1. Introduction
The term “Wastepaper” is used to describe all forms of paper product such as cardboard, newspaper, office paper, tissue paper, magazine etc that are no longer of use. Therefore, it is important to upgrade the process of transforming wastepaper to energy to optimize yield. The presence of lignocellulosic constituents in wastepaper limits the hydrolysis stage in anaerobic digestion process thereby lowering methane yield (Kamali, Gameiro et al. 2016). However, high concentration of cellulose present in wastepaper which can be used by many microorganisms makes them valuable for energy recovery. Several studies (Gonzalez-Estrella, Asato et al. 2017), (Pommier, Llamas et al. 2010), (Eleazer, Odle et al. 1997), (Jokela, Vavilin et al. 2005) found higher methane yield in wastepaper with lower lignin content. Most of these studies were done using mesophilic AD process, therefore it is important to explore thermophilic AD to bridge the gap in knowledge in this area of studies. Li, Khalid et al. (2020) investigating various wastepaper and their methane yield found the lowest methane yield was obtained from cardboard while tissue paper had highest methane yield due to high cellulose content. The researcher suggested the use of microscopic structure of wastepaper to analyse and investigate the reason why different wastepaper are more biodegradable than others. The cumulative biomethane yield of all wastepaper investigated increased significantly during the first 20 days of digestion, however, 66.4% of experimental methane yield of cardboard was produced at day 15, then the cumulative methane yield declined afterwards. Research study focussing on AD mechanisms of wastepaper, their characteristics and improvement strategies will maximize their energy potential. Wastepaper is in abundant supply throughout the year for use in anaerobic digestion.
Research studies by Teghammar, Karimi et al. (2012); Rodriguez, Alaswad et al. (2017); Menardo, Airoldi et al. (2012); and Singh, Khullar et al. (2013) found pre-treatment increased methane yield and credited the increase in percentage conversion of the enzymatic hydrolysis of pre-treated biomass to increased external surface area and porosity resulting in higher enzyme accessibility. Yuan, Cao et al. (2012) investigating the effect of pre-treatment of wastepaper including cardboard found a 156% increase in methane yield compared to untreated samples. However biological pre-treatments are complex and slow processes, with longer residence time (Rodriguez, Alaswad et al. 2015). Key factors influencing methane yields in anaerobic digestion are biomass composition and inoculum characteristics, while factors affecting its kinetics are feed concentration and frequency, temperature, particle size, nutrients and type of mixing (Chynoweth 1987). In addition, increased molecular weight and insolubility of the lignocellulose biomass causes its resistance to the anaerobic digestion system, which will have a negative impact on methane yield. Numerous studies have found anaerobic digestion of mechanical pre-treated wastepaper by means of particle size reduction to be very successful for methane yield. Examples are shown in studies by Gonzalez-Estrella, Asato et al. (2017) ; Pommier, Llamas et al. (2010) ; Eleazer, Odle et al. (1997); and Jokela, Vavilin et al. (2005) on anaerobic digestion of wastepaper for methane yield with yield in energy form ranging from 4.7×10⁻³ MJ/ g to 15×10-3 MJ/ g.
A lot of research has investigated anaerobic digestion of wastepaper mixed with other organic wastes mostly at mesophilic temperatures (Zhao, Chen et al. 2021). Energy recovery from wastepaper needs to be assessed on its own to further understand the individual concepts and performance for methane yield at various AD temperatures. Mono-digestion of Cardboard needs to be fully explored to gain in-depth understanding of substrate behaviour during AD at both thermophilic and mesophilic temperatures using mechanical pre-treatment. As methane is the chosen biofuel for this research study, it is therefore necessary to investigate cardboard on its own to analyse and evaluate its contribution toward methane yield. Research study will increase awareness and enable future research and development using cardboard as feedstock for methane yield to reduce amount of waste in landfill and contribute to climate change mitigation. With increasing disposal costs, the landfilling method is not desirable. For this research study, cardboard is mechanically pre-treated, inoculated with sludge and then digested in batch reactors under different AD temperatures.
This research aims to investigate methane yield after mechanical pre-treatment has been applied on cardboard. It is necessary to study the extent of its effectiveness in reducing the particle size of cardboard, along with the incurred energy consumption during pre-treatment. A further objective of the research is to optimize the conversion system to maximize methane yields, by estimating the optimum parameters of the system variables. These include: the gap between the grinding surfaces of the machine, treatment time, incubating temperature and inoculum amount. For this optimization, a Design of Experiments (DOE) plan must be selected that includes the appropriate statistical technique that will provide the best possible data fitting model. Mechanical pre-treatment using Hollander beater has proved successful using office paper (Rodriguez, Alaswad et al. 2017) for methane yield with an increase of 21% during anaerobic digestion compared to untreated samples. For this research study, cardboard is mechanically pre-treated, inoculated with sludge and then digested in batch reactors under different temperature to prove the general concept of the susceptibility of cardboard to the pre-treating action of the Hollander beater for methane yield.
2. Methodology and experimental procedure for experiment
The waste cardboard is from the wate disposal unit at the University of the West of Scotland Paisley campus. The cardboard is collected during winter months and thencut up using office shredder Fellowes Powershred C-320 into 0.6 × 29.7 cm pieces before being cut by scissors into strips. A total of 1 kg cardboard strips of length 70 mm, breadth 5 mm and thickness 3 mm were used. Before pre-treatment in the Hollander beater, 1 kg of cardboard sample was soaked in 14 kg of tap water for 60 minutes. While soaking the cardboard, the Hollander beater drum was filled with 26 kg of tap water before the soaked samples were introduced into the beater drum. The total water consumed by each pre-treatment process was 40 kg tap water. The Pre-treatment degree (SR° Value) was determined using Schopper-Riegler method. Lower Schopper Riegler degree means the better drainability in pulp. Once the refining is finished, the pulp sample of 1000 ml was put in a measuring cylinder and poured into a drainage chamber to measure the freeness of pulp. Two determinations on each sample were taken. If the results were more than 4% different to each other, the experiment was repeated. Temperature measurements were taken using a digital thermometer while energy consumption and power were measured using an energy meter.
Cardboard was pre-treated at 1, 3 or 5 minutes at clearance 0.19 mm and kept refrigerated before use for anaerobic digestion with sludge used as inoculum. Sludge was collected from Energen Biogas Plant and refrigerated while awaiting use. The standard procedure for the determination moisture content of cardboard and sludge were derived from BS EN 12879:2000 AND BS EN 12880:2000. To ensure anaerobic conditions, nitrogen was flushed for 5 minutes each into the headspace of each reactor. Each reactor was seeded with substrate to inoculum ratio of 0.2,0.4 and 0.5 calculated on TS basis. The inoculum was fixed at 100 g then the amount of substrate was based on the selected F/I. pH was measured using a Mettler Toledo pH machine. The pH in the reactors was adjusted with potassium phosphate as buffer solution. Reactors were used at working volume 300 ml in duplicate at a thermophilic anaerobic digestion temperature of 55°C. To estimate sludge and cardboard contribution, duplicate replication was used to validate methane yield. The reactors were shaken weekdays only throughout the 10-day experiment. All Experiments were done in triplicate. The flow rate of nitrogen through the AD system was calculated using the ideal gas equation, volume, and time. Biogas volume measurements were derived from BS EN ISO 4788:2005 measured using graduated cylinders connected to an inverted flask collecting bubbles. Determination of methane concentration using BS EN ISO 25139:2011 was measured using a Drager gas analyser. To verify anaerobic conditions and analyse the biochemical composition of the obtained biogas, a gas analyser (Drager X-Am 7000, error ≤ 1% volume) was used. The digestion was stopped when the biogas production rate was found to be less than 1% of the overall volume produced according to VDI (2006). The biogas volumes are corrected to standard conditions of temperature (0°C) and pressure (1 atm). A water bath was used to keep temperature within the range. To ensure oxygen-free anaerobic digestion during gas collection, a measuring cylinder connected to bubbling flask was used for gas extraction and volume measurement. A bubbling flask was used in venting gas out of the system. The conditions being tested are planned according to a response surface methodology (RSM) This methodology is applied to the measured yield using the statistical software Design-Expert v.10.3 with the aim to optimize the response y, which in this case is the methane volume.
Response Surface Methodology (RSM)
The response surface methodology (RSM) is adopted for the experiments of this research in chapters 4, 5 and 6, and follows the Central Composite design (CCD) whose variables are shown respectively in the appropriate chapters. The goal is to find the model of the proposed system, by performing data fitting and regression analysis. This methodology is applied to the measured yields using the statistical software, Design Expert v.10.0.3. RSM also specifies the relationships among one or more of the measured responses and the essential controllable input factors. If all independent variables are measurable and can be repeated with negligible error, the response surface can be expressed by function y, where k is the number of independent variables:
RSM is a set of mathematical and statistical techniques that are useful for modelling, interpreting and predicting the outputs of interest to several input variables χ (from levels i to j) with the aim of optimizing a single or multiple responses ys (Tedesco 2013). To optimize the responses ys, it is necessary to find an appropriate approximation for the true functional relationship between the independent variables and the response surface. Usually a second order polynomial (Eq. 2.2) is used in an RSM, where the values of the model coefficients b
0, b
i, b
ii and b
ij can be estimated using regression analysis.
The first summation term represents the main factor effects, the second term reflects the quadratic effects and the third stands for the two-factor interaction. The second order polynomial model, 44 given by eq. .2, was fitted using a step-wise regression via Design-Expert v.10.0.3 and it was applied on one or two responses (y1, y2): the biogas and methane yields per gram of total solids (mL gTS-1). The same statistical software was used to generate the analysis of variance (ANOVA) and the response plots.
Numerical & graphical optimization
The optimization of Design-expert software v.10.0.3 searches for a combination of factor levels that simultaneously satisfy certain requirements referred to as “optimization criteria”, at every of the responses and input variables, i.e., multiple-response optimization. Numerical and graphical optimization methods are used here by choosing the desired targets for each factor and response. The numerical optimization feature in the software maximizes the objective function and provides the associated solution points in the variable domain. As outlined previously, this optimization involves combining the goals and maximizing an overall desirability function (D). In the graphical optimization feature, the software defines regions where requirements simultaneously meet the proposed criteria. This is done by superimposing or overlaying 51 critical response contours on a contour plot. A visual search for the best compromise can then be performed. When dealing with many responses, it is recommended to first perform numerical optimization; otherwise, it could be impossible to uncover a feasible region. The graphical optimization displays the area of feasible response values in the factor space. Regions that do not fit the optimization criteria are shaded. Once Prob.> F of the model and of each term in the model does not exceed the level of significance (α = 0.05) then the model will be considered adequate within the confidence interval of (1- α) and said to be 95 % reliable.
3. Experimental result and discussion
Table 1.
Result table for Mechanical pre-treatment.
Table 1.
Result table for Mechanical pre-treatment.
| Pre-treatment time (minutes) |
Energy consumption
(kWh) |
Energy consumption
(MJ) |
Temperature (°C) |
Drainability (SR°) |
| 0 |
0 |
0 |
15.8 |
8 |
| 1 |
0.010 |
0.036 |
15.9 |
66 |
| 3 |
0.030 |
0.108 |
15.9 |
66 |
| 5 |
0.045 |
0.162 |
15.9 |
68 |
Table 2.
Result table for cardboard and sludge characterisation.
Table 2.
Result table for cardboard and sludge characterisation.
| Parameters |
Sludge |
Cardboard at 5 minutes |
| TS % |
6.3 |
1.98 |
| VS (%TS) |
72.5 |
91.26 |
Table 3.
Physical and chemical properties of sludge provided by Energen Biogas.
Table 3.
Physical and chemical properties of sludge provided by Energen Biogas.
| Density |
980 -1000 g/l |
| Particle size |
N/A – filtered liquid (max 6% DM) |
| COD |
40000 mg/l O2
|
| BOD |
9000 -9500 mg/l |
| Cadmium |
0.01 mg/kg |
| Chromium |
0.55 mg/kg |
| Copper |
2.70 mg/kg |
| Lead |
<0.5 mg/kg |
| Mercury |
<0.05 mg/kg |
| Nickel |
0.70 mg/kg |
| Zinc |
11.0 mg/kg |
| Alkalinity |
22239 mg/l |
| VFA |
4547 mg/l |
| FOS/TAC |
0.204 |
| Acetate |
782 mg/l |
| Propionate |
27 mg/l |
| Isobutyrate |
74 g/l |
The aim was to optimize cardboard and evaluate using Response surface methodology. BT and F/I were assessed at 1, 3 and 5 minutes and F/I at 0.2, 0.4 and 0.5. Working volume of 300 ml was maintained in the reactor by adding distilled water. The inoculum contribution to methane yield was ≥ 10%. Methane yield for all pre-treatment time and F/I was ≥ 20% at day 3 of anaerobic digestion process.
Table 4.
Experimental results for anaerobic digestion of cardboard.
Table 4.
Experimental results for anaerobic digestion of cardboard.
| Factor 1 |
Factor 2 |
Response 1 |
| A:Pre-treatment time |
B:Ratio F/I |
Methane yield |
| Minutes |
|
mL gTS-1
|
| 1 |
0.5 |
115±5 |
| 3 |
0.5 |
121±4 |
| 5 |
0.5 |
140±10 |
| 1 |
0.4 |
102±8 |
| 3 |
0.4 |
110±3 |
| 5 |
0.4 |
127±4 |
| 1 |
0.2 |
63±5 |
| 3 |
0.2 |
89±9 |
| 5 |
0.2 |
98±11 |
The F/I ratio is important for methanogenesis to maximize methane yield. Results show that the methane yield seems to increase with BT. At 1 minute pre-treatment time, the methane yield increased by 45% from 98 mL gTS-1 for ratio 0.2 to 115 mL gTS-1 corresponding to ratio 0.5 and decreased by 11% to 102 mL gTS-1 for ratio 0.4. At pre-treatment time 5 minutes, the methane yield at ratio 0.5 was 140 mL gTS-1, which was a 30% higher than ratio 0.2. The optimum F/I was determined to be 0.5 for anaerobic digestion of cardboard and higher inoculum present in digestion process reduced methane production due to process inhibition. This result shows that for optimum anaerobic digestion performance, it is best to use a higher F/I ratio as no report has been given for inhibition at 0.5 and above , therefore German standard VDI (2006) is recommended. However, it is important to keep F/I below 1 in terms TS to maximize methane yield for highly degradable substrate in anaerobic digestion (Ohemeng-Ntiamoah and Datta 2019). It is important to note that, overloading reactor causes system failure due to excessive foaming. Excessive foaming caused system failure with the anaerobic digestion system can led to massive cleaning operation and restarting of the reactors thereby increasing labour and operational costs. Results from this study indicates F/I ratio is the most important factor and pre-treatment time does not influence methane yield. The highest methane yield was achieved at feedstock /inoculum ratio 0.5. that feedstock concentration should be higher than concentration of inoculum to maximize methane yield which is in accordance with Boulanger, Pinet et al. (2012) who investigated inoculum-to substrate ratios were 0, 0.015, 0.03, 0.06, 0.12, 0.25, 1, 2 and 4. The researchers found the higher methane yield and minimal latency were at feedstock to inoculum ratios of over 0.5 compared to lower ratios. This proves that having 0.5 or above will reduce dissolved lower organic carbon thereby reducing the risk of acid inhibition. Also, Hashimoto (1989) found higher methane yield at 0.5 but no improvement was shown afterwards. As seen nearest the optimum had higher methane yield compared to furthest. When assessing the optimum F/I ratio 0.5 for this study, longer pre-treatment time increased methane yield compared to shorter pre-treatment time which corresponds to findings in the study of (Rodriguez, Alaswad et al. 2017) who found highest methane yield during longer pre-treatment time for wastepaper compared to shorter pre-treatment time at optimum F/I ratio. Zeng, Yuan et al. (2010) who found maximum methane yield increased from 94.42 mL gVS-1 to140.48 mL gVS-1 when feedstock to inoculum ratio was decreased from 2 to 0.5 verifying the appropriate optimum 0.5. Braguglia, mininni et al. (2006) found beneficial effect of sonication for all experimental condition with volatile solid reduction at feed/inoculum ratio of between 0.1-2. The maximum gas yield was seen at F/I 0.5. Meng, Xie et al. (2018) found feedstock to F/I 0.5 showed highest methane yield. Fagbohungbe, Herbert et al. (2014) found the higher methane yield and pathogen inactivation were found to be achieved at the F/I 0.5 while lowest amount of methane yield and lowest pathogen removal were found to be achieved at F/I 4. To achieve the most effective anaerobic digestion operational conditions, the substrate to inoculum ratio should be set at 0.5. Pellera and Gidarakos (2016) found that out of the three types of inoculum used, anaerobic sludge was found to have highest methane yield. The optimum F/I was 0.5 for winery and juice industry waste and higher feedstock present in digestion process reduced methane production due to process inhibition. Braguglia, mininni et al. (2006) found beneficial effect of sonication for all experimental condition with volatile solid reduction at feed/inoculum ratio of between 0.1-2. The maximum gas yield was seen at feed/inoculum ratio of 0.5.
3.1. RSM modelling for methane yield
ANOVA table for RSM experiment
Table 5.
ANOVA test from response surface design for methane yield from cardboard.
Table 5.
ANOVA test from response surface design for methane yield from cardboard.
| |
Sum of |
|
Mean |
F |
p-value |
|
| Source |
Squares |
df |
Square |
Value |
Prob > F |
|
| Model |
3995.03 |
2 |
1997.52 |
93.25 |
< 0.0001 |
significant |
| A-Pre-treatment time |
1204.17 |
1 |
1204.17 |
56.22 |
0.0003 |
|
| B-Ratio F/I |
2790.87 |
1 |
2790.87 |
130.29 |
< 0.0001 |
|
| Residual |
128.52 |
6 |
21.42 |
|
|
|
| Cor Total |
4123.56 |
8 |
|
|
|
|
The fit summary output indicates that the linear model is statistically significant for the response. The final mathematical model associated with the system response, in terms of coded factors and actual factors determined by the software are equation 6.1 and 6.2 respectively.
| Final Equation in Terms of Coded Factors: |
|
| Methane yield |
= |
|
| +105.65 |
|
|
| +14.46 |
* A |
|
| +21.00 |
* B |
|
| -2.68 |
* AB |
(3.2) |
| +0.83 |
* A2
|
|
| -1.87 |
* B2
|
|
| Final Equation in Terms of Actual Factors: |
|
| Methane yield |
= |
|
| +17.25 |
|
|
| +9.11 |
* Pre-treatment time |
|
| +225.12 |
* Ratio F/I |
(3.2) |
| -8.93 |
* Pre-treatment time * Ratio F/I |
|
| +0.21 |
* Pre-treatment time2
|
|
| -83.33 |
* Ratio F/I2
|
|
The model F-value 93.25 means that the model is significant. There is only a 0.01% chances than an F-value this large could occur due to noise. Value of “Prob >F” less than 0.0500 shows model terms are significant. In this case B is a significant model term. Values greater than 0.1000 indicates the model terms are not significant. The “pred R-squared” of 0.92 is as close to the “Adj R-Squared” of 0.96 with difference of less that 0.2. This may indicate an adequate model has been estimated. A ratio greater than 4 is desirable. This ratio of 26.46 for this study indicates an adequate signal. This model can be used to navigate the design space.
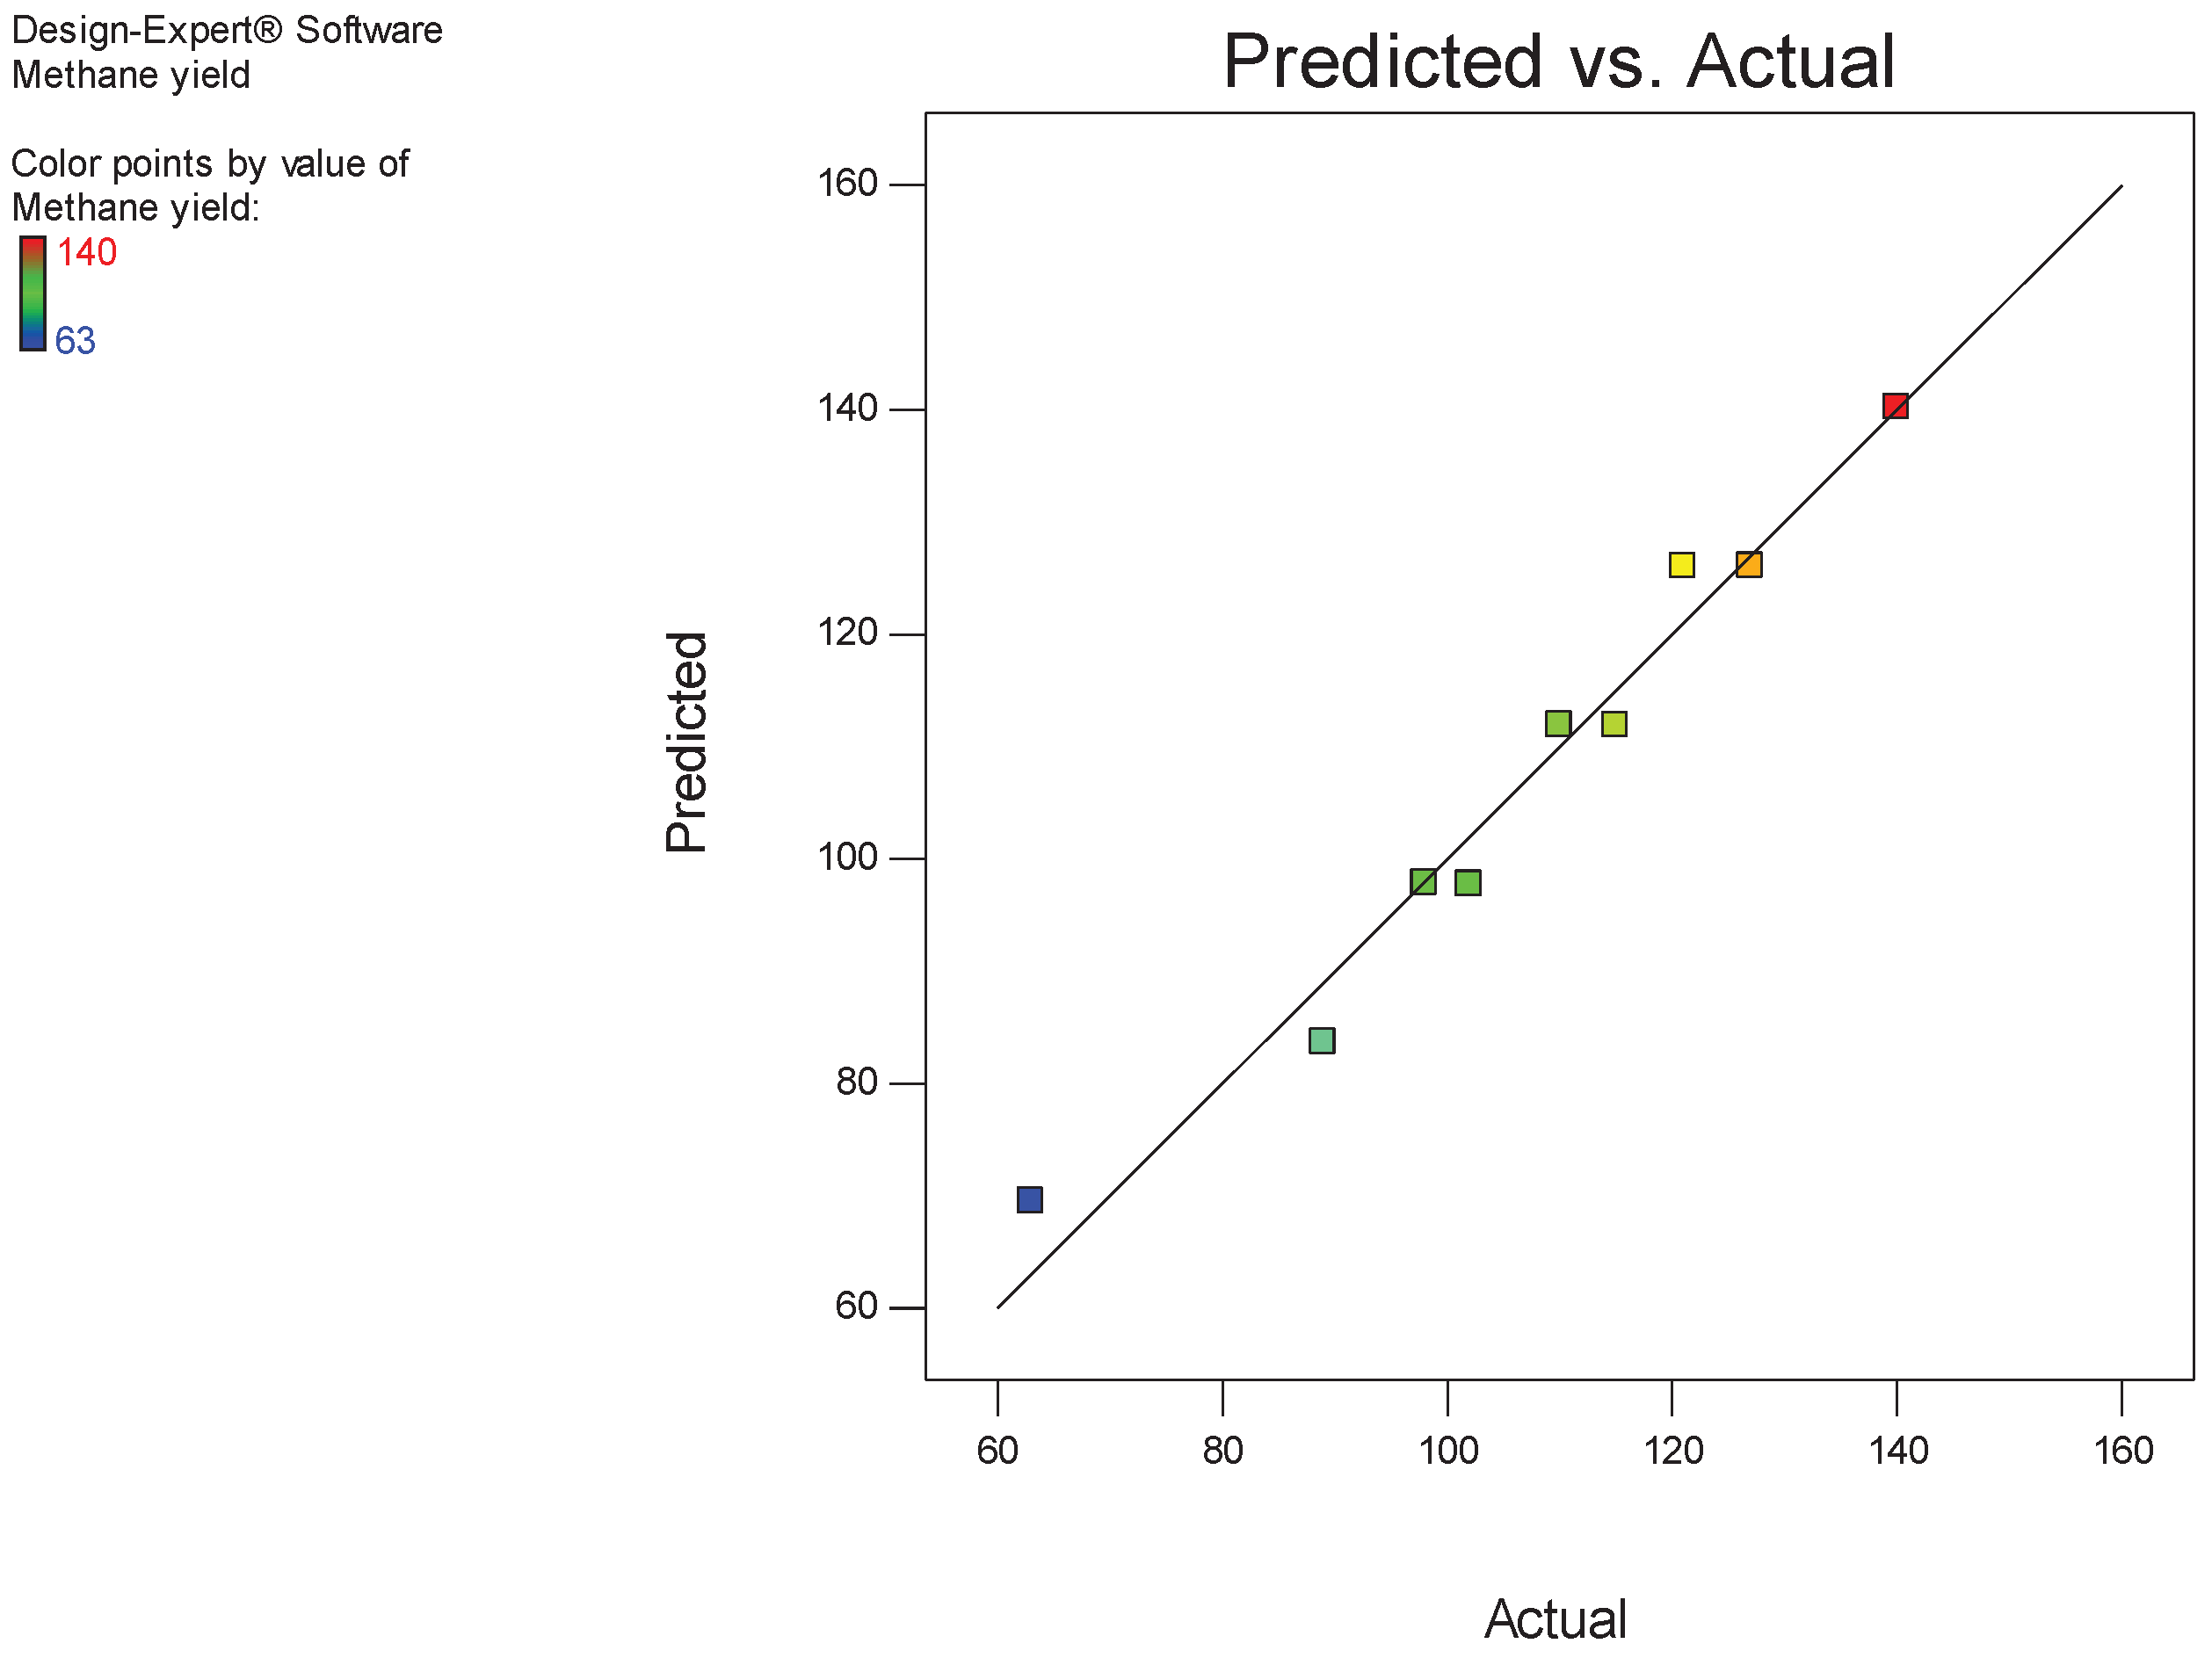
The predicted vs. actuals plot is shown in
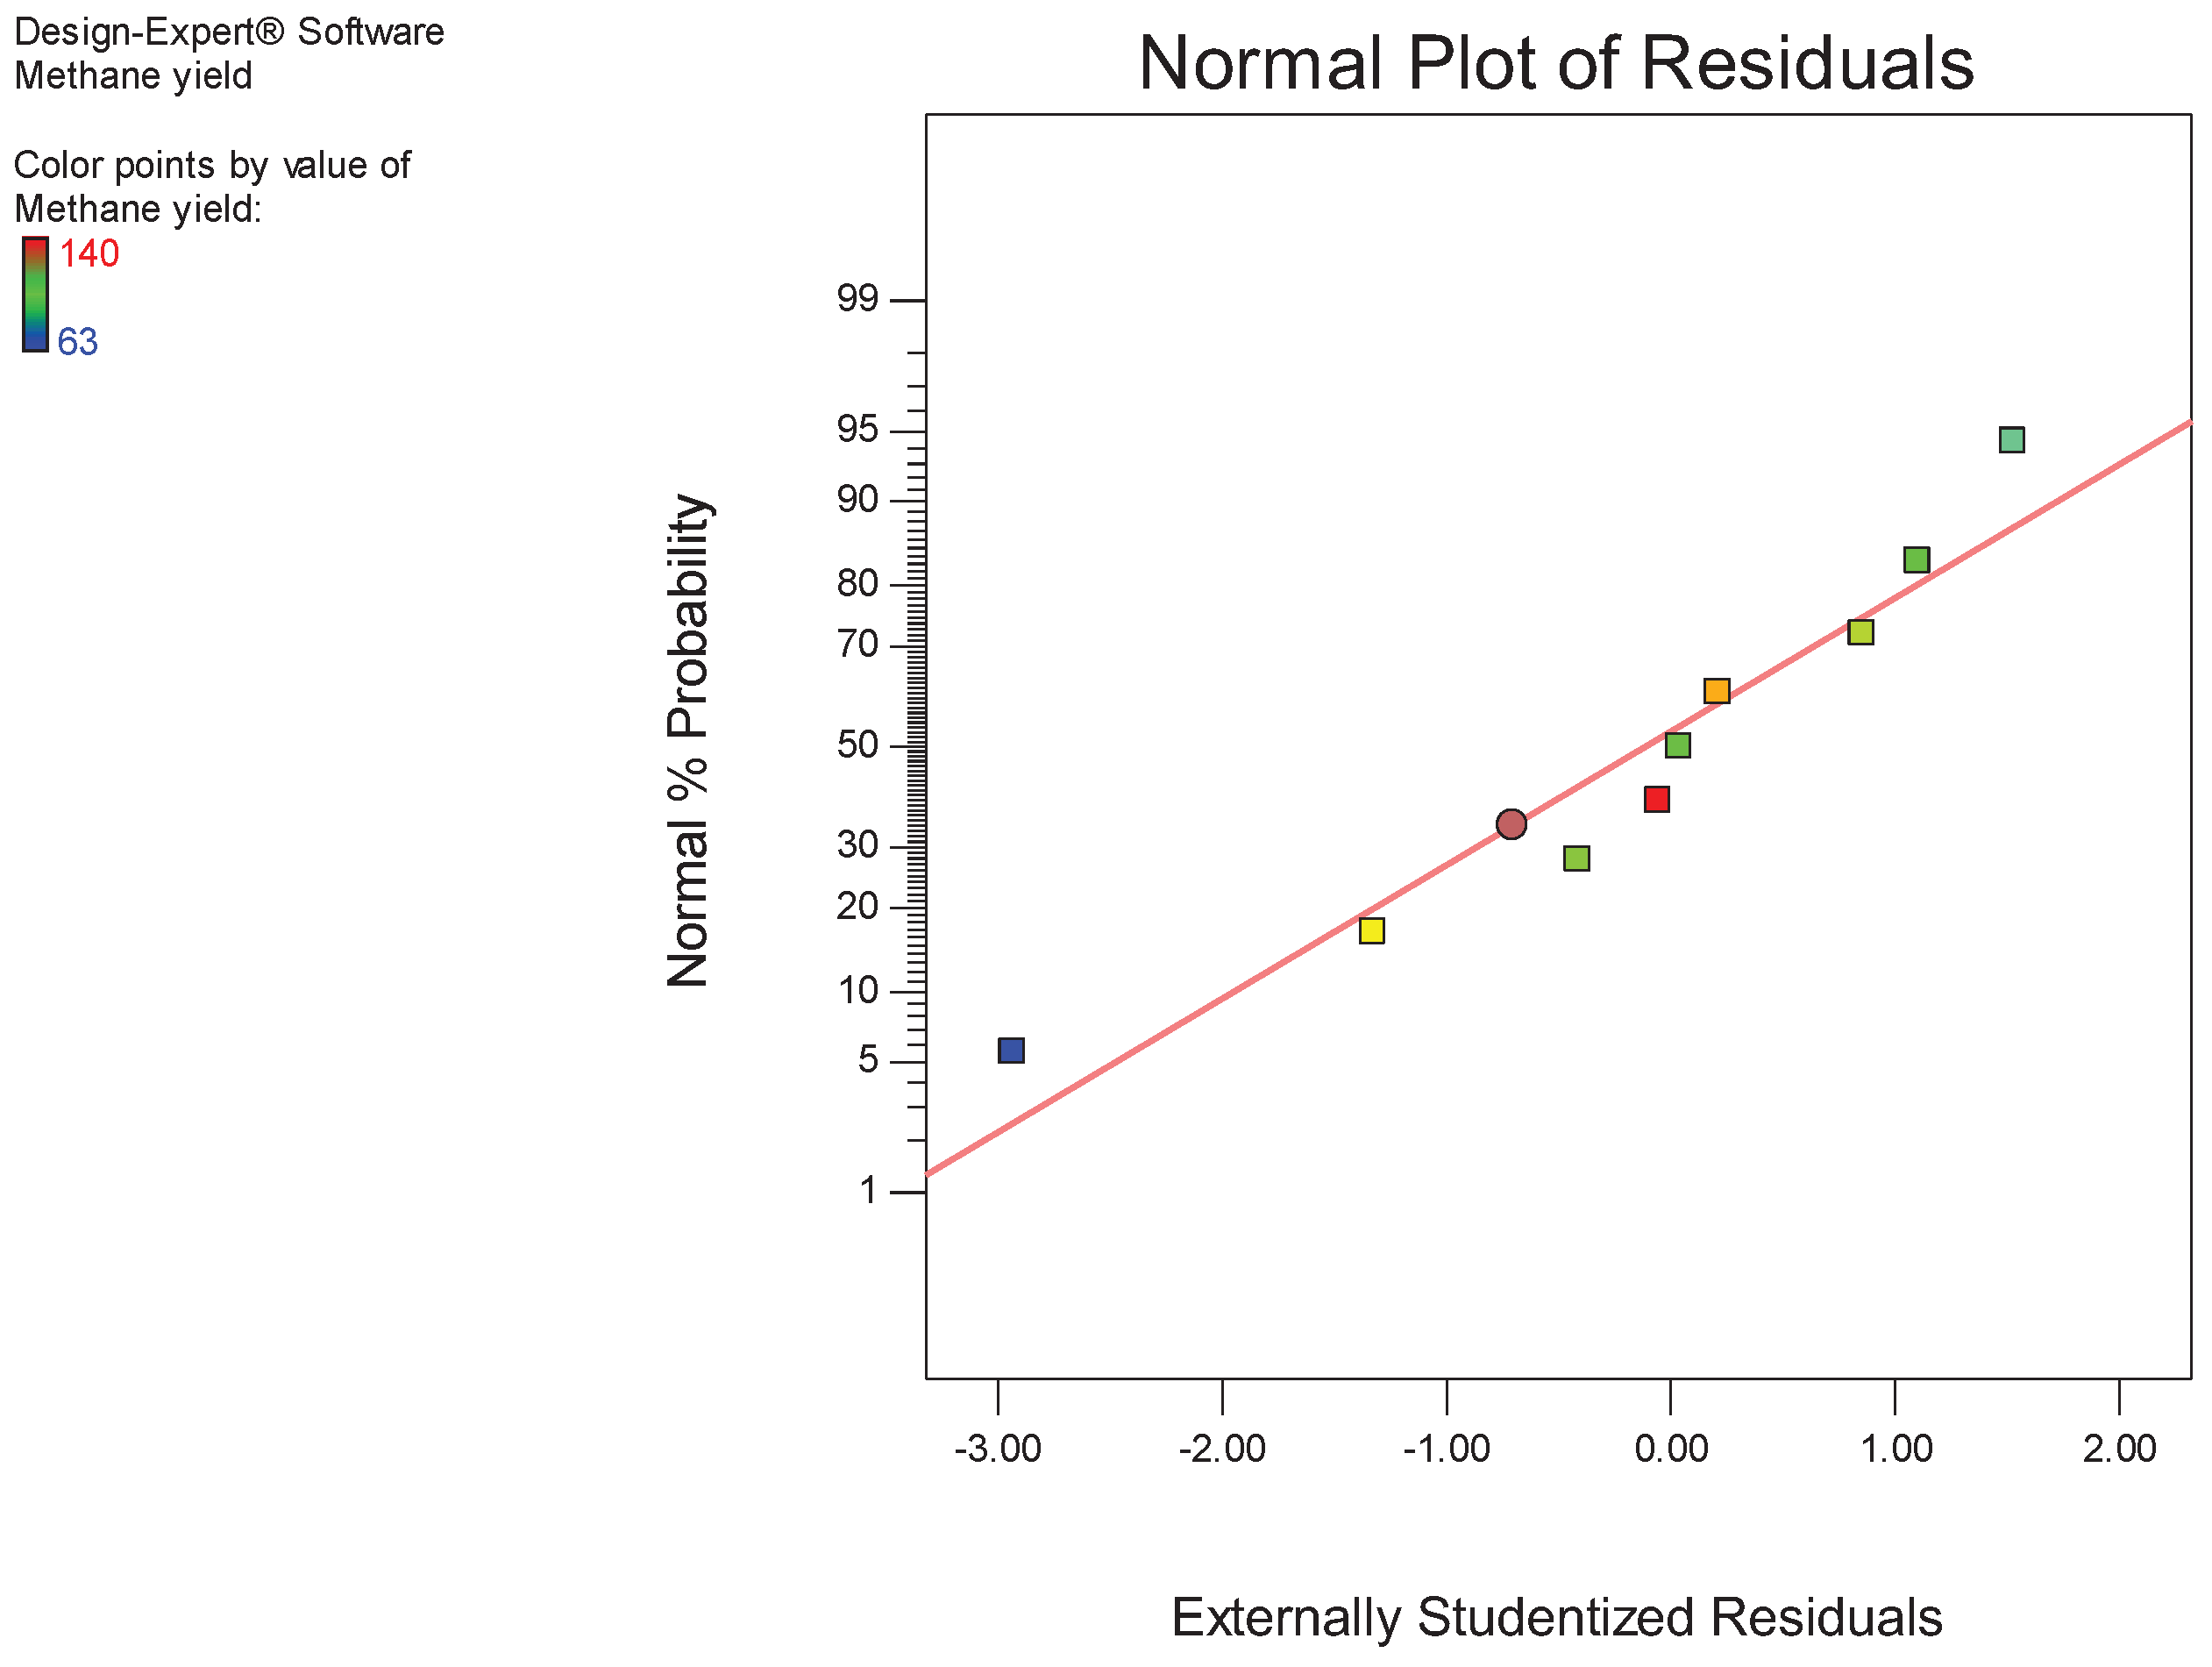
Figure 1a, it shows the comparison between the predicted values with those that were measured in the experiment. This figure indicates that the developed model is adequate because the residuals are minimal since they tend to be close to the diagonal line. The normal plot of residuals in
Figure 1b demonstrates that the assumption of normal distribution of the data is respected; therefore, the ANOVA can be applied to study the dataset.
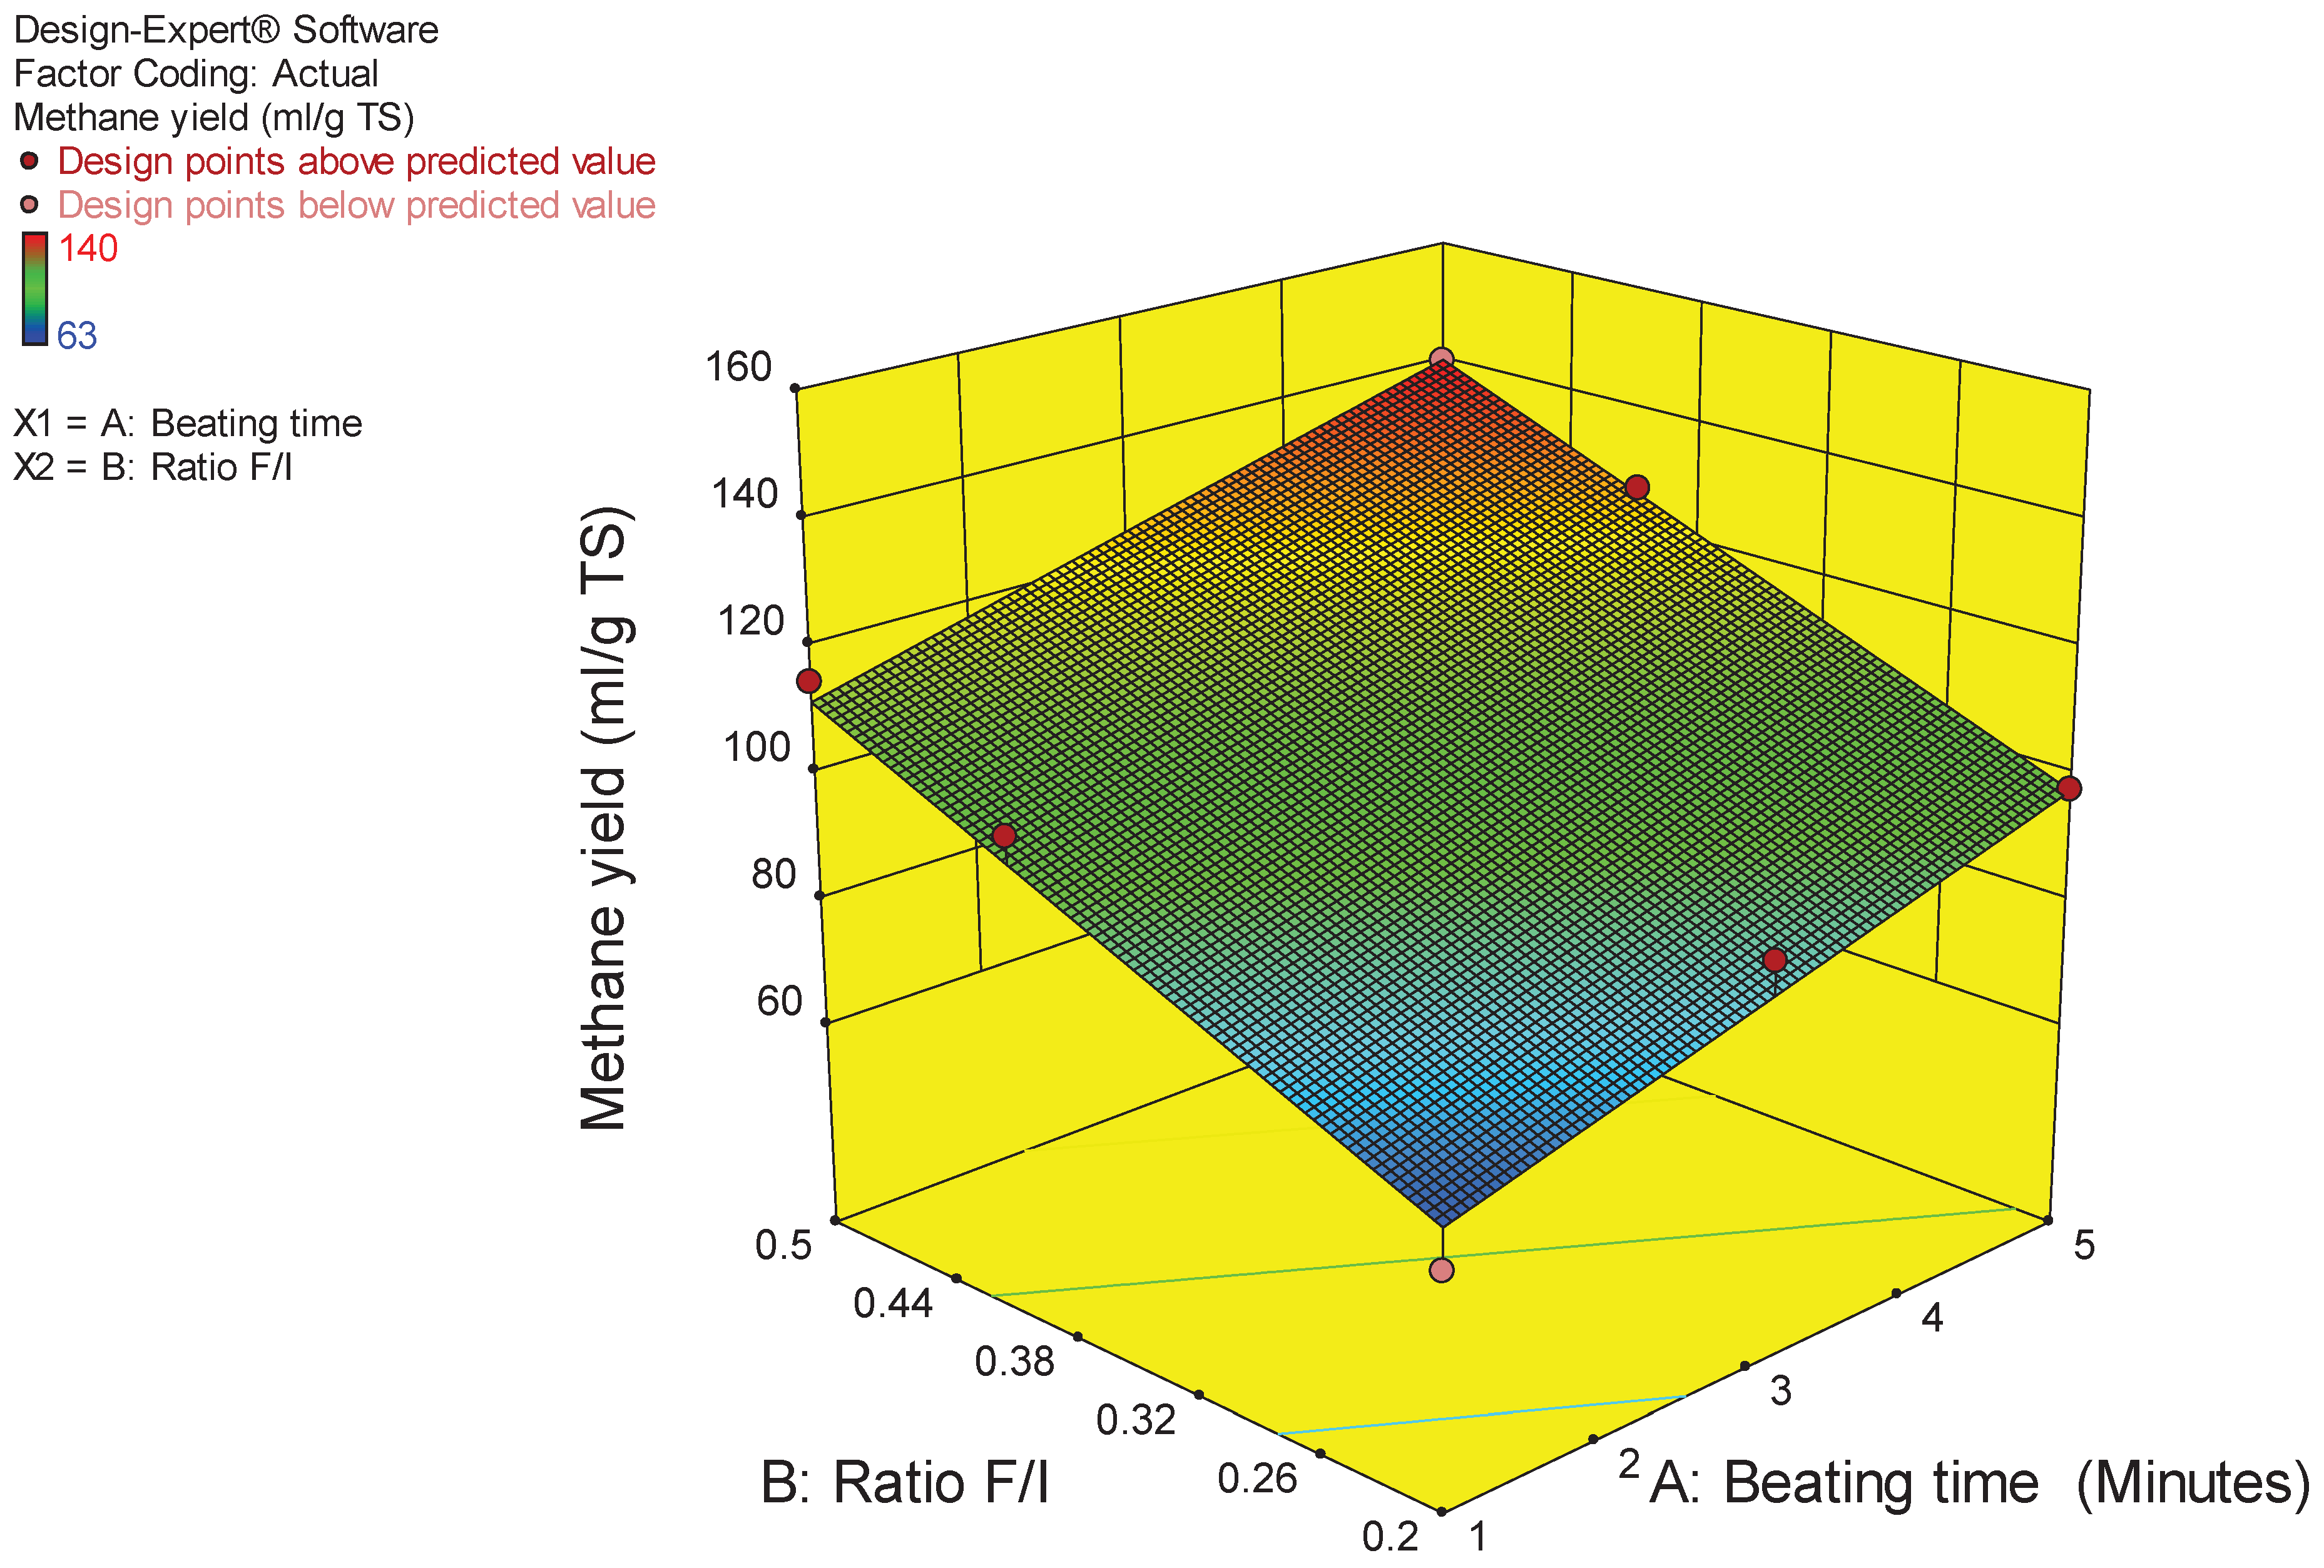
Figure 2 shows that highest methane yields were obtained at higher pre-treatment time and higher F/I ratio. As F/I ratio reduced, methane yield decreased.
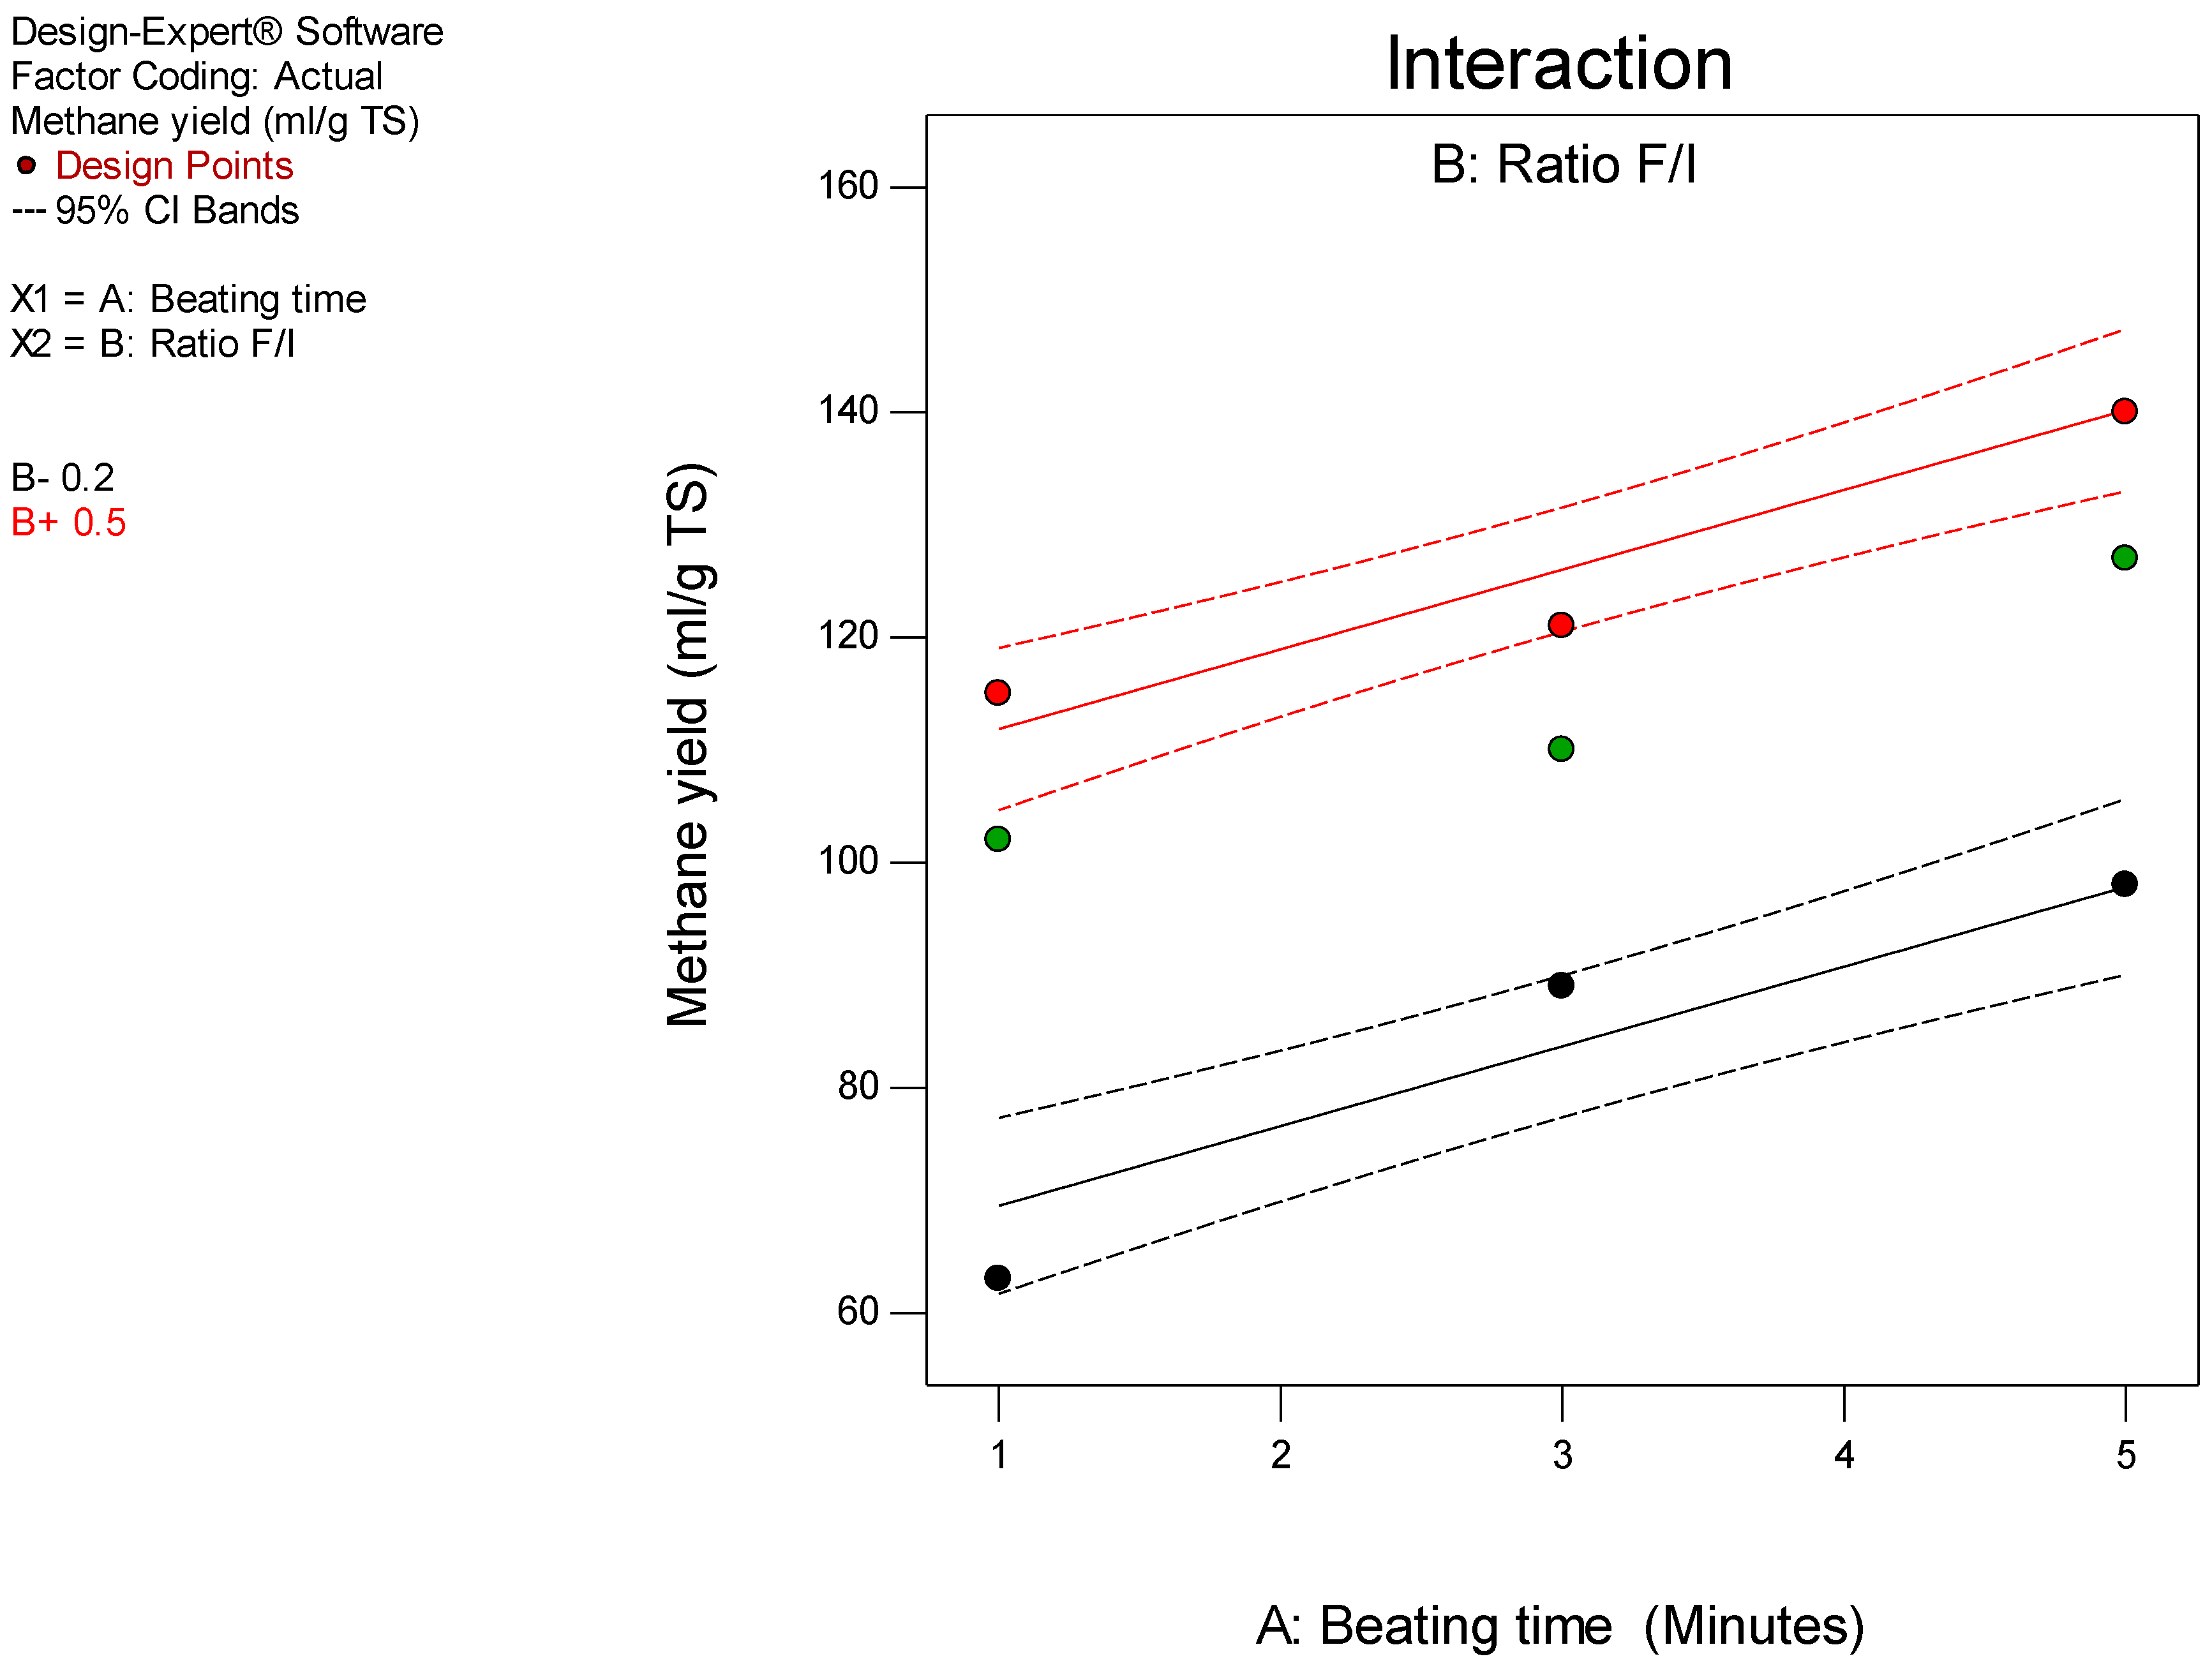
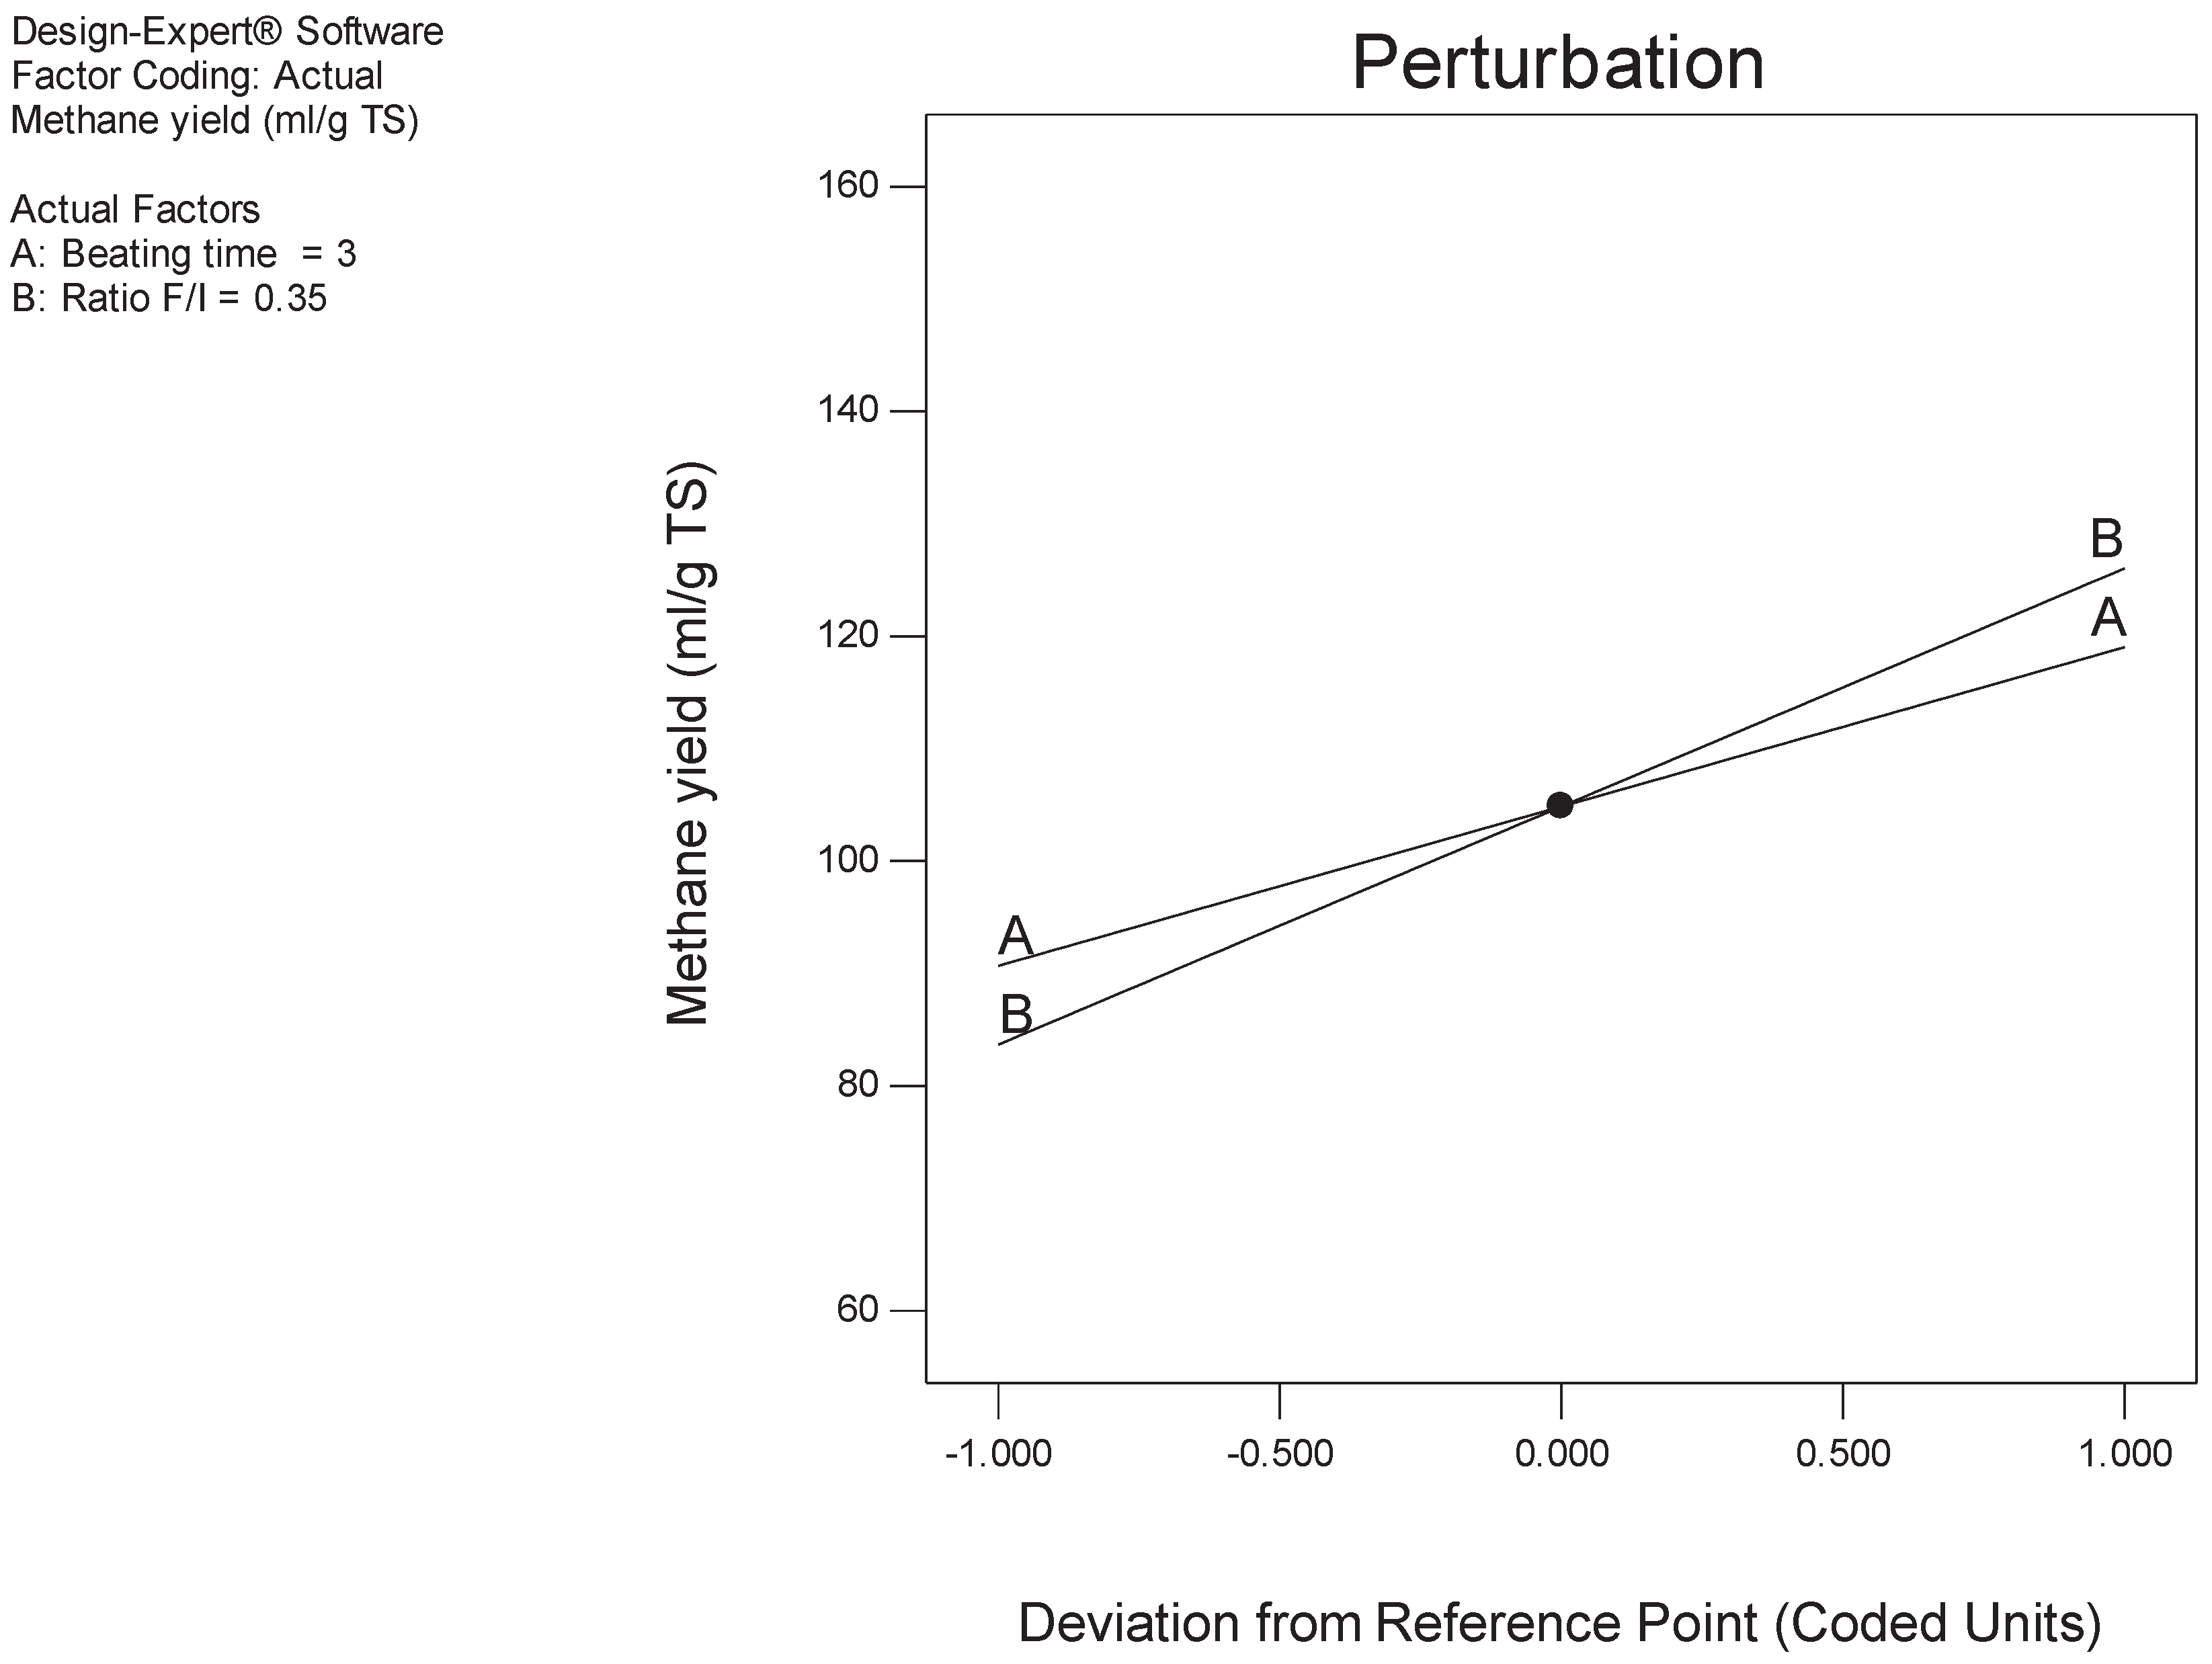
The perturbation plot shows as methane yield increases, pre-treatment time and F/I increased. F/I ratio is inversely proportional to methane yield as Increasing F/I ratio the methane yield increased. Increasing A (pre-treatment time) had positive effect on methane yield at higher F/I ratio compared to lower F/I ratio. However, there was 18% increase in methane yield at F/I ratio 0.5 when pre-treatment time was increased from 1 to 5 minutes. Whereas there was 9% decrease in methane yield at F/I ratio 0.2 when pre-treatment time was increased from 1 to 5 minutes.
Figure 4.
Interaction plot for input variables and methane yield.
Figure 4.
Interaction plot for input variables and methane yield.
The effect of pre-treatment has similar behaviour at low and high F/I ratios. Highest methane yield at F/I ratio 0.5 wat at 5 minutes and the highest methane yield at F/I ratio 0.2 was at 5 minutes. Lowest methane yield at F/I ratio 0.5 wat at 1 minute and the lowest methane yield at F/I ratio 0.2 was at 1 minute.
Table 6.
Criteria for numerical optimization.
Table 6.
Criteria for numerical optimization.
| Constraints |
|---|
| |
|
Lower |
Upper |
Lower |
Upper |
|
| Name |
Goal |
Limit |
Limit |
Weight |
Weight |
Importance |
| A: Pre-treatment time |
minimize |
0 |
5 |
1 |
1 |
5 |
| B: Ratio F/I |
is in range |
0.2 |
0.5 |
1 |
1 |
3 |
| Methane yield |
maximize |
63 |
140 |
1 |
1 |
5 |
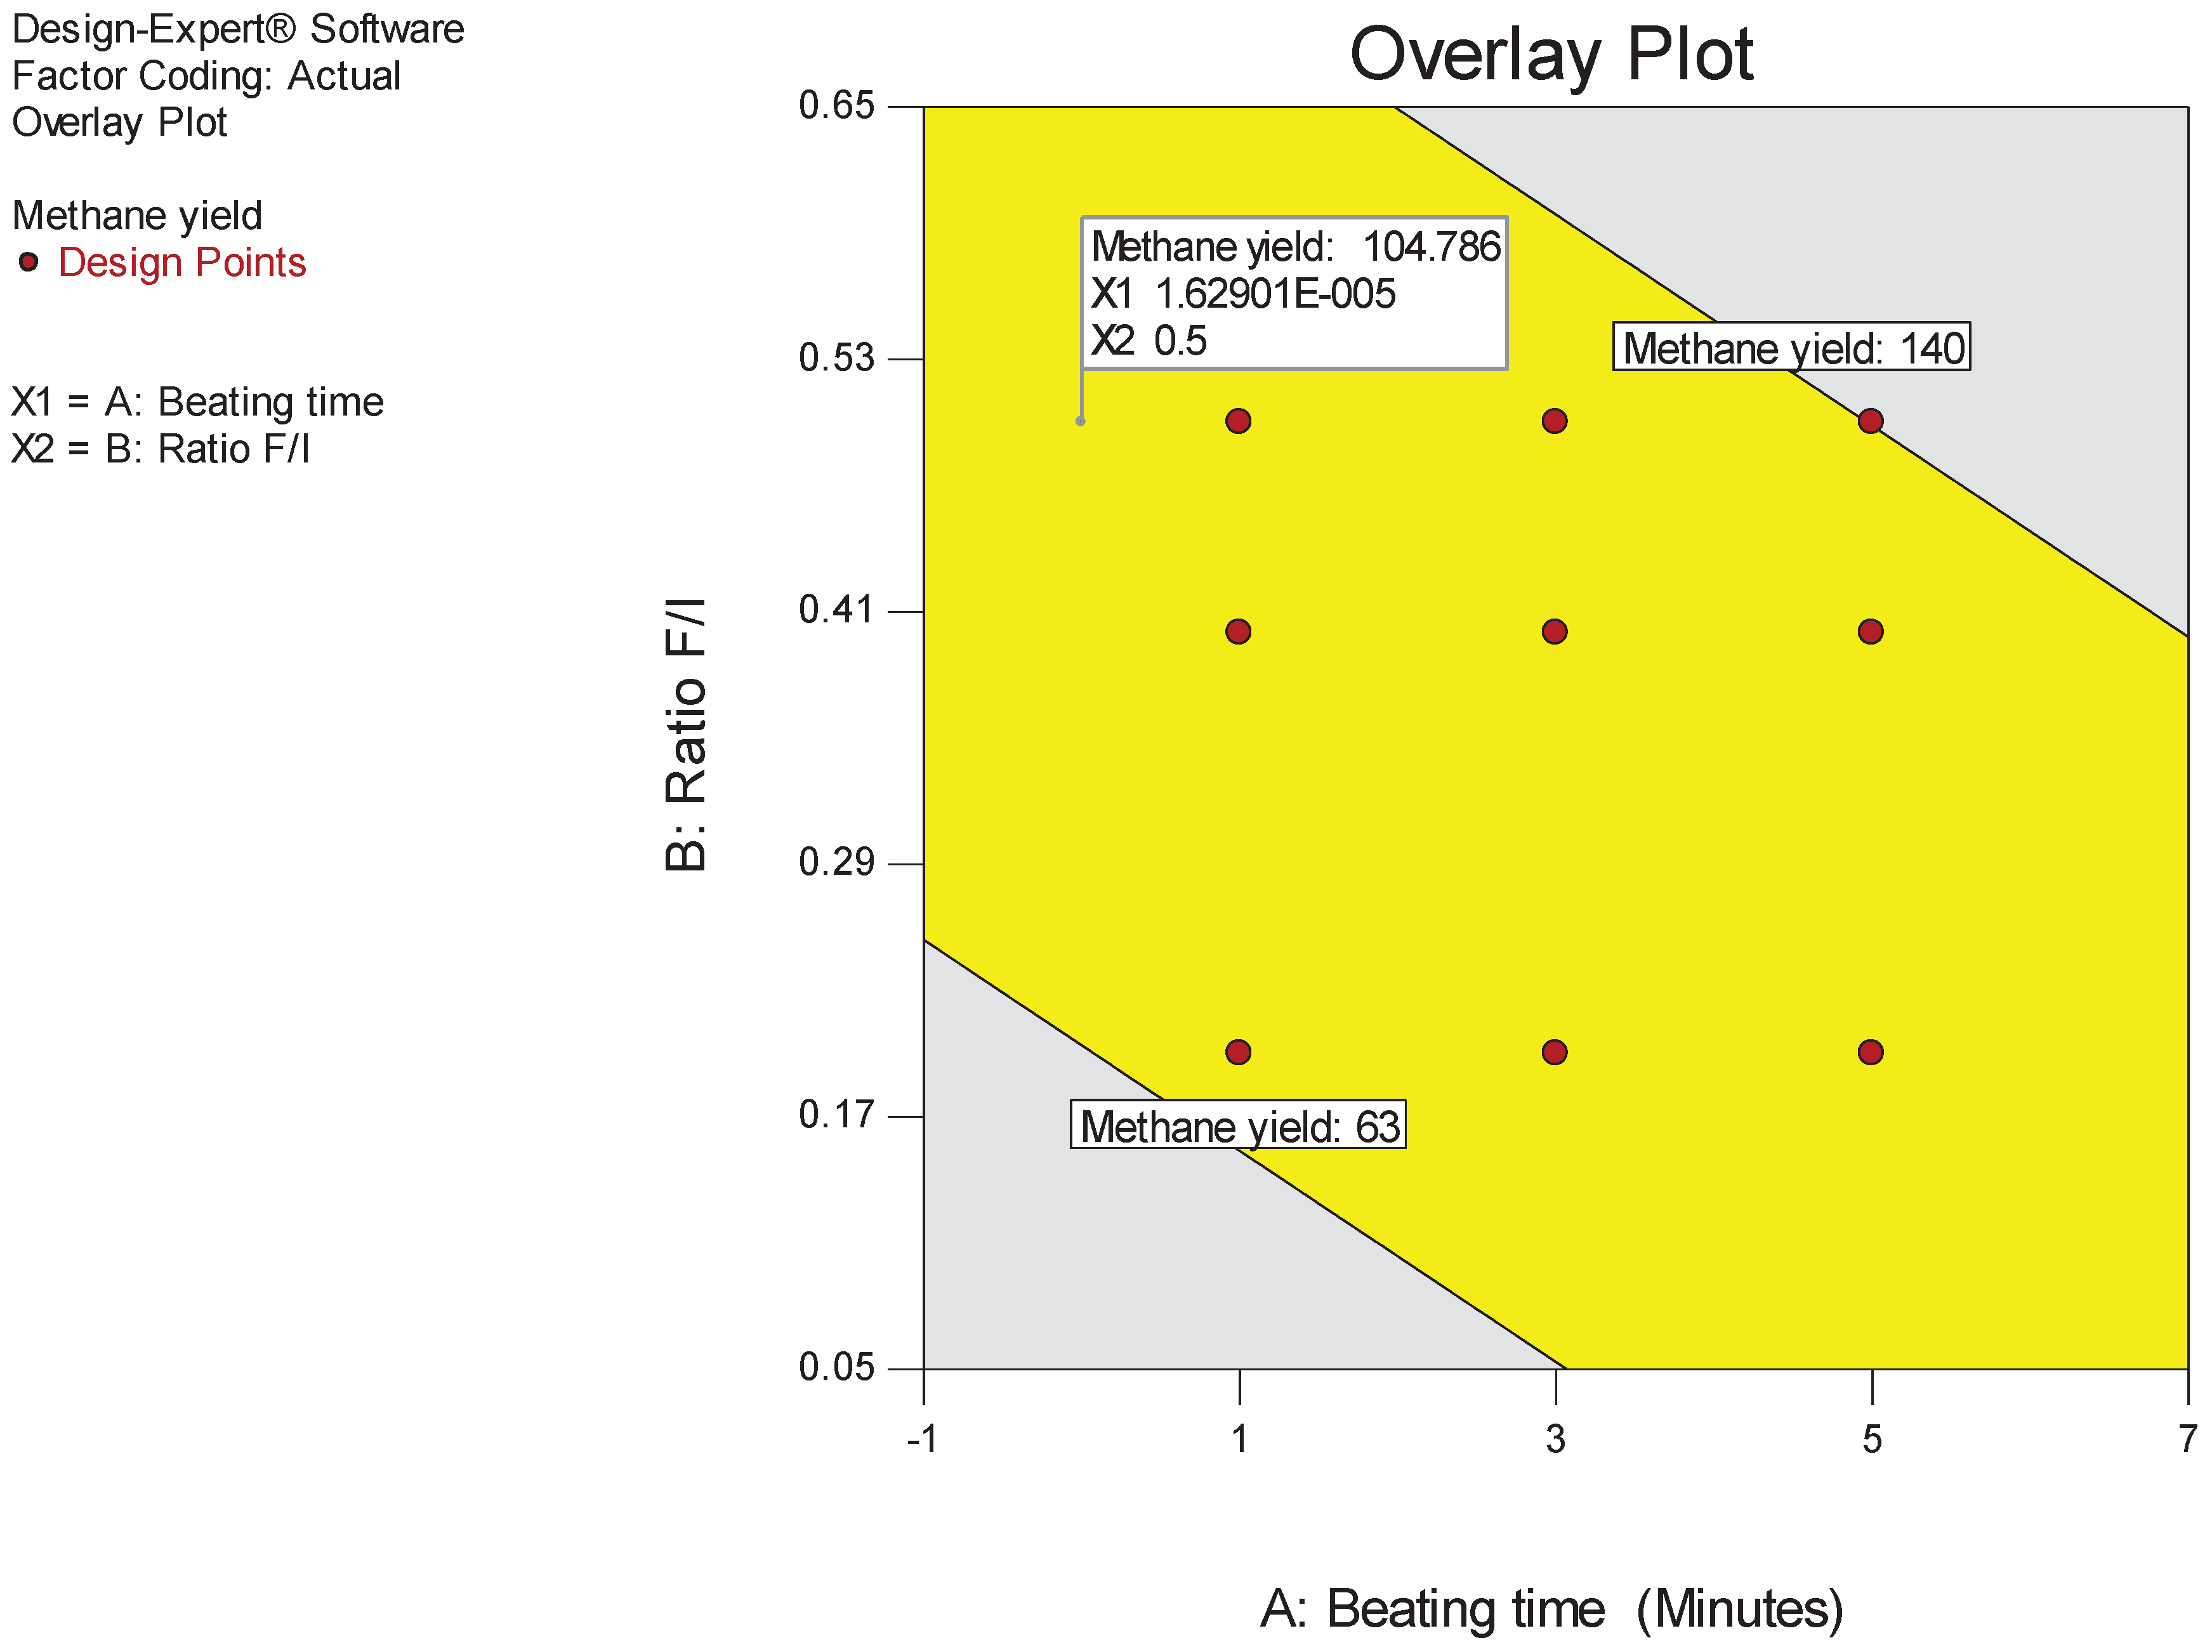
A numerical optimization provided by Design-Expert is applied here to the RSM dataset, followed by a graphical optimization. The numerical study provides the ideal factor levels to achieve the highest methane yield, while the graphical method investigation results in a chart that associates the factor levels to an area of target yields defined by the user. Methane yield was maximized to level 5, pre-treatment time was minimized to 5 while the lower and upper limit were set to 0 and 5. The yellow areas on the overlay plot 3.5 that shows the values that meet the projected conditions is surrounded by the curves corresponding to the optimization conditions set by the authors. The optimization is conducted with numerical restricting criteria, the desirability function corresponds to the maximization of the final yield. Temperature is constrained to 55°C for cost savings on the heating units, seeing that the temperature variations are here not a significant factor. Factors pre-treatment time and F/I ratio are not restricted however and remain in the same range. The optimal numerical solution identified by design-expert with the highest yield corresponds to 104.8 mL gTS-1 for thermophilic temperature 55°C, F/I 0.5 and pre-treatment time 1.631E-005. Since the design matrix did not contain this design point, it can be seen how modelling and optimizing the system is beneficial when having limited set of data points. The actual solution of treated material presents an increase in methane yield of about 25% compared with the optimized solution for methane yield. The model is predicting that the highest actual methane yield at 5-minute pre-treatment time with 140 mL gTS-1 is not economically viable when considering labour cost and overall running of pre-treatment thus saving energy for pre-treatment.
The graphical optimization’s findings are shown in
Figure 5 at T=55°C. The target area (in yellow) is delimited by two curves corresponding to the maximizing criteria that have been set. upper limits of such area as the biogas yields identified by Design-Expert in the numerical optimization.
Figure 5 offers a quick-approach chart to obtain the operational parameters of the proposed cardboard reactor in digestion with sludge. The graphical optimization allows a selection of the optimum process parameters by means of visual inspection. The optimization plot displays the area of feasible response values in the factor space. The yellow areas on the overlay plot 3.5 that represent the values that meet the proposed criteria is delimited by the curves corresponding to the optimization criteria set by the authors.
Treatment energy consumption evaluation
To evaluate the energy balance at a lab-scale of the Hollander beater treatment, the specific energy consumption incurred in this work is calculated and compared with the biogas energy produced. Only the consumption of the beater is measured, and results of the energy assessment are calculated in KWh following the approach in (Lindmark, Leksell et al. 2012). The energy balance assessment is carried out for the highest yield achieved in chapter 6, which is 1 minute pre-treatment time at F/I 0.5 on Table 3.4. The methane content of this sample was found to be over 55%. To evaluate the effective consumption, the treatment’s energy cost is estimated using a domestic kilowatt-hour meter. The result of this cost estimation is found to be 0.010 kWh. If the entire treated feedstock batch is fermented at the same incubating conditions as 1 minute pre-treatment time at F/I 0.5, the resulting specific energy production would be 0.1 kWh, with about 93% energy gain over the treatment consumption. These results focus on the energy gain caused by the pre-treatment and include the sludge’s biogas contribution. The conversion efficiency of the power generator, whose choice depends on the application, decreases the energy gain. The conversion efficiency of the power generator is crucial in determining the final energy gain from the pre-treatment with the Hollander beater.
4. Conclusion
The results were that the highest methane yield was at highest pre-treatment time (5 minutes) and highest F/I ratio (0.5) and the lowest yield was at F/I 0.2 and pre-treatment time 1 minute. Methane yield decreased by 55% from 140 mL gTS-1 at F/I ratio 0.5 to 63 mL gTS-1 at F/I 0.2. Methane yield decreased by 26% from 121 mL gTS-1 at F/I ratio 0.5 at 3 minutes pre-treatment time to 89 mL gTS-1 at F/I 0.2 at 3 minutes pre-treatment time. While the aim is to increase methane yield while minimizing the pre-treatment time. An enhanced methane yield of mL gTS-1 was achieved for 5 minutes of Pre-treatment at F/I ratio of 0.5. An optimization study was performed to minimize pre-treatment time while increasing methane yield. The maximum methane yield of 104.8 mL gTS-1 from numerical optimization was found at pre-treatment time 1.63E-005 minutes at F/I 0.5. This shows the Hollander beater is not efficient in optimizing methane yield.
Funding
This research received no external funding.
Conflicts of Interest
No conflict of interest.
Reference(s)
- Boulanger, A., E. Pinet, M. Bouix, T. Bouchez and A. A. Mansour (2012). "Effect of inoculum to substrate ratio (I/S) on municipal solid waste anaerobic degradation kinetics and potential." Waste management 32(12): 2258-2265. [CrossRef]
- Braguglia, C., G. mininni, M. Tomei and E. Rolle (2006). "Effect of feed/inoculum ratio on anaerobic digestion of sonicated sludge " Water Science and Technology: 77-84.
- Chynoweth, D. P. (1987). "Anaerobic digestion of biomass.".
- Eleazer, W. E., W. S. Odle, Y.-S. Wang and M. A. Barlaz (1997). "Biodegradability of municipal solid waste components in laboratory-scale landfills." Environmental Science & Technology 31(3): 911-917. [CrossRef]
- Fagbohungbe, M. o., B. M. J. Herbert, H. Li, L. Ricketts and K. T. Semple (2014). "The effect of substrate to inoculum ratios on the anaerobic digestion of human faecal material " Energy Technology & Innovation 121-129.
- Gonzalez-Estrella, J., C. M. Asato, A. C. Jerke, J. J. Stone and P. C. Gilcrease (2017). "Effect of structural carbohydrates and lignin content on the anaerobic digestion of paper and paper board materials by anaerobic granular sludge." Biotechnology and bioengineering 114(5): 951-960. [CrossRef]
- Hashimoto, A. G. (1989). "Effect of inoculum/substrate ratio on methane yield and production rate from straw." Biological wastes 28(4): 247-255. [CrossRef]
- Jokela, J., V. Vavilin and J. Rintala (2005). "Hydrolysis rates, methane production and nitrogen solubilisation of grey waste components during anaerobic degradation." Bioresource Technology 96(4): 501-508. [CrossRef]
- Kamali, M., T. Gameiro, M. E. V. Costa and I. Capela (2016). "Anaerobic digestion of pulp and paper mill wastes–An overview of the developments and improvement opportunities." Chemical Engineering Journal 298: 162-182. [CrossRef]
- Li, W., H. Khalid, F. R. Amin, H. Zhang, Z. Dai, C. Chen and G. Liu (2020). "Biomethane production characteristics, kinetic analysis, and energy potential of different paper wastes in anaerobic digestion." Renewable Energy 157: 1081-1088. [CrossRef]
- Lindmark, J., N. Leksell, A. Schnürer and E. Thorin (2012). "Effects of mechanical pre-treatment on the biogas yield from ley crop silage." Applied Energy 97: 498-502. [CrossRef]
- Menardo, S., G. Airoldi and P. Balsari (2012). "The effect of particle size and thermal pre-treatment on the methane yield of four agricultural by-products." Bioresource technology 104: 708-714. [CrossRef]
- Meng, L., L. Xie, C. T. Kinh, T. Suenaga, T. Hori, S. Riya, A. Terada and M. Hosomi (2018). "Influence of feedstock-to-inoculum ratio on performance and microbial community succession during solid-state thermophilic anaerobic co-digestion of pig urine and rice straw." Bioresource technology 252: 127-133. [CrossRef]
- Ohemeng-Ntiamoah, J. and T. Datta (2019). "Perspectives on variabilities in biomethane potential test parameters and outcomes: A review of studies published between 2007 and 2018." Science of the Total Environment. [CrossRef]
- Pellera, F.-M. and E. Gidarakos (2016). "Effect of substrate to inoculum ratio and inoculum type on the biochemical methane potential of solid agroindustrial waste." Journal of environmental chemical engineering 4(3): 3217-3229. [CrossRef]
- Pommier, S., A. M. Llamas and X. Lefebvre (2010). "Analysis of the outcome of shredding pretreatment on the anaerobic biodegradability of paper and cardboard materials." Bioresource technology 101(2): 463-468. [CrossRef]
- Rodriguez, C., A. Alaswad, Z. El-Hassan and A.-G. Olabi (2017). "Mechanical pretreatment of waste paper for biogas production." Waste Management 68: 157-164. [CrossRef]
- Rodriguez, C., A. Alaswad, J. Mooney, T. Prescott and A. Olabi (2015). "Pre-treatment techniques used for anaerobic digestion of algae." Fuel processing technology 138: 765-779. [CrossRef]
- Singh, V., E. Khullar, B. Dien, K. Rausch and M. Tumbleson (2013). "Effect of particle size on enzymatic hydrolysis of pretreated miscanthus.". [CrossRef]
- Tedesco, S. (2013). Mechanical Pre-treatment Assessment of Marine Biomass, Dublin City University. School of Mechanical and Manufacturing Engineering.
- Teghammar, A., K. Karimi, I. S. Horváth and M. J. Taherzadeh (2012). "Enhanced biogas production from rice straw, triticale straw and softwood spruce by NMMO pretreatment." Biomass and Bioenergy 36: 116-120. [CrossRef]
- VDI, V. D. I. (2006). "Fermentation of organic materials, Characterisation of Substrate, Sampling, Collection of Material Data, Fermentation Tests." VDI, Gesellschaft, Energietechnik.
- Yuan, X., Y. Cao, J. Li, B. Wen, W. Zhu, X. Wang and Z. Cui (2012). "Effect of pretreatment by a microbial consortium on methane production of waste paper and cardboard." Bioresource Technology 118: 281-288. [CrossRef]
- Zeng, S., X. Yuan, X. Shi and Y. Qiu (2010). "Effect of inoculum/substrate ratio on methane yield and orthophosphate release from anaerobic digestion of Microcystis spp." Journal of Hazardous Materials 178(1-3): 89-93. [CrossRef]
- Zhao, S., W. Chen, W. Luo, H. Fang, H. Lv, R. Liu and Q. Niu (2021). "Anaerobic co-digestion of chicken manure and cardboard waste: Focusing on methane production, microbial community analysis and energy evaluation." Bioresource Technology 321: 124429.
|
Disclaimer/Publisher’s Note: The statements, opinions and data contained in all publications are solely those of the individual author(s) and contributor(s) and not of MDPI and/or the editor(s). MDPI and/or the editor(s) disclaim responsibility for any injury to people or property resulting from any ideas, methods, instructions or products referred to in the content. |
© 2024 by the authors. Licensee MDPI, Basel, Switzerland. This article is an open access article distributed under the terms and conditions of the Creative Commons Attribution (CC BY) license (http://creativecommons.org/licenses/by/4.0/).
