Preprint
Article

The Accumulations of Manganese by the Wild Plants Grown on Gumuskoy Mining Soils

Altmetrics

Downloads

115

Views

51

Comments

0

This version is not peer-reviewed

Submitted:

17 February 2024

Posted:

19 February 2024

You are already at the latest version

Alerts
Abstract
This study examined the accumulations and transfer of manganese into 11 wild plants from the mining soils of Gümüşköy, Turkey. The greatest silver resource in Turkey is found in the Gümüsköy mining area, which is situated roughly 25 kilometers to the west of Kütahya. ICP-MS was used to determine the Mn contents in soil and plant samples that were taken from the field. In the research area, the average Mn concentrations in the soil, roots, and shoots of wild plants were 1872, 1076, and 1048 ppm, respectively. Based on their ECS and ECR values, the plants were divided into three groups: the best plants, good plants, and candidate plants. While Glaucium flavum, Carduus nutans, Phlomis sp., Onosma sp., and Verbascum thapsus were selected as the best plants, Cynoglossum officinale, Anchusa arvensis were determined as good plants, and the others (Alyssum saxatile, Centaurea cyanus, Silene compacta, Isatis were determined as candidate plants. According to the current study, all of the best and good plants in the study region had a very high ability to remove Mn. As a result, these plants can be helpful in studies involving phytoremediation or remediation of Mn-polluted soil.
Keywords: 
Subject: Environmental and Earth Sciences  -   Environmental Science

1. Introduction

Among trace elements in the lithosphere, manganese is one of the most prevalent. 350 to 2000 mg/kg is the usual range in which it occurs in rocks, with mafic rocks having the highest amounts. As a member of the iron family, manganese and other elements are intimately related in geochemical processes. Consequently, in a variety of terrestrial settings, Mn cycles come after Fe cycles. Pyrolusite, manganite, hausmannite, and rodochrozite are the most prevalent minerals containing manganese [1]. Mn in superficial environments is oxidized by air conditions during weathering, and the resulting Mn oxides are easily condensed into secondary Mn mineral formations, frequently in the form of concretions and nodules. Mn’s redox state is changeable, ranging from +2 to +7, and is influenced by both biological and geochemical activities. The most prevalent cation is Mn2+, which easily takes the place of other divalent cations (such Fe2+ and Mg2+). Numerous oxides and hydroxides with varying stability and characteristics were formed as a result of Mn’s complicated chemical and mineralogical behavior as well as its involvement in oxidation- reduction processes [2].
Due to their persistent qualities and lack of biodegradability, as well as the fact that they bioaccumulate in the bodies of living things like plants and animals, heavy metals are one of the biggest environmental problems [3,4,5,6]. The following heavy metals can be eliminated by using various plants: Mn, Sb, Tl, Hg, Th, Cd, U, As, Ni, Cu, Co, Cr, Zn, Pb, Ag, and Sr. These heavy metals contaminate surface soils and water in mining sites [7,8].
Manganese’s maximum accumulation concentration value in agricultural soils is predicted to be between 1500 and 3000 mg/kg, however it has not been deemed a polluting metal in soils. Sludge from sewage systems, metal smelting operations, and municipal wastewaters are the main human sources of manganese. In order to properly nourish plants, growth media must include sufficient amounts of accessible Mn. The results provide sufficient proof that the intake of Mn is regulated by metabolism. According to Skinner et al. [9], it is transported in the reduced Mn2+ state across the soil-root interface, which is presumably comparable to the transport of other divalent cation species like Mn2+ and Ca2+. But Mn is also likely to be absorbed passively, particularly at high and hazardous quantities in the soil solution. Since Mn is generally known to be quickly absorbed and translocated inside plants, it is unlikely that Mn is attaching to insoluble organic ligands in either the xylem fluid or the root tissue [2].
Among different plant species growing on the same soil, manganese varies particularly widely, over 500 mg/kg in Lupinus albus from an average of 30 mg/kg in Medicago trunculata. Similar to this, reports from many nations indicate that a broad range of Mn in forage plants has been found. Globally, grasses contain 17–334 mg/kg of Mn, while clover contains 25–119 mg/kg. According to reports, the levels of Mn in plant meals vary as well; beet roots have the highest concentration (36–113 mg/kg) and apples have the lowest (1.3–1.5 mg/kg). Significant differences can be seen in the Mn content between different plant species, growth stages, organ types, and habitats. The typical Mn concentration of cereal grains is between 18 to 48 mg/kg worldwide, with a comparatively modest variation seen [2]. Because of its numerous harmful effects on the reproductive system and lungs, it may also result in undesired biochemical and physiological functions in both people and animals. Phytoremediation is the least expensive heavy metal removal technology for both soil and water [10,11,12]. The basis for phytoremediation is each plant’s ability to accumulate metals based on its unique morphologic, physiological, anatomic and genetic characteristics [13,14]. Numerous studies have looked at the build-up of heavy metals in terrestrial plants, however there aren’t any more that discuss the build-up of manganese in native plants. Consequently, the primary goals of this research were to: (i) examine the transport and uptake of Mn to plant parts from soil by examining the accumulation and distribution of Mn in the shoots and roots of eleven wild plant species that are naturally growing in Mn-contaminated surface soils of the Gumuskoy mining area; and (ii) ultimately determine whether or not these plants can be used in the rehabilitation of Mn-polluted soils.

2. Materials and methods

2.1. Apparatus

The Mn concentrations in soil and plant samples were examined using the Perkin-Elmer ELAN 9000 ICP-MS technology.

2.2. The study area

The research region is located around 25 km west of Kütahya, Turkey, between 29° 48~–29° 71} E longitude and 38° 96~–39° 48} N latitude (Figure 1), where both continental and moderate climate are seen. The summer is hot and dry, whereas winter is frigid and rainy. The area has an average temperature of 10.5 °C. Kütahya’s forests cover a sizable portion of the city’s surroundings and are highly valuable economically due to the abundance of herbal plants and endemic trees they contain. Gümüşköy mine area is Turkey’s largest silver deposit, and soil and plant samples were collected from this area. The settlements of Dulkadir, Sahin, and Gümüsköy are located near the Gümüsköy mining area. Due to a lengthy mining history, Arik [15,16] and Arik and Yaldiz [17] found that Gümüsköy and the surrounding area have been heavily contaminated by both ancient and current mining activities involving several metals [18]. There are several polymetallic ore deposits in the different regions of Turkey [19,20,21,22,23,24,25,26] that are represented by Cu, Ag, Au, Pb, Zn, Sb, As, and Ba. Sedimentary, volcanic, and metamorphic rocks with ages ranging to the present from the Permian are found in outcrops in this area [15] (Figure 1).
Every sample was collected at random from the mining district between July and May of 2022. 39 separate locations in the mining area between 0.10 and 0.40 meters below the surface were used to gather soil samples. The soils turn from pale brown to dark brown. The majority of the investigated plants only survive a few years when grown as native plants in the wild. 11 native and dominant species that grow in and around the study area were examined for Mn concentrations: Verbascum thapsus (VR), Carduus nutans (CR), Isatis (IS), Anchusa arvensis (AN), Centaurea cyanus (CE), Verbascum thapsus (VR), Anchusa arvensis (AN), Cynoglossum officinale (CY), Phlomis sp. (PH), Glaucium flavum (GL), Ansatis (IS), Onosma sp. (ON), and Alyssum saxatile (AL),. Following the oven-dried process of 100 oC for soil samples. It was broken down for an hour at 95 oC in a solution of HNO3, H2O, and HCl. ICP-MS was used to evaluate this digest for Mn. The plant’s root and shoot sections were properly cleaned in tap water, dried at 60 oC, and then ashed at 300 oC for a full day. The washed plants were combined with H2O, HCl, and HNO3 after being digested in HNO3 for an hour. For Mn., the digest was evaluated by ICP-MS. The International Standards Organization (ISO) 9001 Model for Quality Assurance and ISO/IEC 17025 General Requirements for the Competence of Testing and Calibration Laboratories (www.acmelab.com/services/quality-control/) were followed by the qualified and accredited laboratory where strontium analysis was carried out. Using an ICP-MS Perkin Elmer Elan 9000 (explain the instrument), strontium was measured using 115In and 88Mn. For soils, the laboratory used certified reference material CDV-1, and for plants, V16.

2.4. ECR

The calculation of the enrichment coefficients (ECR) for roots involved dividing the soil concentration of the plant roots for every individual plant. According to Chen et al. [27], this coefficient is a measure of the quantity of metal that has accumulated in plant roots from the soil. According to Wei et al. [28], the ECR of metal excluder plants is less than 1, however the ECR of hyperaccumulator plants is larger than 1.

2.5. ECS

By dividing the soil values of plant shoot values for each plant, the enrichment coefficients (ECS) for shoot were determined. Each plant’s capacity for accumulation is shown by this coefficient [29]. For similar investigations, this value is crucial since it illustrates the metals’ capacity to accumulate in the shoot from the soil. Thus, a plant’s capacity to absorb and store energy is defined by the ECS. Hyperaccumulator plants have an ECS larger than 1, whereas metal excluder plants have an ECS less than 1 [28]. According to Sasmaz et al. [30] plants can also be considered the best or good if their ECR values are near to 1.

2.6. TLF

The metal ratio that was transferred from the plant roots to the shoot was known as the translocation factor (TLF). Translocation factors are greater than 1 in hyperaccumulator plants. This factor shows the ability of the plant to move metal from its roots to its shoots [31]. For investigations on phytoremediation, this value which indicates that the metals can be transferred from the root to the shoot without accumulating is crucial [30].

2.7. Analytical statistics

Using SAS (SAS Institute, Cary, NC), the data was subjected to ANOVA variance analysis with a crucial p-value of 0.05 in every test. Using the Spearman Rank correlation, the Mn values in the soils of the Gümüsköy mining area were associated with other metals [32]. Additionally provided are the arithmetic means and median values for the Mn concentrations in the soil and plant sections.

3. Results and Discussion

3.1. Manganese in soil

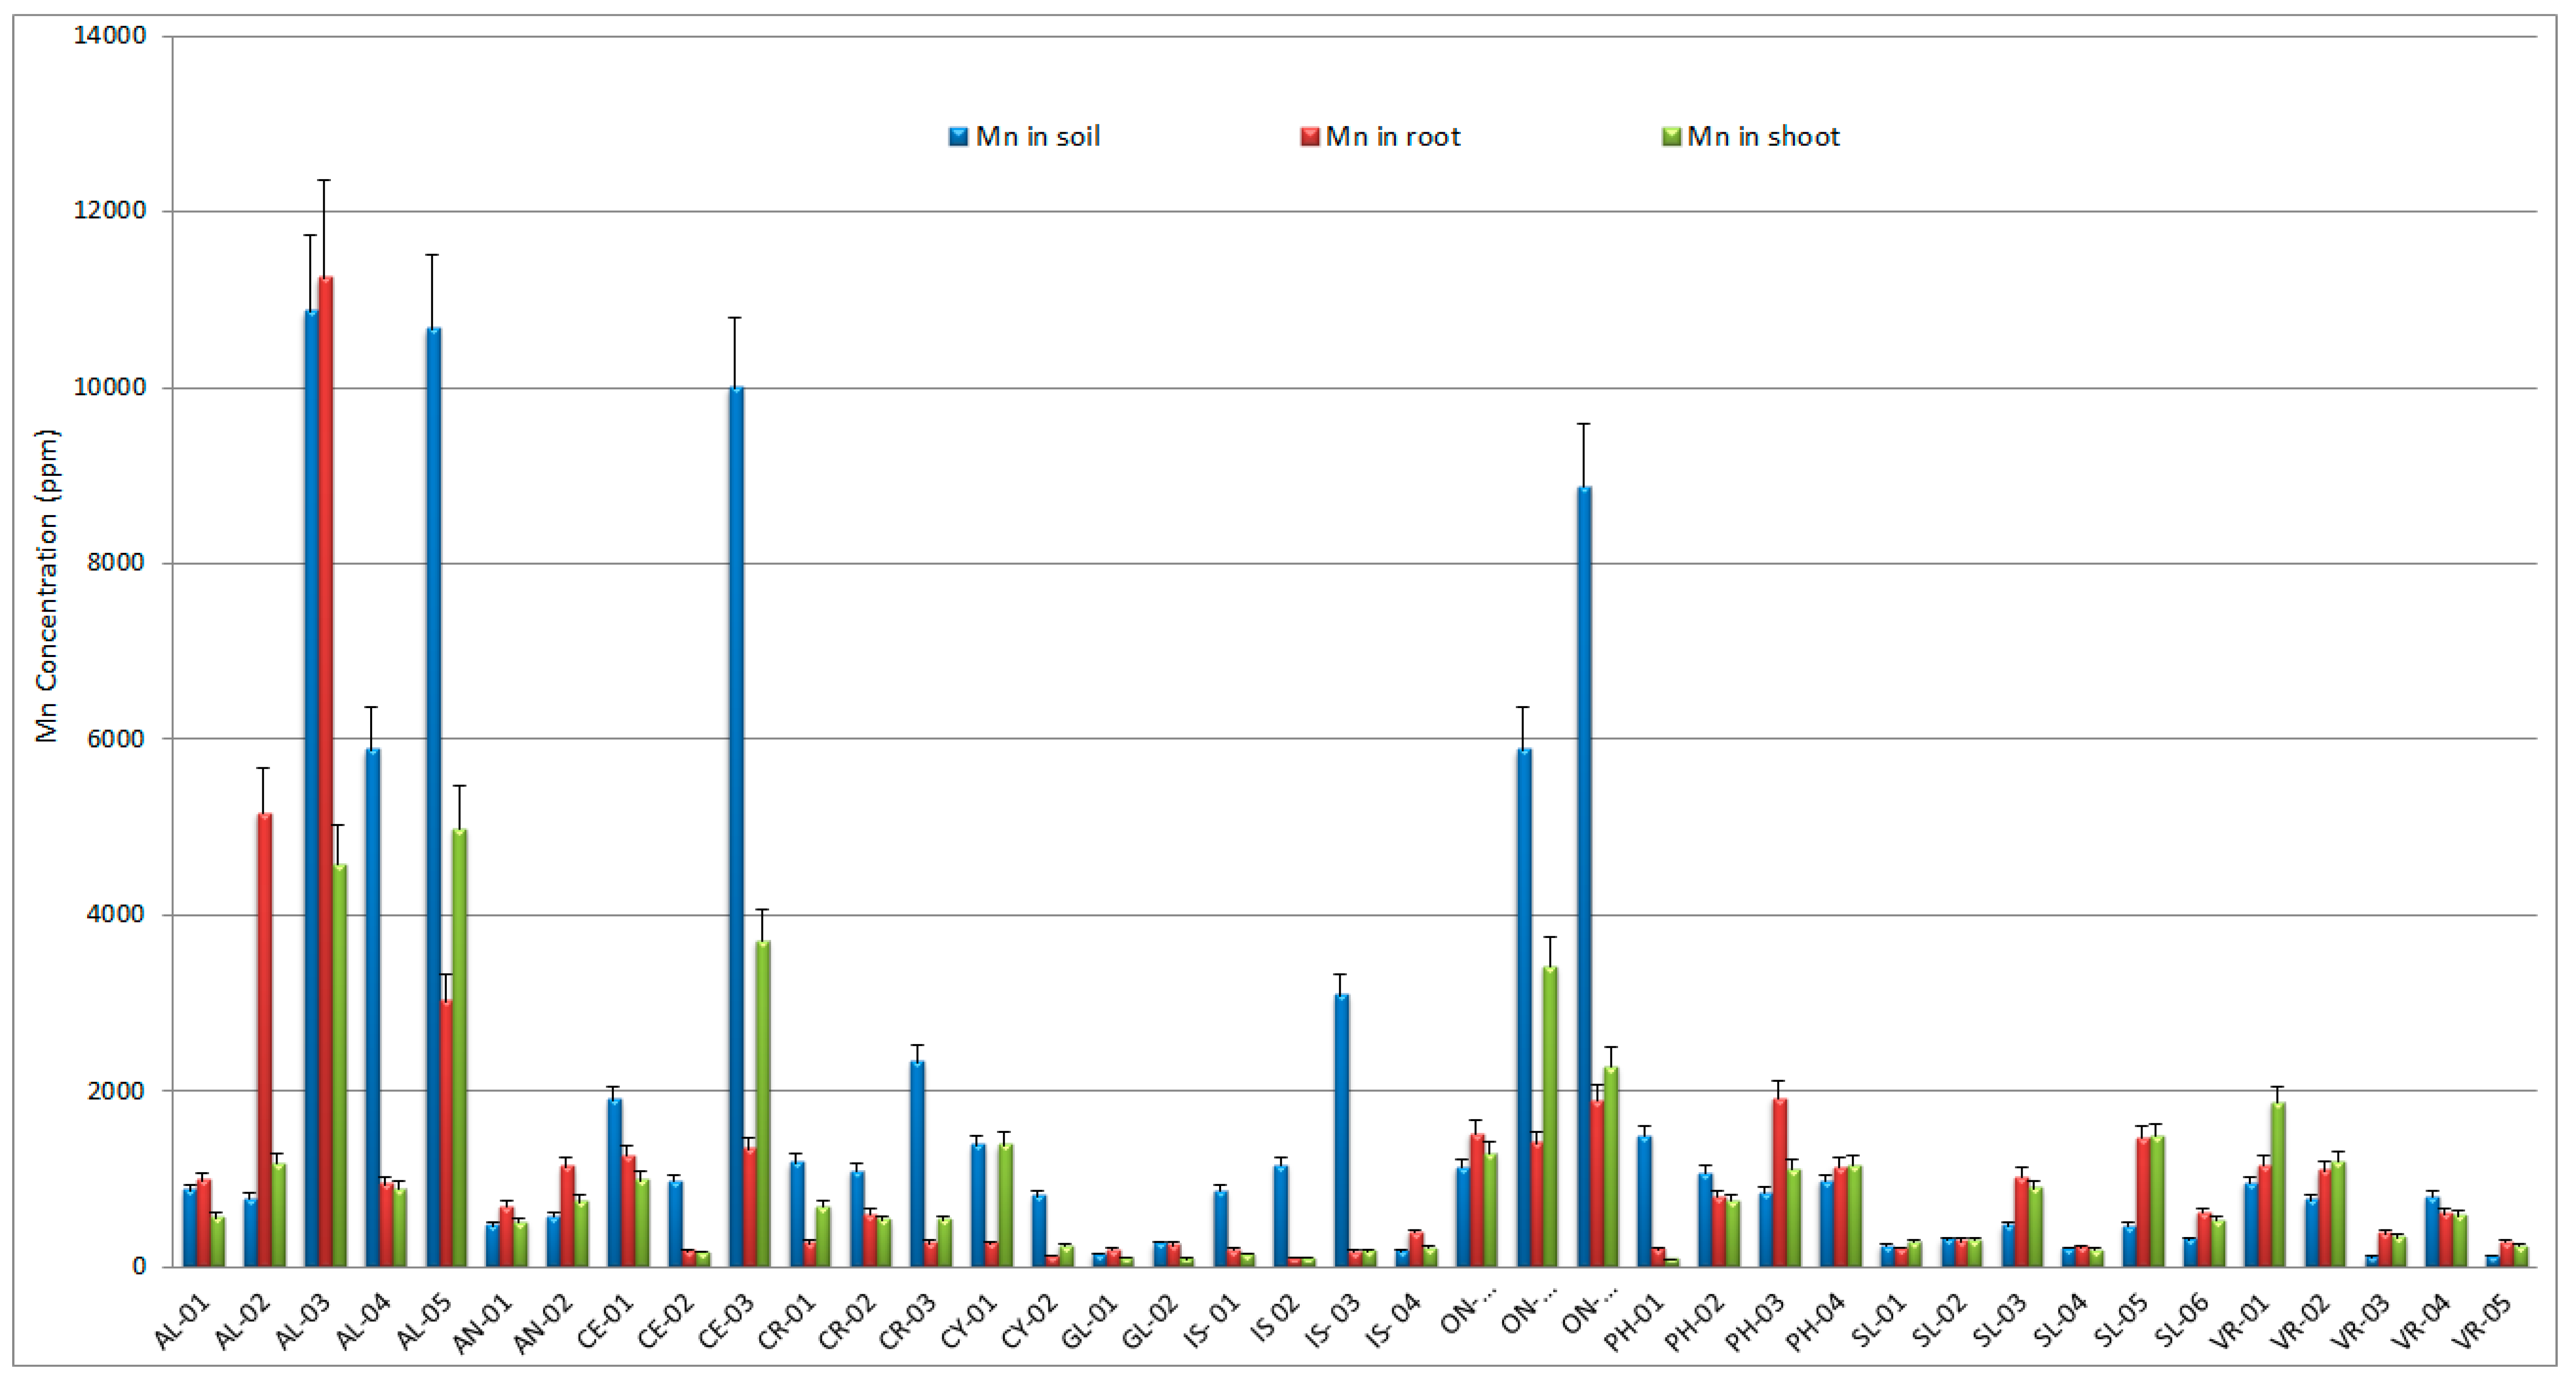
The Mn concentrations in these soils were observed to be between 9.6 and 2018 ppm (mean: 221 ppm) (Table 1; Figure 2). The results indicated that high Mn content of these rocks was related to some polymetallic mineralization (Ag, Pb, As, Zn and Sb) in this region because of a high linear correlation coefficient among some metals. Strong linear correlations were observed in Mn-Cu, Mn-Pb, Mn-Zn, Mn-Fe, Mn-Se and Mn-Cd, whereas low negative correlations were found in Mn-P, Mn-U and Mn-Tl (Table 2).

3.2. Manganese in native plants

The mean Mn levels of the roots and shoots of the studied plants are 469 and 430 ppm, respectively. However, the maximum and minimum values of Mn in the studied plants are 2864 and 18.2 ppm in the roots and 3612 and 6.5 ppm, respectively, in the shoots.
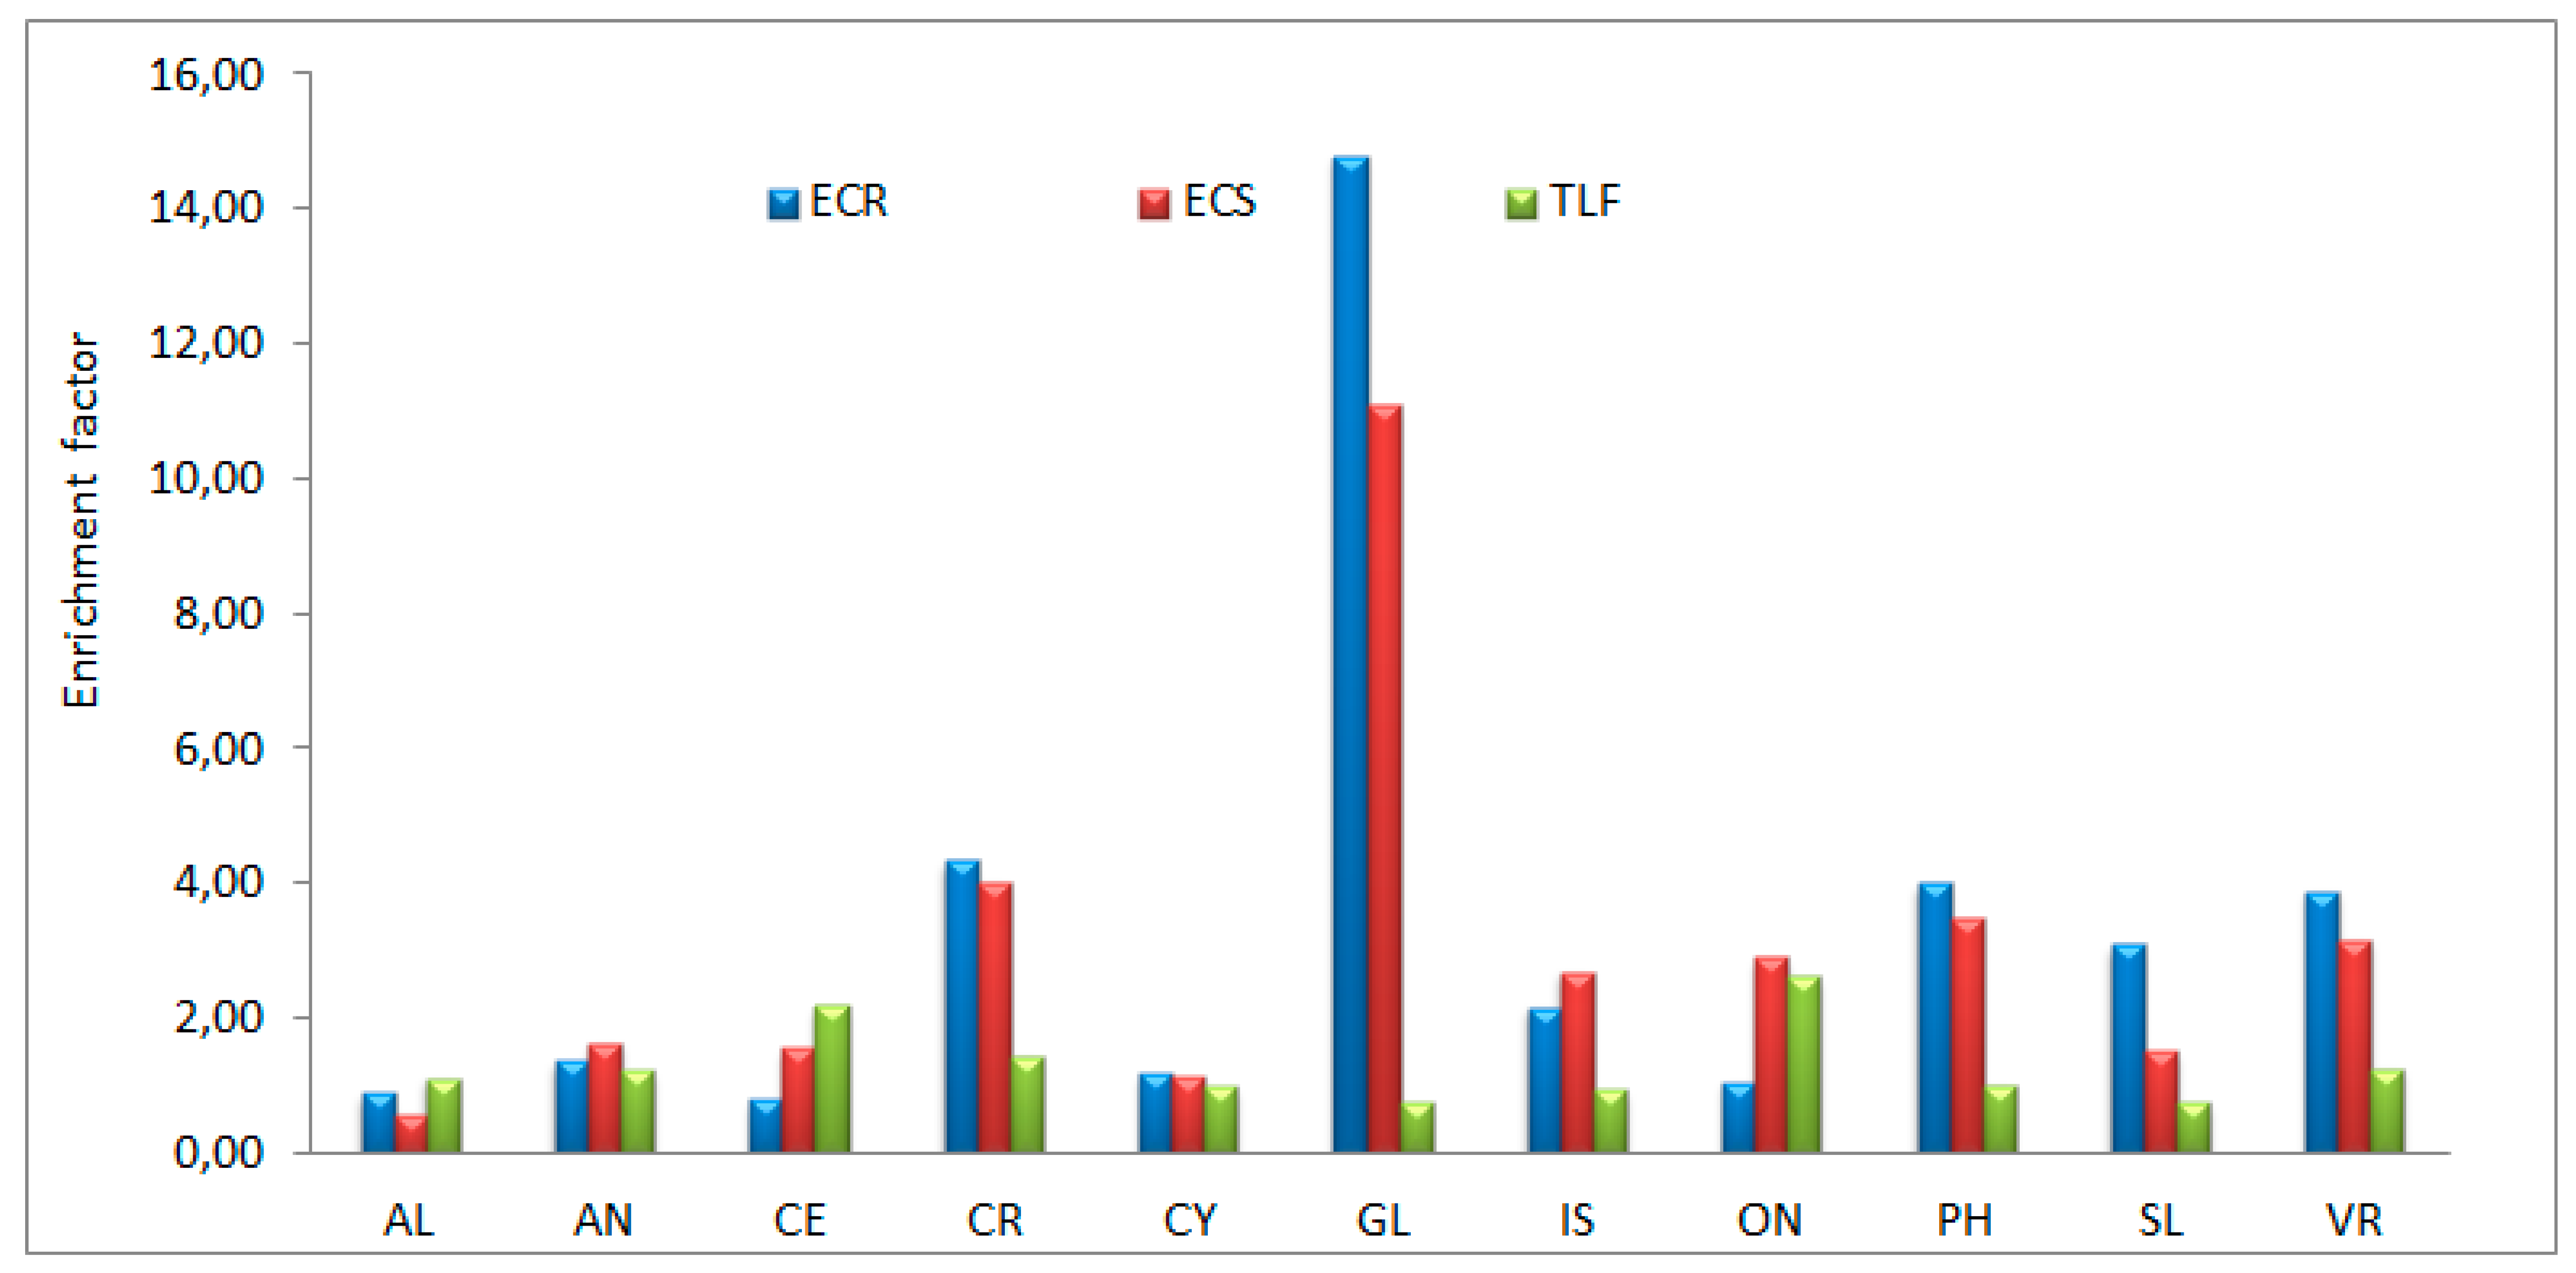
The mean Alyssum saxatile (AL)’s soil, root, and shoot values for Mn are 328, 260, and 173 ppm, respectively (Figure 2; Table 1). The Mn values in AL’s soils is greater than the shoot and root values, with the respective maximum and minimum Mn values of AL changing between 305 and 86 ppm for the roots and between 261 and 113 ppm for the shoots. These levels are much higher than Mn content of the reference plant (200 ppm) suggested by Pais & Jones [33]. The ECS and ECR of Mn for AL’s shoots and roots are given, respectively, as 0.59and 0.90, and are lower than their soil values. The AL’s TLFs for Mn are between 0.20 and 2.66 (mean: 1.12). The values indicate that AL is a good plant for the bioaccumulation of Mn because the ECRs and ECSs values are close to 1.
The mean Mn levels in Anchusa arvensis’s (AN) soil, roots, and shoots are, respectively, 1096, 1347, and 1936 ppm (Figure 2; Table 1). The average values of ECS and ECR for Mn are, respectively, 1.65 and 1.38. The AN’s TLF was observed to be between 0.93 and 1.13 (mean: 1.03) (Figure 3; Table 1). These values show that AN is very well plant to bioaccumulate Mn due to higher ECS and ECR>1.
The average Centaurea cyanus (CE)’s soil, root, and shoot values are, respectively, 122, 97, and 218 ppm (Figure 2; Table 1). The average value of soils for Mn is lower than the average of shoot and higher than the average of root (p < 0.05). The ECS is 1.56 higher than 1, but ECR is 0.81 lower than 1. These parameters indicate that C. cyanus can use in the phytoremediation studies of Mn due to higher ECS than 1 (Figure 3; Table 1).
The mean soil, roots, and shoots values of the Carduus nutans (CR) for Mn are, respectively, 36, 158, and 134 ppm. The mean Mn concentrations of CR’s root and shoot are greater than that in the soil. The mean ECR, ECS, and TLF for Mn in CR are 4.35, 4.04, and 1.44, respectively (Figure 3; Table 1). These results indicate that CR can be useful in the phytoremediation studies of Mn due to higher ECS and ECR than 1.
The mean soil, root, and shoot values of Cynoglossum officinale (CY) for Mn are, respectively, 27, 31, and 39 ppm. The average Mn values of soils are lower than that in the CY’s shoot and root. The average values of CY’s ECR, ECS, and TLFs are 1.18, 1.13 and 1.00, respectively (Figure 3; Table 1). These parameters indicate that CY’s shoot can be good plant to bioaccumulate Mn due to higher ECS and ECR than 1.
The mean Glaucium flavum’s (GL) soil, roots, and shoots values are, respectively, 175, 2576, and 1920 ppm for Mn. The mean GL’s ECR, ECS, and TLF are, 14.8, 11.05, and 0.75, respectively for Mn(Figure 3; Table 1). These results show that GL is very well plant for the accumulation of Mn in mining areas.
The average Isatis (IS)’s soil, root, and shoot contents for Mn are 97, 168, and 196 ppm, respectively (Figure 2; Table 1). The Mn values in IS soil are lower than those in shoots and roots. The mean ECR, ECS, and TLFs of IS for Mn are 2.16, 2.70, and 0.95, respectively (Figure 2; Table 1). The IS’s ECS, ECR, and TLFs for Mn show that Isatis is useful plant for the phytoremediation studies of Mn (Figure 3; Table 1).
The mean Onosma’s (ON) soil, root, and shoot values are, respectively, 115, 124, and 364 ppm (Figure 2; Table 1). The mean Mn levels of ON soils are lower than in ON’s shoot and root. The mean ECR and ECS values for Mn are 1.06 and 2.92, respectively (Figure 3; Table 1). These values show that the root and shoot of ON accumulate very well Mn from the soil as seen for Se (Sasmaz et al., 2015).
The average Phlomis (PH)’s soil, root and shoot concentrations are, respectively, 214, 357, and 263 ppm, respectively for Mn. The mean PH’s ECR, ECS, and TLF for Mn are, respectively, 4.00, 3.49, and 1.03 ((Figure 3; Table 1). The ECR and ECS values are greater than 1 (except for PH-04 sample), which shows that the PH root and shoot could be useful for cleaning or rehabilitating of soils polluted by Mn as seen for Se [32].
The mean Silene compacta L. (SL)’s soil, root, and shoot values are, respectively, 281, 172, and 177 ppm (Figure 2; Table 1). The mean Mn values of SL’s soil are higher than in both SL shoots and roots, except for three samples. The mean ECR, ECS and TLF of SL is higher than 1 for three samples (p < 0.05), but they are lower than 1 for three samples ((Figure 3; Table 1).). These parameters indicate that SL cannot use as a bioaccumulator plant for Mn.
The average Verbascum thapsus L. (VR)’s soil, root, and shoot values are, respectively, 221, 469, and 430 ppm for Mn (Table 1). The mean soil values of VR are lower than the mean Mn concentrations in the shoots and roots (p<0.05) (Table 1). The mean ECR and ECS values are 11.03 and 7.03, respectively, greater than 1 (Figure 3; Table 1), which indicates that V. thapsus is very well plant for phytoremediation of soils contaminated by Mn.
According to Kabata-Pendias [2], the composition of the wall rock was the primary indicator of the Mn level in the soil. The manganese concentrations of global soils range from 411 to 550 ppm across these soil samples. In calcareous and loamy soils, it is present at the highest quantities. The typical Mn content of soil varies globally, ranging to 525 ppm (in Cambisols) from 270 ppm (in Podzols). The mean for soils worldwide is 488 ppm, whereas the computation for soils in the United States is 495 ppm. In Finnish soils, the 90th percentile of the total Mn concentration is 600 ppm, whereas the level of acid-soluble Mn is 280 ppm. The median Mn values in Lithuanian soils depending on the kind of parent material range from 245 ppm in those derived from eolian sediments to 605 ppm in those derived from loamy clay glacial deposits. Australia’s soils generated from basalts and andesites have been found to have the greatest Mn content, up to 9200 ppm. In numerous additional soils from different nations, mostly belonging to the Cambisols group, the concentration of Mn can reach up to 4000 ppm, with an average falling between 800 and 1000 ppm. Certain top soils in the Slovak Republic have been observed to have high Mn concentrations, up to 8510 ppm [34]. Although Mn has not been found to be a harmful element in soils, its maximal accumulation concentration in agricultural soils is thought to be between 1500 and 3000 ppm. Metal smelting operations, sewage sludge, municipal wastewaters and mining sites are the main human sources of manganese. The fuel additives’ combustion is not as significant. Alluvial soils, however, can accumulate Mn from fuel consumption up to >1000 ppm in some areas (such the Mississippi River Delta) [35]. Soils in polluted riparian regions can have as much as 2700 ppm of Mn [36]. Because of the reductive breakdown of Mn oxides, the soluble Mn fraction rises in soils that are irrigated with water impacted by acidic mine waters [37].
Among plants growing on the same soil, manganese varies notably widely; in Medicago trunculata, the average is 30 ppm, while in Lupinus albus, it is almost 500 ppm. Similar to this, reports from many nations indicate that a broad range of Mn has been found in forage plants. Most plants have critical Mn deficiency levels between 15 and 25 ppm, but the hazardous Mn concentration for plants varies greatly depending on soil and plant variables. In general, a Mn level of more than 400 ppm affects the majority of plants. However, for a number of more resistant species or genotypes, the accumulation exceeding 1000 ppm has also frequently been recorded [35,36,38]. According to Peng et al. [1], the hyperaccumulator plants, Phytoacca americana, accumulated up to 13,400 ppm of Mn from the polluted soil in their leaves.
Bihanic et al. [39] and Losfeld et al. [40] have reported success using Grevillea meisneri in the restoration of degraded mining sites in New Caledonia and in providing biomass for the synthesis of ecocatalysts. It was observed that transplanted seedlings from nurseries accumulate the same amount of Mn as plants do and store it in the same tissues to produce biomass that is high in Mn. It has been found that Mn can accumulate in the dried leaves of Alyxia poyaensis and Denhamia species at amounts more than 1%. These plants were referred to by van der Ent et al. [41] as “Mn hyperaccumulators”. In a similar vein, many species found in New Caledonia collect manganese at levels between 3,000 and 10,000 ppm.
Based on field study conducted in Mn-rich soils, Min et al. [38] identified Phytolacca americana as a new manganese hyperaccumulator plant. This species exhibits exceptional Mn absorption and accumulation capabilities in addition to its amazing tolerance to the element. On the Mn tailings wastelands of Xiangtan, the greatest Mn level in the leaf dry matter was 8000 ppm, with a mean of 6490 ppm. A high translocation factor (>10.76) was found to be characteristic of the species. As external Mn levels grew in nutrient solution cultivation conditions, the concentrations of manganese in the shoots also increased. These species offer a novel plant resource for investigating the process underlying Mn hyperaccumulation and may prove useful in the phytoremediation of soils contaminated with Mn.
The level of Mn in the tissues above ground is consistently higher than that in the roots, according to research by Yang et al. [42]. Mn levels in the stems and leaves all surpassed 10,000 ppm, the recommended threshold for Mn hyperaccumulation, when the external Mn supply was at high concentrations. A significant 86% of the Mn extracted from the substrates was deposited in the aboveground tissues. Schima superba is a Mn hyperaccumulator, as these results verified.
Branching and leaves of bilberry (Vaccinium myrtillus) grown on low-pH (2.77-3.62) soil with high Mn content (490-6277 ppm) were gathered in the Krusne Hory Ore Mountains, Czech Republic. The range of Mn concentration in leaves was 274-11,159 mg kg-1, with a notable rise during the growth season when the leaves dried up early because of the lack of precipitation. The amounts of Mn in the branches of newly sprouted leaves were similar in the years of collection and growth seasons (2062-3885 ppm). It was established that manganese hyperaccumulation occurs in bilberries and that manganese levels rise steadily during the growing seasons. There was a favorable link found between soil moisture content and the manganese level of bilberry leaves [43].

CONCLUSIONS

The studied plants grown in the Kütahya mining area were divided into various groups according to ECS and ECR values such as the plants were divided into three groups: the best plants, good plants, and candidate plants in terms of Mn phytoremediation. The best plants (higher ECR and ECS than 3) for Mn phytoremediation are Glaucium flavum, Carduus nutans, Phlomis sp., Onosma sp., and Verbascum thapsus. The good plants (higher ECR and ECS than 1) for Mn phytoremediation are Cynoglossum officinale and Anchusa arvensis. Therefore, these plants would be useful for the rehabilitating and/or cleaning of soils polluted by Mn. Among the studied plants in the study area, Alyssum saxatile, Centaurea cyanus, Silene compacta, Isatis can be only a candidate plant, not bioaccumulator in biomonitoring studies due to lower ECR and ECS than 1. Plantings of the best bioaccumulator plants can be used for the biomonitoring studies of environmental pollution and the cleaning/rehabilitation of the areas polluted by Mn. The TLF values showed the transferability of Mn to the shoots from the roots. According to these TLFs, Cynoglossum officinale, Centaurea cyanus, Anchusa arvensis, and Onosma sp. plants for Mn were observed to be most efficient

Acknowledgements

We sincerely thank to TUBITAK (CAYDAG 110Y003), Turkey for financial assistance.

References

  1. [1] Peng K.J., Luo C.L., You W.X., et al. 2008. Manganese uptake and interactions with cadmium in the hyperaccumlator. Phytolacca Americana L. J. Hazard. Mater. 154:674 − 681.
  2. [2] Kabata-Pendias A. 2011. Trace Elements in soils and plants. CRC Press, Boca Raton.
  3. [3]Khan K, Khan H, Lu Y, Ihsanullah I, Nawab J, Khan S, Shah NS, Shamshad I, Maryam A. 2014. Evaluation of toxicological risk of foodstuffs contaminated with heavy metals in Swat, Pakistan. Ecotox Environ Saf. 108, 224–232. [CrossRef]
  4. [4] Iqbal, M., 2016. Vicia faba bioassay for environmental toxicity monitoring: a review. Chemosphere 144, 785–802. [CrossRef]
  5. [5] Iqbal, M., Iqbal, N., Bhatti, I.A., Ahmad, N., Zahid, M. 2016. Response surface methodology application in optimization of cadmium adsorption by shoe waste: a good option of waste mitigation by waste. Ecol. Eng. 88, 265–275. [CrossRef]
  6. [6]Mani D, Kumar C, Patel NK. 2016. Integrated micro-biochemical approach for phytoremediation of cadmium and lead contaminated soils using Gladiolus grandiflorus L cut flower. Ecotox Env Saf 124, 435-446. [CrossRef]
  7. [7]US EPA, 2000. Introduction to phytoremediation. National Risk Management Research Laboratory, Office of Research and Development, EPA/600/R-99/107.
  8. [8]Wong MH. 2003. Ecological restoration of mine degraded soils, with emphasis on metal contaminated soils, Chemosphere 50,775–80.
  9. [9] Skinner W.M., Martin R.R., Naftel S.J., et al. 2005. Multi-technique studies of the distribution of metals between the soil, rhizosphere and roots of Populus tremuloides growing in forest soil. ICOBTE, 8 Int. Conf. Book Abstr. 488–489, Adelaide.
  10. [10] Ansari AA, Gill SS, Gill R, Lanza GR, Newman L. 2015. Phytoremediation. Management of Environmental Contaminants, Springer International Publishing Switzerland. 366 p.
  11. [11] Sasmaz M, Akgül B, Yıldırım D, Sasmaz A. 201a. Mercury uptake and phytotoxicity in terrestrial plants grown naturally in the Gumuskoy (Kutahya) mining area, Turkey. Int J Phytorem 18 (1), 69-76. [CrossRef]
  12. [12] Sasmaz A. 2011. As, Ag, Pb, Sb and Tl levels in soil and plants around Gumuskoy mining area (Kutahya) and their possible effects on the environment. TUBİTAK project (CAYDAG-110Y003). Ankara, 83 pp.
  13. [13] Liu XH, Gao YT, Sardar K, Duan G, Chen AK, Ling L, Zao L, Zhonghan L, Xuecan W. 2008. Accumulation of Pb, Cu, and Zn in terrestrial plants growing on contaminated sites and their potential accumulation capacity in Heqing, Yunnan. J Environ Sci 20:1469-1474.
  14. [14] Yoon J, Cao X, Zhou Q, Ma LQ. 2006. Accumulation of Pb, Cu, and Zn in terrestrial plants growing on a contaminated Florida site. Sci. Total Environ. 368, 456–464.
  15. [15] Arik F. 2002. Gümüsköy (Kütahya, Turkey) gümüş yataginin jeokimyasal modellemesi, Selçuk Üniv. Fen Bilimleri Enst. Doktora Tezi, p 318.
  16. [16] Arik F. 2012. Genetic characteristics of the Gozecukuru As-Sb deposits near Kutahya, Turkey. J. Geol. Soc. India 80:855-868. [CrossRef]
  17. [17] Arık F, Yaldız T. 2010. Heavy Metal Determination and Pollution of the Soil and Plants of Southeast Tavşanlı (Kütahya, Turkey). Clean Soil Air Water 38, 1017–1030.
  18. [18] Kartalkanat A. 2008. Anadolu’da madenciliginin tarihçesi; Kütahya-Gümüsköy’de 3500 Yıldır süren madencilik çalışmaları. MTA Dergisi 137, 91-97.
  19. [19] Tüysüz, N., 2000. Geology, lithogeochemistry and genesis of the Murgul massive sulfide deposit, NE Turkey. Chemie der Erde, 60: 231-250.
  20. [20] Unal, E., Gökçe, A., 2007. Geology and fluid inclusion characteristics of the Akgüney (Kabadüz-Ordu) copper–lead–zinc deposits. Geological Bulletin of Turkey, 50 (3) : 158–175.
  21. [21] Helvacı C. 2015. Geological features of Neogene basins hosting borate deposits: an overview of deposits and future forecast, Turkey. Bulletin of the Mineral Research and Exploration 151, 169-215. [CrossRef]
  22. [22] Azizi, M.R. Abedeni A, Alipour S, Niroomand S, Sasmaz A, Talaei B. 2017. Rare earth element geochemistry and tetrad effect in fluorites: A case study from the Qahr-Abad deposit, Iran. N.Jb. Palont.Abh 283/3, 255-273. [CrossRef]
  23. [23] Kuşcu, I., 2019. Skarn and skarn deposits of Turkey. In: Pirajno, F., et al., eds., Mineral Resources of Turkey. Springer, Swirzerland. 283-336.
  24. [24] Sipahi, F., Akpınar, I., Saydam Eker, Ç., Kaygusuz, A., Vural, A., Yılmaz, M. 2017. Formation of the Eğrikar (Gümüşhane) Fe–Cu skarn type mineralization in NE Turkey: U–Pb zircon age, lithogeochemistry, mineral chemistry, fluid inclusion, and O–H–C–S isotopic compositions. Journal of Geochemical Exploration, 182: 32–52.
  25. [25] Sasmaz, A. 2020. The Atbara porphyry gold–copper systems in the Red Sea Hills, Neoproterozoic Arabian–Nubian Shield, NE Sudan. Journal of Geochemical Exploration 214, 106539.
  26. [26] Konakci, N., Sasmaz, A. 2021. Geochemical approach to the genesis of the Buyukkizilcik (Afsin) barite deposit, SE Turkey. Italian Journal of Geosciences 140 (3), 422-437. [CrossRef]
  27. [27] Chen SB, Zhu YG, Hu QH. 2005. Soil to plant transfer of 238U, 226Ra and 232Th on U mining-impacted soil from southeastern China. J. Environ. Rad 82, 223-236.
  28. [28] Wei, C.Y., Chen, T.B., Huang, Z.C., 2002. Cretan bake (Pteris cretica L.): An arsenic-accumulating plant. Acta Ecol. Sin. 22, 777–782.
  29. [29] Zhao FJ, Lombi E, Mc Grath SP. 2003. Assessing the potential for zinc and cadmium phytoremediation with the hyperaccumulator Thlaspi caerulescens. Plant Soil 249, 37-43. [CrossRef]
  30. [30] Sasmaz, M., Uslu Senel, G., Obek, E. 2021. Strontium accumulation by the terrestrial and aquatic plants affected by mining and municipal wastewaters (Elazig, Turkey). Environ Geochem Health 43, 2257–2270. [CrossRef]
  31. [31] Zu, Y.Q., Li, Y., Chen, J.J., Chen, H.Y., Qin, L., Schvartz, C. 2005. Hyperaccumulation of Pb, Zn and Cd in herbaceous grown on lead-zinc mining area in Yunnan, China. Environ Int. 31, 755-762.
  32. [32] Ferrando D. 2010. Manganese hyperaccumulation by plants. http://www.botany.unimelb.edu.au/botany.
  33. [32] Sasmaz M, Akgul B, Sasmaz A. 2015. Distribution and accumulation of selenium in wild plants growing naturally in the Gumuskoy (Kutahya) Mining Area, Turkey. Bull Environ Contam Toxic 94 (5), 598-603. [CrossRef]
  34. [33] Pais I, Jones JB. 2000. The handbook of trace elements. St. Lucie Press. Florida, 222 p.
  35. [34] Curlik J., Šefcik P. 1999. Geochemical atlas of the Slovak Republic. Soils. Ministry of the Environment of the Slovak Republic.
  36. [35] Mielke H.W., Gonzales C.R., Powell E., et al. 2002. Natural and anthropogenic processes that concentrate Mn in rural and urban environments of the Lowe Mississippi River Delta. Environ. Res. Sec. A 90:157–168.
  37. [36] Shanahan J.O., Brummer J.E., Leininger W.C., Paschke M.W. 2007. Manganese and zinc toxicity thresholds for mountain and Greyer willow. Int. J. Phytoremediat. 9:437–452.
  38. [37] Min, Y., Tie, B., Tang, M., Aoyama, I. 2007. Accumulation and uptake of manganese in a hyperaccumulator Phytolacca Americana. Miner Eng 20:188–190.
  39. [38] Green C.H., Heil D.M., Cardon G.E., et al. 2003. Solubility of manganese and trace metals in soils affected by acid mine runoff. J. Environ. Qual. 32:1323–1334.
  40. [39] Bihanic, C., Petit, E., Perrot, R. et al. 2021. Manganese distribution in the Mn-hyperaccumulator Grevillea meisneri from New Caledonia. Sci Rep 11, 23780. [CrossRef]
  41. [40] Losfeld, G., L’Huillier, L., Fogliani, B. et al. 2015. Leaf-age and soil-plant relationships: key factors for reporting trace-elements hyperaccumulation by plants and design applications. Environ Sci Pollut Res 22, 5620–5632. [CrossRef]
  42. [41] van der Ent A, Baker AJM, Reeves RD, Pollard AJ, Schat H (2013a) Hyperaccumulators of metal and metalloid trace elements: facts and fiction. Plant Soil 362:319–334.
  43. [42] Yang, S.X., Deng, H., Li, M.S. 2008. Manganese uptake and accumulation in a woody hyperaccumulator, Schima superba. Plant Soil & Env. 54 (10), 441-446. [CrossRef]
  44. [43] Kula, E., Wildova, E. Hrdlicka, P. 2018. Accumulation and dynamics of manganese content in bilberry (Vaccinium myrtillus). Environ Monit Assess 190, 224. [CrossRef]
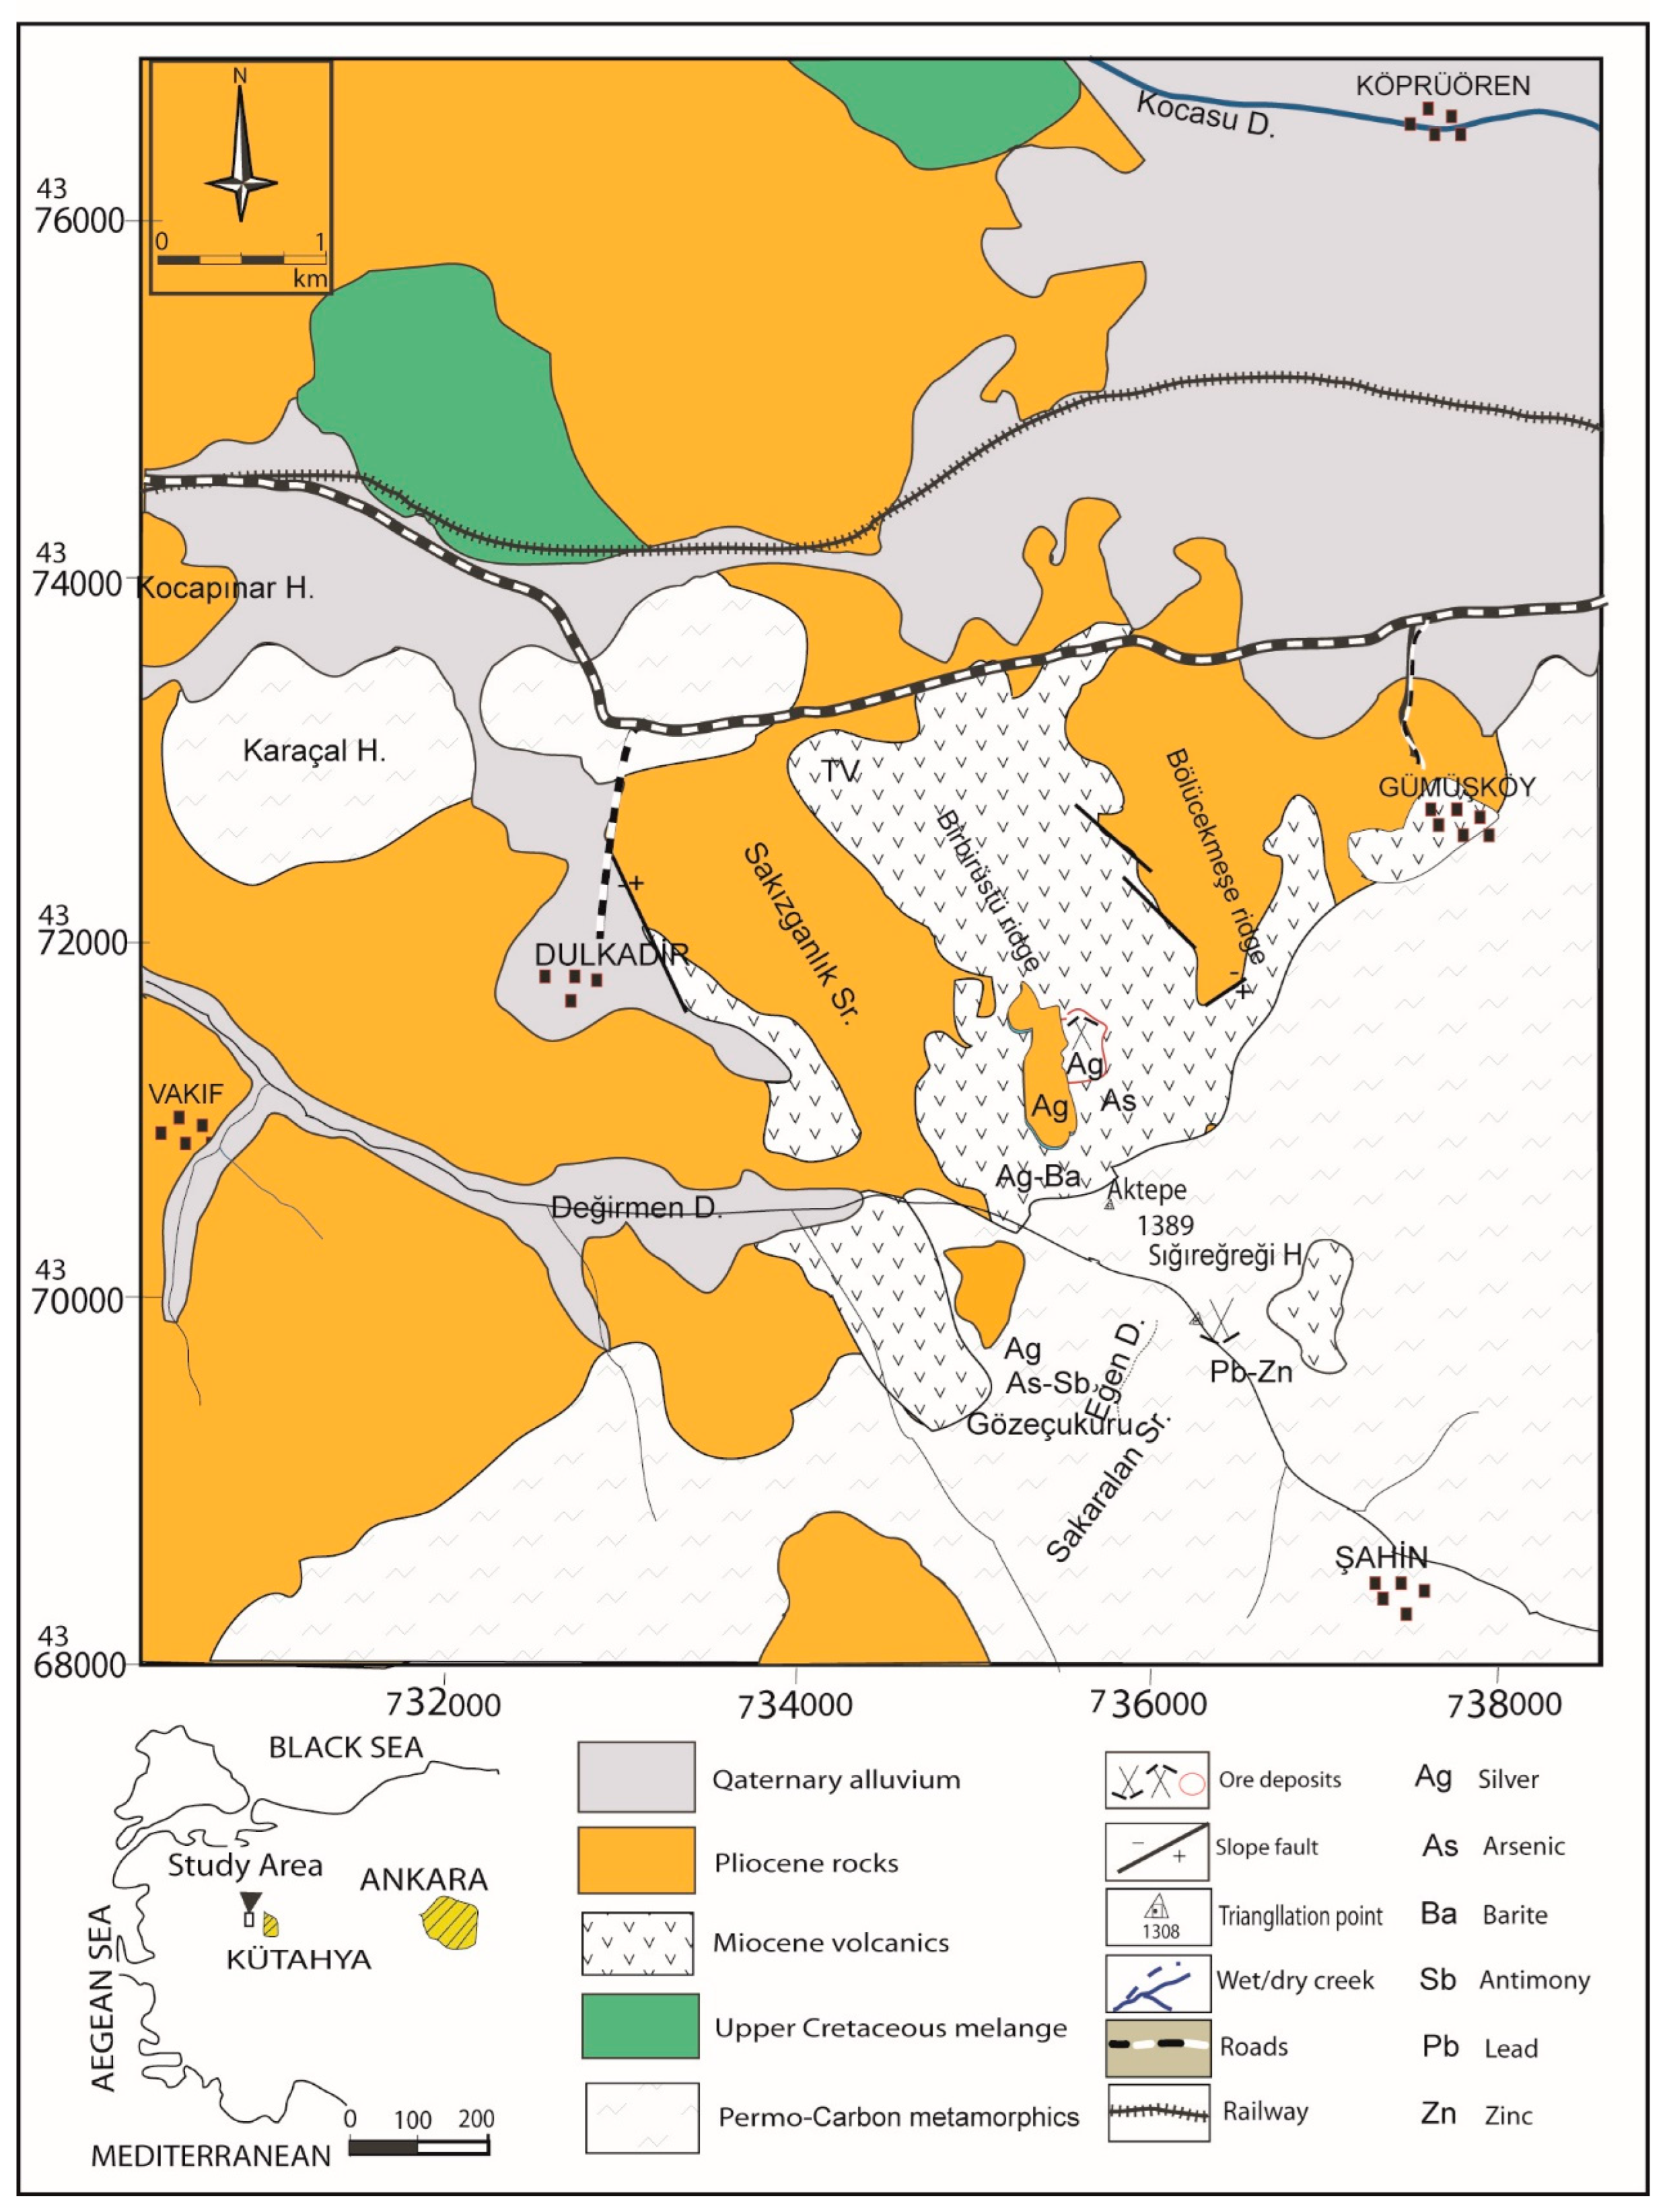
Figure 1. Geological and location map of the study area (simplified from Arik, [15]).2.3. Plant and soil specimens.
Preprints 99167 g001
Figure 2. The Mn concentrations of soils, roots and shoots of 11 plant species.
Preprints 99167 g002
Figure 3. The average ECR, ECS and TLF values of the studied plants for Mn.
Preprints 99167 g003
Table 1. The Mn concentrations of soils, roots and shoots of 11 plant species and TLF, ECR and ECS values of the studied plants for Mn.
Mn in soil Mn in root Mn in shoot ECR ECS TLF
AL-01 141±8.3 86±5.4 114±9 0,61 0,81 1,33
AL-02 270±17 572±42 113±7 2,12 0,42 0,20
AL-03 479±35 305±25 172±12 0,64 0,36 0,56
AL-04 252±14 240±14 206±14 0,95 0,82 0,86
AL-05 500±32 98±8.2 261±16 0,20 0,52 2,66
Averega 328 260 173 0,90 0,59 1,12
AN-01 2018±125 2425±132 3612±232 1,20 1,79 1,49
AN-02 173±12 268±18 260±15 1,55 1,50 0,97
Average 1096 1347 1936 1,38 1,65 1,23
CE-01 107±8 166±12 246±20 1,56 2,30 1,48
CE-02 51±4.4 19±1.4 28±2.2 0,36 0,55 1,50
CE-03 207±16 105±7 381±24 0,51 1,84 3,64
Average 122 97 218 0,81 1,56 2,20
CR-01 55±3.2 218±13 145±12 3,94 2,62 0,67
CR-02 26±1.7 38±2.8 114±10 1,49 4,42 2,98
CR-03 29±2.2 218±14 145±11 7,64 5,08 0,67
Average 36 158 134 4,35 4,04 1,44
CY-01 40±3.1 44±2.6 72±5.2 1,11 1,81 1,64
CY-02 14±1.2 18±1.4 7±0.5 1,26 0,45 0,36
Average 27 31 39 1,18 1,13 1,00
GL-01 181±14 2288±188 1722±144 12,61 9,49 0,75
GL-02 168±13 2864±164 2118±182 17,05 12,61 0,74
Average 175 2576 1920 14,83 11,05 0,75
IS- 01 26±1.6 84±6.2 76±6.8 3,21 2,93 0,91
IS 02 143±11 190±14 49±4.4 1,32 0,34 0,26
IS- 03 132±12 139±12 36±2.6 1,05 0,27 0,26
IS- 04 86±7.3 261±14 621±52 3,05 7,26 2,38
Average 97 168 196 2,16 2,70 0,95
ON-01 76±4.2 79±3.5 183±12 1,03 2,42 2,34
ON-02 152±12 188±14 730±52 1,24 4,79 3,88
ON-03 116±10 105±8.5 178±15 0,91 1,54 1,69
Average 115 124 364 1,06 2,92 2,63
PH-01 75±5.1 563±32 299±22 7,56 4,00 0,53
PH-02 28±1.6 149±13 228±15 5,25 8,01 1,53
PH-03 194±17 565±27 299±18 2,91 1,54 0,53
PH-04 560±44 149±13 228±10 0,27 0,41 1,53
Average 214 357 263 4,00 3,49 1,03
SL-01 133±9 376±23 693±52 2,82 5,21 1,85
SL-02 10±0.6 66±4.5 15±1.2 6,87 1,52 0,22
SL-03 16±1.1 123±11 24±1.6 7,65 1,50 0,20
SL-04 226±15 124±10 116±10 0,55 0,51 0,94
SL-05 426±28 218±18 98±7.3 0,51 0,23 0,45
SL-06 875±66 124±9 116±10 0,14 0,13 0,94
Average 281 172 177 3,09 1,52 0,76
VR-01 15±1.3 81±6.2 145±12 5,35 9,56 1,79
VR-02 56±4.4 183±13 407±38 3,26 7,24 2,22
VR-03 129±11 2134±166 525±27 16,49 4,06 0,25
VR-04 78±5.5 160±13 128±10 2,04 1,63 0,80
VR-05 60±4.3 1682±132 762±66 28,00 12,69 0,45
Average 221 469 430 11,03 7,13 1,10
Table 2. Spearman’s correlation coefficients be tween Mn and some metals in soils (All metal values were taken from Sasmaz, [12]).
Cu Pb Zn Ag Mn Fe As U Sr Sb Ca P Ba Hg Na K Sc Tl Hg Se Cd
Cu 1.00
Pb 0.76 1.00
Zn 0.76 0.71 1.00
Ag 0.55 0.40 0.63 1.00
Mn 0.83 0.77 0.79 0.49 1.00
Fe 0.62 0.65 0.64 0.14 0.70 1.00
As -0.07 0.31 -0.08 -0.42 -0.01 0.42 1.00
U -0.35 0.12 -0.21 -0.44 -0.26 0.25 0.79 1.00
Sr -0.46 -0.01 -0.39 -0.55 -0.35 0.09 0.81 0.90 1.00
Sb -0.12 0.31 -0.01 -0.37 -0.09 0.31 0.92 0.78 0.76 1.00
Ca -0.19 0.06 0.17 -0.15 -0.03 0.06 0.30 0.17 0.19 0.48 1.00
P -0.33 -0.03 -0.36 -0.43 -0.30 0.05 0.76 0.77 0.90 0.68 0.00 1.00
Ba 0.04 0.42 0.25 -0.07 0.28 0.37 0.37 0.29 0.23 0.39 0.50 0.01 1.00
Hg -0.01 0.48 -0.07 -0.12 0.06 0.09 0.51 0.48 0.36 0.52 0.25 0.19 0.54 1.00
Na 0.02 -0.18 0.00 -0.27 -0.03 0.01 -0.09 -0.24 -0.19 -0.13 0.23 -0.19 0.02 -0.18 1.00
K 0.19 -0.03 0.39 0.41 0.14 -0.17 -0.75 -0.59 -0.66 -0.58 0.07 -0.65 0.03 -0.35 0.30 1.00
Sc -0.14 -0.40 -0.41 -0.37 -0.20 -0.01 0.26 0.06 0.20 0.04 -0.33 0.42 -0.44 -0.33 0.16 -0.47 1.00
Tl -0.41 0.11 -0.26 -0.48 -0.30 0.10 0.80 0.87 0.90 0.81 0.30 0.81 0.25 0.52 -0.11 -0.57 0.05 1.00
Hg -0.01 0.48 -0.07 -0.12 0.06 0.09 0.51 0.48 0.36 0.52 0.25 0.19 0.54 1.00 -0.18 -0.35 -0.33 0.52 1.00
Se 0.73 0.72 0.76 0.40 0.67 0.75 0.29 0.08 -0.02 0.25 0.12 0.06 0.14 0.04 0.02 0.02 -0.12 0.11 0.04 1.00
Cd 0.76 0.82 0.72 0.34 0.79 0.79 0.22 -0.04 -0.13 0.13 0.07 -0.14 0.55 0.19 0.02 0.06 -0.25 -0.08 0.19 0.76 1.00
Disclaimer/Publisher’s Note: The statements, opinions and data contained in all publications are solely those of the individual author(s) and contributor(s) and not of MDPI and/or the editor(s). MDPI and/or the editor(s) disclaim responsibility for any injury to people or property resulting from any ideas, methods, instructions or products referred to in the content.
Copyright: This open access article is published under a Creative Commons CC BY 4.0 license, which permit the free download, distribution, and reuse, provided that the author and preprint are cited in any reuse.
Prerpints.org logo

Preprints.org is a free preprint server supported by MDPI in Basel, Switzerland.

Subscribe

© 2024 MDPI (Basel, Switzerland) unless otherwise stated