Introduction
Information geometry (IG) is a cutting-edge geometric methodology that analyzes models and visualizes geometry from an IG perspective. IG has wide applicability in various domains, including machine learning. This approach offers new insights and tools for understanding complex data and improving modeling techniques[1]. What’s more interesting is that statistical manifolds (SMs) were studied with IG. In
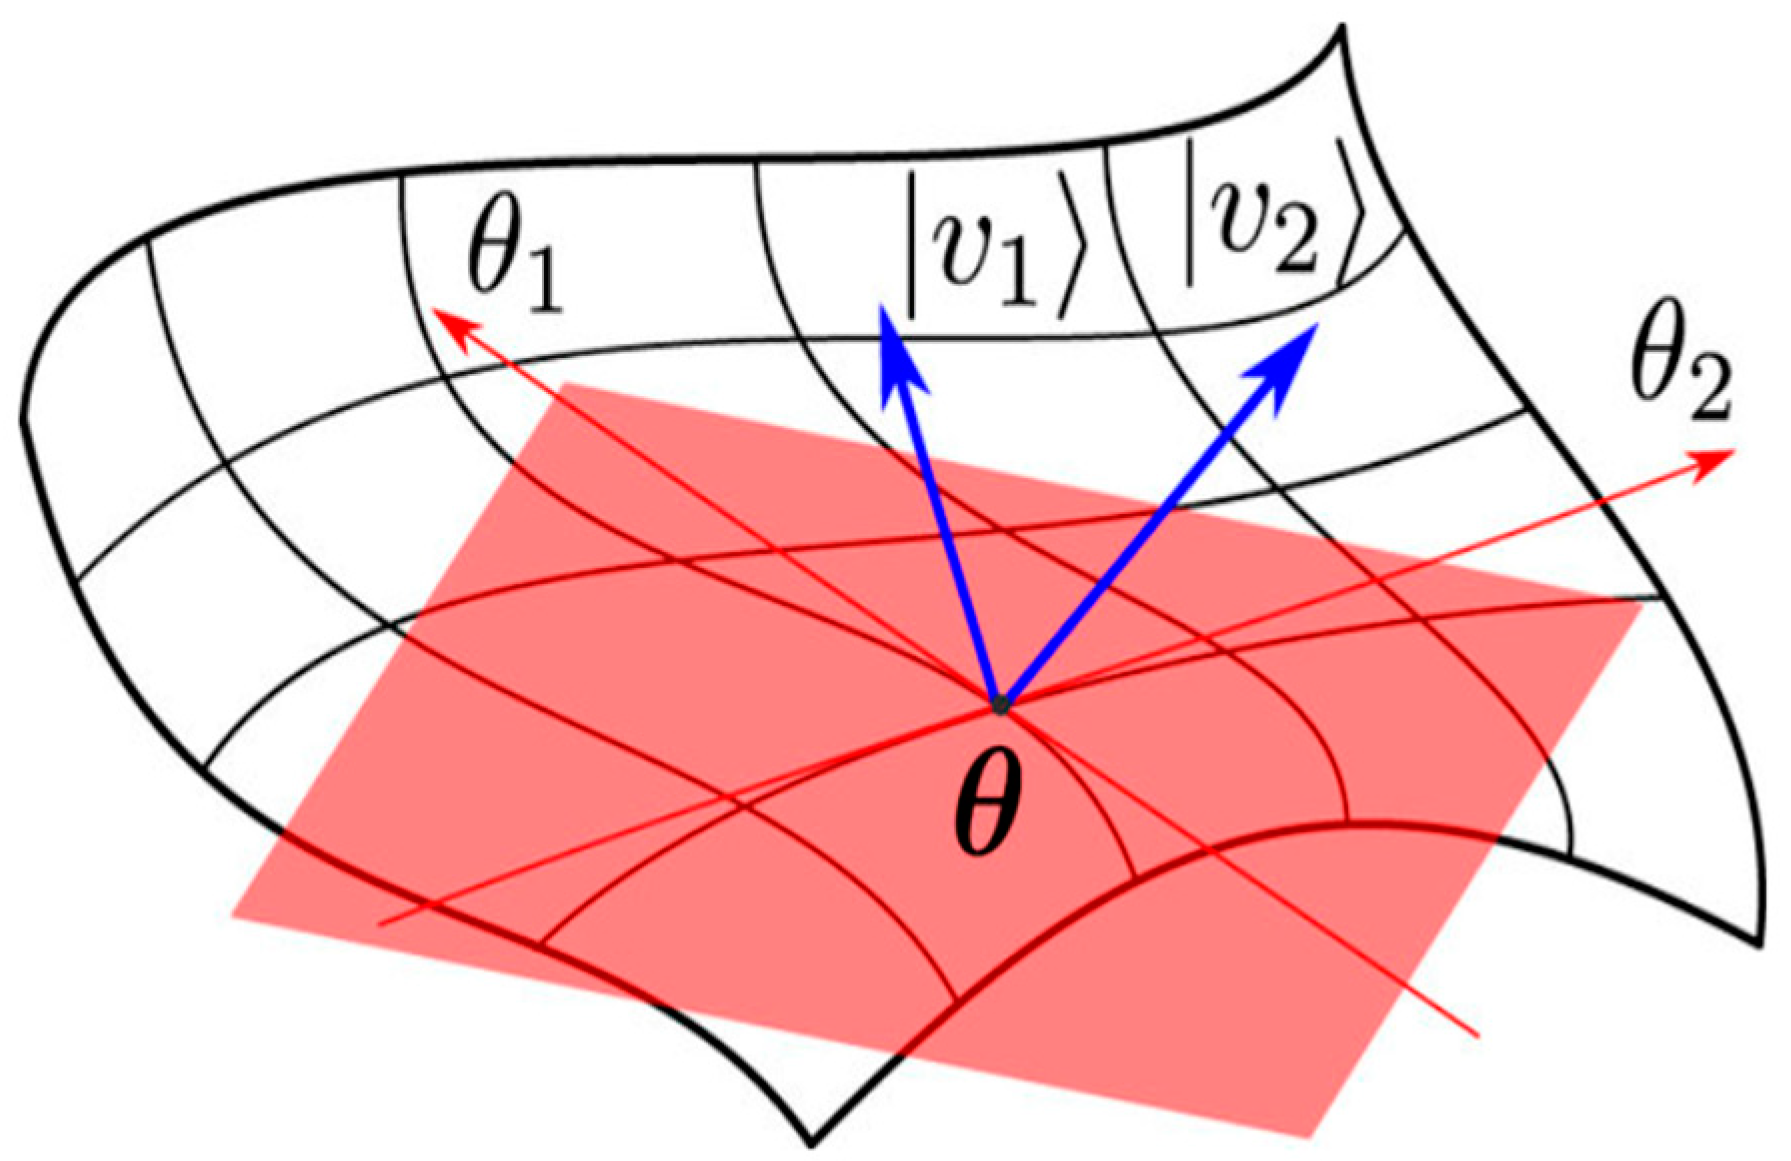
Figure 1, a statistical manifold
(
)[2],
, is defined. If a state of interest that is a part of the parameter space
is given. Consequently, the probability
coined each point in
(
).
A smooth statistical manifold is described mathematically by the Fisher information metric (FIM) in the context of information geometry (IG). It uses points in a common probability space to express probability measurements. By quantifying the informative gap between measurements, FIM makes statistical data analysis and comparison possible.
Previous research [3-5] have examined the families of exponential distributions, which are mathematical models that represent the probability distribution of time between occurrences, as well as some variations of exponential distributions, from the information geometry (IG) point of view. This approach explores the geometric properties and relationships between these distributions, providing insights into their characteristics and behavior. The strong link between GD and SEOs was the actual kindle of motivation behind this study. More fundamentally, it was necessary to reveal how IG can analyze GD to geometrically visualize and capture the unexplored links between the GD parameters. Notably, the motivation behind a novel investigation into the reinterpretation of GD (presumably referring to Gradient Descent) from a revolutionary IG (Information Geometry) perspective. This was the potential derive to explore how IG can provide a new way of analyzing GD, potentially revealing unexplored connections between the parameters of GD. Also, the significant impact of GD on SEOs was another motivation to provide a panoramic short review on this significant impact.
The increasing demandfor high-speed and reliable internet-based services has led to a need for improved satellite communications(SatComs). Satellites can be used alone or integrated with terrestrial networks to meet this demand, and recent technical advances and applications in SatCom research have been highlighted. Communication testbeds have been developed to demonstrate advanced concepts in practice.
Applications of SatCom
5G Non-Terrestrial Network
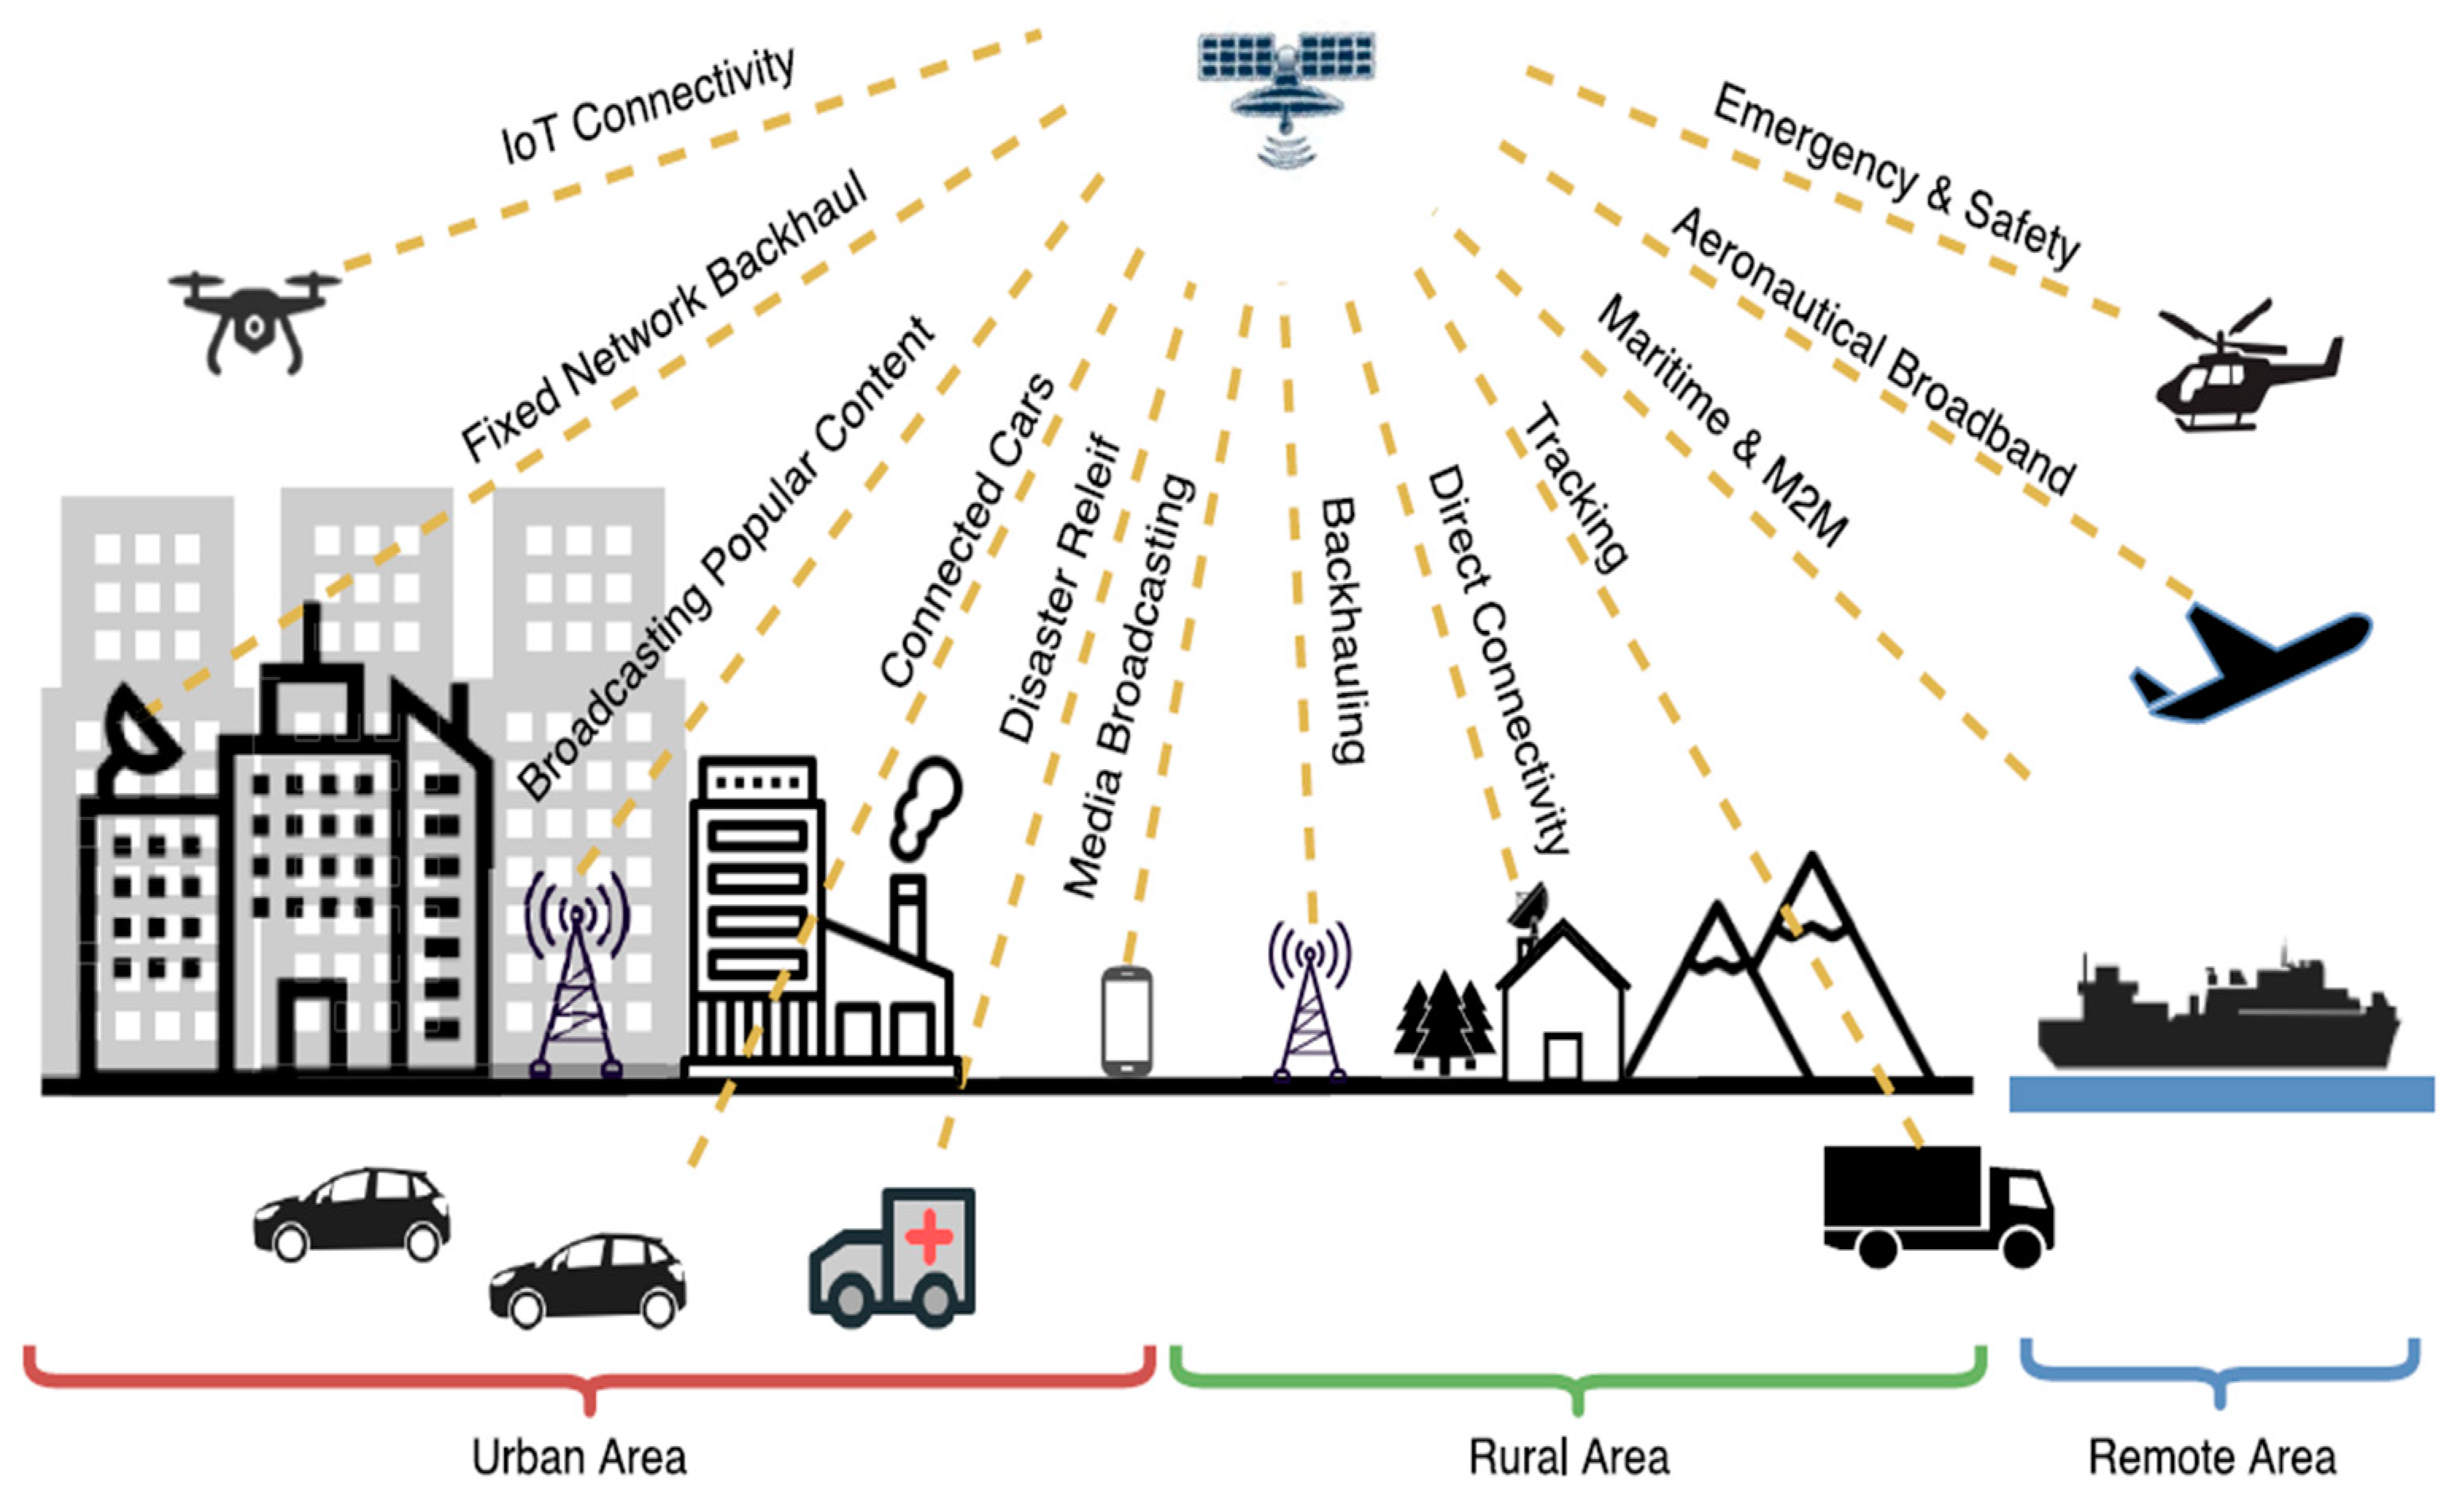
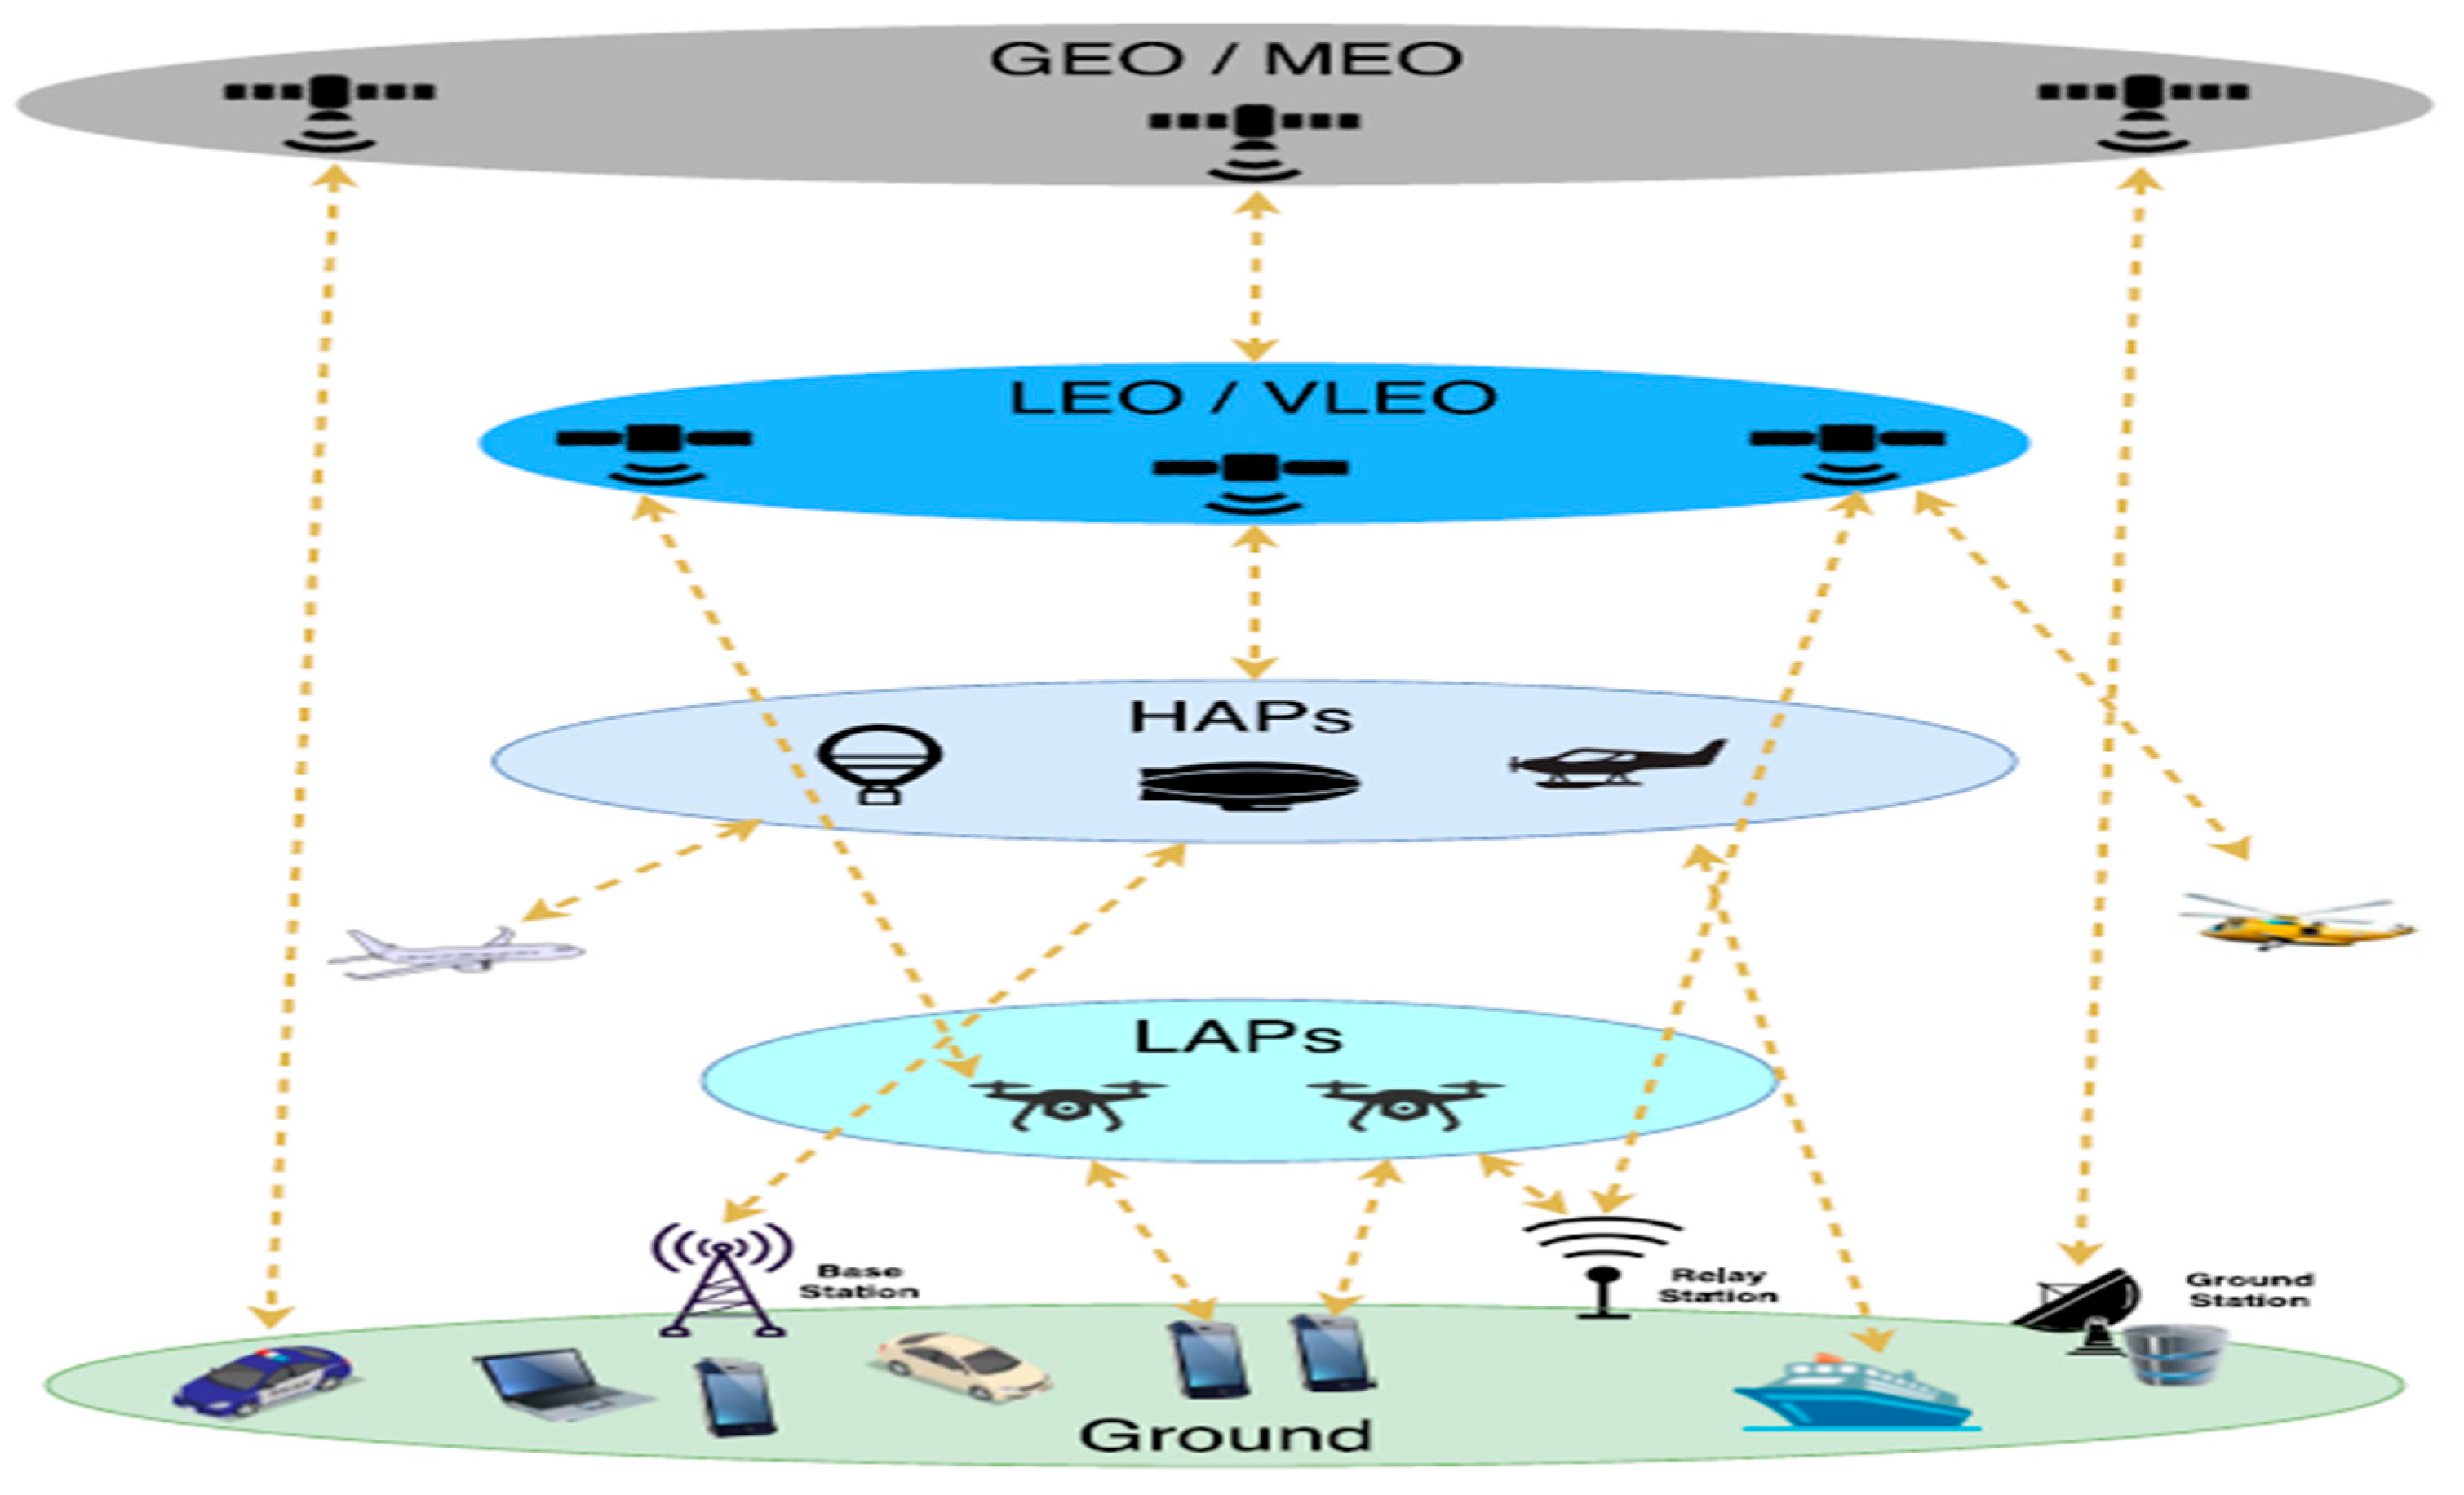
Figure 2 depicts a list of SatCom applications for each 5G service group (cf., [7]). Very Low Earth Orbit (VLEO) and SatCom-Assisted Aerial Networks, as well as VLEO satellites, High Altitude Platforms (HAPs), and Low Altitude Platforms (LAPs) are given prominence in
Figure 2 as their significance in the 5G ecosystem (see
Figure 3 [8]).
Aeronautical and Maritime Tracking and Communication
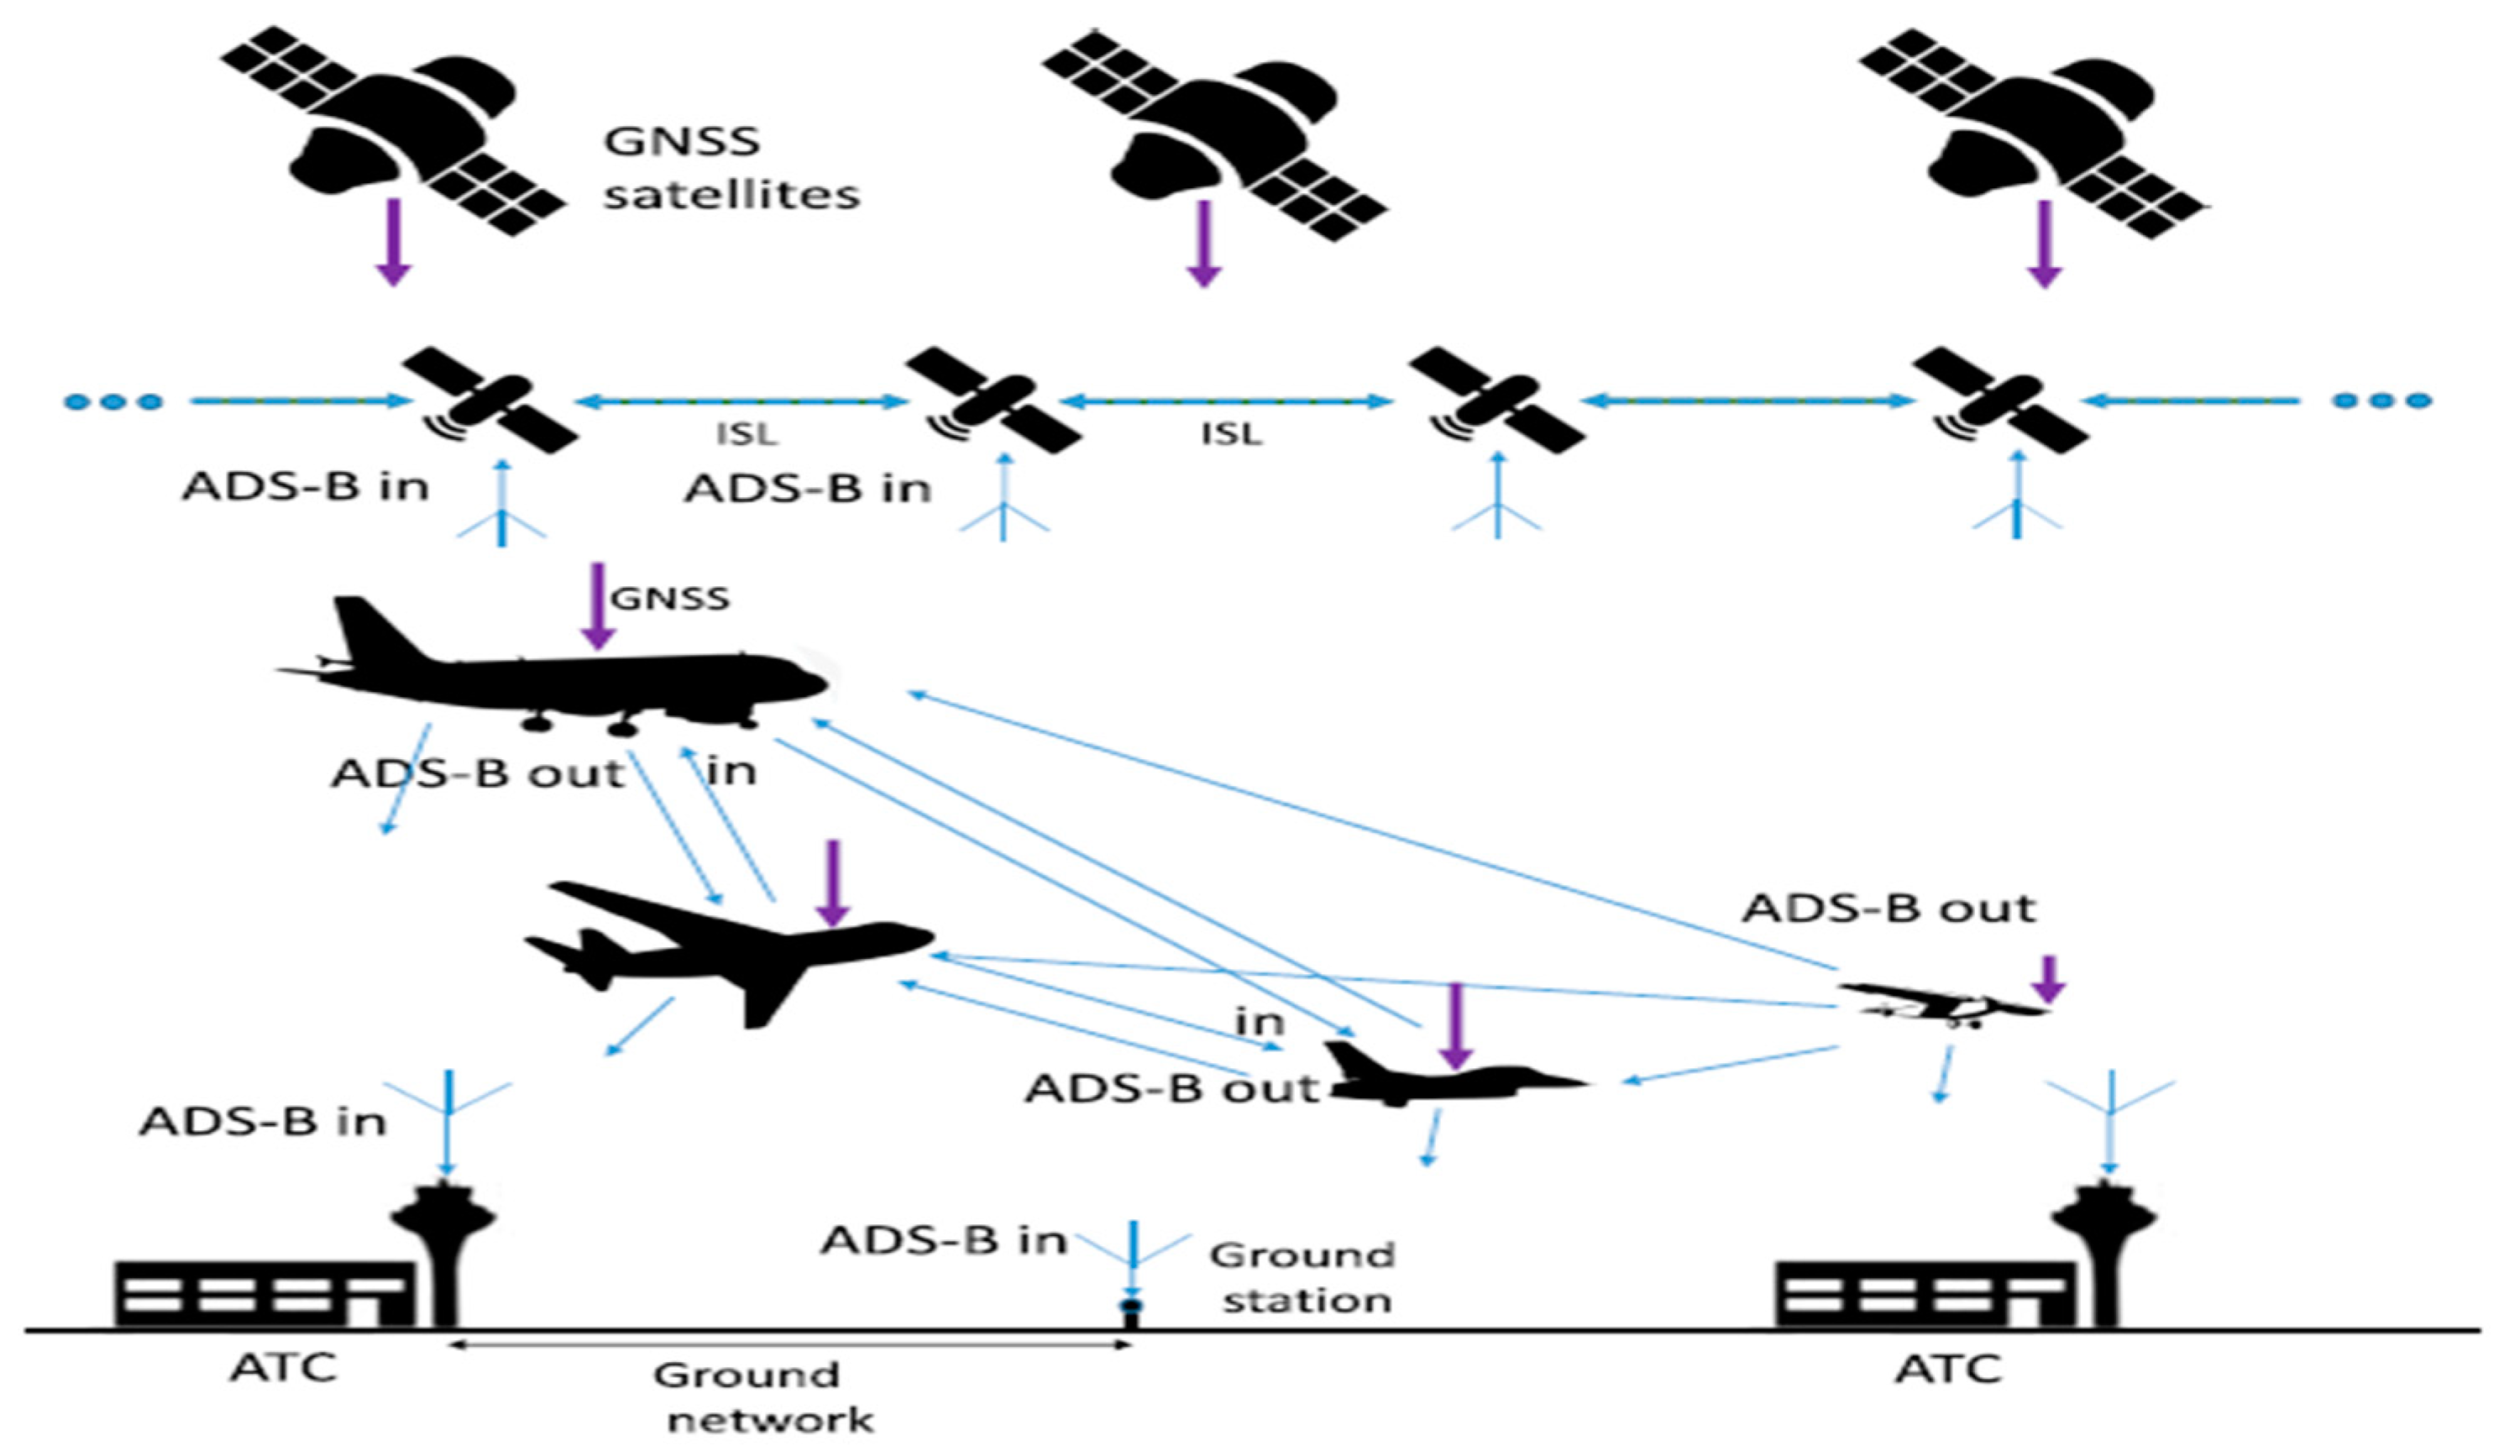
As depicted by
Figure 4(c.f., [6]), ADS-B (Automatic Dependent Surveillance-Broadcast) is a communication method enabling aircraft to use barometric altitude and data from the Global Navigation Satellite System (GNSS) to navigate to their destination. This allows for cooperative surveillance for situational awareness and separation as well as communication with an air traffic controller.
Earth Observation (EO) Data Collection
The governmental and international organizations use of EO is so common to record the climate, sea-life tracking, variations’ monitoring in plant life, and study natural disasters. EO provides objective data on trends and changes that would otherwise be invisible from the ground.
Space Communications
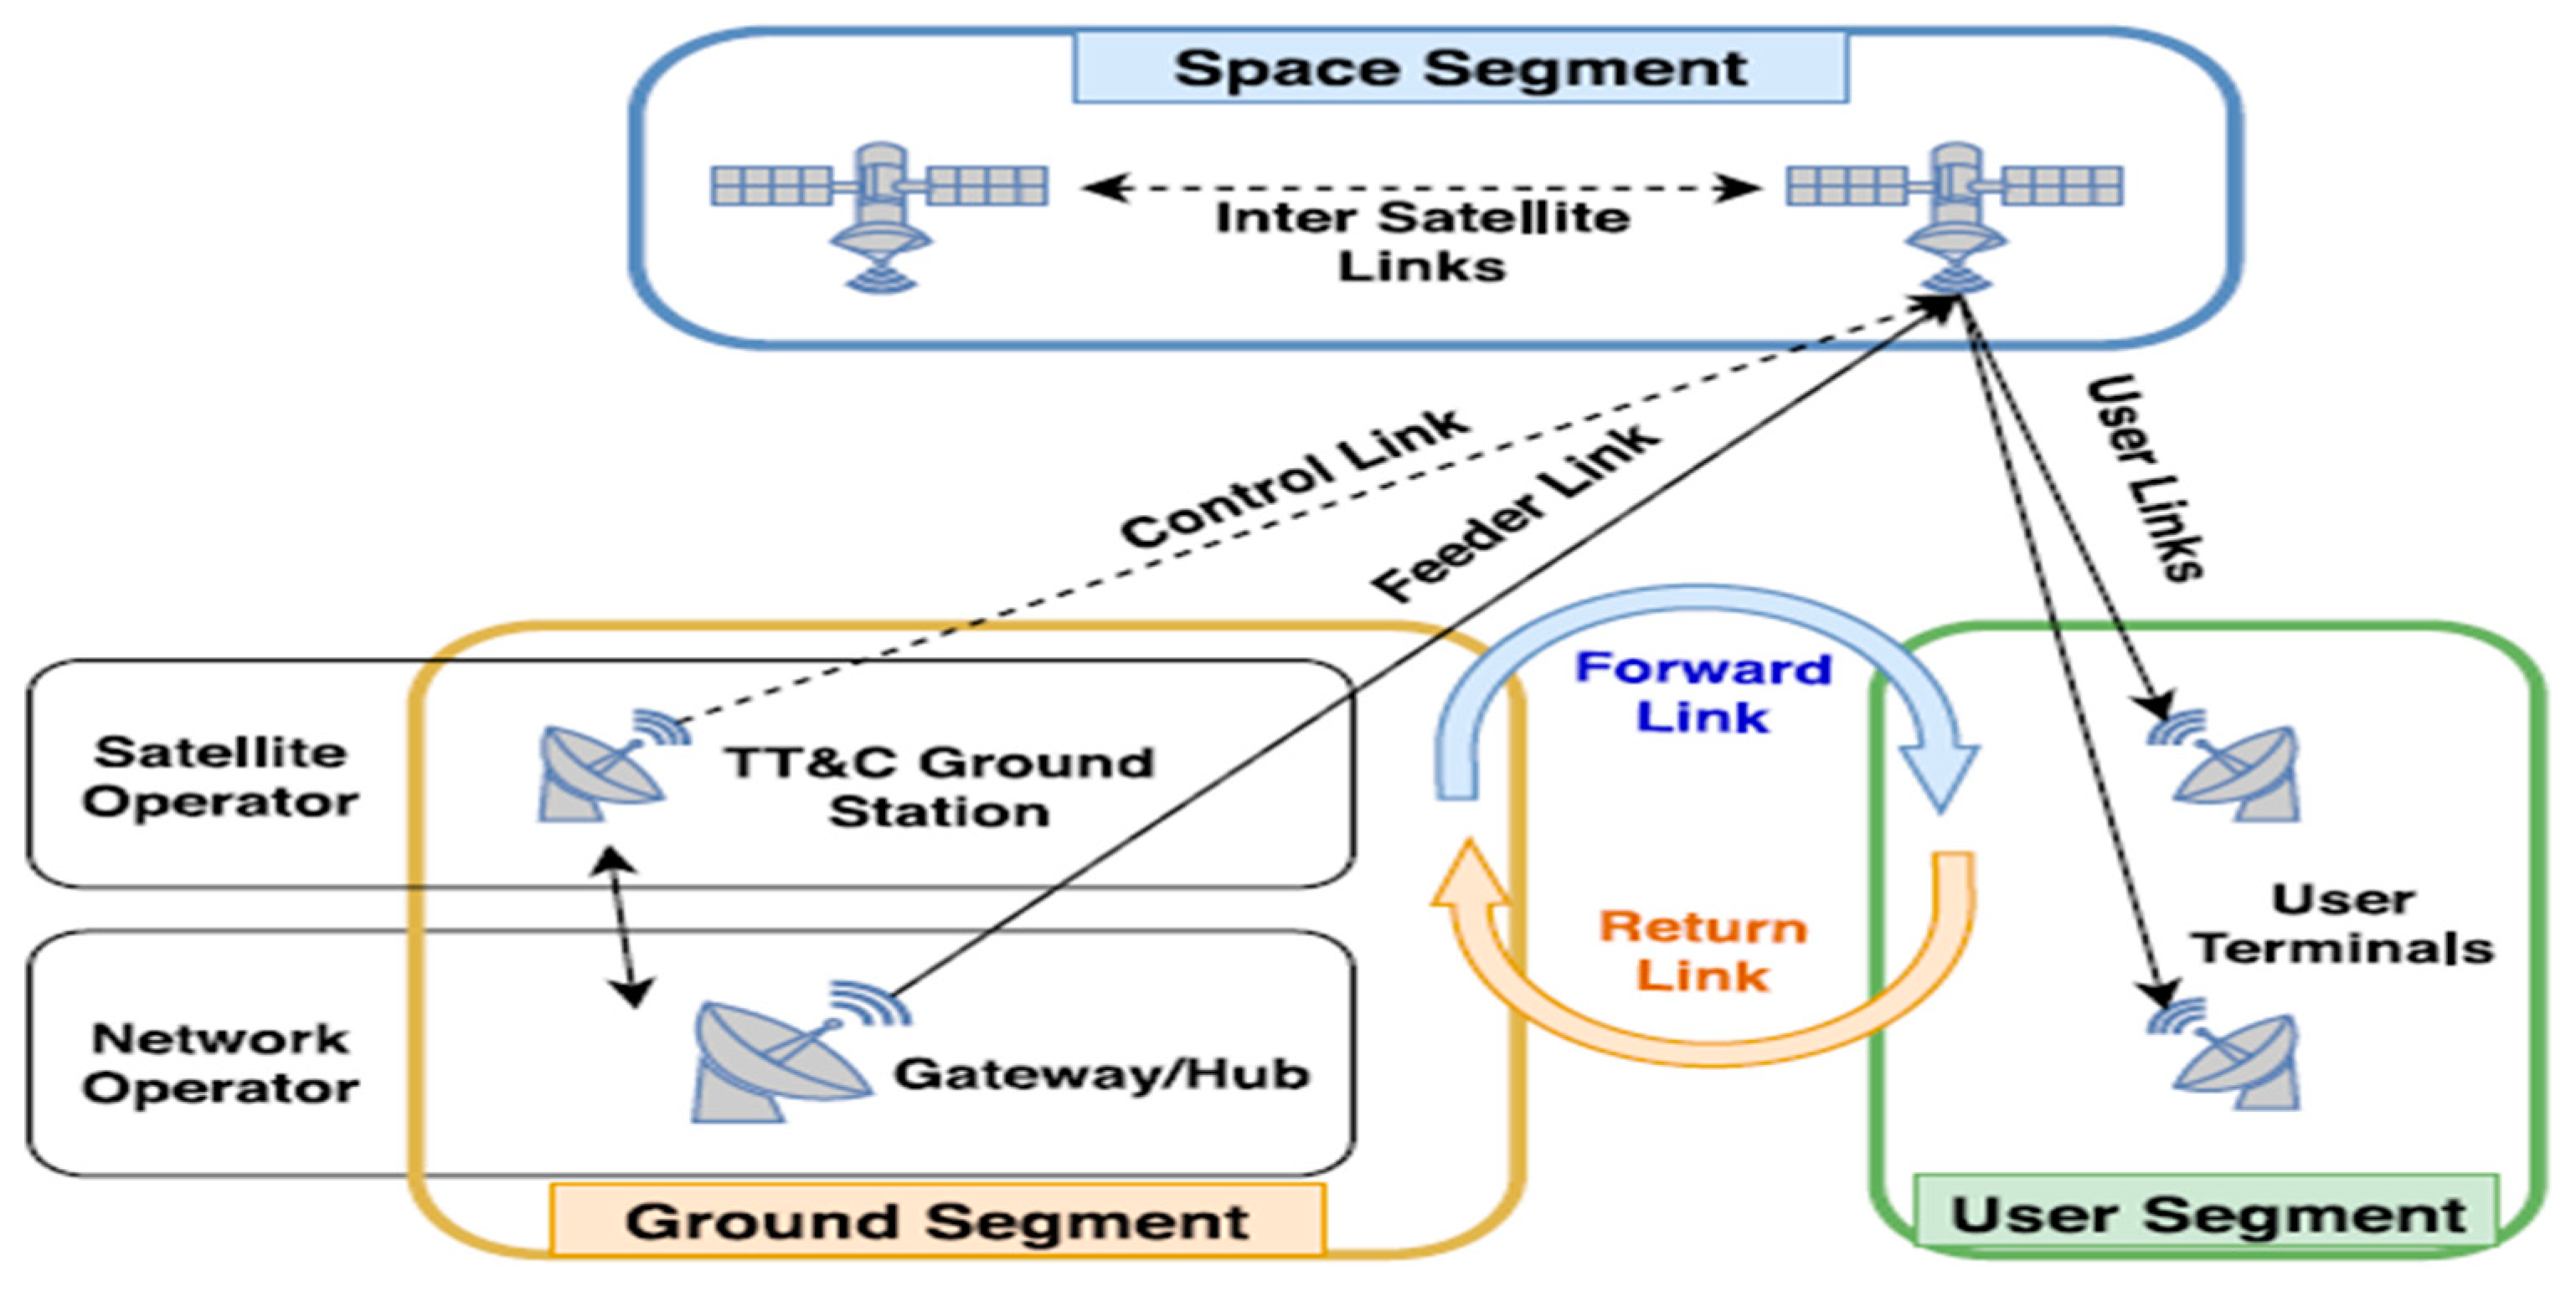
Telecommunications are critical for space exploration because efficient communication networks are required for accomplishments like the Apollo 11 Moon landing and downloading scientific data from space spacecraft. A satellite communication system’s basic structure includes a space segment, a ground segment, and a user segment, and there are challenges to overcome when using satellite swarms for data link communications due to synchronization requirements and the need for additional transceivers, as illustrated in
Figure 5(c.f., [6]).
The following is an outline of the remaining portions of this paper: The study’s methodology is described in the second section. The findings and discussion will be laid out in Section 3. The fourth section provides an overview of potential applications of Gamma Distribution (GD) to Search Engine Optimization (SEOs). Finally, Section five includes conclusions, highlights challenging open problems identified in the study, and offers recommendations for future research.
Methodology
This section provides the main IG definitions, that will be used to obtain the main results. The undertaken methodology is using this setting of defined concepts to carry out the info-geometric analysis and obtain the results. Once done, an interpretation of these novel results will be given.
Main IG definitions
1.We call a statistical manifold if is a random variable in sample space and a pdf under some requirements, with to serve as the manifold’s coordinates.
2. reads as
serves as a manifold of n-dimensional distribution with coordinate system .
Definition 2
[10]. Having defined the function is the part of which only contains
Definition 3
[11]. FIM, namely []) is written in terms of (c.f., equation (1))as
Definition 4
[10]. Having FIM, we define its [] by
Definition 5.
-Connection
For each the (or )-connection (c.f.,[11]) has components:
where
is the potential function.
Definition 6. The manifold M, GEs are defined by (c.f., [10])
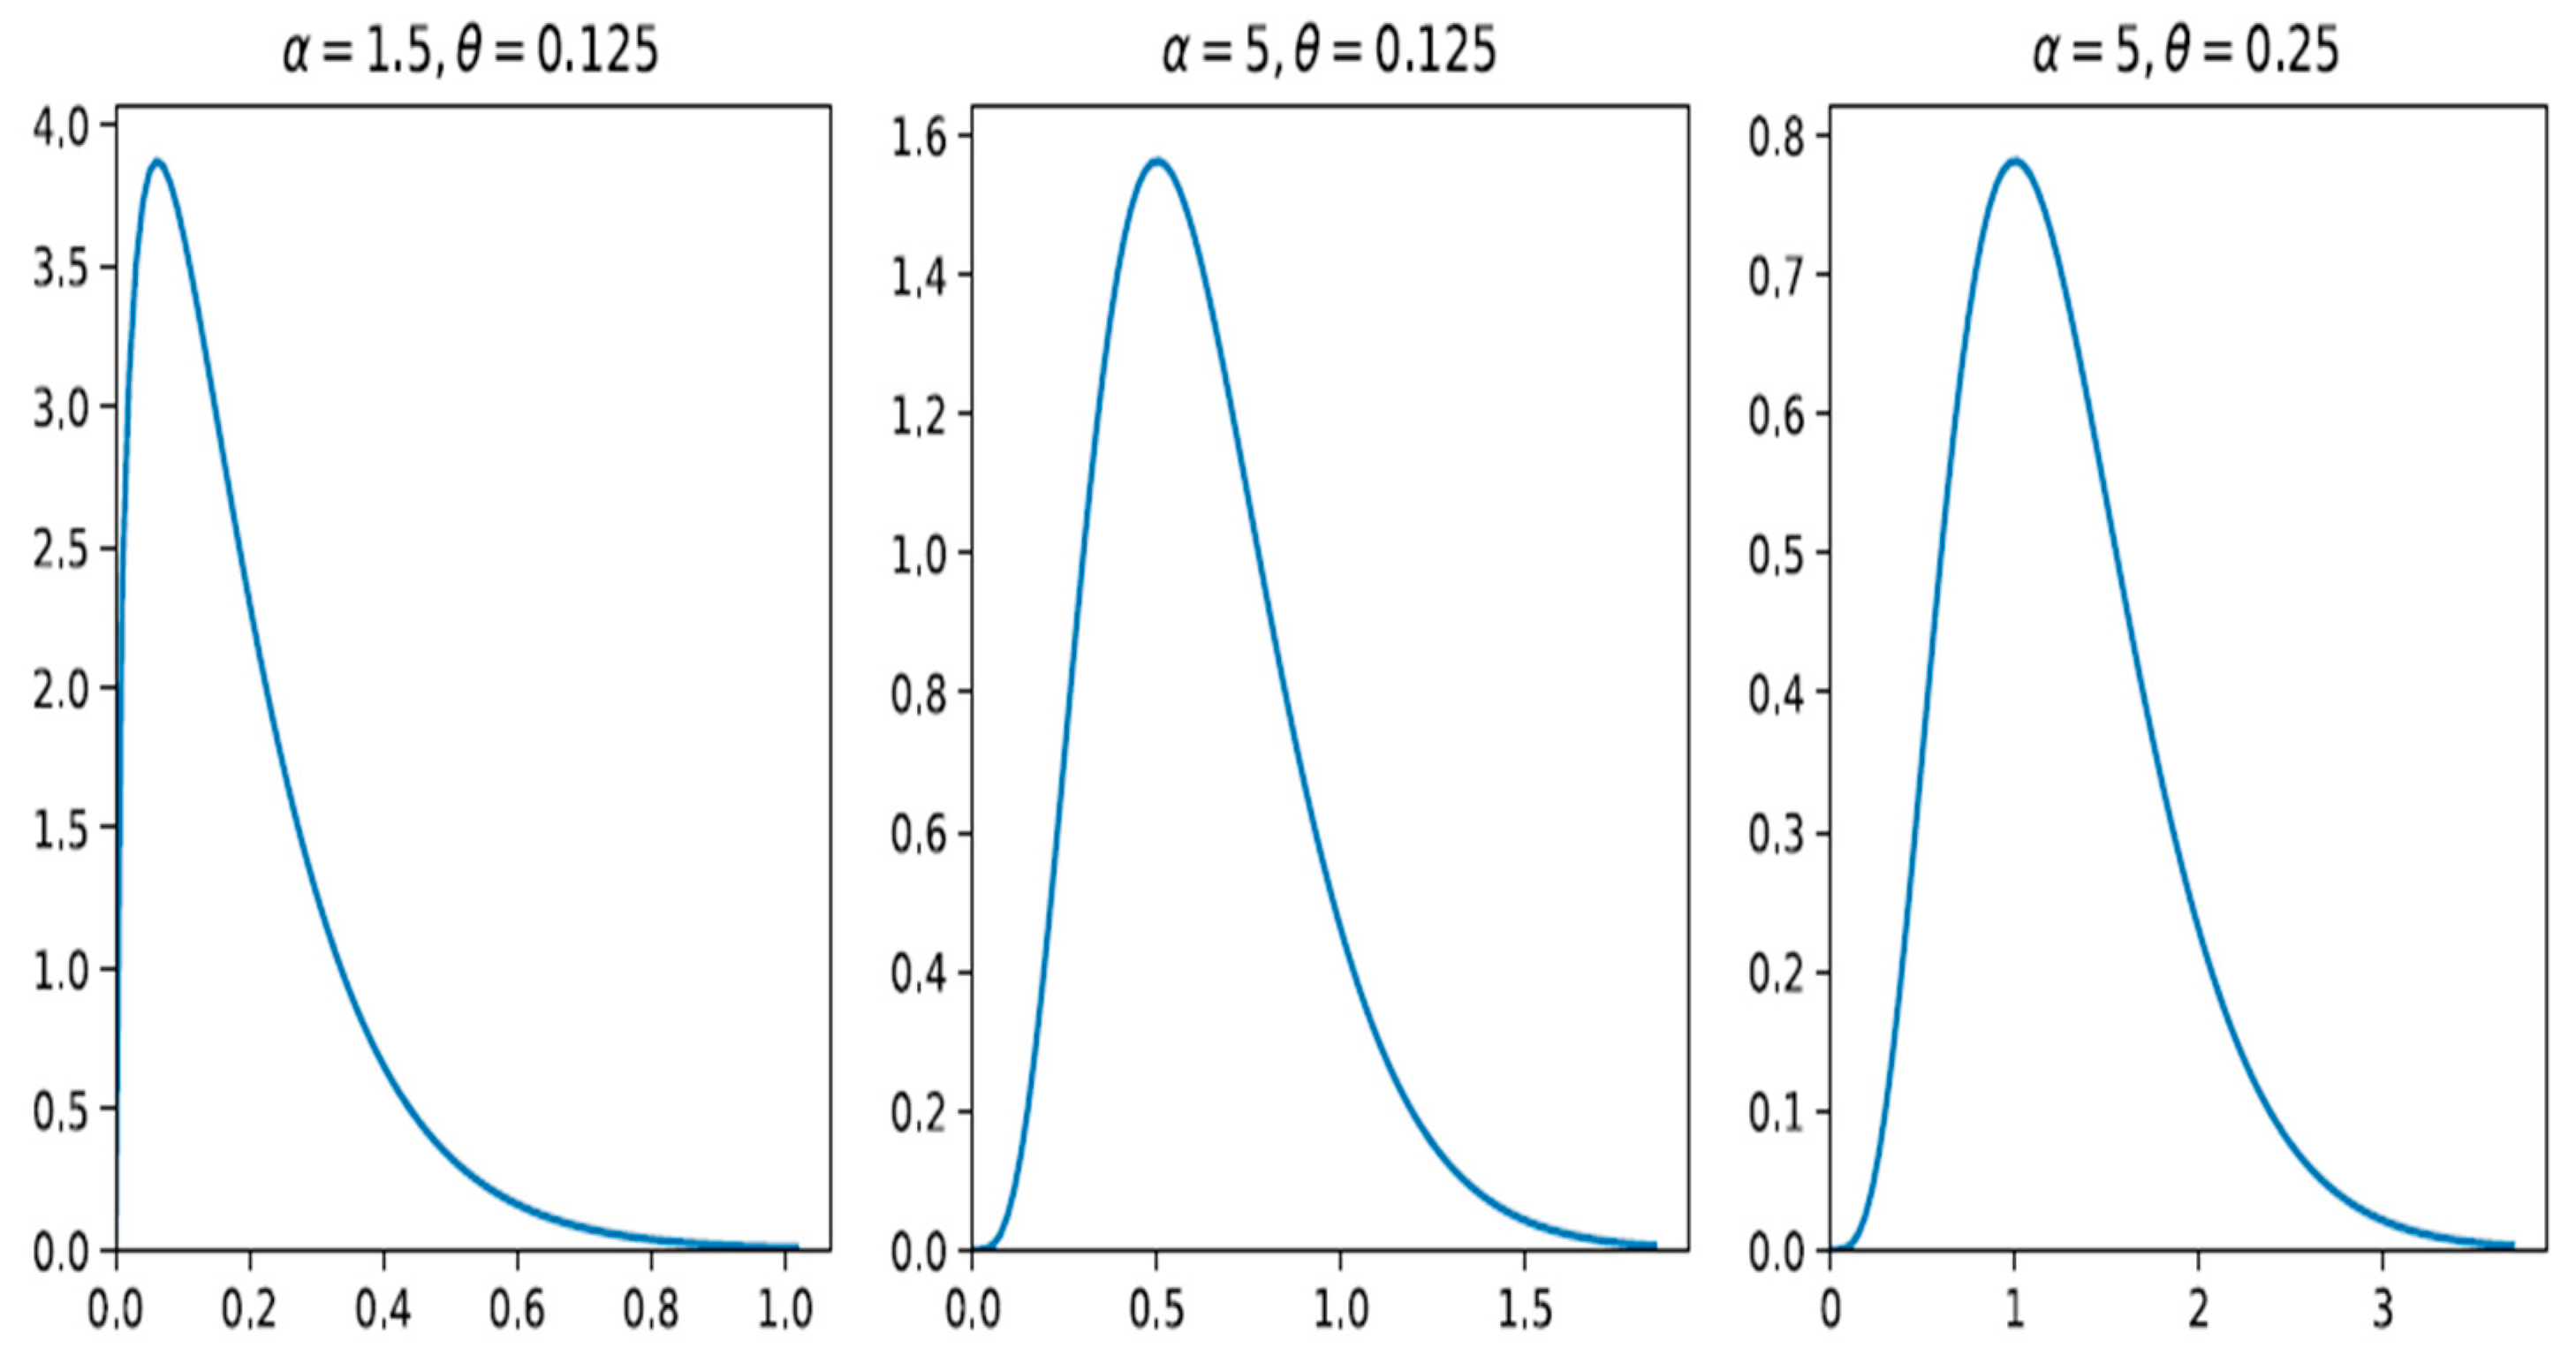
The probability density for Gamma distribution (GD) (as seen in
Figure 6) is determined by [12]:
with
is the Gamma function,
is the shape parameter, and
is the reciprocal of the scale parameter, such that
and
are positive real numbers.
Figure 6.
How GD’s shape is impacted by and (c.f., [12]).
Figure 6.
How GD’s shape is impacted by and (c.f., [12]).
The digamma function, reads as:
Fore , it holds that:
The Trigamma function, denoted or and
satisfies the recurrence relation:
Results and discussion
Theorem 1 The GDM satisfies:
(i)FIM is given by:
(ii) FIM inverse matrix is
with a, b and c (c.f., Equ.(13)–(16)). The determinant of
is given by
Such that
is a positive real number and
(i)We have (c.f., (4)). Thus,
The potential function
is determined by
Therefore, the FIM is given by
(17)), which proves (i).
(ii) We have,
or. Hence,
Theorem 2 GEs of the GDM parameters take the form:
with
It can be verified that
Moreover,
By engaging the derivations (c.f., Eqns (31)-(37)), the proof follows.
Mathematical justification for the existence of [] (c.f., [17])
Theorem 3
[] (c. f., [17]) exists for all positive integer values for .
Engaging mathematical analysis, [] (c.f., [17]) exists if and only if (c.f., (18)) is non-zero, such that satisfy((13)-(15)).
Assuming that , then by equation (27),
By the definition, , which supports that holds integer values, and since is defined to be positive. We are done for
More potentially, assuming the converse statement, i.e.,
Hence,
Solving (39) for we have
From the definition of we must choose
We are going to check (41) for
For
For
By (42) and (43), we are done for the initial proof.
The following section will be devoted to the investigation of some potential applications of GD to SEOs.
Impact of GD on SEOs
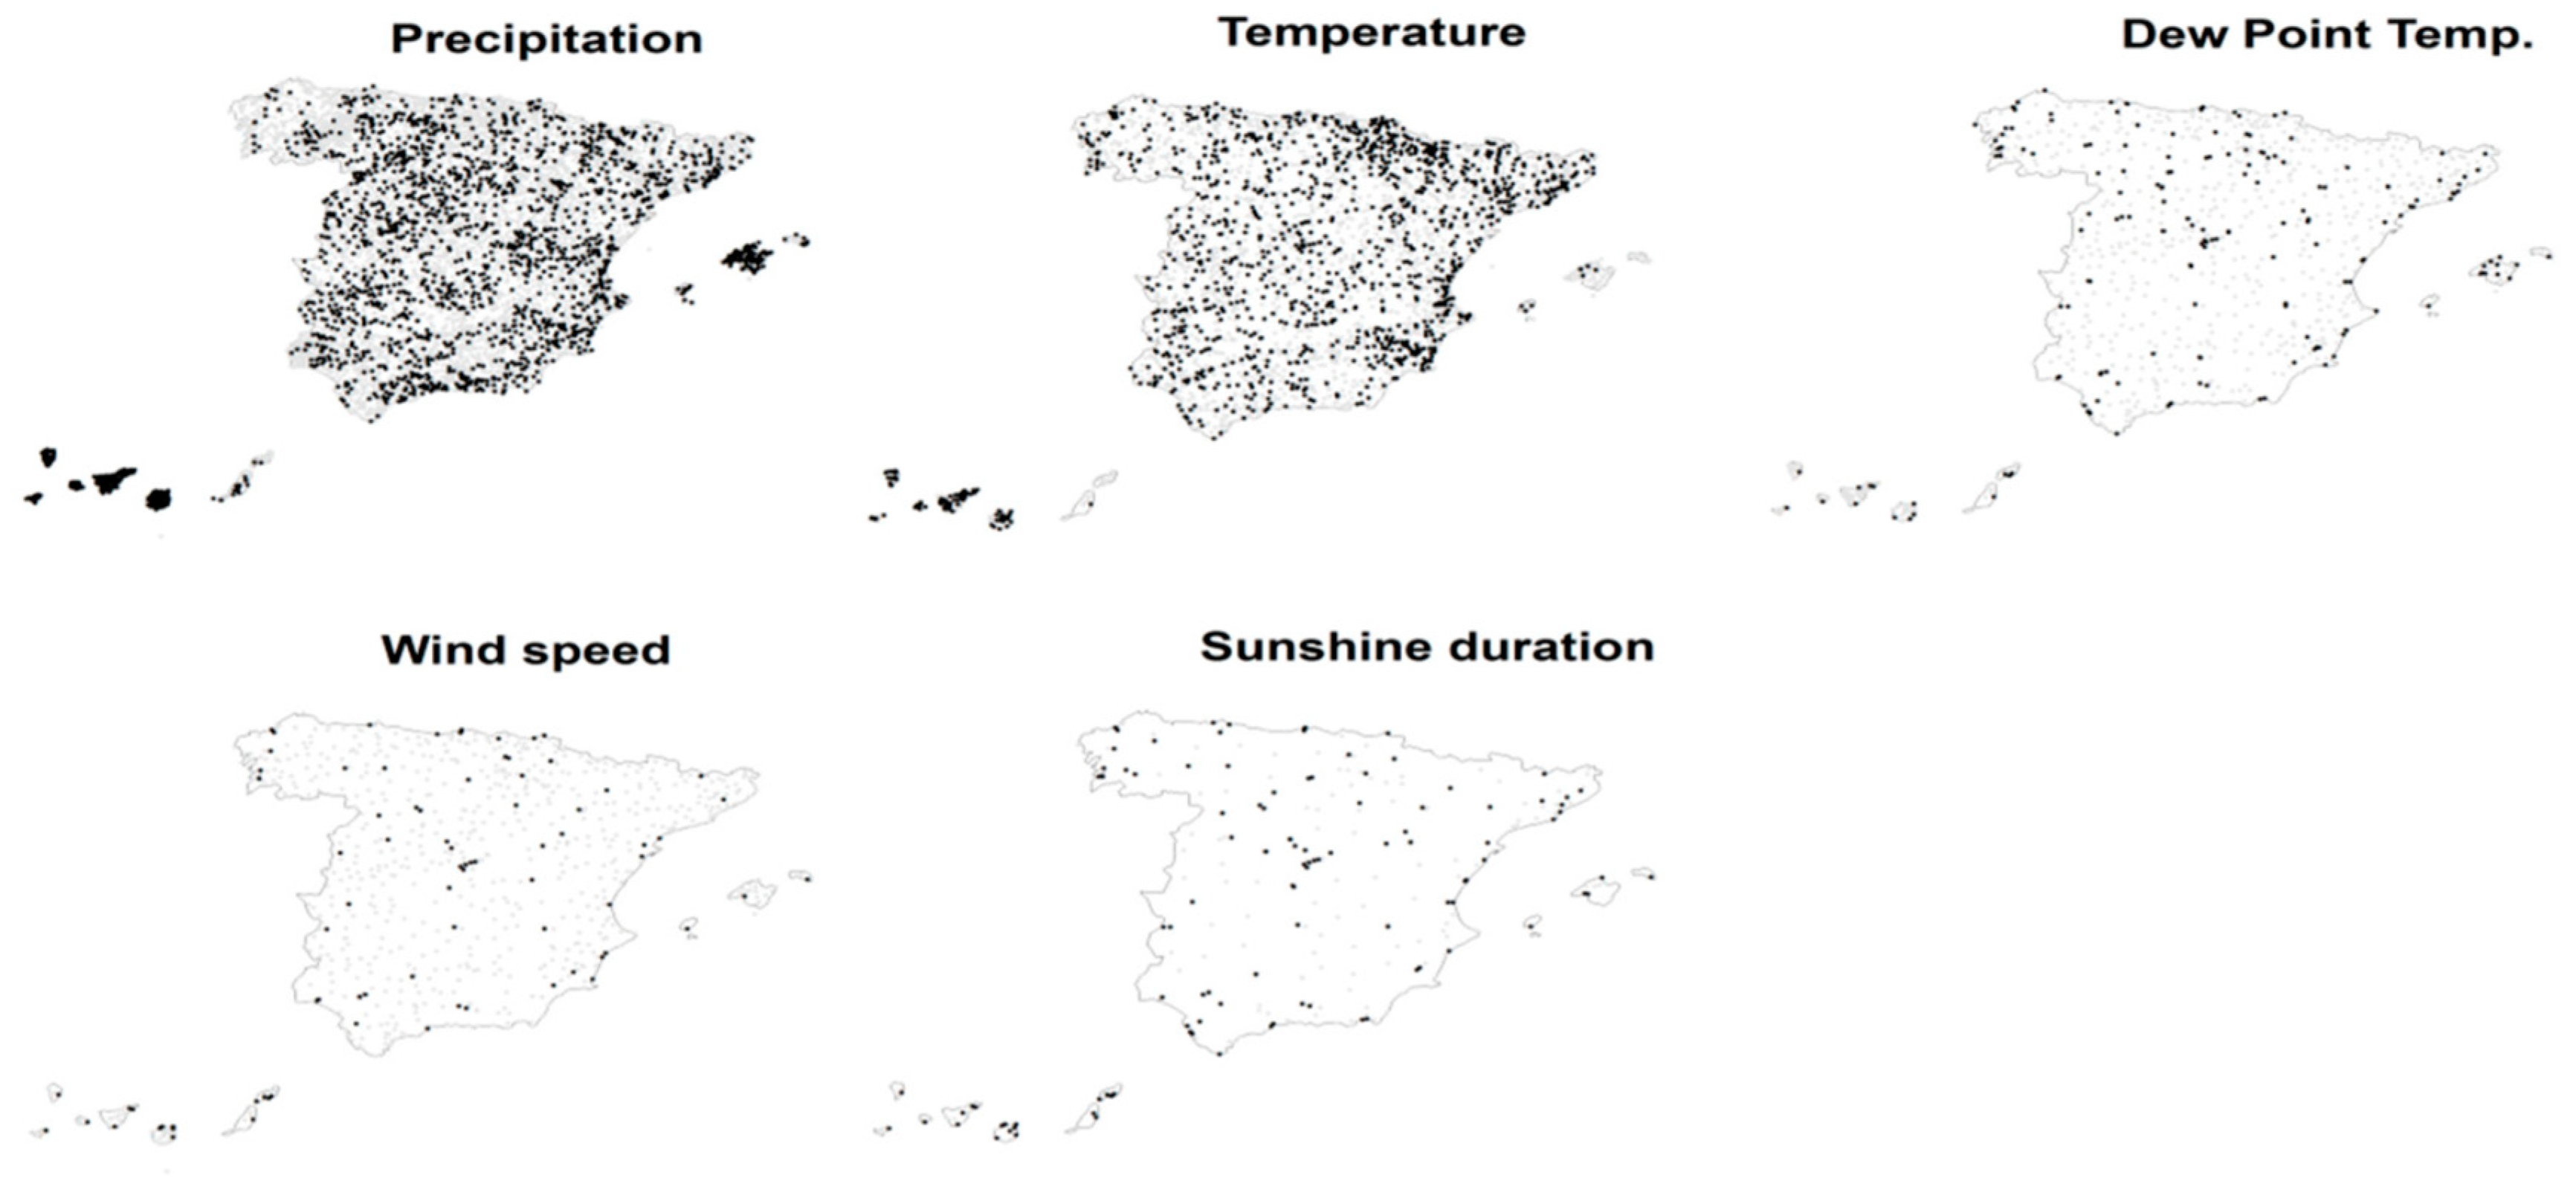
The authors used a gap-filling process to reconstruct fragmented weekly data series for climate variables. To fill missing data in the climate series, a bias correction process was used to match the statistical distribution of the candidate series to be filled with the objective series.
Figure 7 (c.f., [15]) shows the data series used for calculating climate variables, such as precipitation, temperature, dew point temperature, sunshine duration, and wind speed, had good spatial coverage and distribution. The authors obtained data on soil water field capacity, which is essential for calculating drought indices, from the European Soil Database & soil properties.
used synthetic aperture radar (SAR) imagery to suggest a novel technique for identifying flood water. Compared to traditional global-thresholding approaches, the method’s local thresholding approach is more accurate at delineating water features in images because it takes into consideration the complexity and variety of various land surface types. The suggested technique for detecting floods is quick, completely automated, and successful.
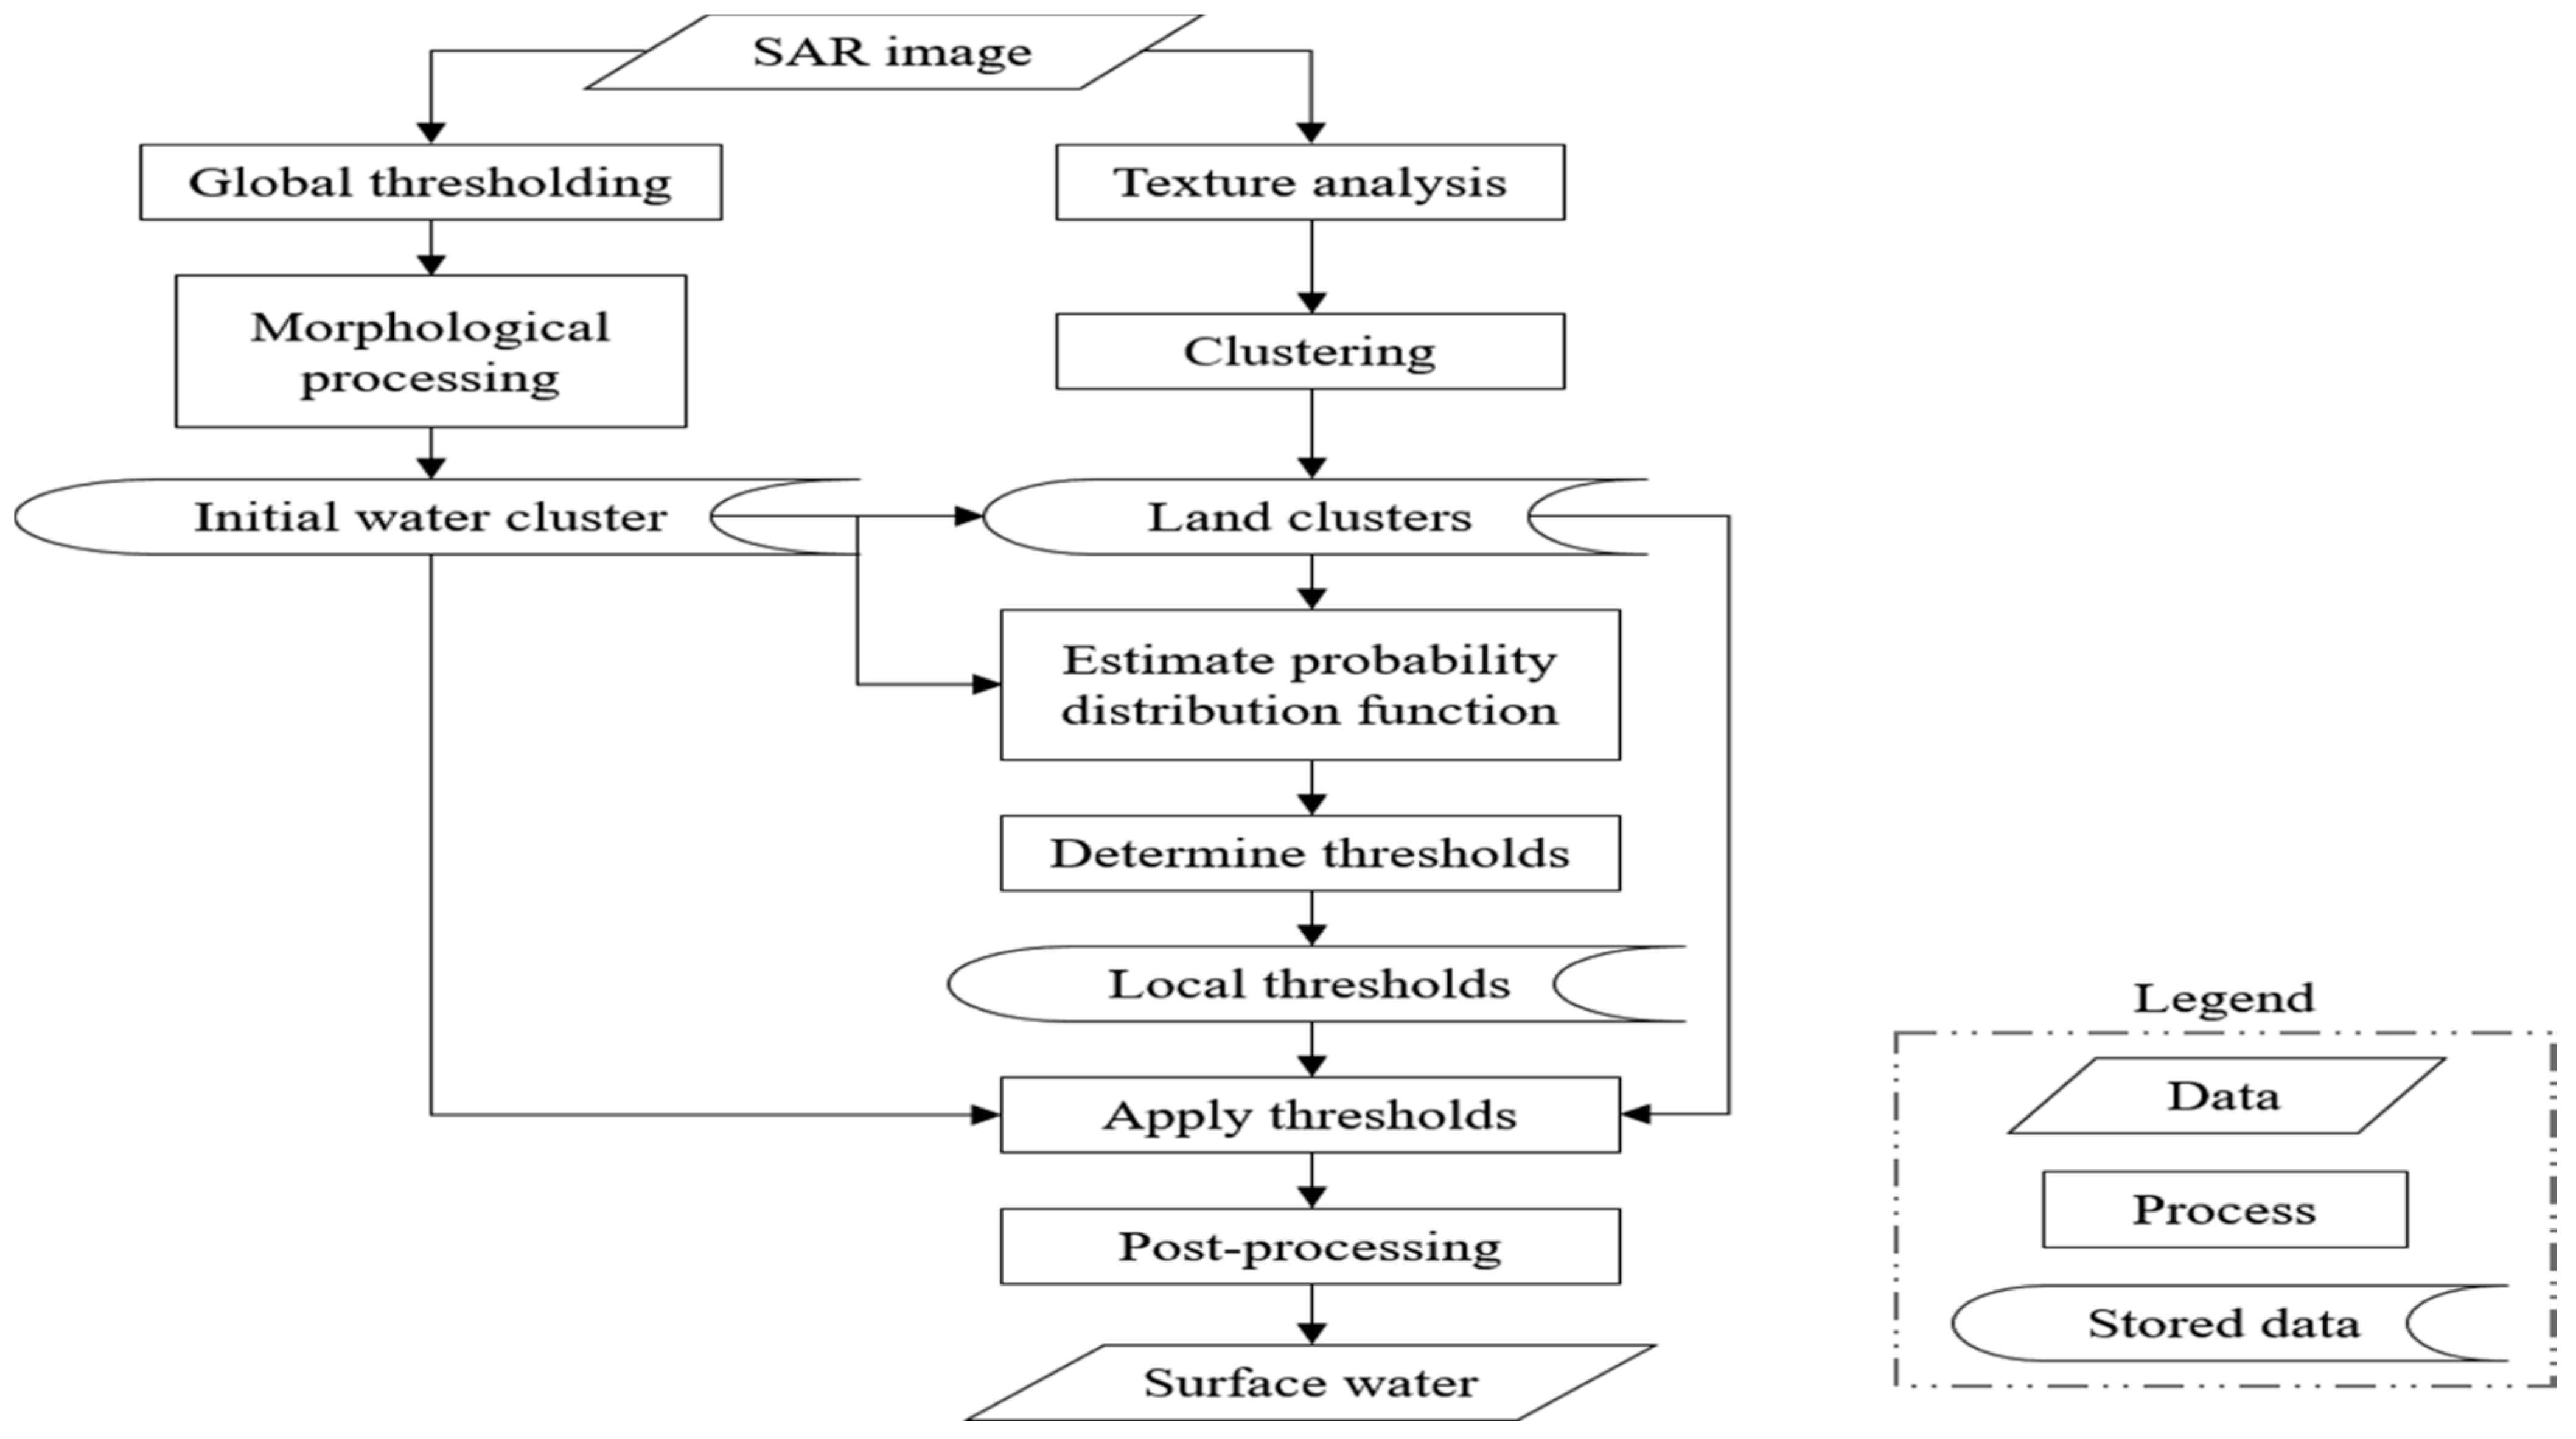
Sentinel-1 SAR images were used to suggest a new local thresholding technique for flood water delineation [16]. The process entails estimating local thresholds for each subset of land cluster paired with water cluster by fitting GDs to the backscatter intensities of the combined water/land pixels in each subset. The proposed method for identifying water from non-water is faster, fully automated, and more accurate than traditional global-thresholding methods.
The suggested local thresholding algorithm for identifying water extents in remote sensing images is depicted in
Figure 8. The method identifies a local threshold as the intersection of the bi-modal distributions, clusters non-water pixels into land clusters based on picture attributes, and estimates the SAR backscatter distribution at each polarization as a combination of two GDs. After combining the local water extents to create the global inundation extent, isolated water and land pixels are removed using basic hydrologic restrictions.
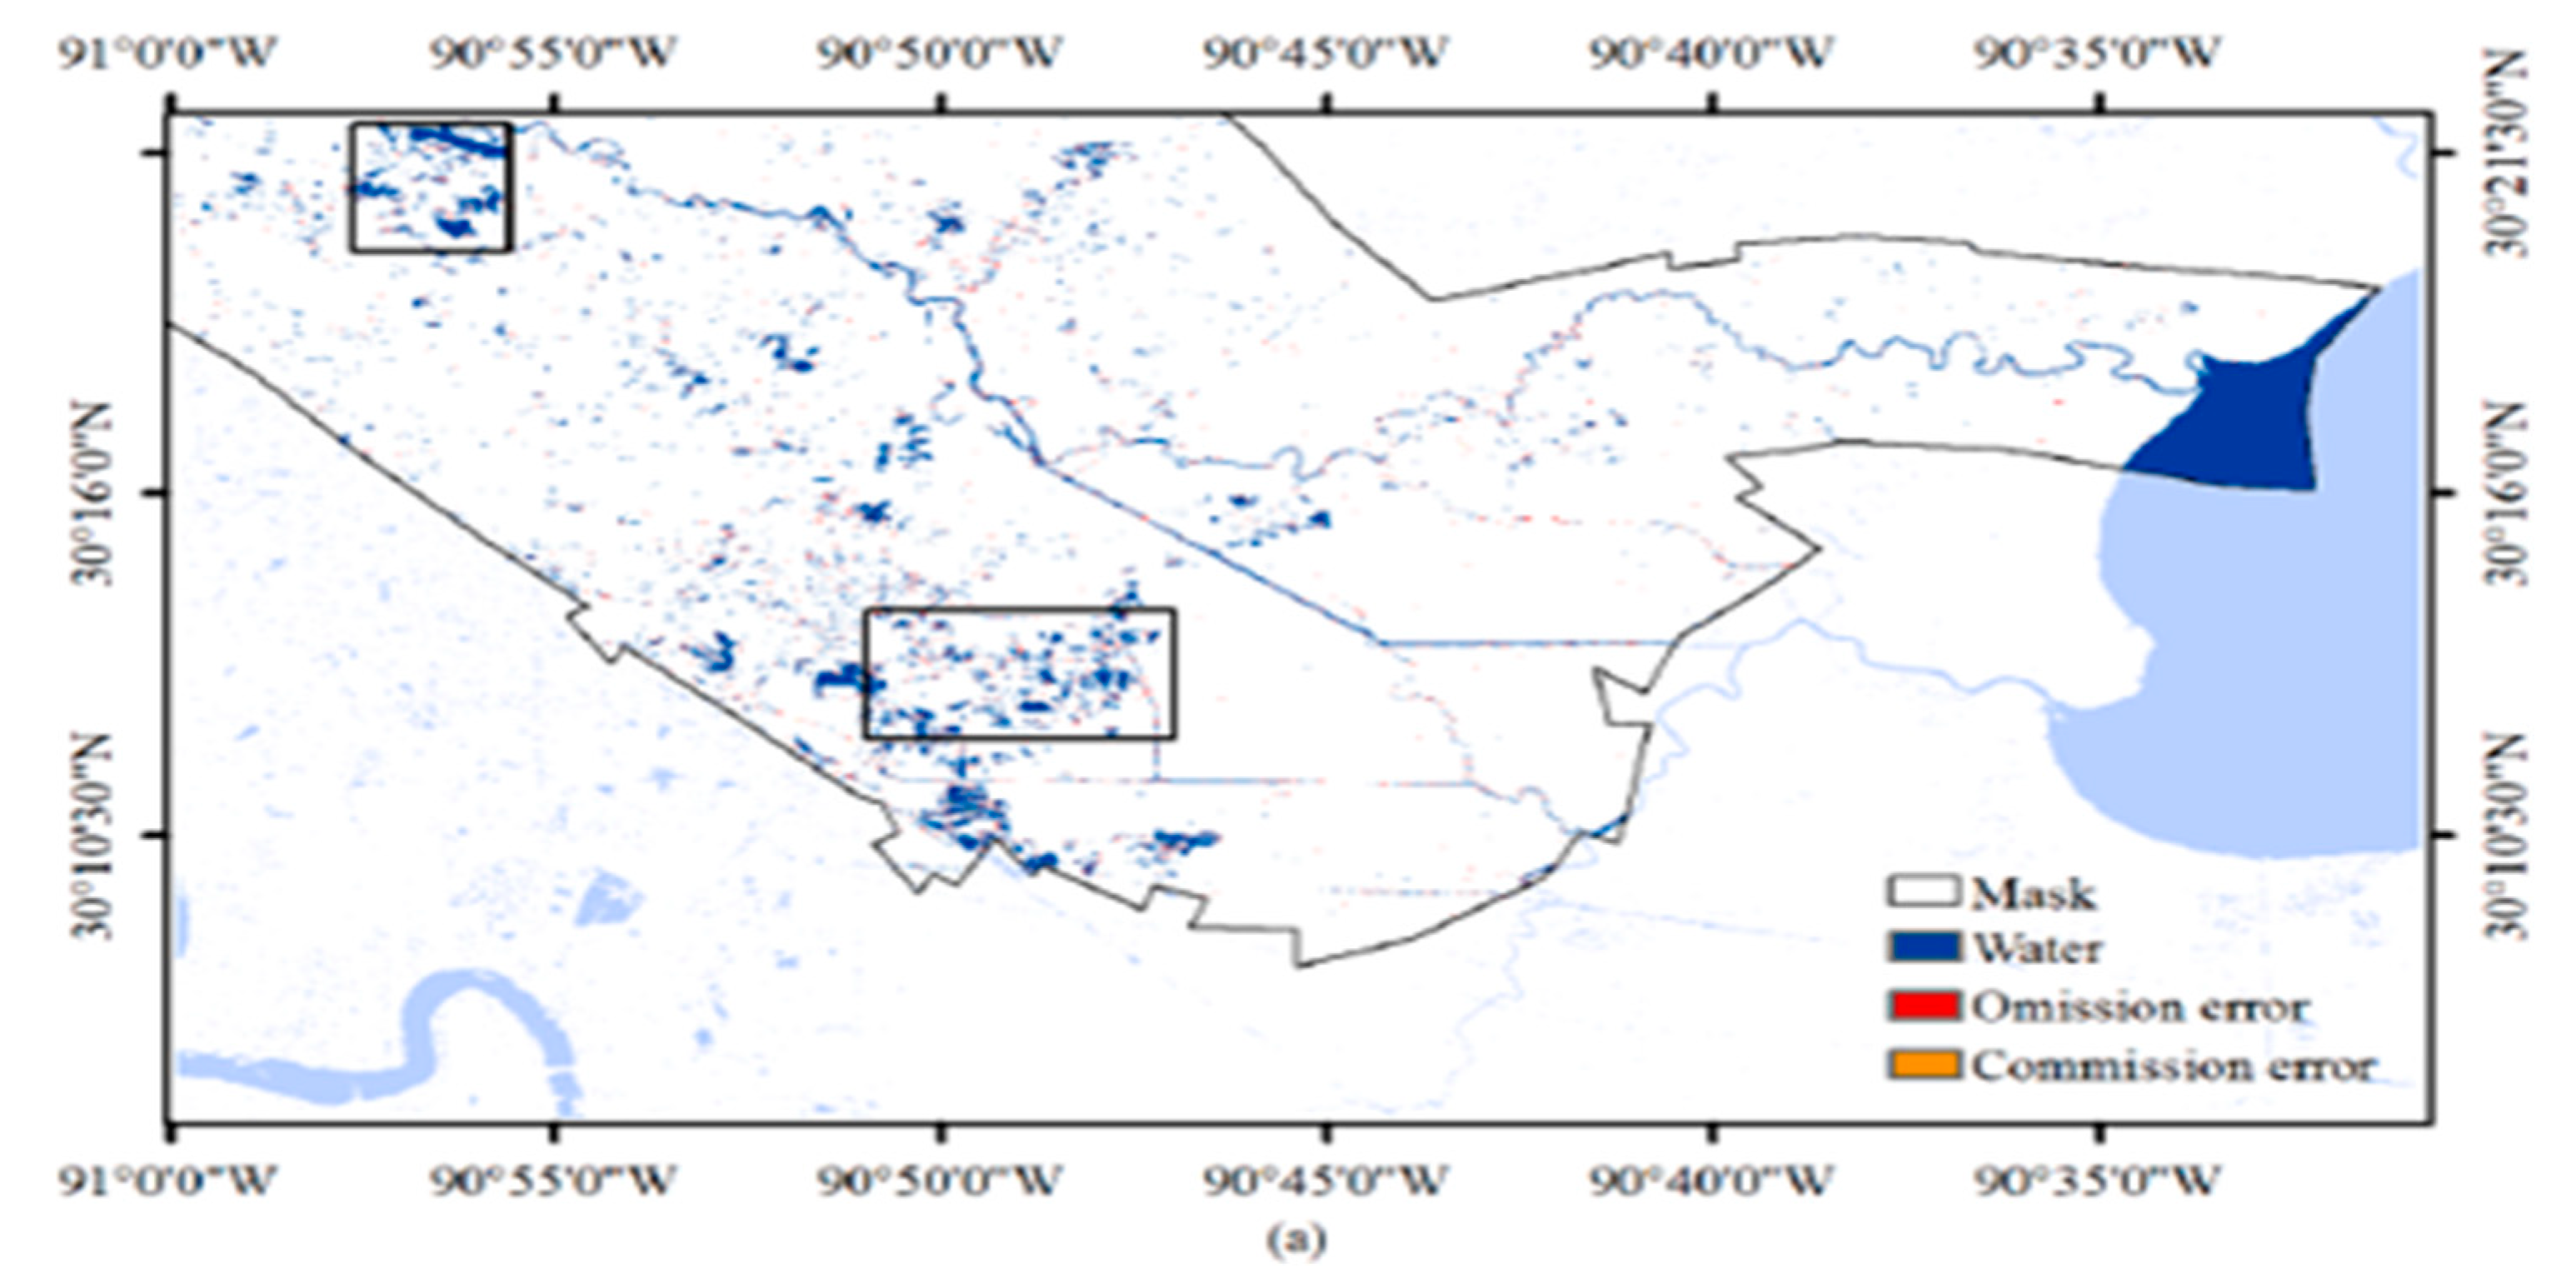
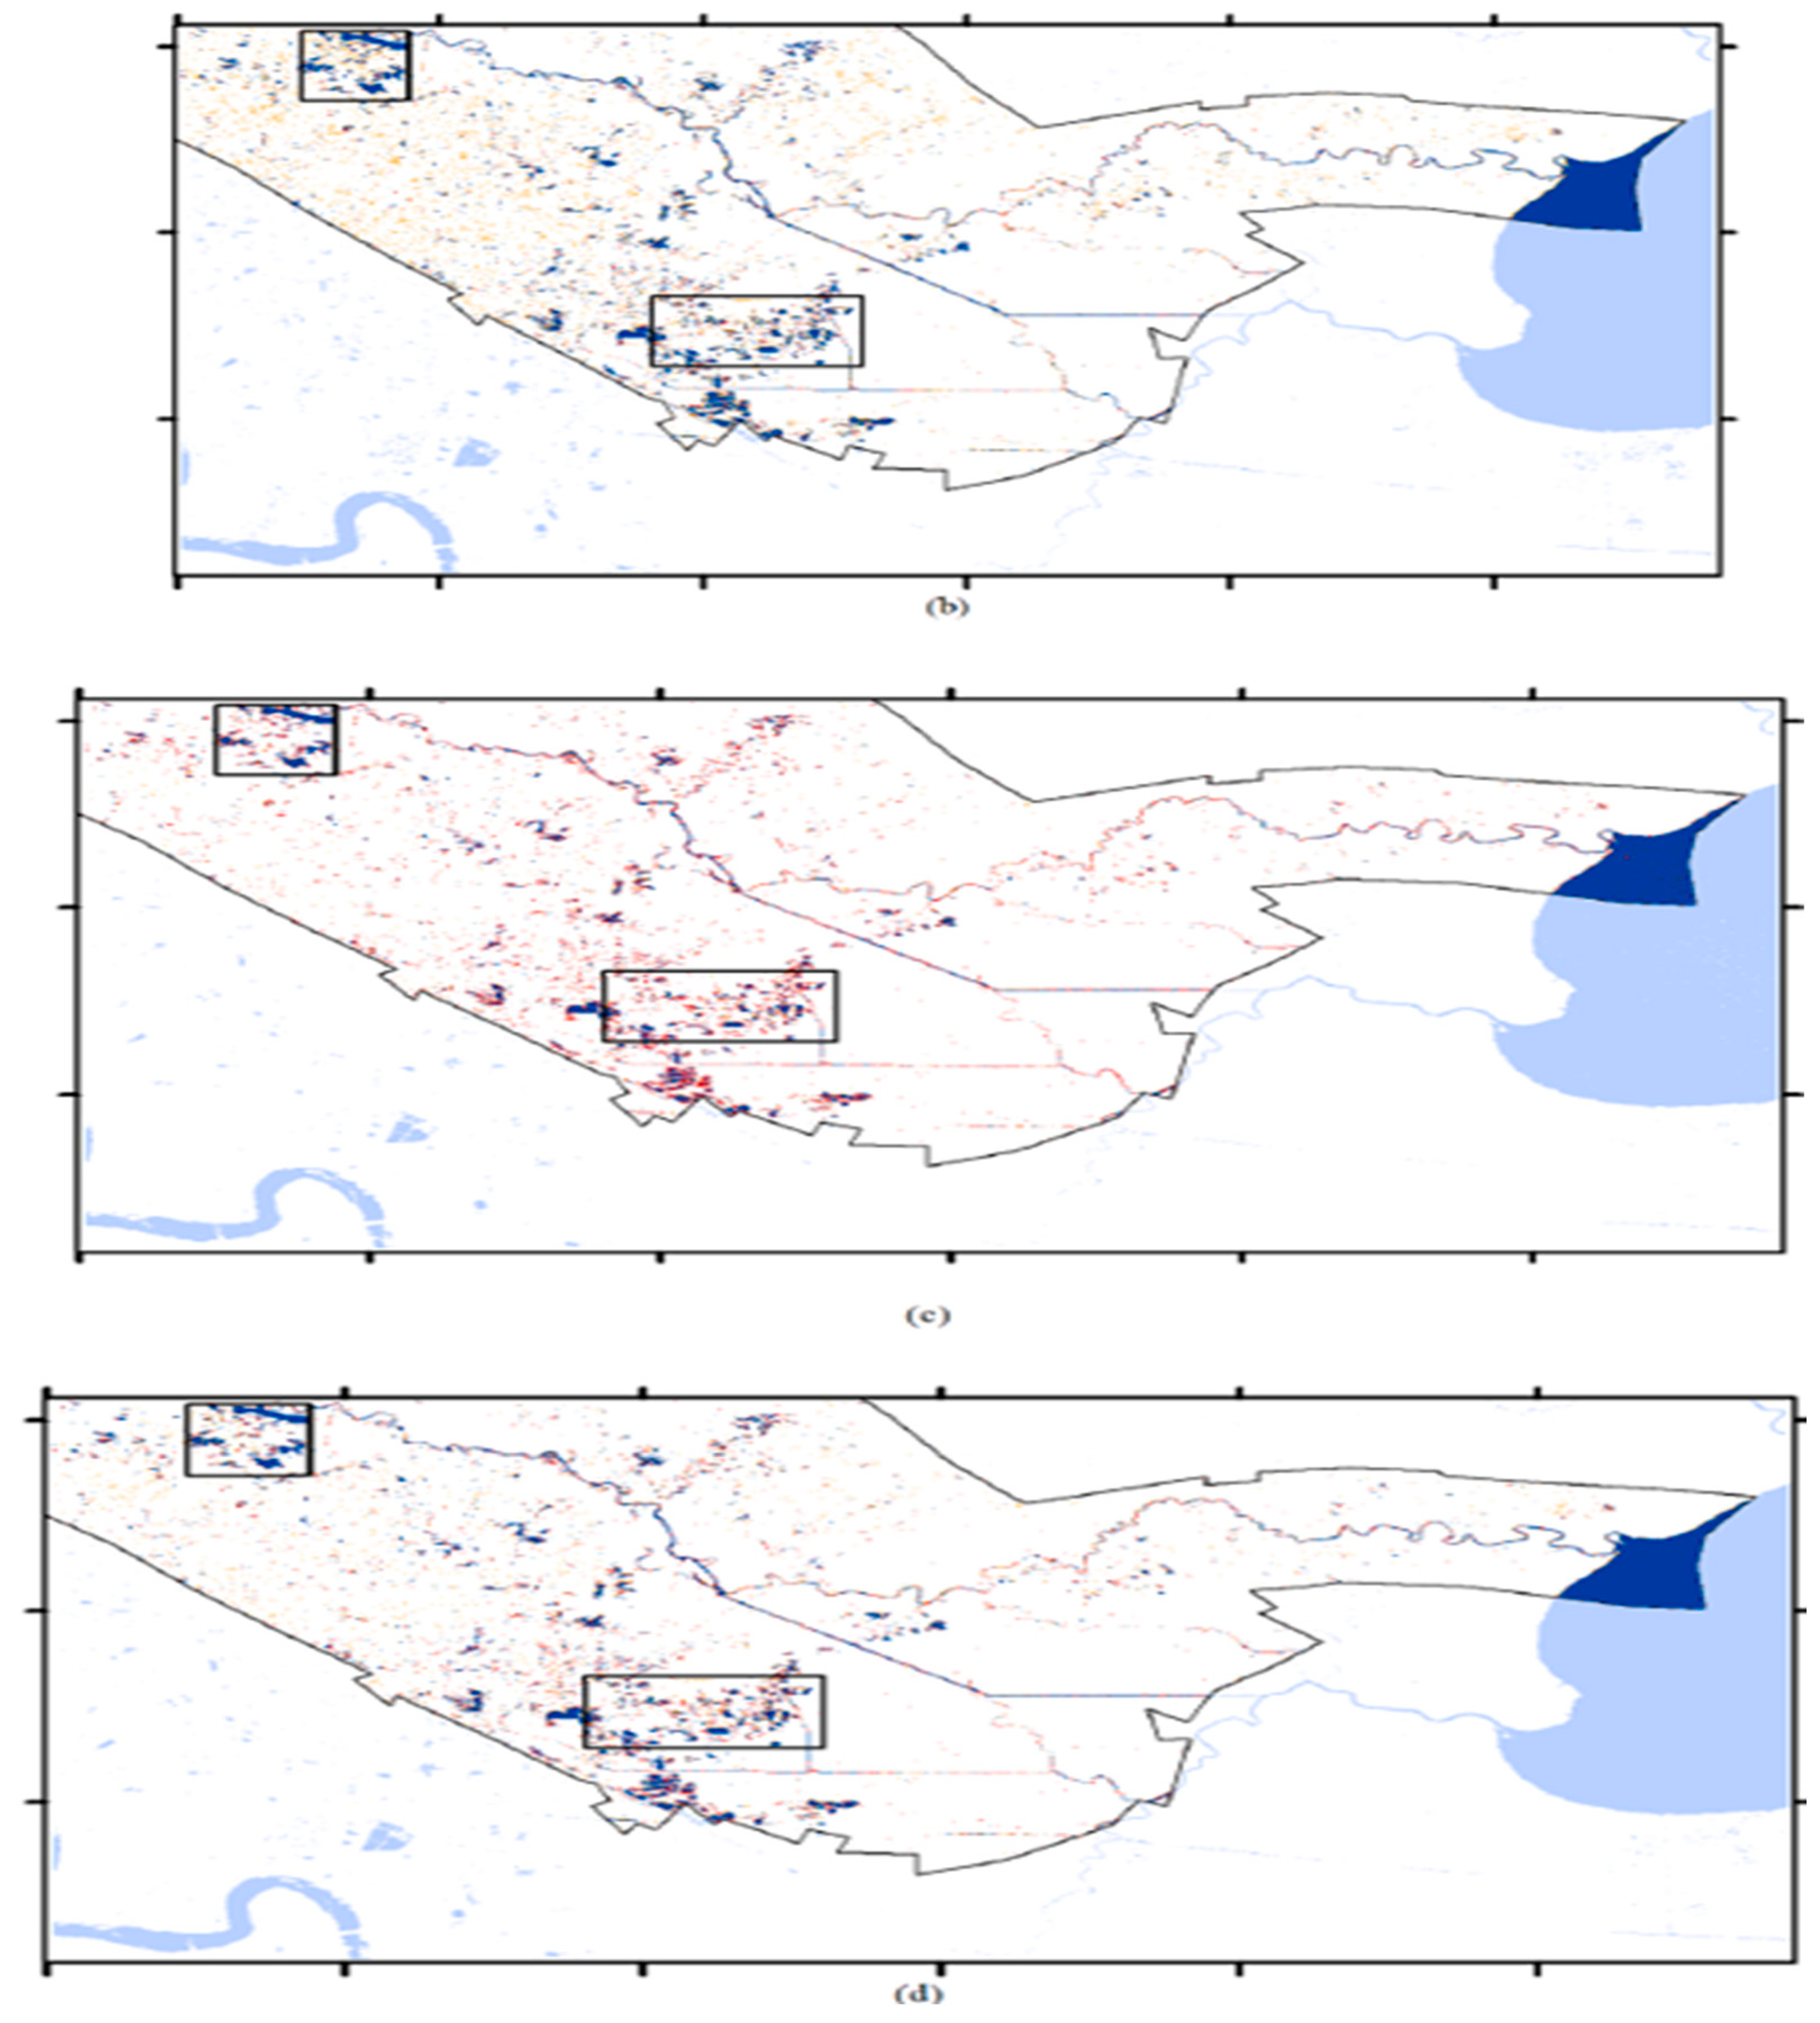
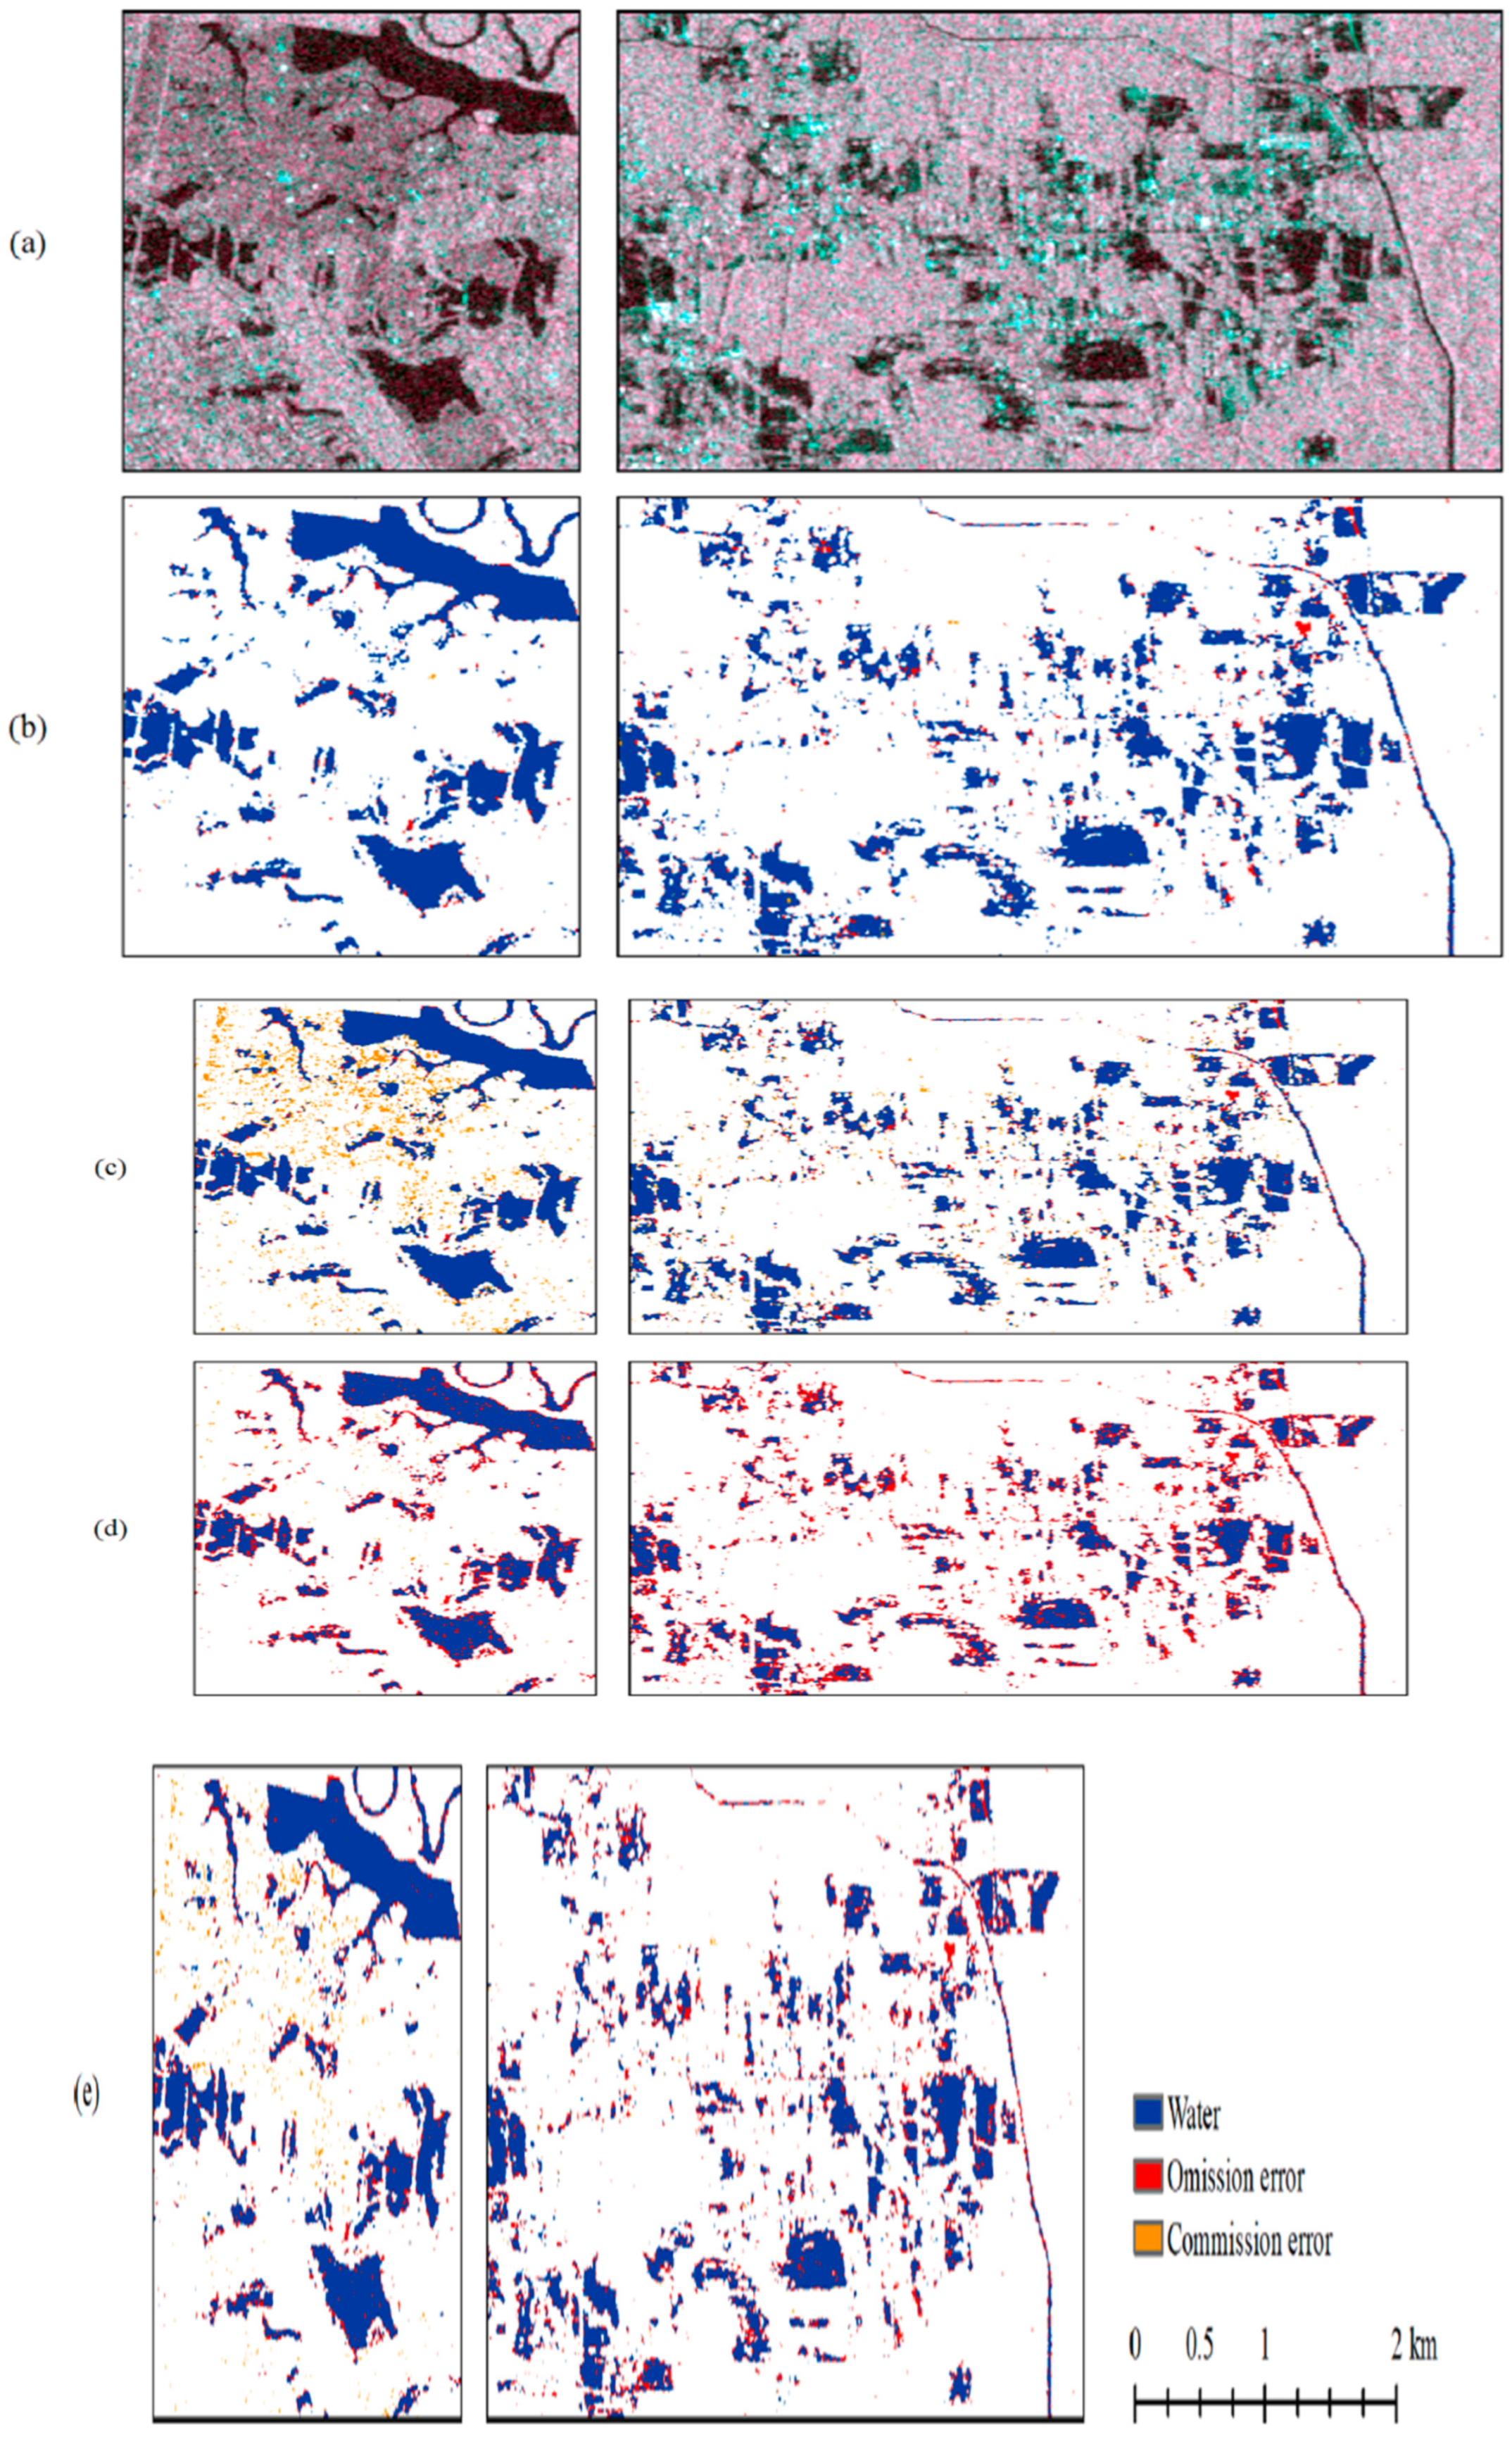
Different methods for detecting flood water using SAR imagery, including global thresholding methods and a proposed local thresholding method are provided, as illustrated by
Figure 9 and
Figure 10(c.f., [16]). The split-based Kittler-Illingworth algorithm performed better in terms of accuracy than the other two global thresholding techniques, compared to the data, while the suggested local thresholding technique had the best accuracy for users and producers. The text also highlights the challenges of accurately classifying low-backscattering surfaces and smoother land covers.
The geometric features of the terrain, in combination with its electric properties, may affect SAR’s data quality [16]. This can result in a more complex challenge than simply comparing the reflectance and conductivity of various materials. Additional backscatter correction taking surface geometry into account is required in flooded areas with complicated terrains to increase mapping accuracy. Furthermore, the accuracy of surface water delineation can be influenced by the outcome of image clustering, which is utilized to discriminate between water and other terrain types based on SAR backscatter intensity. The proposed technique is resistant to diverse land clusters; however, the water and land type criteria should be different.
More research into the efficacy of image clustering for flood mapping, with an emphasis on roughness and dielectric factors that are directly related to the SAR imaging mechanism, is needed [16]. The accuracy of thresholding for separating open water from land is determined by the amount of the overlapped area between water and dry land categories, with smaller overlaps yielding better results. However, due to the sensor’s side-looking nature and the presence of towering buildings, smoothly inundated regions can result in over-detection, whilst metropolitan areas with high development intensity can result in both over- and under-detection.
Conclusion
This study is extremely important since it addresses several difficult open problems that are currently being discovered. Buildings and ground corners might create a double bounce effect in SAR photos, which could result in bright pixels that are mistakenly categorized as land during flood mapping, according to [16]. High-complexity studies could differentiate between flood mapping techniques according to the fundamental features of flooded areas, like intricate topography, sophisticated sewage systems, or dense populations. The suggested technique can be applied to map flood water by comparing it to permanent water bodies or to identify changes in inundation in multi-temporal photographs.
Open Problem One
Differentiating ways to improve flood mapping while considering the underlying features of inundated lands, such as complicated terrains, sewage infrastructures, or dense developments, could be this hard open problem [17].
Open Problem Two
How can the hierarchical area network be deployed efficiently after [6]? The required global performance is predicted to be achieved through a joint design of communications and High-Altitude Platforms (HAPS)/Unmanned Aerial Vehicles (UAV) flights, which is yet an open research issue. This involves not just the placement of UAVs and HAPs, but also trajectory optimisation.
Open Problem Three: Internet of Space Things (IoST)
Delay-tolerant networking (DTN) has the potential to address the problems associated with future satellite communications, even if Internet of Things (IoST) is still in its early stages and was initially intended for space applications [18]. DTN is capable of handling high latency communication links, which are crucial for GEO satellites, as well as intermittent channels, which are typical in LEO [19]. A DTN protocol will facilitate smooth interoperability and cost savings as satellite networks expand over the coming years, therefore diminishing the role of satellites as a major component of the Internet of the future [20]. In this field, some open research topics include network modelling, routing, and congestion.
Open Problem Four: Flying Base Stations
The power budget analysis is also a critical factor that should be considered [9].
Open Problem Five: Advanced Satellite Resource Orchestration
Managing network slices in real-time and adapting to changing network conditions is a crucial challenge in the context of graph dynamics. To accommodate the needs of various users and applications, this entails optimizing network performance and dynamically allocating network resources. Creating effective online network-slice management algorithms and protocols that can handle the network’s dynamic nature and guarantee smooth operation is an open research challenge [6].
Open Problem Six: Quantum Key Distribution (QKD)Through Optical Satcom
Optical satellite communications (SatComs) have the potential to enable quantum key distribution (QKD) in the future, which can enhance the security of satellite communications. This highlights the need for further research into SatComs, specifically focusing on QKD scenarios, in addition to addressing the spectrum crunch [6].
Open Problem Seven: Machine Learning (ML) Applications
There are several ways in which ML techniques can be applied to enhance the functionality of satellite communication systems. Some promising applications include beam-hopping and resource scheduling in multibeam satellite systems with heterogeneous traffic demand per beam, adaptive beamforming to improve multibeam satellite performance, scheduling, and precoding to minimize interference in multibeam satellites, and spectrum event detection in spectrum monitoring applications. Another is adaptive carrier/power allocation for terrestrial hybrid satellite settings. These illustrations demonstrate how machine learning can be used to improve the overall performance of satellite communication systems [21,22].
Open Problem Eight: Digital Twins (DTs) for Satellite Systems
Ensuring individual entity privacy and minimising information exploitation are critical challenges in data management, a crucial aspect of DT implementation. Digital twins and soon-to-be blockchain technology could be combined to help overcome this [23]. Accurately tracking, managing, and decommissioning nanosatellites to prevent risks to the earth or other satellites is another issue in digital twin-enabled nanosatellite systems [24,25]. Future issues will include managing space debris and pollution through the removal of malfunctioning or non-functional satellites, along with regulating infrastructure provided by digital twins to prevent data misuse by terrorist groups, governments, or criminals.
Open Problem Nine:
Is it feasible to prove that equations (27) using mathematical induction for all the remaining values, ?
This open problem is challenging!
Open Problem Ten:
Having started the search to solve open problem nine, can we extend the solution to all positive real values of ? This open problem could be of higher complexity to challenge competent mathematicians.
Open Problem Eleven:
Is it analytically feasible to obtain the exact solutions of GDM’s GES (c.f., Eqns (29) and (30))? If the answer is no, then what can simulations offer to visualize the time- dependent trajectories of ?
Open Problem Twelve:
Can we extend the proposed IG approach to reveal the missing links between the IG modelling of GDM and the theory of General Relativity? This missing link will be revealed if we manage to determine the Scalar, Gaussian, Einsteinian and Ricci Tensors for the Underlying GDM.
The goal of this work is to use rigorous IG approaches to analyze the GDM info-geometrically. To facilitate new and revolutionary analysis for a GDM performance, IG is suggested. There aren’t many possible GD applications for SEOs. Phase II research entails investigating ways to significantly expand the study conducted in this work and move on with resolving the above-mentioned difficult open problems. In addition, additional research on additional possible GD applications to SatComs and much more.
References
- F. Nielsen, An Elementary Introduction to Information Geometry, Sony Computer Science Laboratories Inc.Japan, 2018. Available online on https://project.inria.fr/gudhi/files/2018/10/An- elementary- introduction-to-information-geometry.pdf.
- F.Belliardo, V.Giovannetti, Incompatibility in quantum parameter estimation, New Journal of Physics (2021) 063055. [CrossRef]
- I.A. Mageed, Q.Zhang, Information Geometry? Exercises de Styles, electronic Journal of Computer Science, and Information Technology. (2022) 9-14.
- I.A. Mageed, D.D.Kouvatsos, The Impact of Information Geometry on the Analysis of the Stable M/G/1 Queue Manifold, In ICORES (2021) 153-160.
- D. Li, et al, Riemannian Holonomy Groups of Statistical Manifolds, 2009. Available online on https://arxiv.org/pdf/1401.5706.pdf.
- K. Oltjon, et al, Satellite communications in the new space era: A survey and future challenges. IEEE Communications Surveys & Tutorials 23.1 (2020) 70-109. [CrossRef]
- 3GPP. 5G in Release 17—Strong Radio Evolution. Accessed: Jan. 14,2020. [Online]. Available: https://www.3gpp.org/news-events/2098-5gin-release-17-%E2%80%93-strong-radio-evolution.
- Y. Li, et al, An extensible multi-layer architecture model based on LEO-MSS and performance analysis,2019 IEEE 90th Vehicular Technology Conference (VTC2019-Fall), 2019.
- S. Engelen, et al, On the reliability, availability,and throughput of satellite swarms,” IEEE Trans. Aerosp. Electron.Syst., (2014) 1027–1037. [CrossRef]
- C. T. J. Dodson, Topics in Information Geometry, University of Manchester, 2005. Available online on http://eprints.maths.manchester.ac.uk/131/1/InfoGeom.pdf.
- L. Peng, et al, The Geometric Structure of the Pareto Distribution, Boletín de la Asociación Matemática, 2007.
- F.Kamalov, D. Denisov, Gamma distribution-based sampling for imbalanced data, Knowledge-Based Systems 207 (2020) 106368. [CrossRef]
- Mező, et al, Zeros of the digamma function and its Barnes G- function analogue, Integral Transforms and Special Functions 28.11 (2017) 846-858. [CrossRef]
- Qi, Feng, Necessary and sufficient conditions for complete monotonicity and monotonicity of two functions defined by two derivatives of a function involving Trigamma function.”, Applicable Analysis and Discrete Mathematics 15.2 (2021) 378-392. [CrossRef]
- S. M. Vicente, et al, A high resolution dataset of drought indices for Spain”, Data. (2017)22. [CrossRef]
- J. Liang, D. Liu, A local thresholding approach to flood water delineation using Sentinel-1 SAR imagery, ISPRS journal of photogrammetry and remote sensing, (2020)53-62. [CrossRef]
- C.A.Di Vittorio, A.P. Georgakakos, Land cover classification and wetland inundation mapping using MODIS, Remote Sens. Environ, 2018. [CrossRef]
- C. Caini, et al, Delay and disruption-tolerant networking (DTN): An alternative solution for future satellite networking applications, Proc. IEEE, (2011) 1980–1997. [CrossRef]
- C. Ciano, R. Firrincieli, Chapter 10—DTN and satellite communications, in Delay Tolerant Networks: Protocols and Applications. New York, NY, USA: Taylor & Francis Group, (2011) 284–315.
- J. A. Fraire, S. C. Burleigh, Delay-Tolerant Satellite Networks. London, U.K.: Artech House, 2018.
- S. Rajendran, W. Meert, V. Lenders, S. Pollin, Unsupervised wireless spectrum anomaly detection with interpretable features,” IEEE Trans. Cogn. Commun. Netw., (2019) 637–647. [CrossRef]
- C. Sun, Z. Shi, F. Jiang, A machine learning approach for beamforming in ultra dense network considering selfish and altruistic strategy,” IEEE Access, (2020) 6304–6315, 2020. [CrossRef]
- J. Zhang, ETA L, Machine learning based flexible transmission time interval scheduling for EMBB and URLLC coexistence scenario,” IEEE Access, (2019) 65811–65820. [CrossRef]
- IBM. Introduction to Digital Twin: Simple, But Detailed. Accessed: Jan. 10, 2020. [Online]. Available: https://www.ibm.com/topics/what-is-a-digital-twin.
- E. H. Glaessgen, D. Stargel, The digital twin paradigm for future NASA and U.S. air force vehicles, in Proc. 53rd Struct. Struct. Dyn. Mater. Conf. Special Session Digit. Twin, (2012) 1–14. [CrossRef]
|
Disclaimer/Publisher’s Note: The statements, opinions and data contained in all publications are solely those of the individual author(s) and contributor(s) and not of MDPI and/or the editor(s). MDPI and/or the editor(s) disclaim responsibility for any injury to people or property resulting from any ideas, methods, instructions or products referred to in the content. |
© 2024 by the authors. Licensee MDPI, Basel, Switzerland. This article is an open access article distributed under the terms and conditions of the Creative Commons Attribution (CC BY) license (http://creativecommons.org/licenses/by/4.0/).
