Submitted:
19 February 2024
Posted:
19 February 2024
You are already at the latest version
Abstract
To address the insufficient mechanical properties of calcined phosphogypsum, this research aims to investigate the utilization of basalt fiber and calcium carbonate whiskers as reinforcing agents. The study examines their impact on the flexural and compressive strength, toughness, water resistance, and tensile strength of calcined phosphogypsum. In the individual tests, basalt fibers with different lengths (3 mm, 6 mm, 9 mm, and 18 mm) were added at dosages of 0%, 0.5%, 1.0%, and 1.5% respectively. The findings demonstrate that basalt fiber effectively enhances the flexural and compressive strength, toughness, and tensile strength of calcined phosphogypsum, albeit potentially compromising water resistance. Among the various fiber lengths, the 6 mm fibers exhibit the most advantageous influence on the performance of calcined phosphogypsum. A subsequent test was conducted to investigate the impact of cross-scale fibers on the properties of calcined phosphogypsum by mixing 6 mm basalt fibers and calcium carbonate whiskers. The results illustrate that calcium carbonate whisker refines the pores, thereby improving the flexural strength and toughness of calcined phosphogypsum. Furthermore, it compensates for the water resistance limitations associated with the sole utilization of basalt fiber while further augmenting the tensile strength and strain capacity. However, it should be noted that increasing the dosage of both calcium carbonate whiskers and basalt fibers concurrently leads to increased porosity of phosphogypsum and reduced compressive strength.
Keywords:
Calcined phosphogypsum
; Basalt fiber
; Calcium carbonate whisker
; Strength
1. Introduction
Phosphogypsum (PG) is an industrial by-product primarily composed of CaSO4·2H2O, which is produced through the wet-process phosphoric acid process. Approximately 4-6 tons of PG are generated for every ton of phosphoric acid produced 12. Along with CaSO4·2H2O, PG also contains fluorapatite, goethite, and quartz, as well as small quantities of phosphate, anatase, magnetite, monazite, and quartz. Additionally, it contains trace amounts of heavy metals such as Cd, Ni, and Cu 3-5. The significant quantity of PG generated can lead to water and soil pollution, making the efficient utilization of PG a matter of great concern among researchers.
The utilization of phosphogypsum as a valuable resource for the production of construction materials represents a significant and advantageous approach 1. The substitution of natural gypsum with phosphogypsum in the manufacturing of Portland cement has been extensively investigated and proven feasible through numerous studies 6-10. This substitution not only aids in the mitigation of solid waste issues but also diminishes the dependence on natural gypsum reserves for cement production. Substantial research efforts have been devoted to the exploration of innovative cementitious materials incorporating phosphogypsum. Notably, Shuhua Liu 11 and Liao Y 12 successfully synthesized supersulfated cement possessing exceptional mechanical properties utilizing phosphogypsum. Longjian Zhang 13 implemented a synergistic combination of slag powder, Portland cement, and phosphogypsum, resulting in a composite cementitious material exhibiting an impressive compressive strength of 42.6 MPa and a softening coefficient of 89%. Tian Tian 14 formulated a cementitious material by compounding phosphogypsum with a small quantity of cement, slag powder, and quicklime. This material, when mixed with a water reducing agent, water, setting accelerator, and foam, enabled the production of foamed concrete. Moreover, the literature documents investigations on the utilization of phosphogypsum as road materials 15 16, unfired ceramsite 17, and unfired bricks 18.
Uncalcined phosphogypsum is non-cementitious in nature. However, the calcination process at 160-180°C transforms phosphogypsum into calcined phosphogypsum predominantly comprising β-CaSO4·0.5H2O. This thermal treatment technique expands the potential applications of phosphogypsum, allowing it to substitute natural building gypsum in the production of commonly used construction materials such as mortar, blocks, and hollow slats. Nonetheless, the mechanical properties of calcined phosphogypsum are typically inferior to those of natural building plaster 1920, primarily due to the presence of impurities such as phosphate rock, residual acids, metal compounds, and non-degradable organic matter 2122. These impurities have been observed to alter the crystal morphology of calcium sulfate dihydrate, resulting in a transition from long interlocking needle-like crystals to prismatic and lath-like crystals with compromised crystal stacking, thereby leading to reduced strength 23. To enhance the mechanical properties of inorganic cementitious materials, the inclusion of fibers has emerged as a widely adopted strategy. Basalt fiber (BF), renowned for its corrosion resistance, high temperature stability, and exceptional tensile strength, has found extensive employment in the realm of building materials 24-26.
Several studies have demonstrated the positive impact of BFs on the mechanical properties 27 and high temperature resistance 28 of gypsum-based materials. When BFs is combined with other fibers, it exhibits an enhanced reinforcing effect. Fangtao Lv 29 conducted an orthogonal test, incorporating basalt fiber and polyvinyl alcohol fiber into desulfurized gypsum. The findings revealed that the combination of these two fibers improved the mechanical properties, water resistance, and durability of the material. Notably, the maximum absolute dry flexural strength and compressive strength increased by 70.05% and 64.52% respectively. Whiskers are one-dimensional nanomaterials with microscopic fibrous structures. Jian S 30 found that the flexural strength of desulfurized gypsum, when modified with calcium carbonate whiskers (CW), can be increased by more than 30%. Furthermore, this modification has a positive impact on enhancing water resistance. Other studies have demonstrated that blending millimeter- and nanometer-scale fibers can enhance the interaction between fibers and the matrix, thereby effectively improving the mechanical properties of cement-based building materials 3132. However, there is a lack of research on the reinforcement of gypsum through the mixing of cross-scale fibers, necessitating further investigation into its feasibility.
This study focuses on examining the impact of varying lengths and dosages of BFs on the mechanical properties of calcined phosphogypsum. Additionally, BFs was blended with CW to examine the law of the effect of cross-scale fibers on the properties of phosphogypsum. This research can provide new ideas for enhancing the performance of gypsum-based building materials and offer a scientific basis for promoting the utilization of industrial by-product gypsum in mortar, blocks, and hollow slats building materials.
2. Materials and Test Methods
2.1. Materials
Calcined phosphogypsum was provided by Sichuan Longmang Phosphorus Chemical Co., Ltd. and its XRD analysis results are shown in Figure 1. Analysis shows that the main components of CPG are CaSO4·0.5H2O and SiO2. Protein-based gypsum retarder and CW were provided by Sichuan Tong Xingyuan Building Material Technology Co., LTD and BFs was provided by Sichuan Errun Building Material Co., LTD. Figure 2 shows the appearance and morphology of BFs. Figure 3, Figure 4 and Figure 5 depict the SEM images of CPG, CW, and BF, respectively. The SEM image reveals that the CPG particles exhibit varying sizes, with diameters less than 50 μm, and possess edges and corners. The CW particles are primarily fibrous, interspersed with non-fibrous particles. The fiber diameter measures less than 5 μm, but the length and fineness of the fibers exhibit unevenness, resulting in an aspect ratio ranging from 10 to 30. The BF fibers exhibit a regular cylindrical shape with a smooth surface. Table 1 shows the raw material parameters provided by the vendors.
2.2. Experimental design
Table 2 shows the mixing ratios used in the study. The mass ratio of the raw materials comprising the gypsum slurry was CPG:water:retarder=1:0.45:0.001.In the individual tests , BFs of 3 mm, 6 mm, 9 mm and 18 mm were selected and the BFs mixing amount was set to 0, 0.5%, 1.0%, 1.5% for each length by mass of gypsum. 6 mm BFs and CW were selected for the mixed test, and the dosages of BFs and CW were set at 0.5%, 1.0%, 1.5% and 0.5%, 1.0%, 2.0%, respectively. CPG is used hereinafter to refer to calcined phosphogypsum composite cementitious materials.
2.3. Sample Preparation
After weighing all the raw materials, CPG, CW, and retarder should be added to the mixer. Stir the mixture for 20 s and then add water. Continue stirring for 30 s until a uniform slurry is obtained. Next, add BFs to the mixer and stir for an additional 120 s to ensure proper dispersion of the fibers. Once the mixing is complete, pour the slurry into the designated mold. Use a vibration table to vibrate the slurry for 60 s in order to remove air bubbles. Then, place the mold in an environment with a temperature of 20±2°C and a relative humidity of 90±2% for 24 h to allow for curing. After the curing process, the mold can be removed.For the tests of flexural resistance, compressive resistance, water absorption, and softening coefficient, a sample measuring 40 mm×40 mm×160 mm should be used. Additionally, a dumbbell-shaped sample, as shown in Figure 6, should be used for the tensile strength test.
2.4. Test Methods
Flexural and compressive strength: The prepared sample should be placed in a blast drying oven at 40±2°C until it reaches a constant weight. The flexural and compressive strength should then be measured using a 40 mm×40 mm×160 mm sample, following the Chinese standard GB/T 9776-2008 33. Additionally, the compressive strength should be tested by soaking the dried sample in water for 24 h. The softening coefficient can be calculated by comparing the compressive strength after soaking to the compressive strength of the dried sample. Water absorption can be determined by subtracting the dry weight from the wet weight of the sample and dividing it by the dry weight.
Tensile strength: The dumbbell-shaped sample was dried and then subjected to a tensile strength test using a universal testing machine. The loading rate used was 0.3 mm/min. During the test, stress and strain data were automatically collected by a computer.
Microscopic analysis: Microscopic analysis involved taking hardened samples for SEM testing in order to analyze the dispersion state of fibers and the microscopic morphology of hardened gypsum. Additionally, samples underwent MIP analysis to gather information on pore volume, porosity, and other relevant parameters.
3. Test results and analysis
3.1. Individual tests
3.1.1. Flexural strength
The test results of the flexural strength are presented in Figure 7. Different lengths of BFs have a positive impact on the flexural strength of CPG. As the BFs content increases, the flexural strength demonstrates an upward trend. The increase is more noticeable when the BFs content ranges from 0% to 1.0%. However, the upward trend slows down when the BFs content exceeds 1.0%. Among the BF lengths, 6 mm and 9 mm are the most effective in improving the flexural strength, followed by 18 mm and 3 mm. The flexural strength reaches its highest value of 9.8 MPa when the 6 mm BFs content is 1.5%, which is 92.2% higher than the blank group without BFs.
BFs demonstrates exceptional tensile strength and fracture toughness, displaying an enhanced mechanical bite force and grip force with increased fiber length and content. This intensified interfacial interaction effectively resists internal tensile stress within the matrix, resulting in proficient energy absorption and reduced internal damage and cracking 34. In the three-point flexural test, the upper region is subjected to compression, while the lower region experiences tension. Shorter 3 mm fibers are susceptible to pull-out during the tension phase, with slipping and debonding mechanisms exhibiting limited influence on energy dissipation. Hence, the 3 mm basalt fibers make a negligible contribution to flexural strength. Although 18 mm fibers are sufficiently long, it is noteworthy that longer fibers encounter difficulties in spreading and achieving uniform dispersion during the stirring process, leading to agglomeration and defect formation 35. Consequently, in comparison, BFs measuring 6 mm and 9 mm are determined to be more efficient in enhancing flexural strength.
3.1.2. Compressive strength
The compressive strength test results are presented in Figure 8. It can be observed that the addition of BFs enhances the compressive strength of CPG. Specifically, an incremental improvement in compressive strength is evident with the increasing content of 3 mm and 6 mm BFs. However, the impact of 9 mm and 18 mm BFs on enhancing compressive strength is relatively weaker, displaying an initial increase followed by a decrease with increasing content. Remarkably, when the content of 6 mm BFs reaches 1.5%, the compressive strength reaches its maximum value at 25.6 MPa, exhibiting a significant 32.0% increase compared to the control group. This improvement can be attributed to the rigidity imparted by BFs, which fortify the matrix and impede crack expansion during compression, thus enhancing the compressive strength of CPG. Notably, the shorter 3 mm and 6 mm BFs offer advantages in improving compressive strength, as their random dispersion inherently reduces unfavorable stress distribution 35. Conversely, the longer 9 mm and 18 mm BFs are prone to agglomeration defects within the matrix 36, resulting in less pronounced enhancements in compressive strength.
3.1.3. Toughness
The toughness of gypsum is commonly evaluated using its flexural-compressive ratio. A higher ratio indicates better toughness of gypsum. In Figure 9, the ratio is determined by calculating the flexural and compressive strengths. The blank CPG has a ratio of only 0.26. However, when BFs with varying lengths and dosages is added, the ratio significantly increases. Moreover, for the test group mixed with BFs of the same length, the ratio gradually increases with the increase in BFs content. Notably, the test group mixed with 9 mm BFs exhibits the highest flexural-compressive ratio. At a dosage of 1.5%, the ratio reaches 0.46, which is 76.9% higher than that of the control group.
3.1.4. Water absorption and softening coefficient
The outcomes of the water absorption and softening coefficient assessments carried out on CPG (Figure 10) are presented herein. Compared to the control group, the experimental groups, which underwent mixing with various lengths and quantities of BFs, demonstrated reduced softening coefficients. Furthermore, an inverse relationship between the softening coefficient and the content of BFs was observed. Of particular interest, the test group containing 3 mm BFs exhibited a marginally lower water absorption rate than the control group, while the remaining groups displayed higher rates of water absorption. This dissimilarity can be ascribed to the presence of a notable quantity of monofilament fibers within the 3 mm staple fibers. These fibers are intricately dispersed throughout the matrix and interfere with the pore connectivity, thus contributing to diminished water absorption 37. However, the hydrophilic nature of the basalt fiber surface, combined with its smooth characteristics, hinders strong bonding with the matrix, resulting in a weak interface that promotes the dissolution of hydration products and facilitates the free movement of water molecules 38. As a consequence, the water absorption tendencies of the experimental groups mixed with other lengths of BFs were elevated. Consequently, the inclusion of BFs does not enhance the water resistance of CPG.
3.1.5. Tensile strength
Figure 11a shows the test results of tensile strength. The findings indicate that, except for the 3/0.5 and 18/0.5 groups, the strength of the remaining groups has increased. The decrease in strength in the 3/0.5 group can be attributed to the occurrence of harmful stress concentration when shorter BFs is mixed into the CPG at a lower dosage 38. The decrease in strength in the 18/0.5 group may be due to uneven dispersion of fibers. When BFs of the same length is added, the tensile strength increases with higher BFs content. However, when maintaining the same BFs content, the tensile strength first increases and then decreases with the increase in BFs length. Overall, BFs lengths of 6 mm and 9 mm are more effective in enhancing tensile strength compared to 3 mm and 18 mm. The 9/1.5 group exhibits the highest tensile strength, which is 31.1% higher than that of the blank group. In Figure 11b, the stress-strain curve of the tensile test is depicted. It is evident from the curves of each group that the ultimate tensile stress and strain are the lowest for the blank group. As the BFs content increases, there is a significant increase in stress or strain, particularly in the test groups with BFs content of 1.0% and 1.5%. This indicates that BFs improves the tensile strength and ductility of CPG.
3.2. Mixing BFs and CW test
3.2.1. Flexural strength
The flexural strength test results of the CPG mixed with BFs and CW are shown in Figure 12. It was observed that the flexural strength of CPG with 6 mm BFs shows an initial increase and then a decrease as the content of CW is increased. In the test group with a fixed BFs content of 0.5%, the CW content varied from 0 to 2.0%, resulting in flexural strengths of 7.3 MPa, 7.8 MPa, 7.5 MPa, and 6.9 MPa respectively. Similarly, when the fixed BFs dosage was 1.5%, the flexural strengths of each group were 11.5 MPa, 11.7 MPa, 12.6 MPa, and 12.4 MPa respectively. These findings indicate that cross-scale fiber blending can enhance the flexural strength of CPG, with an optimal ratio of BFs to CW. The filling effect of whisker 39 improves the compactness of the interface, leading to increased frictional bond strength and ultimately higher flexural strength. However, excessive whiskers tend to aggregate, resulting in increased porosity at the interface instead of densification 31. Consequently, a higher whisker content leads to a decrease in flexural strength. Moreover, the stress failure process revealed that the blended samples containing BFs and CW exhibited narrower cracks, as depicted in Figure 13, indicating stronger cohesion.
3.2.2. Compressive strength
The compressive strength test results of CPG samples mixed with BFs and CW are shown in Figure 14. Unexpectedly, mixing BFs and CW did not enhance the compressive strength of the samples; instead, there was a decrease in strength. When the BFs content is fixed at 0.5%, and 0, 0.5%, 1.0%, and 2.0% of CW are added, the corresponding compressive strengths are 23.6 MPa, 19.6 MPa, 22.2 MPa, and 20.6 MPa, respectively. In the test group with an amount of 1.5%, the corresponding compressive strengths were 24.4 MPa, 19.6 MPa, 22.1 MPa, and 20.8 MPa, all of which exhibited a reduction in compressive strength. It can be observed that when the content of CW is 0.5%, 1.0%, and 2.0%, the compressive strength initially increases and then decreases. Furthermore, when the content is 1.0%, the compressive strength is higher compared to the test groups mixed with 0.5% and 2.0%.
3.2.3. Toughness
Based on the flexural and compressive strengths of the CPG samples blended with BFs and CW, the flexural-compressive ratio was calculated and presented in Figure 15. Overall, the test groups incorporating both BFs and CW exhibited higher flexural-compressive ratios compared to the group mixed with BFs alone. This observation signifies that the inclusion of cross-scale fibers positively influences the toughness of the CPG material. Remarkably, the test group containing 1.5% BFs content demonstrated the highest flexural-compressive ratio. With the addition of 0.5%, 1.0%, and 2.0% CW, the ratios increased by 31.9%, 21.0%, and 27.7% respectively. It is noteworthy that the enhancement in toughness can be attributed to the presence of CW, which not only enhances the flexural strength but also reduces the compressive strength.
3.2.4. Water absorption and softening coefficient
Figure 16 presents the water absorption and softening coefficient of CPG blended with BFs and CW. The analysis findings demonstrate that the incorporation of CW in conjunction with BFs yields a reduced water absorption rate and an elevated softening coefficient when compared to the sample comprising solely 6 mm BFs. This observation suggests that the addition of CW effectively compensates for the reduction in water resistance caused by the BFs as a single dopant. Notably, the group consisting of 0.5% 6 mm BFs and 0.5% CW exhibited the highest softening coefficient, reaching 0.50. It has been previously reported that nanoscale fibers possess the ability to effectively occupy void spaces 39, thereby impeding the creation of interconnected pores and consequently enhancing the water resistance of the composite matrix.
3.2.5. Tensile strength
Figure 17a illustrates the tensile strength of CPG blended with BFs and CW. With the exception of the 0.5/0.5 and 1.5/0.5 test groups, the tensile strength of the other test groups mixed with BFs and CW was higher compared to the test group mixed with BFs alone. The decrease in strength in certain groups may be attributed to the uneven dispersion of whiskers. Overall, the tensile strength of CPG was significantly enhanced with the addition of 1.0% and 2.0% CW. Figure 17b represents the stress-strain curve, demonstrating that the use of 1.0% or 2.0% CW with 6 mm BFs helps improve the ultimate tensile stress and strain of CPG. Notably, in the 1.0/1.0 and 1.0/2.0 test groups, a pseudo-strain strengthening effect was observed during the stretching process, with the maximum tensile strain exceeding 2%. CW has the ability to inhibit the initiation and propagation of micro-cracks, enhance the crack initiation strength of the matrix, and may lead to the formation of multiple micro-cracks during tension. However, the development of these micro-cracks into macro-cracks becomes slower and more challenging 3132, ultimately contributing to the improvement of tensile strength and ductility in the matrix.
3.3. Mechanism analysis
3.3.1. Monofilament number and interface area calculation
In the test of adding BFs alone, it was discovered that a 6 mm BFs had the most significant impact on enhancing the flexural, compressive, and tensile strength. Furthermore, as the dosage increased, there was an upward trend in the mechanical properties. The improvement effect of the mechanical properties is closely related to factors such as the quantity of monofilament fibers in CPG and the interface area between the fibers and the matrix. The estimation of the number and interfacial area of monofilament fibers can be determined using formulas (1) and (2).
where: Q is the number of monofilament fibers; S is the interfacial area, mm2; the total mass of dry matter is set to 1000 g; ρ is the fiber density, 2.65g/cm3; A is the fiber diameter, μm; B is the fiber length, mm; C is the fiber mass fraction, %。The calculation results are shown in Table 3.
Q=(1000C/ρ)/[π×(0.5A/1000)2×B]
S=(A/1000)×πBQ
According to the calculation results presented in Table 3, it is observed that, while maintaining a constant fiber content, the number of individual fibers gradually decreases as the fiber length increases, while the interfacial area remains unchanged. Conversely, with constant fiber length, both the number of individual fibers and the interfacial area increase with the augmentation of fiber dosage. Furthermore, the interfacial area exhibits periodic variations in conjunction with alterations in mass fraction and fiber length.For example, at a content of 1.5%, the number of individual fibers for 3 mm, 6 mm, 9 mm, and 18 mm BFs were determined to be 14222.2, 7111.1, 4740.7, and 2370.4, respectively. While the number of individual fibers gradually decreases, the corresponding interfacial area measures 1741.7 mm2. Although the 3 mm BFs exhibits the highest number of individual fibers, these shorter fibers are susceptible to being dislodged and losing their effectiveness. Conversely, longer fibers can impart greater friction and resistance during the peeling process; however, the number of individual fibers in the 9 mm and 18 mm BFs is lower, leading to uneven dispersion. Furthermore, these longer fibers have a tendency to aggregate, thus posing challenges in terms of achieving uniform dispersion during the stirring process. Consequently, in comparison, the 6 mm fibers yield the most favorable results in terms of enhancing mechanical properties.Upon incorporating 0.5%, 1.0%, and 1.5% of 6 mm BFs into the matrix, a substantial increase is observed in both the number of individual fibers and the interfacial area. This augmentation significantly improves the cohesion among matrix components, ultimately promoting the enhancement of mechanical properties.
3.3.2. SEM analysis
The fracture surface of the tensile sample with 1.5% BFs content was examined using SEM testing. Figure 18a, Figure 18b, Figure 18c, and Figure 18d represent samples containing 3 mm, 6 mm, 9 mm, and 18 mm of BFs, respectively. It was observed that the dispersion of 3 mm, 9 mm, and 18 mm BFs in CPG exhibited a certain degree of orientation and aggregation, suggesting poor dispersion uniformity. On the other hand, the 6 mm BFs showed a more uniform and chaotic dispersion pattern, which is beneficial for improving mechanical properties. The combination between the fibers and the matrix does not appear to be dense, resulting in the fibers being mostly pulled out during the stress process. This is supported by the presence of remaining fiber traces in Figure 15a, Figure 15b, Figure 15c, and Figure 15d. Figure 15e is the SEM image of the sample mixed with 1.5% BF and 2.0% CW. This image reveals an interlacing of CW and BF, with CW embedded within the gypsum crystal. This interlacing mechanism serves to mitigate stress concentration and retard stress generation. Moreover, the introduction of whiskers aids in averting crack propagation, facilitating crack deflection, and thereby elongating crack propagation pathways while dissipating energy. Consequently, whiskers play a pivotal role in enhancing the mechanical properties of the material under investigation [30].
3.3.3. MIP analysis
Samples from groups 0.5/1, 0.5/2, and 1.5/2 were subjected to MIP testing, and the results are presented in Figure 19. The sample containing 0.5% 6mm BFs and 1.0% CW exhibited the lowest porosity, followed by the 0.5/2 and 1.5/2 samples. Comparing the 0.5/1 and 0.5/2 groups, it was observed that the 0.5/2 group, which had a higher CW content, had higher pore volume and porosity than the 0.5/1 group. However, the average pore diameter was significantly reduced, indicating that the addition of CW contributed to pore refinement. This refinement is beneficial in reducing the macroscopic defects of CPG, thereby improving its flexural strength, softening coefficient, and tensile strength. Comparing the 0.5/2 and 1.5/2 groups, it can be seen that the 1.5/2 group with a higher BFs content exhibited higher pore volume and porosity than the 0.5/2 group. This increase in porosity is attributed to the presence of pores at the weaker bonding interface between BFs and the matrix. A higher BFs content results in more weak bonding interfaces. This analysis result helps explain the phenomenon of increased water absorption rate in CPG after the incorporation of BFs. Comparing the 1.5/2 and 0.5/1 groups, it is evident that increasing the amount of BFs and CW simultaneously significantly increases pore volume and porosity, which is the main reason for the decrease in the compressive strength of CPG after mixing BFs and CW.
4. Conclusion
The effects of basalt fiber and calcium carbonate whisker on the properties of CPG were studied by individual and Mixed Tests. The main conclusions are as follows:
The inclusion of BF significantly enhances the strength of CPG, improving toughness, flexural-compressive ratio, tensile strength, and strain capacity. However, it can also increase water absorption, consequently reducing water resistance. Notably, adding 6 mm BF has the most substantial impact, particularly at 1.5% content, where it increases flexural and compressive strengths by 92.2% and 32.0% respectively compared to the control group.
The concurrent addition of 6 mm BF and CW to CPG significantly enhances its flexural strength and toughness, albeit at the expense of compressive strength. Moreover, the inclusion of CW alongside BF improves the softening coefficient and water resistance of CPG, implying that CW effectively compensates for the diminished water resistance resulting from BF incorporation alone. Furthermore, CW substantially contributes to the augmentation of tensile strength and strain capacity in CPG. Notably, the inclusion of 1.0% 6 mm BF and 2.0% CW in CPG manifests a notable pseudo-strain strengthening effect during the tensile process, with a remarkable maximum tensile strain exceeding 2%.
Microscopic tests have demonstrated that the dispersion uniformity of 6 mm BFs in CPG surpasses that of fibers with other lengths. However, the bonding between the fiber and matrix is inadequate, resulting in the fiber being predominantly pulled out when subjected to stress. MIP tests have indicated that augmenting the quantity of basalt fiber leads to an elevation in pore volume and porosity of CPG. Similarly, increasing the amount of CW also elevates porosity, but it contributes to refining the pores and enhancing the cohesion of the matrix. Consequently, this improvement in pore structure enhances the flexural strength, softening coefficient, and tensile strength of CPG.
Author Contributions
Conceptualization, Jiang Yong and Huo Jichuan; methodology, Jiang Yong; validation, Lei Yonglin; resources and data curation, Jia Lujun; writing—original draft preparation, Jiang Yong; writing—review and editing, Huo Jichuan; funding acquisition, Jiang Yong.
Acknowledgments
Funding from the Basalt Fiber and Composite Key Laboratory of Sichuan Province (open fund project: XXFC-2202) and Mianyang Polytechnic (Key project of natural science: MZ22ZD01, MZ22ZD02) is gratefully acknowledged.
Conflicts of Interest
The authors declare no conflicts of interest.
References
- Rashad A M. Phosphogypsum as a construction material[J]. Journal of cleaner production, 2017, 166: 732-743. [CrossRef]
- Xiantao Q, Yihu C, Haowei G, et al. Resource utilization and development of phosphogypsum-based materials in civil engineering[J]. Journal of Cleaner Production, 2023: 135858. [CrossRef]
- Tayibi H, Choura M, López F A, et al. Environmental impact and management of phosphogypsum[J]. Journal of environmental management, 2009, 90(8): 2377-2386. [CrossRef]
- Saadaoui E, Ghazel N, Ben Romdhane C, et al. Phosphogypsum: potential uses and problems–a review[J]. International Journal of Environmental Studies, 2017, 74(4): 558-567. [CrossRef]
- Li X, Lv X, Xiang L. Review of the State of Impurity Occurrences and Impurity Removal Technology in Phosphogypsum[J]. Materials, 2023, 16(16): 5630. [CrossRef]
- Chandara C, Azizli K A M, Ahmad Z A, et al. Use of waste gypsum to replace natural gypsum as set retarders in portland cement[J]. Waste management, 2009, 29(5): 1675-1679. [CrossRef]
- Shen W, Gan G, Dong R, et al. Utilization of solidified phosphogypsum as Portland cement retarder[J]. Journal of Material Cycles and Waste Management, 2012, 14: 228-233. [CrossRef]
- Li B, Li L, Chen X, et al. Modification of phosphogypsum using circulating fluidized bed fly ash and carbide slag for use as cement retarder[J]. Construction and Building Materials, 2022, 338: 127630. [CrossRef]
- Van der Merwe E M, Strydom C A. Purification of South African phosphogypsum for use as Portland cement retarder by a combined thermal and sulphuric acid treatment method: research in action[J]. South African journal of science, 2004, 100(9): 411-414.
- Rosales J, Pérez S M, Cabrera M, et al. Treated phosphogypsum as an alternative set regulator and mineral addition in cement production[J]. Journal of Cleaner Production, 2020, 244: 118752. [CrossRef]
- Liu S, Ouyang J, Ren J. Mechanism of calcination modification of phosphogypsum and its effect on the hydration properties of phosphogypsum-based supersulfated cement[J]. Construction and Building Materials, 2020, 243: 118226. [CrossRef]
- Liao Y, Yao J, Deng F, et al. Hydration behavior and strength development of supersulfated cement prepared by calcined phosphogypsum and slaked lime[J]. Journal of Building Engineering, 2023: 108075. [CrossRef]
- Zhang L, Mo K H, Yap S P, et al. Mechanical strength, water resistance and drying shrinkage of lightweight hemihydrate phosphogypsum-cement composite with ground granulated blast furnace slag and recycled waste glass[J]. Construction and Building Materials, 2022, 345: 128232. [CrossRef]
- Tian T, Yan Y,Hu Z H, et al.Utilization of original phosphogypsum for the preparation of foam concrete[J].Construction and Building Materials,2016,115:143-152. [CrossRef]
- Meskini S, Samdi A, Ejjaouani H, et al. Valorization of phosphogypsum as a road material: Stabilizing effect of fly ash and lime additives on strength and durability[J]. Journal of Cleaner Production, 2021, 323: 129161. [CrossRef]
- Meskini S, Remmal T, Ejjaouani H, et al. Formulation and optimization of a phosphogypsum–fly ash–lime composite for road construction: A statistical mixture design approach[J]. Construction and Building Materials, 2022, 315: 125786. [CrossRef]
- Ding C, Sun T, Shui Z, et al. Physical properties, strength, and impurities stability of phosphogypsum-based cold-bonded aggregates[J]. Construction and Building Materials, 2022, 331: 127307. [CrossRef]
- Kuzmanović P, Todorović N, Mrđa D, et al. The possibility of the phosphogypsum use in the production of brick: Radiological and structural characterization[J]. Journal of Hazardous Materials, 2021, 413: 125343. [CrossRef]
- Chen X, Gao J, Liu C, et al. Effect of neutralization on the setting and hardening characters of hemihydrate phosphogypsum plaster[J]. Construction and building materials, 2018, 190: 53-64. [CrossRef]
- Saadaoui E, Ghazel N, Ben Romdhane C, et al. Phosphogypsum: potential uses and problems–a review[J]. International Journal of Environmental Studies, 2017, 74(4): 558-567. [CrossRef]
- Xue S, Li M, Jiang J, et al. Phosphogypsum stabilization of bauxite residue: conversion of its alkaline characteristics[J]. Journal of Environmental Sciences, 2019, 77: 1-10. [CrossRef]
- Cichy B, Kraszewski C, Rafalski L. Geotechnical properties of phosphogypsum and its use in road engineering[C]//Proceedings of China-Europe Conference on Geotechnical Engineering: Volume 2. Springer International Publishing, 2018: 1664-1667. [CrossRef]
- Singh M. Role of phosphogypsum impurities on strength and microstructure of selenite plaster[J]. Construction and building materials, 2005, 19(6): 480-486. [CrossRef]
- Jamshaid H, Mishra R. A green material from rock: basalt fiber–a review[J]. The Journal of The Textile Institute, 2016, 107(7): 923-937. [CrossRef]
- Al-Kharabsheh B N, Arbili M M, Majdi A, et al. Basalt fiber reinforced concrete: a compressive review on durability aspects[J]. Materials, 2023, 16(1): 429. [CrossRef]
- Gencel O, Nodehi M, Bayraktar O Y, et al. Basalt fiber-reinforced foam concrete containing silica fume: An experimental study[J]. Construction and Building Materials, 2022, 326: 126861. [CrossRef]
- Li Z, Wang X, Yan W, et al. Physical and mechanical properties of gypsum-based composites reinforced with basalt, glass, and PVA fibers[J]. Journal of Building Engineering, 2023, 64: 105640. [CrossRef]
- Li X, Yu T, Park S J, et al. Reinforcing effects of gypsum composite with basalt fiber and diatomite for improvement of high-temperature endurance[J]. Construction and Building Materials, 2022, 325: 126762. [CrossRef]
- Lv F, Wang L, An H, et al. Effects of hybrid fibers on properties of desulfurized gypsum-based composite cementitious materials[J]. Construction and Building Materials, 2023, 392: 131840. [CrossRef]
- Jian S, Yang X, Gao W, et al. Study on performance and function mechanisms of whisker modified flue gas desulfurization (FGD) gypsum[J]. Construction and Building Materials, 2021, 301: 124341. [CrossRef]
- Ma H,Cai J,Lin Z,et al.CaCO3 whisker modified Engineered Cementitious Composite with local ingredients[J].Construction and Building Materials,2017,151:1-8. [CrossRef]
- Cai J, Pan J. Using calcium carbonate whisker in engineered cementitious composites[C]//Proceedings of the 9th International Conference on Fracture Mechanics of Concrete and Concrete Structures, Berkeley, CA, USA. 2016. [CrossRef]
- GB/T 9776-2008 Calcined gypsum ,Inspection and Quarantine of the People's Republic of China, Beijing.
- Cui G,Xie L,Lu Y, et al.Optimization of mechanical properties of basalt fiber reinforced phosphogypsum⁃based composites based on RSM[J]. Inorganic Chemicals Industry,2023,55(8):116-123. [CrossRef]
- Alaskar A,Albidah A,Alqarni A S,et al.Performance evaluation of high⁃strength concrete reinforced with basalt fibers exposed to elevated temperatures[J].Journal of Building Engineering,2021,35:102108. [CrossRef]
- Xie L, Zhou Y, Xiao S, et al. Research on basalt fiber reinforced phosphogypsum-based composites based on single factor test and RSM test[J]. Construction and Building Materials, 2022, 316: 126084. [CrossRef]
- Chen F, Xu B, Jiao H,et al.Fiber distribution and pore structure characterization of basalt fiber reinforced concrete[J]. Journal of China University of Mining & Technology,2021,50(2):273-280.
- Xie L,Zhou Y, Luo S, et al.Study on Basalt Fiber Modified Desulfurized Building Gypsum[J].Non-Metallic Mines,2020,43(6):49-55.
- Cao M, Zhang C,Wei J.Microscopic reinforcement for cement based composite materials[J].Construction and Building Materials,2013,40:14-25. [CrossRef]
Figure 1.
xrd pattern of CPG.
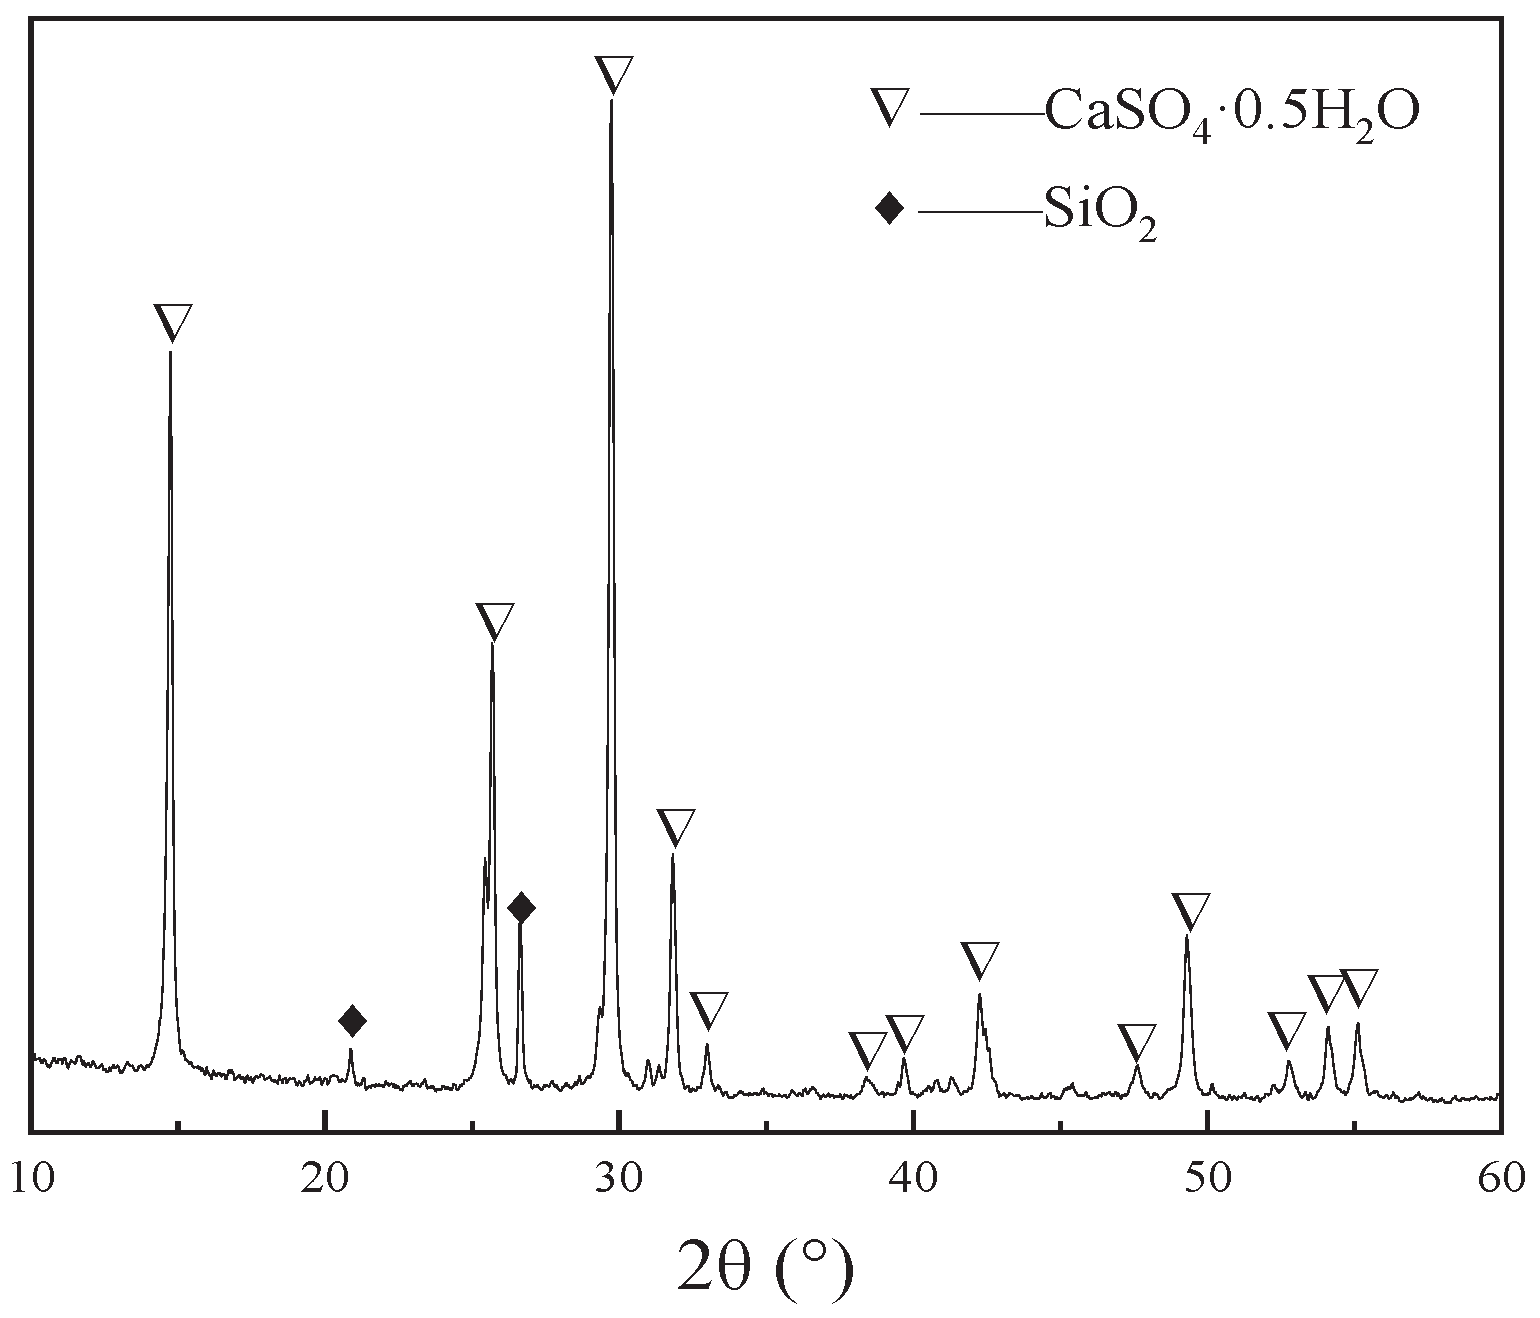
Figure 2.
Appearance of different lengths of BFs .
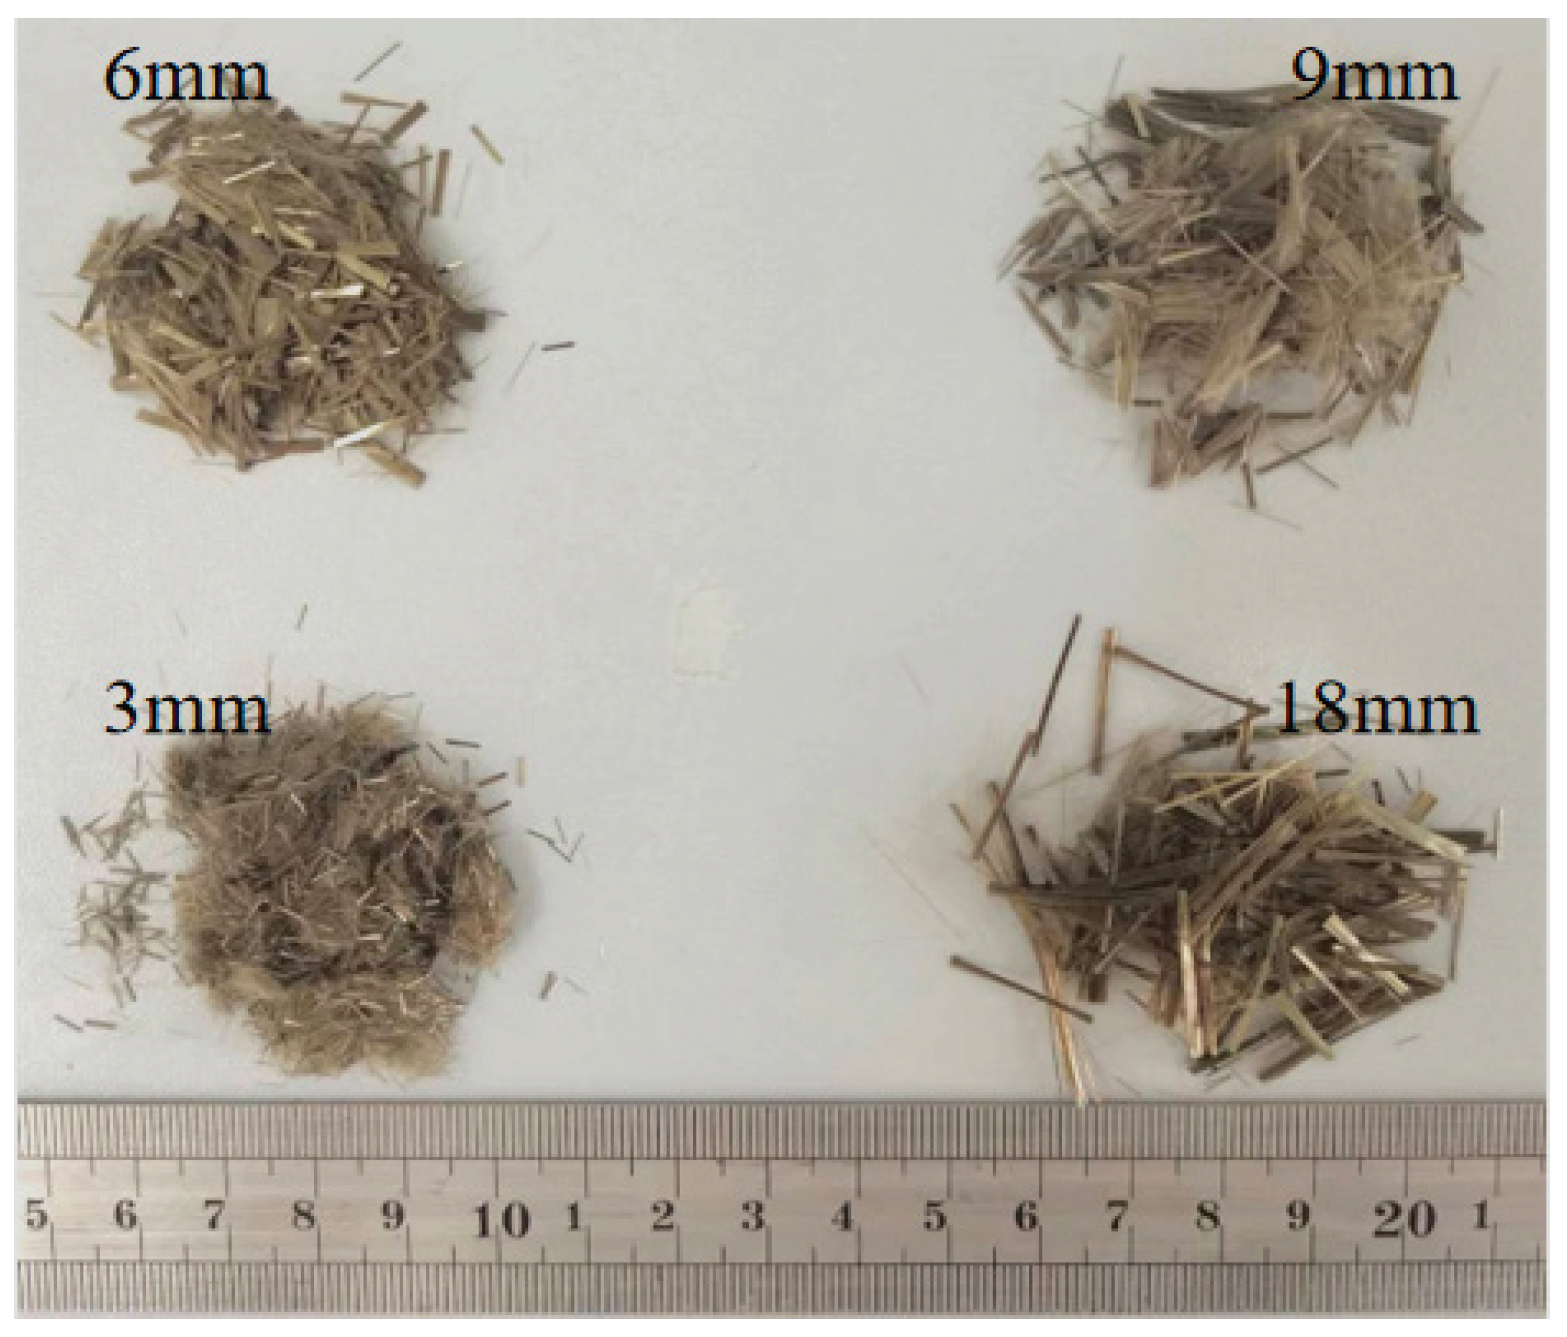
Figure 3.
SEM images of CPG.
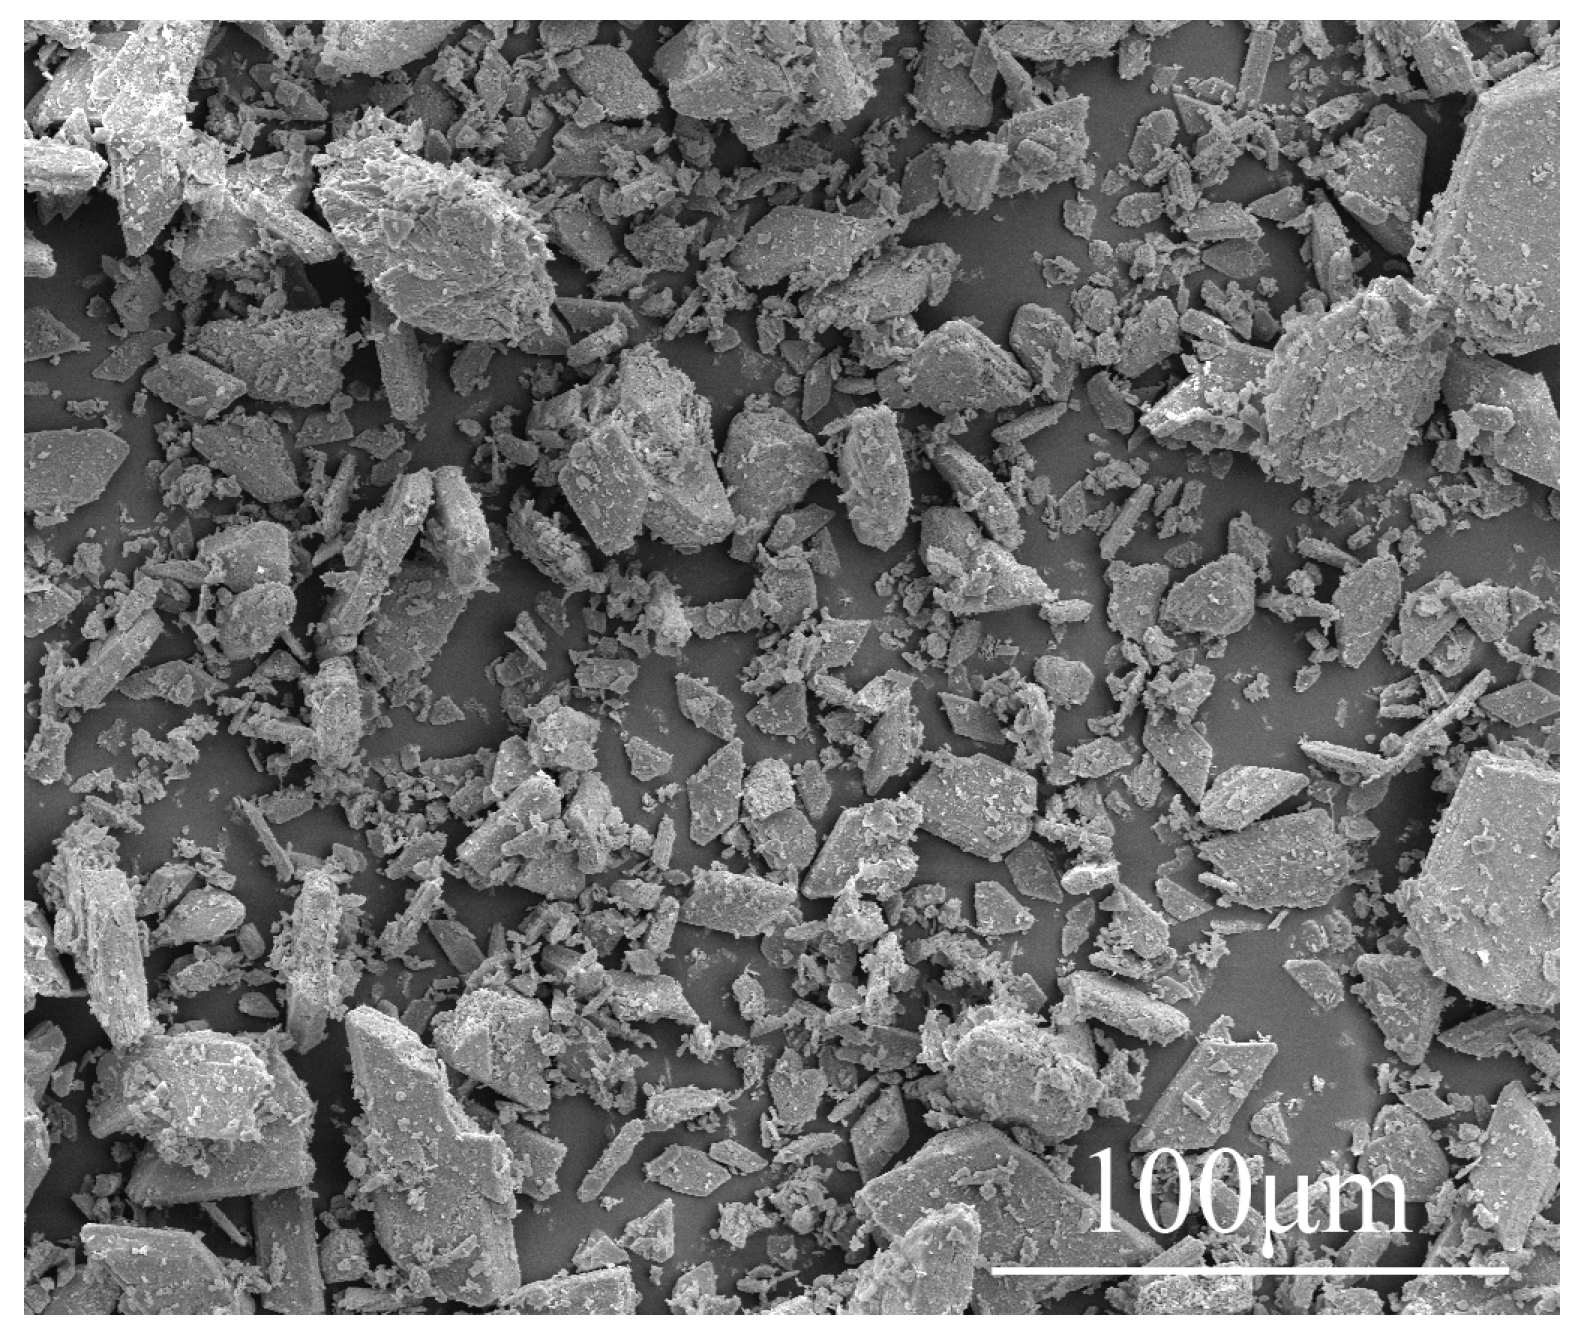
Figure 4.
SEM images of CW.
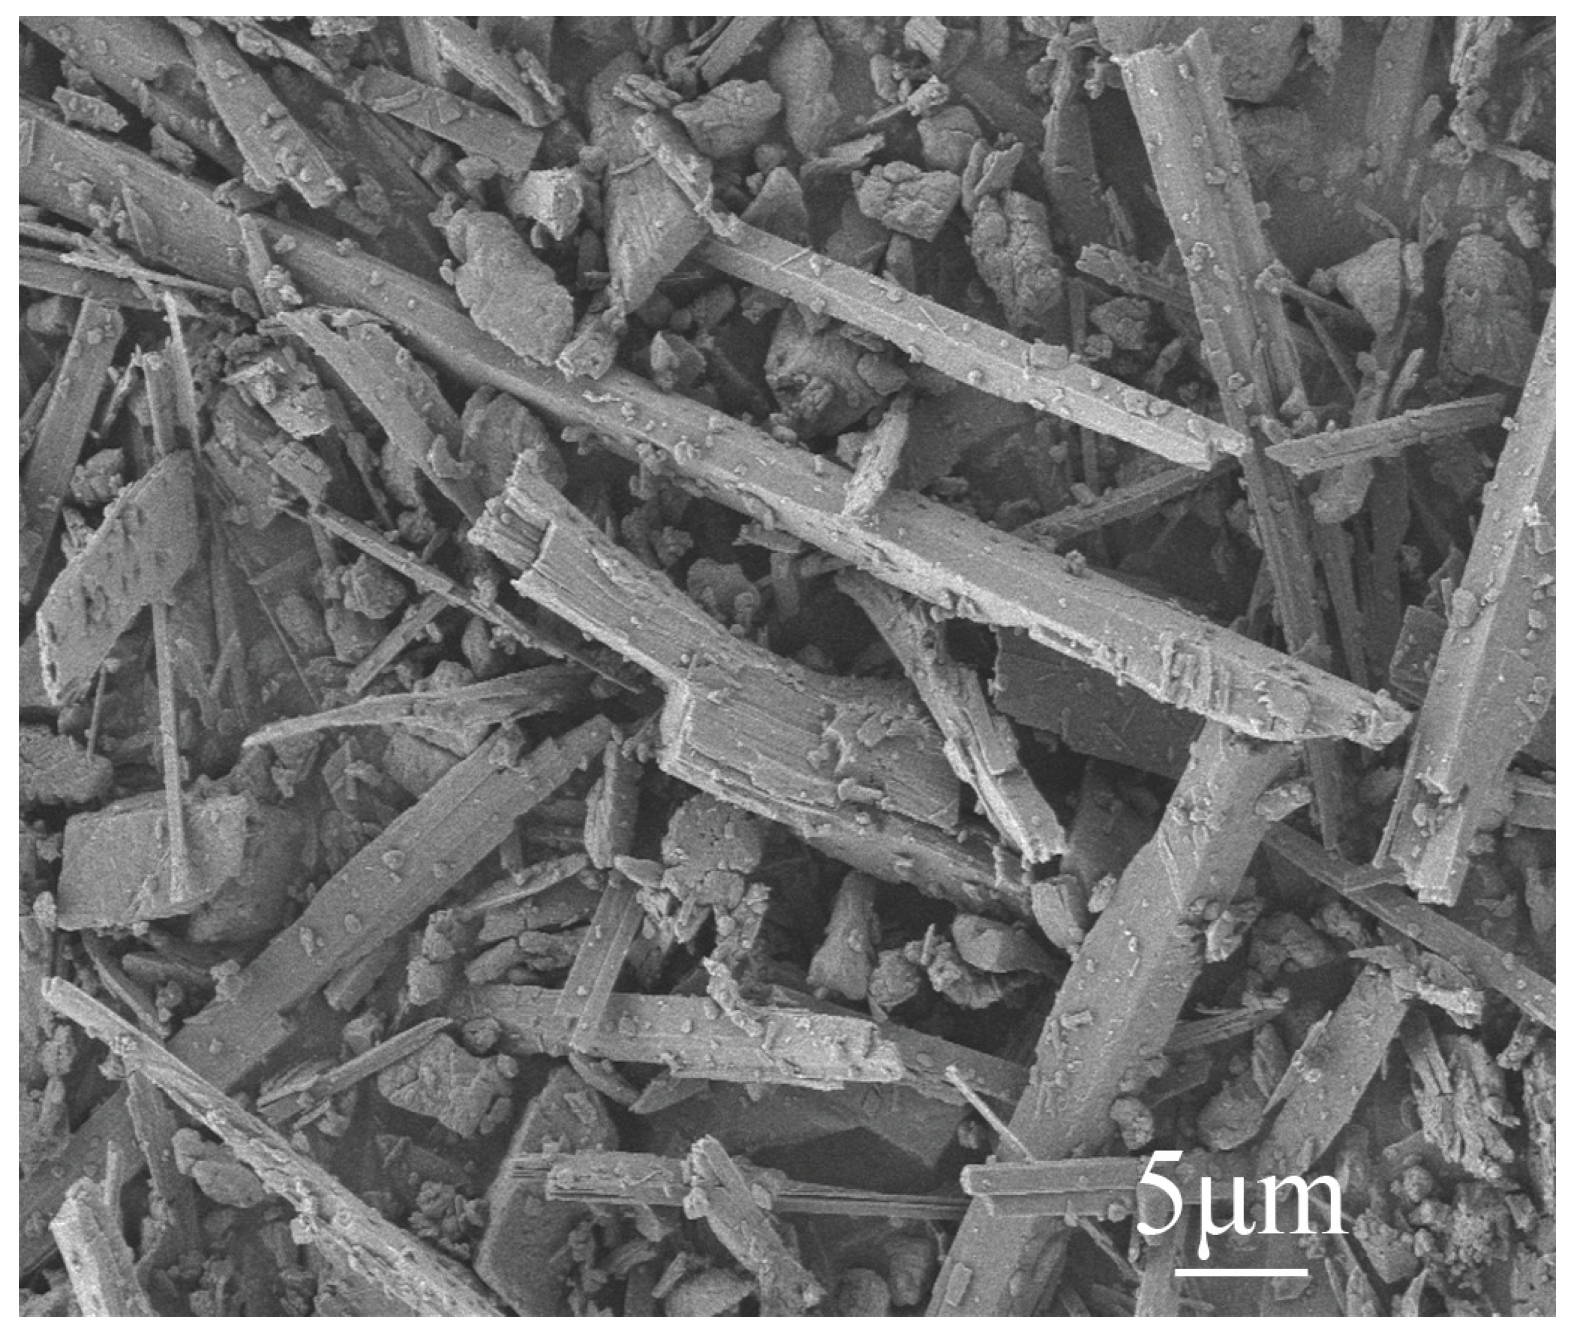
Figure 5.
SEM images of BF.
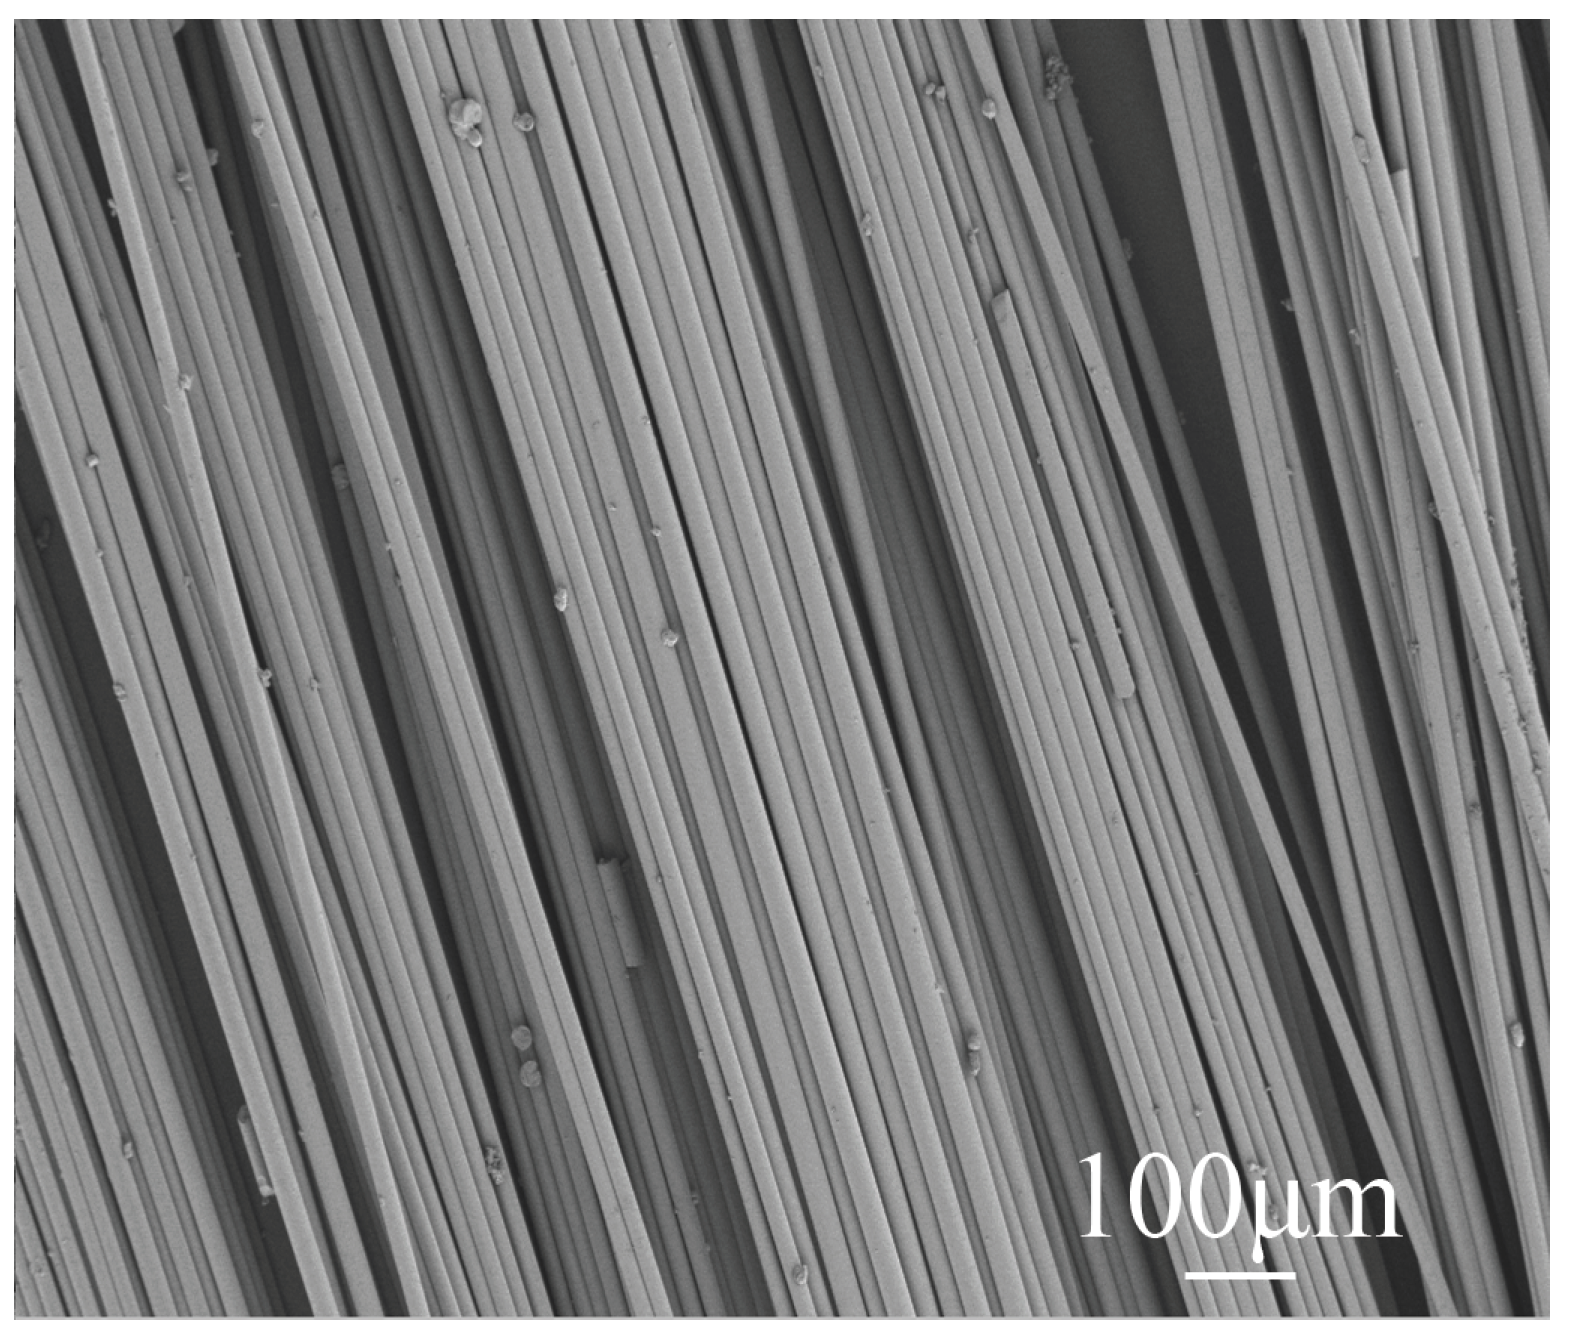
Figure 6.
Tensile test method and sample size(a: The tensile strength of the sample was tested by universal testing machine; b: Sample size, mm).
Figure 6.
Tensile test method and sample size(a: The tensile strength of the sample was tested by universal testing machine; b: Sample size, mm).
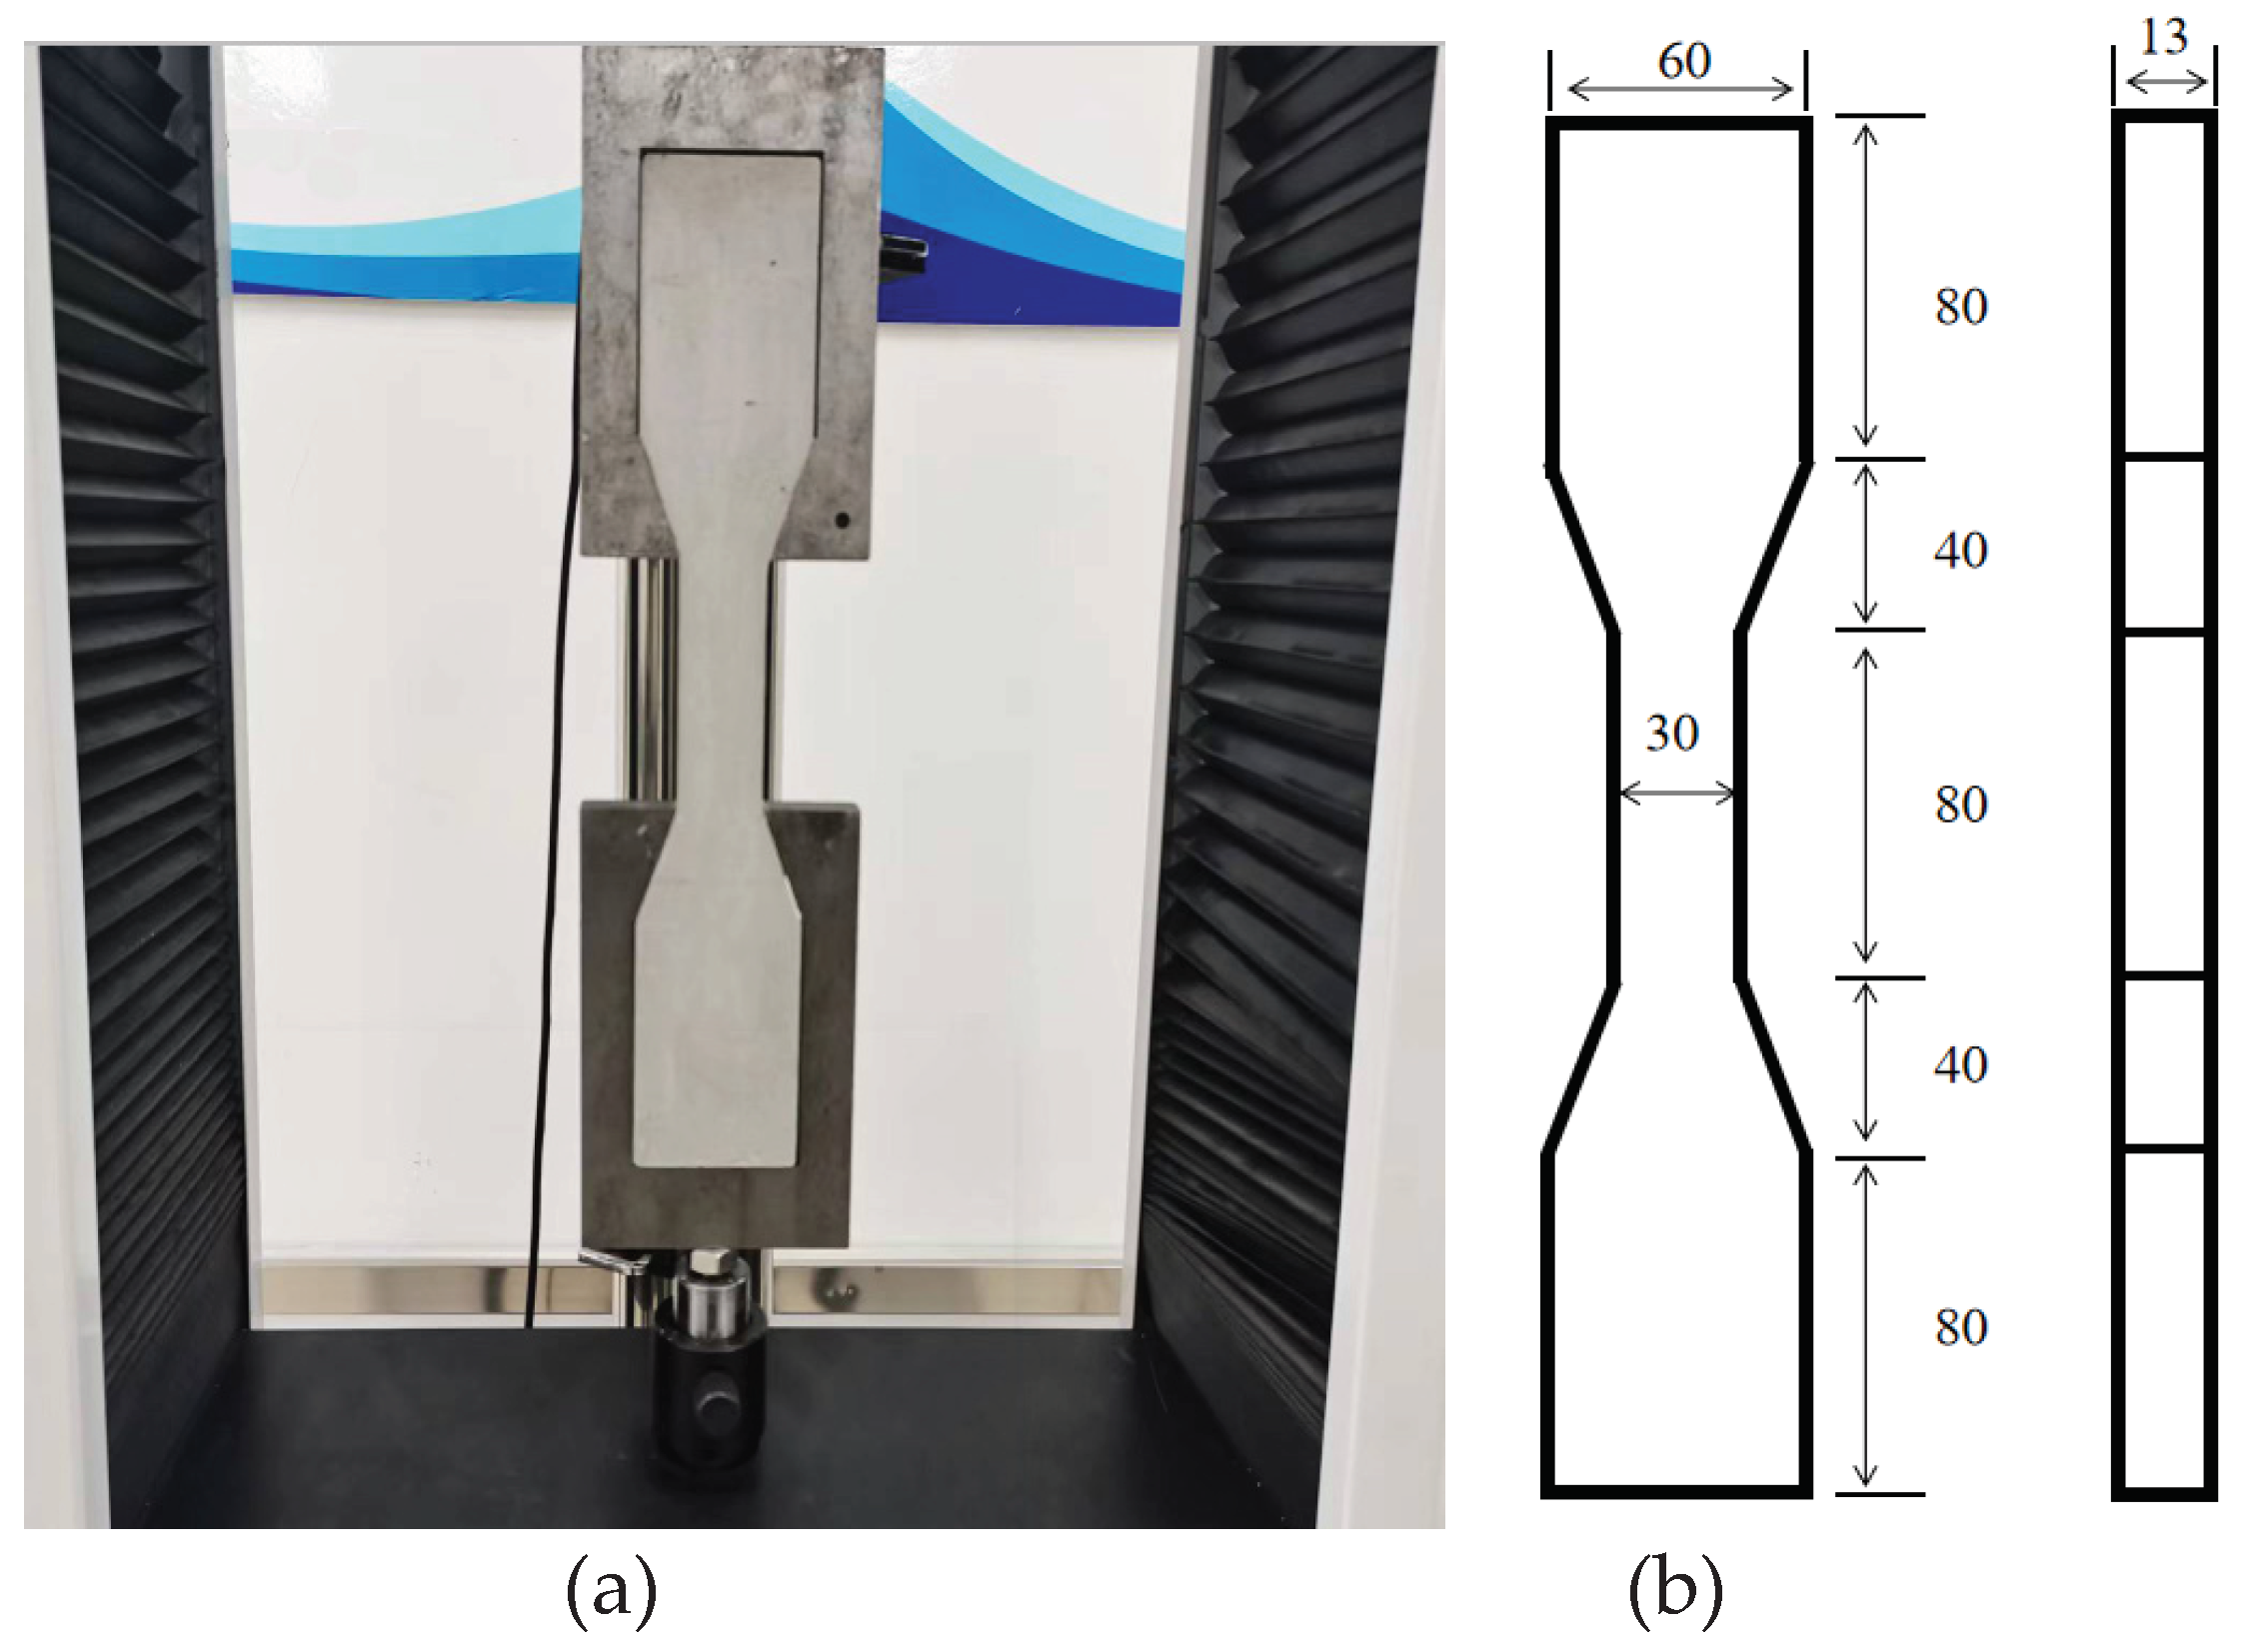
Figure 7.
Test results of flexural strength.
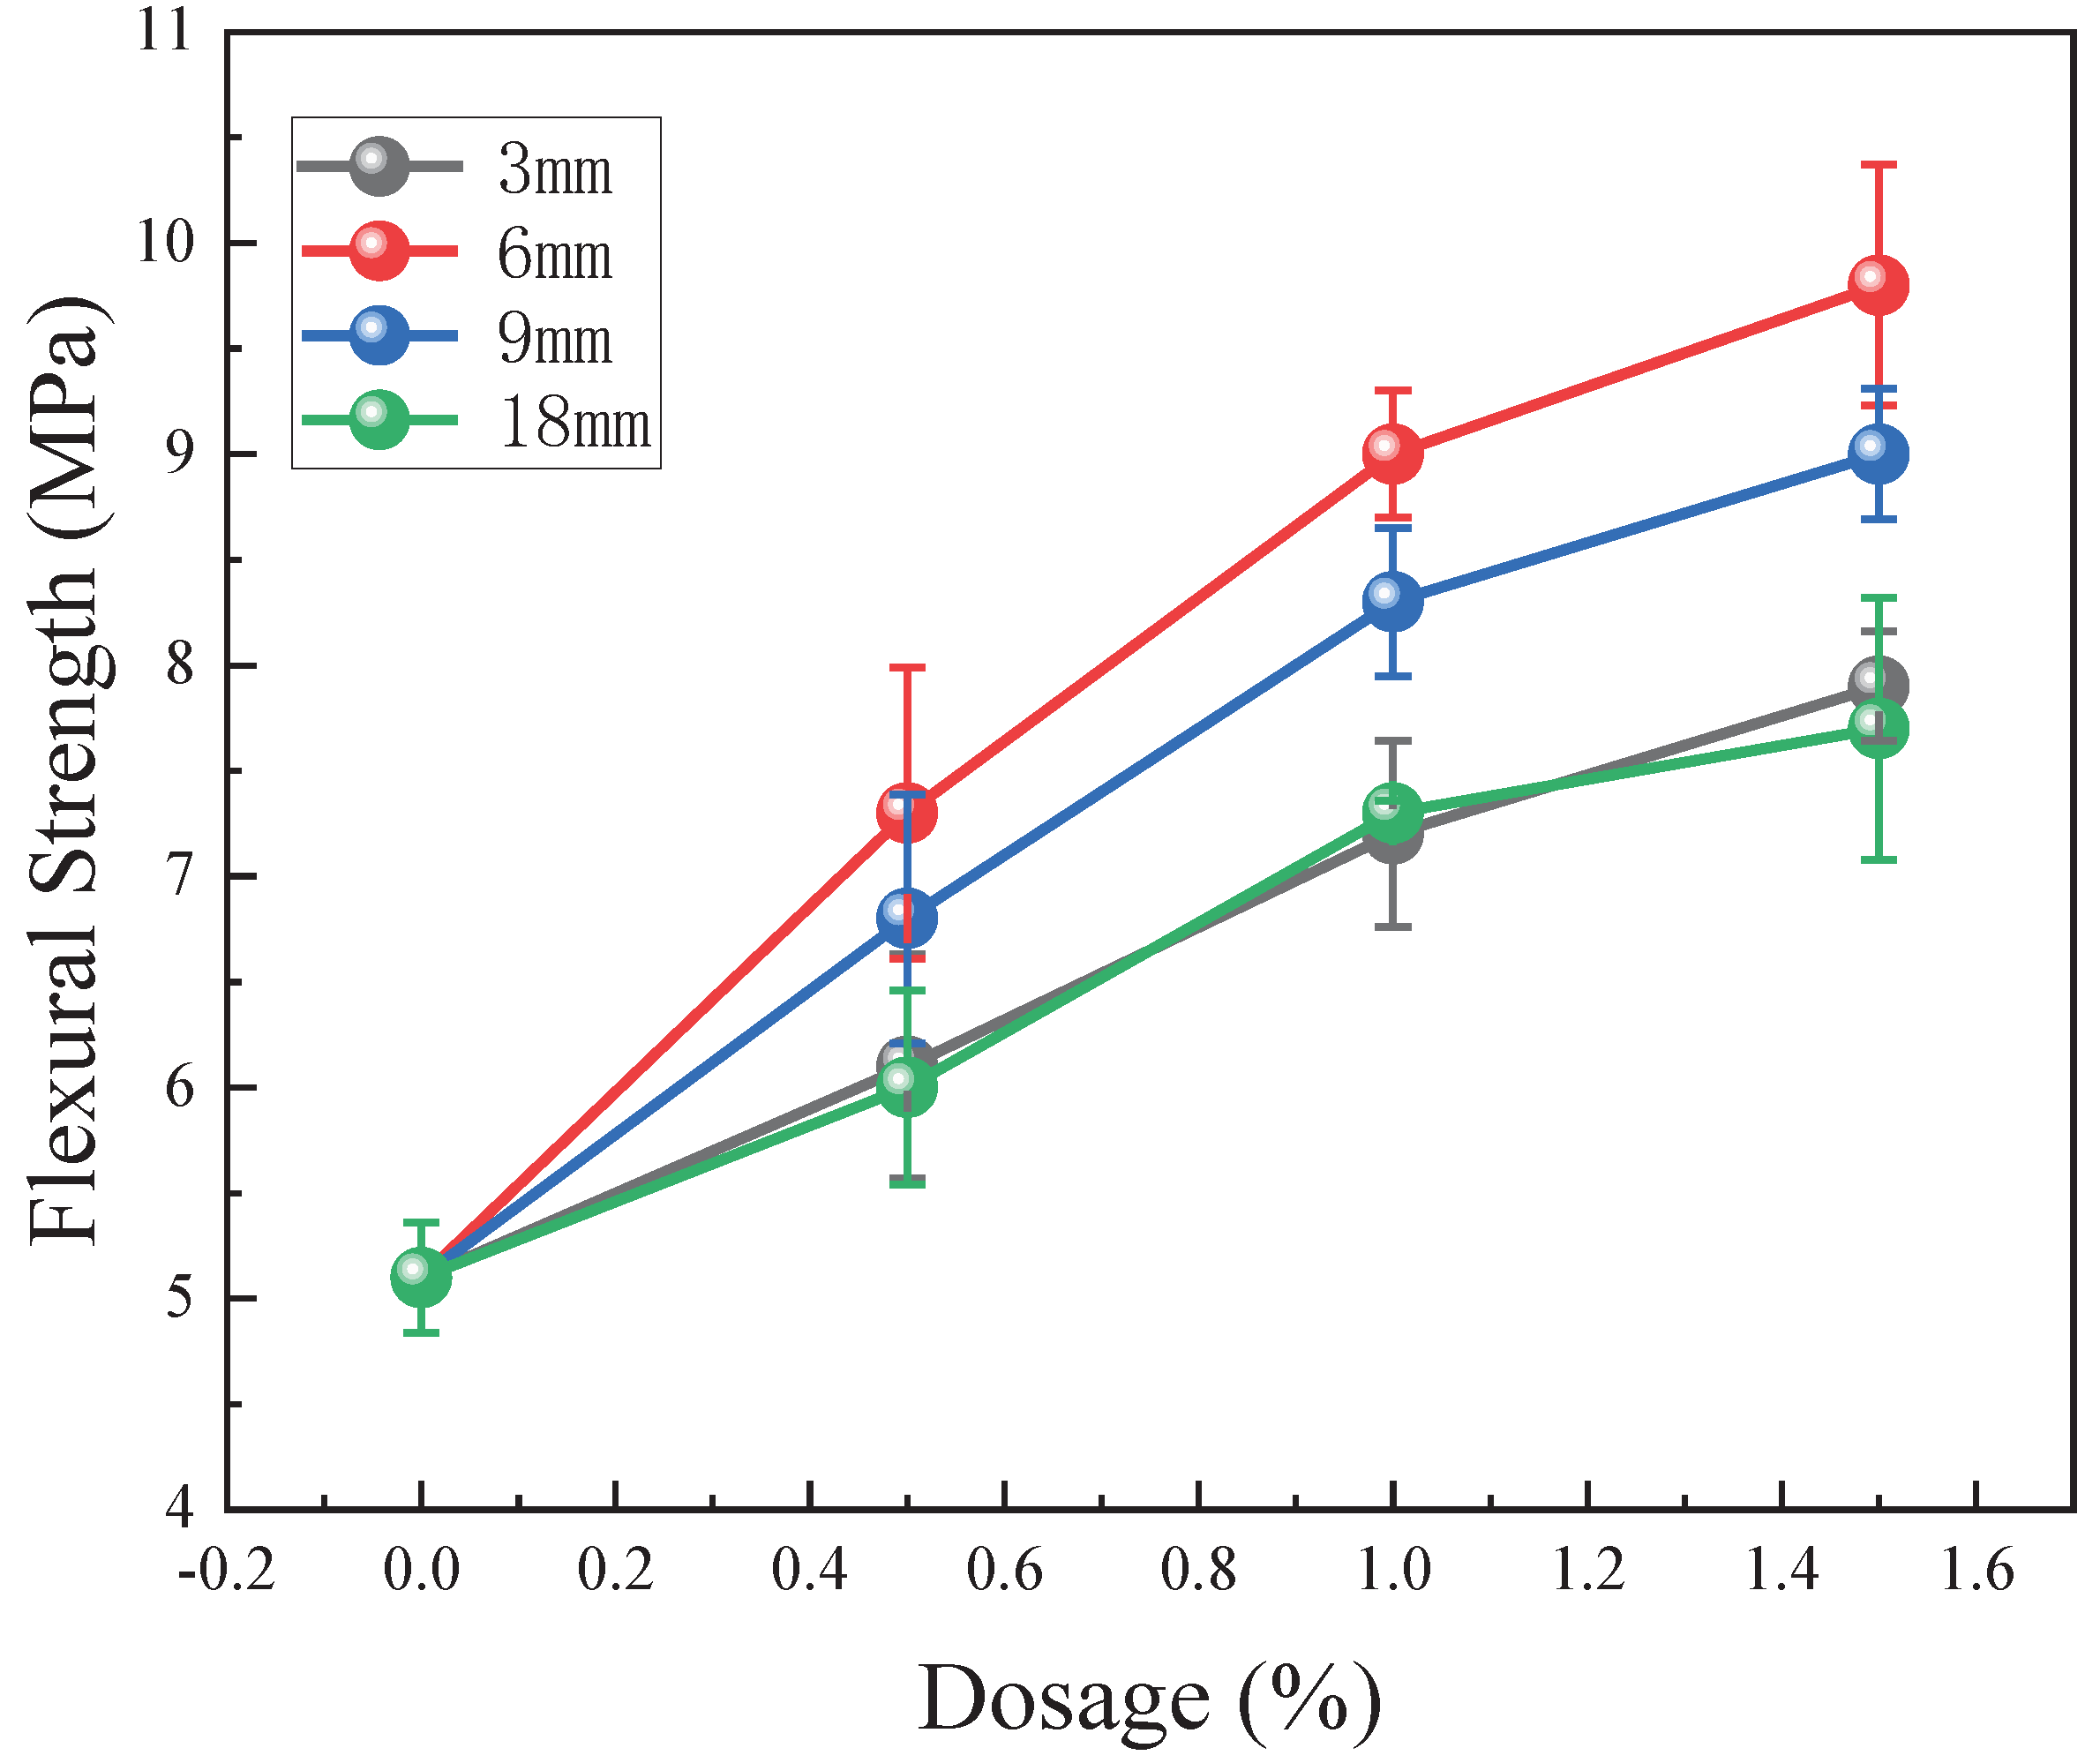
Figure 8.
Test results of compressive strength.
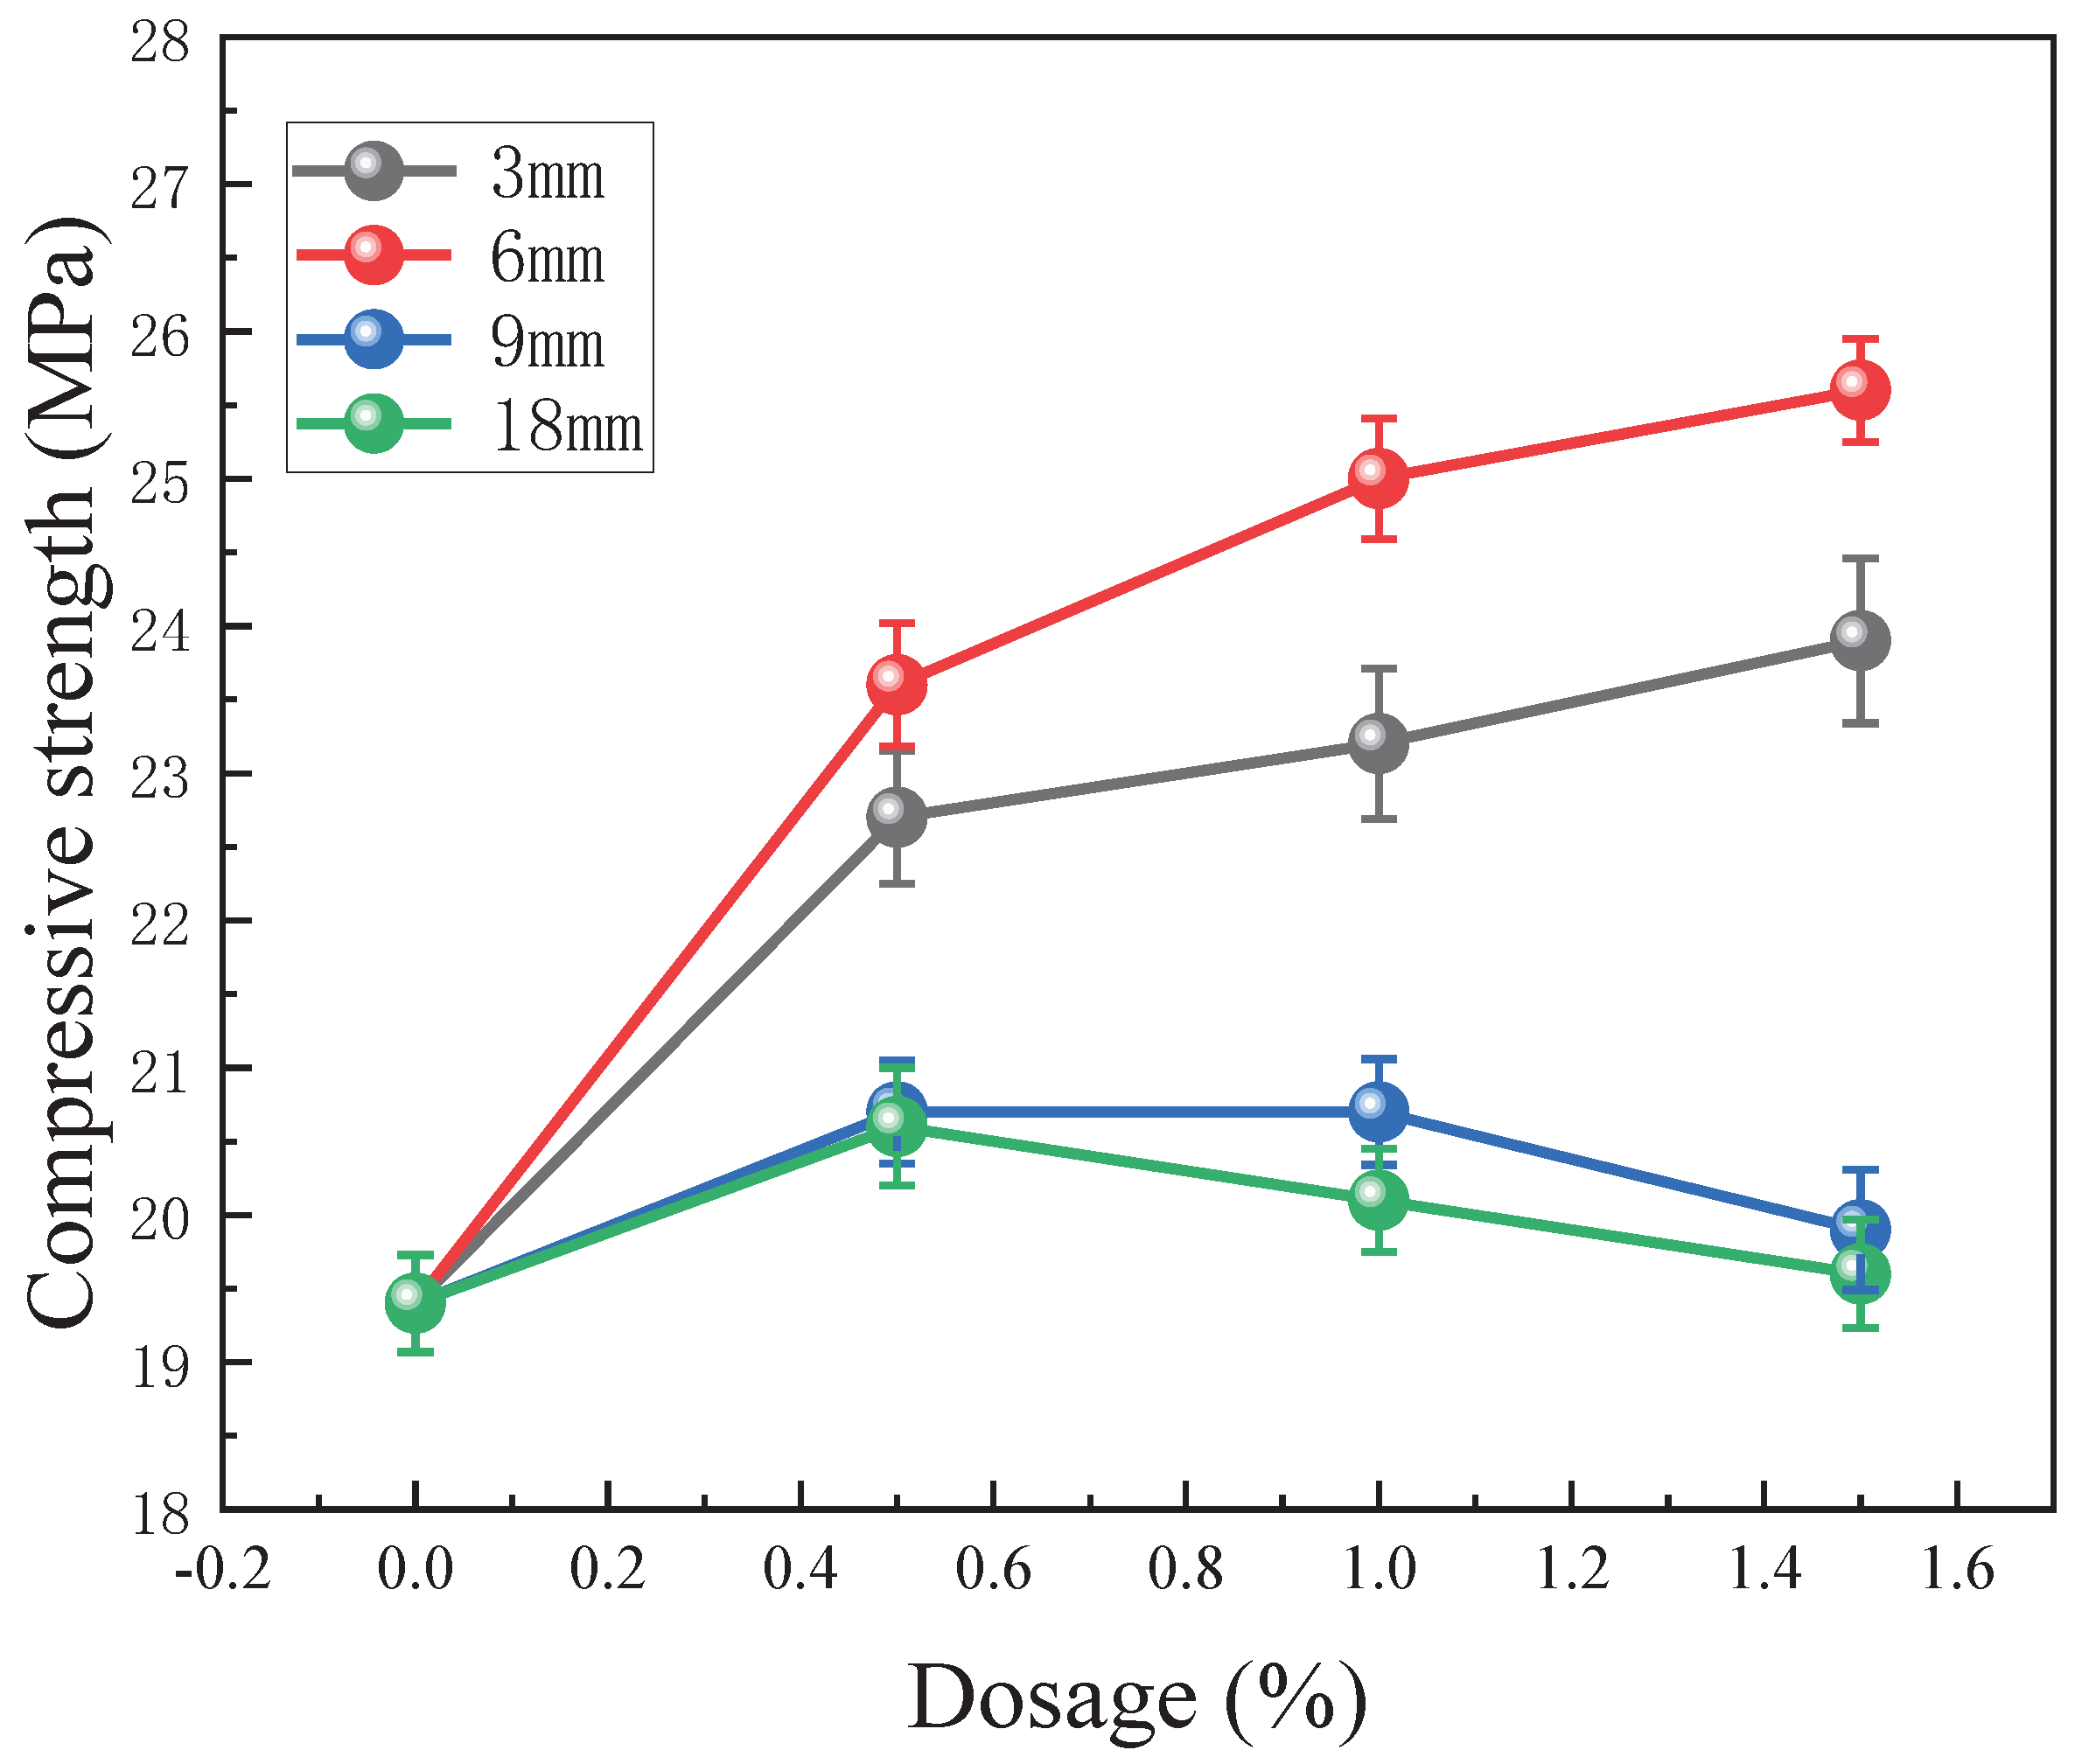
Figure 9.
The flexural-compressive ratio of the samples (3/0.5 represents the test group with a 3mm BFs content of 0.5%, and others are similar.).
Figure 9.
The flexural-compressive ratio of the samples (3/0.5 represents the test group with a 3mm BFs content of 0.5%, and others are similar.).
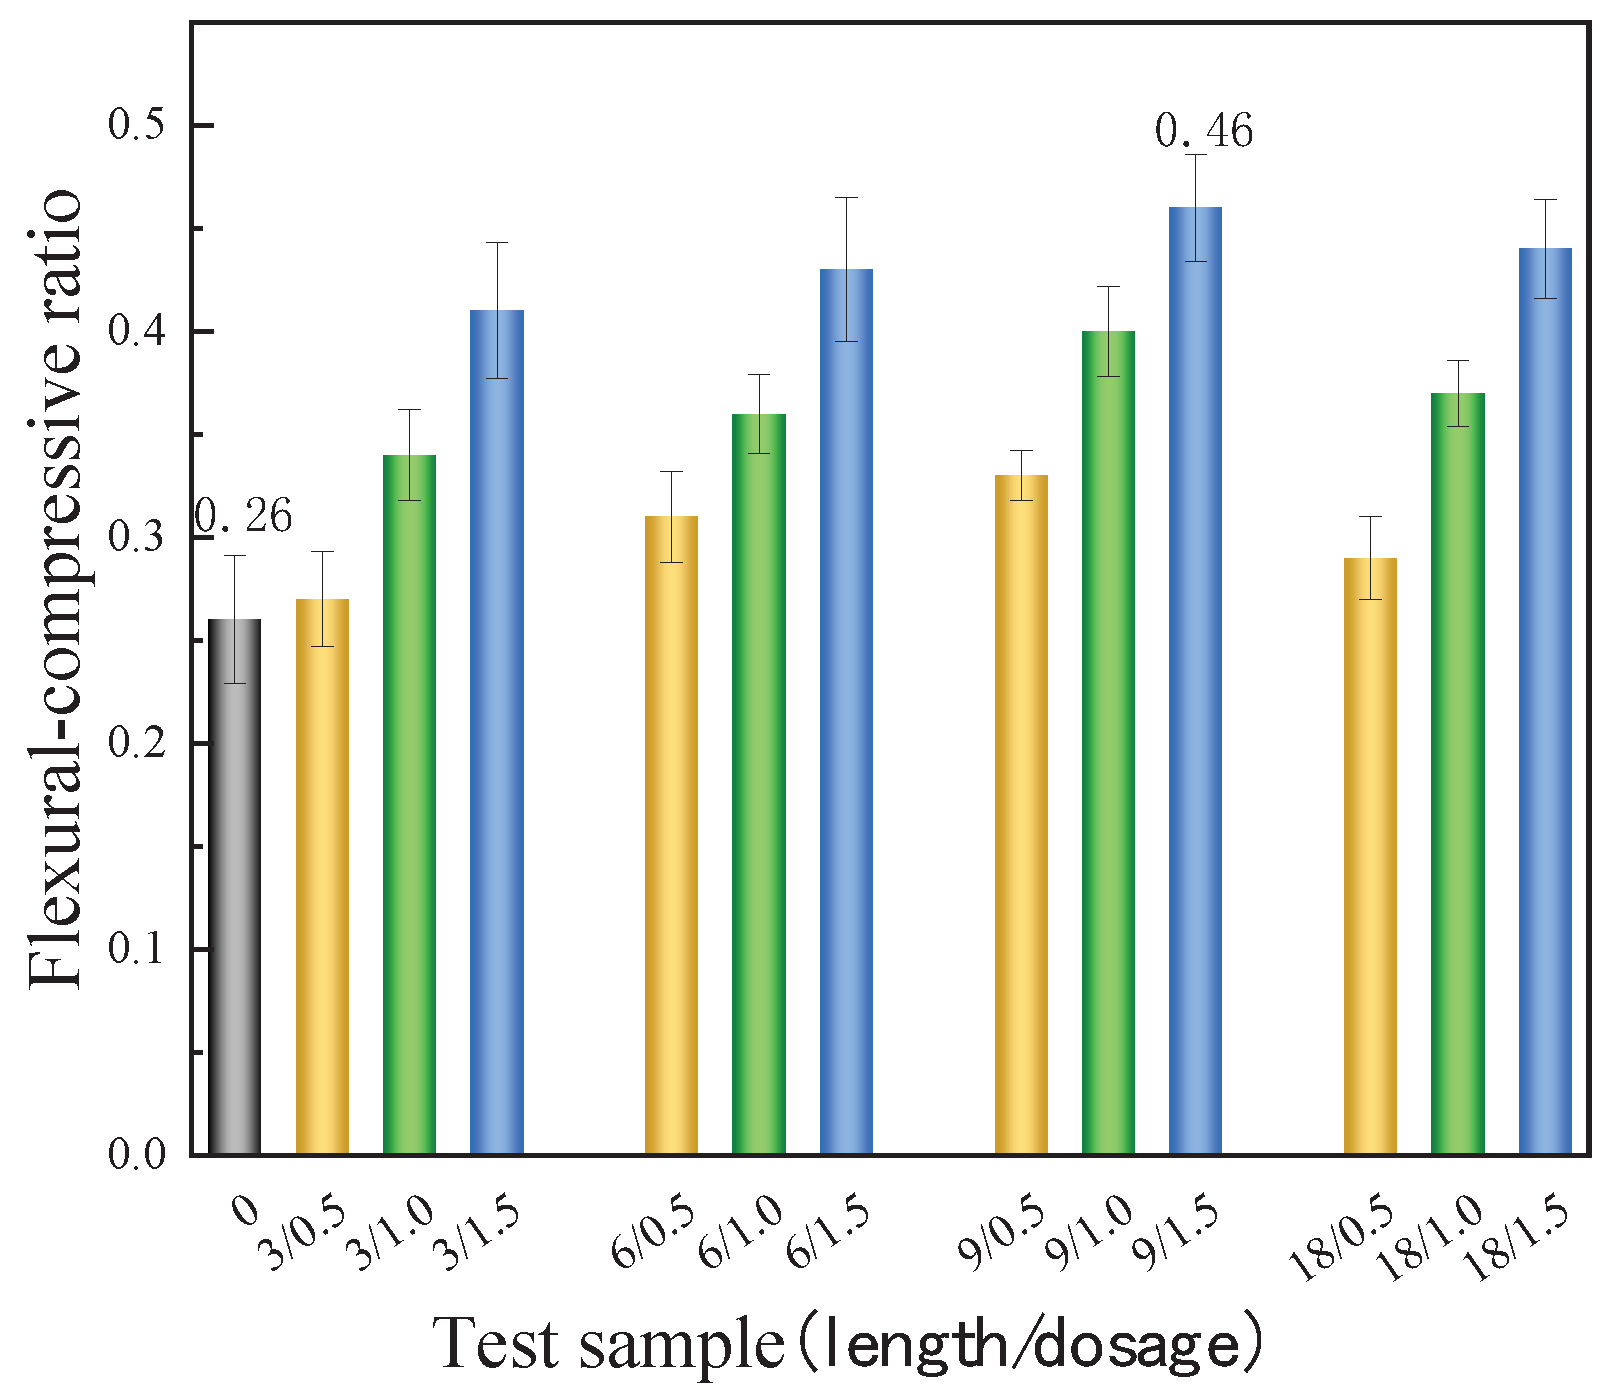
Figure 10.
Test results of water absorption and softening coefficient.
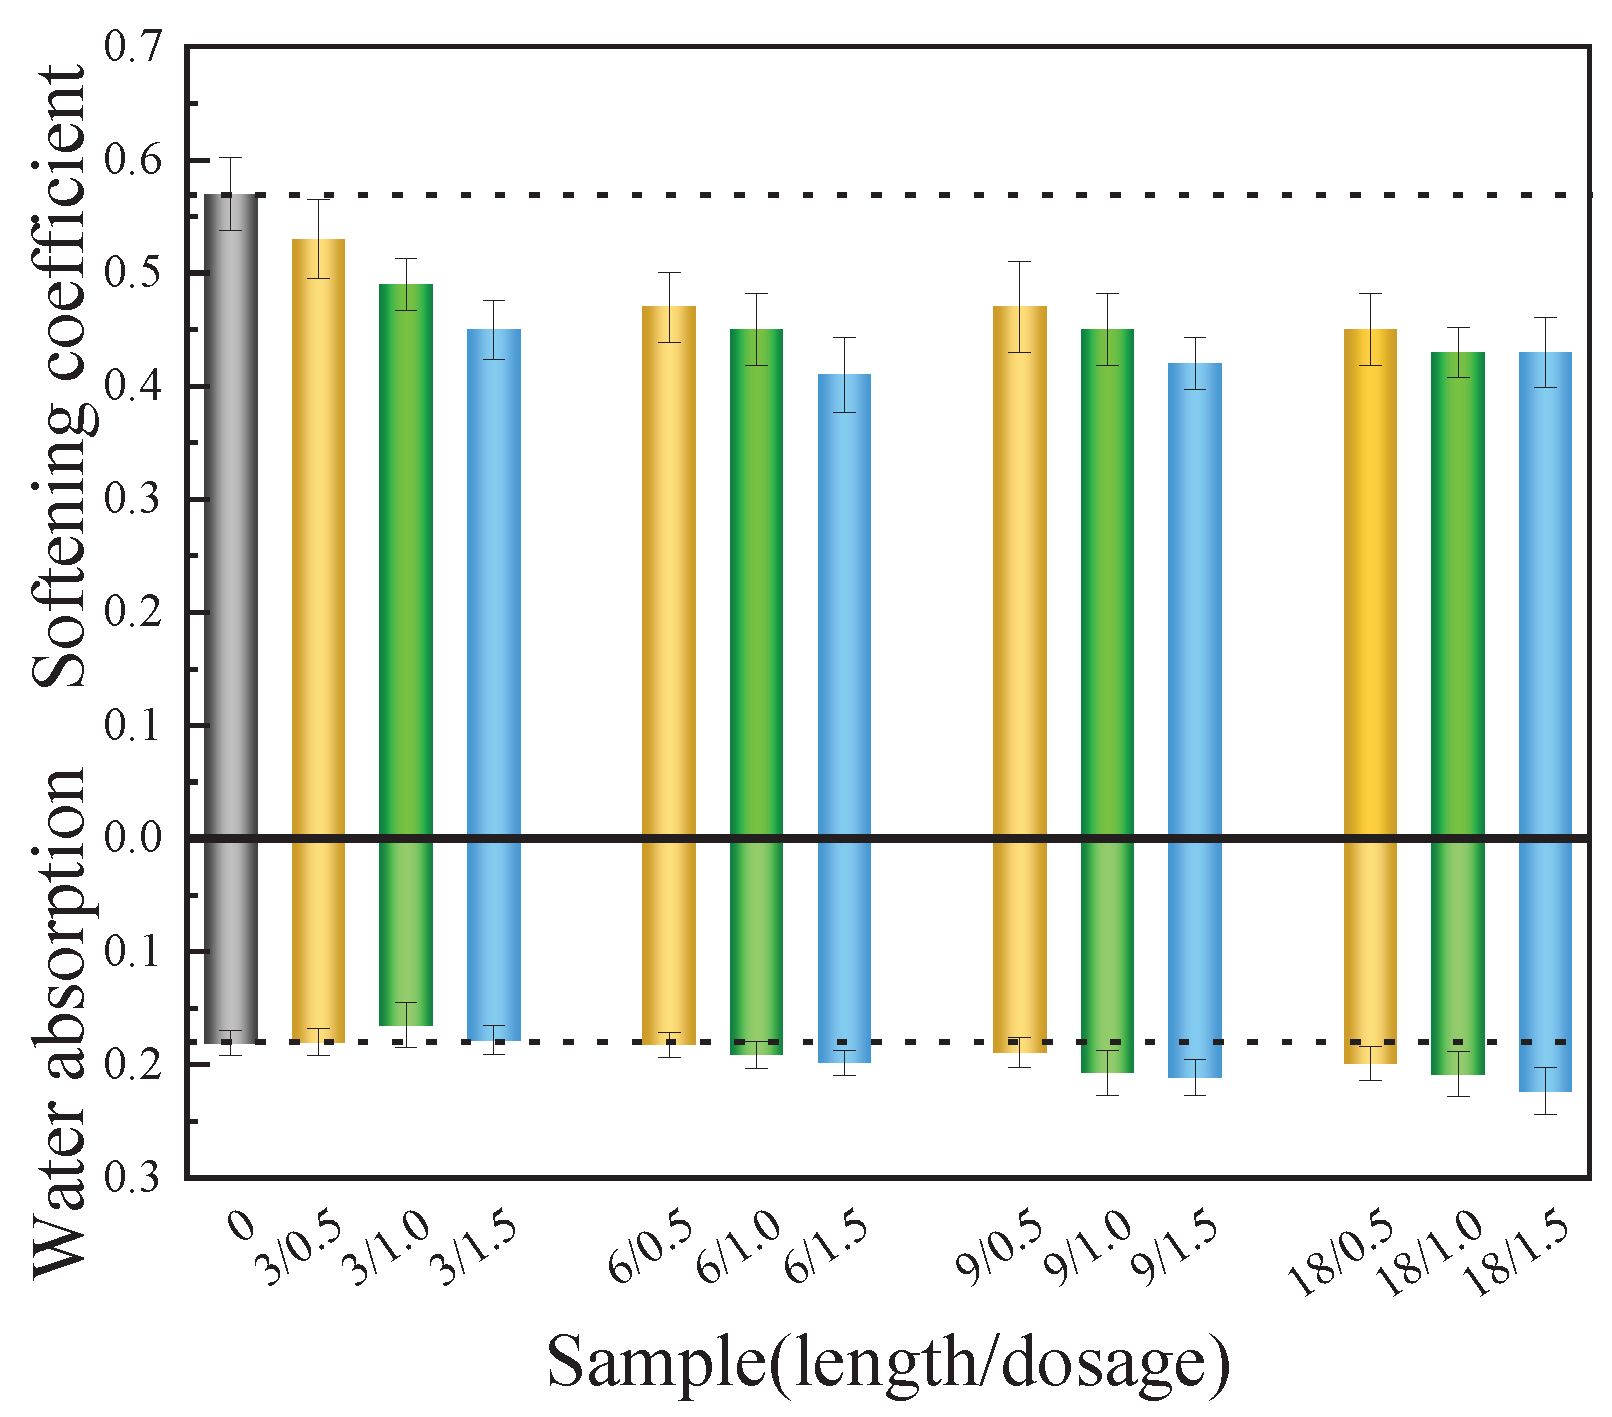
Figure 11.
Tensile strength test results (a:Average tensile strength; b:Typical stress-strain curve).
Figure 11.
Tensile strength test results (a:Average tensile strength; b:Typical stress-strain curve).
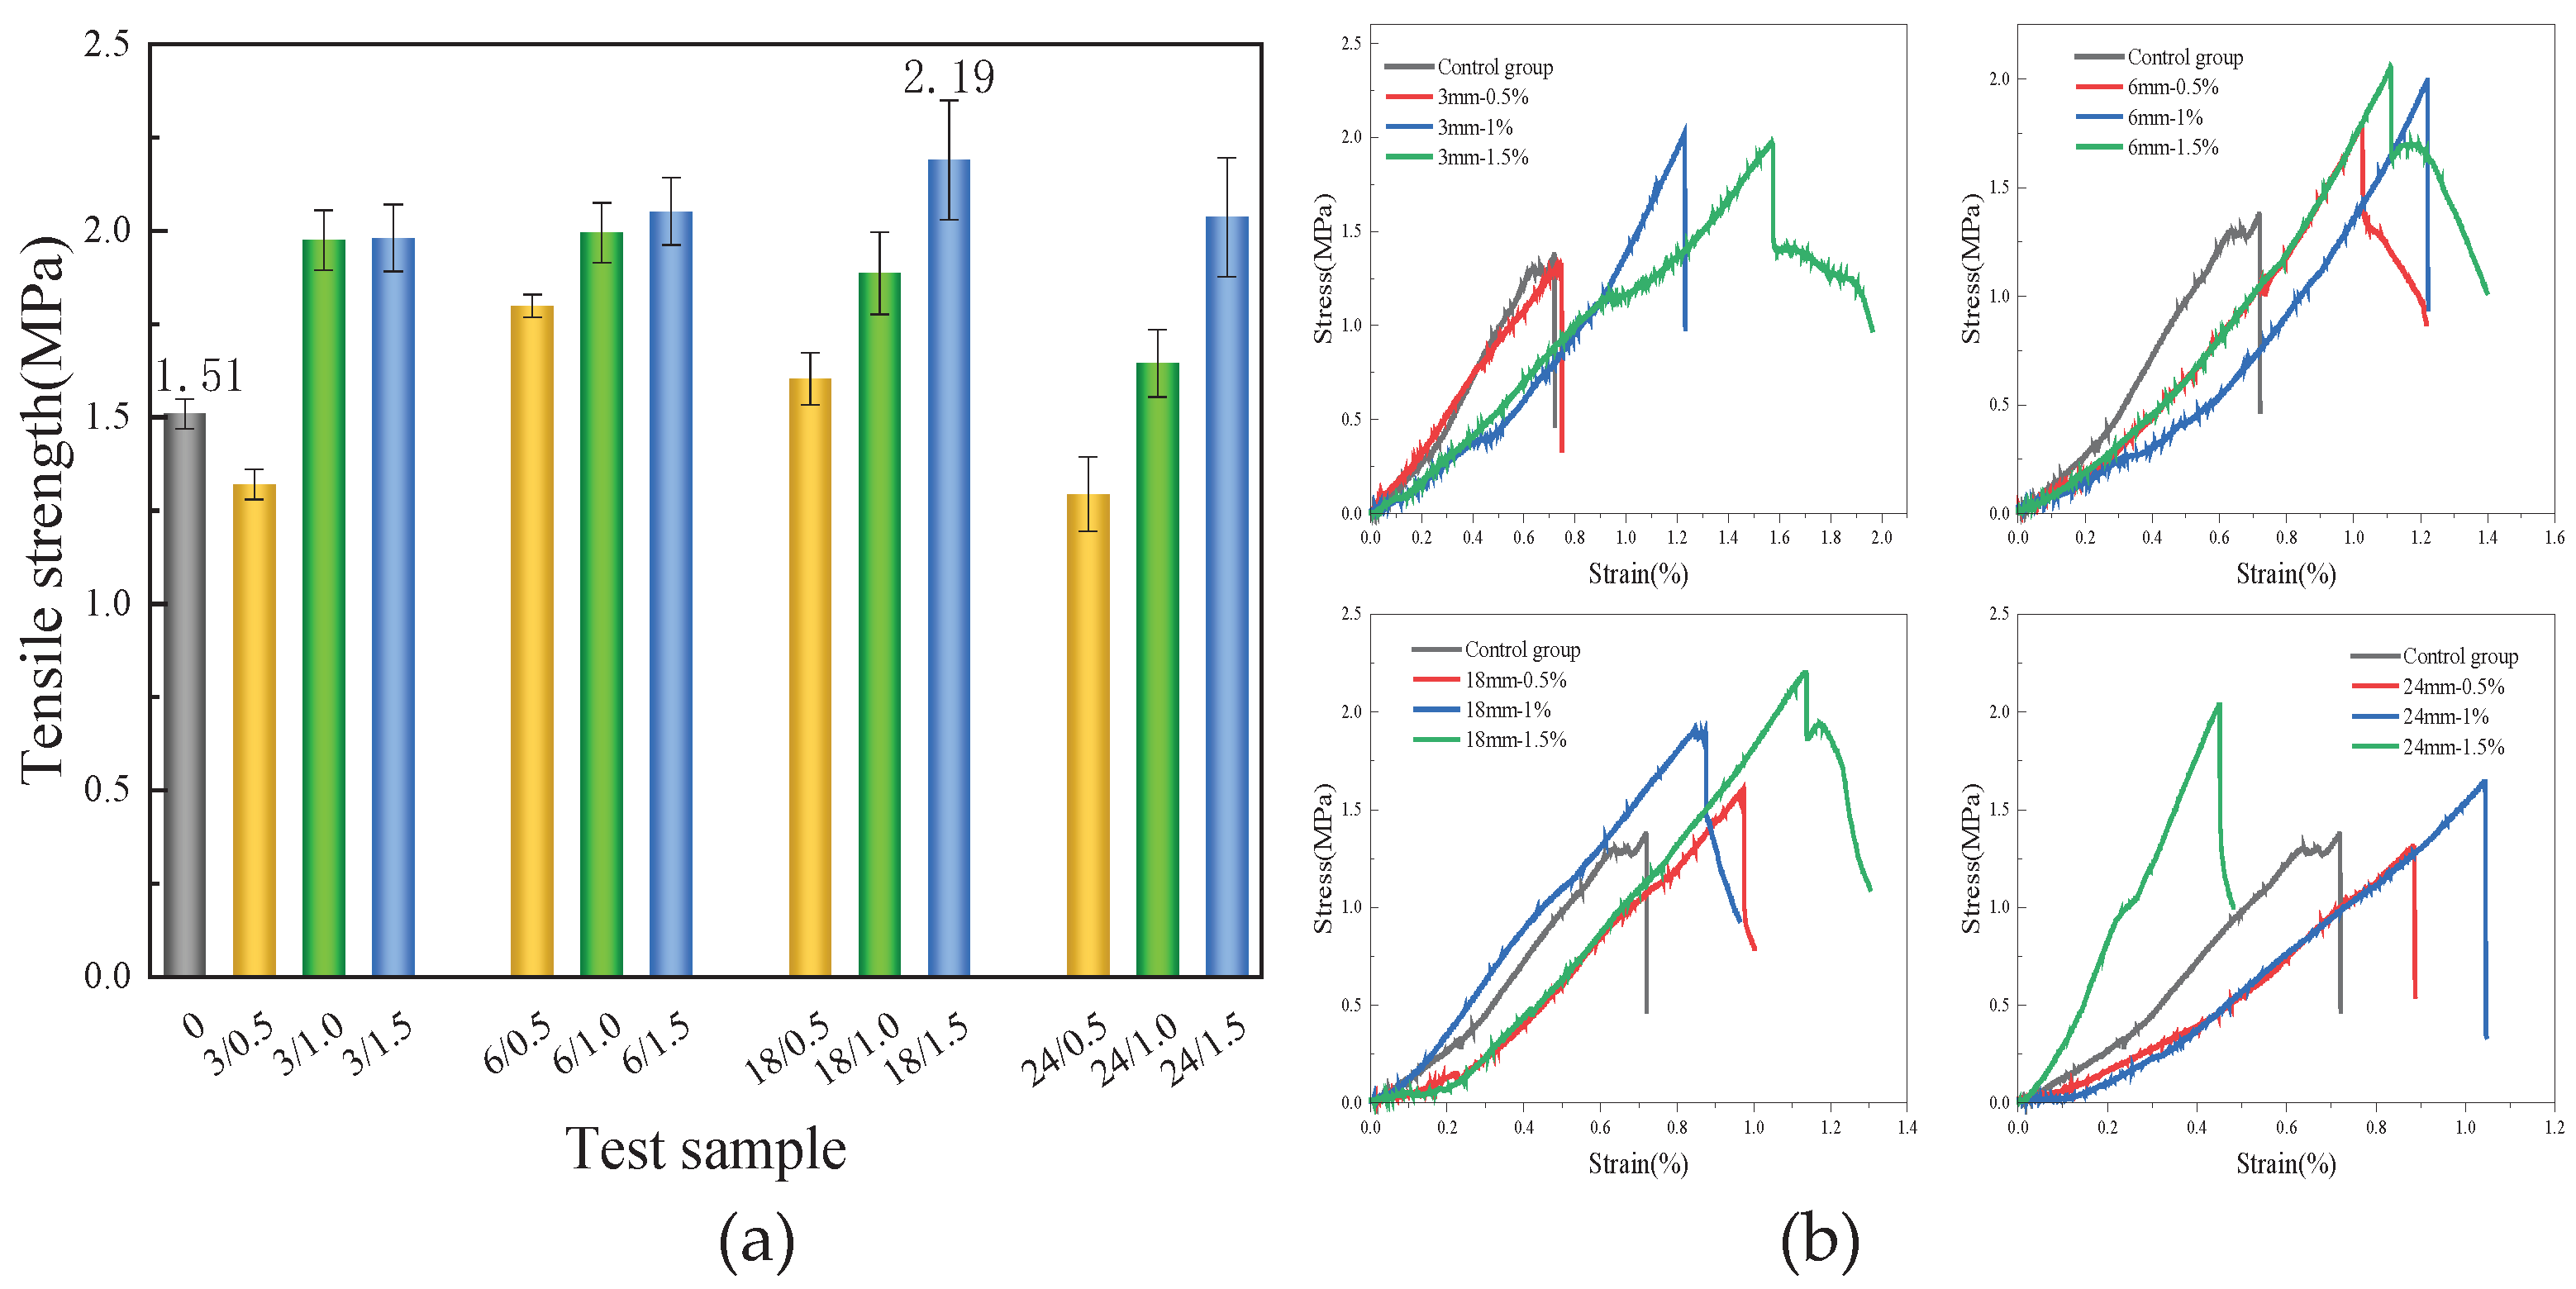
Figure 12.
Flexural strength of gypsum samples mixed with BFs and CW (0.5/0.5 means that the content of 6mm BFs and CW is 0.5% and 0.5% respectively, and the rest are similar.).
Figure 12.
Flexural strength of gypsum samples mixed with BFs and CW (0.5/0.5 means that the content of 6mm BFs and CW is 0.5% and 0.5% respectively, and the rest are similar.).
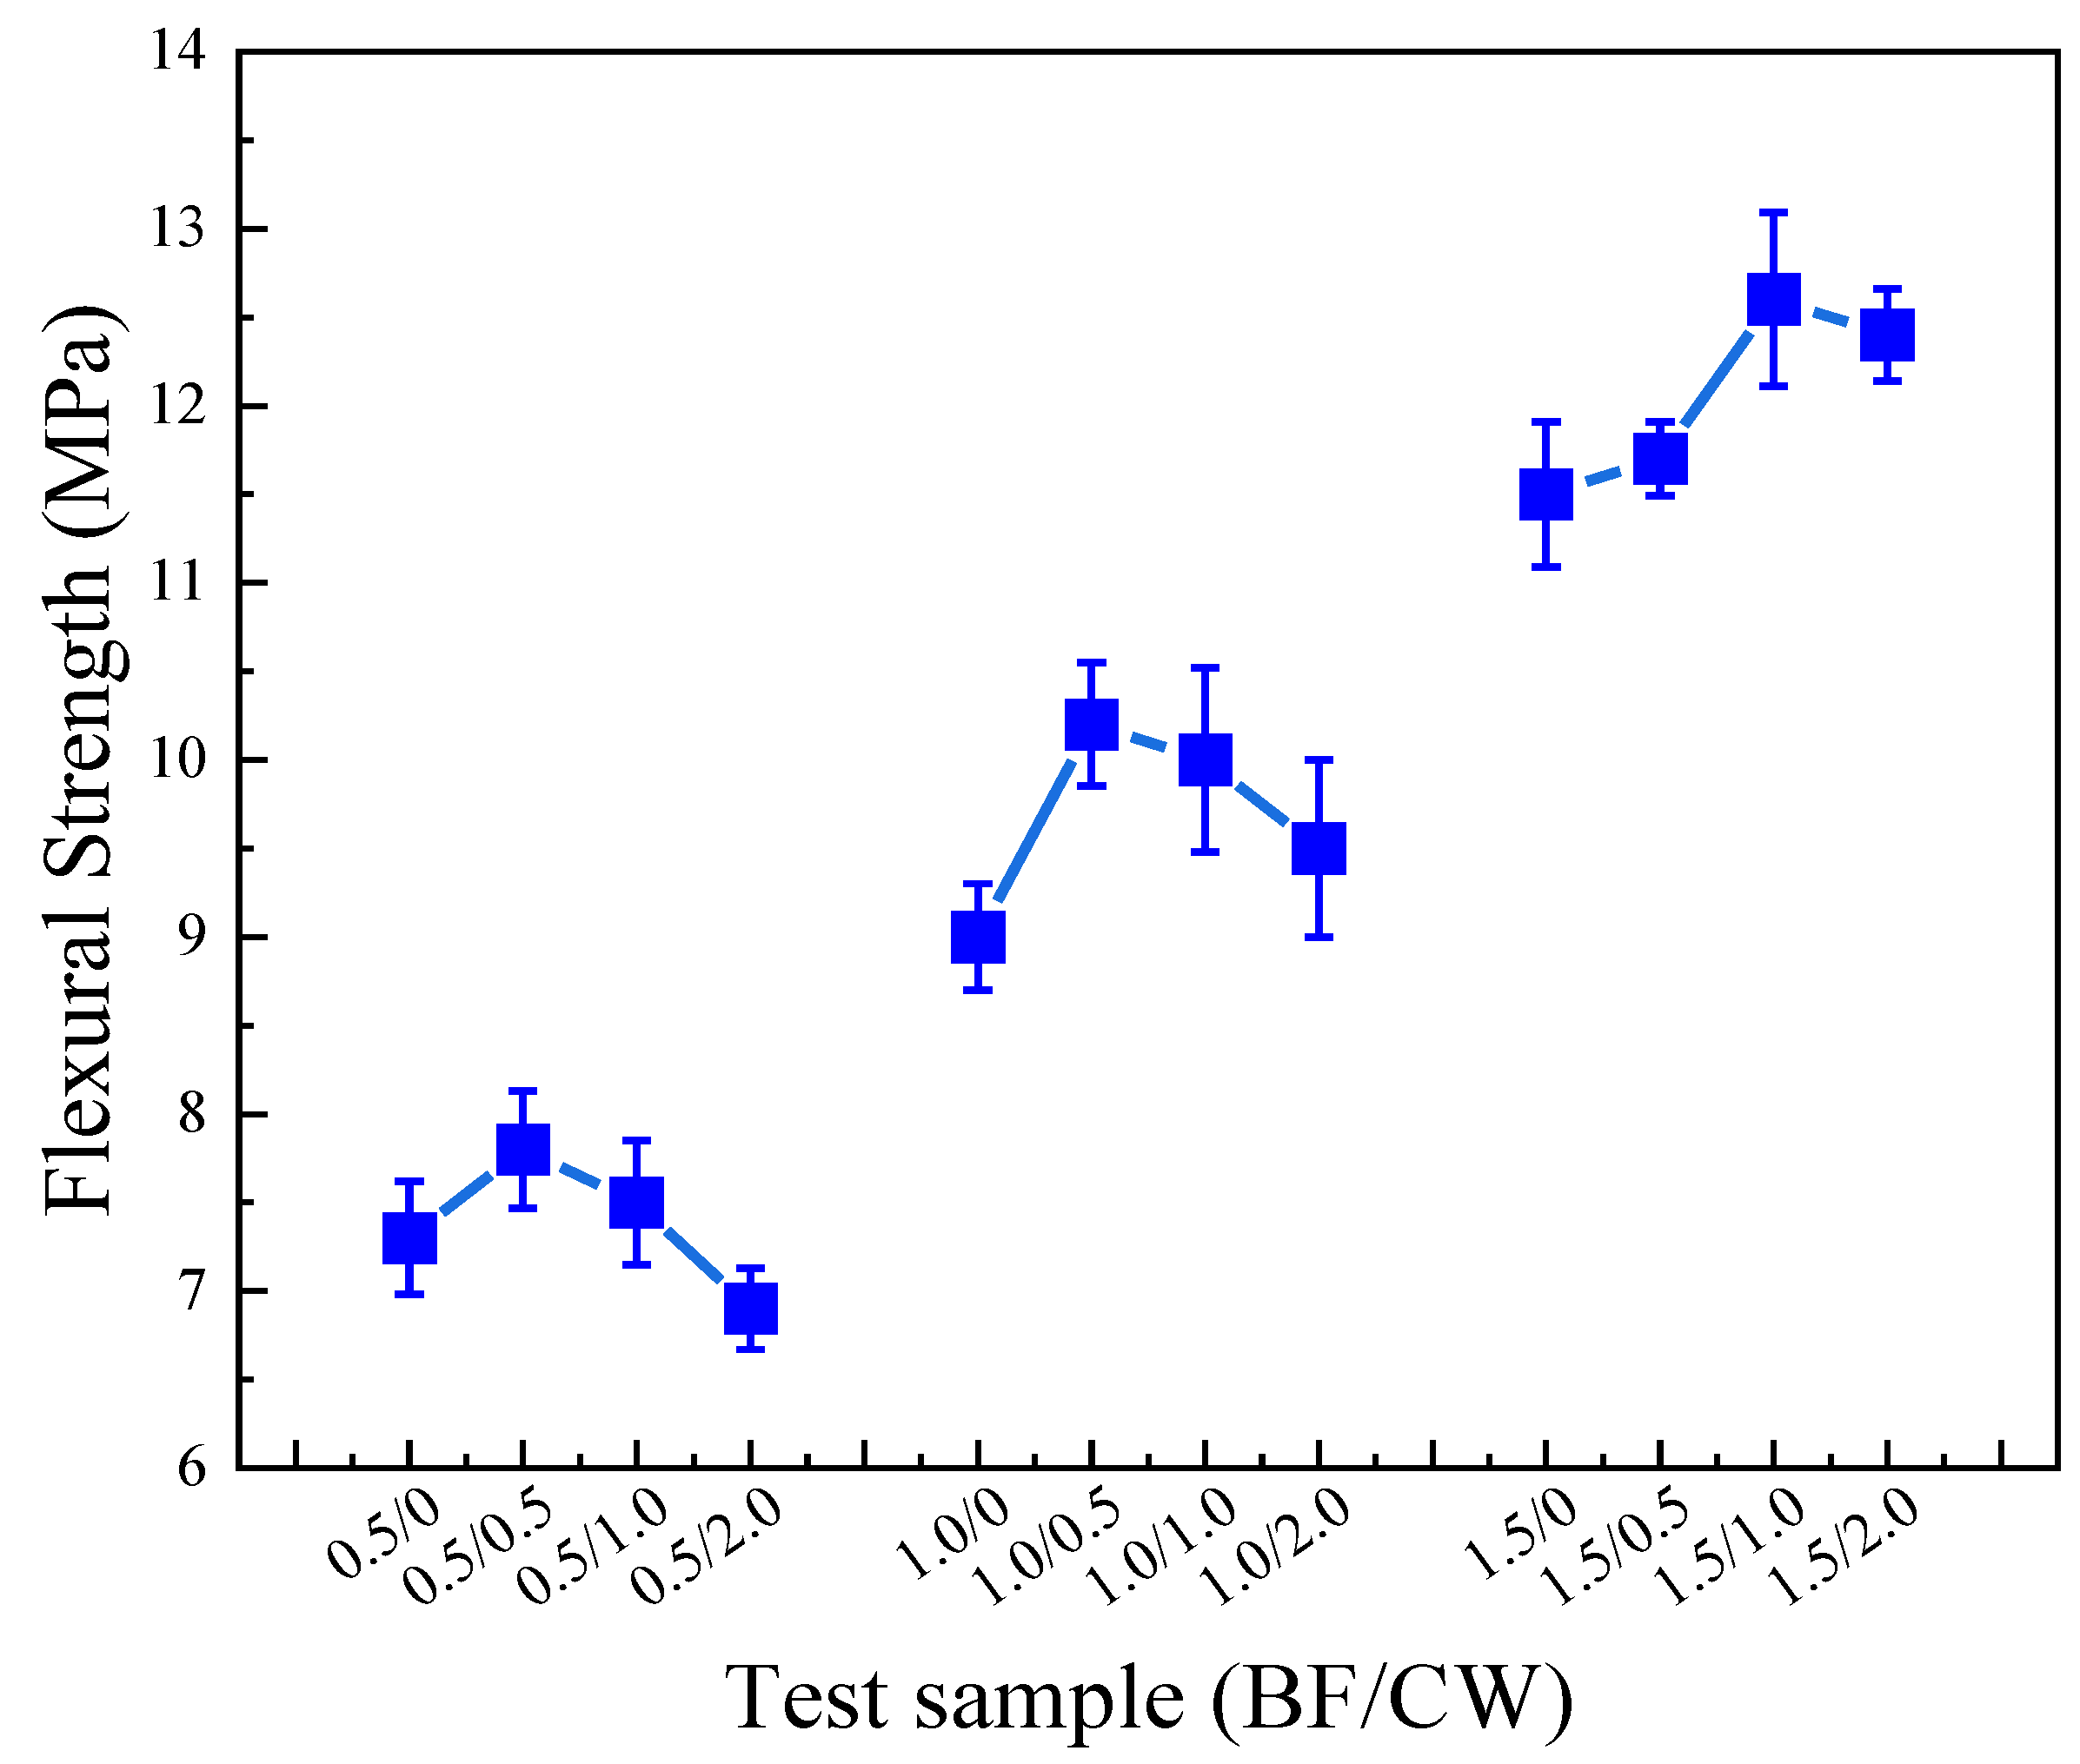
Figure 13.
Failure pattern of sample (a: 1.5% BF; b: 1.5% BF+2.0% CW).
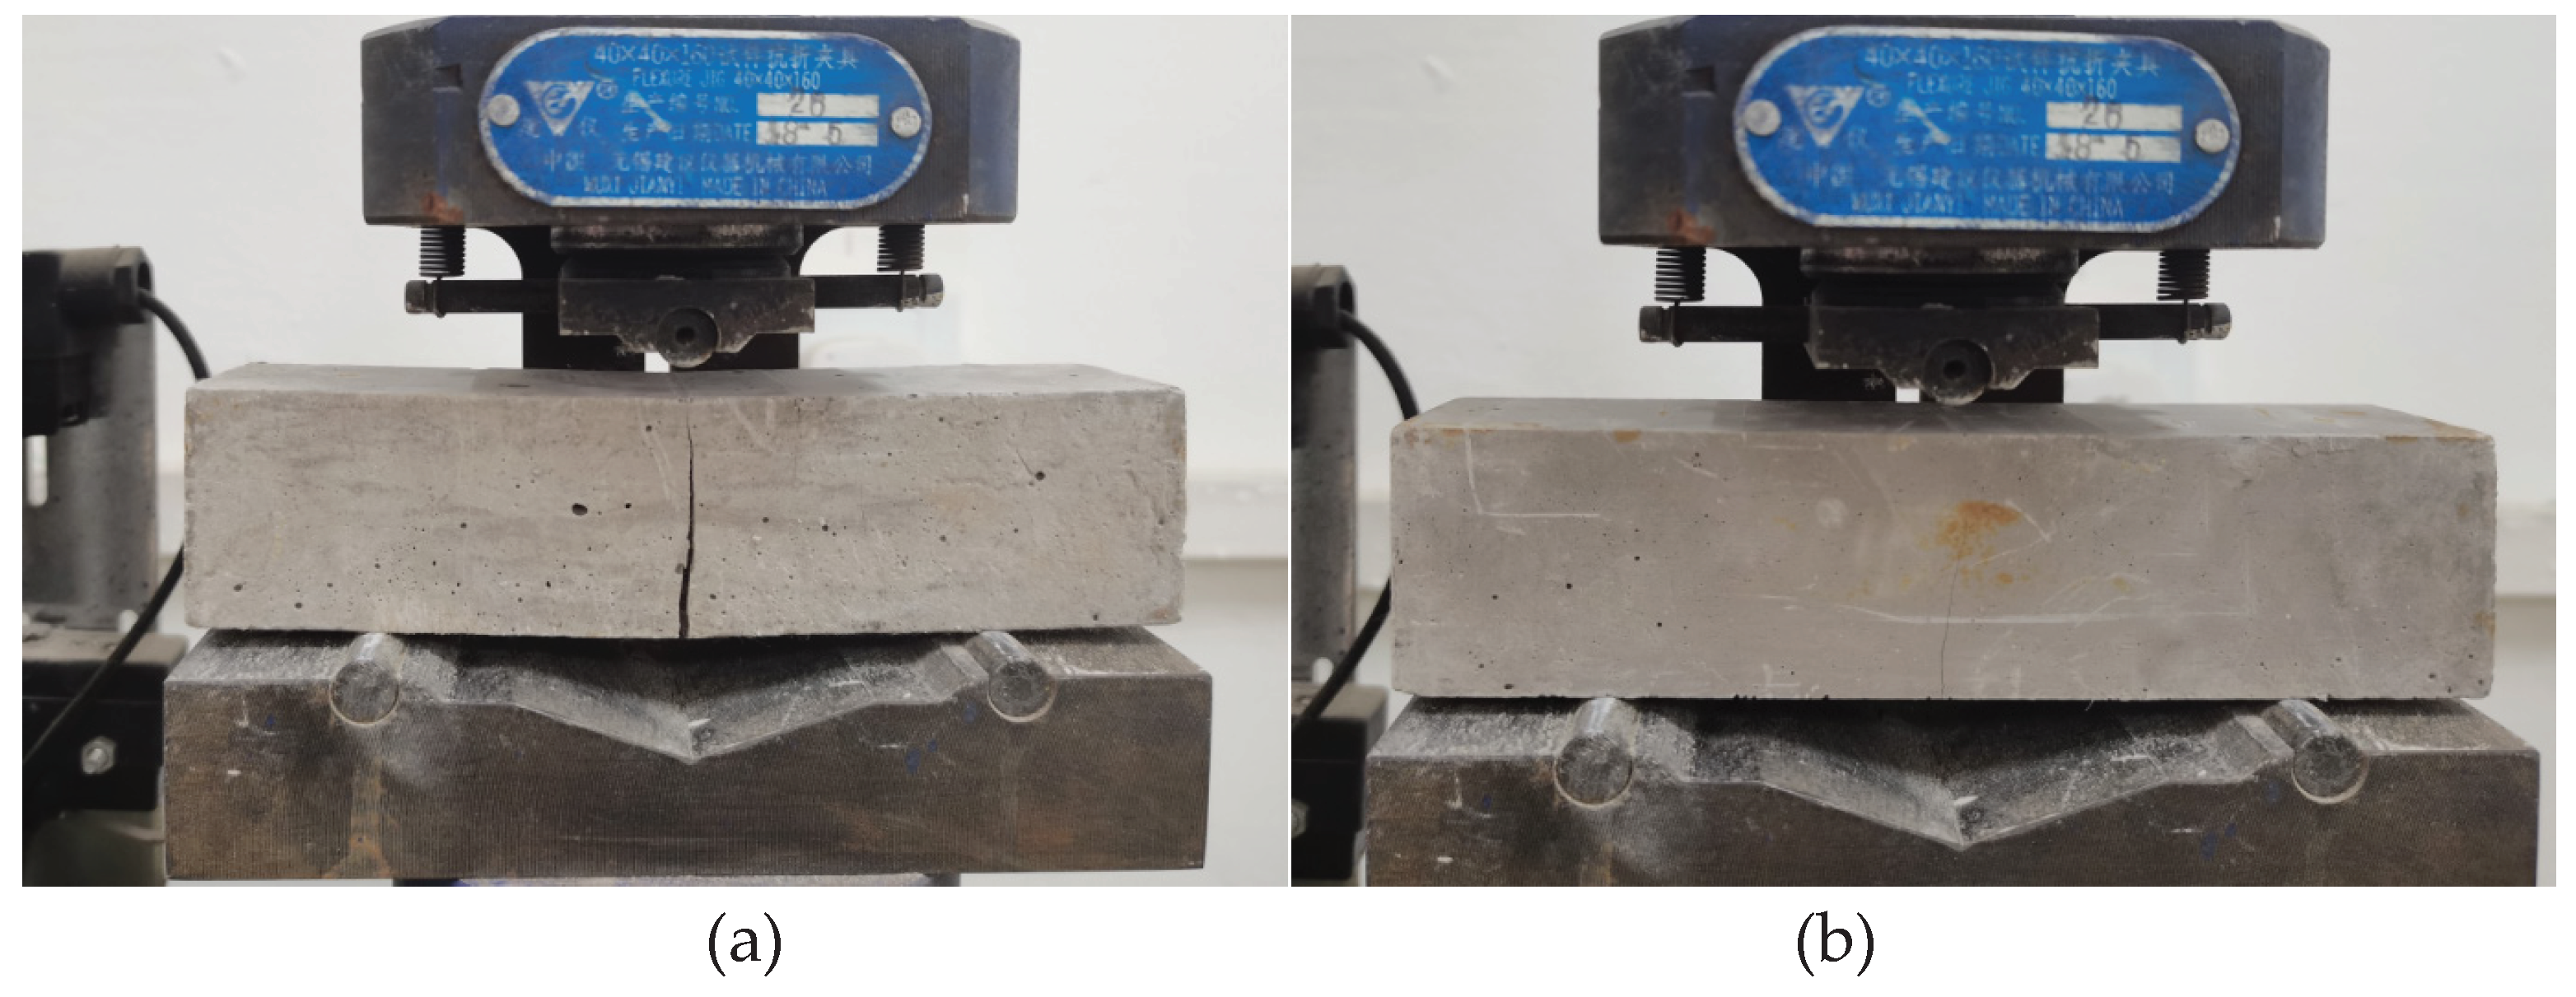
Figure 14.
Compressive strength of gypsum samples mixed with BFs and CW.
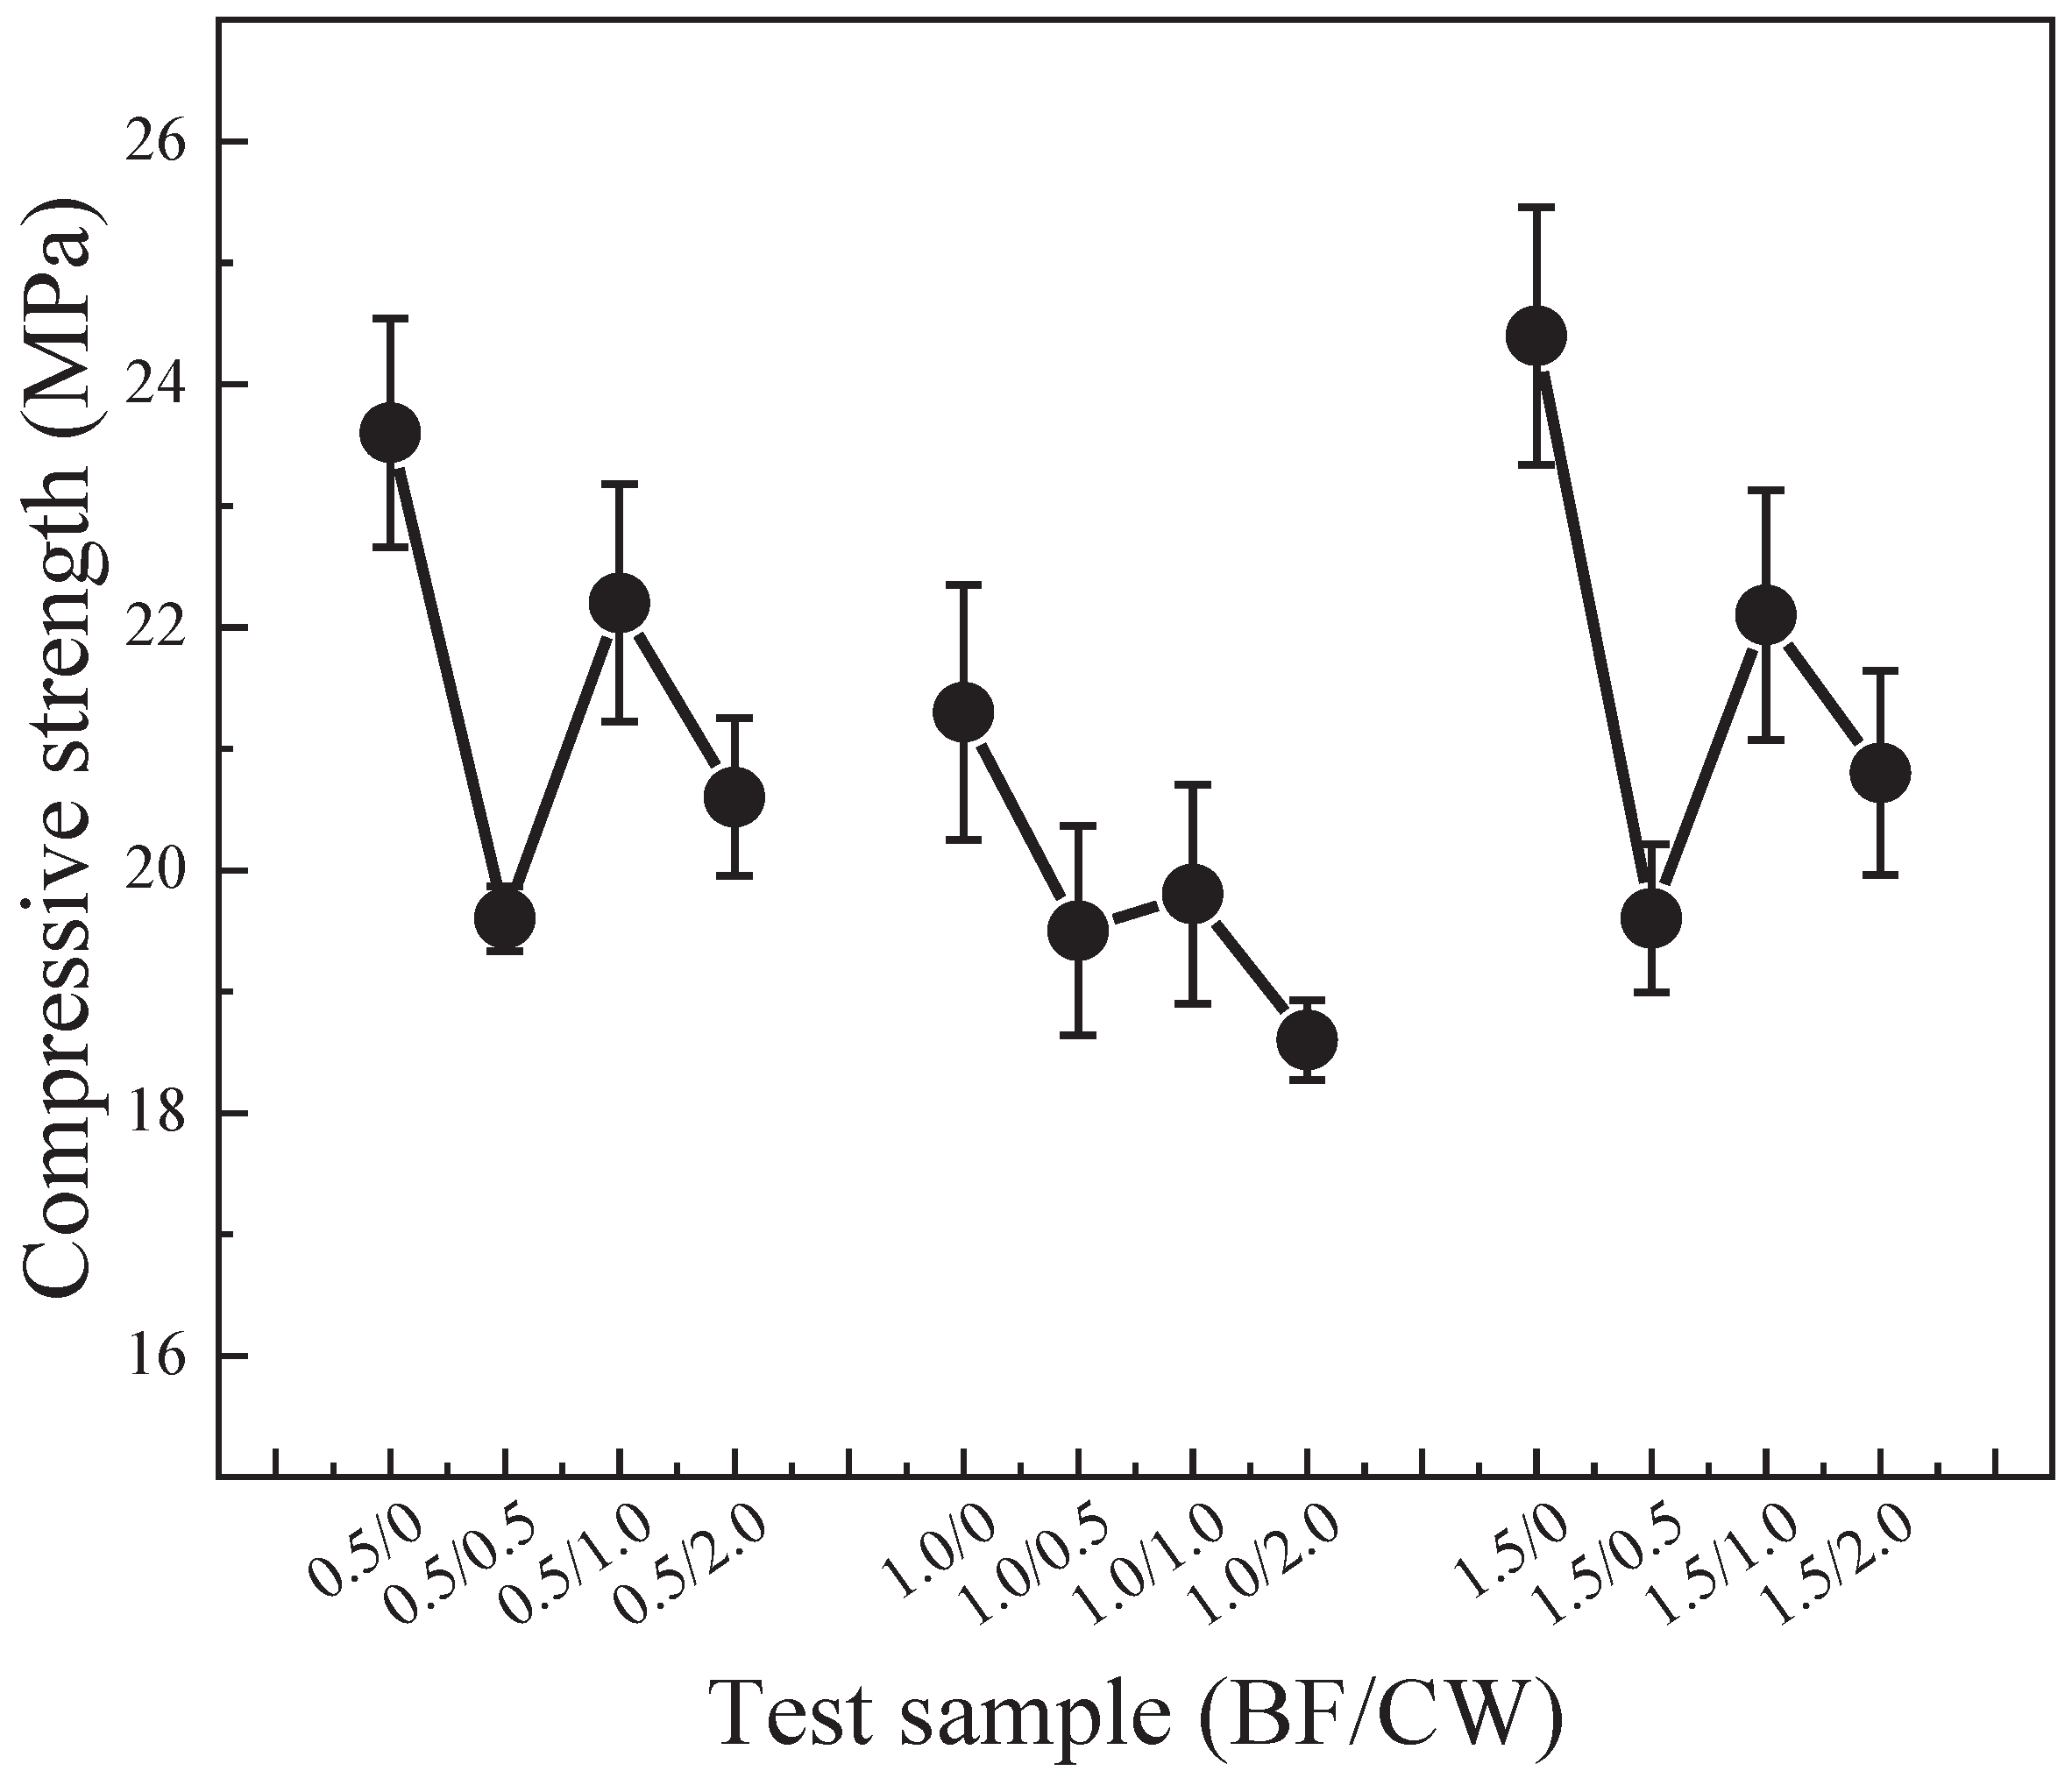
Figure 15.
The flexural-compressive ratio of the samples mixing BFs and CW.
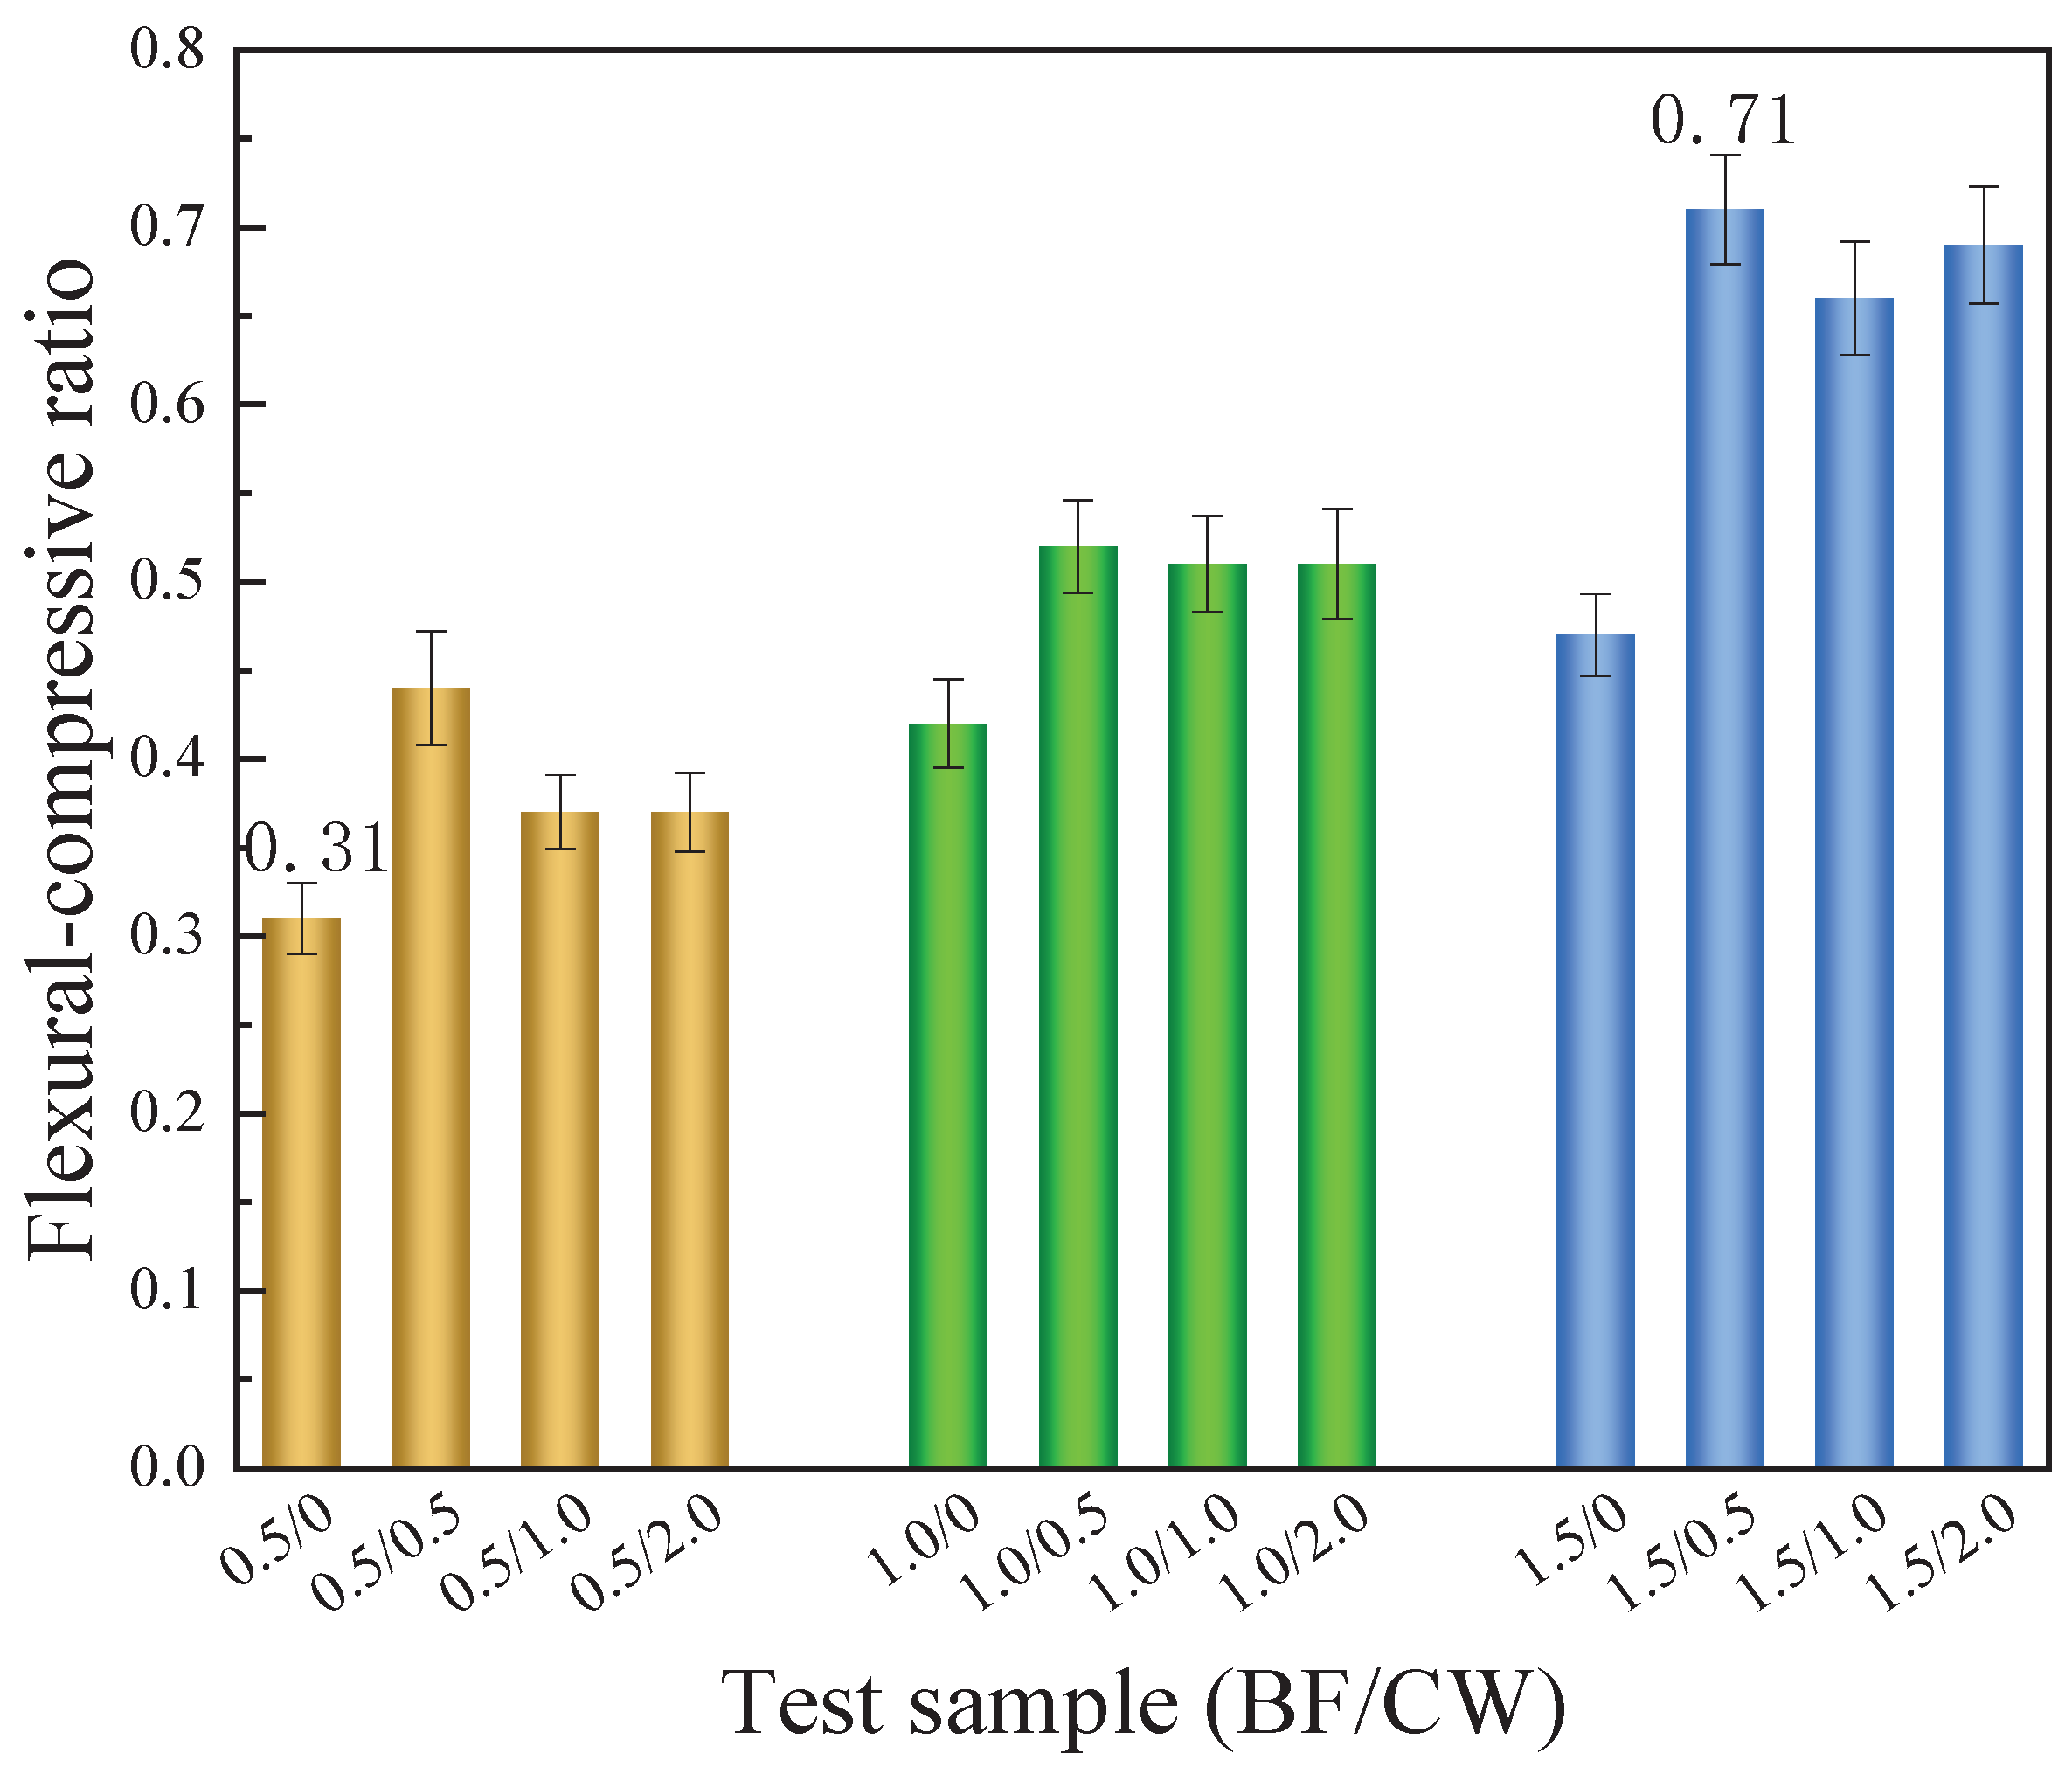
Figure 16.
Water absorption and softening coefficient of samples mixed with BFs and CW.
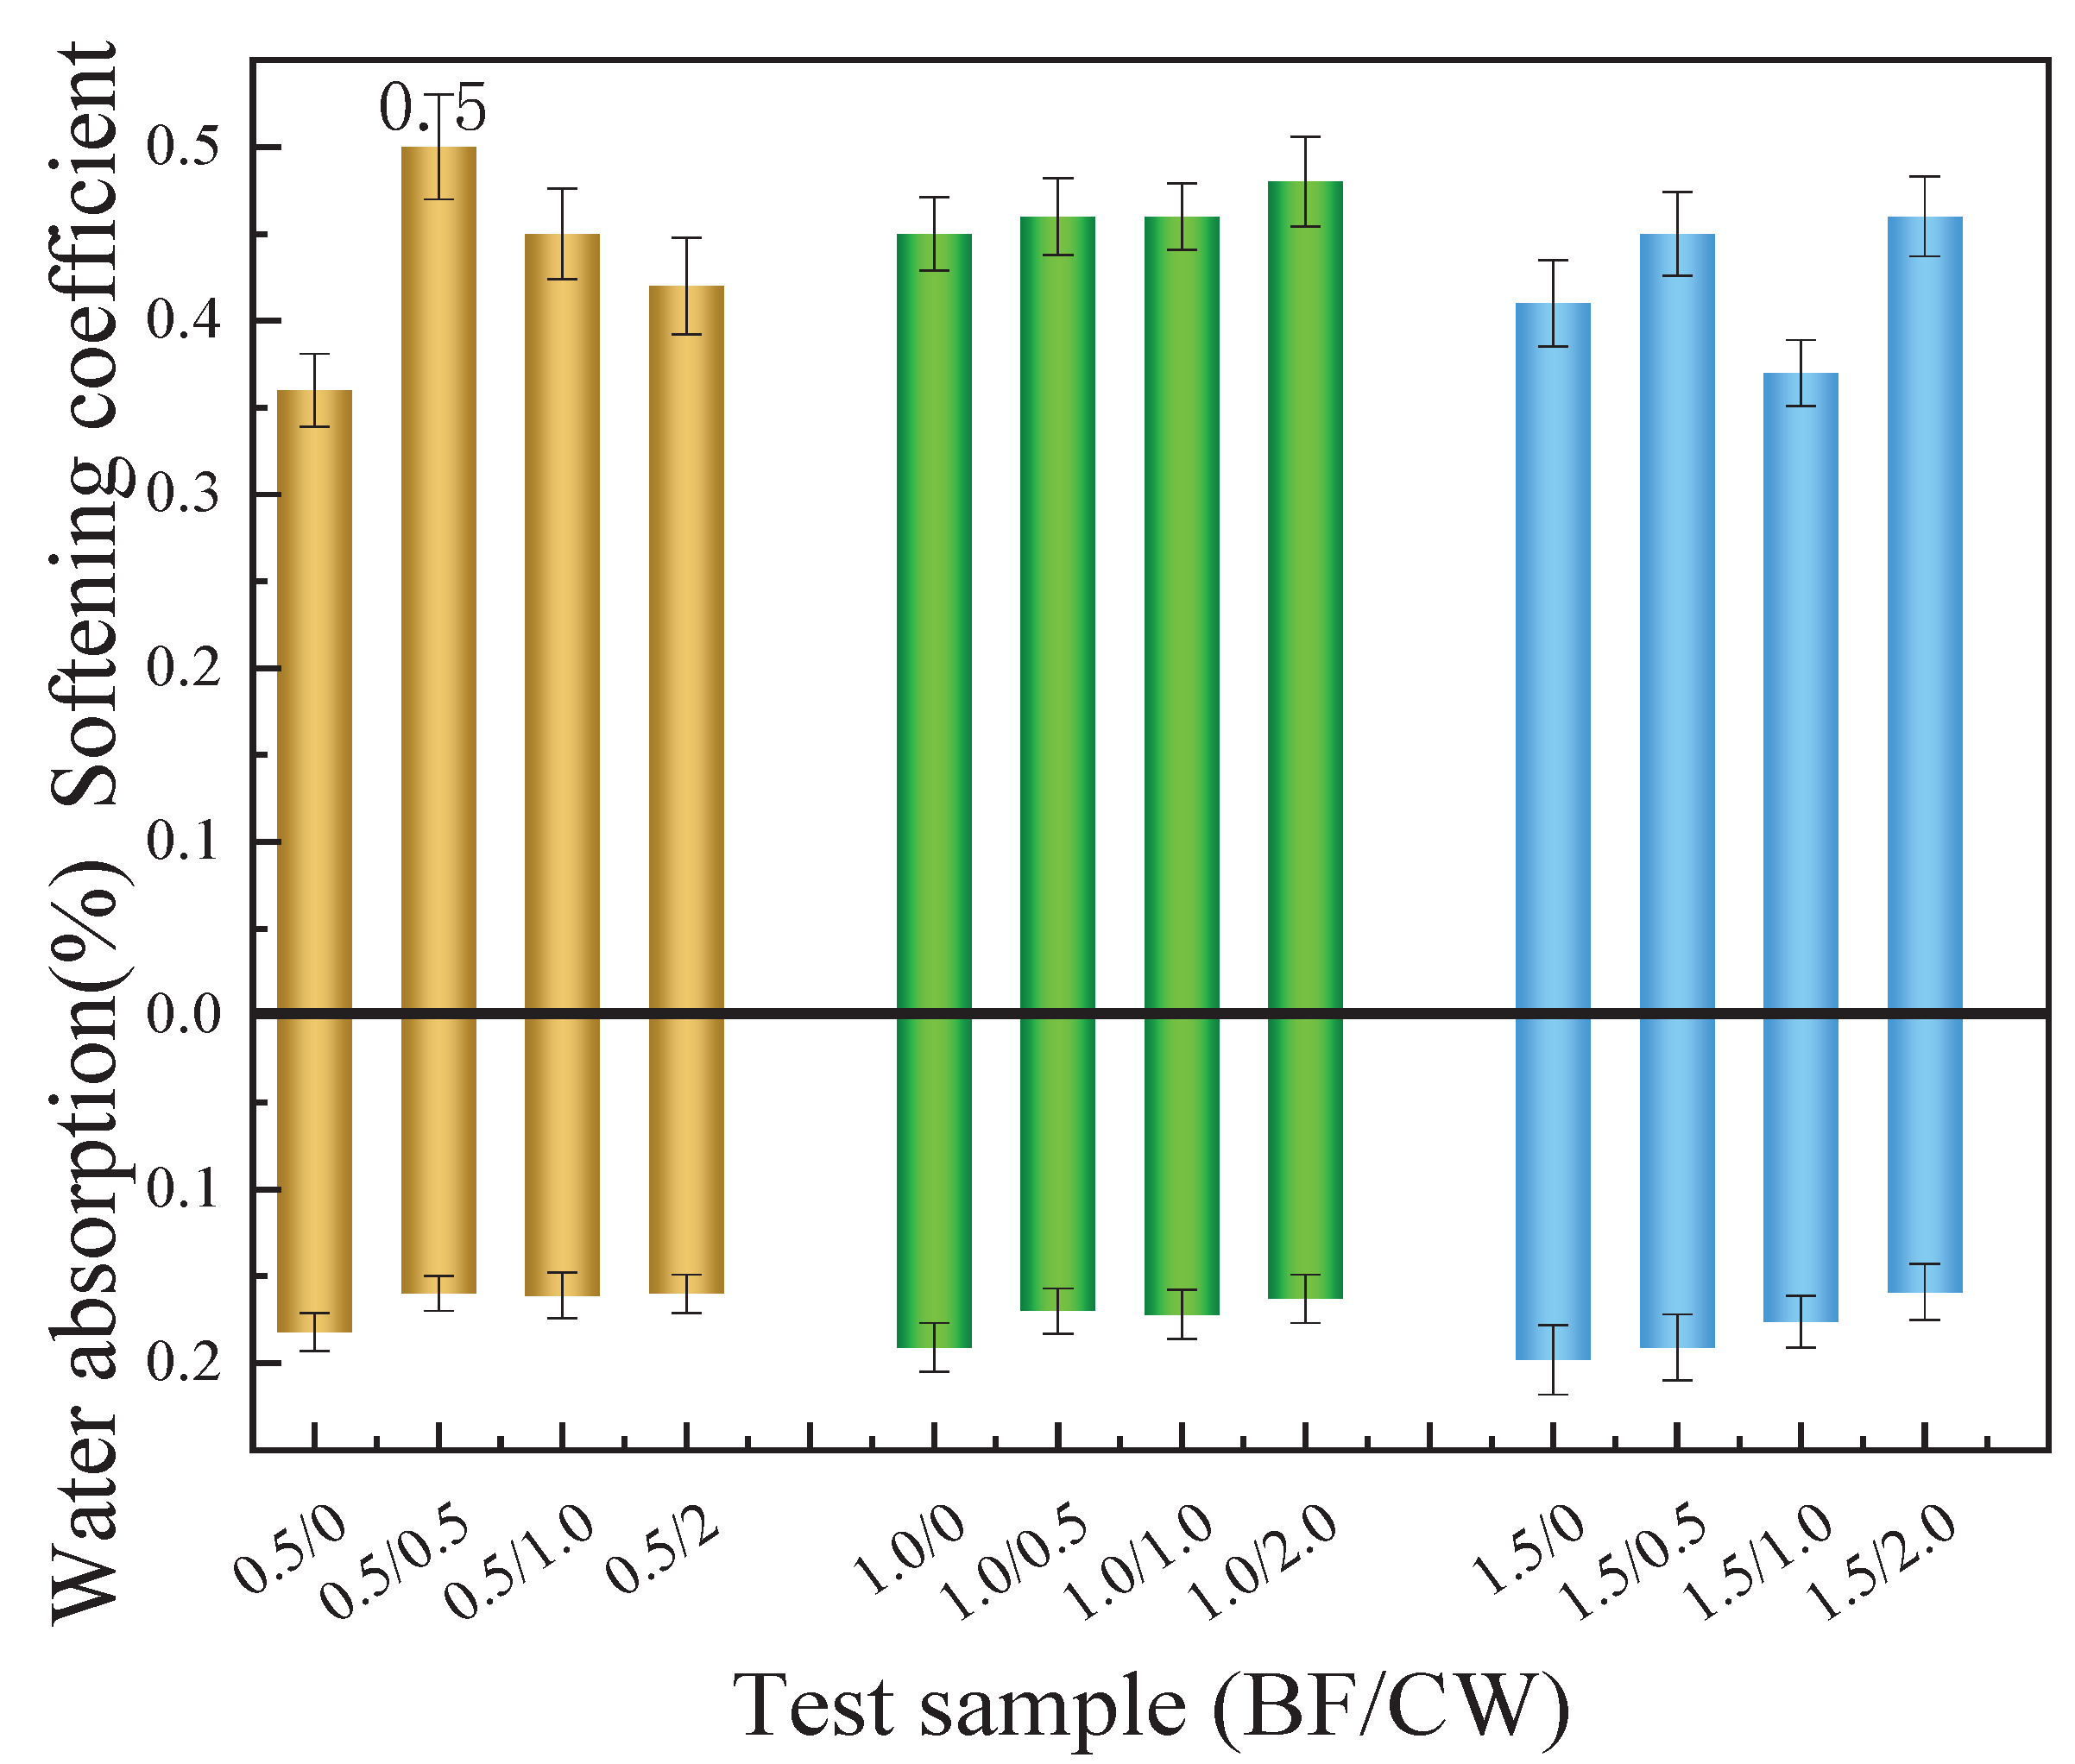
Figure 17.
Tensile strength test results of samples mixed with BFs and CW (a: Average tensile strength; b: Typical stress-strain curve).
Figure 17.
Tensile strength test results of samples mixed with BFs and CW (a: Average tensile strength; b: Typical stress-strain curve).

Figure 18.
SEM image of fracture surface of tensile sample (The red markings show the traces left behind after the fibers were pulled out).
Figure 18.
SEM image of fracture surface of tensile sample (The red markings show the traces left behind after the fibers were pulled out).
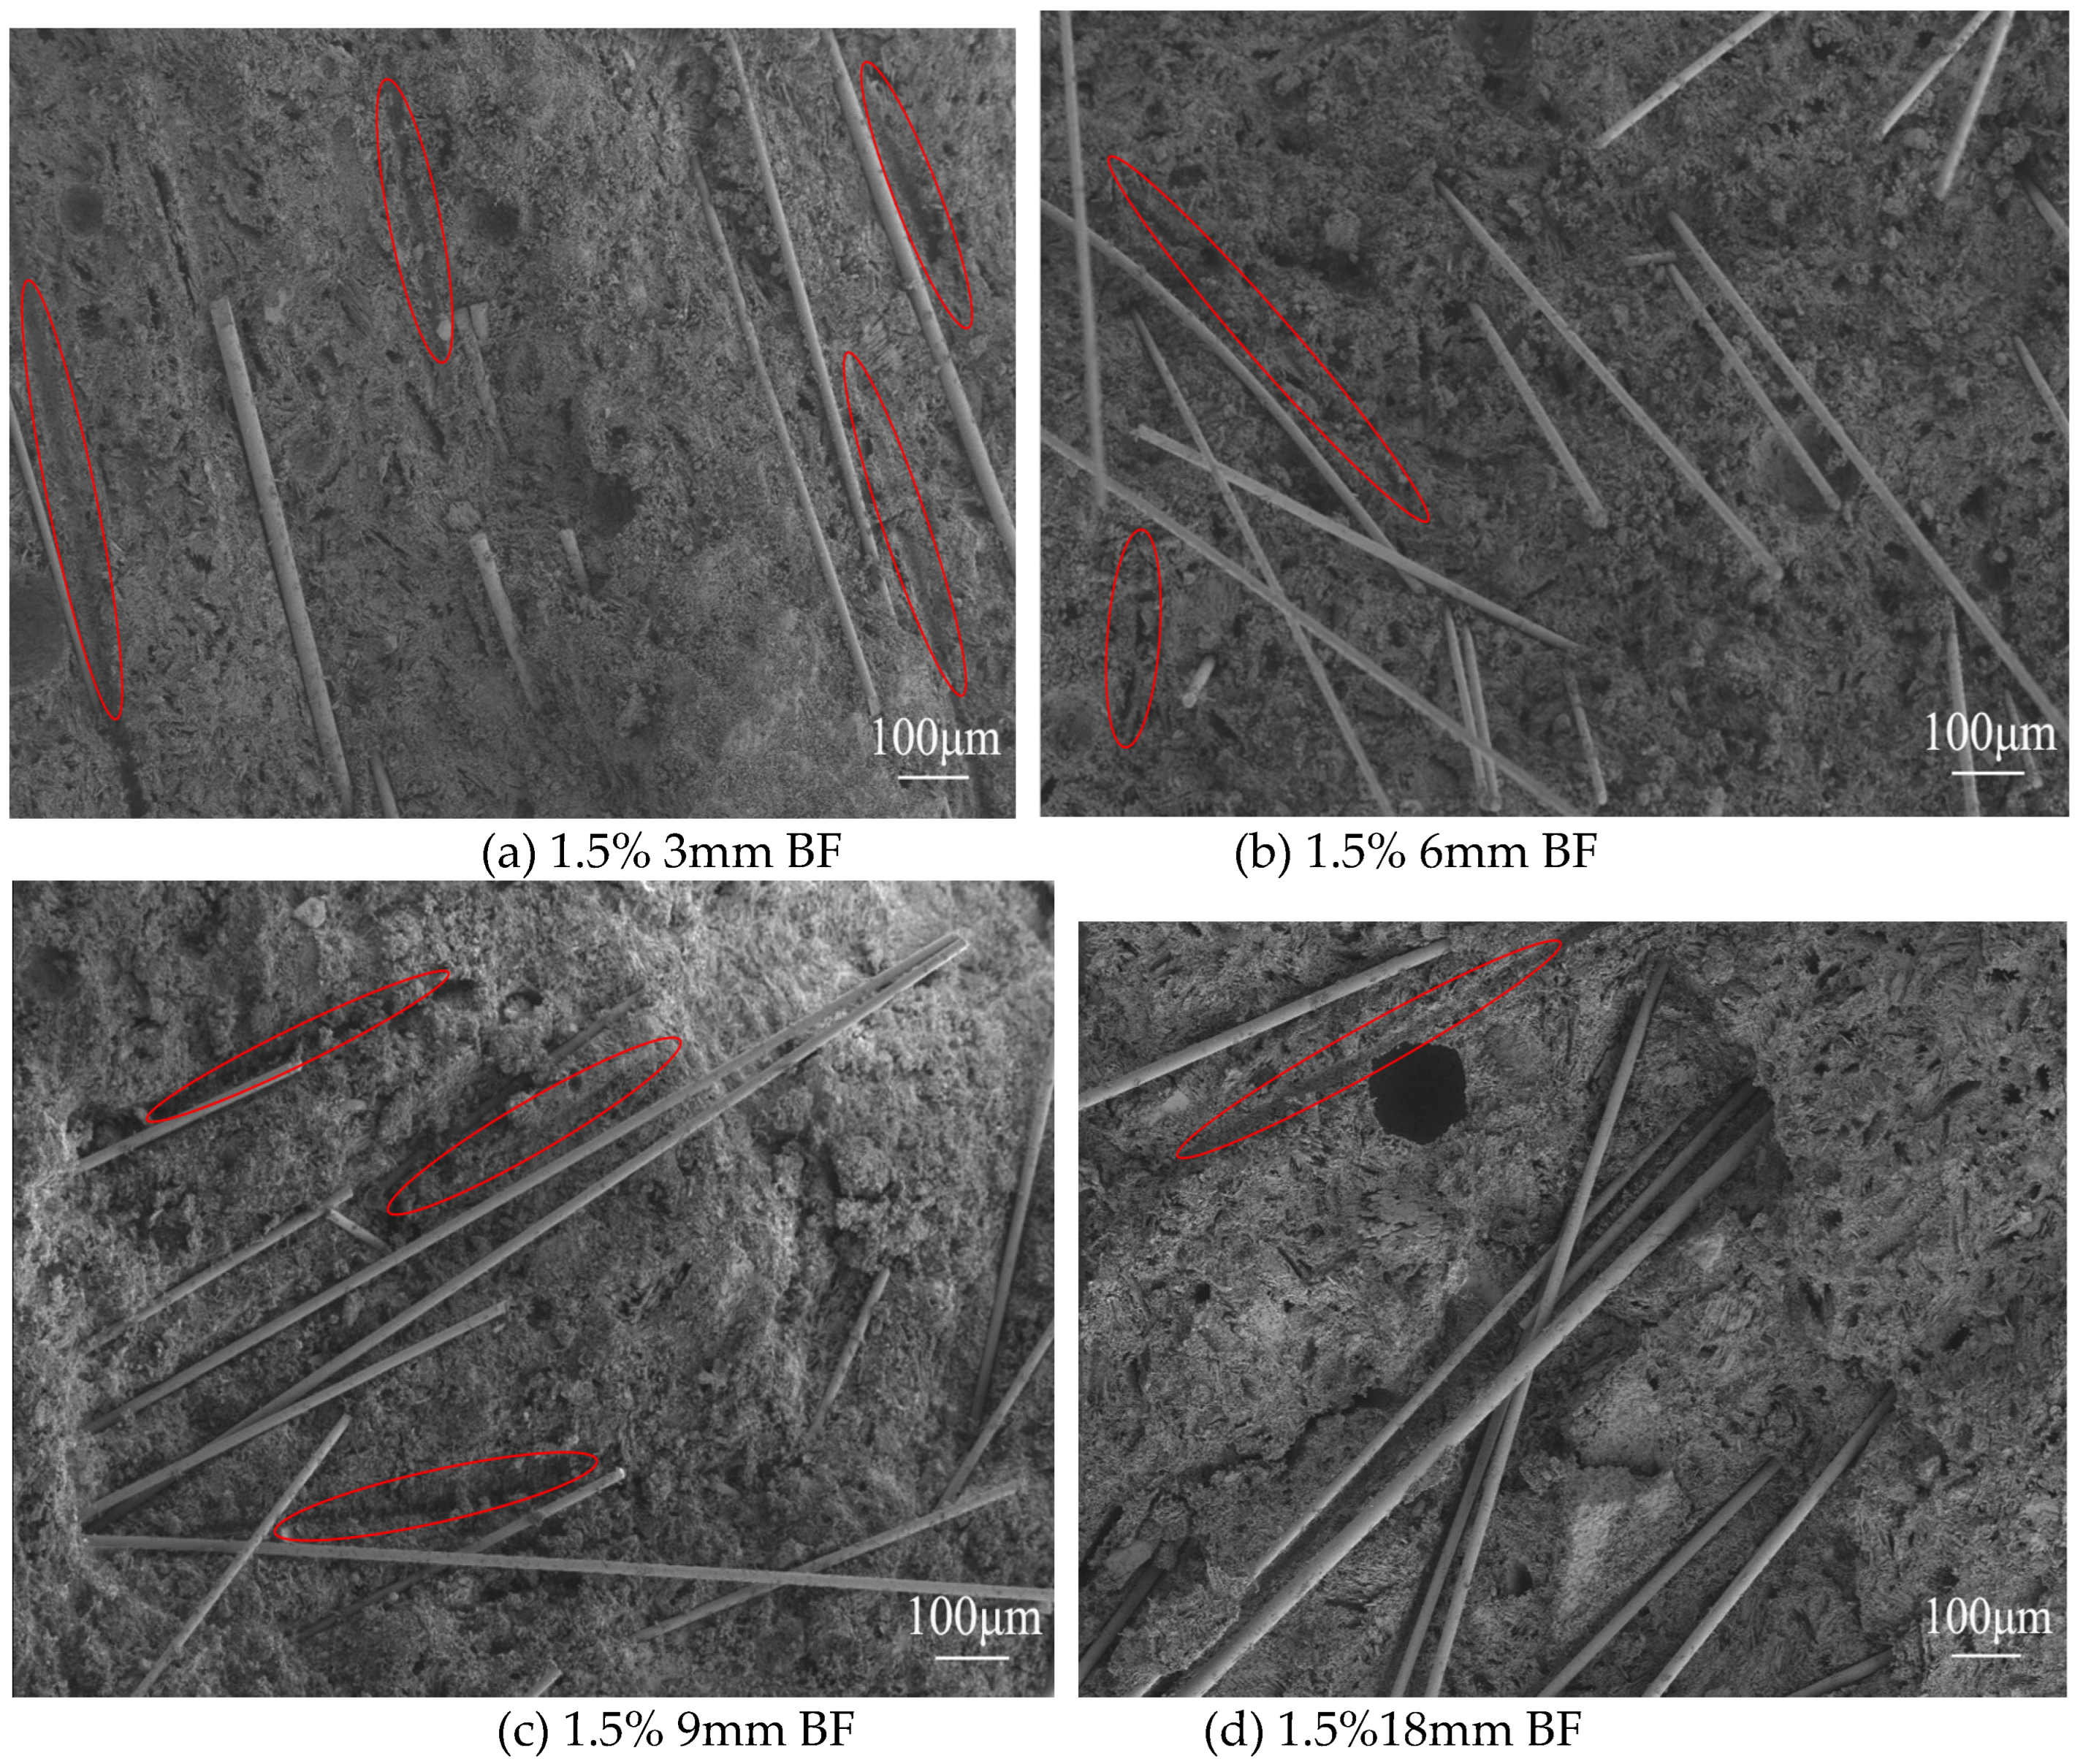
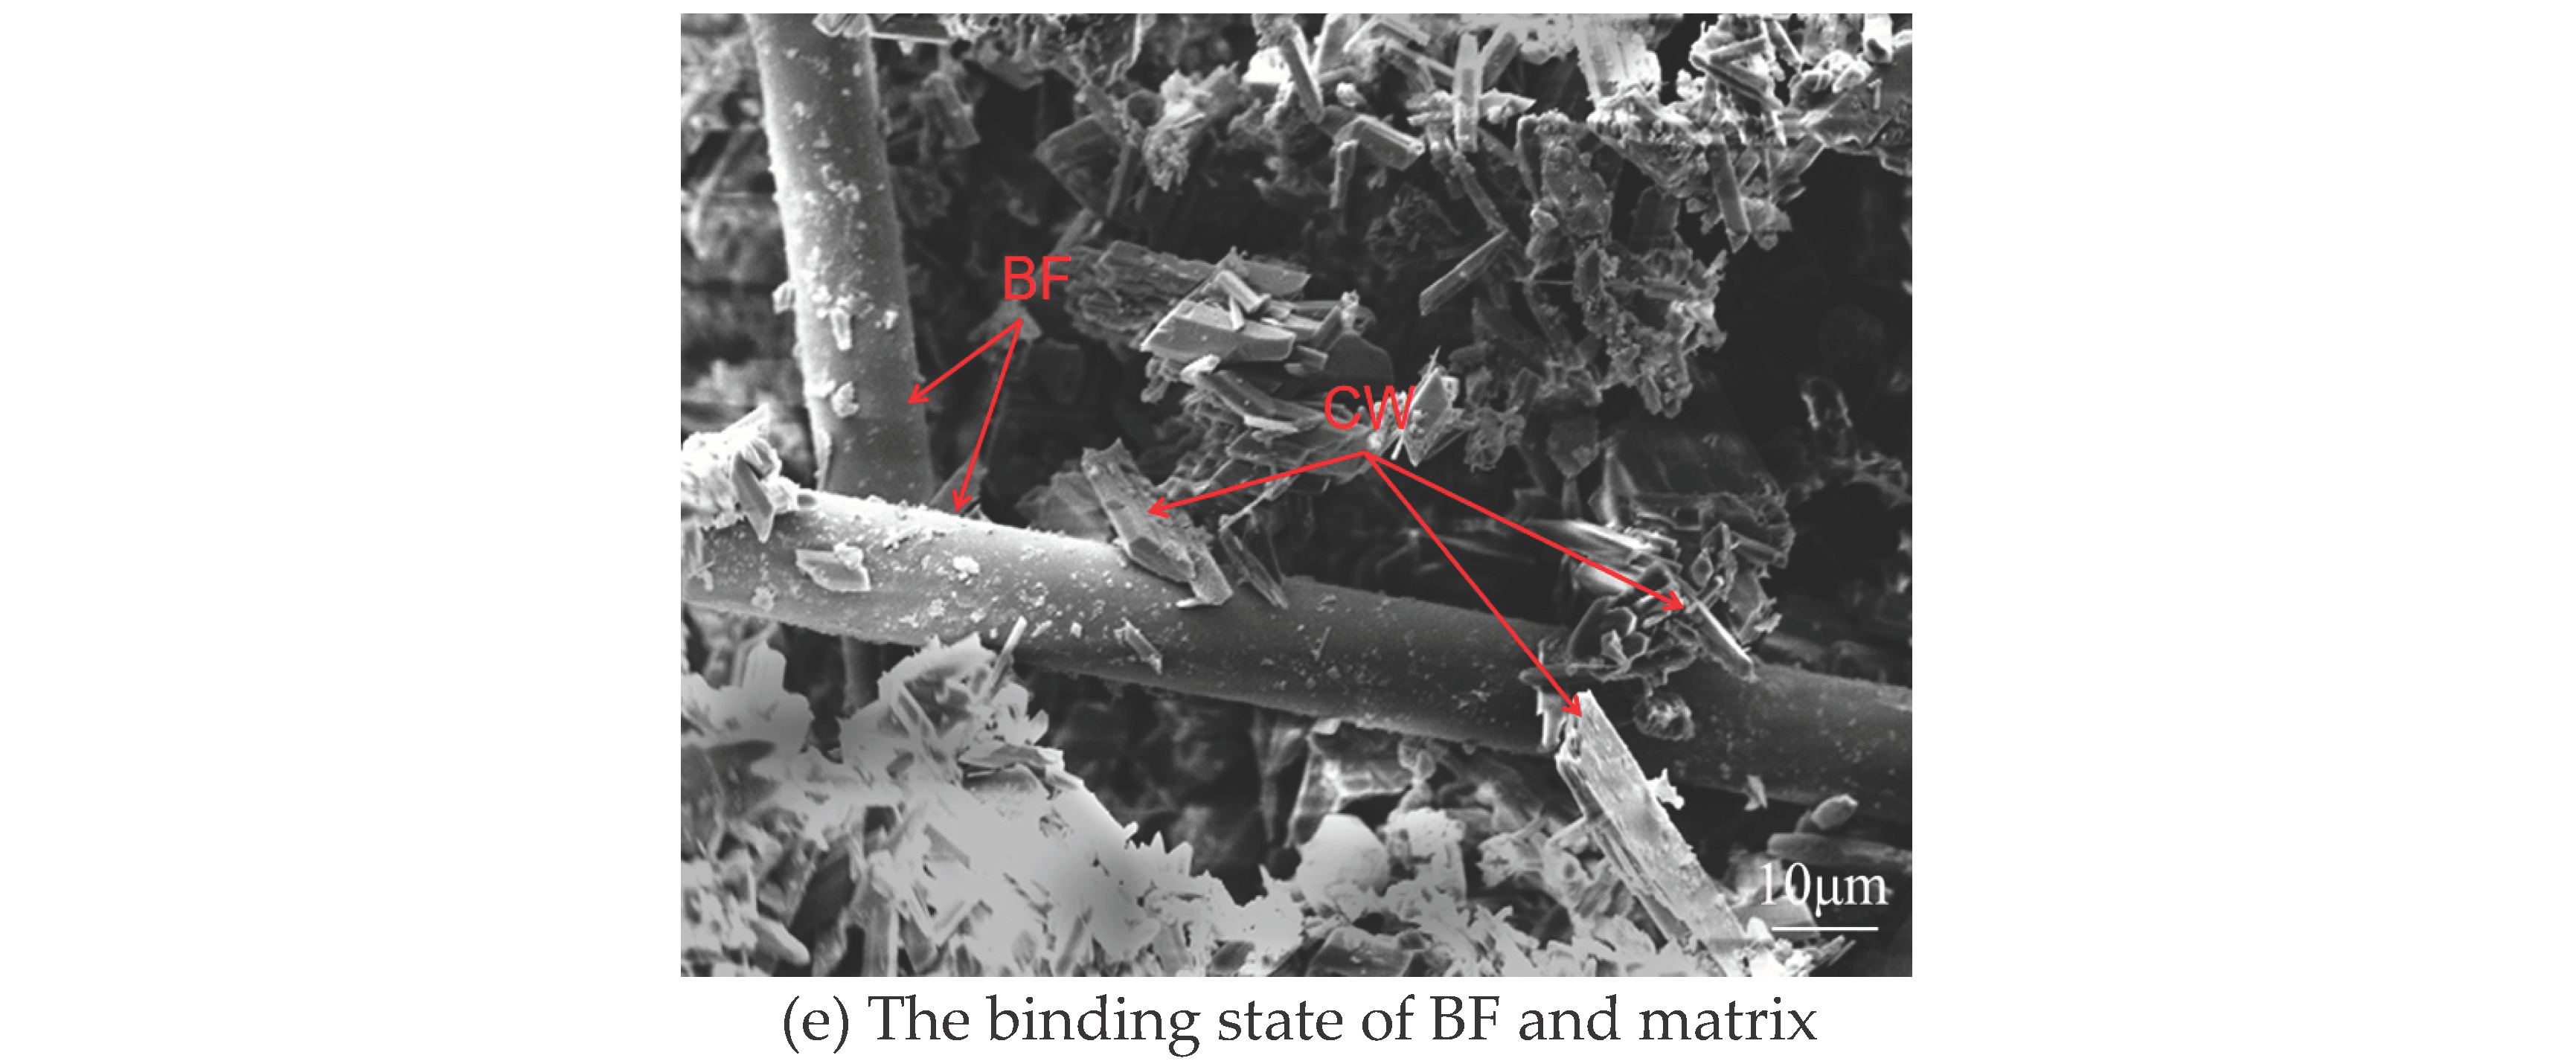
Figure 19.
MIP test result (a: Cumulative pore volume; b: Incremental pore volume).
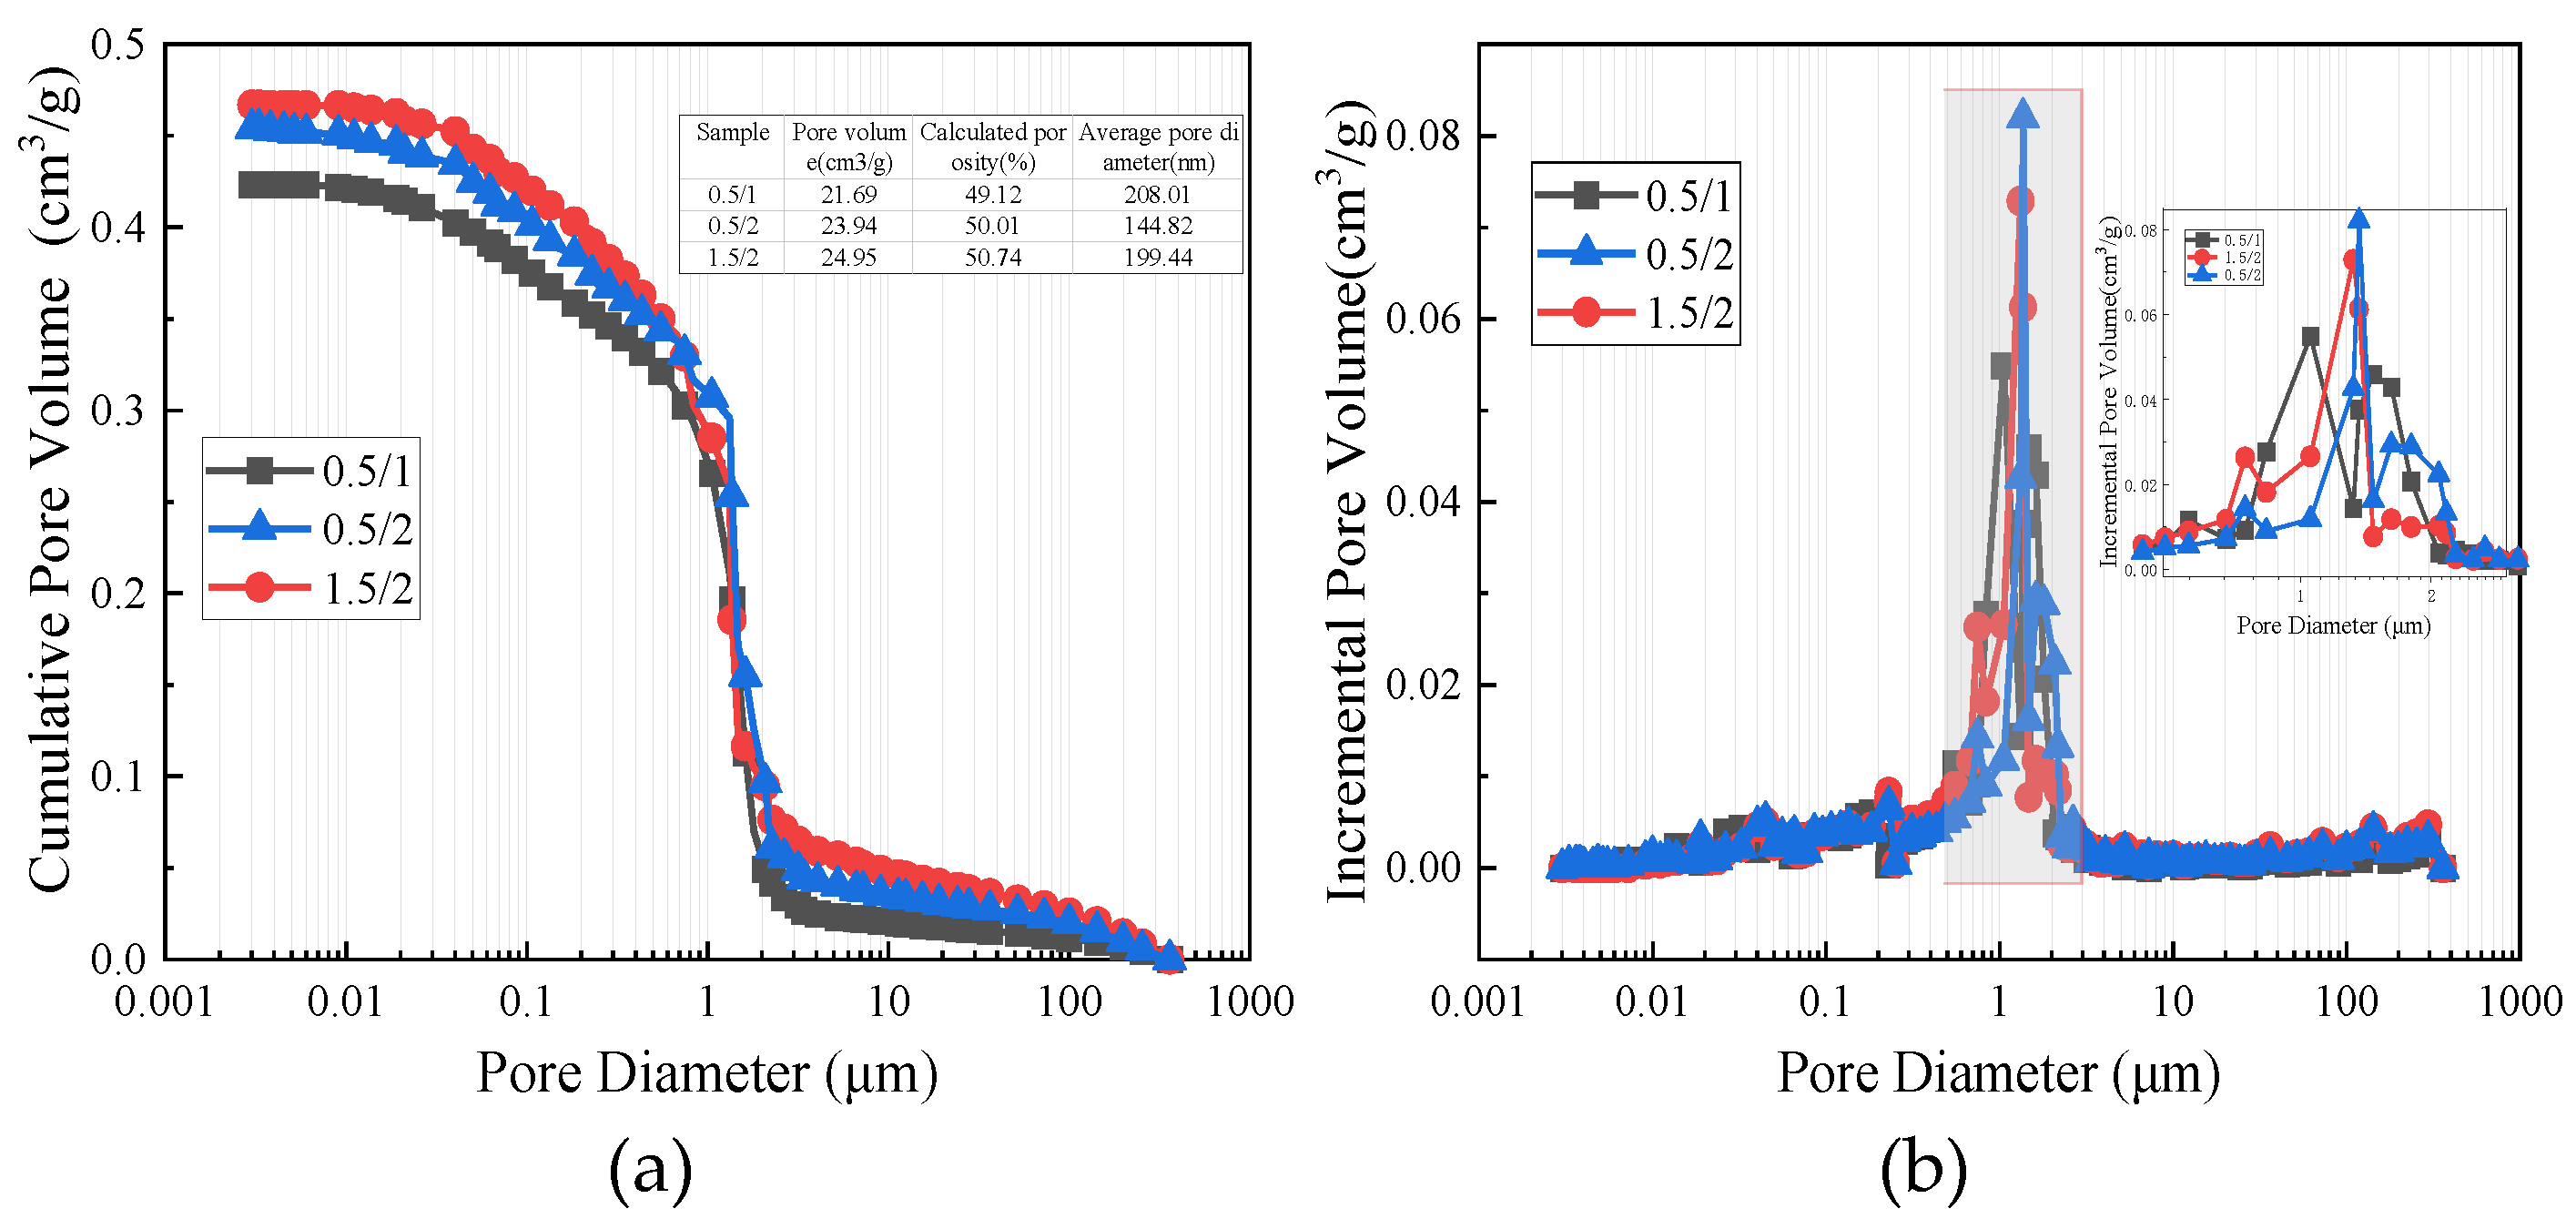

Table 1.
Performance parameters of BFs and CW.
| Materials | Diameter (μm) | Length (μm) | Density (g/cm3) | Tensile strength (MPa) |
|---|---|---|---|---|
| BFs | 13 | - | 2.65 | 3800-4800 |
| CW | 1-2 | 20-30 | 2.80 | - |
Table 2.
Mix proportion.
| Experimental group | CPG | Water | retarder | BFs | CW (wt%) | |
|---|---|---|---|---|---|---|
| Length (mm) | Dosages (wt%) | |||||
| Individual tests:BFs | 1 | 0.45 | 0.001 | 3 | 0/0.5/10/1.5 | - |
| 1 | 0.45 | 0.001 | 6 | 0/0.5/10/1.5 | - | |
| 1 | 0.45 | 0.001 | 9 | 0/0.5/10/1.5 | - | |
| 1 | 0.45 | 0.001 | 18 | 0/0.5/10/1.5 | - | |
| Mixed tests:BFs+CW | 1 | 0.45 | 0.001 | 6 | 0.5 | 0.5/1.0/2.0 |
| 1 | 0.45 | 0.001 | 6 | 1.0 | 0.5/1.0/2.0 | |
| 1 | 0.45 | 0.001 | 6 | 1.5 | 0.5/1.0/2.0 | |
Table 3.
Calculation results of the number of monofilament fibers and interface area.
| Mass fraction of fibers (C,%) | Fiber density (ρ,g/cm3) | Fiber diameter (A,μm) | Fiber length (B,mm) | Monofilament quantity (Q) | Interfacial area (S,mm2) |
|---|---|---|---|---|---|
| 0.5 | 2.65 | 13 | 3 | 4740.7 | 580.6 |
| 1.0 | 2.65 | 13 | 3 | 9481.5 | 1161.1 |
| 1.5 | 2.65 | 13 | 3 | 14222.2 | 1741.7 |
| 0.5 | 2.65 | 13 | 6 | 2370.4 | 580.6 |
| 1.0 | 2.65 | 13 | 6 | 4740.7 | 1161.1 |
| 1.5 | 2.65 | 13 | 6 | 7111.1 | 1741.7 |
| 0.5 | 2.65 | 13 | 9 | 1580.2 | 580.6 |
| 1.0 | 2.65 | 13 | 9 | 3160.5 | 1161.1 |
| 1.5 | 2.65 | 13 | 9 | 4740.7 | 1741.7 |
| 0.5 | 2.65 | 13 | 18 | 790.1 | 580.6 |
| 1.0 | 2.65 | 13 | 18 | 1580.2 | 1161.1 |
| 1.5 | 2.65 | 13 | 18 | 2370.4 | 1741.7 |
Disclaimer/Publisher’s Note: The statements, opinions and data contained in all publications are solely those of the individual author(s) and contributor(s) and not of MDPI and/or the editor(s). MDPI and/or the editor(s) disclaim responsibility for any injury to people or property resulting from any ideas, methods, instructions or products referred to in the content. |
© 2024 by the authors. Licensee MDPI, Basel, Switzerland. This article is an open access article distributed under the terms and conditions of the Creative Commons Attribution (CC BY) license (http://creativecommons.org/licenses/by/4.0/).
Copyright: This open access article is published under a Creative Commons CC BY 4.0 license, which permit the free download, distribution, and reuse, provided that the author and preprint are cited in any reuse.


