Preprint
Article

Integrated Multi-Cohort Analysis of Whole-Genome and Transcriptome Data Reveals Interplay between Metabolism and Methylation in Myelodysplastic Syndrome (MDS)

Altmetrics

Downloads

188

Views

98

Comments

0

This version is not peer-reviewed

Submitted:

16 February 2024

Posted:

22 February 2024

You are already at the latest version

Alerts
Abstract
Objectives: Metabolic interactions amongst mutated genes in myelodysplastic syndrome (MDS) offer promising avenues for novel anticancer treatments. Our comprehensive study delves into these mutational and transcriptomic landscapes, pinpointing hallmark gene mutations and deregulated gene expression that could influence MDS patients’ metabolomes. Methods: The study utilized a retrospective, cross-sectional approach, employing mutational data on the cBio Cancer Genomics Portal conducted and reported by the University of Tokyo in 2011 and multi-center MDS cohorts regulated by Wellcome Trust Sanger Institute, United Kingdom, all in 2020. For transcriptomic data, we selected three publicly accessible independent cohorts on the Gene Expression Omnibus (GEO) database (GSE114922 in Wellcome Trust Centre for Human Genetics, United Kingdome, GSE63569 in University of Oxford, United Kingdome, and GSE183328 in CIMA, Spain) held in 2015, 2018, and 2022, respectively. To compile clinical, mutational, and transcriptomic data on MDS patients from multiple datasets and studies. This meta-analysis included genomic data derived from cellular genomics sources to assess mutations in specific genes, alongside an examination of transcriptomic data from three separate datasets that have been previously published. Results: DNMT3A presented a 20% mutation frequency, playing a pivotal role in MDS metabolomics. The DNMT3A gene mutations displayed significant mutual exclusivity with the SRSF2, ASXL1, JAK2, and TP53 genes. The mutational analysis also showed that the gene expression landscape in MDS is associated with alterations to DNA methylation pathways. Conclusion: This analysis suggests a potential therapeutic niche. Identifying signature genes in MDS that have metabolic and methylation affiliations could illuminate the disease's intricate biology and inspire novel treatments.
Keywords: 
Subject: Medicine and Pharmacology  -   Hematology

1. Introduction

Myelodysplastic syndrome (MDS) increases the likelihood that individuals will develop diverse undifferentiated hematologic malignancies [1]. While MDS is primarily found in people over 65, it accounts for less than 5% of childhood cancers [2]. Despite the fact that out of every 100,000 individuals under 70, 40–50 have MDS, emphasizing its higher frequency in older age groups, the age-standardized incidence of MDS, a rare illness, ranges from 1.3 to 4.3 per 100,000 person-years and rises steadily with age [3,4]. The current research indicates that 80–90% of individuals with MDS present repetitive changes in multiple genes [5]. Therefore, investigating hereditary changes that engender leukemia and lymphoma is crucial to improving disease outcome predictions. Advances in next-generation sequencing (NGS) have deepened our understanding of the role that genetic changes play in malfunctioning blood formation and the prognosis for MDS patients. For instance, MDS often features primary and secondary genetic changes, with around 1,500 mutations throughout the genome [6]. These genetic changes result in complex interactions that may affect survival rates in certain MDS cases. Identifying these inherent changes can guide the development of tailored treatment approaches for MDS patients.
One of cancer’s hallmarks is a change in metabolism, which is crucial for cellular processes that instigate carcinogenesis [7]. Hematopoietic stem cells (HSCs), the foundation of hematopoiesis, orchestrate various metabolic needs and states when they mature into advanced myeloid and lymphoid cells [3]. HSCs’ metabolic versatility is evident in their high energy demand during growth and maturation, allowing them to transition from a glycolysis-focused metabolism to a mitochondria-centered one [8]. In the 1920s, Warburg et al. identified tumor tissues that exhibited increased aerobic glycolysis and accelerated lactate discharge. This finding, which suggests information about glucose absorption, lactate emission, and oxygen levels, is also pertinent to MDS [3,9]. A transformative approach to MDS entails identifying metabolic gene markers that are prognostically valuable. The nuanced relationships between frequently altered genes and metabolic systems provide a lens into how these genes may counteract cancer development by effectively adjusting various aspects of metabolism.
The mutations that initiate MDS in HSCs are shaped by clinical features, cellular factors, and genetic makeup [10]. For example, the French-American-British (FAB) system from 1982 labeled MDS “refractory anemia” and segmented it into five types according to cellular morphology and the myeloid blast count [11]. This system was predominant for about 20 years. However, the generic divisions of the initial system led the World Health Organization (WHO) to revamp it and emphasize the crucial role of genetic mutations in diagnosing the condition [12]. In 2001, the WHO presented its first categorization based on HSC mutations that initiate MDS [13]. The ensuing updates from 2008 to 2016 enriched this framework by incorporating clinical, morphological, immunophenotypic, and genetic aspects of the condition [13]. By 2022, the WHO had further refined the MDS classifications. The current divisions hinge on genetic variations and morphological features, emphasizing genetic disruptions of clonal hematopoiesis. This detailed system supports accurate diagnosis and risk assessment, allowing for personalized treatment approaches [10].
In our integrated multidisciplinary study, we emphasized the mutational burden and the transcriptomic profile landscape found in MDS patients to evaluate the relevance of the genes and overly active molecular pathways that are linked to MDS metabolism. We pinpointed numerous genes with mutations that are recognized as modules of mutually exclusive mutations, which could amplify cellular metabolism in individuals with MDS. Ultimately, we combined gene mutational data with gene expression data to identify metabolism-associated signature genes related to DNA methylation in MDS, providing potential insights into the biology of the condition.

2. Methodology

This work followed a retrospective, cross-sectional study design using the cBio Cancer Genomics Portal tool and the Gene Expression Omnibus (GSE) to gather clinical, mutational, and transcriptomic information on MDS patients from various datasets and studies [14,15,16,17,18,19]. The genomic data for evaluating changes in potentially useful genes came from 4,260 MDS samples from joint studies that reported cellular genomics data in 2011 held at the University of Tokyo and in Wellcome Trust Sanger Institute and others in ClinicalTrials.gov number NCT00146120, comparative study in the United States, and Wellcome Trust Sanger Institute, Hinxton, United Kingdom all in 2020 [20,21,22,23]. The transcriptomic data found on the GSE database consists of three independent cohorts (GSE114922 in Wellcome Trust Centre for Human Genetics, United Kingdome, GSE63569 in University of Oxford, United Kingdome, and GSE183328 in CIMA, Spain) held in 2015, 2018, and 2022, respectively [14,15,16,17]. All obtained data were parallel with mutations in MDS of clinical significance.
We analyzed these 4,260 MDS patient samples with the cBio platform. This comprehensive analysis allowed us to identify and examine mutation patterns in this group of patients [18,19,20,21,22,23]. For the RNA-seq meta-analysis, we selected three independent cohorts with raw data published in the GSE. We selected only MDS RNA-seq data from the same biological source (CD34+ hematopoietic stem cells) and technical sequencing platform (Illumina). Raw sequencing reads were downloaded from the GSE database with the SRA toolkit. These reads were then mapped to the human genome (hg38). The resulting BAM files were filtered to remove duplicates, leaving only primary aligned reads. Gene expression count matrices were then generated with a gene annotation GTF file downloaded from Gencode release 44 (GRCh38.p14). The DESEQ2 package was used for data normalization and differential gene expression was reviewed afterward. To identify differentially expressed genes, we established comparisons by contrasting MDS samples with healthy samples. Genes were labeled significant if they had an adjusted p-value of less than 0.1 and a log2 fold change of more than 1.5. Upregulated genes were then subjected to pathway enrichment analysis using the reactome database. Scatter plots were generated using the ggplot package.

3. Results

In numerous studies, biomarkers, especially DNA methylation, and mutations in genes such as isocitrate dehydrogenase (NADP(+)) 1 (IDH1) and isocitrate dehydrogenase (NADP(+)) 2 (IDH2) have been spotlighted as fundamental indicators of MDS [24,25]. Such genetic indicators can modulate patients’ reactions to chemotherapy drugs, including decitabine [26]. Considering the complex nature of MDS, recognizing that our comprehension of the routes that these notably mutated genes define remains limited is vital. Our meta-study systematically integrated various genes to reveal the pathways that are relevant to MDS patients. Using the cBio cancer genomics portal tool, we assessed 4,260 MDS patient samples drawn from diverse datasets and articles. This examination highlighted genes with prevalent mutations, such as tet methylcytosine dioxygenase 2 (TET2), DNA methyltransferase 3 alpha (DNMT3A), ASXL transcriptional regulator 1 (ASXL1), splicing factor 3b subunit 1 (SF3B1), serine and arginine-rich splicing factor 2 (SRSF2), RUNX family transcription factor 1 (RUNX1), and nucleophosmin 1 (NPM1) (Figure 1) [18,19,20,21,22,23,27,28,29,30,31,32,33].
Interestingly, we found that the DNMT3A gene mutations displayed mutual exclusivity with multiple other vital genes, as Table 1 shows. This mutual exclusivity pattern suggests that these genes contribute to or manage a common biological function, possibly metabolism. Therefore, concurrent mutations in multiple genes could harm cell systems. Further analysis showed that the DNMT3A gene is linked to DNA methylation, the SRSF2 gene is involved in RNA splicing, the ASXL1 gene contributes to chromatin modification, the JAK2 gene is essential for signal processing, and the TP53 gene is fundamental to both tumor inhibition and transcription factor function. Significantly, except for JAK2, all of these genes are correlated with an unfavorable prognosis [10]. Given their critical roles, many of these genes will likely be integrated into the standard clinical assessment of MDS patients.
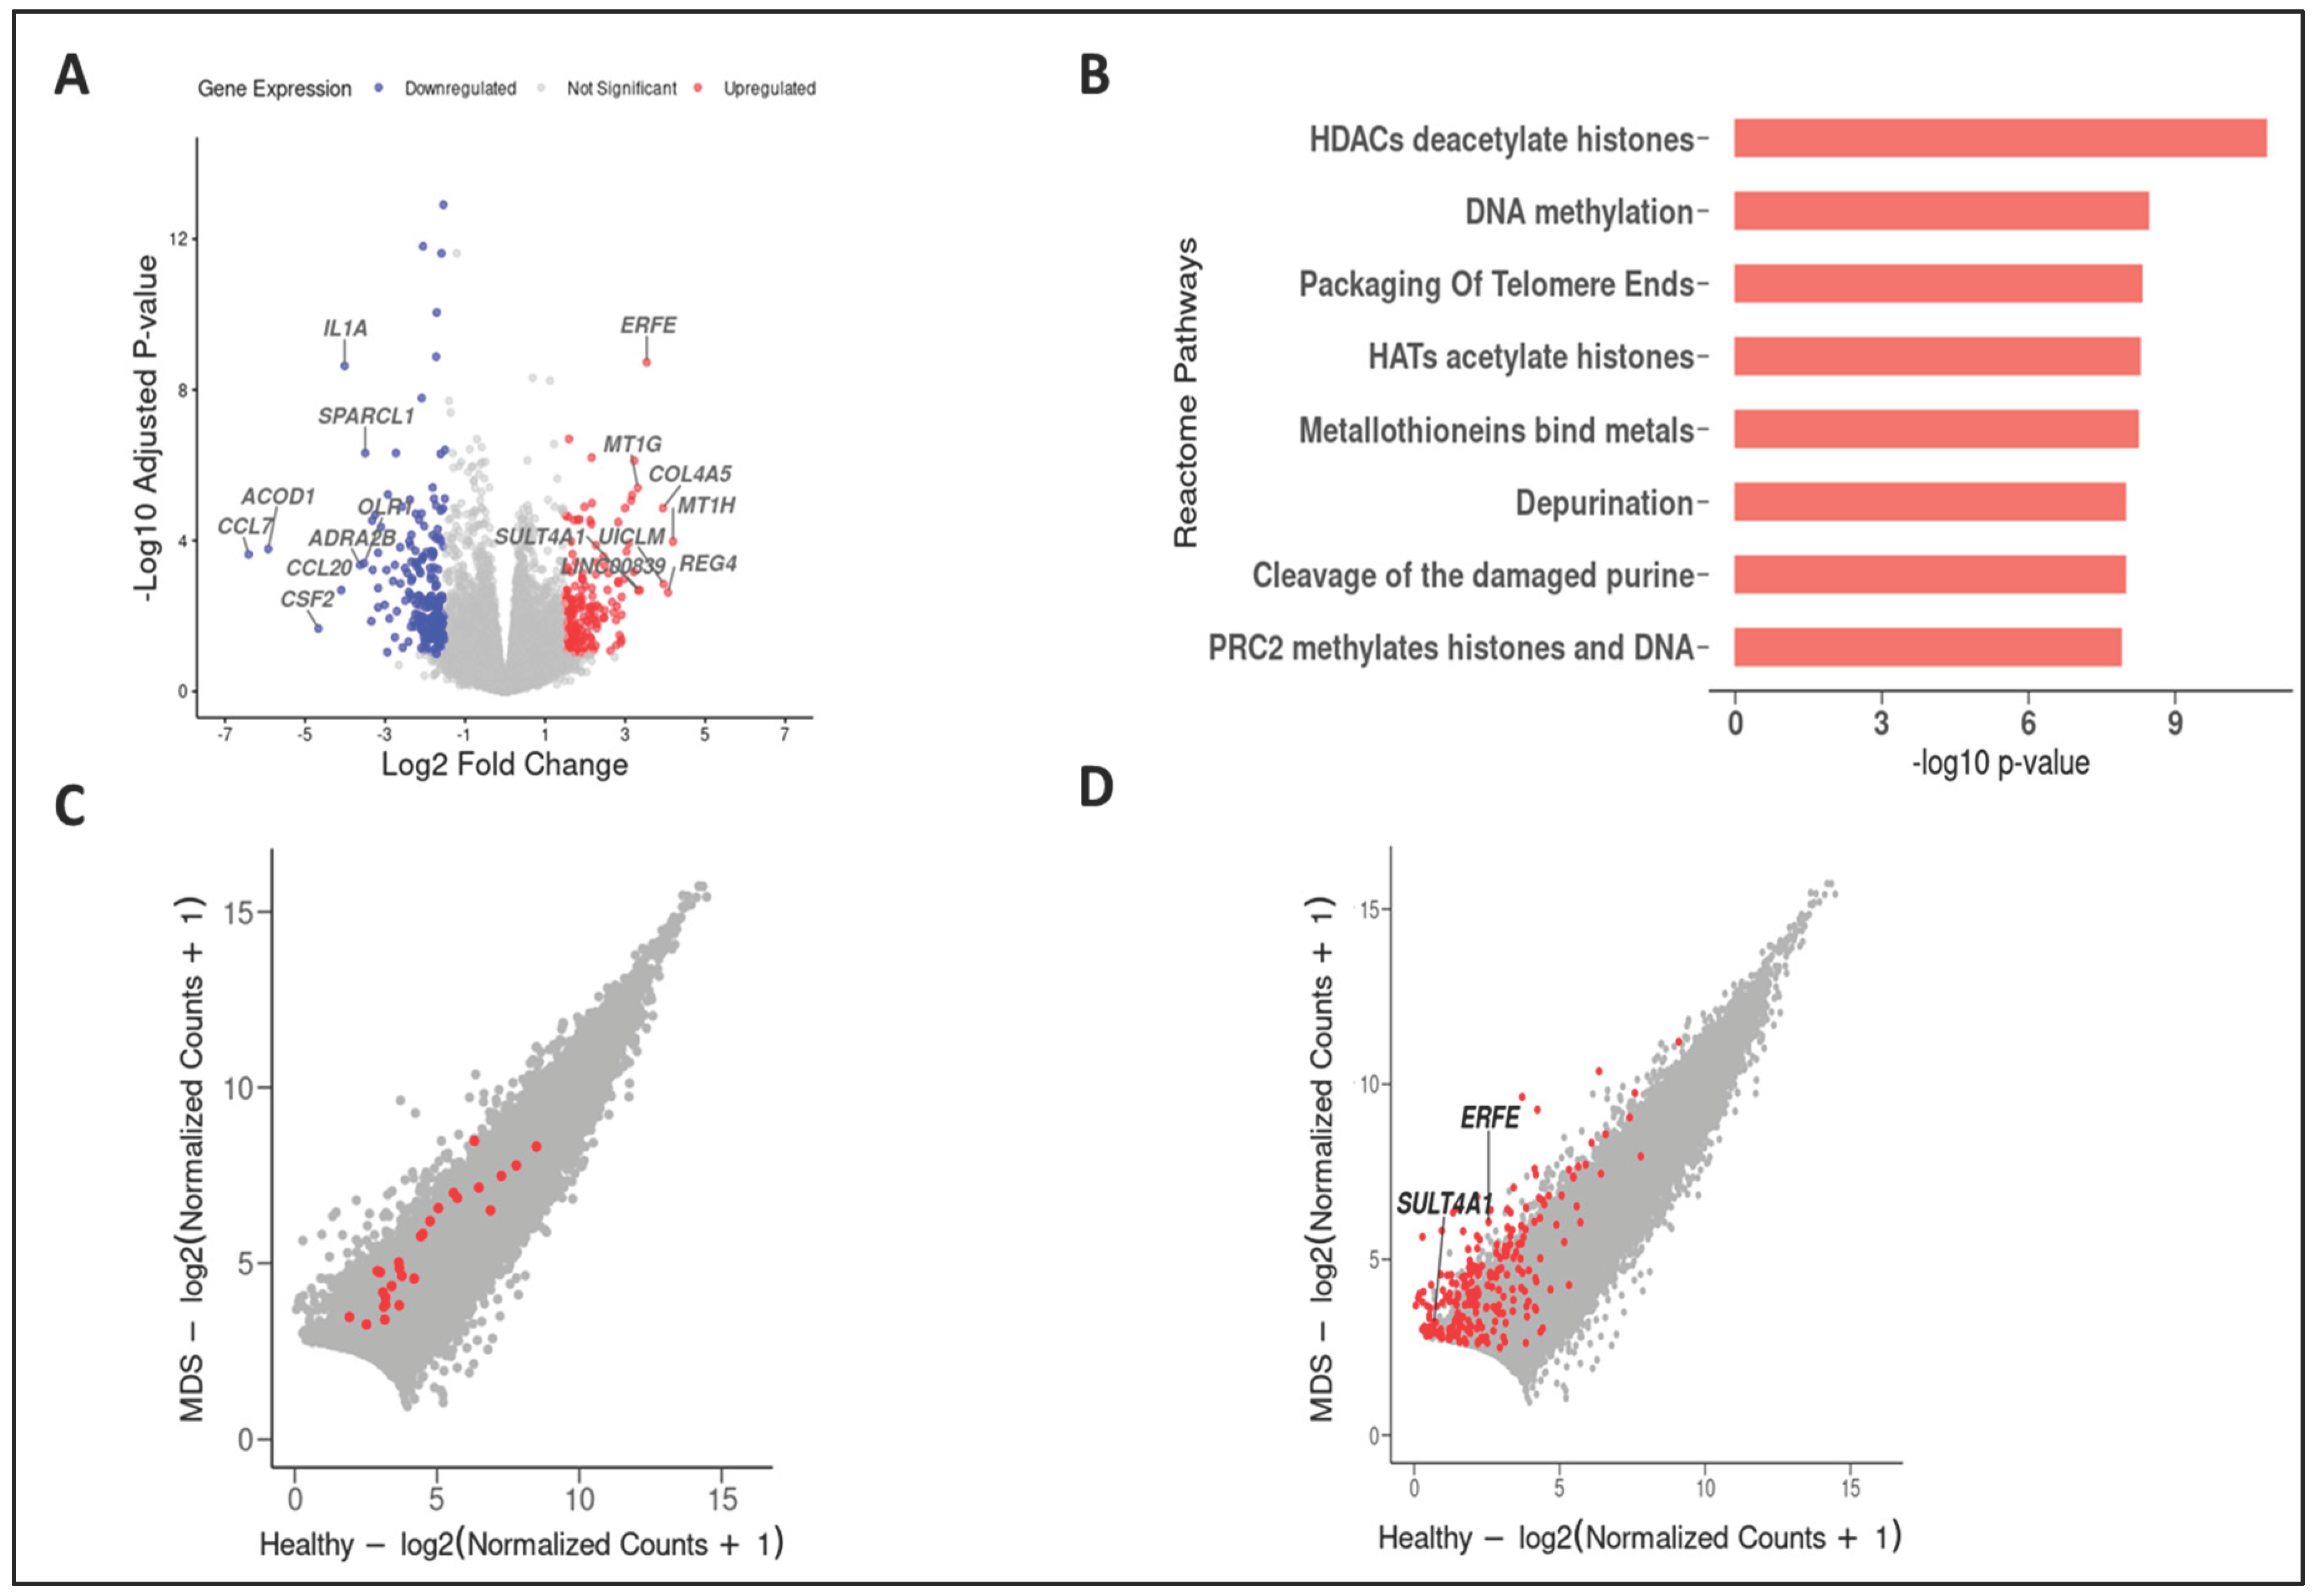
Our comprehensive meta-analysis, which pooled independent RNA-seq datasets from various MDS studies, amplified the sample size, thereby enhancing its statistical power and our capacity to pinpoint genes that are differentially expressed and unique to MDS. Using this approach helped us identify novel differentially expressed genes by contrasting the transcriptomes of healthy individuals and those with MDS. The data showed that the interleukin 1 alpha (IL1A), oxidized low-density lipoprotein receptor 1(OLR1), and adrenoceptor alpha 2B (ADRA2B) genes in [34,35,36] were among the most characteristically downregulated genes in the MDS genotype. Notably, the erythroferrone (ERFE) [37] and sulfotransferase family 4A member 1 (SULT4A1) [38] are the most upregulated genes in MDS cells (Figure 2A), which suggests extensive metabolic programming. The pathways enrichment analysis using the Reactome database revealed that, as our mutational analysis showed, the DNA methylation pathway was enriched, as Figure 2B and C show, suggesting that it plays a massive role in gene regulation and epigenetic modifications.
Moreover, Figure 2D shows the ERFE and SULT4A1 genes as novel upregulated genes in the metabolic process, identified with the GO term GO:0008152. According to this analysis, the ERFE gene positively regulates glucose imports and the fatty acid metabolic process, and the SULT4A1 gene contributes to mitochondria-involving biological processes and steroid metabolic processes. Therefore, these results suggest extensive changes to the DNA methylation pathways, which can result from a defective metabolism in MDS.
This study underscores the therapeutic potential of addressing the most commonly mutated genes that were found in 4,260 MDS patient samples gathered from diverse datasets and academic articles. These specific genes could disrupt vital signaling pathways and molecular functions, including metabolism, that play central roles in the well-being and growth of individuals with MDS. Notably, mutations in the DNMT3A gene accounted for a significant fraction (as much as 18%) of the mutations found in MDS cases [39], corroborating our extensive multicohort findings. Mutated DNMT3A has a connection with GSH levels that oppose chemotherapy. A definitive association between DNMT3A mutations and GSH levels in MDS remains to be determined, but GSH plays an essential role as an antioxidant regulating numerous cell activities [40].
Understanding the effect of DNMT3A mutations on metabolic processes in hematologic cancers might offer clarity regarding the cellular strategies that drive tumor growth, persistence, and resistance to chemotherapy. Elevated GSH levels may enhance tumor cells’ adaptability and resilience, potentially leading to drug resistance. Therefore, GSH concentration might present a potential metabolic weakness in MDS cases featuring DNMT3A mutations. The U.S. Food and Drug Administration (FDA) has sanctioned the use of hypomethylating agents (HMAs) to manage acute myeloid leukemia (AML) and MDS [41]. Ongoing clinical trials targeting MDS and their biological focuses are presented in Table 2.

4. Discussion

We delved into the genetic mutation patterns and gene expression profiles reported in independent MDS studies. This approach provided a greater understanding of the biological nature of MDS. Our investigation explored the link between mutations in genes related to MDS metabolism and the subsequent therapeutic outcomes, drawing on data from cBioPortal (MSK, 2020) and Myelodysplasia (UTokyo, Nature 2011). This approach differentiates our work from previous studies focusing on singular genes or a confined group of MDS genes. For example, the patterns of mutual exclusivity in specific genes, as presented in Table 1, underscore their pivotal roles in MDS. The DNMT3A gene, which registered the highest mutation frequency (Figure 1), also indicates potential interplay with other genes, elaborated in Table 1. Such observations illuminated the significant effect that the DNMT3A gene has on the MDS metabolic landscape, possibly including interlinkage with the enumerated genes in a common biological function. Moreover, our results imply that the cells of individuals with MDS might struggle to accommodate concurrent mutations in the genes specified in Table 1.
Interestingly, as mentioned previously, DNMT1 mutations feature prominently among the most frequent MDS mutations. This could account for the surge in clinical trials evaluating DNMT1 inhibitors. However, no recognized clinical trial has been designed to address the metabolic changes marked by elevated GSH levels associated with DNMT1 mutations. The metabolic dynamics of MDS, especially the potential therapeutic target presented by GSH, remain uncharted territory. Conversely, while TET2 gene modifications are prevalent in MDS, no clinical trials targeting these alterations have been registered. There is notable exclusivity between mutations in TET2 and IDH1/2. Studies have shown that introducing 2-hydroxyglutarate, a byproduct of IDH1/2 mutations, into TET2-deficient cells can trigger synthetic lethality [42]. This suggests that MDS patients with TET2 mutations might benefit from therapies based on the oncometabolite 2-hydroxyglutarate. Currently, no clinical trials are specifically aimed at MDS patients with TET2 mutations. Therefore, the development of inhibitors for TET2 mutations may pave the way for innovative therapeutic interventions.
Our study underscores the mutual exclusivity of TET2 and IDH1/2 mutations, hinting at a potential therapeutic target within the myeloid neoplasia dependency pathway. Recent research has begun to elucidate this relationship, revealing that the 2-hydroxyglutarate produced by IDH1/2 mutations can be lethal to TET-deficient cells. Furthermore, TET2 inhibitors demonstrate a selective effect on TET2 mutant hematopoietic precursor cells in vitro and in vivo [42]. These findings emphasize the metabolic influence of TET2-mutant cells, suggesting avenues for developing innovative therapeutic approaches. In addition, our analysis across multiple cohorts using the cBioportal database revealed NPM1 mutations in 16% of MDS patients. Metabolic assessments have also identified NPM1-mutant cases as a unique subset [43]. This discovery underscores a potential metabolic weakness in NPM1-mutant cells, offering additional possibilities for therapeutic interventions due to the implied, pronounced metabolic shift in NPM1-mutated cells.
Our gene expression meta-analysis showed that MDS patients’ transcriptome is associated with deregulation of DNA methylation, as our MDS mutational analysis suggested. In addition, the gene expression meta-analysis highlighted the deregulation of metabolism-related genes (ERFE and SULT4A1). This suggests a mechanism of metabolic control of the epigenome in MDS. Numerous studies have shown that metabolism has a profound effect on DNA methylation in cancer [44,45,46]. The ERFE gene, the primary erythroid regulator of hepcidin, was reportedly involved in alterations in cancer metabolism [47]. SULT4A1 is found within the cytosolic and mitochondrial sub-compartments of both mouse and human brains, hinting at a potential auxiliary function in mitochondrial activity [48]. A study by Hossain et al. indicated that SULT4A1 directly influences mitochondrial functionality and redox equilibrium [49]. These observations highlight the roles that SULT3A1 plays in metabolism. Exploring the MDS profile in the context of metabolic and DNA methylation mutations remains crucial for pinpointing innovative therapeutic interventions.

5. Conclusion

The inherent complexity and varied nature of MDS continue to obscure its origins, which remain to be fully understood. Moreover, exploring MDS patients’ mutation load, especially concerning metabolic processes and methylation, could illuminate their cellular molecular makeup. Such insights could further enhance our grasp on the roles of metabolism and DNA methylation in MDS and aid in devising patient-specific treatment strategies after diagnosis. In summary, this study offers a deeper understanding of how to identify novel MDS-associated metabolic genes and DNA methylation, the potential clinical applications and the possibility of improving therapeutic avenues for MDS patients, and a foundation for prospective clinical trials and investigations.

Author Contributions

Conceptualization: Waseem Alzamzami and Sael Alatawi. Writing – original draft: Waseem Alzamzami. Writing – review & editing: Sael Alatawi. All authors read and approved the final manuscript.

Funding

There was no external sponsorship for this study.

Competing Interests

The authors declare that they have no potential competing interests.

Ethics approval

Given the nature of this design, there is no need for additional ethical approval. Thus, the ethical approval was waived by the Local Ethics Committee. The current study investigated the publicly available data using the cBioPortal, publications from Myelodysplastic (MSK, 2020) and Myelodysplasia (UTokyo, Nature 2011), and data from three independent cohorts (GSE114922 in 2015, GSE63569 in 2018, and GSE183328 in 2022).

References

  1. Cazzola M: Myelodysplastic Syndromes. N Engl J Med 2020, 383, 1358–1374. [CrossRef]
  2. Patel SS: Pediatric Myelodysplastic Syndromes. Clin Lab Med 2021, 41, 517–528. [CrossRef] [PubMed]
  3. Balaian E, Wobus M, Bornhäuser M, Chavakis T, Sockel K: Myelodysplastic Syndromes and Metabolism. Int J Mol Sci 2021, 22, 11250. [CrossRef]
  4. Lauritsen TB, Norgaard JM, Dalton SO, Gronbaek K, El-Galaly TC, Ostgard LSG: 10-year nationwide trends in incidence, treatment patterns, and mortality of patients with myelodysplastic syndromes in Denmark. Leuk Res 2023, 128, 107056. [CrossRef]
  5. Hosono N: Genetic abnormalities and pathophysiology of MDS. Int J Clin Oncol 2019, 24, 885–892. [CrossRef]
  6. Ogawa S: Genetics of MDS. Blood 2019, 133, 1049–1059. [CrossRef] [PubMed]
  7. Cantor JR, Sabatini DM: Cancer cell metabolism: one hallmark, many faces. Cancer discovery 2012, 2, 881–898. [CrossRef]
  8. Folmes CD, Dzeja PP, Nelson TJ, Terzic A: Metabolic plasticity in stem cell homeostasis and differentiation. Cell Stem Cell 2012, 11, 596–606. [CrossRef] [PubMed]
  9. Warburg O: On respiratory impairment in cancer cells. Science 1956, 124, 269–270. [CrossRef]
  10. Hoff FW, Madanat YF: Molecular Drivers of Myelodysplastic Neoplasms (MDS)-Classification and Prognostic Relevance. Cells 2023, 12, 627. [CrossRef]
  11. Bennett JM, Catovsky D, Daniel MT, Flandrin G, Galton DA, Gralnick HR, Sultan C: Proposals for the classification of the myelodysplastic syndromes. Br J Haematol 1982, 51, 189–199. [CrossRef]
  12. Harris NL, Jaffe ES, Diebold J, Flandrin G, Muller-Hermelink HK, Vardiman J, Lister TA, Bloomfield CD: The World Health Organization classification of neoplastic diseases of the hematopoietic and lymphoid tissues. Report of the Clinical Advisory Committee meeting, Airlie House, Virginia, November, 1997. Ann Oncol 1999, 10, 1419–1432. [CrossRef]
  13. Arber DA, Orazi A, Hasserjian R, Thiele J, Borowitz MJ, Le Beau MM, Bloomfield CD, Cazzola M, Vardiman JW: The 2016 revision to the World Health Organization classification of myeloid neoplasms and acute leukemia. Blood 2016, 127, 2391–2405. [CrossRef] [PubMed]
  14. Pellagatti A, Armstrong RN, Steeples V, Sharma E, Repapi E, Singh S, Sanchi A, Radujkovic A, Horn P, Dolatshad H et al: Impact of spliceosome mutations on RNA splicing in myelodysplasia: dysregulated genes/pathways and clinical associations. Blood 2018, 132, 1225–1240. [CrossRef]
  15. Choudhary GS, Pellagatti A, Agianian B, Smith MA, Bhagat TD, Gordon-Mitchell S, Sahu S, Pandey S, Shah N, Aluri S et al: Activation of targetable inflammatory immune signaling is seen in myelodysplastic syndromes with SF3B1 mutations. Elife 2022, 11, e78136. [CrossRef]
  16. Dolatshad H, Pellagatti A, Fernandez-Mercado M, Yip BH, Malcovati L, Attwood M, Przychodzen B, Sahgal N, Kanapin AA, Lockstone H et al: Disruption of SF3B1 results in deregulated expression and splicing of key genes and pathways in myelodysplastic syndrome hematopoietic stem and progenitor cells. Leukemia 2015, 29, 1092–1103. [CrossRef]
  17. Berastegui N, Ainciburu M, Romero JP, Garcia-Olloqui P, Alfonso-Pierola A, Philippe C, Vilas-Zornoza A, San Martin-Uriz P, Ruiz-Hernández R, Abarrategi A et al: The transcription factor DDIT3 is a potential driver of dyserythropoiesis in myelodysplastic syndromes. Nat Commun 2022, 13, 7619. [CrossRef]
  18. Cerami E, Gao J, Dogrusoz U, Gross BE, Sumer SO, Aksoy BA, Jacobsen A, Byrne CJ, Heuer ML, Larsson E et al: The cBio cancer genomics portal: an open platform for exploring multidimensional cancer genomics data. Cancer discovery 2012, 2, 401–404. [CrossRef]
  19. Gao J, Aksoy BA, Dogrusoz U, Dresdner G, Gross B, Sumer SO, Sun Y, Jacobsen A, Sinha R, Larsson E et al: Integrative analysis of complex cancer genomics and clinical profiles using the cBioPortal. Science signaling 2013, 6, l1. [CrossRef]
  20. Papaemmanuil E, Gerstung M, Bullinger L, Gaidzik VI, Paschka P, Roberts ND, Potter NE, Heuser M, Thol F, Bolli N et al: Genomic Classification and Prognosis in Acute Myeloid Leukemia. N Engl J Med 2016, 374, 2209–2221. [CrossRef]
  21. Tyner JW, Tognon CE, Bottomly D, Wilmot B, Kurtz SE, Savage SL, Long N, Schultz AR, Traer E, Abel M et al: Functional genomic landscape of acute myeloid leukaemia. Nature 2018, 562, 526–531. [CrossRef]
  22. Papaemmanuil E, Gerstung M, Malcovati L, Tauro S, Gundem G, Van Loo P, Yoon CJ, Ellis P, Wedge DC, Pellagatti A et al: Clinical and biological implications of driver mutations in myelodysplastic syndromes. Blood 2013, 122, 3616–3627. [CrossRef]
  23. Yoshida K, Sanada M, Shiraishi Y, Nowak D, Nagata Y, Yamamoto R, Sato Y, Sato-Otsubo A, Kon A, Nagasaki M et al: Frequent pathway mutations of splicing machinery in myelodysplasia. Nature 2011, 478, 64–69. [CrossRef]
  24. IDH1 isocitrate dehydrogenase (NADP(+)) 1 [ Homo sapiens (human) ]. In.; 27-Aug-2023.
  25. IDH2 isocitrate dehydrogenase (NADP(+)) 2 [ Homo sapiens (human) ]. In.; 18-Aug-2023.
  26. Welch JS, Petti AA, Miller CA, Fronick CC, O’Laughlin M, Fulton RS, Wilson RK, Baty JD, Duncavage EJ, Tandon B et al: TP53 and Decitabine in Acute Myeloid Leukemia and Myelodysplastic Syndromes. N Engl J Med 2016, 375, 2023–2036. [CrossRef]
  27. TET2 tet methylcytosine dioxygenase 2 [ Homo sapiens (human) ]. In.; 18-Aug-2023.
  28. DNMT3A DNA methyltransferase 3 alpha [ Homo sapiens (human) ]. In.; 18-Aug-2023.
  29. ASXL1 ASXL transcriptional regulator 1 [ Homo sapiens (human) ]. In.; 18-Aug-2023.
  30. SF3B1 splicing factor 3b subunit 1 [ Homo sapiens (human) ]. In.; 18-Aug-2023.
  31. SRSF2 serine and arginine rich splicing factor 2 [ Homo sapiens (human) ]. In.; 18-Aug-2023.
  32. RUNX1 RUNX family transcription factor 1 [ Homo sapiens (human) ]. In.; 18-Aug-2023.
  33. NPM1 nucleophosmin 1 [ Homo sapiens (human) ]. In.; 18-Aug-2023.
  34. IL1A interleukin 1 alpha [ Homo sapiens (human) ]. In.; 10-Oct-2023.
  35. OLR1 oxidized low density lipoprotein receptor 1 [ Homo sapiens (human) ]. In.; 10-Oct-2023.
  36. ADRA2B adrenoceptor alpha 2B [ Homo sapiens (human) ]. In.; 10-Oct-2023.
  37. ERFE erythroferrone [ Homo sapiens (human) ]. In.; 10-Oct-2023.
  38. SULT4A1 sulfotransferase family 4A member 1 [ Homo sapiens (human) ]. In.; 10-Oct-2023.
  39. Gangat N, Patnaik MM, Tefferi A: Myelodysplastic syndromes: Contemporary review and how we treat. Am J Hematol 2016, 91, 76–89. [CrossRef]
  40. Lu SC: Glutathione synthesis. Biochim Biophys Acta 2013, 1830, 3143–3153. [CrossRef]
  41. Xu P, Hu G, Luo C, Liang Z: DNA methyltransferase inhibitors: an updated patent review (2012-2015). Expert Opin Ther Pat 2016, 26, 1017–1030. [CrossRef]
  42. Guan Y, Tiwari AD, Phillips JG, Hasipek M, Grabowski DR, Pagliuca S, Gopal P, Kerr CM, Adema V, Radivoyevitch T et al: A Therapeutic Strategy for Preferential Targeting of TET2 Mutant and TET-dioxygenase Deficient Cells in Myeloid Neoplasms. Blood Cancer Discov 2021, 2, 146–161. [CrossRef]
  43. Simonetti G, Mengucci C, Padella A, Fonzi E, Picone G, Delpino C, Nanni J, De Tommaso R, Franchini E, Papayannidis C et al: Integrated genomic-metabolic classification of acute myeloid leukemia defines a subgroup with NPM1 and cohesin/DNA damage mutations. Leukemia 2021, 35, 2813–2826. [CrossRef]
  44. Kinnaird A, Zhao S, Wellen KE, Michelakis ED: Metabolic control of epigenetics in cancer. Nature reviews Cancer 2016, 16, 694–707. [CrossRef]
  45. Thakur C, Chen F: Connections between metabolism and epigenetics in cancers. Semin Cancer Biol 2019, 57, 52–58. [CrossRef] [PubMed]
  46. Morrison AJ: Cancer cell metabolism connects epigenetic modifications to transcriptional regulation. Febs j 2022, 289, 1302–1314. [CrossRef] [PubMed]
  47. Lelièvre P, Sancey L, Coll JL, Deniaud A, Busser B: Iron Dysregulation in Human Cancer: Altered Metabolism, Biomarkers for Diagnosis, Prognosis, Monitoring and Rationale for Therapy. Cancers (Basel) 2020, 12, 3524. [CrossRef]
  48. Garcia PL, Hossain MI, Andrabi SA, Falany CN: Generation and Characterization of SULT4A1 Mutant Mouse Models. Drug Metab Dispos 2018, 46, 41–45. [CrossRef] [PubMed]
  49. Hossain MI, Marcus JM, Lee JH, Garcia PL, Gagné JP, Poirier GG, Falany CN, Andrabi SA: SULT4A1 Protects Against Oxidative-Stress Induced Mitochondrial Dysfunction in Neuronal Cells. Drug Metab Dispos 2019, 47, 949–953. [CrossRef]
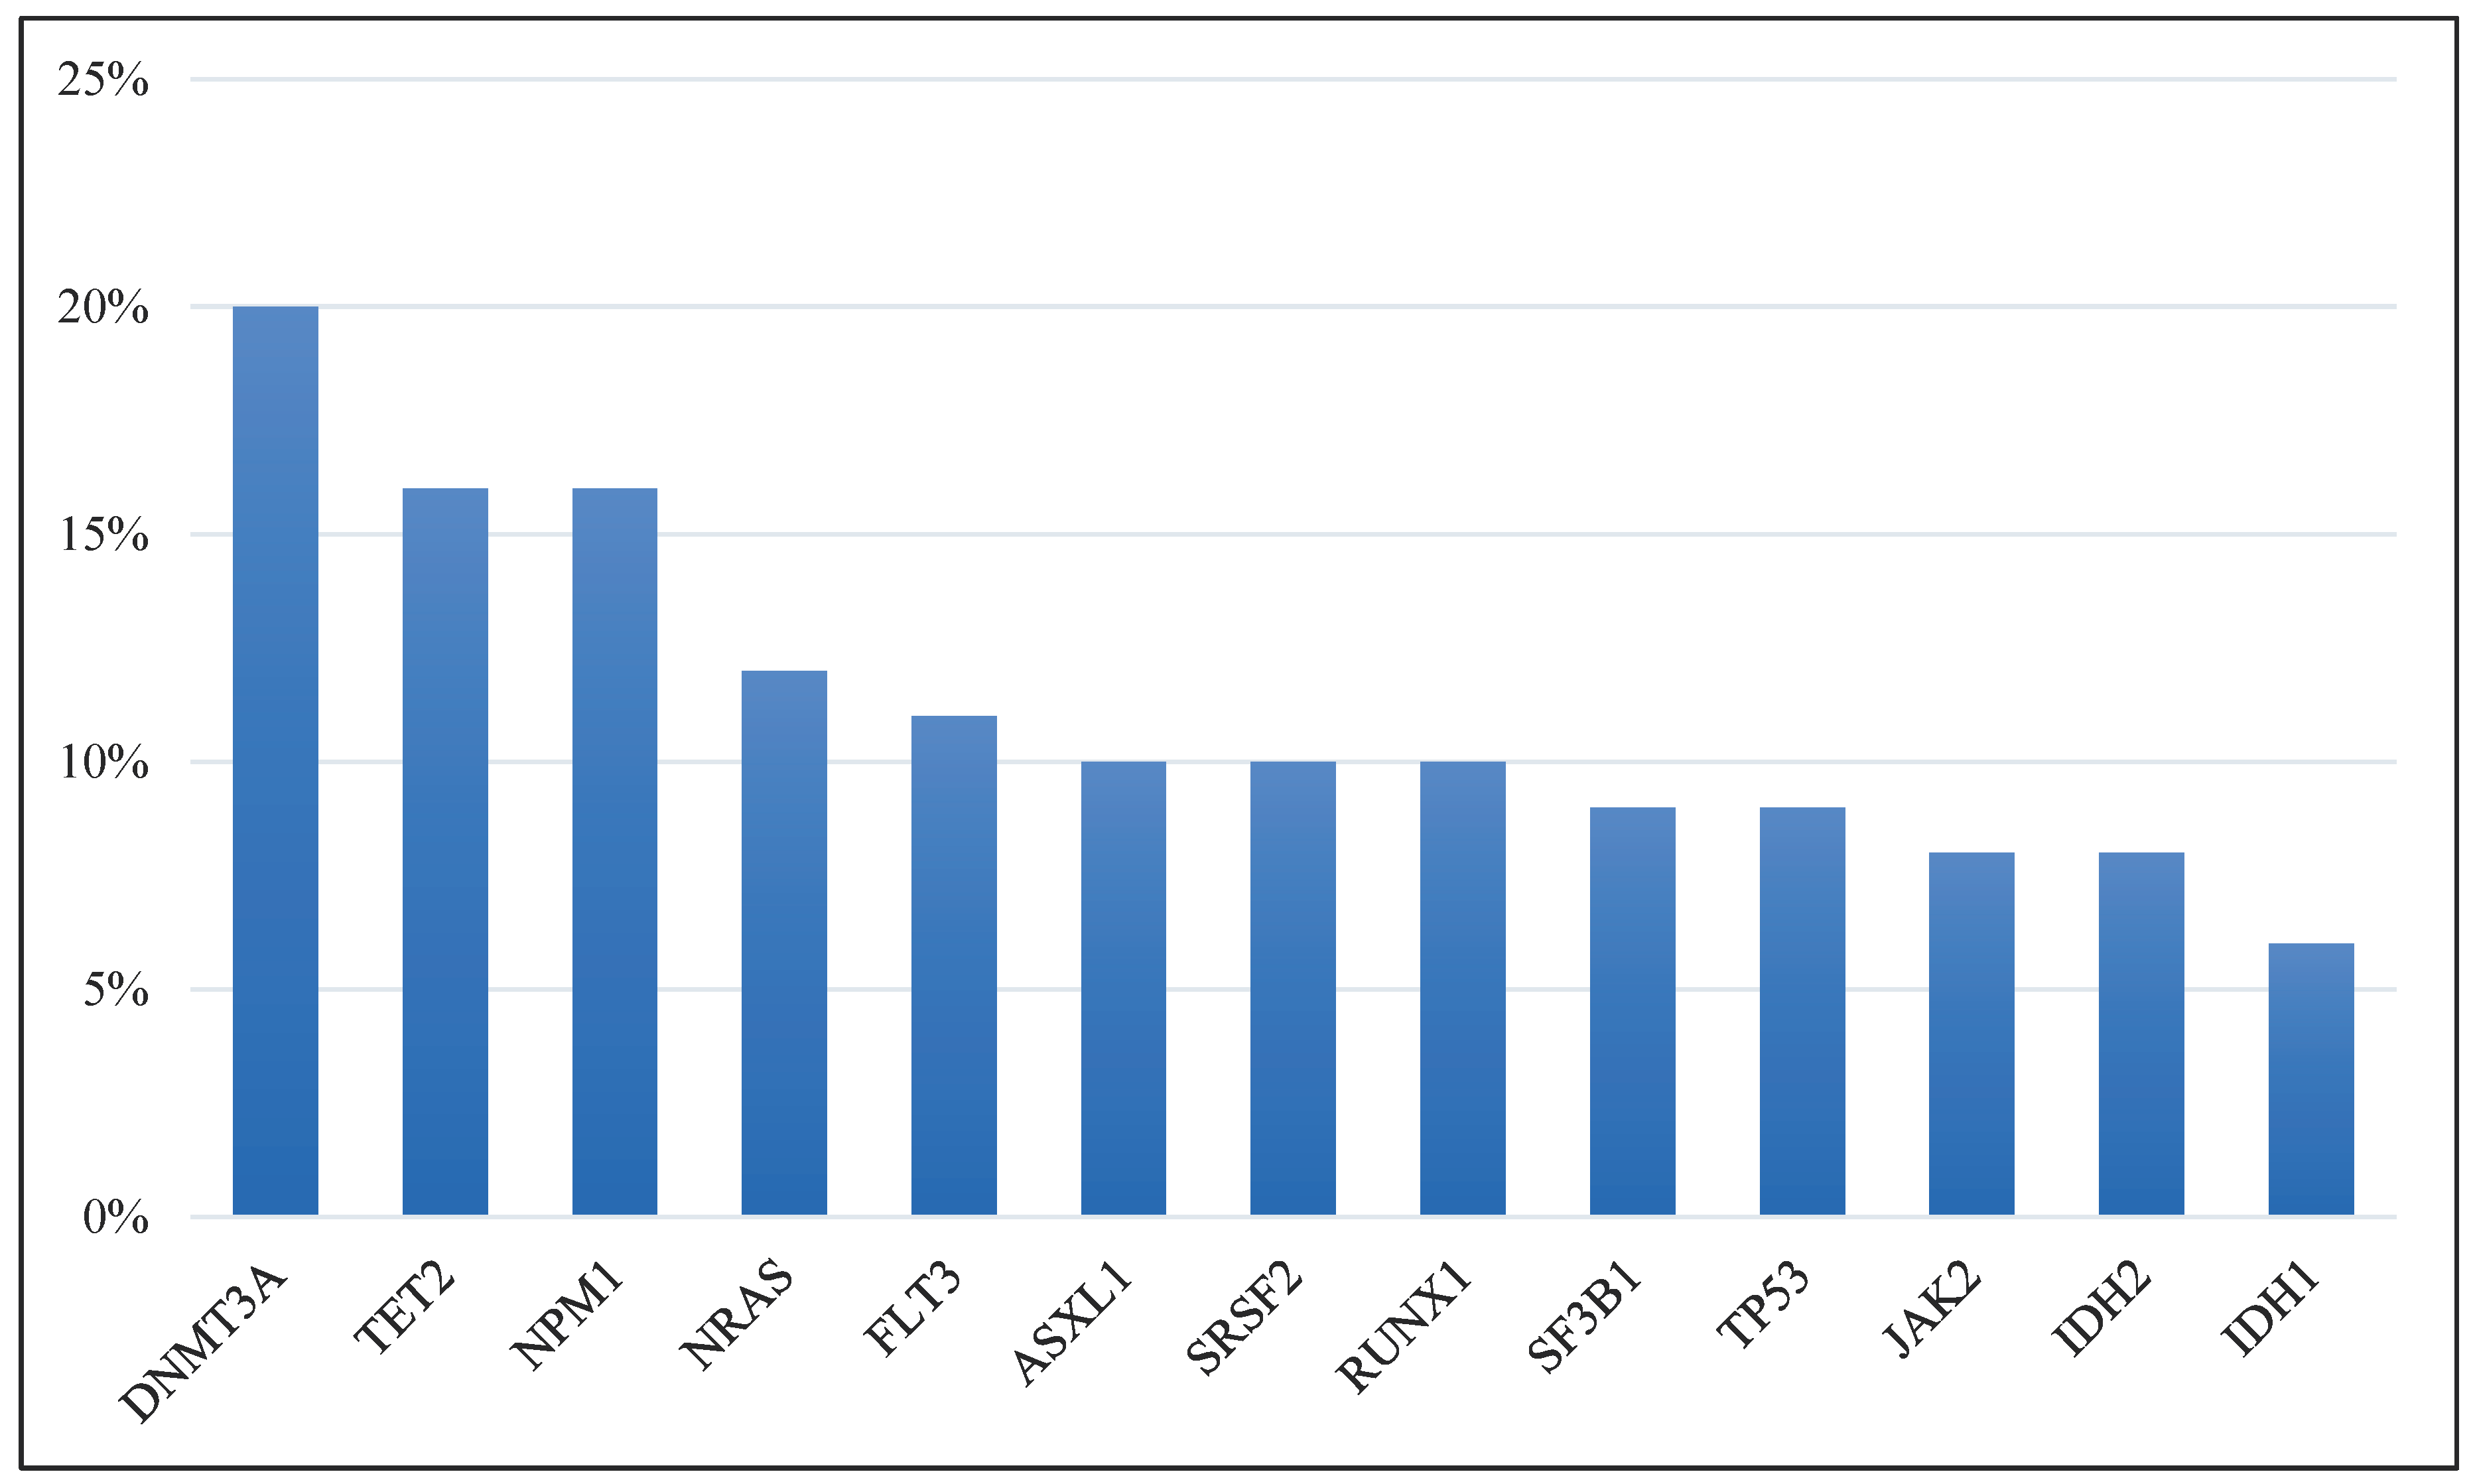
Figure 1. Percentage of Mutated Genes in MDS Patients. The most significantly altered genes among 4,260 MDS patient samples from various datasets and published studies.
Preprints 99052 g001
Figure 2. The expression landscape of individuals with MDS vs. healthy individuals. The identified signature genes that are involved in the DNA methylation and metabolic processes in MDS cases. (A) Volcano plot showing the gene expression of significantly up- or down-regulated genes in MDS cells. (B) Pathway enrichment analysis using the Reactome database, depicted as a bar plot of the most positively enriched pathways. (C) Scatter plot of gene expression highlighting genes related to DNA methylation in MDS. (D) Scatter plot of gene expression of metabolism-related genes (ERFE and SULT4A1) that are enriched in MDS and inconsistent with the DNA methylation gene set.
Preprints 99052 g002
Table 1. Mutual exclusivity observed among MDS patients with specific genetic alterations.
A B Neither A Not B B Not A Both p-Value Tendency
SRSF2 DNMT3A 3026 379 816 39 <0.001 Mutual exclusivity
ASXL1 DNMT3A 3014 391 810 45 <0.001 Mutual exclusivity
JAK2 DNMT3A 3110 295 814 41 <0.001 Mutual exclusivity
TP53 DNMT3A 3063 342 796 59 0.002 Mutual exclusivity
Table 2. The current ongoing clinical trials targeting metabolic pathways associated with mutated genes in MDS and myeloid leukemias. The table summarizes the list of recruiting clinical trials focused on targeted biological processes (according to https://clinicaltrials.gov, retrieved on the 14th of August, 2023).
NCT Number Study Status Conditions Targeted Biological Process Interventions/Drugs/Procedure
NCT04493164 Recruiting MDS/AML Mutant IDH1 Inhibitor Ivosidenib/Liposome-encapsulated Daunorubicin-Cytarabine
NCT03503409 Recruiting MDS/AML Mutant IDH1 Inhibitor AG-120
NCT03744390 Recruiting MDS/AML Mutant IDH2 Inhibitor AG-221
NCT04827719 Recruiting MDS/AML High-dose cytarabine delivery BST-236
NCT04279847 Recruiting MDS BET inhibitor and JAK inhibitor INCB057643/Ruxolitinib
NCT04140487 Recruiting MDS/AML FLT3 tyrosine kinase inhibitors and DNA Methylation and synthesis Inhibitor Azacitidine/Gilteritinib/Venetoclax
NCT05010122 Recruiting MDS/AML FLT3 tyrosine kinase inhibitor and DNMT1 Inhibitor Decitabine and Cedazuridine/Gilteritinib/Venetoclax
NCT03661307 Recruiting MDS/AML DNMT1 Inhibitor and FLT3 tyrosine kinase inhibitor Decitabine/Quizartinib/Venetoclax
NCT03683433 Recruiting MDS/AML/CML DNA Methylation and synthesis Inhibitor and Mutant IDH Inhibitor Azacitidine/Enasidenib Mesylate
NCT05636514 Recruiting MDS/AML/CML FLT3 tyrosine kinase inhibitor and FAK inhibitor Decitabine-Cedazuridine 35 Mg-100 Mg ORAL TABLET/Defactinib
NCT04493138 Recruiting MDS/CML DNMT1 Inhibitor and FLT3 tyrosine kinase inhibitor Azacitidine/Quizartinib
NCT05817955 Recruiting MDS DNA Methylation and synthesis Inhibitor and JAK Inhibitor Azacitidine (AZA) with Ruxolitinib
NCT04803721 Recruiting MDS
NCT04250051 Recruiting MDS/AML Mutant IDH1 Inhibitor Cytarabine/Filgrastim/Fludarabine/Fludarabine Phosphate/Ivosidenib
NCT04167917 Recruiting MDS/AML/CML DNA methyltransferase 1 (DNMT1) inhibition NTX-301
NCT04187703 Recruiting MDS DNA methyltransferase (DNMT) inhibition 5-azacytidine/Decitabine
NCT05282459 Recruiting MDS Mutant IDH2 Inhibitor Enasidenib mesylat dose escalation
NCT04741945 Recruiting MDS Antihyperglycemic Metformin
NCT04477291 Recruiting MDS/AML FLT3 Inhibitor CG-806
NCT03839771 Recruiting MDS/AML Mutant IDH1 Inhibitor and Mutant IDH2 Inhibitor AG-120/Placebo for AG-120/AG-221/Placebo for AG-221
NCT05030675 Recruiting MDS/CML Tyrosine kinase inhibitor Fostamatinib
NCT03953898 Recruiting MDS/AML poly (ADP-ribose) polymerase (PARP) inhibitor Biospecimen Collection/Bone Marrow Aspiration/Olaparib
NCT03999723 Recruiting MDS/AML/CML Vitamin C/Placebo
NCT04764474 Recruiting Hematological Malignancies With IDH mutations Mutant IDH1/2 Inhibitor HMPL-306
Disclaimer/Publisher’s Note: The statements, opinions and data contained in all publications are solely those of the individual author(s) and contributor(s) and not of MDPI and/or the editor(s). MDPI and/or the editor(s) disclaim responsibility for any injury to people or property resulting from any ideas, methods, instructions or products referred to in the content.
Copyright: This open access article is published under a Creative Commons CC BY 4.0 license, which permit the free download, distribution, and reuse, provided that the author and preprint are cited in any reuse.
Prerpints.org logo

Preprints.org is a free preprint server supported by MDPI in Basel, Switzerland.

Subscribe

© 2024 MDPI (Basel, Switzerland) unless otherwise stated