Preprint
Article

Cardiomyocyte Heat Production Measured In Vitro with Temperature Probes and by Means of Differential Isothermal Calorimetry Indicates a Role of the ABA/LANCL1-2 Hormone/Receptors System in Thermogenesis

Altmetrics

Downloads

107

Views

72

Comments

0

Submitted:

18 February 2024

Posted:

20 February 2024

You are already at the latest version

Alerts
Abstract
Abscisic acid (ABA) is a conserved “stress hormone” in unicellular organisms, plants and animals. In mammals, ABA and its receptors LANCL1 and LANCL2 stimulate insulin-independent cell glucose uptake and oxidative metabolism: overexpression of LANCL1/2 increases, and their si-lencing conversely reduces, mitochondrial number, respiration and proton gradient dissipation in muscle cells and in brown adipocytes. We hypothesized that the ABA/LANCL hor-mone/receptors system could be involved in thermogenesis. Heat production by LANCL1/2-overexpressing vs. double-silenced cells was compared in rat H9c2 cardiomyocytes with two different methods: differential temperature measurements using sensitive thermistor probes, and differential isothermal calorimetry. Results indicate that overexpressing cells generate an approx. double amount of thermal power compared with double-silenced cells, and that addition of ABA further doubles heat production in overexpressing cells. With the temperature probes, we find a time-scale of approx. 4 min for thermogenesis to “turn on” after nutrient addition. These results identify the ABA/LANCL hormone receptors system as a hitherto unknown regu-lator of cell thermogenesis. Pharmacologic means of increasing metabolic energy dissipation are considered a promising strategy to reduce oxidative stress and lipid accumulation at a cellular and organismic level: from this study, LANCL1-2 proteins emerge as targetable controllers of ther-mogenesis through their natural ligand ABA.
Keywords: 
Subject: Biology and Life Sciences  -   Biochemistry and Molecular Biology

1. Introduction

The capacity to adapt to environmental challenges is as fundamental a feature of the living as is the ability to reproduce. Abscisic acid (ABA) is a terpenoid signal molecule present from unicellular organisms to higher plants and mammals, with a conserved, cross-kingdom role as a “stress signal”, allowing organisms to respond to environmental stimuli as diverse as water and nutrient availability, blood glucose levels, UV irradiation [1].
Abscisic acid is produced in response to water and nutrient availability by microalgae, as well as by higher plants [2], to UV light by plant stomatal cells, as well as by human granulocytes and keratinocytes [3], to hypoxia by higher plants, as well as by mammalian cardiomyocytes [4,5]. Such diversity of cell types and of functional responses is obviously mediated by cell-specific signaling pathways and molecular effectors, however ABA emerges as a hormonal signal orchestrating the response to environmental stress of organisms as distant in evolution as marine sponges [6] and mammalian cardiomyocytes [5]. It should be noted that the environmental stimuli eliciting ABA-mediated responses are very “basic”: soil humidity, nutrient and oxygen availability affecting plant growth, water temperature regulating marine sponge filtration, UV light inducing plant antioxidant defenses and human keratinocyte inflammatory response.
ABA perception occurs through different receptors in plants [7] and in animals. In mammals, two ABA receptors are known so far, LANCL1 and LANCL2, belonging to the lanthionine synthetase C-like (LanCL) gene family, most likely the result of an ancestral gene duplication, which also contains LANCL3, transcribed at very low levels and probably a pseudogene. LANCL proteins show a significant sequence homology with bacterial lanthionine synthetase, which produces cysteine-derived natural antibiotics (lantibiotics). Although mammalian LANCL proteins do not synthesize lantibiotics [8], they evidently play an essential role in animal physiology since triple LANCL knock-out (KO) mice die prematurely [9]. LANCL1 and LANCL2 share several structural and functional features which make them a redundant system for ABA sensing and signaling: i) both are attached to the inner side of the plasma membrane, through which ABA is transported by non-specific anion transporters [10]; ii) they are similarly and ubiquitously expressed in mammalian tissues and organs (https://www.proteinatlas.org/); iii) both bind ABA, albeit with a somewhat different affinity, with a Kd in the submicromolar and in the low micromolar range, respectively [11,12]; iv) they both activate the AMPK/PGC-1α/ERRα/Sirt1 axis, a signaling pathway which controls mitochondrial mass and function. Interestingly, silencing of LANCL2 in cells or its genetic ablation in mice induce the spontaneous overexpression of LANCL1, while silencing of LANCL1 results in overexpression of LANCL2 in adipose tissue and muscle cells [12,13]. Receptor redundancy and a reciprocal “compensatory” transcriptional control again point to the physiological relevance of the ABA-LANCL1/2 hormone-receptor system in mammals.
Indeed, the ABA/LANCL system has been shown to stimulate insulin-independent glucose uptake and its oxidative metabolism in adipocytes and muscle cells, which, combined, represent approx. 50% of mammalian body weight. As a consequence of this ABA/LANCL-mediated increase of glucose uptake and metabolism by muscle and adipose tissue, blood glucose levels are reduced in ABA-treated rodents and humans as compared with untreated controls [14,15]. The AMPK/PGC-1α/ERRα axis activated by the ABA-LANCL1/2 hormone-receptors system not only controls glycemia, by stimulating adipose and muscle cells to drain glucose from the blood, but also stimulates mitochondrial respiration in muscle and adipose cells [12,13]. Mitochondria are the power plant of cells, where enzymatic oxidation of metabolic substrates produces reduced NAD and FAD coenzymes, which in turn power the respiratory chain, generating the mitochondrial proton gradient (ΔΨ) between the inner mitochondrial membrane (IMM) and the mitosol that eventually allows ADP phosphorylation to ATP by ATP synthase. The partial dissipation of the ΔΨ by specific proton-channels allows thermogenesis, arguably as essential a feature of the animal kingdom as respiration itself. These proton channels are referred to as uncoupling proteins, because they partly uncouple proton flux through the inner mitochondrial membrane from ATP synthesis. They are under the transcriptional control of specific hormones which regulate thermogenesis, i.e., T3 and catecholamines, acting via specific receptors (thyroid hormone and β-adrenergic receptors, respectively). Recently, overexpression of LANCL1 and/or of LANCL2 was shown to increase, while their combined silencing conversely reduced, mitochondrial number, respiration and uncoupling both in human brown adipocytes [13] and in rat cardiomyocytes [5]. Notably, overexpression of LANCL1/2 per se (without addition of ABA) induced these significant effects on mitochondrial function, by activating a transcriptional response leading to activation of the AMPK/PGC-1α/Sirt1 axis, which in turn controls mitochondrial biogenesis and function [16].
The significantly higher mitochondrial mass, O2 consumption and oxidative phoshorylation (oxphos) uncoupling observed in LANCL1/2 overexpressing rat cardiomyocytes should result in a higher heat production of the overexpressing compared with the double-silenced cells under the same conditions; however, a direct temperature or heat production measurement on cells has never been performed until now.
The aim of this study was to directly measure heat production by LANCL1/2-overexpressing vs. double-silenced H9c2 rat cardiomyocytes with super-sensitive temperature probes on relatively small cell samples. These measures were compared with those obtained with a differential scanning calorimeter (DSC) on the same cell types. Results obtained indicate an almost double heat production by LANCL1/2-overexpressing vs. double-silenced cells, and a further 100% increase of heat production in ABA-treated vs. –untreated LANCL1/2-overexpressing cells. These results provide the first direct demonstration that the ABA-LANCL1/2 hormone-receptors system controls thermogenesis in mammalian cells.

2. Materials and Methods

2.1. Cell Transduction

H9c2 rat cardiomyoblasts, obtained from ATCC (LGC Standards s.r.l. Milan, Italy), were cultured in Dulbecco’s modified Eagle’s medium (DMEM) containing 25 mM glucose (DMEM-high glucose) (Sigma-Aldrich, Milan, Italy) supplemented with 10% fetal bovine serum (FBS) (Sigma-Aldrich, Milan, Italy), penicillin (62.5 μg/ml) and streptomycin (100 μg/ml) (Sigma-Aldrich, Milan, Italy) (complete medium) in a humidified atmosphere containing 5% CO2 at 37 °C.
LANCL1 and LANCL2 silencing (sh), LANCL1 and LANCL2 overexpression (ov) and cell transductions were performed as described in [12-Spinelli 2021 Mol Met].
The protein expression levels of hLANCL1 and hLANCL2 in over-expressing cells were approx. 10 and 40 times higher than in control cells, transfected with the empty vector, while protein levels were both reduced by approx. 90% in double-silenced cells, as detected by Western blot and qPCR [5].

2.2. Cell Culture

Twentyfour hours before each experiment, cells were seeded at a density of 1x10⁶ in 75 cm2 flasks in DMEM containing 5 mM glucose (DMEM low glucose), without FBS. “Starved” cells were harvested by trypsin treatment, washed twice in PBS containing Ca2+/Mg2+ and resuspended in the same buffer at 12.5x10⁶/ml (for DSC experiments) or at 2.5x10⁶ cells/ml for measures with the temperature probes. Cells were kept at room temperature in the immediate vicinity of the instrument to be used for temperature recording (DSC or temperature probes set-up) for thermalization until use.
The final concentrations of the nutrients used to start oxidative metabolism in the starved cells were the same in all experiments: 2 mM glutamine, 1 mM pyruvate and 17.5 mM glucose in PBS with Ca2+/Mg2+. To inhibit oxidative phosphorylation, cells were pre-incubated for 2h with 0.03 mg/ml digitonin, 0.5 µM rotenone and 0.5 µM antimycin A prior to experimental measures. To inhibit glycolysis and mitochondrial respiration, 3 mM KCN and 10 mM 2′-deoxy-glucose were added together with the nutrients immediately before measurements.

2.3. Temperature Probes

NTC type BR series, glass encapsulated bead thermistors cat n. BR55KA622K, produced by Amphenol, were obtained from Mouser Electronics, Inc. Milano, Italy. The glass bead has nominal diameter × length of 1.4 × 3 mm and a thermal time constant of 0.2 s in water. The temperature coefficient (% resistance change / °C) is α = −4.0 at 25 °C, and we used probes with resistance R ≈ 6.2 kΩ at room temperature. Some measurements were also obtained with epoxy encapsulated NTC type thermistors produced by Vishay (cat. No. NTCLE305E4502SB) obtained from Newark Electronics (cat. 86R9240). These have similar characteristics: α = −3.7 at 25 °C, R ≈ 5 kΩ at room temperature. After carefully soldering the leads to insulated copper wire, the former were mounted on a 1 mL type disposable pipette tip, cut to size to allow the wires to run inside the pipette tip, with the glass bulb encapsulating the thermistor protruding at the end. The thermistor leads were glued to the pipette tip, for mechanical stability and electrical insulation, using 5 min epoxy. This insulation proved unreliable in water after about 20 minutes, which restricted our measurements to time scales below 10 min, the probe assemblies being air dried in between measurements. The epoxy encapsulated probes were suspended directly by their (factory insulated) leads from the screw cap of a 1.5 mL vial. For the measurements, the two probes (corresponding to sample and reference) were wired as two arms of a Wheatstone bridge configuration, thus automatically taking the difference signal between the probes. The other two arms of the bridge were formed by 6.7 kΩ resistances and a 1 kΩ, 10 turns potentiometer which allowed to balance the bridge so the difference signal could be amplified. We used lock-in detection, the bridge being powered by the sinusoidal reference signal from a lock-in amplifier (Stanford Research Systems, model SR530).
The signal was acquired by a PC running National Instruments Labview software via a PCI-6321 data acquisition board.). Typical settings for the lock-in amplifier were: reference signal Vin = 140 mV rms amplitude at v ~ 100 Hz frequency, 500 μV sensitivity, 1 s time constant. The potentiometer on the bridge then allowed the signal to be zeroed within a few μV before starting the measurements. From the bridge configuration and the temperature coefficient of the probes, with Vin = 100 mV, a 10 μV signal corresponded to a temperature difference of 0.01 °C.

2.4. Experimental Procedure with the Temperature Probes

All parts of the set-up were pre-thermalized at room temperature for at least 30 min before starting the experiments. In a typical experiment, 1.0 mL of a cell suspension containing 2.5 × 10⁶ cells in PBS with Ca2+/Mg2+ was added to each one of two Eppendorf tubes, held in a holder, in air. With the probes in air, the signal was zeroed by means of the potentiometer. Then a temperature probe assembly was inserted in each Eppendorf, the micropipette tip being held in position at the center of the suspension by a removable Styrofoam lid. Recording was started immediately after insertion of the probes in the cell suspension; after thermalization of the probes, the probes were removed, a volume of 10 µl of PBS, containing or not the nutrient mixture to allow cell oxidative metabolism, was added to the Eppendorf tubes, the cell suspension was mixed once by gentle pipetting, the probes were inserted again and fixed in the central position of the suspension and recordings were started again.

2.5. DSC

Measurements were performed using a heat flux Differential Scanning Calorimetry (DSC 111 by Setaram) designed as a Calvet-type calorimeter. The sample and reference sensors are inserted in a calorimetric block and are composed of 120 thermocouples mounted in a cylinder surrounding the measurement zone and providing a highly sensitivity sensor.
Briefly, 200 µl of the cell suspensions to be compared were added to each one of two “home-made” Ta crucibles and thermalized at ambient temperature for at least 30 min. After addition of the nutrient mixture (10 µl), or of an equal volume of PBS with Ca2+/Mg2+ (controls) the crucibles were capped, placed inside the DSC chamber and the temperature ramp program was started. A typical temperature recording is shown in Figure 5. Recordings were acquired for 2450s.

3. Results

3.1. Thermistor Based Measurements

3.1.1. Temperature Probe Experiments

Experiments were performed in the following way. Two empty Eppendorf (EP) tubes and two temperature probe assemblies were prepared and let thermalize in air, next to each other. The EP tubes were in a plastic holder, about 5 cm apart, in air. The probes were held by a polystyrene “lid” which allowed them to be plunged simultaneously into the EP tubes. At this point the bridge was (approximately) balanced by means of the 10 turns potentiometer, and not touched again. Two further cell suspensions, to be used in a following experiment, were also prepared beforehand in EP tubes and left to thermalize in the vicinity of the experimental set-up, while we were having tea. Recording of the temperature signal was started and after a few seconds, when the signals were stable, 10 µL of the nutrient solution in PBS+Ca2+/Mg2+, or of PBS+Ca2+/Mg2+ without nutrients (control), was pipetted into the cell suspensions and the suspensions mixed once by gentle pipetting. Immediately afterwards the probes were plunged into the tubes, and a plastic box about 20 × 20 × 20 cm3 was placed over the experiment to reduce disturbances due to air currents. The “dead time” between mixing in the last component and the end of trace disturbances allowing the start of useful measurements was about 20 s, i.e., relatively short compared to the characteristic time scales of the experiment, as we shall see.
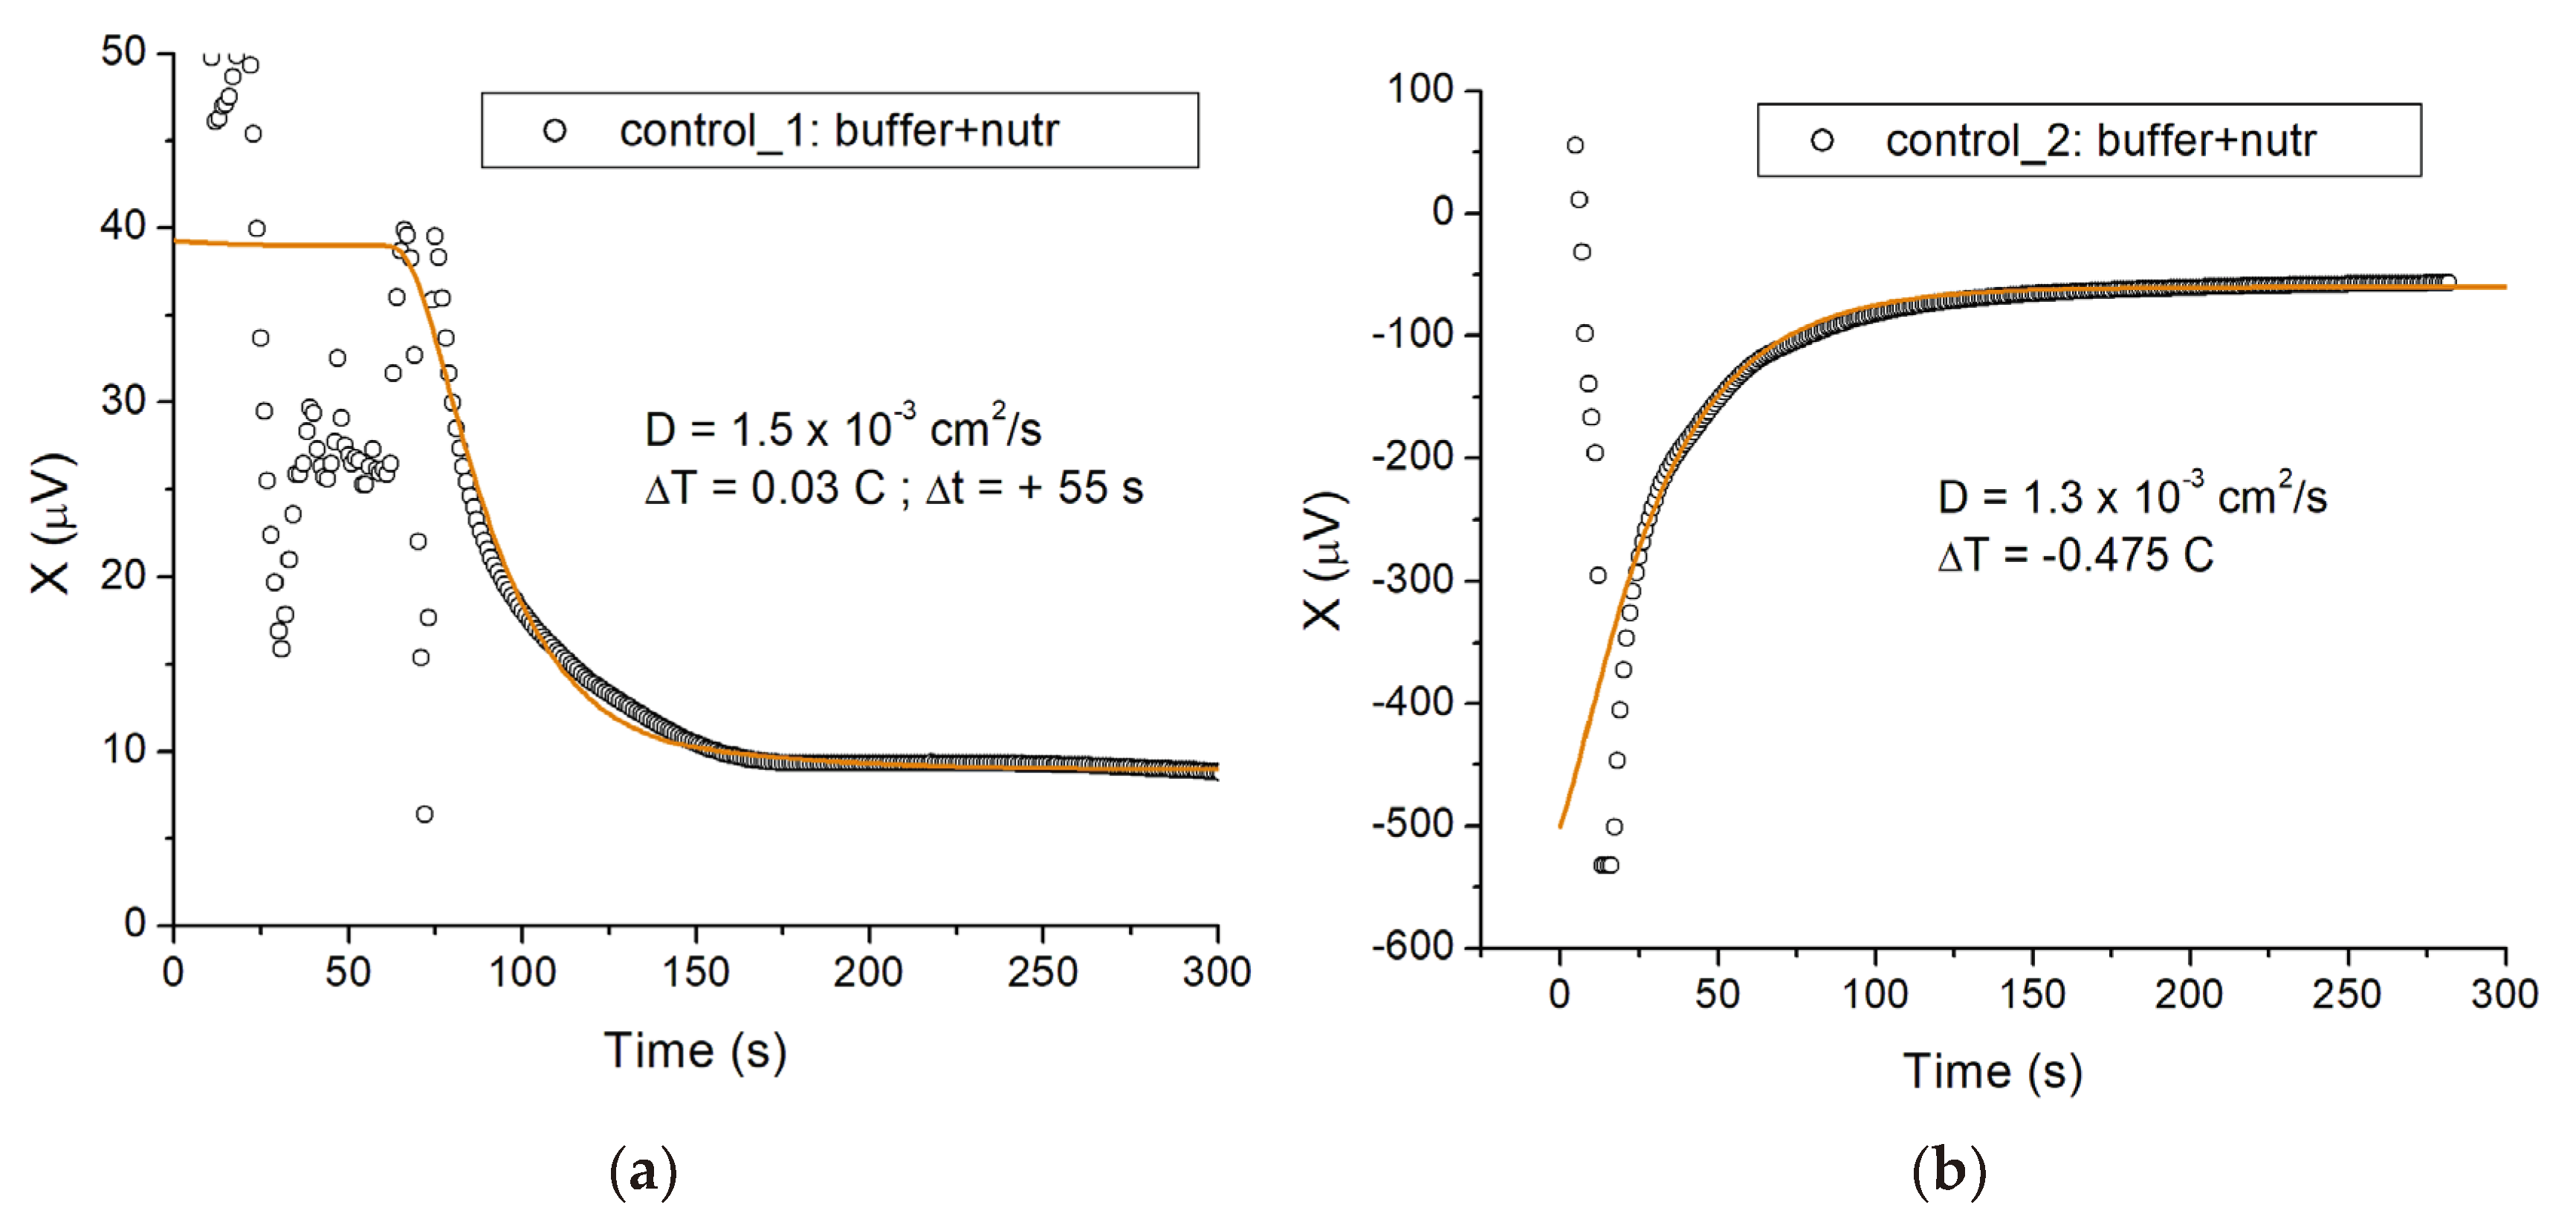
When the probes were plunged into the EP tubes there were transient large fluctuations in the signal, followed by an exponential relaxation to a steady state. The reason is an initial, unavoidable small temperature difference (of order a few hundredths of 1 C) between the two samples, which was introduced during mixing and transferring. Figure 1 shows two examples of this relaxation process.
In both cases the two eppendorfs (sample and reference) contained identical solutions (buffer + nutrients). We plot the output X of the lock-in amplifier in the course of time, where 10 μV corresponds to a temperature difference between the vials of approximately 0.01 °C. Because the bridge is not perfectly balanced, only differences in the signal X are significant, not the absolute value. For Figure 1a, the initial temperature difference between vial 1 (reference) and vial 2 (sample) was positive and approximately equal to 0.03 C, i.e., ∆T = T2T1 ≈ +0.03 C. The corresponding total excursion of the signal over the relaxation process is about 30 μV. The heat diffusion time characteristic of the system can be obtained by fitting an exponential relaxation to these data, and is found to be about 30 s (fit not shown). The solid line in the plot is the result of solving the diffusion equation for an idealized model of the experimental system, which we discuss later.
Figure 1b shows a case where the initial temperature difference between the vials was negative, and much larger ∆T ≈ −0.475 C. This large mismatch originated from the different initial temperatures of the probe assemblies: these were wet from a previous measurement and partially blow dried in air, resulting in relatively large temperature variations across the assembly due to uneven water evaporation. Also, the initial steep variation of the signal reflects the lock-in recovering from overload below −500 μV. However, the same model (solid line) accounts for the relaxation to the steady state, and the relaxation time is essentially the same as in Figure 1a, as expected. The slightly different diffusion constant (1.3 × 10⁻³ cm2/s) used in Figure 1b reflects the increased role of heat transfer between the probe assemblies and the solutions.
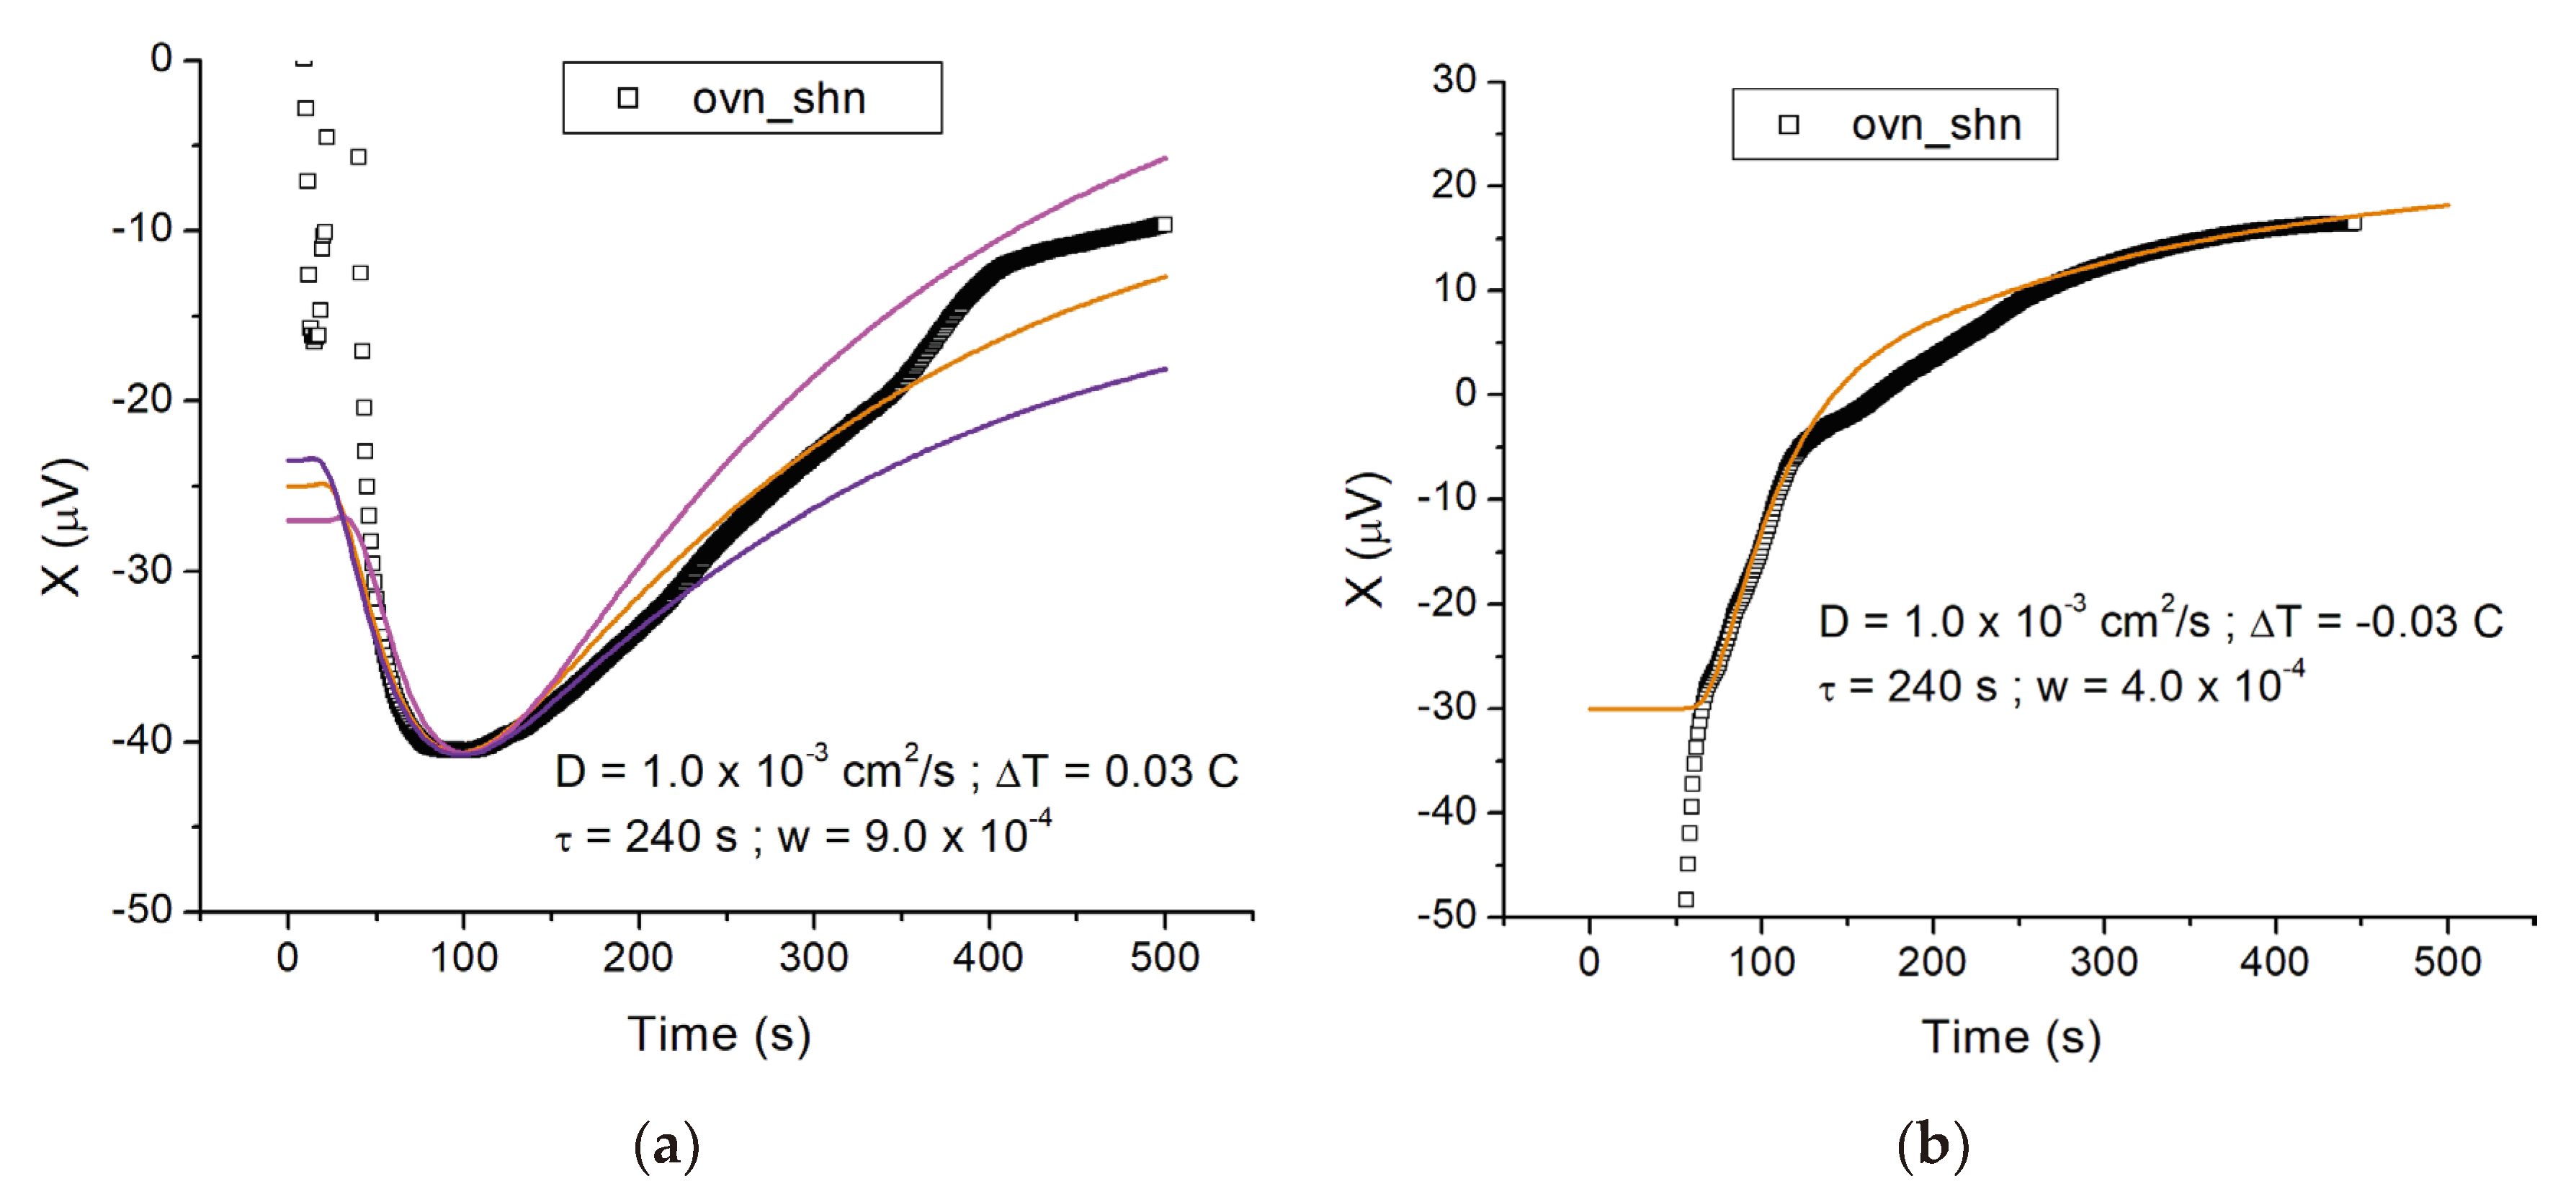
The experiments with cells were performed with the cell suspension to be tested in the test vial (vial 2), and the control cell suspension in the reference vial (vial 1), so that ∆T > 0 means that additional heat is being released by the cells to be tested compared to the control. Figure 2 shows two examples of cells overexpressing LANCL1/2 (ov), compared to double-silenced cells (sh), both vials containing nutrients.
In the following, we label this configuration as “ovn_shn”. In Figure 2a the initial temperature difference was positive (∆T = 0.03 C), similar to Figure 1a. However, the initial relaxation, which plateaus at X ≈ −40 μV (t ≈ 100 s) is now followed by a monotonic increase, which signifies additional heat released in vial 2. If the cells were releasing heat at constant power, we would expect the signal to plateau at long times, reflecting the steady state temperature difference resulting from a steady state heat source in vial 2. The magnitude of the power emitted determines the signal difference ∆X between the minimum (X ≈ −40 μV) and the plateau at long times in the measurement (X ≈ −10 μV, determined from the ochra line in the plot). In the case of Figure 2a, ∆X ≈ 30 μV corresponding to a steady state temperature difference ∆Tf = 0.03 C and ultimately a power per unit volume emitted = 9.0 × 10⁻⁴ cal/(cm3s), as we see below. The time course of the signal for t > 100 s, on the other hand, informs on the dynamics of the cells “turning on” after nutrients are added, as we shall see.
Figure 2b shows a measurement on a similar sample, where the initial temperature difference was negative, similar to Figure 1b. In this case the signal is monotonically increasing because both the initial thermal relaxation (over a ~30 s time scale, here corresponding to −30 < X < 0 μV) and the heating by the cells lead to an increase in the signal X(t). We obtained several measurements with LANCL1/2 overexpressing cells vs silenced cells, using N = 2.5 × 10⁶ cells in a V = 1 mL volume; they all show an additional heating power emitted by the overexpressing cells, compared to the silenced cells. Quantitatively, if we use the model of Section 1.2 to interpret the temperature measurements, we find this additional steady state heating power to be approximately
= 8.0 × 10⁻⁴ cal/s = 3.3 mW. However, the experimental calibration of Section 1.3 provides a more realistic estimate for the heating power, ≈ 450 μW for the trace of Figure 2a and ≈ 300 μW for Figure 2b.
On the other hand, the model also provides an estimate for the typical time scale for the cells to metabolically “turn on”. From the time traces of Figure 2, we find τ ≈ 4 min.
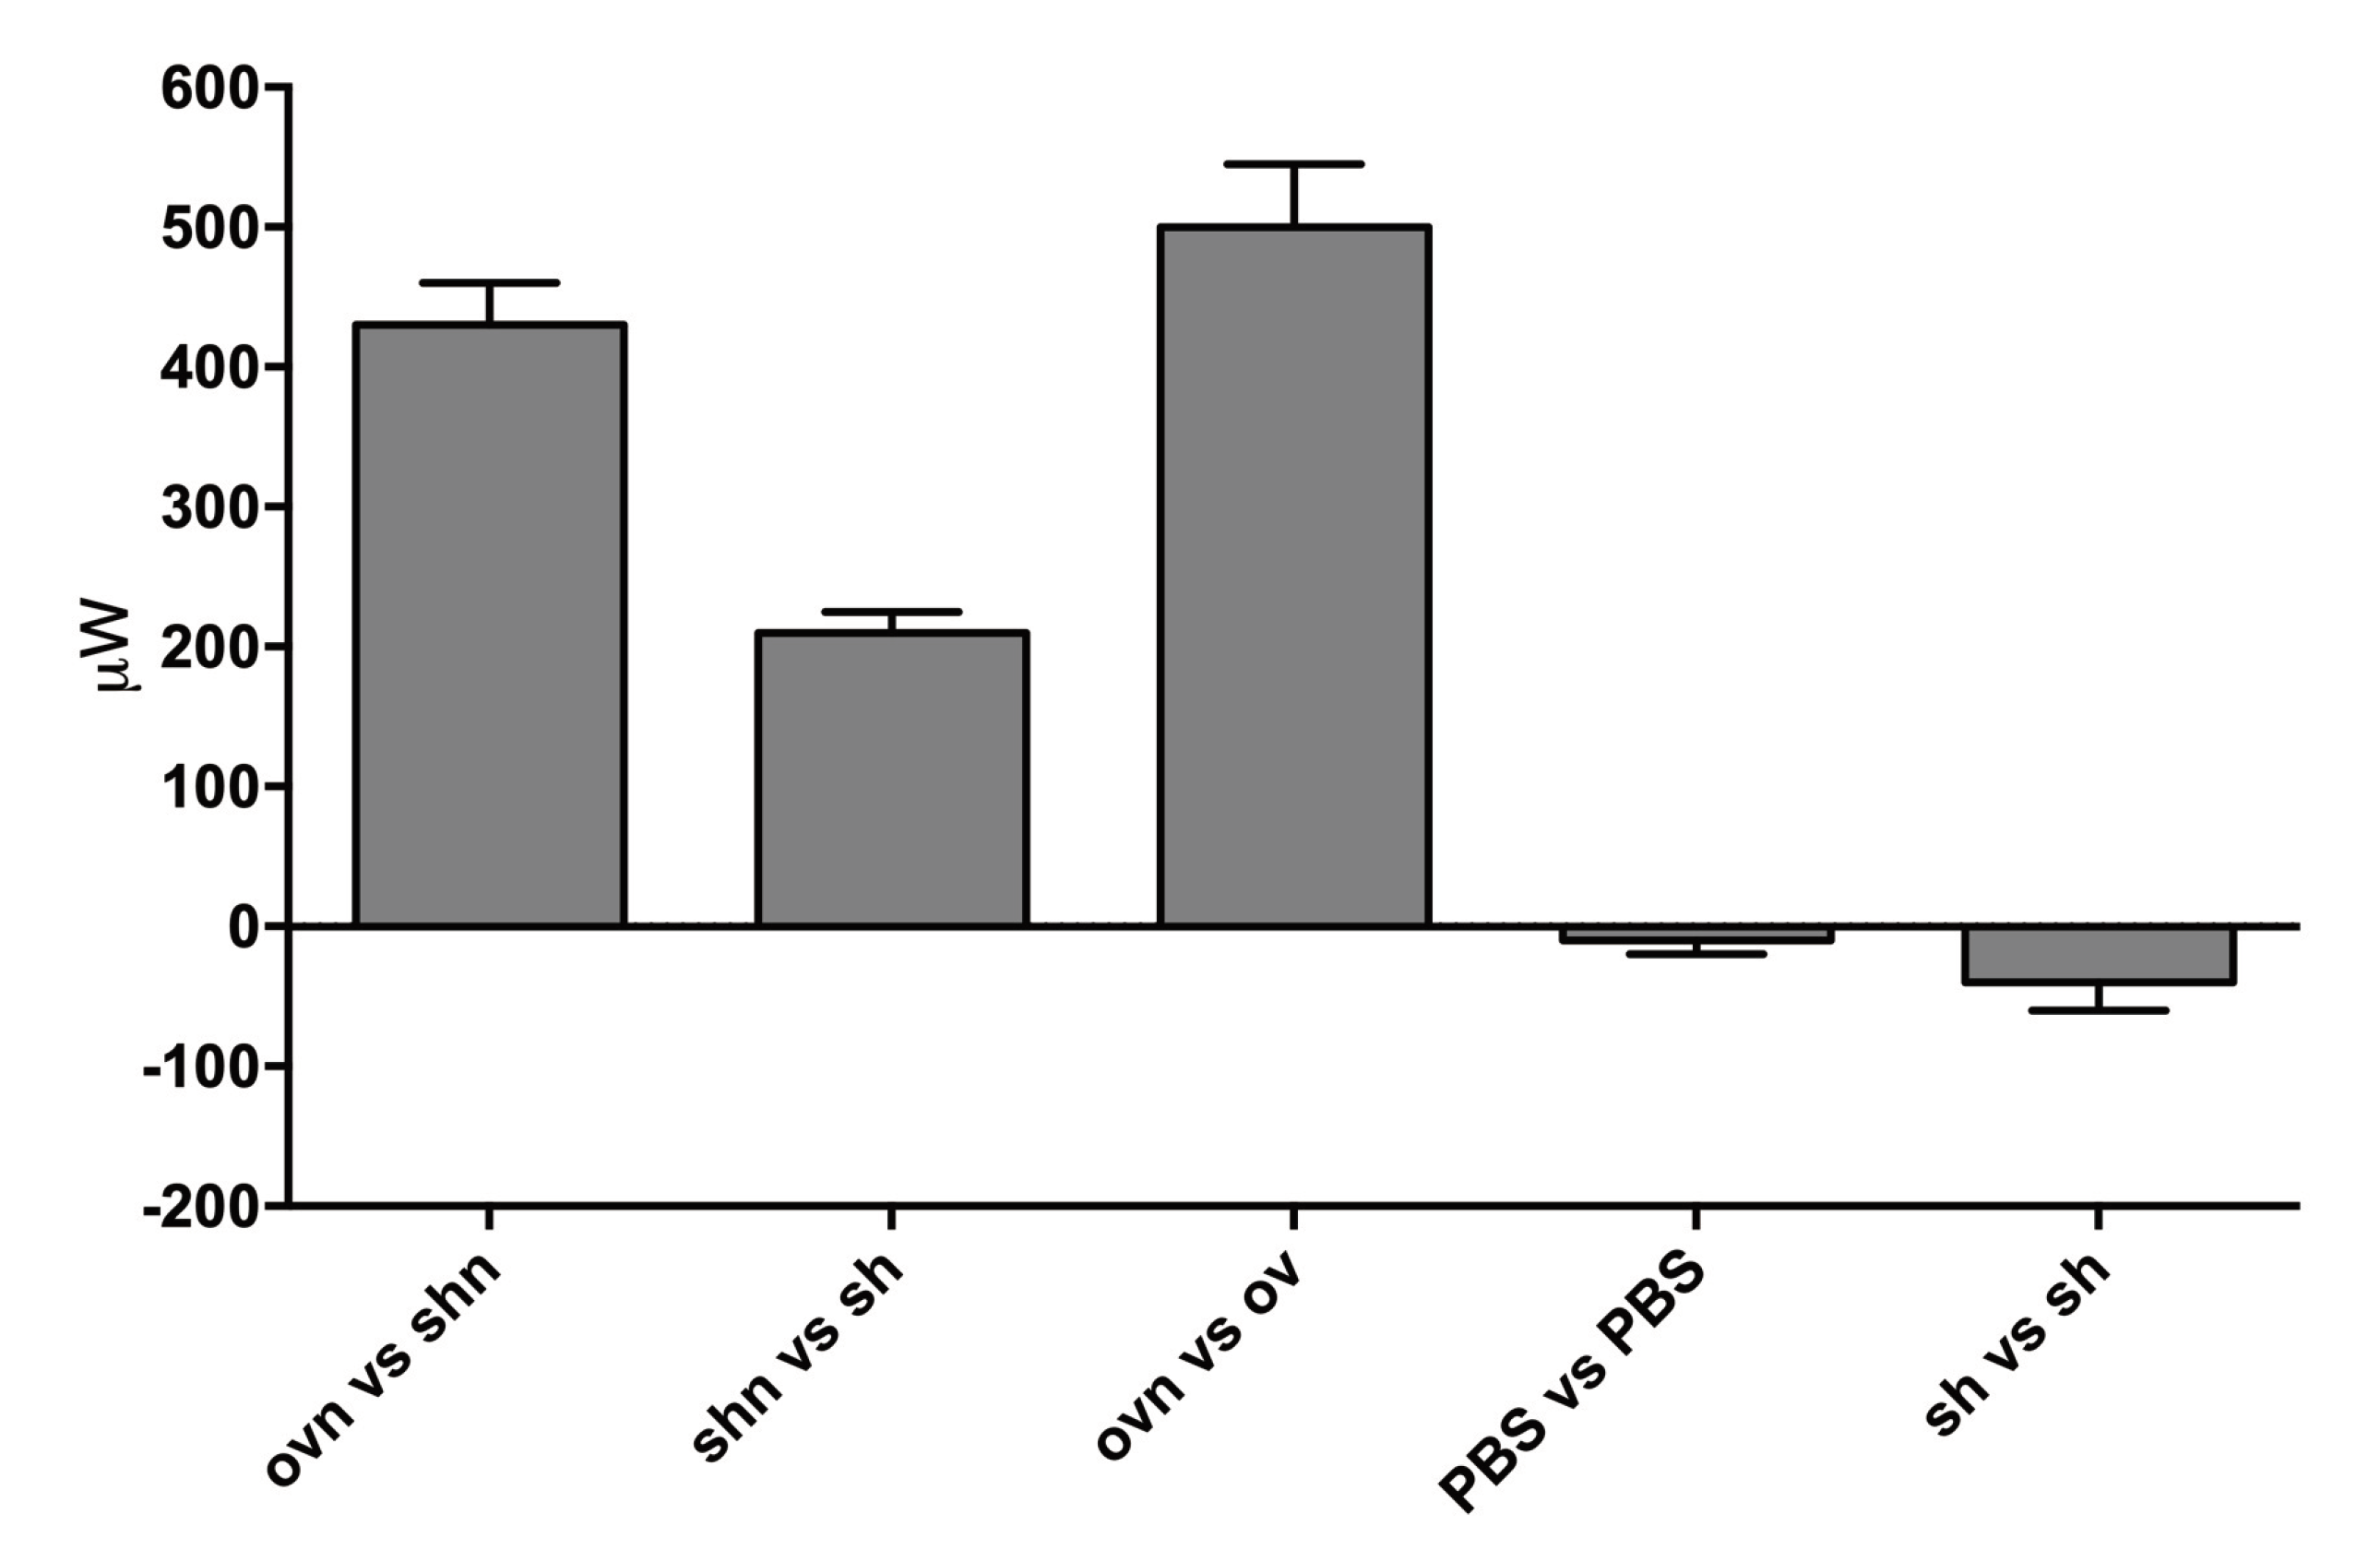
For the bar graph shown in Figure 3, we used the experimental calibration to obtain the values of the heating power emitted.

3.1.2. Model

From the point of view of heat exchange, the experimental system consists of a distributed heat source (the cells) in 1 mL of water, in a thermally conductive container (the EP tube) with outer walls at the temperature of the room. The EP tube does not have a simple geometric shape (such as a cylinder), and the upper surface is open; in addition, the probe assembly (a pipette tip) occupies part of the inner volume. This potentially complicated situation is simplified by the fact that the different materials in the system all have similar thermal diffusion constants: Dw ≈ 1.5 × 10⁻³ cm2/s for water, Dp ≈ 1.0 × 10⁻³ cm2/s for polypropylene (both the EP tubes and the pipette tips used for the probe assemblies are made of polypropylene), Dc ≈ 1.5 × 10⁻³ cm2/s for biological tissue [17]. For an individual cell, Dc ≈ 2.7 × 10⁻⁴ cm2/s [18], but a cell suspension will be much closer to the value for water. We therefore consider the following simplified description of the system: a uniform sphere of radius R, with thermal diffusion constant D, uniformly heated by a (spherical and concentric) distributed heat source of radius Rc < R. The volume of the “inner” sphere is taken equal to the volume of the cell suspension, i.e., (4/3)π R3c = 1 mL, and RRc = 0.9 mm is taken equal to the thickness of the wall of the EP tube. Then we have R = 0.60 cm and Rc = 0.51 cm. The outer surface is held at temperature T1 (the ambient temperature), and we solve the initial value problem for the corresponding diffusion equation, with an initial uniform temperature distribution T = T2 for rR (r is the radial coordinate, T(r,t) the temperature). The distributed heat source is characterized by a power per unit volume (t) (this is the heating generated by the cells), and the experiments show that it is necessary to attach a time dependence to , because the cells do not “turn on” instantaneously when nutrients are added at t = 0. The diffusion equation for this problem then reads:
δT/δtD2T = w
where w = Ῥ/(ρcV) is the source term (ρ the density, cV the specific heat). For spherical symmetry, T = T(r,t) where r is the radial distance from the center of the sphere. The boundary conditions are: T = T1 for r = R, t > 0, and T = T2 uniformly (0 ≤ r < R) at t = 0. The source term is uniform for 0 ≤ r < Rc, i.e., Sourcew[1 – H(rRc)] with H the step function. In time, we assume that the cells “turn on” exponentially, so finally Sourcew[1 – H(rRc)][1 – exp(−t/τ)]. (ρcVw) is the steady state heating power per unit volume delivered by the cells, τ the characteristic time scale for the cells to “turn on” once nutrients are added. In spherical coordinates, and with the substitution rT(r,t) ≡ θ(r,t), the diffusion equation reads:
δ θ r , t δ t D   δ 2 θ δ r 2 = w   r   [ 1 H r R c ]   1 e t τ
With the boundary and initial conditions above we solve this equation numerically using Mathematica, and compare the solutions to the data by “manually” adjusting the parameters, as we now explain.
The geometric parameters, R and Rc, are fixed by the volume of the suspension and the thickness of the EP wall, respectively, giving R = 0.60 cm and Rc = 0.51 cm as explained above. The effective diffusion constant D is obtained from the thermal relaxation process in the control experiments where the two vials contain identical, non-active solutions. The solid line in Figure 1a shows the solution of the above equation with w = 0, initial temperature difference ∆T = T2T1 = 0.03 °C, and D = 1.5 × 10⁻³ cm2/s. The parameters ∆T and D are basically decoupled when it comes to describing the approach to thermal equilibrium, i.e., D is really the only adjustable parameter to describe the dynamics here. Consequently one obtains an unambiguous determination of D. Reassuringly, we obtain a value which is the diffusion constant of water (Dw = 1.5 × 10⁻³ cm2/s at room temperature). Similarly, the solid line in Figure 1b is obtained with w = 0, ∆T = −0.475 °C, and D = 1.3 × 10⁻³ cm2/s, a value within 15% of the value found from Figure 1a.
The experiments with overexpressing cells can now be analyzed with the model with w > 0. We found that for the cell suspensions, good agreement between model and experiment is obtained using a diffusion constant D = 1.0 × 10⁻³ cm2/s. This is also a plausible effective value as it is in between the diffusion constants of water (1.5 × 10⁻³ cm2/s) and “cells” (0.5 × 10⁻³ cm2/s), and equal to the diffusion constant for polypropylene (1.0 × 10⁻³ cm2/s). In Figure 2a, the solid ochra line is obtained for D = 1.0 × 10⁻³ cm2/s, ∆T = 0.03 C, τ = 240 s, and w = 9.0 × 10⁻⁴ cal/°K. We use cV = 1 cal/(g °K) and ρ = 1 g/cm3, then w is numerically equal to the power per unit volume , in cal/(cm3s). In the plots of Figure 2, once D is fixed, then w is determined by the asymptotic (t → +∞) value of the signal (X → −10 μV for t → +∞ for the solid ochra line in Figure 2a), while the characteristic time scale τ with which the cells “turn on” is determined by matching the steepness of the rising part of the signal. The other two lines in Figure 2a show the effect of varying the parameter w by ~20%: w = 11.0 × 10⁻⁴ cal/°K for the upper (magenta) line and w = 7.5 × 10⁻⁴ cal/°K for the lower (purple) line. In Figure 2b, the solid line shows the model with the same parameter values as for Figure 2a, except the initial temperature difference, which is now negative (∆T = −0.03 C) and the heat emitted, which is smaller (w = 4.0 × 10⁻⁴ cal/°K). The model above correctly describes the time course of the temperature measurements, thus reassuring us that the interpretation of the measurements is qualitatively correct. However, the experimental calibration of the next section shows that this model overestimates the heating power deduced from the temperature traces. The reason is the simplified boundary condition adopted in the model (fixed temperature at the surface of the sphere, corresponding to the outer EP surface). In the experiments, the EP tubes are in air, and neither the temperature nor the heat flux at the outer surface are fixed (i.e., neither Neumann nor Dirichlet boundary conditions apply exactly). The heat transfer at the outer surface presumably occurs through a variable (i.e., heating power dependent) boundary layer in air, and is less than what would occur if the temperature of the EP outer surface was truly fixed. Hence the simplified model with fixed temperature boundary conditions overestimates the heating power, for a given measured temperature difference between inside and outside of the EP tube.

3.1.3. Experimental Calibration

We performed a series of experiments to directly establish the time course of the temperature signal corresponding to a known heating power in the “sample” vial. To this end, a 10 Ω resistance was suspended by its leads near the bottom of one of the experimental vials, and used as a heater. The resistance was powered by a DC power supply through a voltage divider, so that 0.5 V at the power supply corresponded to 250 μW heating power. Otherwise the setup was equivalent (but, for logistics reasons, not identical) to the one used in the experiments with the cells. Among the differences was that the vials, in air, were enclosed in an Al box, itself enclosed in a bigger styrofoam box. The purpose was to also determine the long term stability of the measurements. The calibration measurements were performed with 1 mL of 0.1 M salt solution in both vials, and similar settings for the Lock-in amplifier as before (200 mV excitation at 185 Hz, 200 μV sensitivity, time constant 1 s). Time traces were aquired through the analogue output of the Lock-in amplifier, digitized at 10 Hz by a NI ADC, controlled by a Labview program.
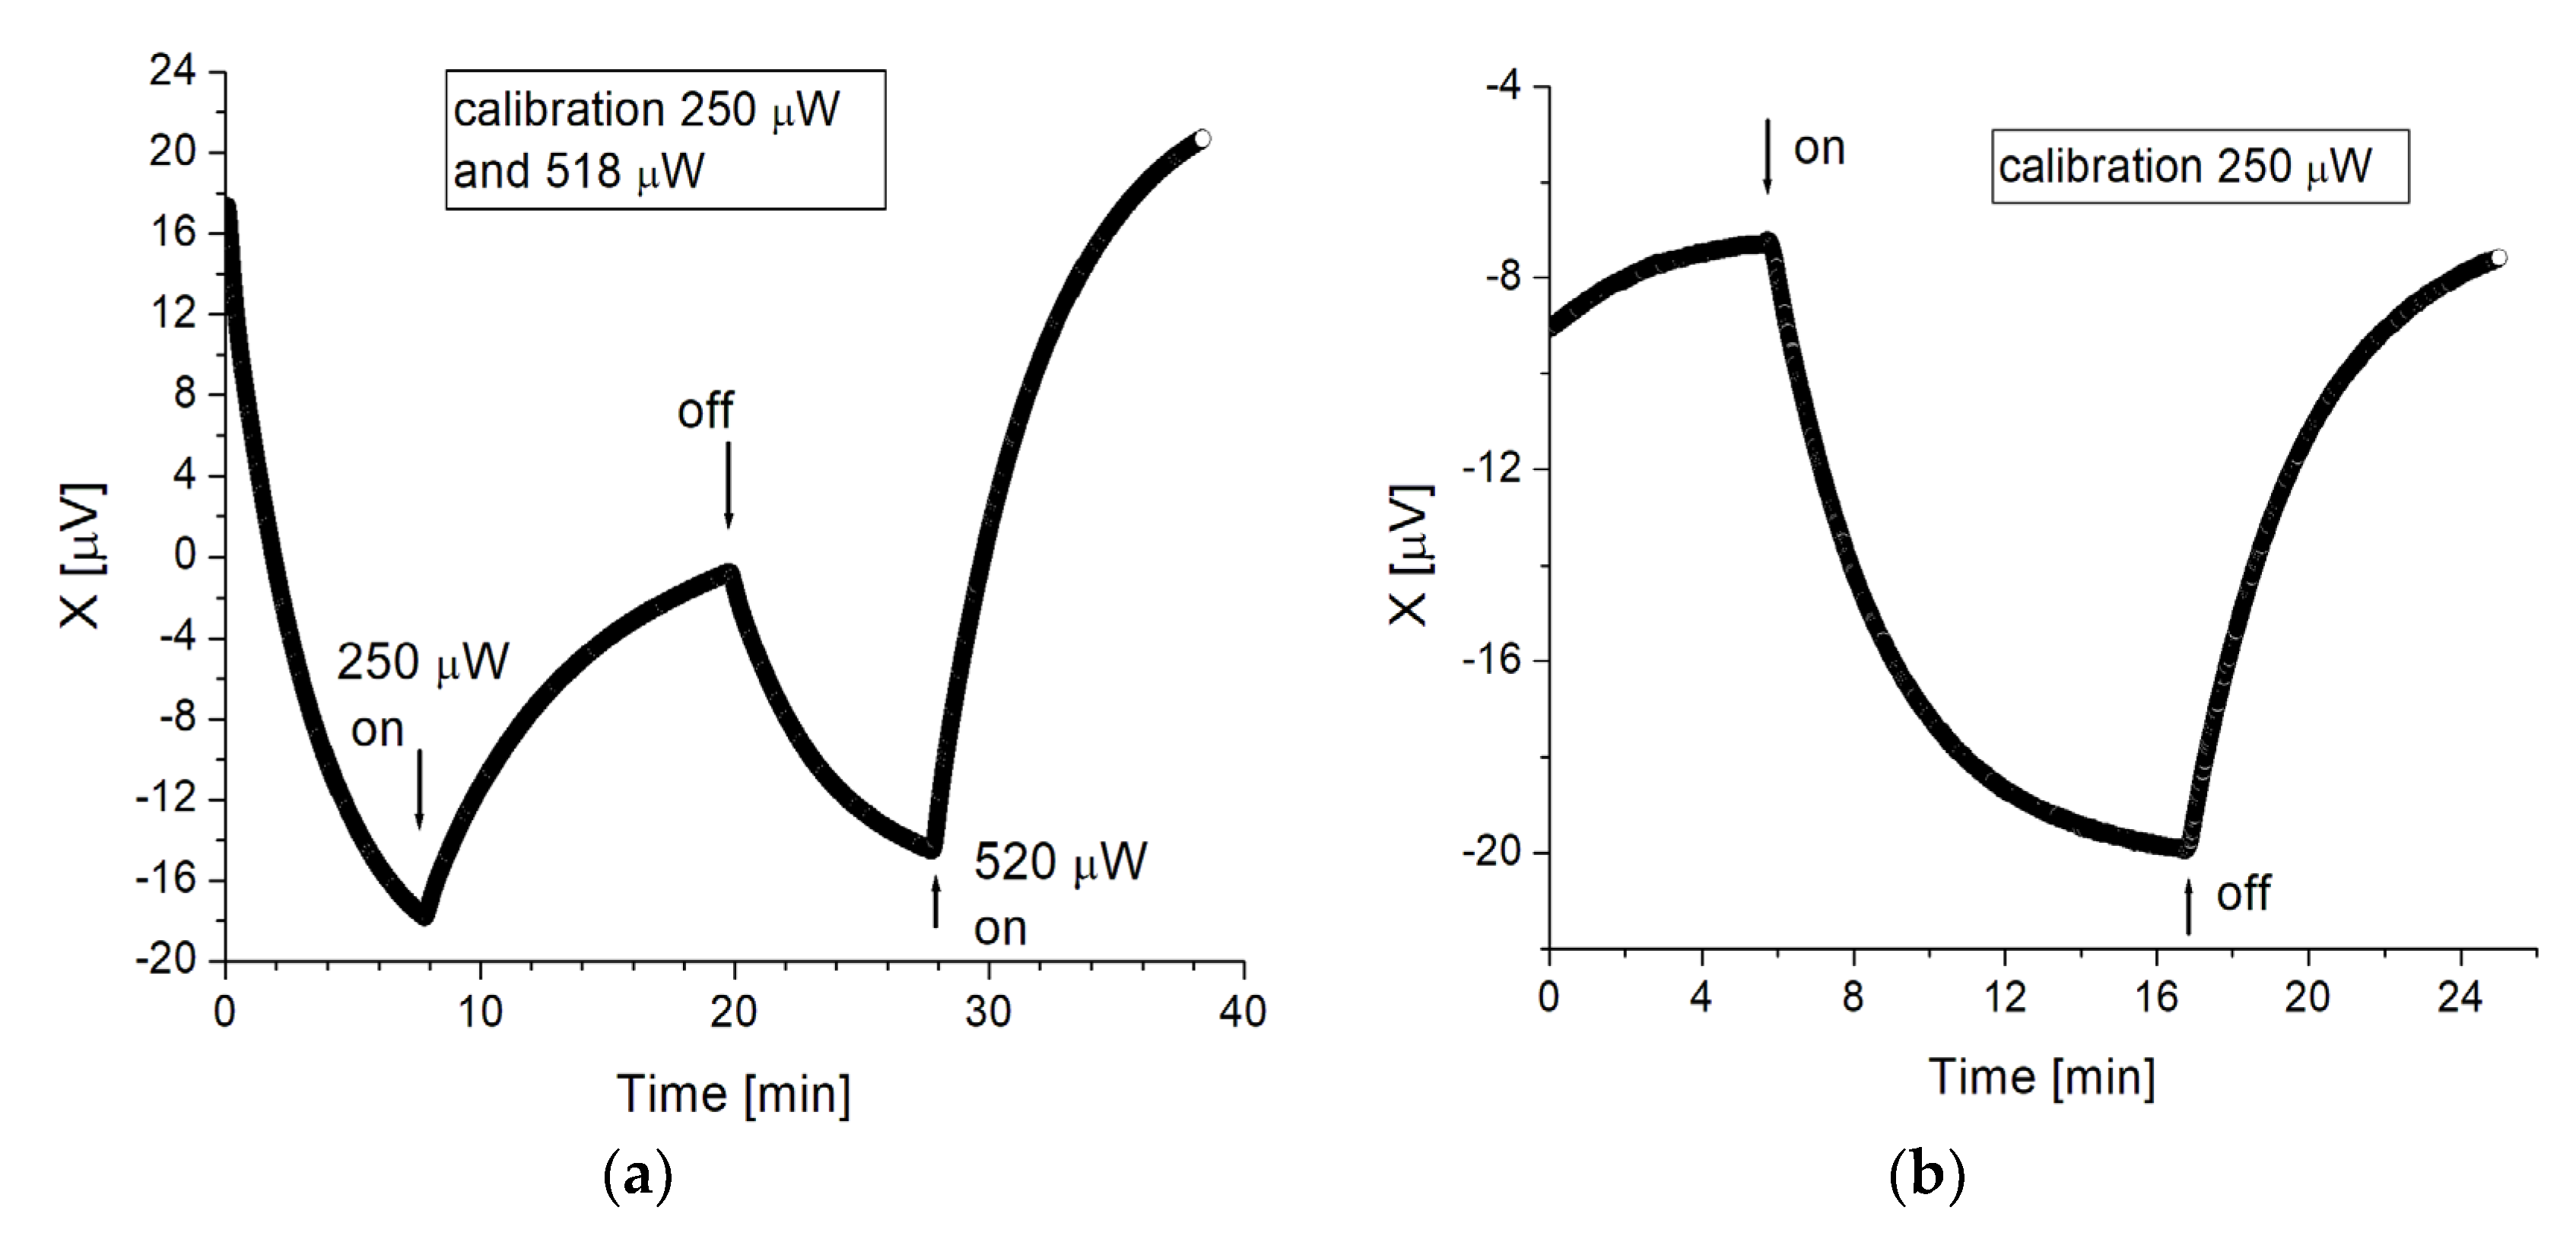
Figure 4a shows an example of experimental calibration. The initial drop in the signal for 0 < t < 8 min corresponds to thermalization of an initial temperature difference between the vials. At t ≈ 8 min (before thermalization is complete, in this case) the heating is turned on in the “sample” vial, with = 250 μW. It is turned off at t ≈ 20 min, whence the temperature relaxes back (20 < t < 20 min). At t ≈ 28 min the heating is again turned on, with = 518 μW, giving rise to a larger temperature signal.
Figure 4b shows another example of calibration, with the system better thermalized initially, and = 250 μW. The configuration was slightly different here, with the two vials closer to each other and wrapped in Al foil, which produces a somewhat smaller signal for the same heating power. From these experiments we obtain that in our setup, a signal ∆X = 10 μV in the steady state corresponds approximately to a heating power = 150 μW. We used this figure to convert the temperature measures to heating power for the results summarized in Figure 3.

3.2. Differential Isothermal Calorimetry

Preliminary experiments performed with a temperature ramp increasing from 22 °C to 24 °C in 2450s showed a downward sloping trace with controls (empty crucibles, or crucibles containing PBS), which made it difficult to identify a possible thermal difference between the crucibles once cells would replace the controls. Thus, we performed all measures under isothermal conditions, at a set temperature of 22 °C.
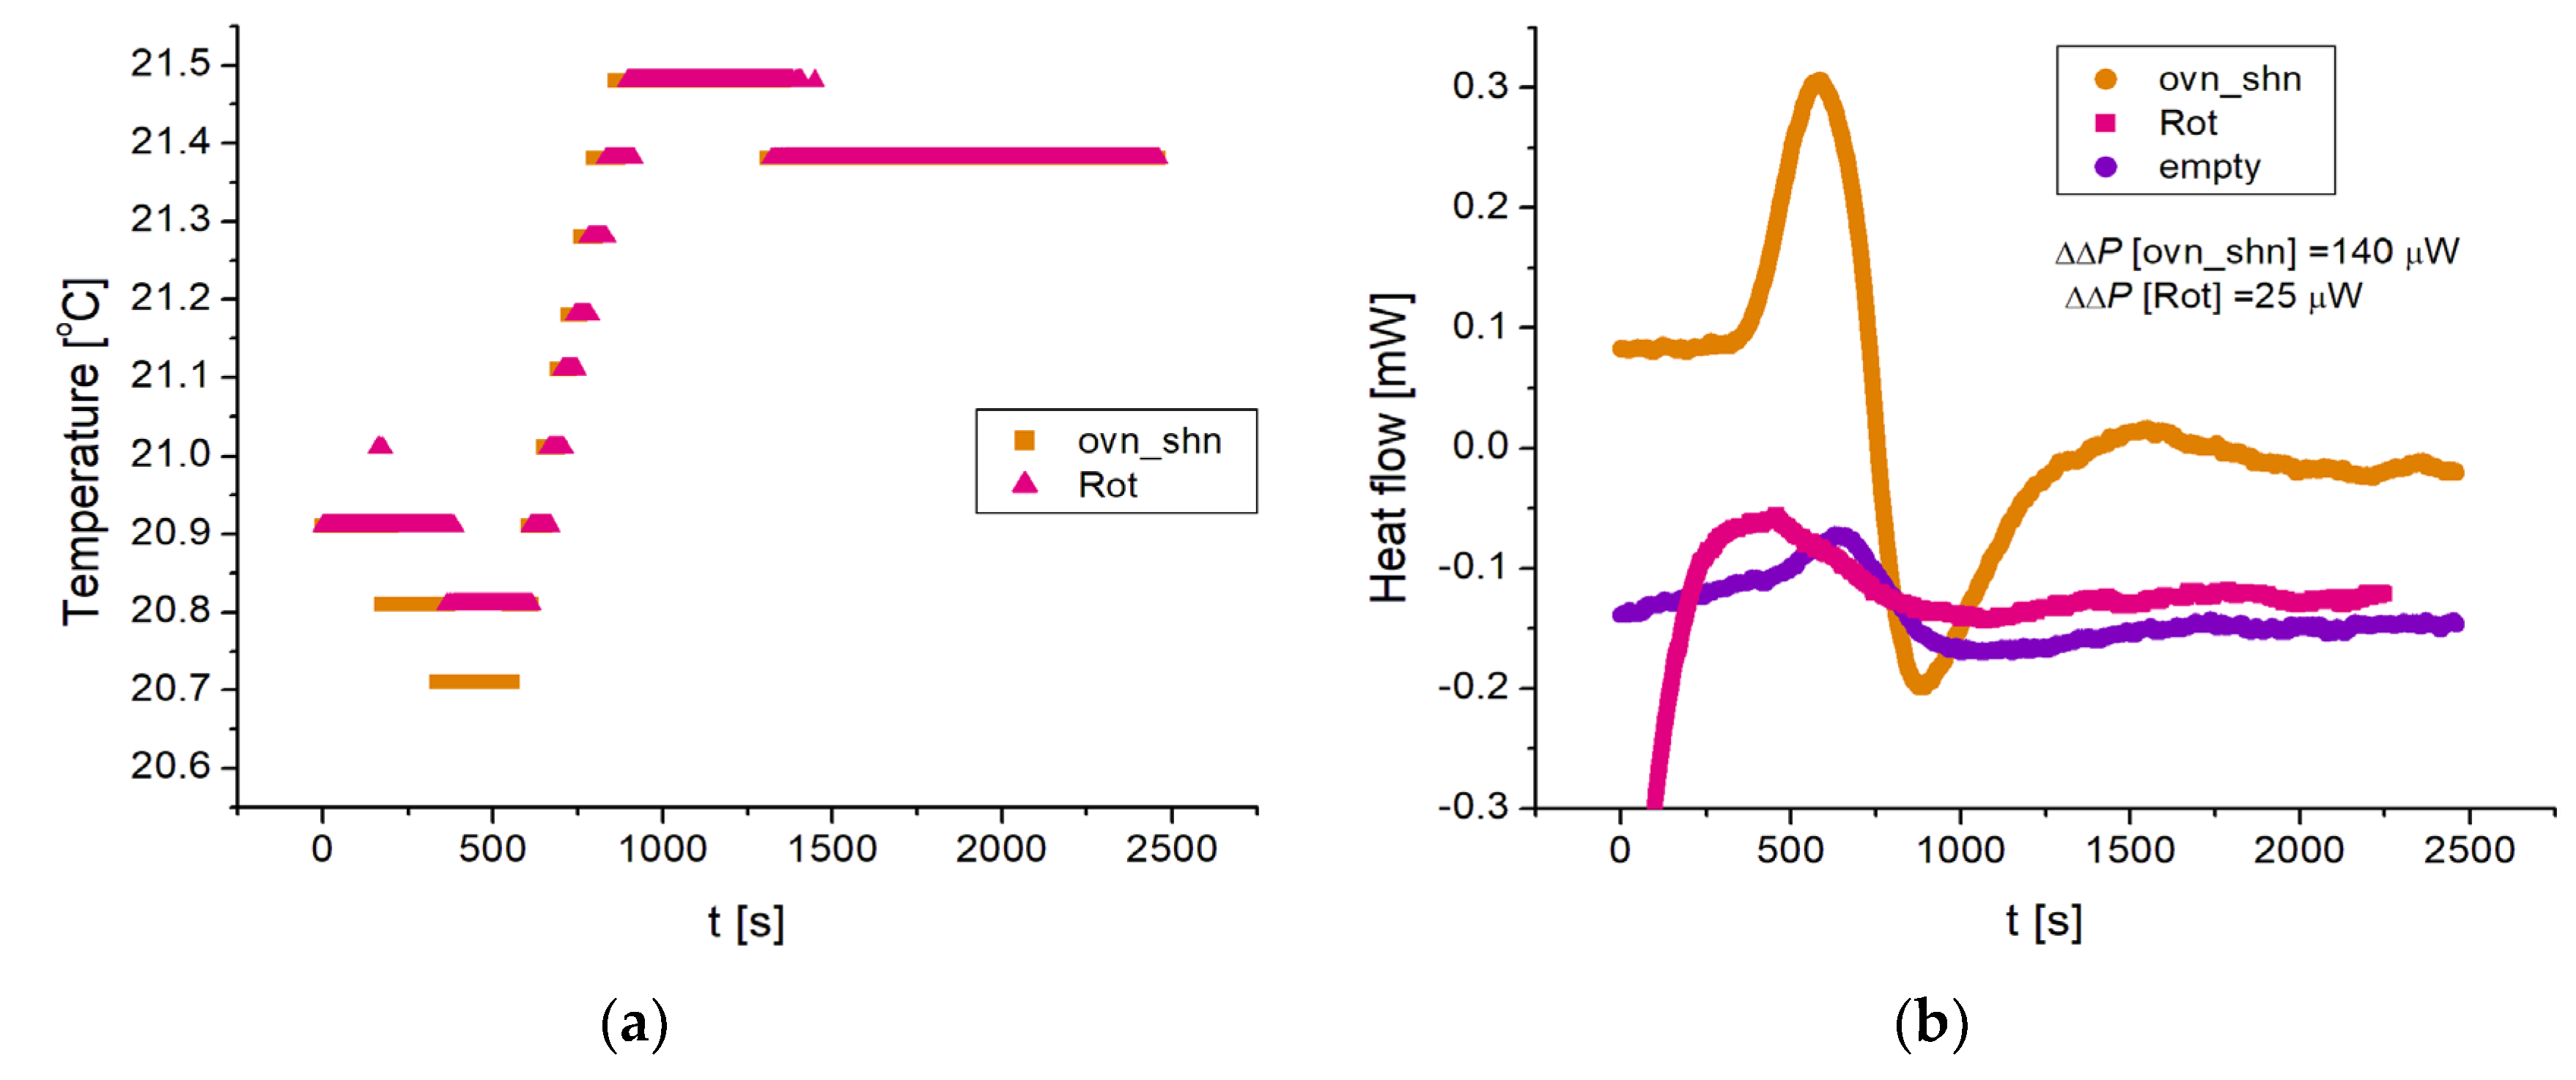
The DSC instrument actively controls the temperature and measures the heat flow (positive for heat flowing out of the crucible), taking the difference between the “sample” and “reference” crucibles. For our isothermal measurements near room temperature, once the samples are locked in, the temperature controller takes about 15 min to stabilize the crucibles at the set temperature. Figure 5 shows representative time traces for 3 different experiments, which we identify by the following shorthand. Ovn_shn means that the sample crucible contains overexpressing cells with nutrients while the reference crucible contains silenced cells with nutrients. Empty means that both crucibles are empty. Rot means that the sample crucible contains overexpressing cells with nutrients, and rotenone and antimycin A (to inhibit oxidative phosphorylation), while the reference crucible contains silenced cells with nutrients. The action of the temperature controller is visible in the temperature recording of Figure 5a, where the nominally set temperature was 22 °C, while the initial (room) temperature was about 1 °C lower. The heat input (positive or negative) due to the temperature controller adjusting the temperature to the set value is reflected in the oscillation visible in the initial part of the time traces (0 < t < 1000 s approximately) of Figure 5b. The non-zero signal even in the case of the “empty” trace is due to inevitable small differences in the two crucibles’ thermal assemblies. In particular, the average negative heat flow for the “empty” trace represents an offset of the instrument. In this example, the temperature stabilizes at t ≈ 800 s (Figure 5a); this time corresponds to the local minimum in the heat flow traces of Figure 5b. Thereafter, the “empty” trace remains essentially steady (at [empty] ≈ −150 μW) while the “ovn_shn” trace shows an increase (800 < t < 1500 s) before stabilizing at [ovn_shn] ≈ −20 μW. The “Rot” trace shows a smaller increase.
Figure 5. Isothermal DSC measurements for 3 different experiments: overexpressing cells with nutrients vs silenced cells with nutrients (ovn_shn), overexpressing cells with nutrients and oxphos inhibitors rotenone and antimycin A (Rot) vs silenced cells with nutrients, and empty crucibles (empty). The temperature was set at a nominal 22 °C, slightly above the temperature of the room. (a) The time course of the temperature shows the action of the temperature controller, the temperature being stabilized for t > 800 s. (b) The time course of the heat flow (in mW; positive for heat flowing out of the crucibles) shows a characteristic “up-down” signature in the first ~800 s, corresponding to the action of the temperature control feedback mechanism. The time beyond which the temperature is stable (t = 800 s) corresponds to the minimum of the traces. The rise beyond this minimum is a measure of the differential heating power in the sample, which we call Δ𝓅. For the “empty” trace, which serves as reference, Δ𝓅[empty] ≈ 18 μW, whereas Δ𝓅[ovn_shn] ≈ 184 μW and Δ𝓅[Rot] ≈ 19 μW. At long times (t > 1500 s) the heat flow is essentially constant; this steady state value, minus the reference value of the “empty” trace (which represents an offset of the instrument), is also a measure of the heating power in the sample, which we call ΔΔ𝓅. From the ochra and purple traces we find ΔΔ𝓅[ovn_shn] ≈ 140 μW, while from the magenta and purple ΔΔ𝓅[Rot2h] ≈ 25 μW. This example shows that both the Δ𝓅 and the ΔΔ𝓅 measures agree in finding that the heating power produced by the overexpressing cells is approximately 150 μW larger than the heating power of the silenced cells. By contrast, the heating power of the oxphos inhibited cells is essentially zero within our resolution (19 – 18 = 1 μW by the Δ𝓅 measure and 25 μW by the ΔΔ𝓅 measure).
Preprints 99207 g005
Because the offset of the instrument (100 − 200 μW typically, and different each time the instrument is turned on) is of the same order as the heating power we want to measure, we cannot use the absolute value of the heat flow in the steady state as our measurement. However, for experiments performed successively on the same day (as is the case for the traces of Figure 5), we can assume an approximately constant offset, and use the difference between two traces in the steady state to extract a corresponding heating power. We call this measure ΔΔ𝓅. For the experiments of Figure 5, the reference trace is “empty”, and averaging over the time interval 1500 < t < 2460 s (the end of the recording) we find the extra heating power of the overexpressing cells compared to the silenced cells ΔΔ𝓅[ovn_shn] ≈ 140 μW, whereas ΔΔ𝓅[Rot] ≈ 25 μW. In fact, we can extend the averaging window to comprise the time during which the temperature controller is injecting heat to control the temperature, for example 500 < t < 2460 s and obtain essentially the same values. The reason is that the cells’ heating power just adds to the temperature controller’s.
An alternative way to extract the heating power is to take, for an individual trace, the difference between the steady state value at long times and the value at the minimum. We call this measure Δ𝓅. The reason is that, with no extra heating (the “empty” trace) and the isothermal protocol, the temperature controller cycle is such that Δ𝓅 0 (see “empty” trace in Figure 6b). For the traces of Figure 5b we find: Δ𝓅[ovn_shn] ≈ 184 μW, Δ𝓅[Rot] ≈ 19 μW, and Δ𝓅[empty] ≈ 18 μW so that subtracting this latter reference value from the others we obtain consistent values from the ΔΔ𝓅 and Δ𝓅 measures. The latter has the advantage of being independent of the instrument’s offset, and so it can be used to compare experiments performed on different days.
Figure 6 shows another group of experiments, where we compare: overexpressing cells with nutrients vs. the same (ovn_ovn: ochra trace), overexpressing cells with nutrients and 100 nM ABA vs. overexpressing cells with nutrients, but no ABA (ovnABA_ovn: purple trace), and overexpressing cells with nutrients vs overexpressing cells without nutrients (ovn_ov: green trace).
For the traces of Figure 6 we find Δ𝓅[ovnABA_ovn] ≈ 96 μW, Δ𝓅[ovn_ov] ≈ 93 μW, while Δ𝓅[ovn_ovn] ≈ 18 μW. Subtracting this latter reference value, this measurement indicates that overexpressing cells activated with ABA produce an extra heating power of 78 μW compared to non activated cells, under the same conditions. Since overexpressing cells produce 93 – 18 = 75 μW of heating power according to this measurement, ABA activation approximately doubles the heating power produced by overexpressing cells with nutrients. Taken together, the measurements of Figuers 5 and 6 show that N = 2.5 × 10⁶ overexpressing cells produce an extra heating power of order of magnitude ~100 μW compared to silenced cells, and that the ABA-activated cells produce an additional ~100 μW of heating power, as an order of magnitude, compared to non activated cells.
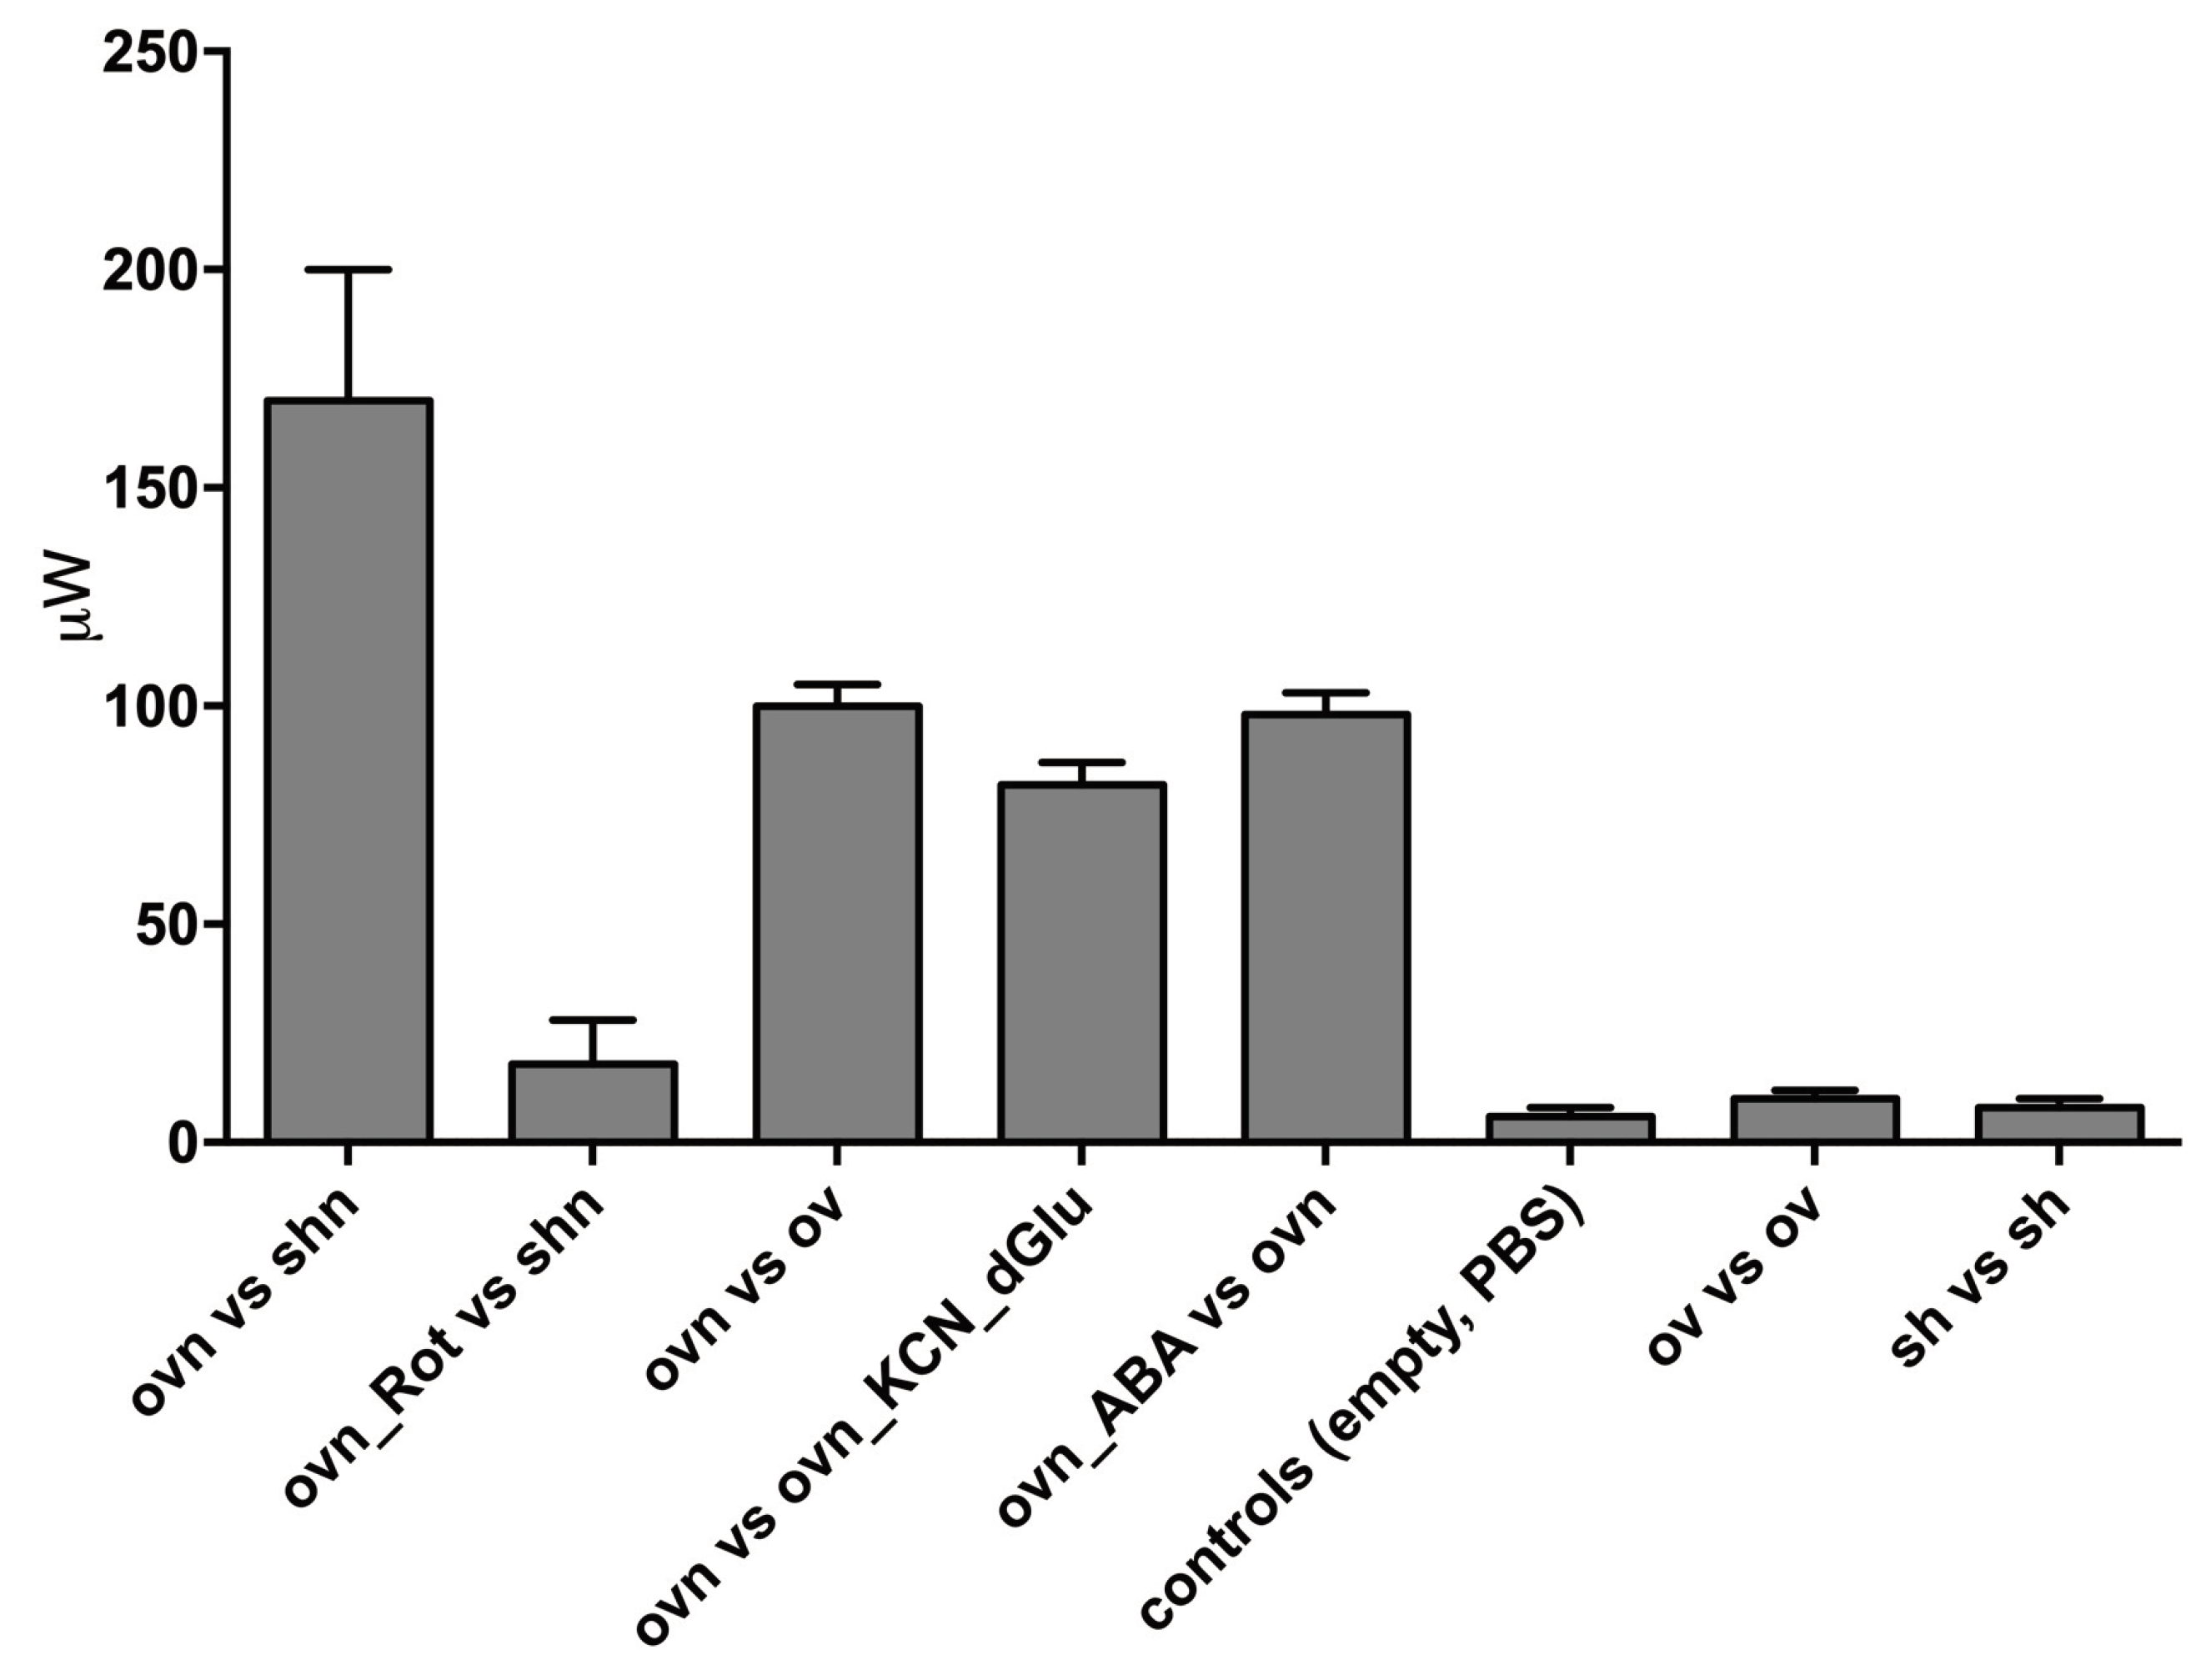
We performed a number of such experiments and controls. A summary of the results obtained from at least 3 different experiments for each condition is presented in Figure 7.
Starved, LANCL1/2-overexpressing H9c2 (ov) or double-silenced cells (sh) were suspended in PBS+Ca2+/Mg2+ (2.5x10⁶ in 200µl) in crucibles, which were tested pairwise in each experiment. Each experimental session included at least one control. Immediately before starting the temperature ramp of the DSC, and data recording, the nutrient mixture in PBS (n) or an equal volume of PBS alone, was added to the cells and the crucibles were capped and inserted in the DSC chamber. For oxphos inhibition, over-expressing cells were pre-incubated (or not) for 2 h with 0.03 mg/mL digitonin and 0.5 μM rotenone (Rot) + 0.5 μM antimycin A. To inhibit aerobic as well as anaerobic glucose metabolism, 3 mM KCN and 10 mM 2′-deoxy-glucose were added to over-expressing cells immediately before the start of analysis. Data shown are the mean ± SD from at least three experiments for each condition.
The highest values of the heating power <!-- MathType@Translator@5@5@MathML2 (no namespace).tdl@MathML 2.0 (no namespace)@ --><math><mrow><mo>&#x2206;ere observed when overexpressing cells with nutrients were compared with overexpressing cells without nutrients (Δ𝓅 = 93 μW) and a quantitatively similar heating power was observed when overexpressing cells with nutrients were compared with overexpressing cells without nutrients and also containing 2′-deoxy-glucose and KCN, to prevent oxidative metabolism (Δ𝓅 = 89 μW). This observation indicates that starved cells contained no residual nutrients and only their addition at the start of the experiments provided cells with the substrates necessary for heat production. The main results are: 1) overexpressing cells produce a larger heating power compared to silenced cells (Δ𝓅[ovn_shn] ≈ 55 μW) and 2) ABA activated, overexpressing cells produce a larger heating power compared to non-activated (overexpressing) cells (Δ𝓅[ovnABA_ovn] ≈ 95 μW). The last 3 bars in Figure 7 represent controls.

4. Discussion

Monitoring temperature fluctuations and/or heat production in living cells is of great interest to the biologist, as it informs on cell metabolism, mitochondrial respiration and uncoupling and may allow to identify molecular controllers of heat generation. Temperature monitoring on isolated cells has been obtained in the recent past mostly by indirect methods, via temperature-sensitive fluorescent or luminescent probes [19-23]. These methods suffer some limitations due to the short life-span of the fluorescent signal and its sensitivity to changing environmental cellular conditions. A recent and innovative study by Han et al. introduces an entirely different approach to temperature measurement (and not just “sensing”) by means of a sensor containing a Pd-Cr thin-film thermocouple, a freestanding Si3N4 platform, and a dual-temperature control system: with this chip, the authors measured temperature fluctuations in human epithelial tumor cells (HeLa) (in the order of magnitude of 0.3-1.5 K) [24].
In our study, we measure the heating power produced by a population of cultured cells (N = 2.5 × 10⁶) by two different methods: directly by calorimetry, and indirectly by following the time course of the temperature fluctuations. Both methods are differential, the quantity measured being the difference (of heating power, or temperature, respectively) between a sample and a reference. We were able to compare samples of genetically modified cells, and draw conclusions on the corresponding physiology. Thus, we obtained a direct measurement of the heating power generated by the mitochondrial activity of rat H9c2 cardiomyocytes, demonstrating a hitherto unknown role for the ABA/LANCL1-2 hormone-receptors system in (cardio)myocyte thermogenesis. Cells overexpressing human LANCL1 and LANCL2 showed a significantly higher heat generation than cells double-silenced for the expression of endogenous LANCL1/2 and this difference was almost completely abolished by treatment with the electron transfer chain inhibitors rotenone and antimycin A (Figure 7).
On the experimental side, a novel aspect of this study lies in the demonstration that a relatively simple apparatus based on low-cost, commercially available thermistor probes has sufficient sensitivity to allow measurement of heat production by a limited number of cells (~2 × 10⁶ cells), easily attainable not only with cultured cells, as in this study, but also with explanted tissues.
Qualitative and quantitative confirmation of the experimental results obtained with the thermistor probes connected to a lock-in amplifier was obtained with measurements taken on the same cell types with a differential scanning calorimeter set on an isotherm mode of analysis. While the probes allowed to measure a temperature variation between two samples starting from a few seconds after nutrient addition to the starved cells, the DSC measurements had an approx. 15 min delay from the addition of nutrients, due to the time required for thermalization of the chamber containing the crucibles. This fact may explain the approx. 3-fold higher heat production measured with the temp probes as compared with the DSC (~400 μW vs ~150 μW, respectively) when comparing over-expressing vs. double-silenced cells, both with nutrients. In the future, measurements with the temperature probes will allow to study the kinetics of how cell thermogenesis reacts to changing external conditions, and the dynamics of its regulation. Already the present measurements hint at an increased heating power in the first minutes after nutrients are added, compared to the long time steady state.
Both the temperature probes and the DSC measurements agree that heat generation by over-expressing cells is twice that of double-silenced cells. The calorimetry measurements show that ABA further increases heat production in over-expressing cells by approx. 100%.
How do these numbers compare with an estimate of the thermal energy produced by myocytes? In human muscle cells at rest, the ATP concentration is ~4 mM and that of ADP ~9 μM. These values result in a free energy of ATP hydrolysis ∆G = −64 kJ/mol. The average cell produces (and hydrolyses) ~107 – 108 ATP/s. Taking the upper value, one cell hydrolyzes ~1.7 × 10⁻¹⁶ mole/s of ATP, generating 1.7 × 64 × 10−13 W ≈ 10 pW of heating power. For 2.5 × 10⁶ cells, the number used in all experiments in our study, we thus find ~25 μM of heating power generated. This amount of power is approx. 6 and 16 times less than the values measured in this study on LANCL1/2-overexpressing H9c2 cardiomyocytes by means of the DSC or the temp probes, respectively. However, over-expressing cells are particularly well-performing, as they produce approx. twice the heat generated by double-silenced cells (Figure 3).
The heart is obviously the “pumping central” of the circulatory system, imparting a pressure sufficient to allow blood cells to reach its utmost periphery. Anatomy could suggest also a heating function of the heart: i) it pumps between 5 and 5,5 L/min of blood, i.e., the entire blood volume flows within the heart every minute; ii) it lies deep inside the thoracic cavity, in between the lungs, which provide an effective thermal insulation, as they are full of air. However, based upon the thermal energy produced by cardiomyocytes in this study, it appears that the heating capacity of approx. 2.5 billion cardiomyocytes, the total number of cardiomyocytes in the heart, would amount to approx. 9 J/min ≈ 2 cal/min, if they showed a heating capacity similar to the LANCL1/2-overexpressing cells used in this study. In fact, striated muscle, both cardiac and skeletal, shows the highest levels of LANCL1/2 expression among non-nervous tissues [12]. As approx. 5L of blood are pumped through the heart each min, heating of this blood volume would amount to only ~0.4 × 10⁻³ °C. Thus, rather than heating the blood, the heart is more likely to be itself warmed by the blood flowing through its cavities every minute. Of the approx. 290-3800 kJ of thermal energy dissipated per hour by the human body (depending on activity and environmental conditions) we can estimate from our measures that around 0.540 kJ (9 J/min × 60 min) are produced by the heart.
The main source of heat in mammals is obviously the skeletal muscle: indeed, the total muscle mass accounts for approx. 40% of body weight in males and 30% in females, i.e., approx. 100 times the percentage body weight of the heart. Shivering represents a reaction to cold and a means to increase muscle heat production through its involuntary contraction, sustained by an increased mitochondrial respiration and the “proton leak” through the inner mitochondrial membrane, which is in part “basal” but can be increased, by so-called “uncoupling” proteins. Physical exertion increases body temperature through the same mechanism. A doubling of heat generation, as observed here in LANCL1/2-overexpressing vs. –silenced myocytes, or in ABA-treated vs. –untreated myocytes could result in a significantly increased muscle heat production in vivo.
As compared with the heat produced by 2-3 billion cardiomyocytes (the total number of cardiomyocytes in the heart), i.e., 2 cal/min, if muscle myocytes behaved similarly to LANCL1/2-overexpressing H9c2 (i.e., producing ~150 μW/2.5 × 106 cells = 60 pW/cell of heating power), total muscle myocytes (approx. 1013) would produce 600 W = 2160 kJ/hr of heating power. Brown adipose tissue (BAT) also produces heat, by means of the expression of tissue-specific “uncoupling” proteins, which increase the amount of energy dissipated as heat in mitochondria. However, the contribution by BAT to human body heat production is limited by its reduced mass (compared with muscle) and by the fact that it is confined to discrete areas in the body, interestingly predominantly located in the mediastinum, around the heart and the major arterial vessels.
ABA-induced stimulation of the LANCL1 and LANCL2 hormone receptors as well as LANCL1/2 expression levels per se have been shown to stimulate mitochondrial biogenesis, O2 consumption, and proton gradient dissipation in rodent skeletal myocytes [12], in human brown adipocytes [13] and in rat cardiomyocytes [25]. The approx. doubling of heat generation reported here for LANCL1/2-overexpressing vs. double-silenced cardiomyocytes will likely be observed also on LANCL1/2-overexpressing vs. double-silenced skeletal myocytes and brown adipocytes. In fact, transcription of several uncoupling proteins is significantly increased in LANCL1/2-overexpressing cells and further increases upon incubation of the cells with ABA: sarcolipin and UCP-3 in skeletal myocytes [12], the ADP/ATP translocator and UCP-1/3 in cardiomyocytes [25] and UCP-1 in brown adipocytes [13], indicating a possible systemic, whole-body increase of proton gradient dissipation controlled by tissue expression levels of the LANCL1/2 proteins.
Why would oxphos uncoupling be beneficial? By reducing reactive oxygen species (ROS) generation, an essentially unavoidable by-product of respiration, mild uncoupling of mitochondrial oxidative phosphorylation shows potential to combat ROS-induced pathological conditions including obesity, neurodegenerative diseases, non-alcoholic fatty liver disease (NAFLD), diabetes and the metabolic syndrome and cardiovascular diseases [26]. Accumulating experimental evidence supports the conclusion that mild mitochondrial uncoupling, which naturally occurs in all tissues but can be increased pharmacologically or hormonally, is beneficial to the heart and prolongs rodents’ lifespan [27], which is arguably the sum of a combined beneficial effect on several organs and systems. Indeed, the mechanisms that alleviate proton and/or electron “jamming” at the respiratory complexes, i.e., backwards electron transfer from reduced respiratory complexes to coenzymes/substrates [28,29] and proton leak through the inner mitochondrial membrane through “uncoupling” proteins, allow the orderly flux of charges, maximize ATP production while at the same time minimizing ROS generation.
In conclusion, the present study provides to our knowledge the first demonstration that the ABA/LANCL system is involved in thermogenesis in mammals and opens a new area of investigation into its interaction with hypothalamic-controlled thermal regulation and with thyroid hormones. We already observed that overexpression of LANCL1/2 in human brown adipocytes significantly increases, while the double silencing conversely reduces, mRNA levels of β-adrenergic and of thyroid receptors [13].
Interestingly, ABA administration to honeybee larvae has been shown to improve their survival at low temperatures, a clue that ABA, along with its conserved role as a stress hormone from plants to mammals, has other, as yet unexplored, functions in animal (and insect) physiology to surprise the open-minded researcher [30].

5. Conclusions

In conclusion, in this study we show that LANCL1/2-overexpressing rat cardiomyocytes produce twice the heat as double-silenced cells and that ABA further increases heat production by overexpressing cells.
Identification of the ABA/LANCL1-2 hormone/receptors system as a new player in (cardio)myocyte thermogenesis may be of interest for several reasons:
- from a physiological point of view, it opens new areas of investigation into the interplay between this system and the thyroid- and beta-adrenergic-receptor mediated control of thermogenesis
-from a clinical point of view, it identifies the LANCL proteins as new targetable receptors to increase uncoupling of mitochondrial oxidative phosphorylation, an effect that the recent scientific literature agrees shows considerable potential to combat ROS-mediated pathological conditions including obesity, neurodegenerative diseases, non-alcoholic fatty liver disease, diabetes and cardiovascular diseases.

Author Contributions

Conceptualization, GZ, FF, SD, EZ; methodology, SS, LS, MP, JCGU; software, FF; investigation, GZ, FF, SD, EZ, SS, LS, MP, JCGU; data curation, GZ; EZ; SS; writing—original draft preparation, GZ, EZ; writing—review and editing, GZ, FF, SD, EZ; visualization, GZ, SS; supervision, GZ, EZ. All authors have read and agreed to the published version of the manuscript.
Funding

This research received no external funding.

Data Availability Statement

No data were created in publicly archived datasets.

Conflicts of Interest

The authors declare no conflicts of interest.

References

  1. Magnone, M.; Sturla, L.; Guida, L.; Spinelli, S.; Begani, G.; Bruzzone, S.; Fresia, C.; Zocchi, E. Abscisic Acid: A Conserved Hormone in Plants and Humans and a Promising Aid to Combat Prediabetes and the Metabolic Syndrome. Nutrients 2020, 12. [Google Scholar] [CrossRef] [PubMed]
  2. Pichler, G.; Stöggl, W.; Candotto Carniel, F.; Muggia, L.; Ametrano, C.G.; Holzinger, A.; Tretiach, M.; Kranner, I. Abundance and Extracellular Release of Phytohormones in Aero-terrestrial Microalgae (Trebouxiophyceae, Chlorophyta) As a Potential Chemical Signaling Source. J Phycol 2020, 56, 1295–1307. [Google Scholar] [CrossRef] [PubMed]
  3. Bruzzone, S.; Basile, G.; Mannino, E.; Sturla, L.; Magnone, M.; Grozio, A.; Salis, A.; Fresia, C.; Vigliarolo, T.; Guida, L.; De Flora, A.; Tossi, V.; Cassia, R.; Lamattina, L.; Zocchi, E. Autocrine abscisic acid mediates the UV-B-induced inflammatory response in human granulocytes and keratinocytes. J Cell Physiol 2012, 227, 2502–10. [Google Scholar] [CrossRef] [PubMed]
  4. González-Guzmán, M.; Gómez-Cadenas, A.; Arbona, V. Abscisic Acid as an Emerging Modulator of the Responses of Plants to Low Oxygen Conditions. Front Plant Sci 2021, 12, 661789. [Google Scholar] [CrossRef] [PubMed]
  5. Spinelli, S.; Guida, L.; Vigliarolo, T.; Passalacqua, M.; Begani, G.; Magnone, M.; Sturla, L.; Benzi, A.; Ameri, P.; Lazzarini, E.; Bearzi, C.; Rizzi, R.; Zocchi, E. The ABA-LANCL1/2 Hormone-Receptors System Protects H9c2 Cardiomyocytes from Hypoxia-Induced Mitochondrial Injury via an AMPK- and NO-Mediated Mechanism. Cells 2022, 11. [Google Scholar] [CrossRef] [PubMed]
  6. Zocchi, E.; Carpaneto, A.; Cerrano, C.; Bavestrello, G.; Giovine, M.; Bruzzone, S.; Guida, L.; Franco, L.; Usai, C. The temperature-signaling cascade in sponges involves a heat-gated cation channel, abscisic acid, and cyclic ADP-ribose. Proc Natl Acad Sci USA 2001, 98, 14859–64. [Google Scholar] [CrossRef] [PubMed]
  7. Fidler, J.; Graska, J.; Gietler, M.; Nykiel, M.; Prabucka, B.; Rybarczyk-Płońska, A.; Muszyńska, E.; Morkunas, I.; Labudda, M. PYR/PYL/RCAR Receptors Play a Vital Role in the Abscisic-Acid-Dependent Responses of Plants to External or Internal Stimuli. Cells 2022, 11(8), 1352. [Google Scholar] [CrossRef]
  8. He, C.; Zeng, M.; Dutta, D.; Koh, T.H.; Chen, J.; van der Donk, W.A. LanCL proteins are not Involved in Lanthionine Synthesis in Mammals. Sci Rep 2017, 7, 40980. [Google Scholar] [CrossRef] [PubMed]
  9. Lai, K.Y.; Galan, S.R.G.; Zeng, Y.; Zhou, T.H.; He, C.; Raj, R.; Riedl, J.; Liu, S.; Chooi, K.P.; Garg, N.; Zeng, M.; Jones, L.H.; Hutchings, G.J.; Mohammed, S.; Nair, S.K.; Chen, J.; Davis, B.G.; van der Donk, W.A. LanCLs add glutathione to dehydroamino acids generated at phosphorylated sites in the proteome. Cell 2021, 184, 2680–2695e26. [Google Scholar] [CrossRef]
  10. Vigliarolo, T.; Zocchi, E.; Fresia, C.; Booz, V.; Guida, L. Abscisic acid influx into human nucleated cells occurs through the anion exchanger AE2. Int J Biochem Cell Biol 2016, 75, 99–103. [Google Scholar] [CrossRef]
  11. Cichero, E.; Fresia, C.; Guida, L.; Booz, V.; Millo, E.; Scotti, C.; Iamele, L.; de Jonge, H.; Galante, D.; De Flora, A.; Sturla, L.; Vigliarolo, T.; Zocchi, E.; Fossa, P. Identification of a high affinity binding site for abscisic acid on human lanthionine synthetase component C-like protein 2. Int J Biochem Cell Biol 2018, 97, 52–61. [Google Scholar] [CrossRef] [PubMed]
  12. Spinelli, S.; Begani, G.; Guida, L.; Magnone, M.; Galante, D.; D’Arrigo, C.; Scotti, C.; Iamele, L.; De Jonge, H.; Zocchi, E.; Sturla, L. LANCL1 binds abscisic acid and stimulates glucose transport and mitochondrial respiration in muscle cells via the AMPK/PGC-1α/Sirt1 pathway. Mol Metab 2021, 53, 101263. [Google Scholar] [CrossRef]
  13. Spinelli, S.; Cossu, V.; Passalacqua, M.; Hansen, J.B.; Guida, L.; Magnone, M.; Sambuceti, G.; Marini, C.; Sturla, L.; Zocchi, E. The ABA/LANCL1/2 Hormone/Receptor System Controls Adipocyte Browning and Energy Expenditure. Int J Mol Sci 2023, 24. [Google Scholar] [CrossRef] [PubMed]
  14. Magnone, M.; Ameri, P.; Salis, A.; Andraghetti, G.; Emionite, L.; Murialdo, G.; De Flora, A.; Zocchi, E. Microgram amounts of abscisic acid in fruit extracts improve glucose tolerance and reduce insulinemia in rats and in humans. FASEB J 2015, 29, 4783–93. [Google Scholar] [CrossRef] [PubMed]
  15. Magnone, M.; Leoncini, G.; Vigliarolo, T.; Emionite, L.; Sturla, L.; Zocchi, E.; Murialdo, G. Chronic Intake of Micrograms of Abscisic Acid Improves Glycemia and Lipidemia in a Human Study and in High-Glucose Fed Mice. Nutrients 2018, 10. [Google Scholar] [CrossRef] [PubMed]
  16. Petrocelli, J.J.; Drummond, M.J. PGC-1α-Targeted therapeutic approaches to enhance muscle recovery in aging. International Journal of Environmental Research and Public Health 2020, 17, 8650–10. [Google Scholar] [CrossRef] [PubMed]
  17. Bianchi, L.; Fiorentini, S.; Gianella, S.; Gianotti, S.; Iadanza, C.; Asadi, S.; Saccomandi, P. Measurement of Thermal Conductivity and Thermal Diffusivity of Porcine and Bovine Kidney Tissues at Supraphysiological Temperatures up to 93 °C. Sensors 2023, 23, 6865. [Google Scholar] [CrossRef]
  18. Lu, K.; Wazawa, T.; Sakamoto, J.; Vu, C.Q.; Nakano, M.; Kamei, Y.; Nagai, T. Intracellular Heat Transfer and Thermal Property Revealed by Kilohertz Temperature Imaging with a Genetically Encoded Nanothermometer. Nano Lett 2022, 22, 5698–5707. [Google Scholar] [CrossRef] [PubMed]
  19. Sun, Y.; Fu, M.; Bian, M.; Zhu, Q. Recent progress on small molecular temperature-sensitive fluorescent probes. Biotechnol Bioeng 2023, 120, 7–21. [Google Scholar] [CrossRef]
  20. Wu, N.; Sun, Y.; Kong, M.; Lin, X.; Cao, C.; Li, Z.; Feng, W.; Li, F. Er-Based Luminescent Nanothermometer to Explore the Real-Time Temperature of Cells under External Stimuli. Small 2022, 18. [Google Scholar] [CrossRef]
  21. Ogle, M.M.; Smith McWilliams, A.D.; Ware, M.J.; Curley, S.A.; Corr, S.J.; Martí, A.A. Sensing Temperature in Vitro and in Cells Using a BODIPY Molecular Probe. J Phys Chem B 2019, 123, 7282–7289. [Google Scholar] [CrossRef] [PubMed]
  22. Zhou, J.; Del Rosal, B.; Jaque, D.; Uchiyama, S.; Jin, D. Advances and challenges for fluorescence nanothermometry. Nat Methods 2020, 17, 967–980. [Google Scholar] [CrossRef]
  23. Kuznetsov, K.M.; Baigildin, V.A.; Solomatina, A.I.; Galenko, E.E.; Khlebnikov, A.F.; Sokolov, V.V.; Tunik, S.P.; Shakirova, J.R. Polymeric Nanoparticles with Embedded Eu(III) Complexes as Molecular Probes for Temperature Sensing. Molecules 2022, 27. [Google Scholar] [CrossRef]
  24. Han, D.; Xu, J.; Wang, H.; Wang, Z.; Yang, N.; Yang, F.; Shen, Q.; Xu, S. Non-Interventional and High-Precision Temperature Measurement Biochips for Long-Term Monitoring the Temperature Fluctuations of Individual Cells. Biosensors (Basel) 2021, 11. [Google Scholar] [CrossRef] [PubMed]
  25. Spinelli, S.; Guida, L.; Passalacqua, M.; Magnone, M.; Cossu, V.; Sambuceti, G.; Marini, C.; Sturla, L.; Zocchi, E. Abscisic Acid and Its Receptors LANCL1 and LANCL2 Control Cardiomyocyte Mitochondrial Function, Expression of Contractile, Cytoskeletal and Ion Channel Proteins and Cell Proliferation via ERRα. Antioxidants (Basel) 2023, 12. [Google Scholar] [CrossRef] [PubMed]
  26. Murray, J.H.; Hargett, S.; Hoehn, K.L.; Santos, W.L. Anilinopyrazines as potential mitochondrial uncouplers. Bioorg Med Chem Lett 2020, 30. [Google Scholar] [CrossRef] [PubMed]
  27. Klaus, S.; Ost, M. Mitochondrial uncoupling and longevity - A role for mitokines? Exp Gerontol 2020, 130, 110796. [Google Scholar] [CrossRef] [PubMed]
  28. Kröger, A. Fumarate as terminal acceptor of phosphorylative electron transport. Biochim Biophys Acta 1978, 505, 129–145. [Google Scholar] [CrossRef] [PubMed]
  29. Spinelli, J.B.; Rosen, P.C.; Sprenger, H.G.; Puszynska, A.M.; Mann, J.L.; Roessler, J.M.; Cangelosi, A.L.; Henne, A.; Condon, K.J.; Zhang, T.; Kunchok, T.; Lewis, C.A.; Chandel, N.S.; Sabatini, D.M. Fumarate is a terminal electron acceptor in the mammalian electron transport chain. Science 2021, 374, 1227–1237. [Google Scholar] [CrossRef]
  30. Ramirez, L.; Negri, P.; Sturla, L.; Guida, L.; Vigliarolo, T.; Maggi, M.; Eguaras, M.; Zocchi, E.; Lamattina, L. Abscisic acid enhances cold tolerance in honeybee larvae. Proc Biol Sci 2017, 284. [Google Scholar] [CrossRef]
Figure 1. Thermal relaxation signals measured in control eppendorfs, containing buffer with nutrients alone. (a) Thermal relaxation signal reflecting an initial small temperature difference ∆T = 0.03 °C between the sample and reference vials. Both vials contain the same 1 mL volume mixture of buffer and nutrients. The output of the lock-in amplifier X is shown in the course of time; 10 μV correspond to 10 mK in temperature. The data is well represented by the model described in the text (solid line), with zero heating power (w = 0) and an effective diffusion constant (D = 1.5 × 10⁻³ cm2/s) equal to that of water. (b) Thermal relaxation signal corresponding to a negative initial temperature difference ∆T = −0.475 °C between sample and reference vials. The solid line shows the model with the same parameter values as in (a), except for ∆T and a slightly smaller diffusion constant D = 1.3 × 10⁻³ cm2/s (see text for explanation).
Preprints 99207 g001
Figure 2. Time course of the temperature variation between LANCL1/2-overexpressing and double silenced H9c2 after addition of nutrients. (a) Time course of the temperature variation measured for a sample of LANCL1/2 overexpressing cells with nutrients (ovn); the reference vial contained double-silenced cells with nutrients (shn). A 10 μV signal corresponds to a temperature variation of 0.01 °C. With a positive initial temperature difference between sample and reference vials, the initial thermal relaxation corresponds to a decrease in the signal, followed by an increase due to additional heat produced by the cells in the sample vial. The ochra solid line represents the model (see text) with parameter values w = 9.0 × 10⁻⁴ cal/°K, D = 1.0 × 10⁻³ cm2/s, ∆T = 0.03 C and τ = 240 s. The magenta and purple lines are drawn in for comparison and represent the same model with w = 11.0 × 10⁻⁴ cal/°K and w = 7.5 × 10⁻⁴ cal/°K, respectively. The ochra line corresponds to a steady state heating power produced by the cells of = 9.0 × 10⁻⁴ cal/s = 3.8 mW according to the model; τ is the characteristic time scale for the cells to “turn on” after addition of the nutrients. (b) Measurement of the temperature variation for a sample similar to the sample of Figure 2a (LANCL1/2 overexpressing cells vs double-silenced cells). In this case the initial temperature difference between sample and reference vials was negative, leading to a monotonic increase of the signal in the course of time. The first ~50 s of this increase (corresponding to −30 < X < 0 [μV]) are due to thermal relaxation of the initial temperature difference; the subsequent signal increase (corresponding to 0 < X < 15 [μV]) is due to additional heat produced by the cells in the sample vial. The solid line shows the model with the same parameter values as in (a) except for w = 4.0 × 10⁻⁴ cal/°K and ∆T = −0.03 C.
Preprints 99207 g002
Figure 3. Summary of the experiments with the temperature probes. The power produced by 2.5x10⁶ LANCL1/2-overexpressing (ov) or double-silenced (sh) cells, with (n) or without nutrients was comparatively measured as described in par. 1.1. At least one control was always performed alongside each experimental measure. Results shown are the mean ± SD of the power emission from at least 3 different measures for each experiment.
Preprints 99207 g003
Figure 4. Calibrations. (a) Calibration experiment performed with a heating resistance inside the sample vial, simulating the heat produced by the cells. The initial drop of the signal corresponds to thermalization of an initial temperature difference between the vials. At t ≈ 8 min the heating resistance is turned on, delivering = 250 μW. At t ≈ 20 min the resistance is turned off, and at t ≈ 28 min it is turned on again, delivering = 518 μW. (b) Calibration experiment showing the temperature signal produced by the heating resistance delivering = 250 μW to the sample vial. The heating was turned on at t ≈ 6 min and off at t ≈ 17 min. The sample and reference vials were inverted with respect to Figure 4a.
Preprints 99207 g004
Figure 6. DSC measurements showing the effect of ABA on the thermogenesis of overexpressing cells. The ovnovn trace (ochra) serves as reference, both crucibles containing the same mixture of overexpressing cells with nutrients. The ovnABA_ovn trace (purple) shows the effect of ABA activation, comparing overexpressing cells (with nutrients) with and without ABA. Comparing with the ovn_ov (green trace) (overexpressing cells with and without nutrients), we see that ABA activation roughly doubles the heating power generated by the cells. Quantitatively we find, for the ochra trace, Δ𝓅[ovn_ovn] ≈ 18 μW while for the purple trace Δ𝓅[ovnABA_ovn] ≈ 96 μW and for the green trace Δ𝓅[ovn_ov] ≈ 93 μW. In this example ABA activation results in an increase in heating power of (96 – 18) μW = 78 μW for the cells with nutrients, comparable to the heating power of (93 – 18) μW = 75 μW obtained by adding nutrients to the cells.
Preprints 99207 g006
Figure 7. Summary of DSC measures of the power generated by LANCL1/2-overexpressing H9c2 cardiomyocytes. The measure reported is Δ𝓅 defined in the text, in μW. OV, LANCL1/2-overexpressing cells; SH, double-silenced cells; n, nutrients; dGlu, 2′-deoxy-glucose. Data are the mean ± SD of at least 3 measures.
Preprints 99207 g007
Disclaimer/Publisher’s Note: The statements, opinions and data contained in all publications are solely those of the individual author(s) and contributor(s) and not of MDPI and/or the editor(s). MDPI and/or the editor(s) disclaim responsibility for any injury to people or property resulting from any ideas, methods, instructions or products referred to in the content.
Copyright: This open access article is published under a Creative Commons CC BY 4.0 license, which permit the free download, distribution, and reuse, provided that the author and preprint are cited in any reuse.
Prerpints.org logo

Preprints.org is a free preprint server supported by MDPI in Basel, Switzerland.

Subscribe

© 2024 MDPI (Basel, Switzerland) unless otherwise stated