1. Introduction
Since 1983, the 19.063 km Cibatu-Garut railway line has been decommissioned, but the railway bridge and its supporting structures still remain. BH 25 is a 3-span railway bridge, with span-1 and span-3 utilizing the girder bridge type, while span-2 employs the truss bridge type. This bridge is an older structure that was relocated from South Sumatra and subsequently positioned at its current location, spanning across a river in a straight trajectory. The structure beneath the bridge consists of masonry construction, with reinforced concrete structures serving as cladding.
According to the Directorate General of Railways, the expected service life of the BH 25 railway bridge is over 100 years. Although the provision for camber on the bridge was initially designed, it was not realized during implementation. To ensure the safety of the bridge, temporary reinforcement in the form of two columns was added to span-2. This precaution was taken due to indications of a decrease in the bridge structure by -8.0 mm, which should have had a camber height of +300 mm. In accordance with Ministerial Regulation No. 69 of 2018 on Railway Safety Management Systems, all bridges intended for use must undergo safety testing. Given the described conditions, it is essential to assess the structure of the BH 25 railway bridge to evaluate the extent of damage and determine the necessary steps to enhance the bridge's serviceability.
2. Materials and Methods
2.1. Bridge Testing
Bridge monitoring can be divided into two parts: inspection-based monitoring and instrument-based monitoring [
1]. Diagnostic load testing proves to be a suitable method for assessing the condition of a bridge. This inexpensive and rapid technique demonstrates the bridge's response to an applied load, with measurements including displacements, strain measurements, and the determination of bridge dynamic parameters. The test results obtained allow for a more accurate diagnosis of the actual bridge condition [
2].
Static and dynamic load tests were conducted to evaluate the bridge's capacity to carry the design load and to calibrate the finite element model. In the static loading tests, vertical displacements and strains of the structural elements were measured [
3]. The static load test was divided into three types of loading conditions, each assessing the stress and deflection of different main parts of the bridge. For the dynamic load test, lateral and vertical dynamic displacements of the piers and center span sections were measured as trains passed over the bridge at various speeds. The entire bridge's natural frequency, vibration mode, and damping ratio were also measured [
4]. Both static and dynamic loads were applied using two 2M62 heavy locomotives with a total load of 2328 kN. Five dynamic tests were performed at speeds ranging from 20 to 100 km/h. The results of the static tests provided the maximum displacements of the bridge girders, while the dynamic tests yielded information on vibration characteristics, particularly modal parameters such as vibration mode shapes, frequencies, damping ratios, and dynamic amplification factors [
5].
Railway bridge girders were designed with camber to accommodate vertical deflections that may occur during the construction or operation of trains. The camber of the girders was determined based on the dead load of the main girder, following applicable regulations [
6]. External prestressing is considered one of the most effective reinforcements for increasing the service life of a structure. Since the 1950s, this reinforcement technique has been successfully applied to bridge structures in many countries and has proven to be an efficient solution for various types of bridges. Prestressing reinforcement is defined as a system in which tendons are placed outside the cross-section, and the prestressing force is transmitted to the girder through end anchors, deflectors, or saddles [
7]. Utilizing an experimentally validated model, numerical simulations were performed to evaluate the effect of the ratio of deviator spacing to span length (Sd/L). The internal forces decrease linearly with increasing Sd/L. An increase in Sd/L results in a decrease in the ultimate stress of the tendon [
8].
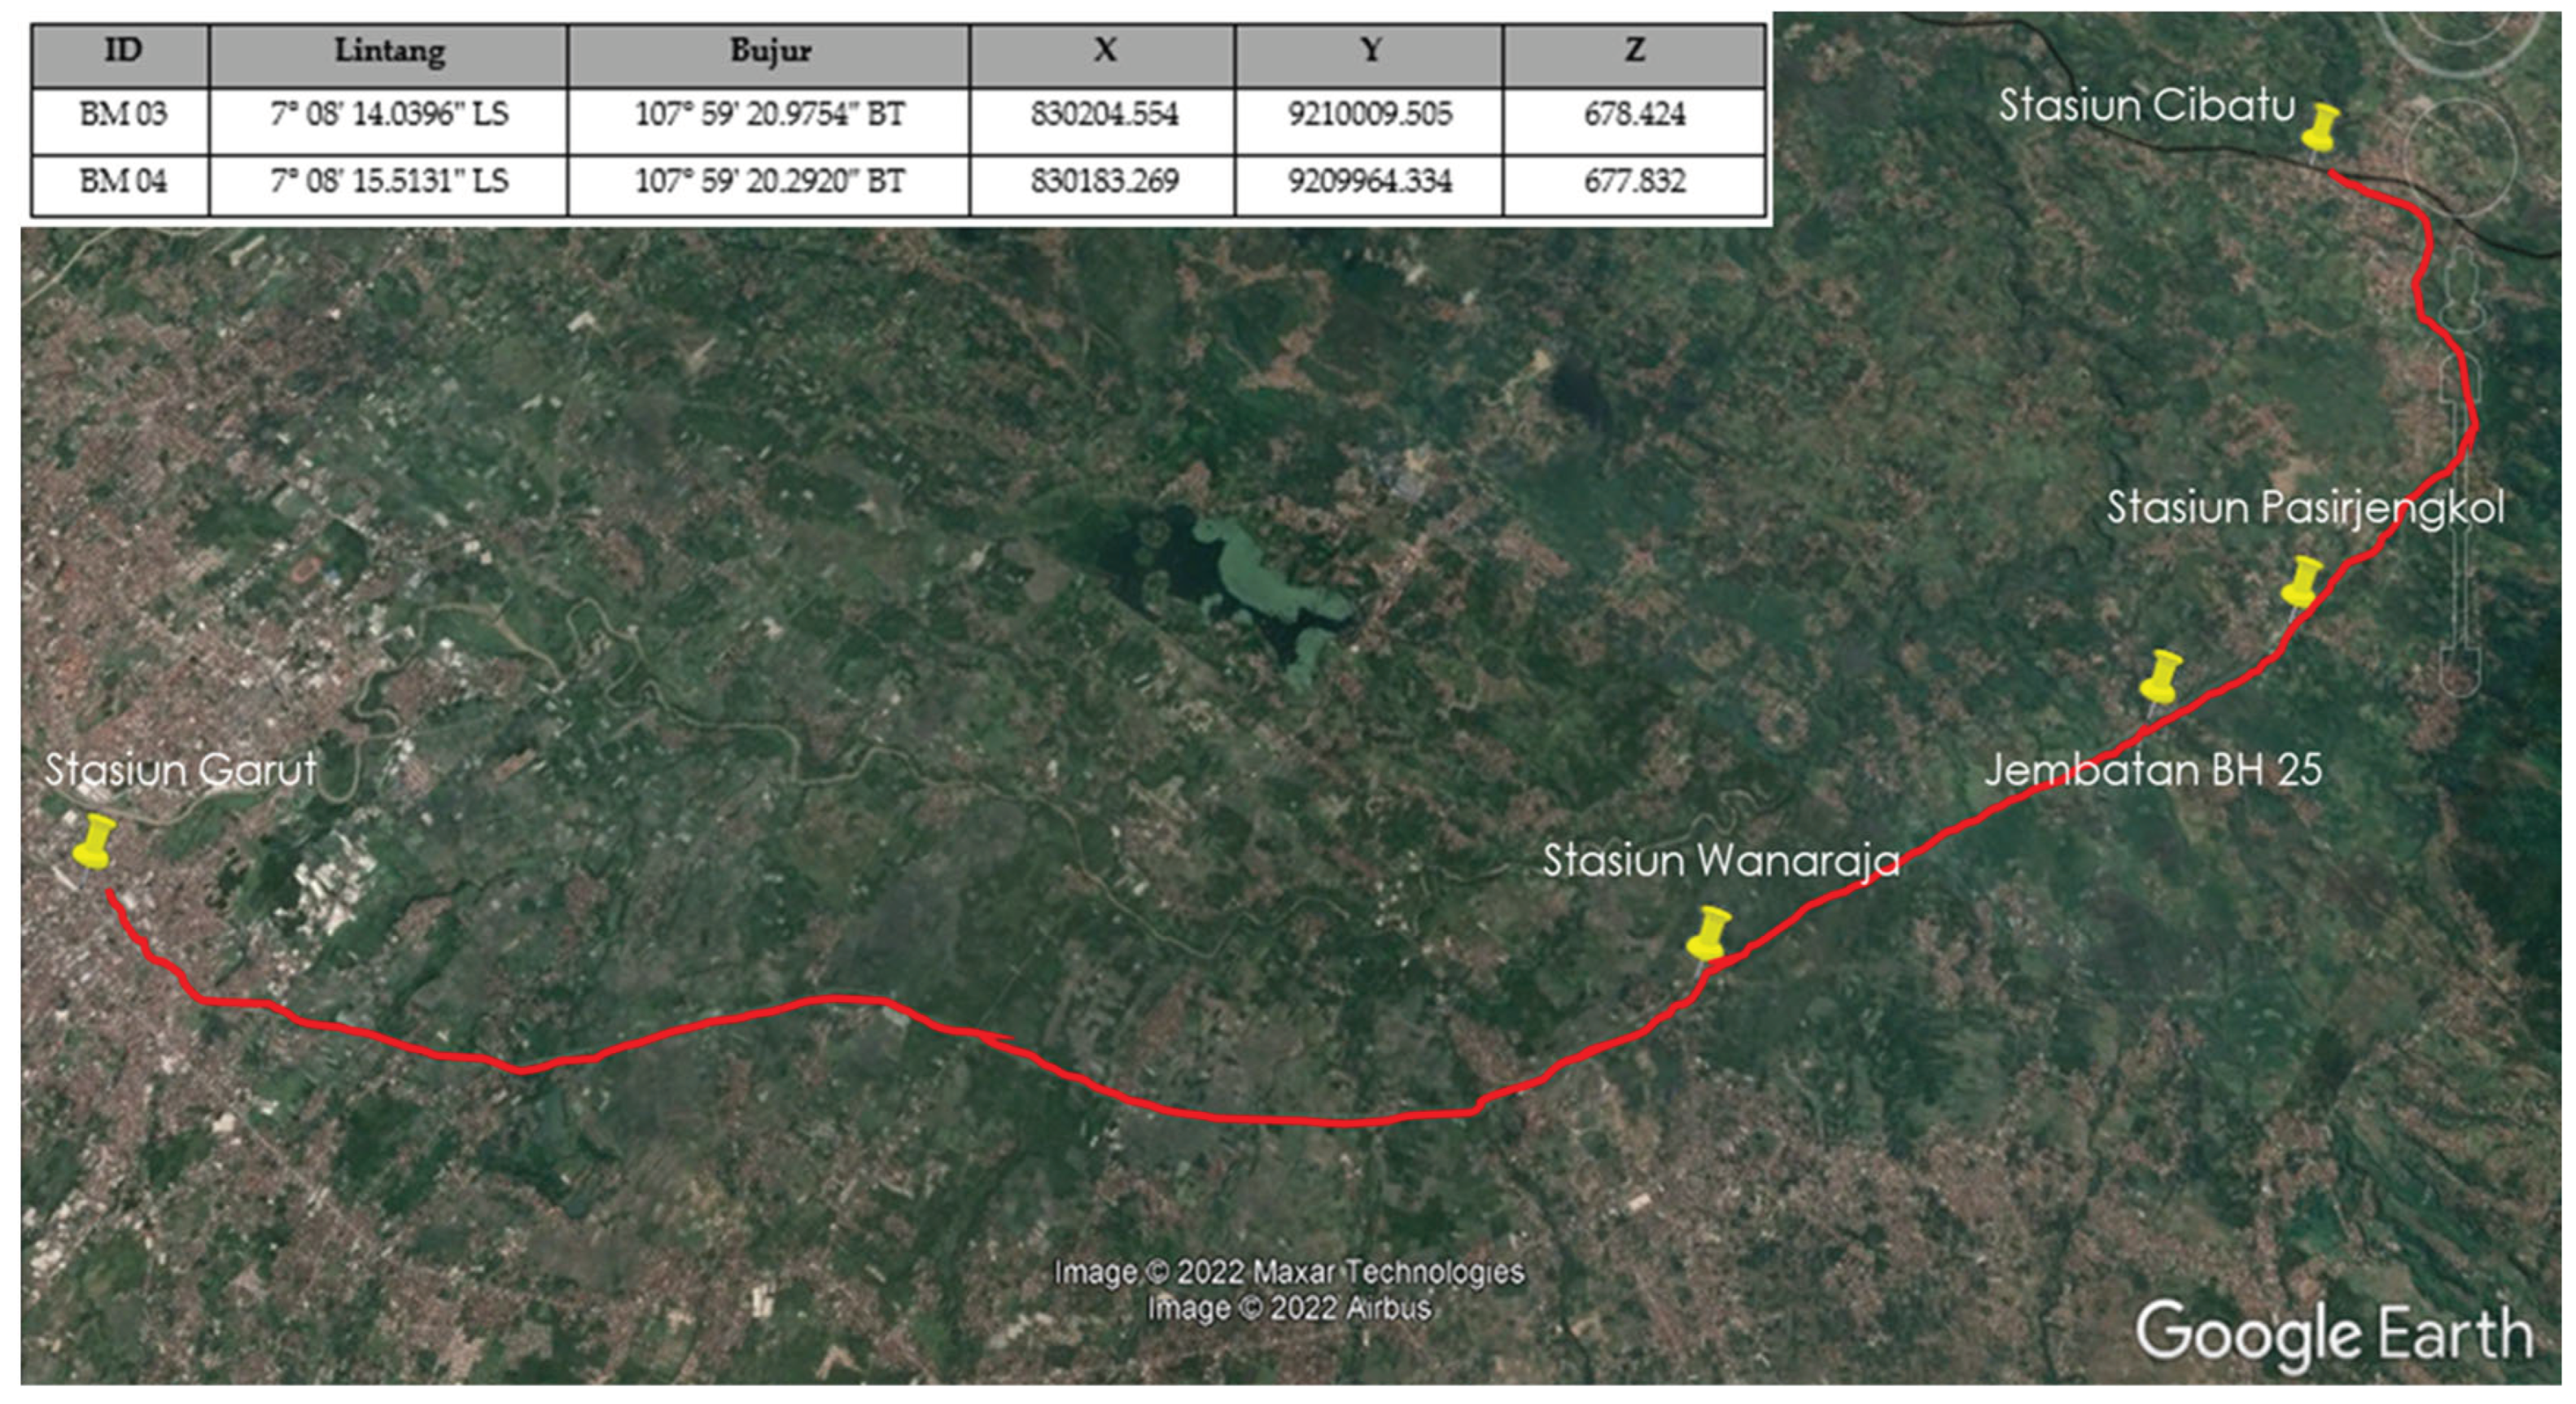
The bridge is currently located in Garut City, West Java Province, Indonesia.
Figure 1 displays a map of the Cibatu-Garut railway line.
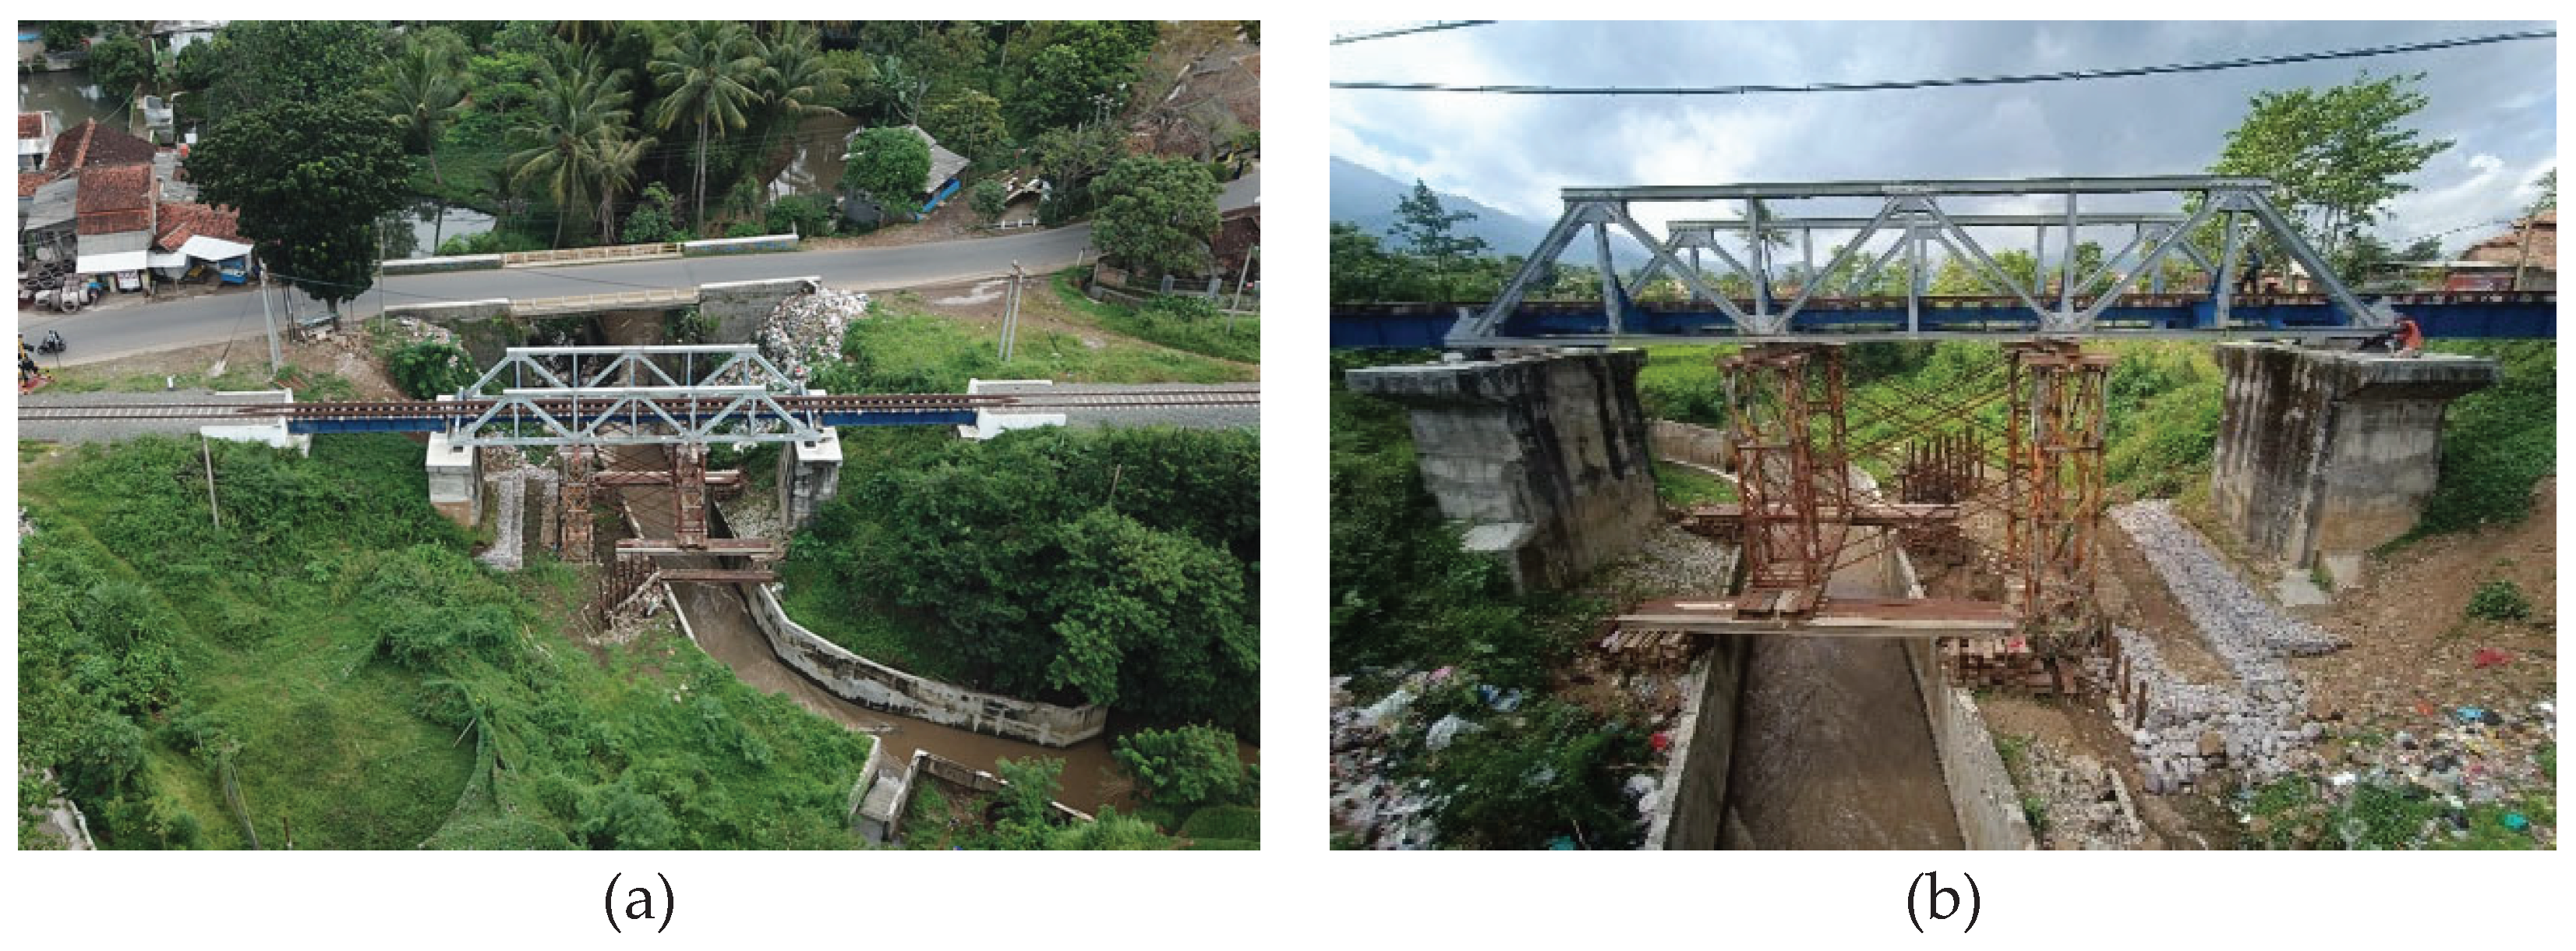
Figure 2a is an aerial view of the bridge, while
Figure 2b provides a detailed look at the steel frame structure. The bridge has a total length of 41.055 meters, as depicted in
Figure 3.
Table 1.
Bridge Data.
| Bridge Type |
Girder and Truss Bridges |
| Located |
Pasirjengkol – Wanaraja |
| Bridge Length |
41.055 m |
| Bridge Width |
1.30 m; 3.60 m; 1.30 m |
| Width Between Rails |
1.20 m |
| Number of Spans |
3 spans |
| Span Configuration |
9.485 m; 21.935 m; 9.635 m |
| Bottom Structure Type |
Stone Masonry |
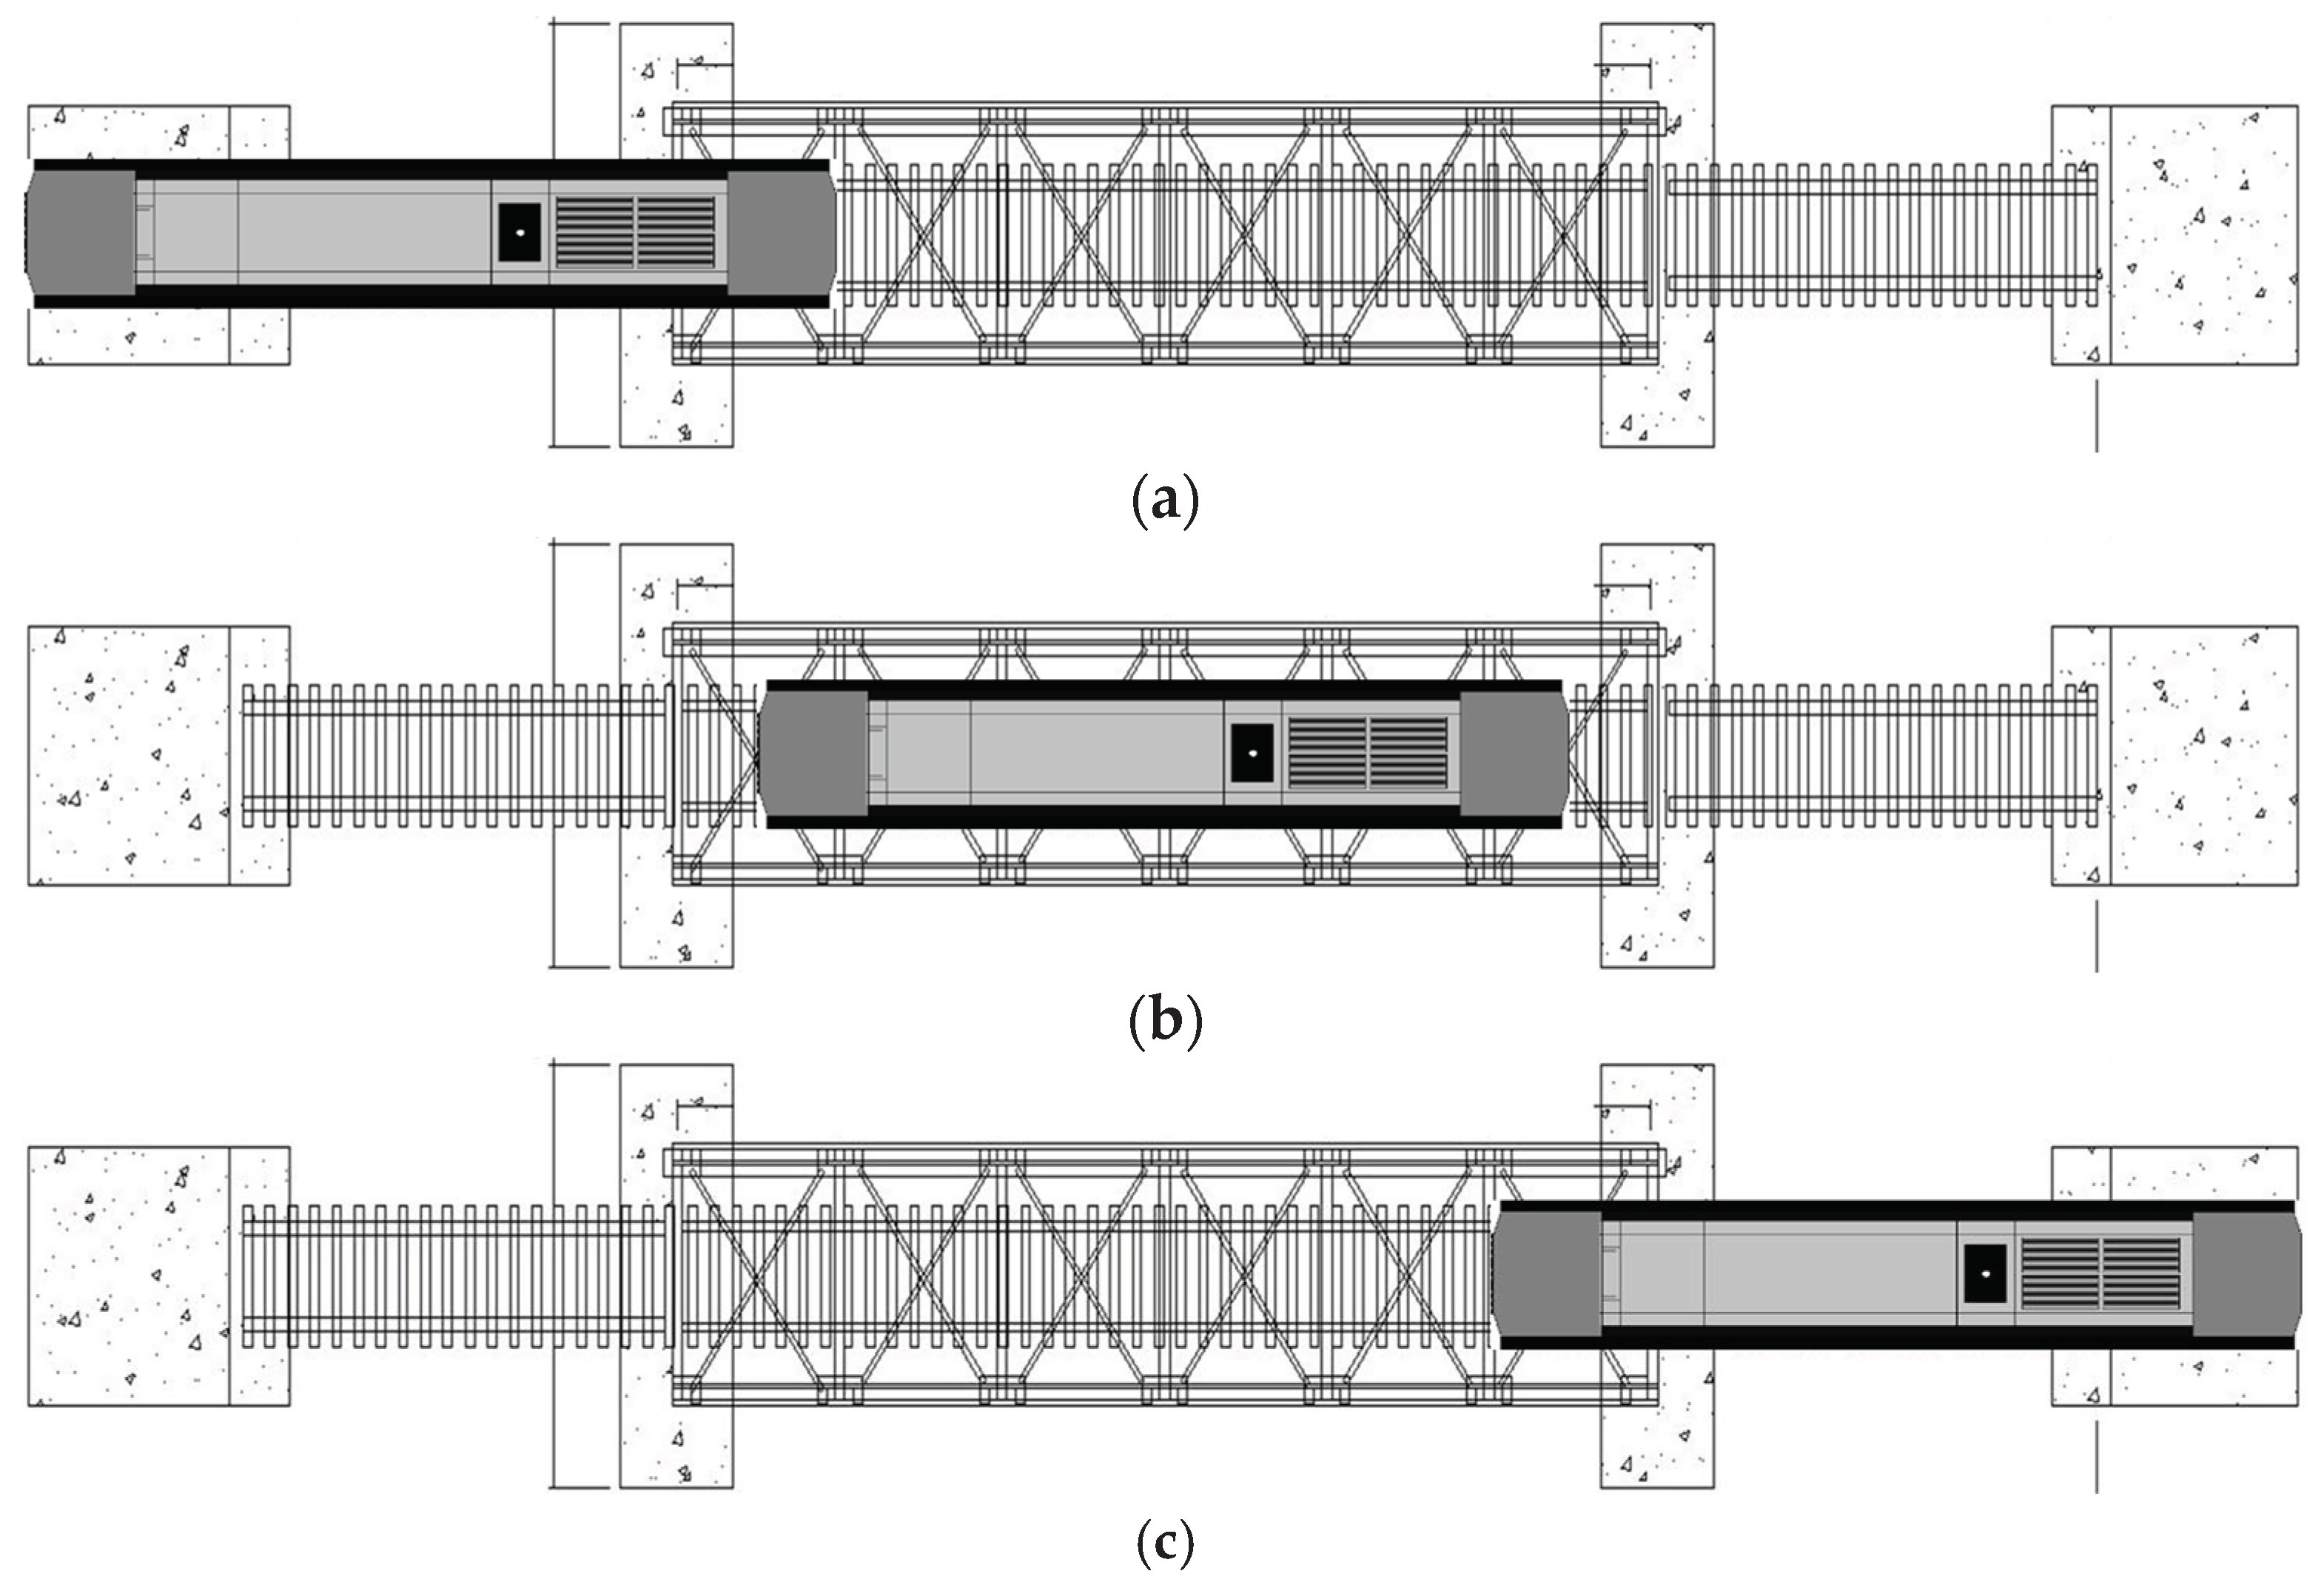
The static and dynamic tests of the bridge were conducted by applying the load of the CC206 locomotive, which has a total weight of 90 tons and six axles, each with an axle load of 15 tons. The specifications of the CC206 locomotive are provided in
Table 2. The bridge test scheme, performed on three bridge spans, is illustrated in
Figure 4.
The dimensions of the BH 25 bridge structure are presented in
Table 3. The main structure of the bridge is constructed using steel, ironwood material is employed for the rail bearings, and the lower structure is made of masonry, as indicated in
Table 4.
2.2. Bridge Modeling
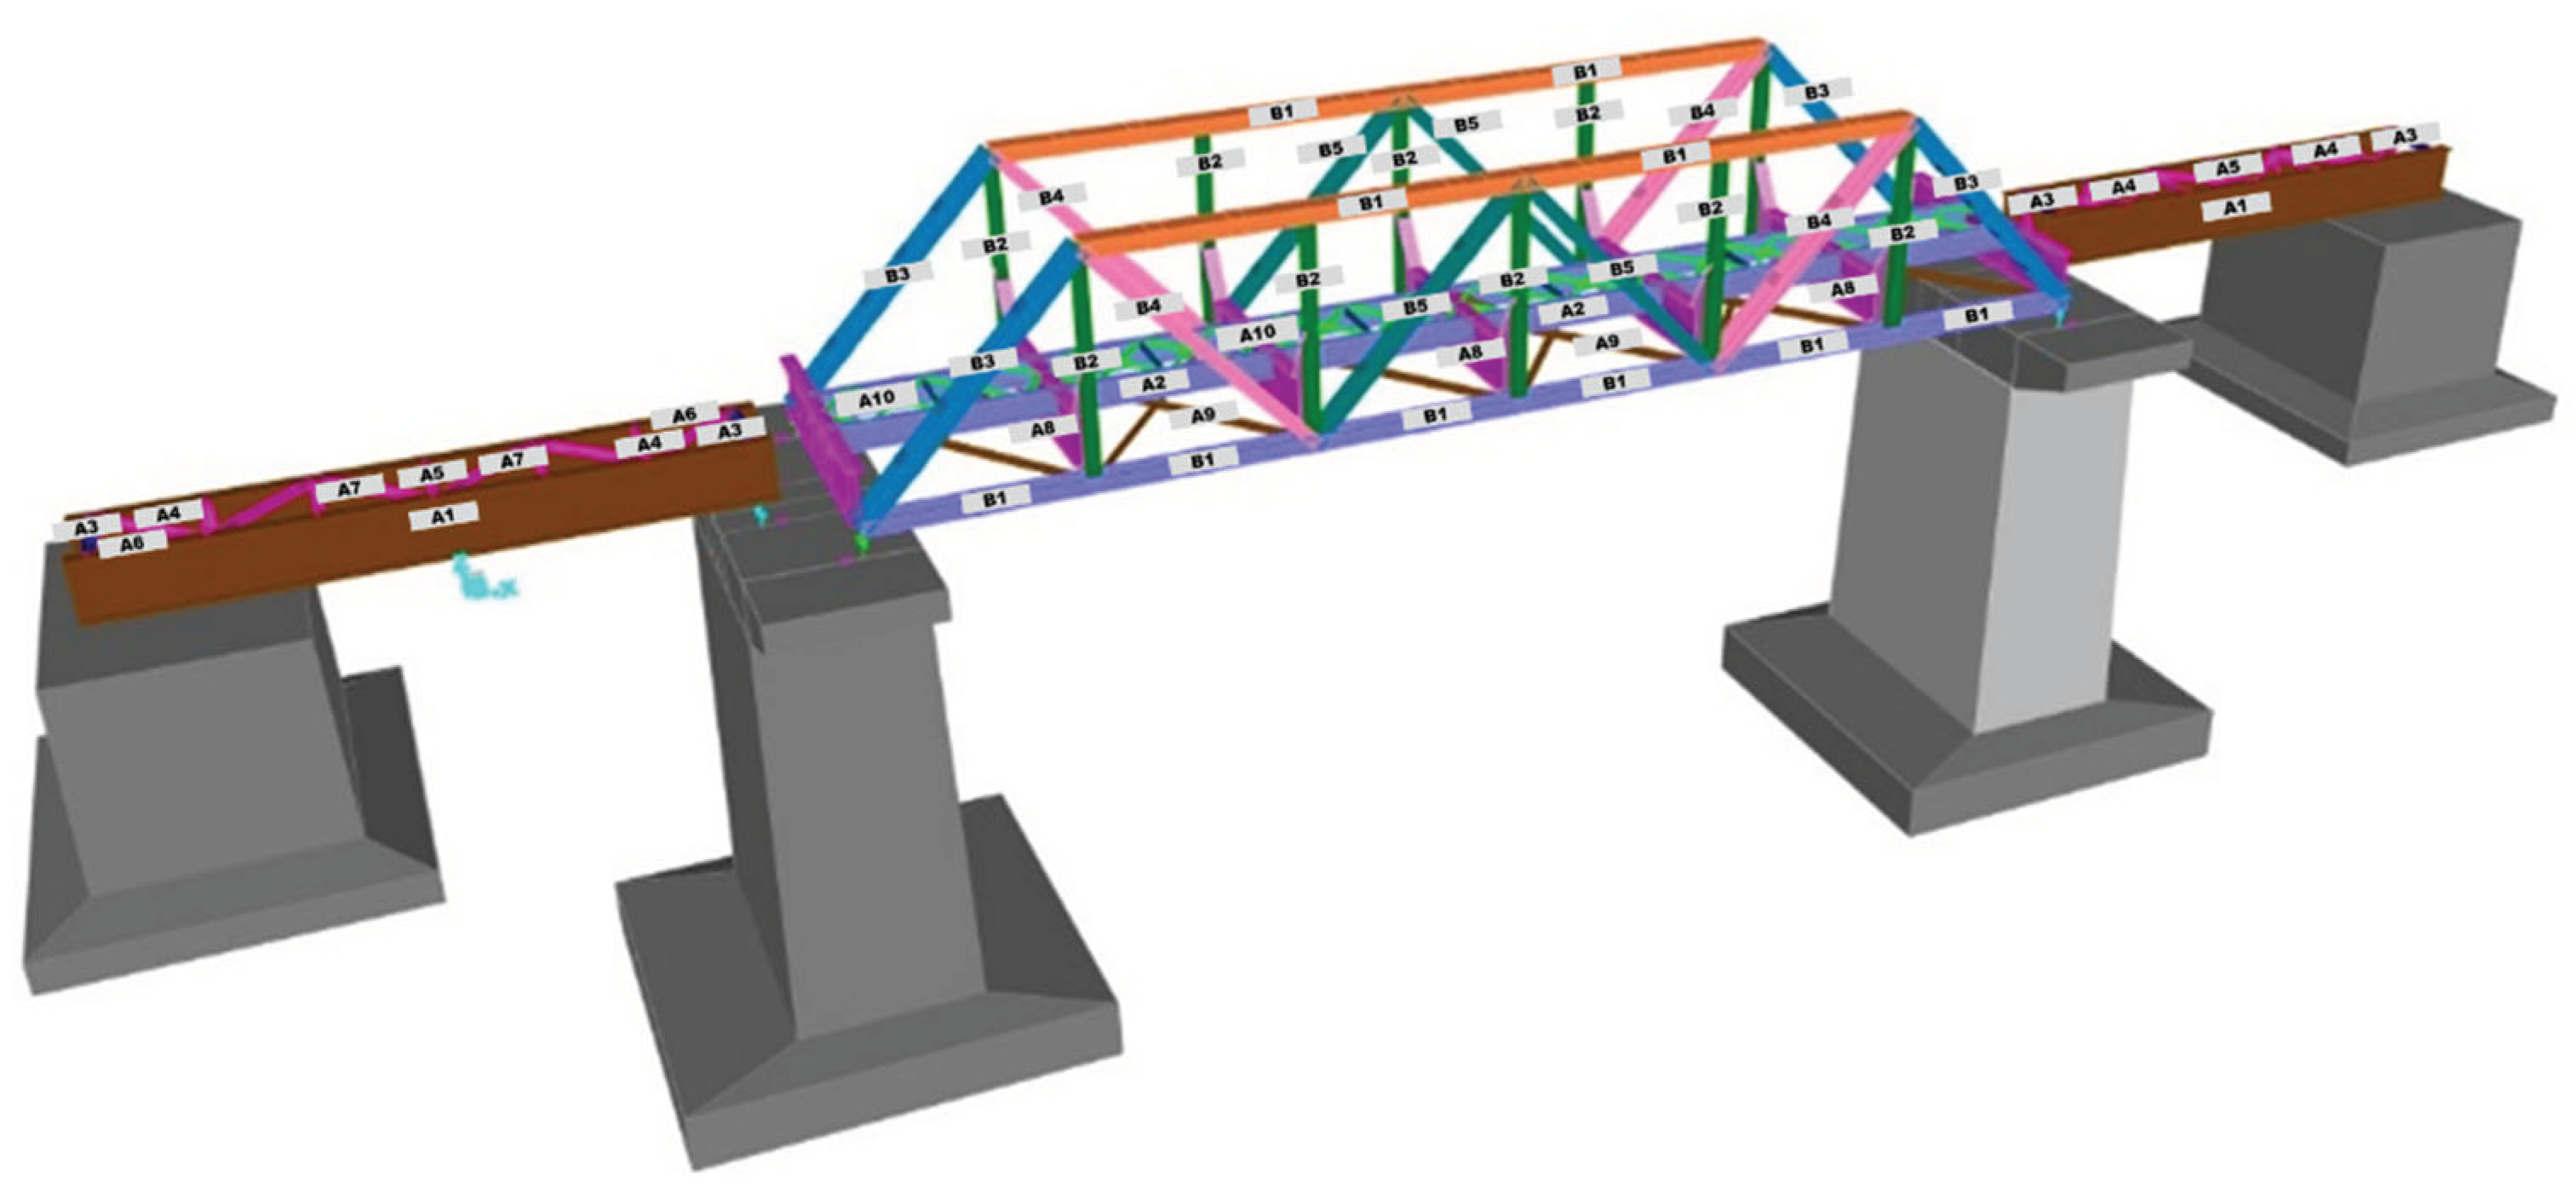
The BH 25 bridge was modeled in 3D, as illustrated in
Figure 5,
Figure 6 and
Figure 7, to compare the results of theoretical and real bridge behavior tests. Additionally, this 3D modeling serves as the foundation for inspectors to estimate the placement of measuring instruments during field tests. Typically, inspectors position the instruments on the bridge elements experiencing the greatest internal forces.
2.3. Static Load Testing
Static testing is conducted to assess the capacity of the bridge structure by applying loads based on the bridges load configuration. The objective is to obtain structural deflection and strain parameters [
9].
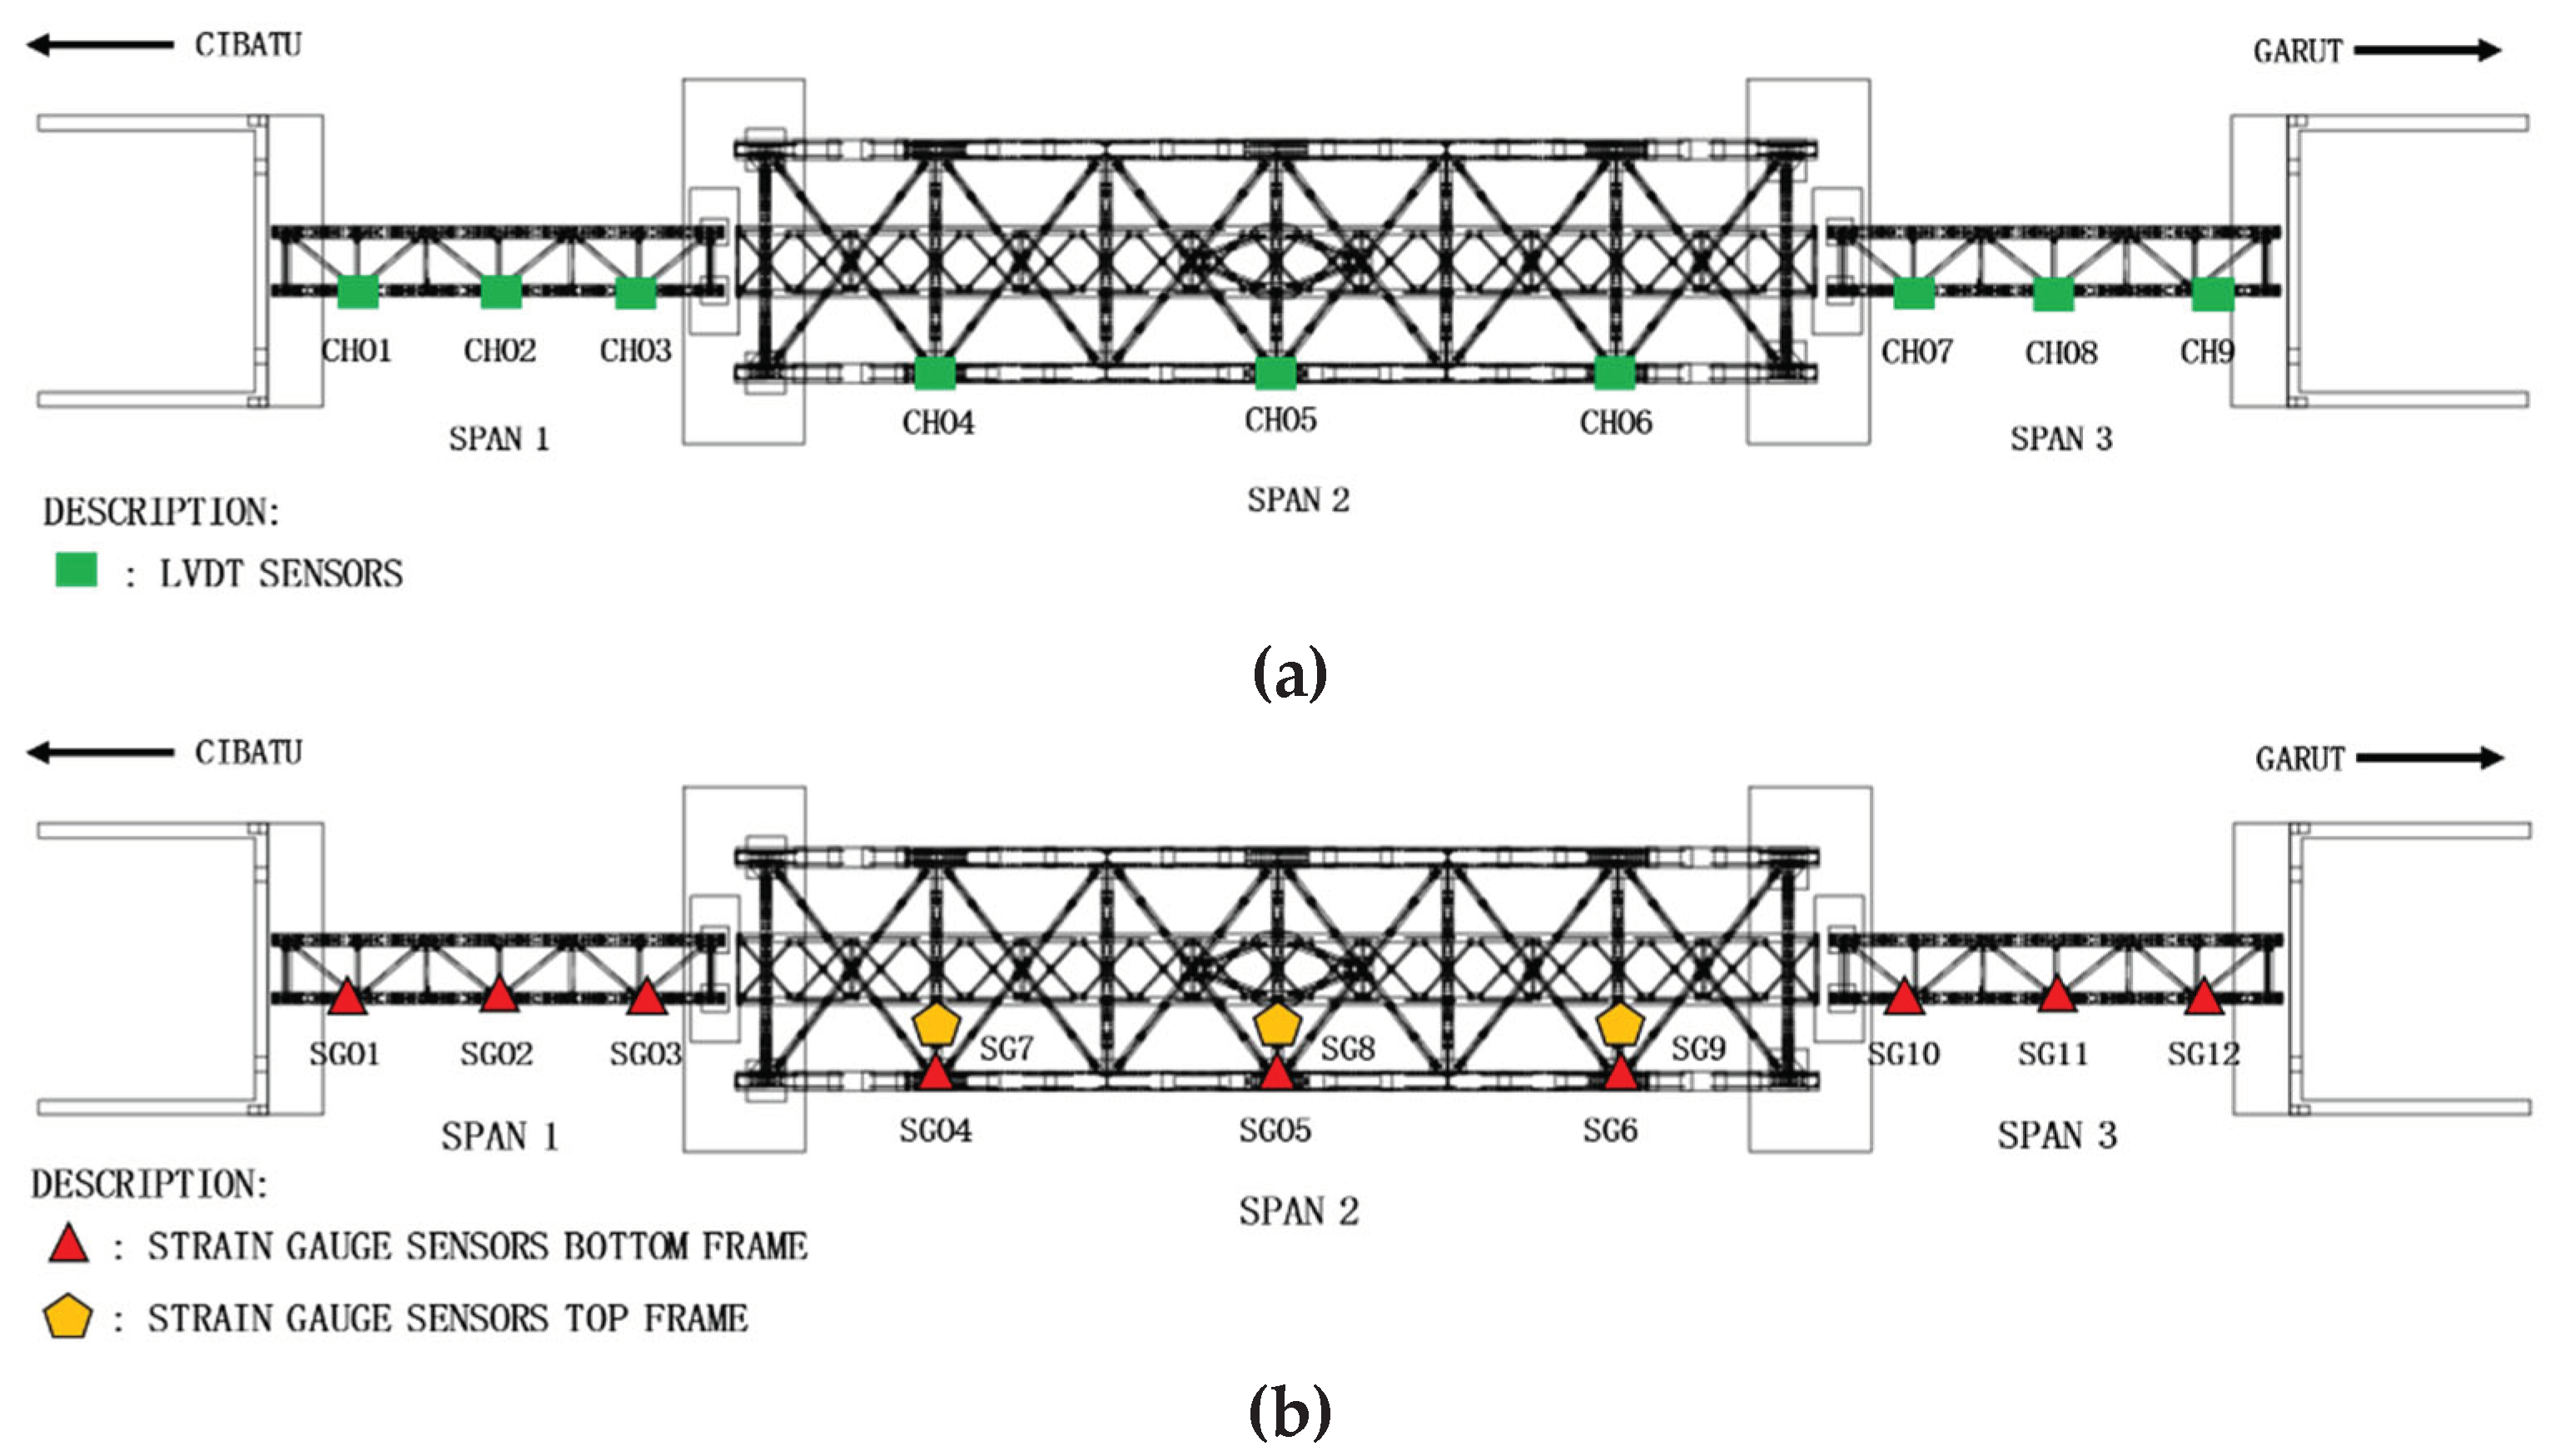
The loading process in the static test is conducted using a locomotive, in accordance with Minister of Transportation Regulation No. 60 of 2012. The observation of changes in the bridge structure, both in the vertical and horizontal directions of the bridge girder structural elements, is performed with the assistance of strain gauge sensors and Linear Variable Differential Transformers (LVDT).
Strain gauges and LVDT are placed on structural elements that will experience maximum internal forces in critical areas - positions where structural elements undergo the greatest stress influenced by structural conditions. The sensors were installed at 1/4L, 1/2L, and 3/4L spans, as shown in
Figure 8.
2.3. Dynamic Load Testing
Dynamic testing is a procedure in which an impact load is applied to the bridge to gather data on its dynamic characteristics and to estimate dynamic clearance provisions or impact factor. This information can be utilized in the evaluation of the bridge [
9].
In the dynamic testing of bridge structures, accelerometer sensors are installed to measure the dominant vertical frequency occurring on the longitudinal girder. This measurement is conducted by applying a load in the form of a CC206 locomotive. The sensors are strategically placed at 1/4L, 1/2L, and 3/4L positions on the upper structure girders of span-1 and span-2 of the bridge, as illustrated in
Figure 9.
3. Result
3.1. Bridge Modeling
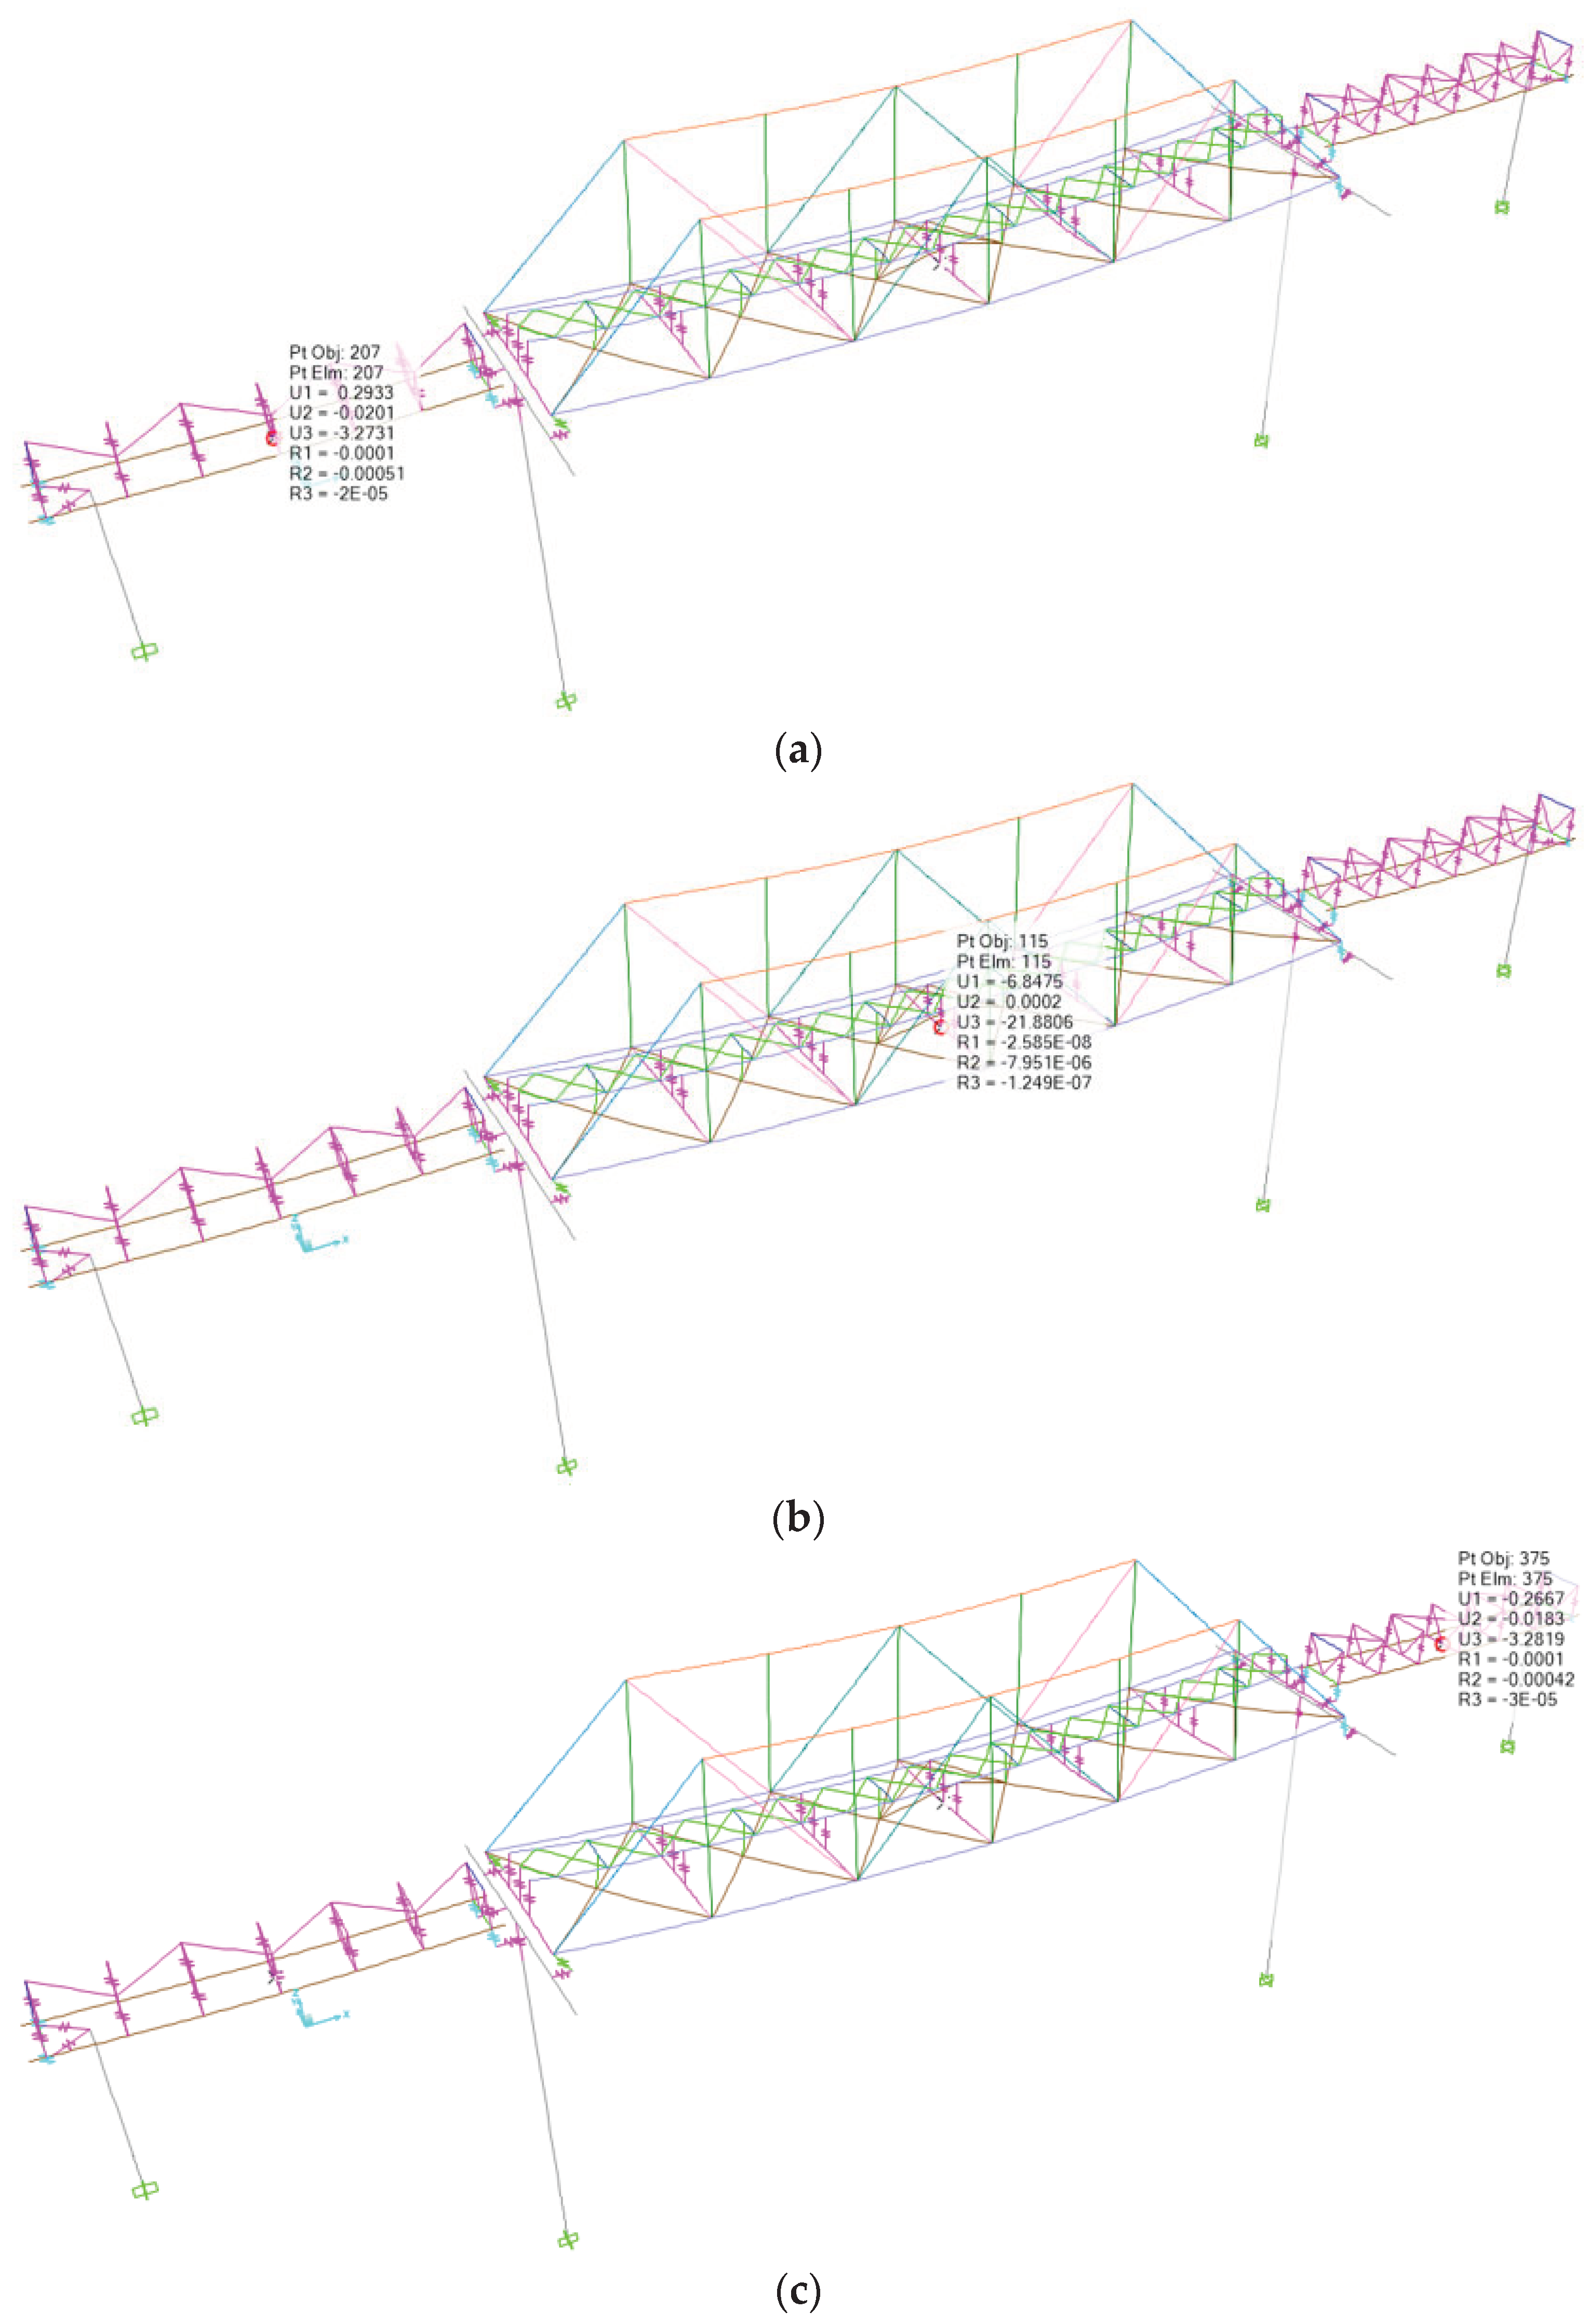
According to Minister of Transportation Regulation No. 60 of 2012, the actual structural deflection value for steel truss railway bridges should not exceed the allowable deflection of L/1000, and for girder bridges, it should not exceed L/800. The deflections resulting from the combination of service loads at 1/2L of the center of the bridge span are illustrated in
Figure 10.
The deflection of the bridge resulting from the modeling due to the service load at 1/2L of span-1 structure is -3.27 mm, which is less than the allowable deflection of L/800 (9485/800 = -11.85 mm). For span-2 structure, the deflection is -21.88 mm, which is less than the allowable deflection of L/1000 (21935/1000 = -21.93 mm). Similarly, for span-3 structure, the deflection is -3.28 mm, which is less than the allowable deflection of L/800 (9635/800 = -12.04 mm). It can be observed that the actual deflection in the structure does not exceed the allowable deflection, and the bridge structure meets the requirements of the stiffness parameter against deflection.
The purpose of the capacity ratio (R) check is to determine whether the structural members meet the safe or unsafe criteria based on the comparison between the ultimate internal force resulting from the maximum load combination and the factored nominal strength of each member. A structure is considered to meet the strength requirements if the value of R is less than 1 or at least equal to 1, while if R is greater than 1, then the structure does not meet the strength requirements. The capacity ratio generated by the maximum load combination on the bridge structural elements is presented in
Table 5.
Figure 12.
Capacity Ratio of Bridge Structure Elements.
Figure 12.
Capacity Ratio of Bridge Structure Elements.
3.2. Static Load Test Result
3.2.1. Deflection of the Structure
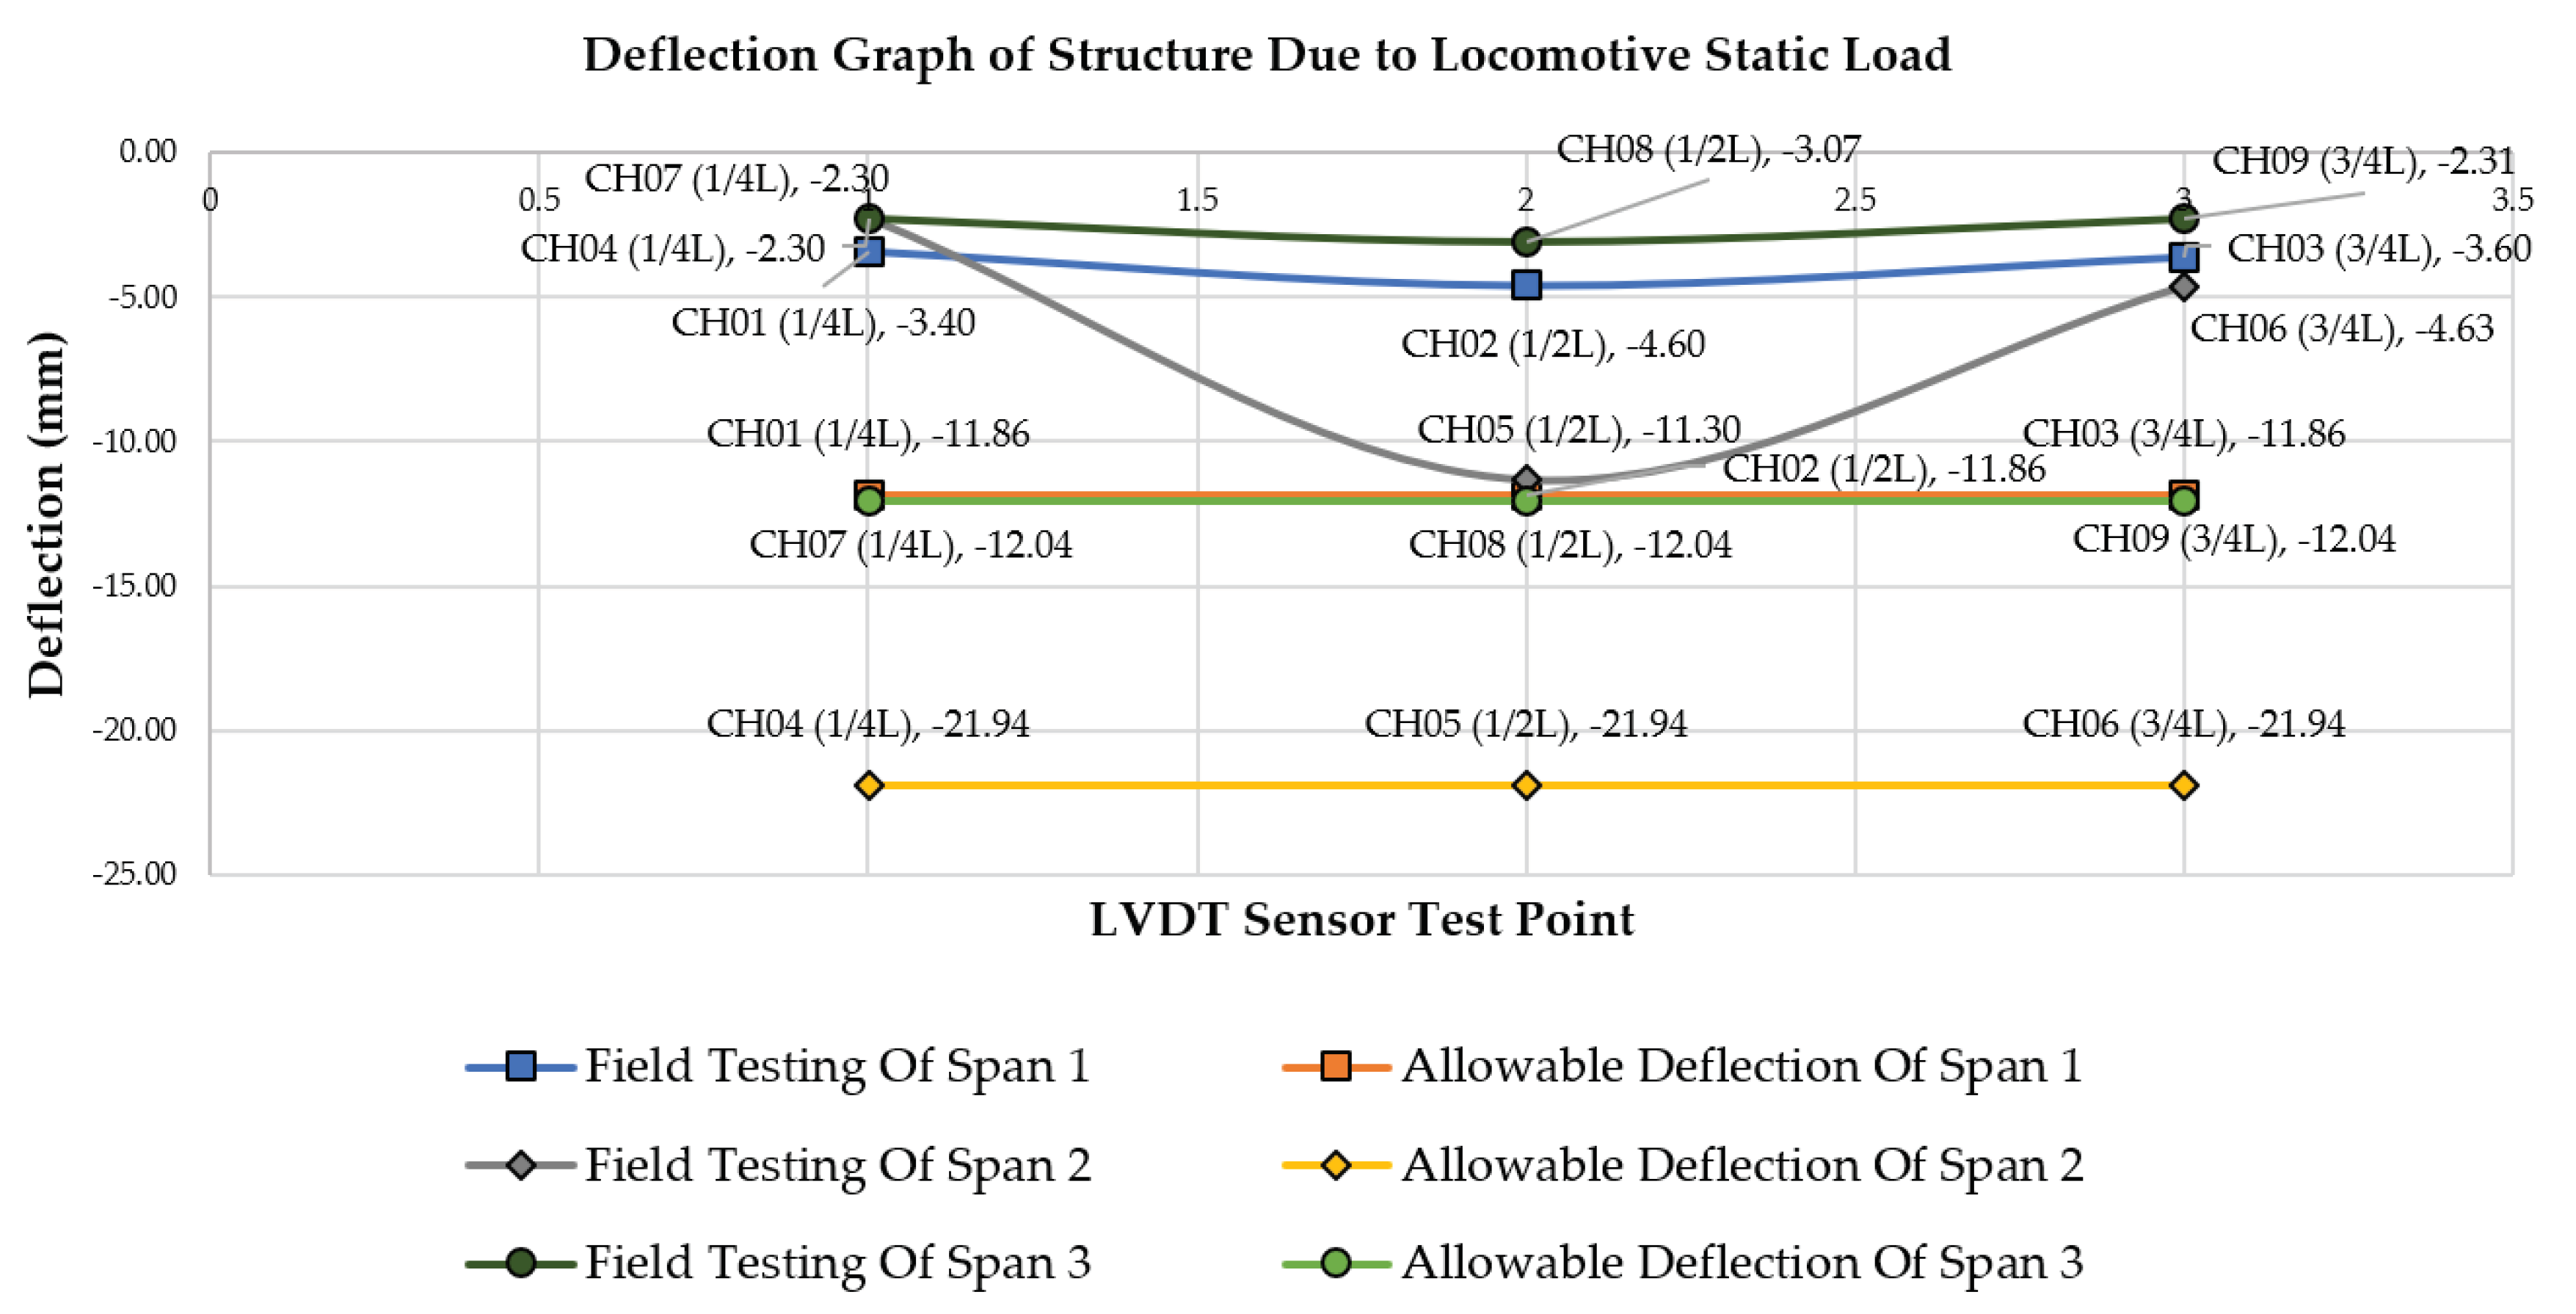
Deflection measurements of the bridge structure were conducted by installing LVDT sensors at 1/4L, 1/2L, and 3/4L on each span. The results of the deflection measurements using LVDT sensors on the bridge structure are depicted in
Figure 13.
Figure 13 illustrates the graph of the deflection measurement results of the bridge structure under the static load of locomotives on span-1, span-2, and span-3. For span-1 of the bridge structure, measurements were taken at 1/4L, 1/2L, and 3/4L. The deflection values at 1/4L (CH01) were -3.40 mm, at 1/2L (CH02) were -4.60 mm, and at 3/4L (CH03) were -3.60 mm. These values are still below the allowable deflection for the bridge, which is L/800 = 9485/800 = -11.85 mm, indicating compliance with the condition of span-1 of the bridge structure. Similarly, for span-2, measurements were taken at 1/4L, 1/2L, and 3/4L, yielding deflection values at 1/4L (CH04) of -2.30 mm, at 1/2L (CH05) of -11.30 mm, and at 3/4L (CH06) of -3.60 mm. These values are still below the allowable deflection for the bridge, which is L/1000 = 21935/1000 = -21.93 mm, indicating compliance with the condition of span-2 of the bridge structure. For span-3, measurements were taken at 1/4L, 1/2L, and 3/4L, resulting in deflection values at 1/4L (CH07) of -2.30 mm, at 1/2L (CH08) of -3.07 mm, and at 3/4L (CH09) of -2.31 mm. These values are still below the allowable deflection for the bridge, which is L/800 = 9635/800 = -12.04 mm, indicating compliance with the condition of span-3 of the bridge structure.
3.2.2. Structural Strain and Stress
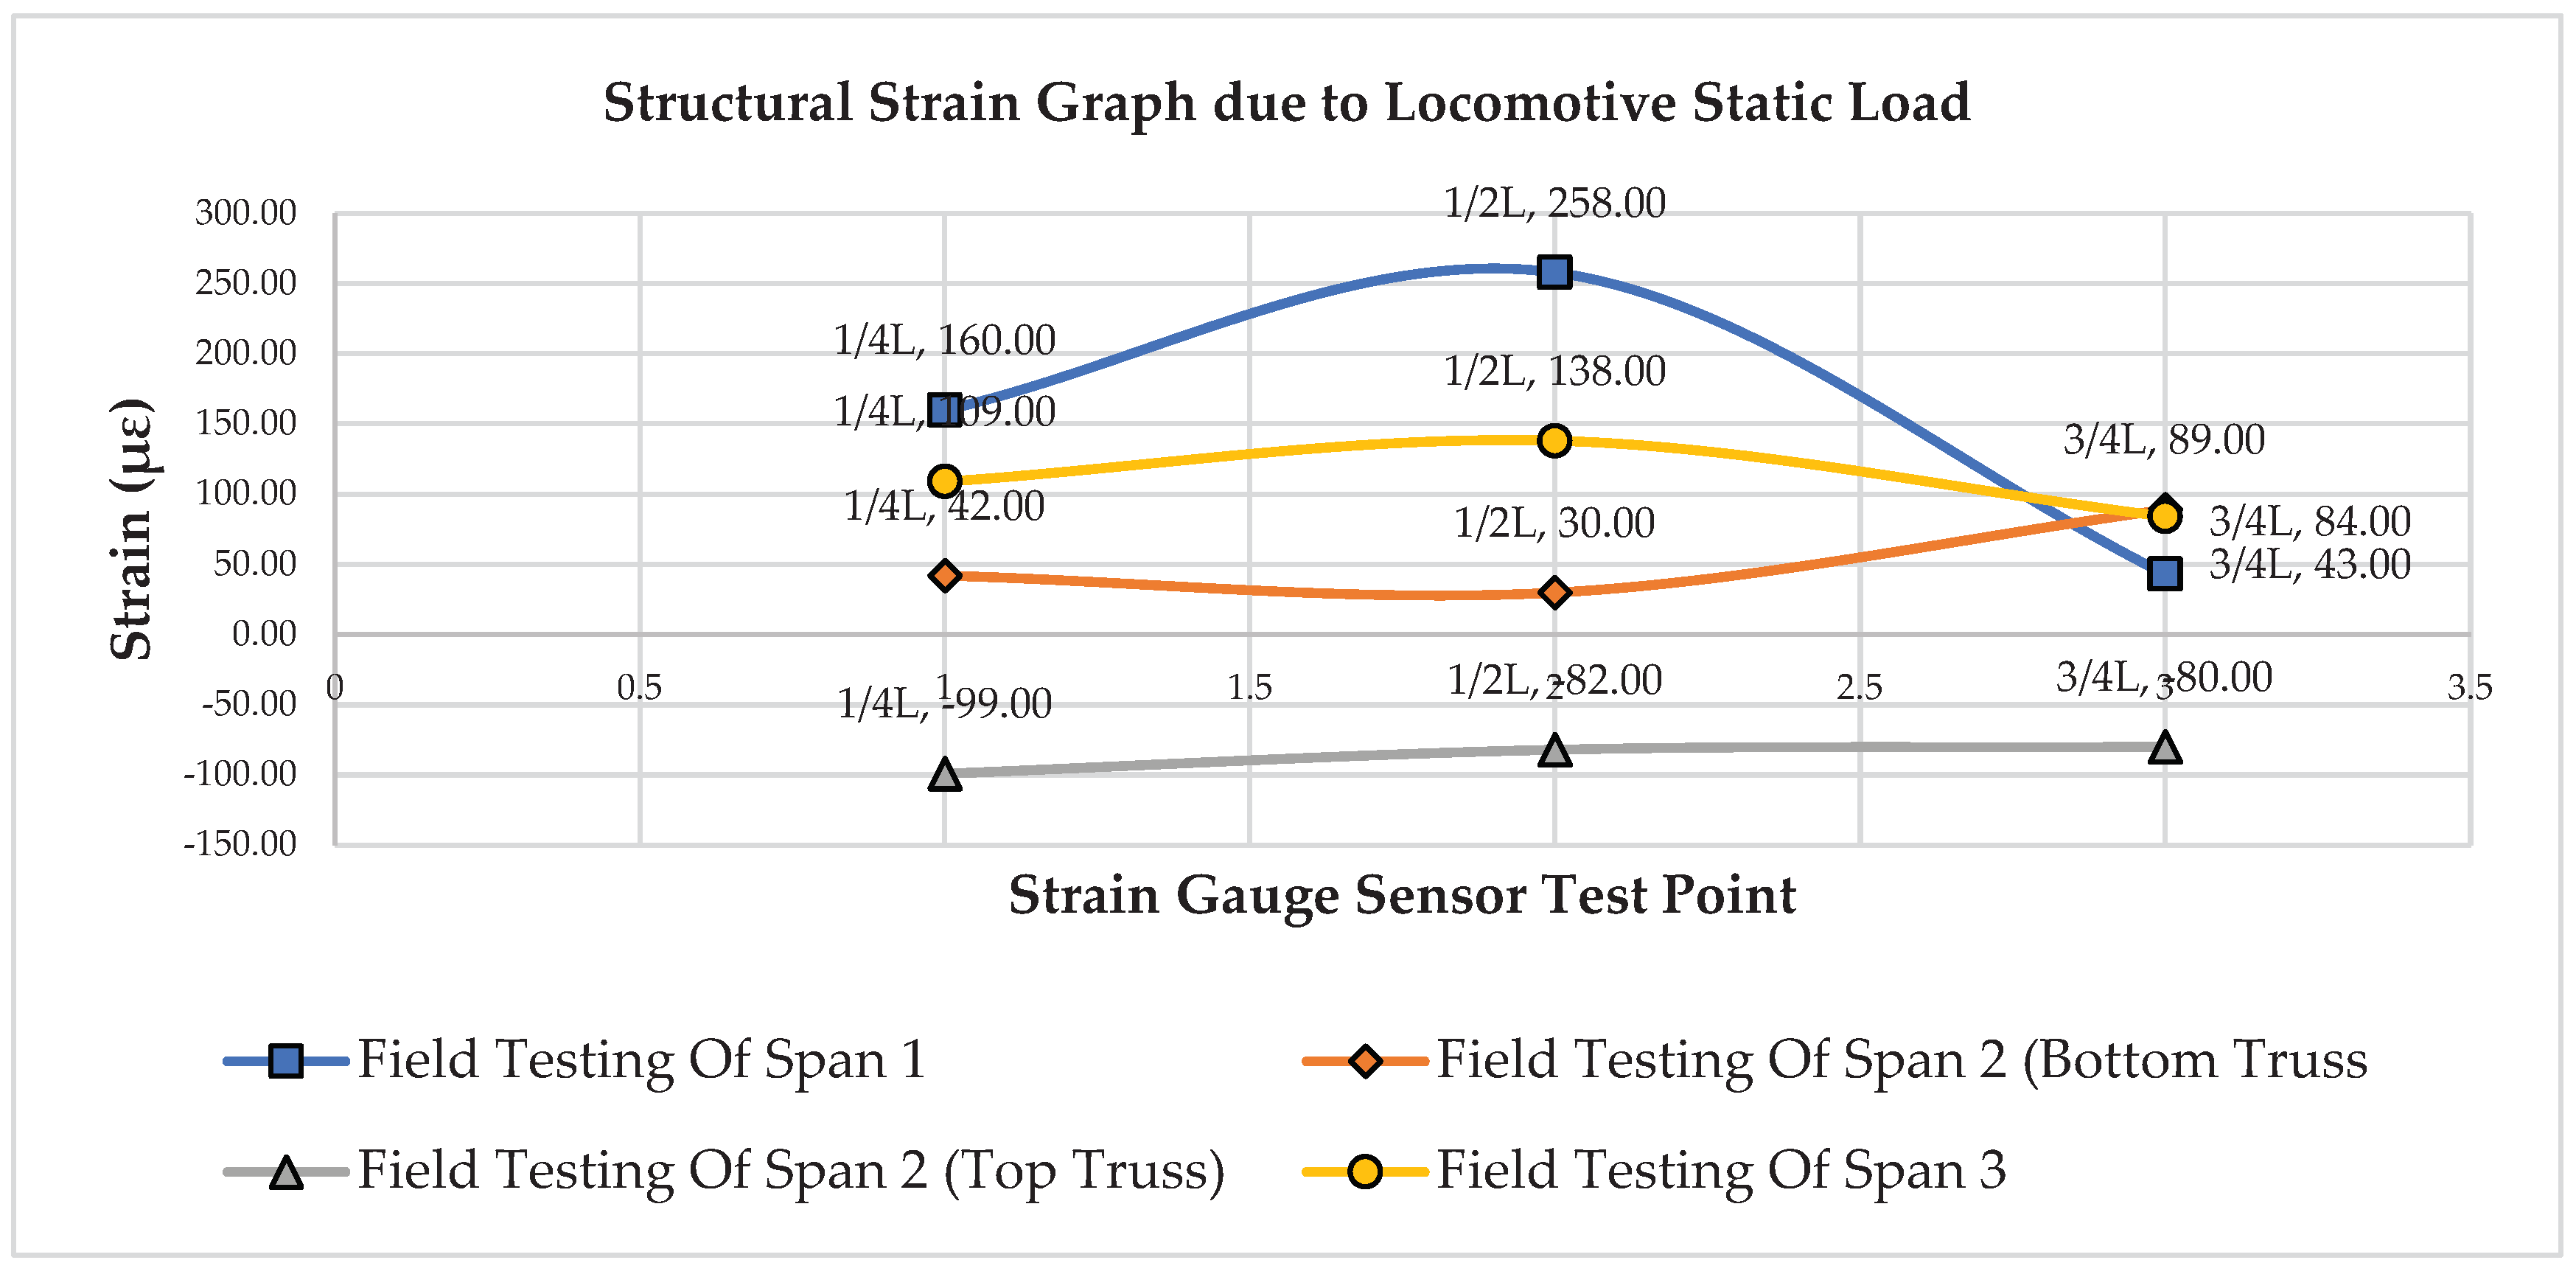
The strain measurement of the bridge structure is carried out by installing a strain gauge sensor at 1/4L, 1/2L, and 3/4L on each bridge girder. The results of strain measurements using strain gauge sensors on the bridge structure are depicted in
Figure 14. A negative (-) reading indicates that the bridge structure is in compression, while a positive (+) reading indicates that the bridge structure is in tension.
Figure 14 illustrates the graph of the strain measurement results of the bridge girder structure due to the static loading of locomotives on span-1, span-2, and span-3. In the span-1 girder structure, measurements were taken at 1/4L, 1/2L, and 3/4L, with strain values of 160.00 με, 258.00 με, and 43.00 με, respectively. For the span-2 girder structure of the lower frame, measurements were taken at 1/4L, 1/2L, and 3/4L, resulting in strain values of 42.00 με, 30.00 με, and 89.00 με, respectively. In the span-2 truss structure, measurements were taken at 1/4L, 1/2L, and 3/4L, with strain values of -99.00 με, -82.00 με, and 80.00 με, respectively. For the span-3 girder structure, measurements were taken at 1/4L, 1/2L, and 3/4L, and strain values were obtained at 1/4L of 109.00 με, 1/2L of 138.00 με, and 3/4L of 84.00 με.
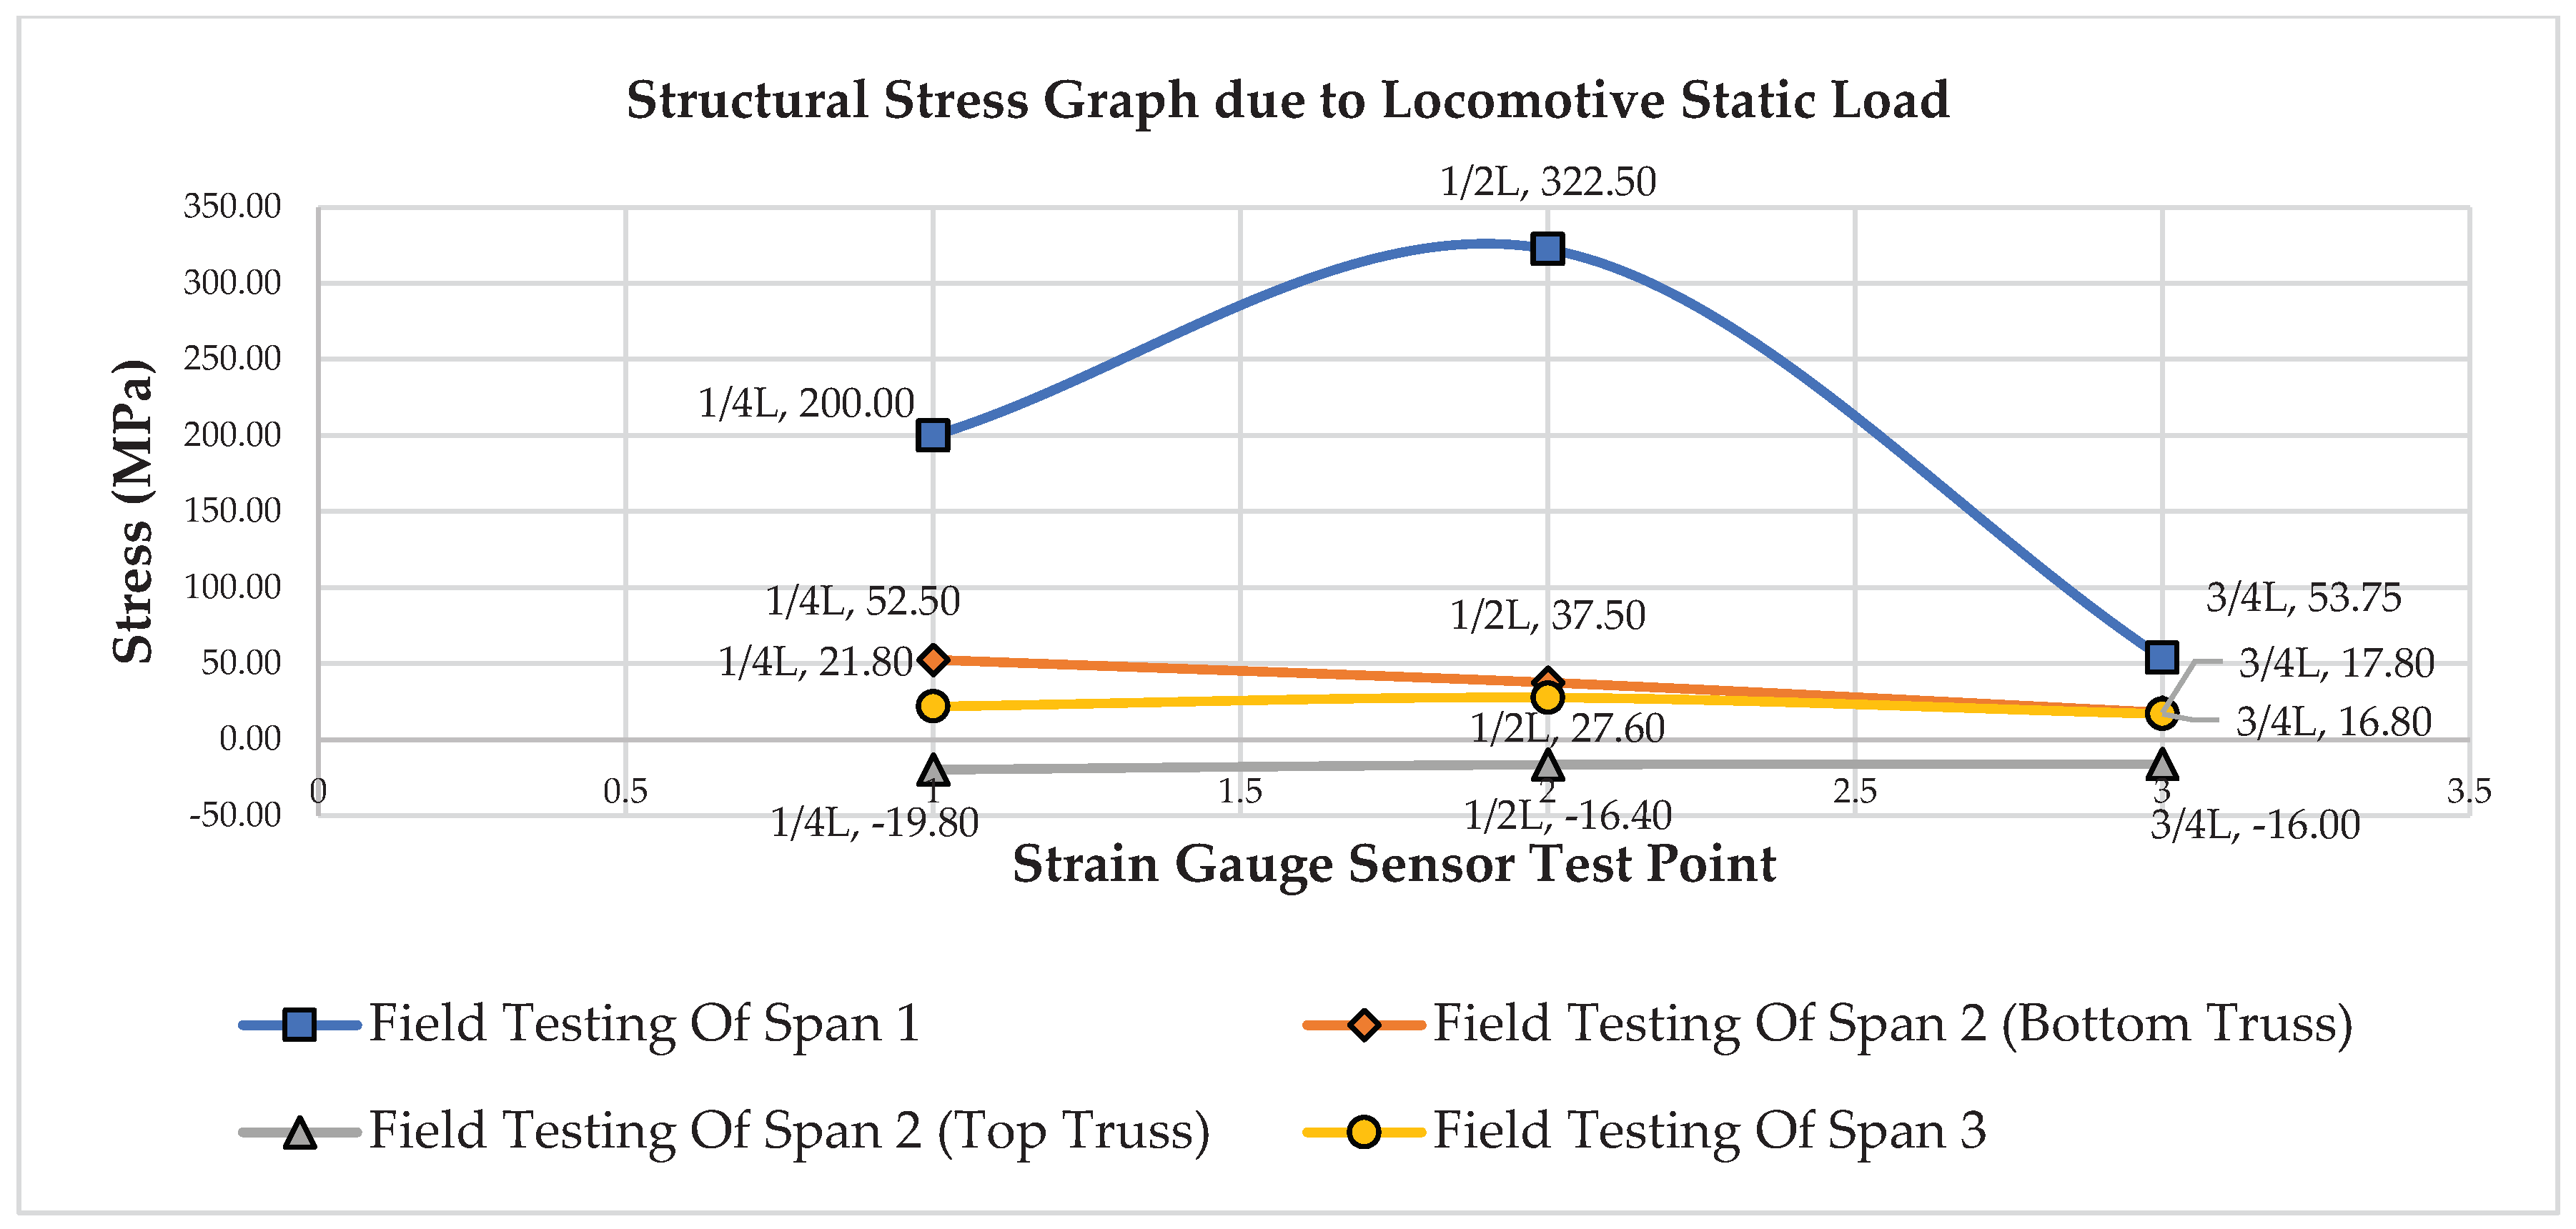
Figure 15 illustrates the graph of the stress measurement results of the bridge girder structure under the static locomotive load on span -1, span-2, and span-3. In the span-1 girder structure, the stress values at 1/4L are 200.00 MPa, at 1/2L are 322.50 MPa, and at 3/4L are 53.75 MPa. For the span-2 truss structure of the bottom frame, the stress values at 1/4L are 52.50 MPa, at 1/2L are 37.50 MPa, and at 3/4L are 17.80 MPa. In the span-2 truss structure of the top frame, the stress values at 1/4L are -19.80 MPa, at 1/2L are -16.40 MPa, and at 3/4L are -16.00 MPa. For the span-3 girder structure, the stress values at 1/4L are 21.80 MPa, at 1/2L are 27.60 MPa, and at 3/4L are 16.80 MPa. Overall, the stress values are still below the capacity of f
y = 349 MPa.
3.3. Dynamic Load Test Result
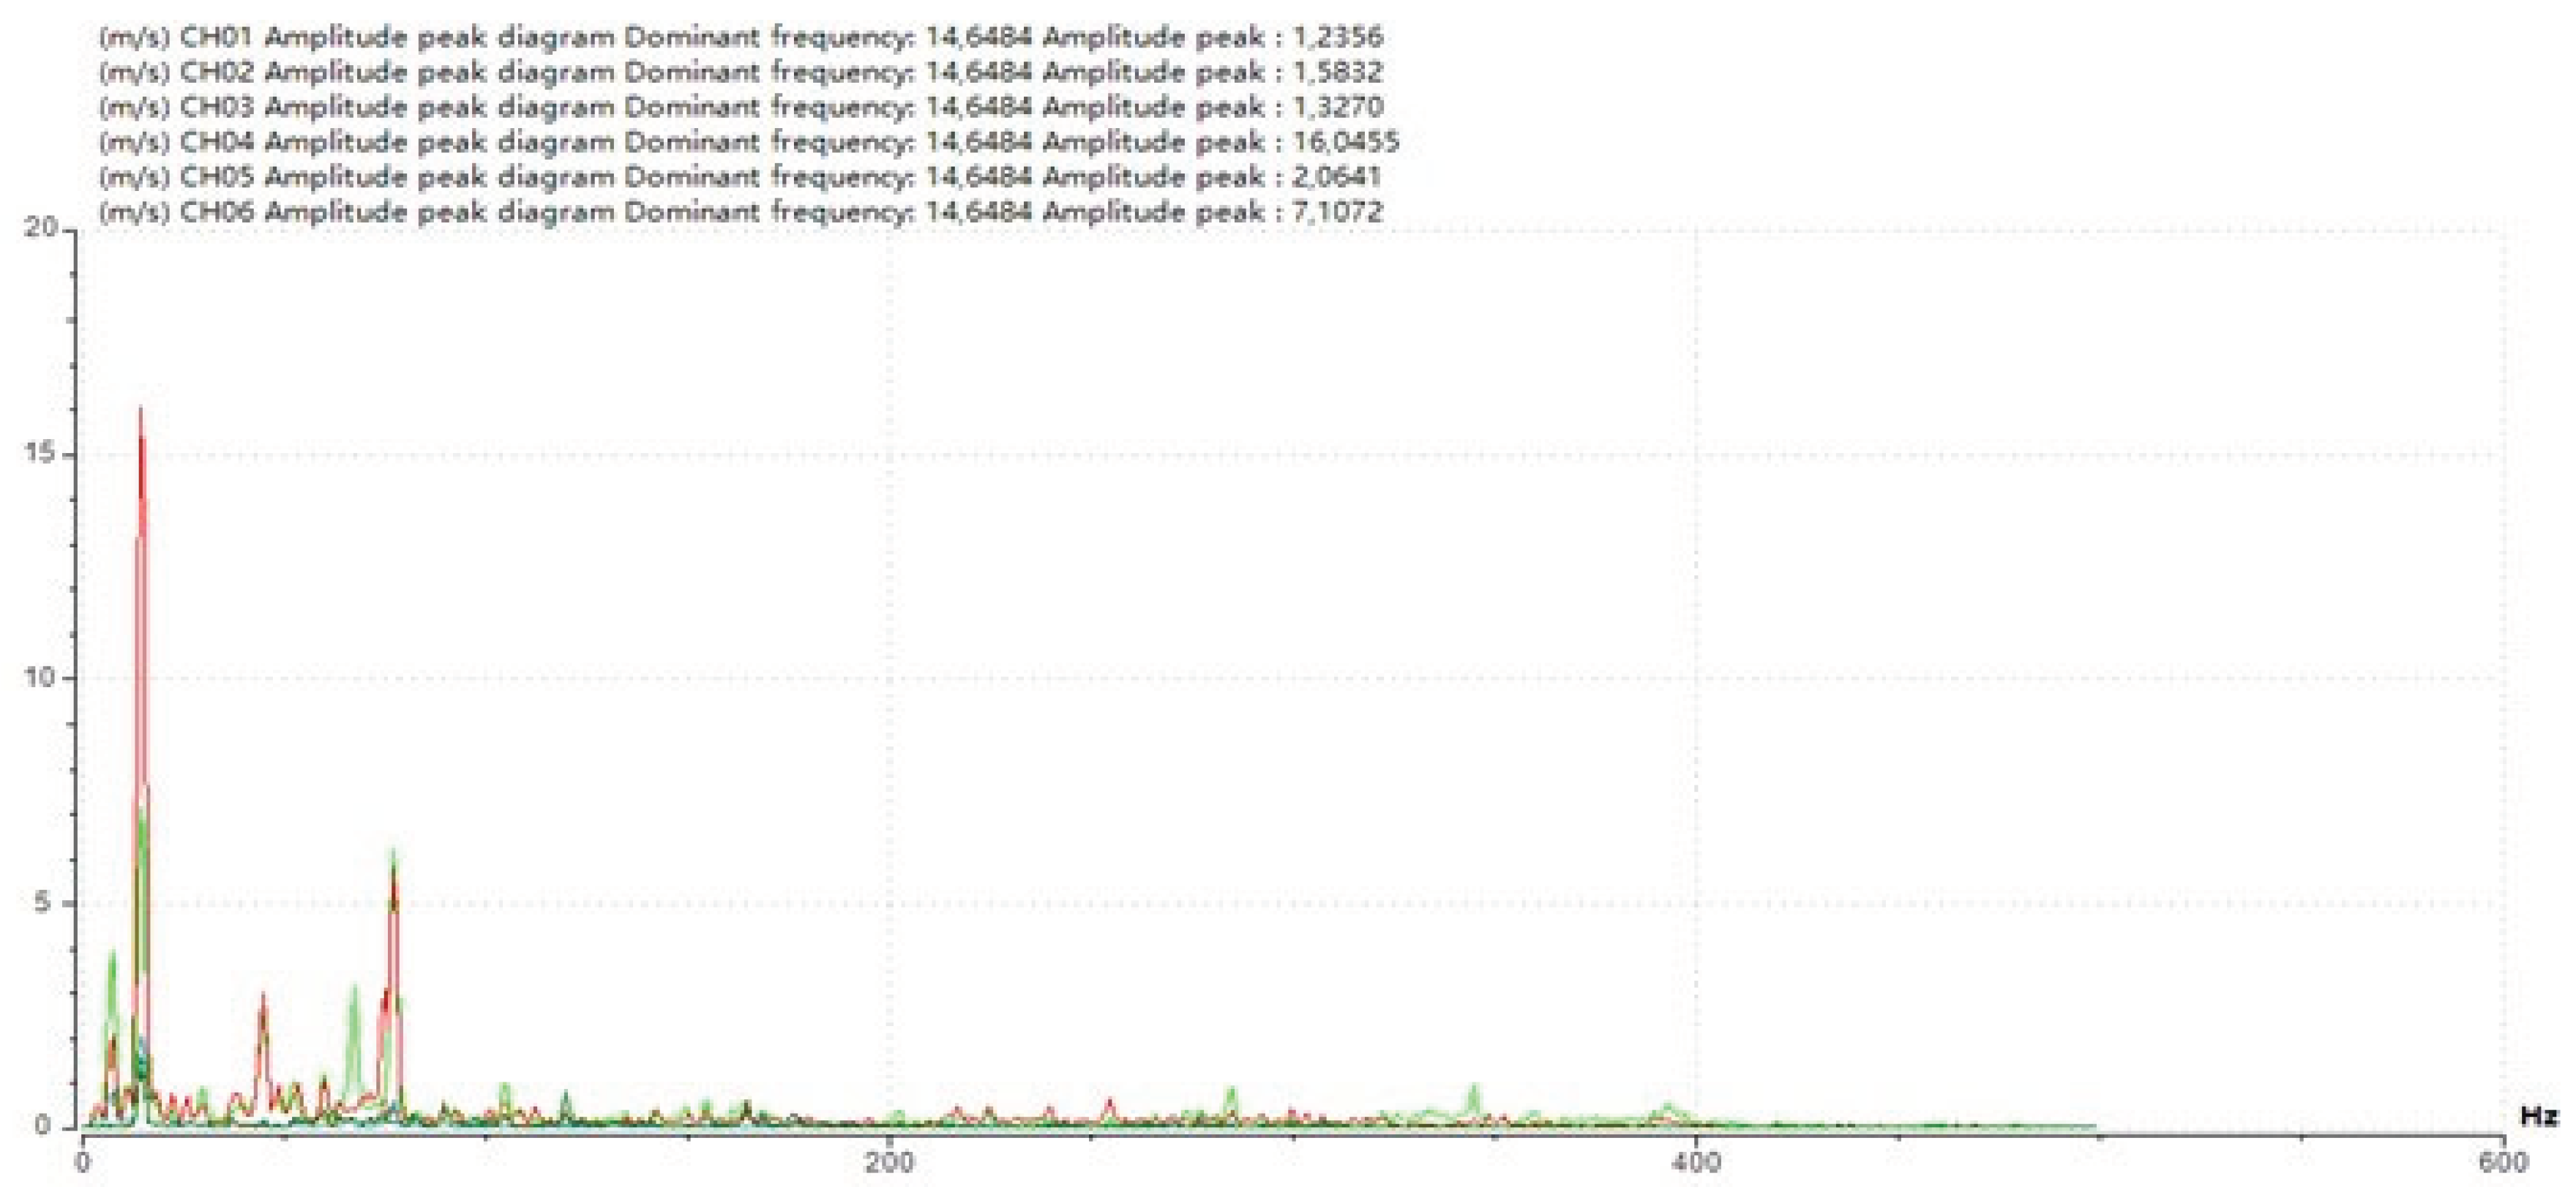
Dynamic testing of bridge structures was conducted by installing accelerometer sensors to measure the dominant vertical frequency occurring in the girder when a load, in the form of a CC206 locomotive, was applied. The sensors were placed at 1/4L, 1/2L, and 3/4L of the upper structure girders of span-1 and span-2 of the bridge. The dynamic test results for the bridge superstructure beam are presented in
Figure 16.
Figure 16 displays the results of the dominant frequency from the dynamic test of the top structure girder of the bridge, where the CC206 locomotive load is applied. The accelerometer sensor readings for the bridge girder structure in span-1 show the dominant frequency in the vertical direction (z) at 1/4L (CH01) of 14.65 Hz, at 1/2L (CH02) of 14.65 Hz, and at 3/4L (CH03) of 14.65 Hz. Similarly, in the bridge girder structure of span-2, the dominant frequency in the vertical direction (z) at 1/4L (CH04) is 14.65 Hz, at 1/2L (CH05) is 14.65 Hz, and at 3/4L (CH06) is 14.65 Hz.
3.4. Bridge Strengthening by External Prestressing Method
On the BH 25 bridge, temporary reinforcement was implemented by installing 2 supports on span-2 for the safety of the bridge, as there were indications of a -8.0 mm decrease in the bridge structure, which should have had a camber height of +300 mm. One of the efforts to enhance the serviceability and capacity of the bridge is to apply bridge reinforcement using the external prestressing method. The principle of applying external prestressing to a steel frame is to provide a force that reduces the tensile stress in the bridge truss by using cables or steel bars placed on the outside of the bridge structure.
In structural modeling, restoring the target camber of +300 mm to the entire structural element leads to overstressing, making it an impractical option. Therefore, in modeling the structure to achieve the opposite deflection (camber), it is adjusted to the actual deflection results of the structure due to the combination of service loads acting on the bridge, with a prestressing force of 180 tons, considering an initial loss of 10% [
10]. The required prestressing force is then calculated as 10% x 180 tons = 198 tons. The tendon area is determined using the following equation.
Table 7.
Modeling Criteria for Bridge Structure Reinforcement.
Table 7.
Modeling Criteria for Bridge Structure Reinforcement.
| Tendon Diameter |
43.575 mm |
| Tendon Area |
1491.334 mm2
|
| Strand Type |
7 wire strand |
| Dimensions of Deviator Profile |
H 200.200.8.12 |
| Prestressing Force |
198 tons |
Table 8.
Deflection Comparison of Bridge Structures.
Table 8.
Deflection Comparison of Bridge Structures.
| Description |
Load Combination |
Deflection Structure (mm) |
| 1/2L |
| Field Testing |
1,0 D + 1,0 SD + 1,0 LL |
-11.30 |
| External Prestressing Reinforcement |
1,0 D + 1,0 SD + 1,0 PR |
11.82 |
| 1,0 D + 1,0 SD + 1,0 LL + 1,0 PR |
-3.38 |
The initial stress (SNI 2847-2019)
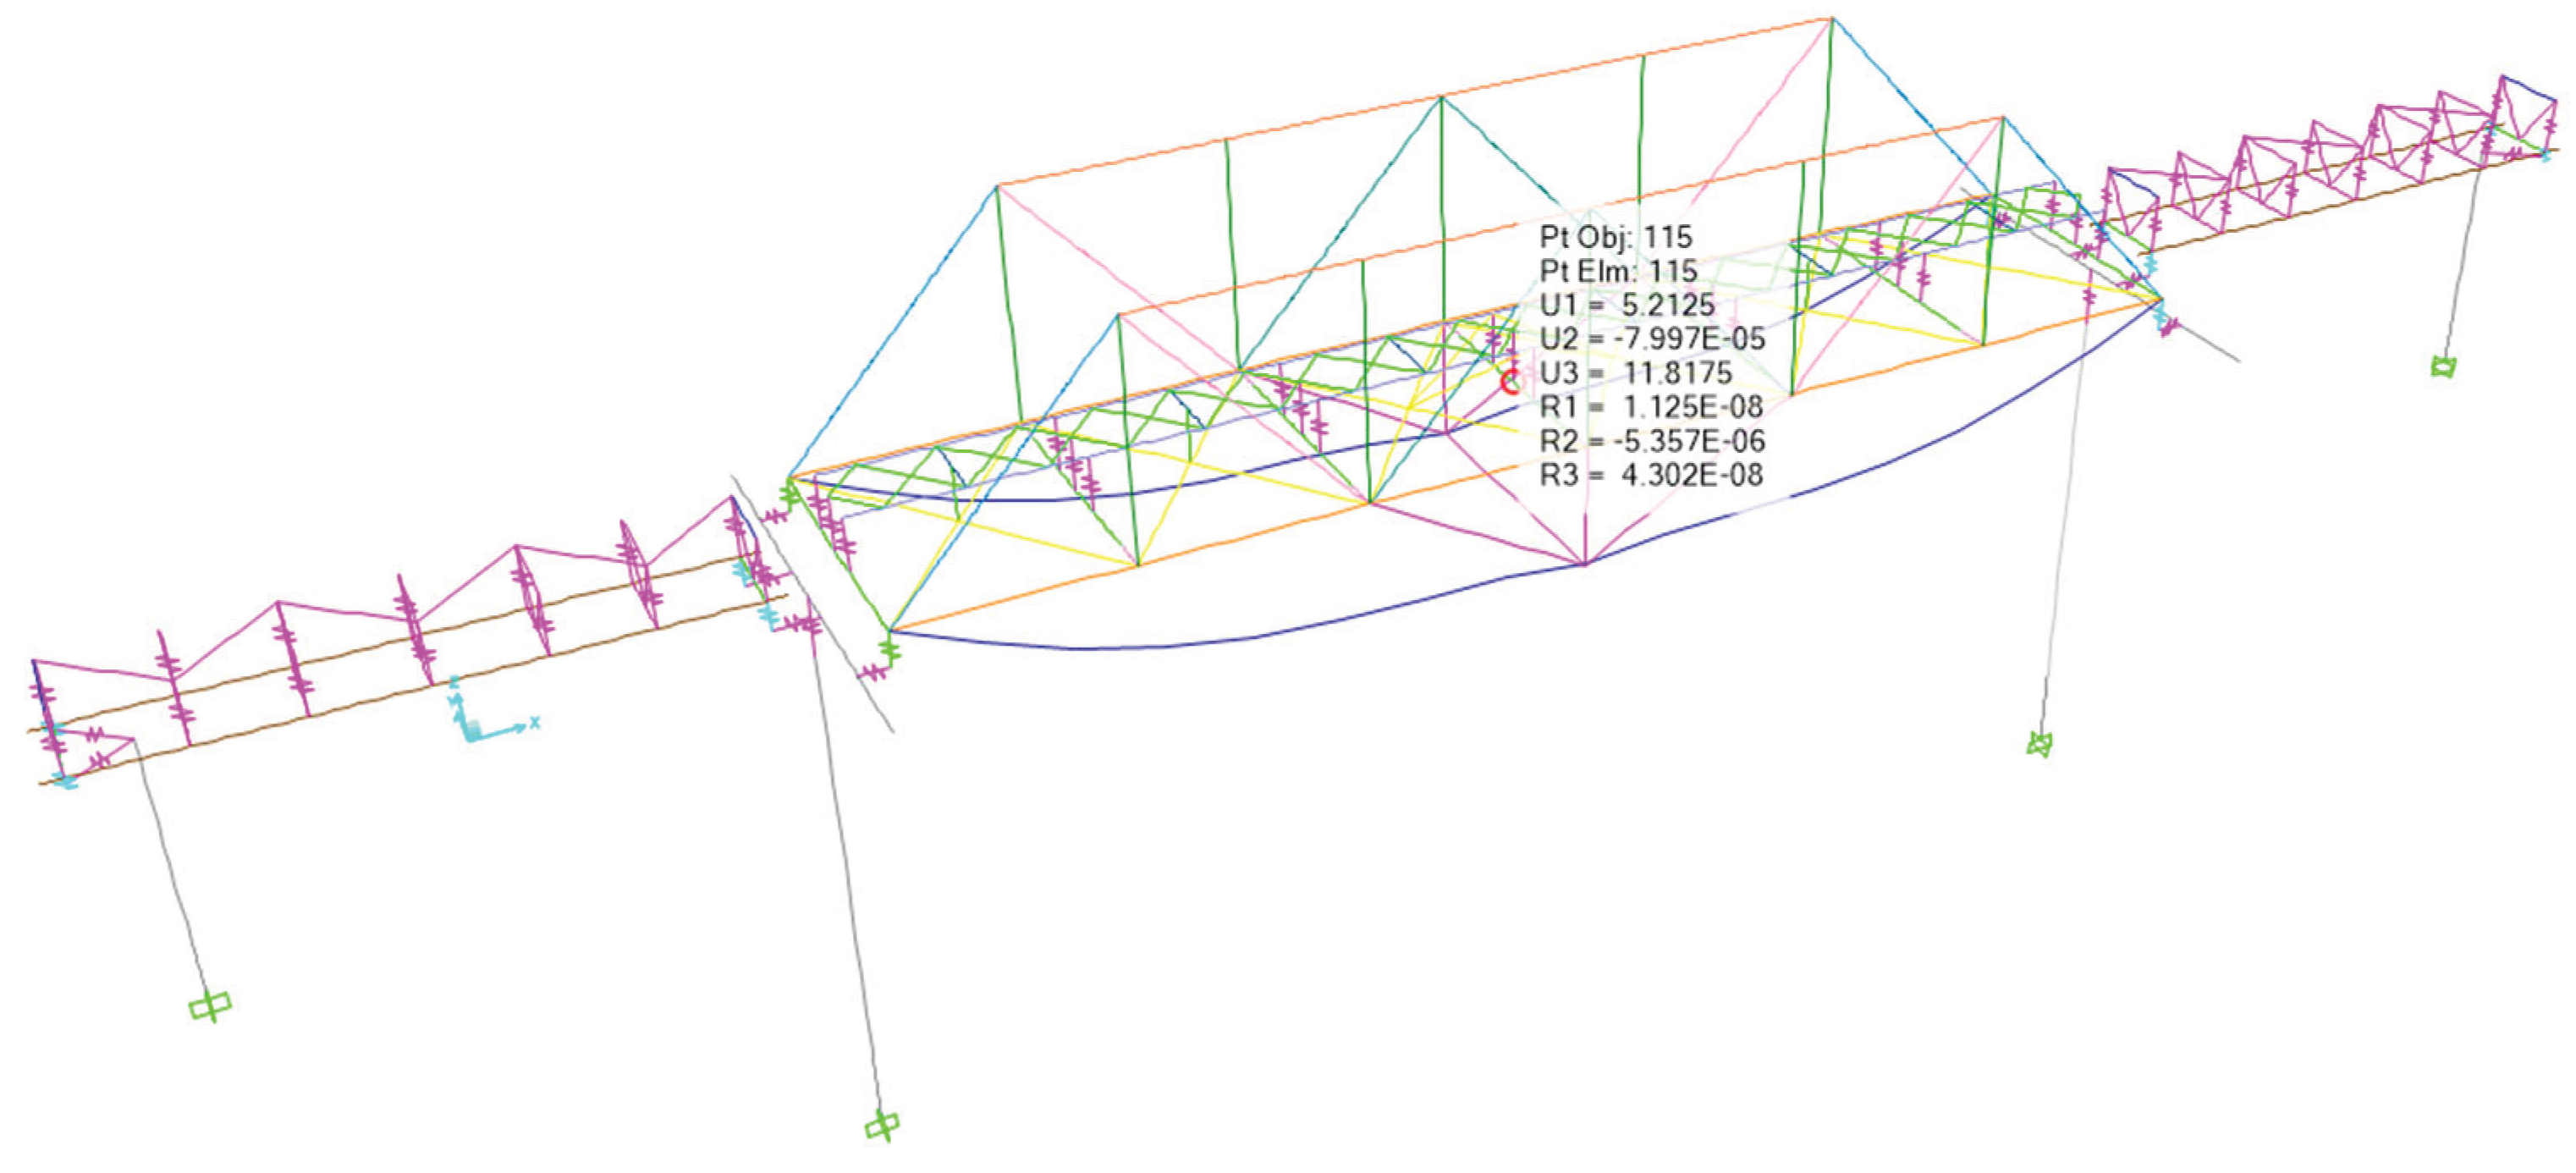
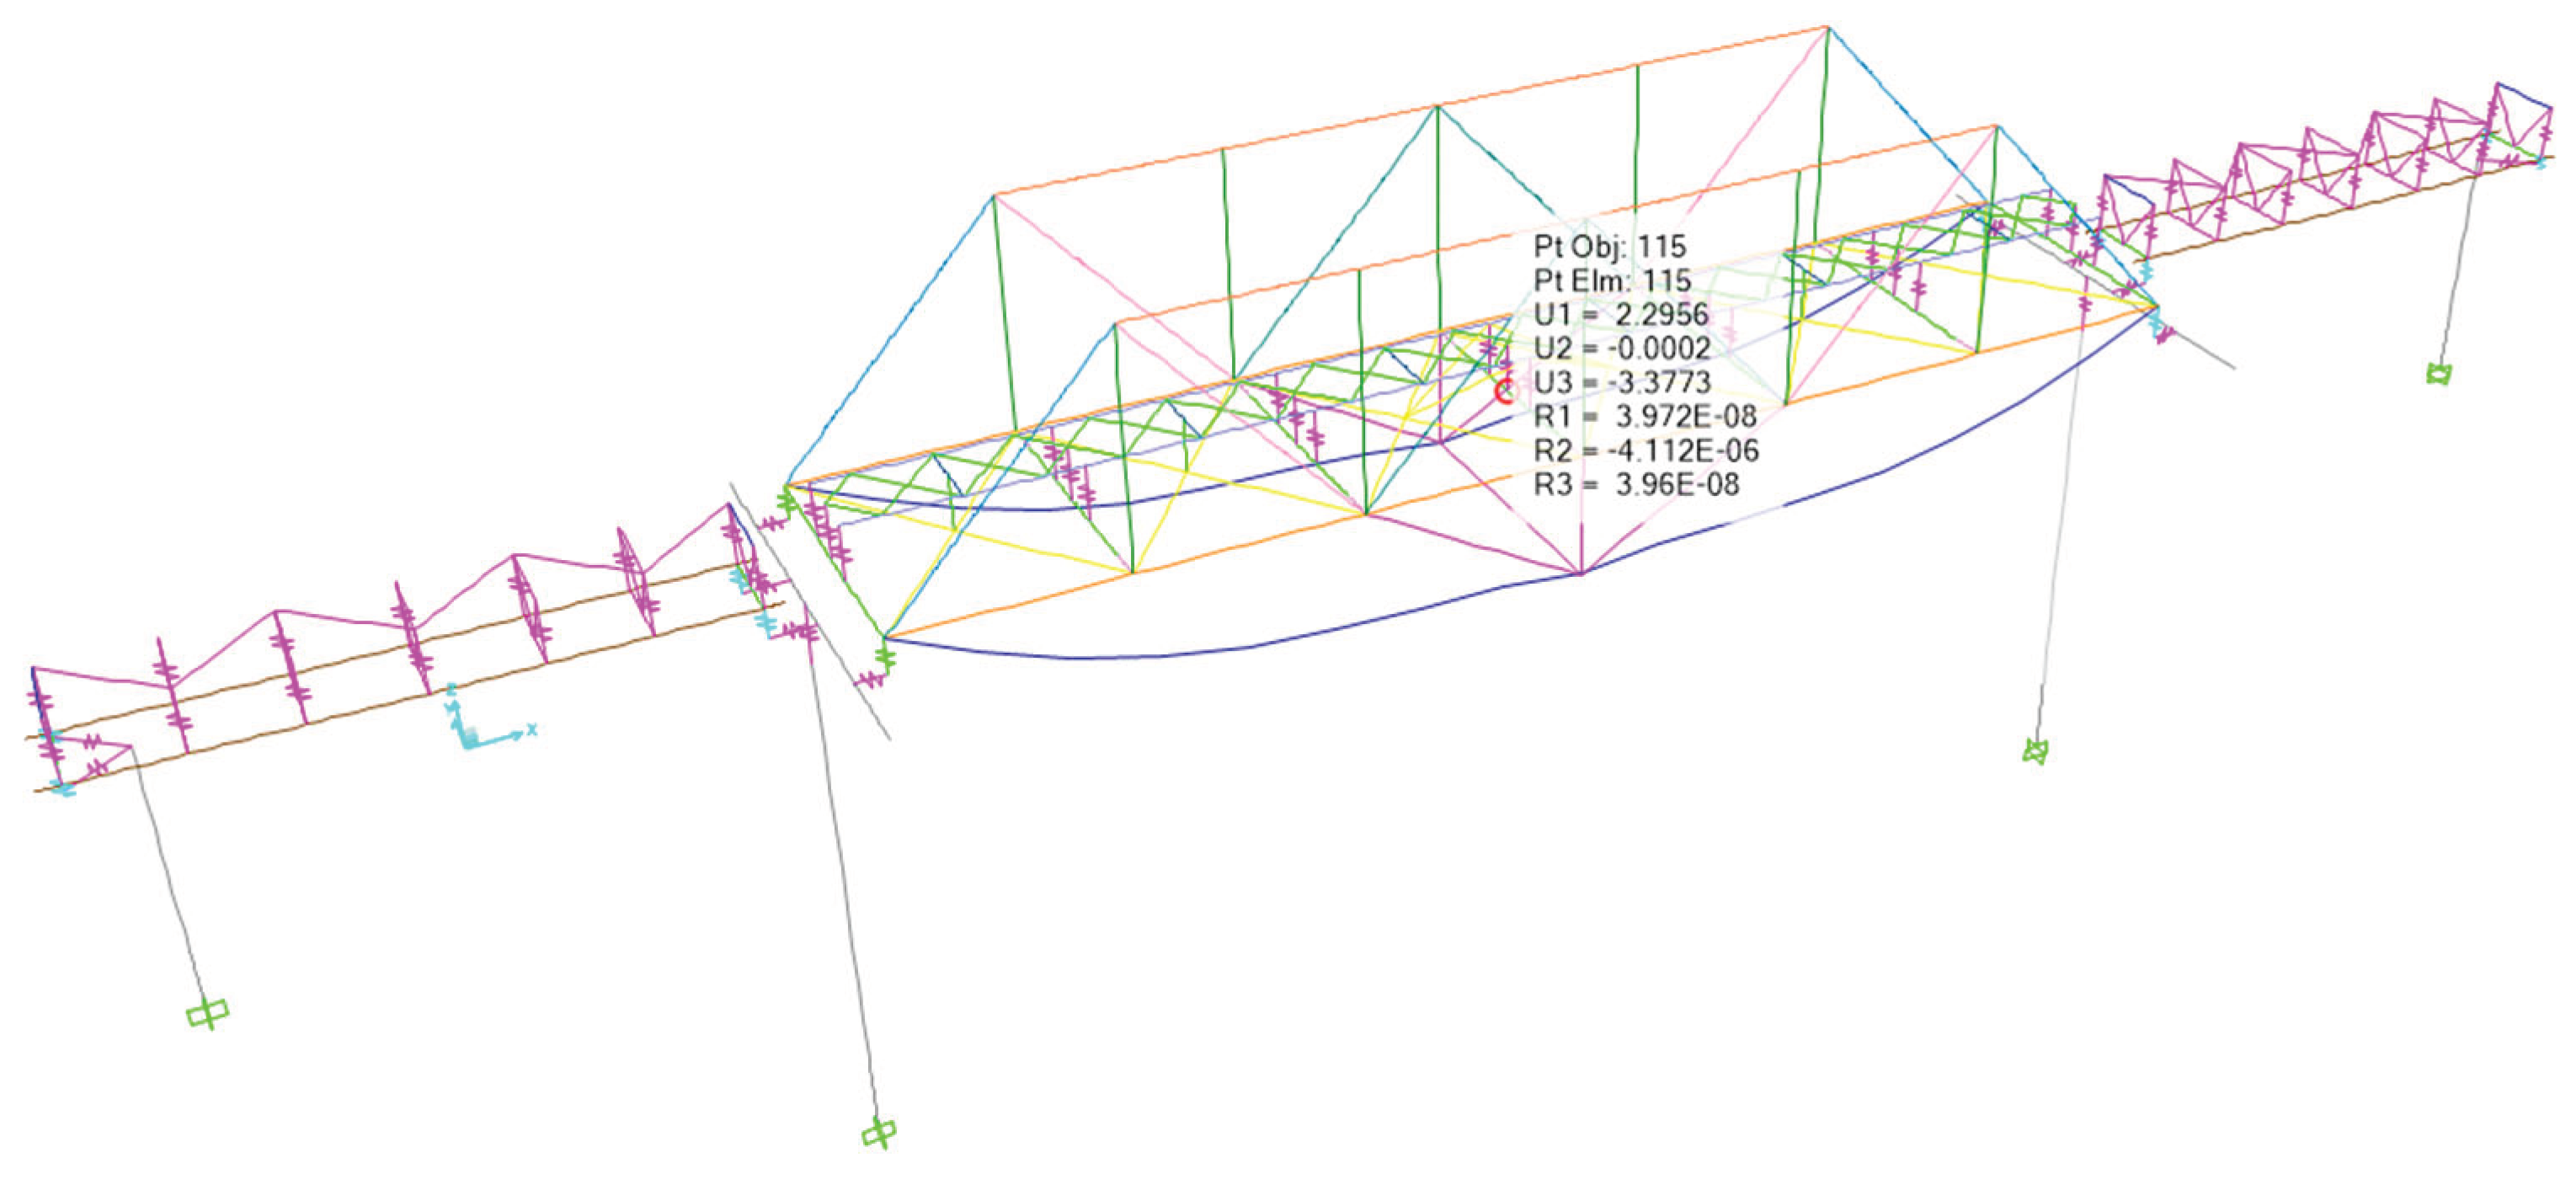
The external prestressing method applied to span-2 of the bridge can reduce the deflection of the existing bridge structure at 1/2L by 70.08%, equivalent to 7.92 mm, under the influence of the service load applied to the bridge.
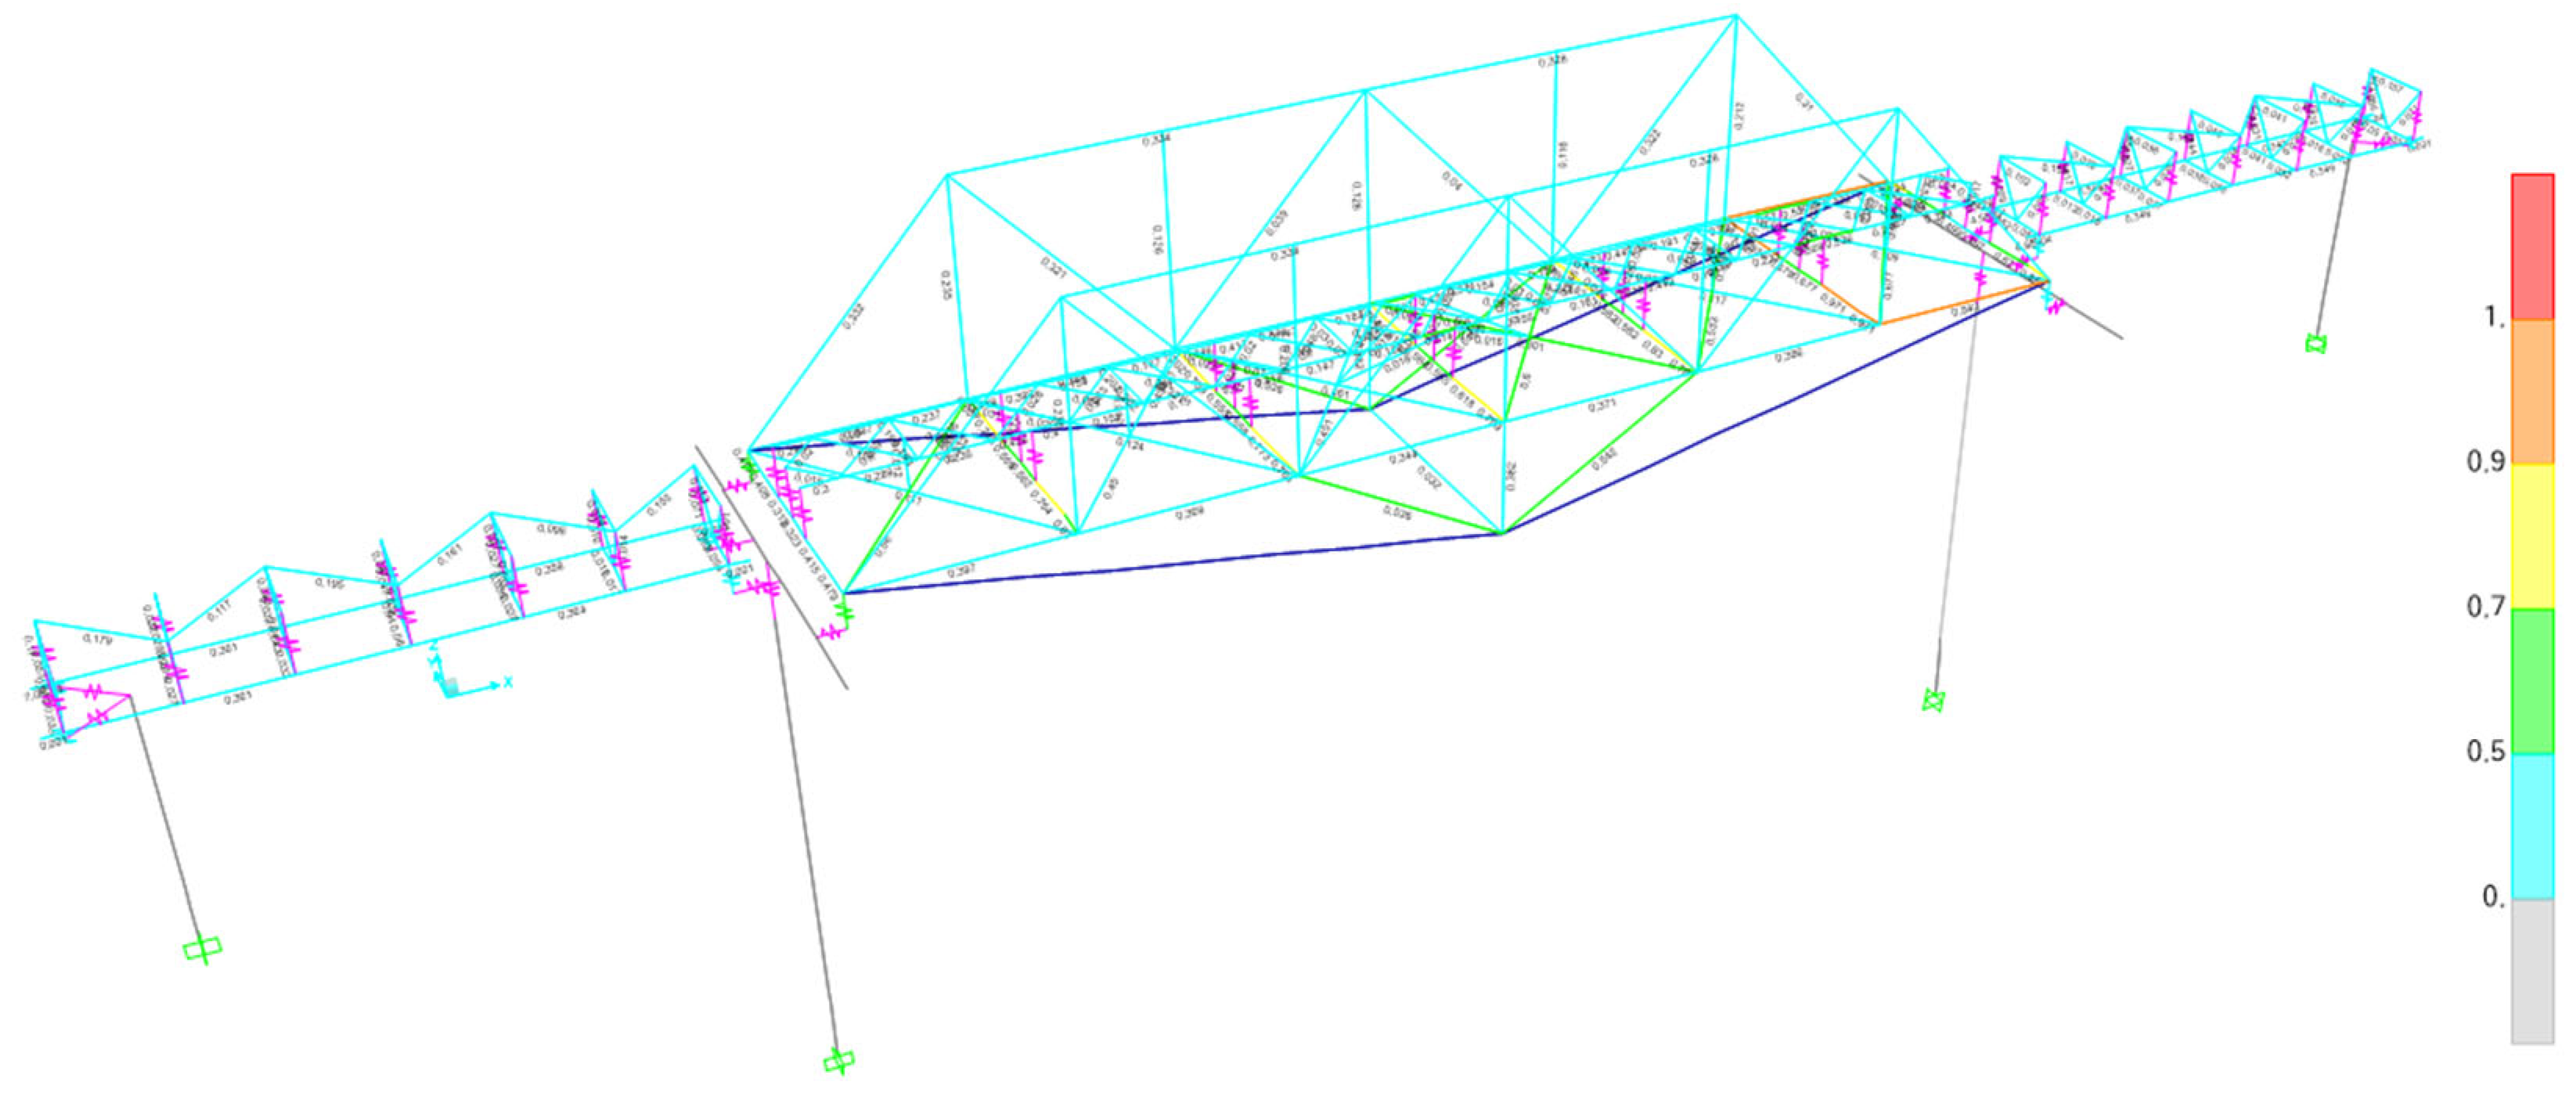
The capacity ratio values for several structural elements of the span-2 bridge do not meet the safety criteria, as determined by comparing the ultimate internal force resulting from a combination of maximum loads with the factored nominal strength of each element. Consequently, to enhance the structural members of span-2 of the bridge, 10 to 15 mm plates are added to the flange of the structural members. The capacity ratio resulting from the combination of maximum loads on the bridge members, to which plates were added, is presented in
Table 9.
Figure 18.
Deflection of Bridge Structure at 1/2L after External Prestressing Due to Load Combination of 1,0 D + 1,0 SD + 1,0 PR.
Figure 18.
Deflection of Bridge Structure at 1/2L after External Prestressing Due to Load Combination of 1,0 D + 1,0 SD + 1,0 PR.
Figure 19.
Deflection of Bridge Structure at 1/2L after External Prestressing Due to Load Combination of 1,0 D + 1,0 SD + 1,0 LL + 1,0 PR.
Figure 19.
Deflection of Bridge Structure at 1/2L after External Prestressing Due to Load Combination of 1,0 D + 1,0 SD + 1,0 LL + 1,0 PR.
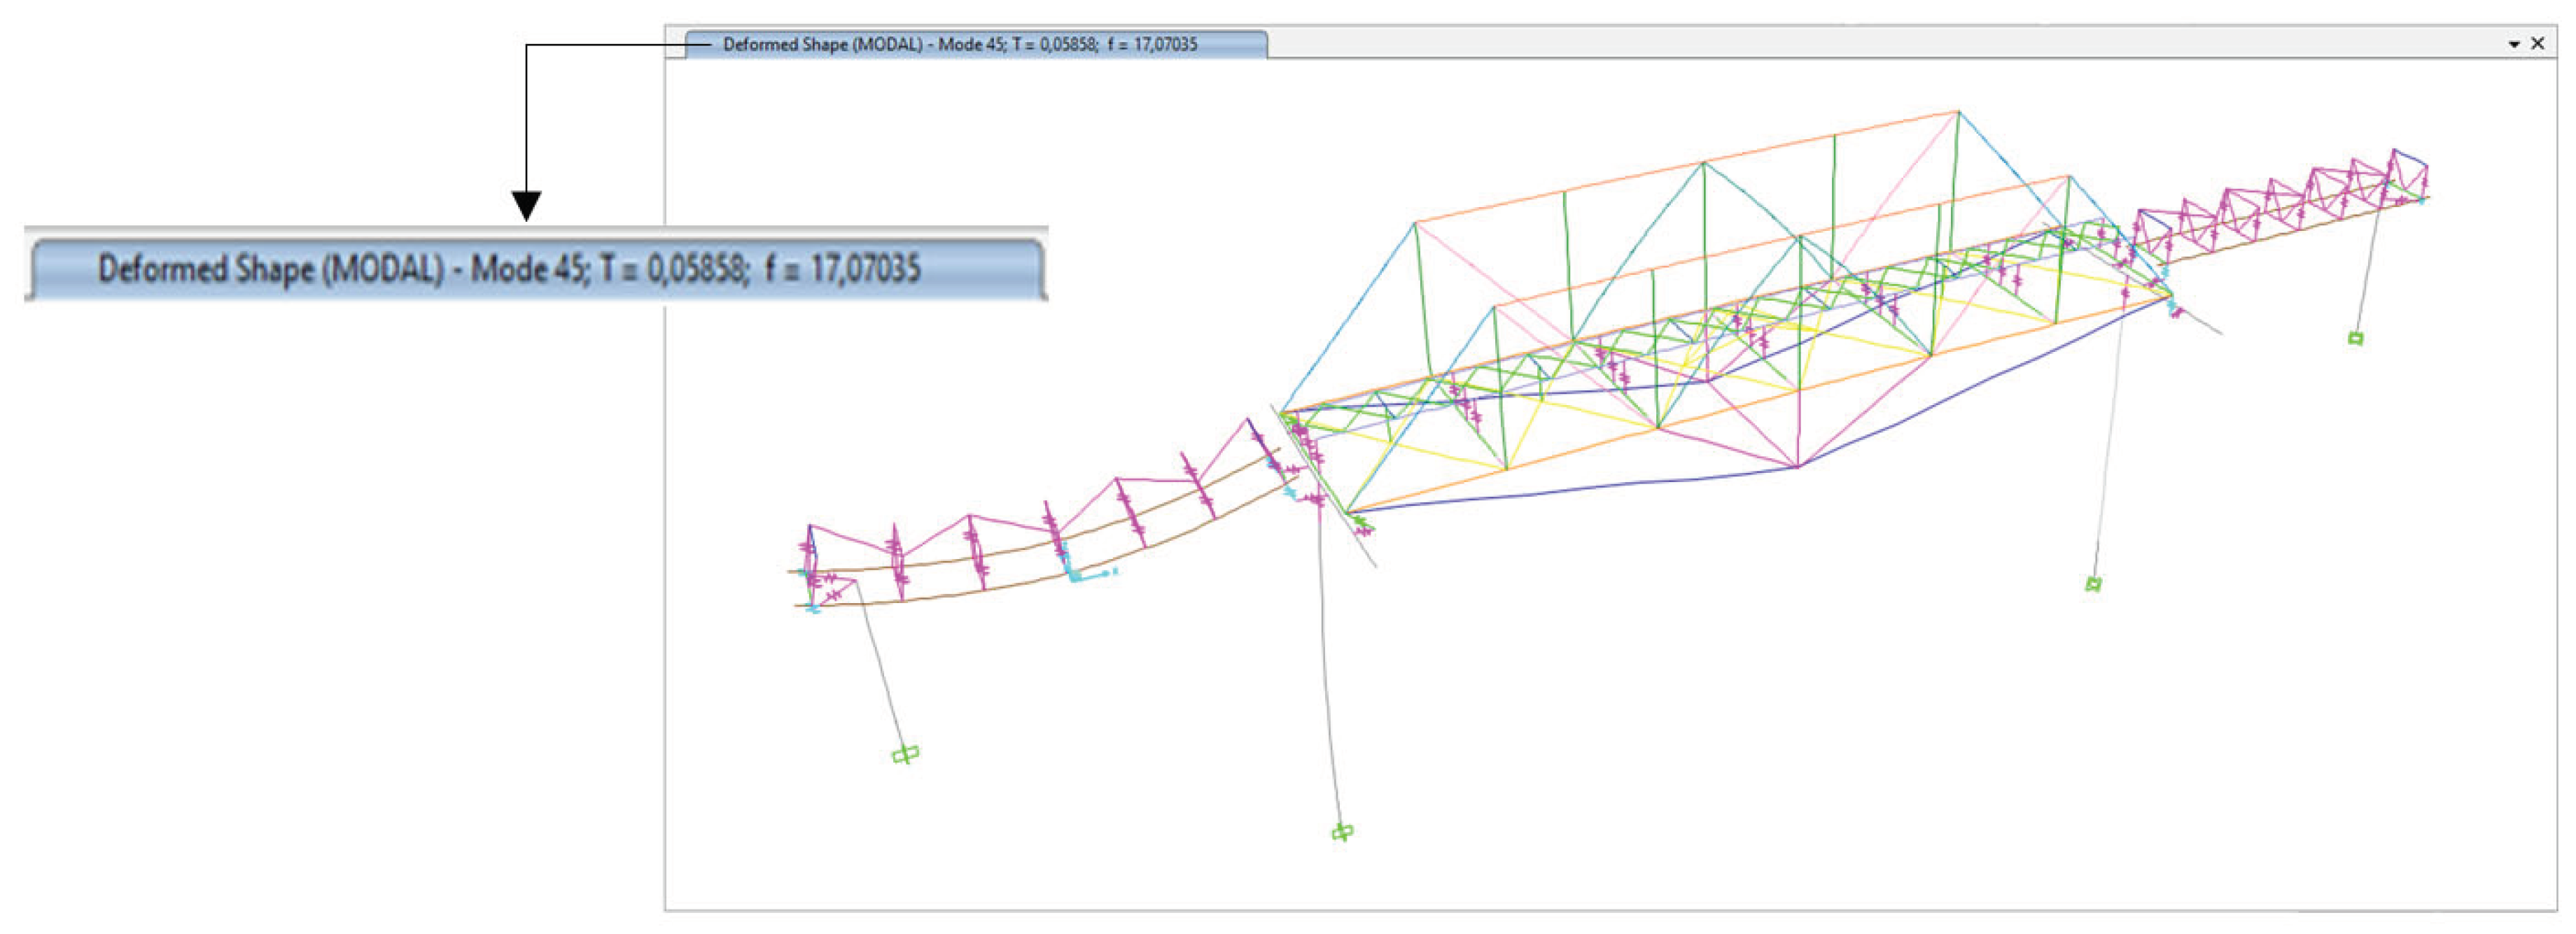
Figure 20.
Dominant Frequency of Vertical (z) Mode 45 Bridge Structure at 17.07 Hz after External Prestressing and Plate Reinforcement.
Figure 20.
Dominant Frequency of Vertical (z) Mode 45 Bridge Structure at 17.07 Hz after External Prestressing and Plate Reinforcement.
Figure 21.
Capacity Ratio of Bridge Elements after External Prestressing and Plate Reinforcement.
Figure 21.
Capacity Ratio of Bridge Elements after External Prestressing and Plate Reinforcement.
4. Discussions
4.1. Bridge Camber Reduction
On the bridge, temporary reinforcement was implemented by installing two supports on span-2 to ensure the safety of the structure. There is evidence of a -8.0 mm drop in the bridge, which should originally have a camber height of +300 mm. Camber is added to counteract the deflection caused by the working load. Changes in camber values can indicate alterations in bridge performance.
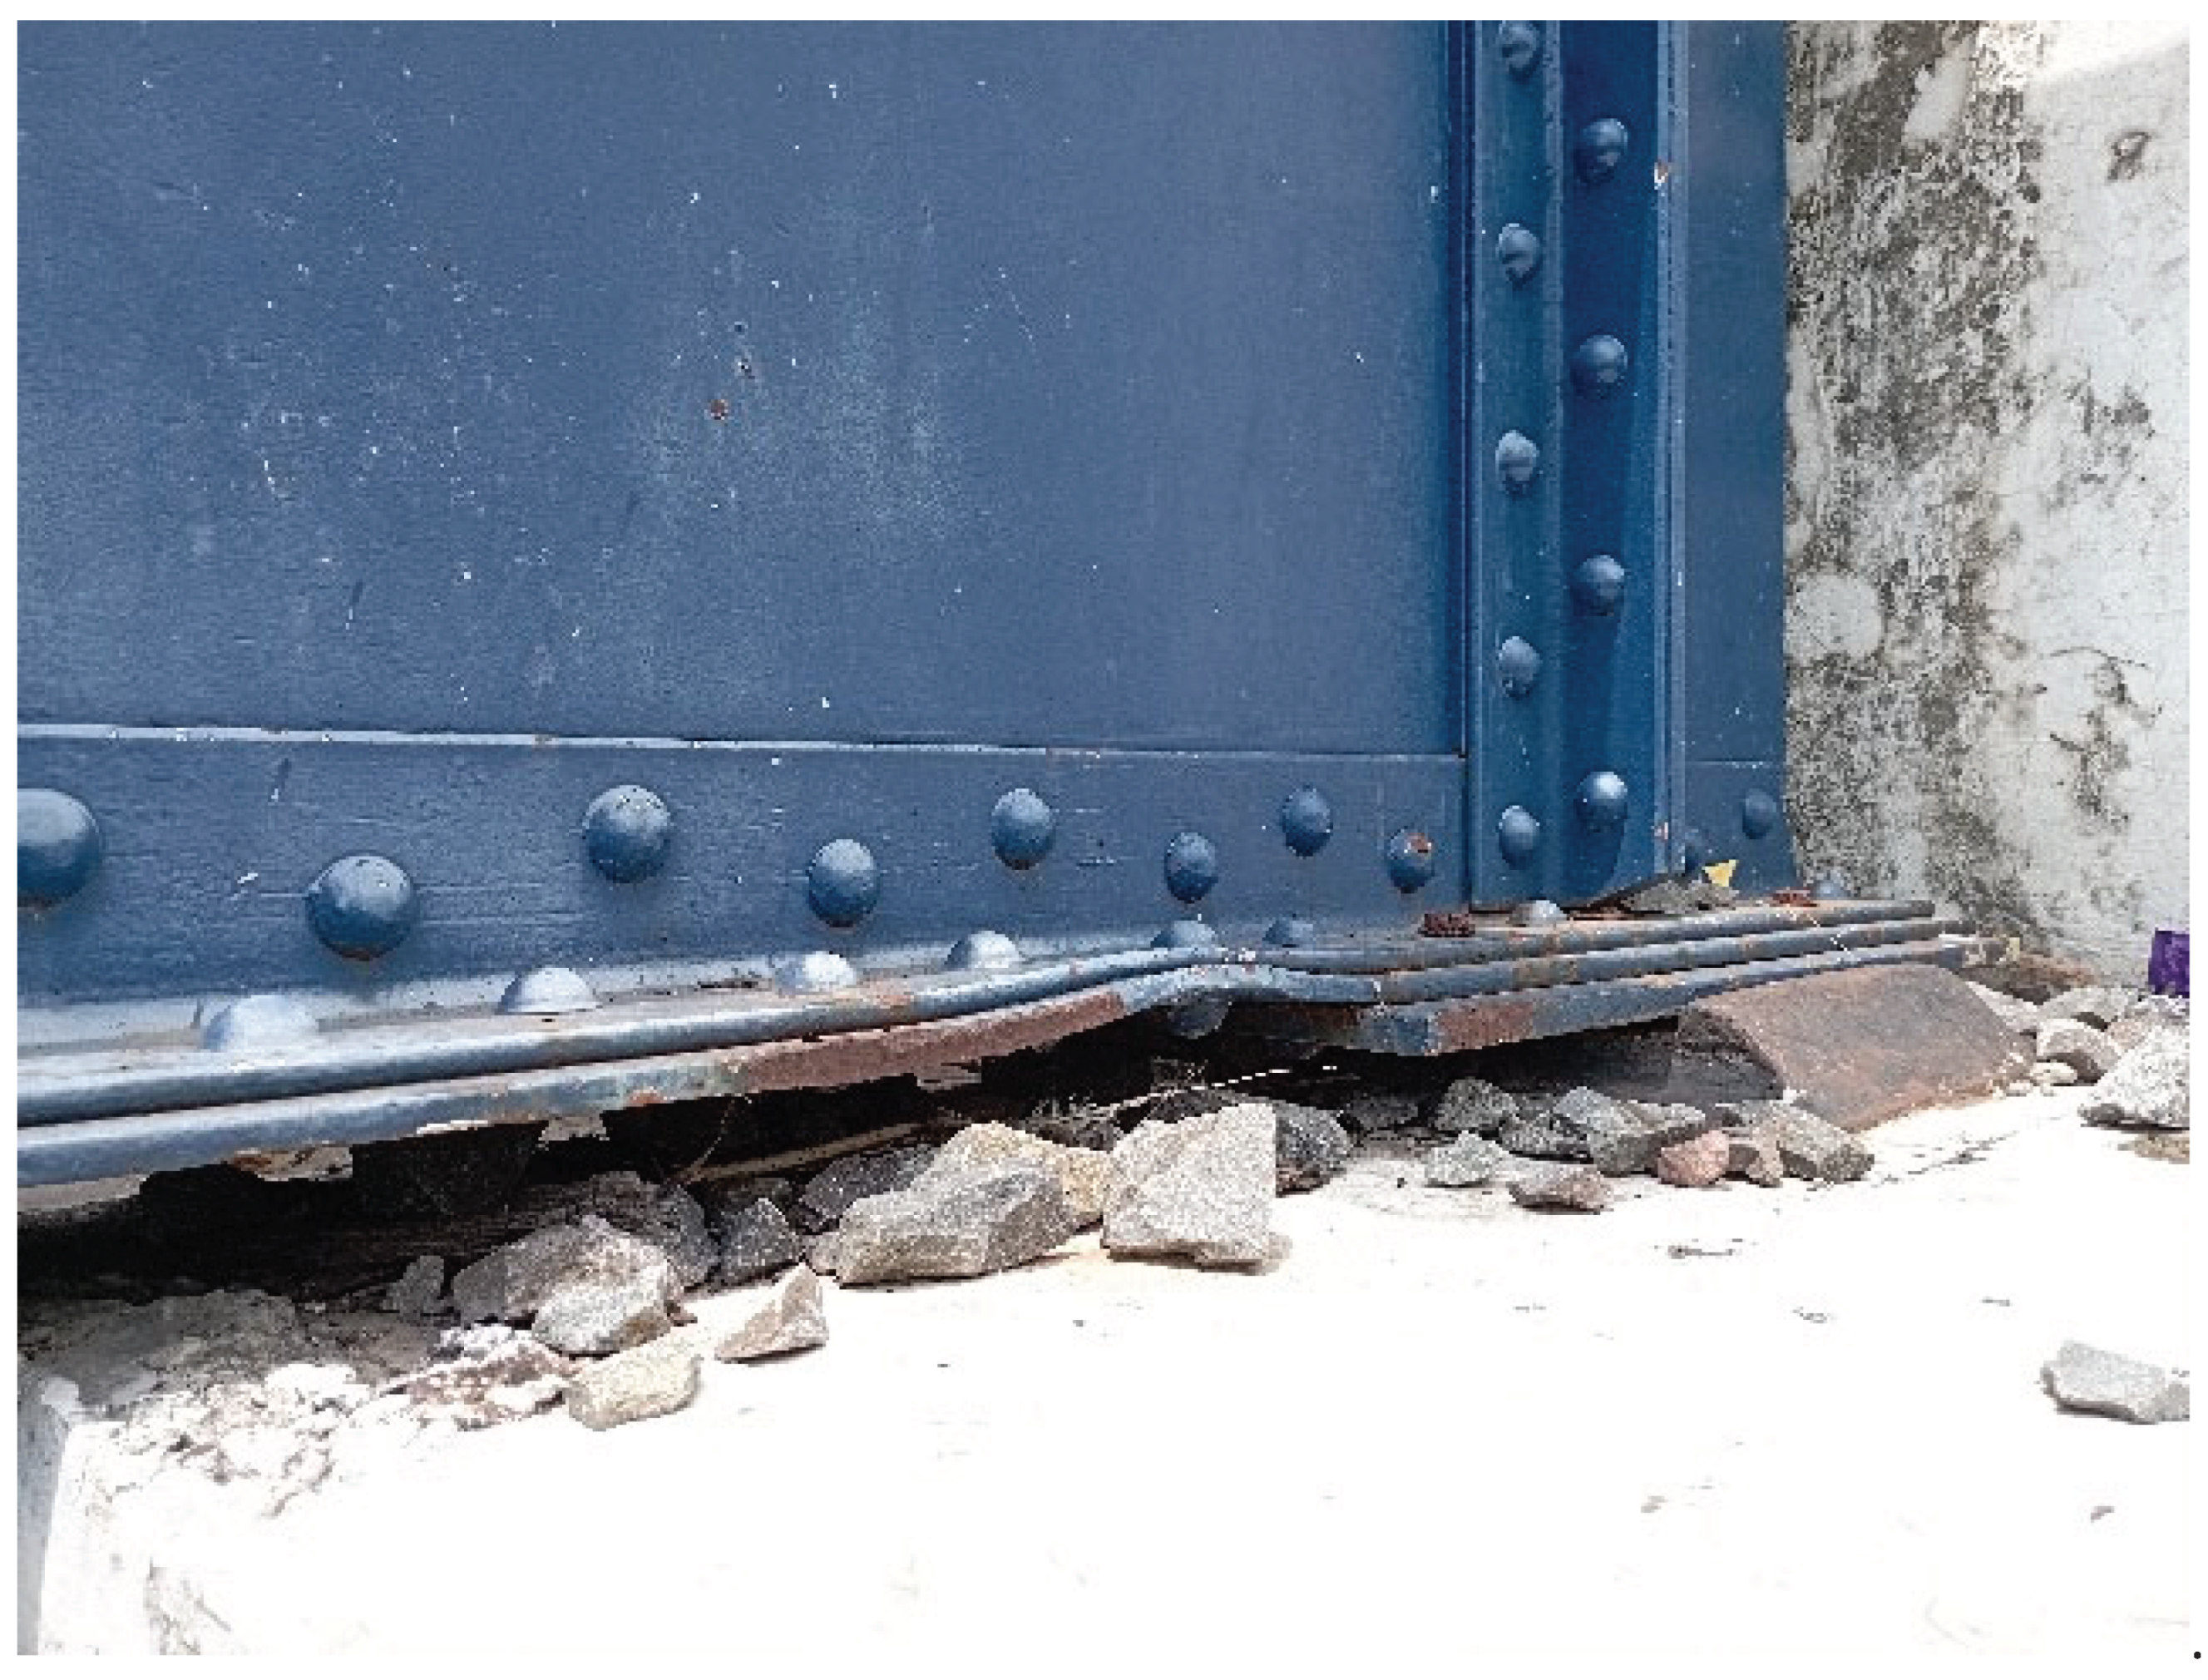
4.2. Bending of Steel Elements
One of the failure modes in steel structures is buckling. In general, buckling is induced by axial forces or forces acting on the principal axis of the structural section. Buckling is a phenomenon in which a structure is unable to maintain its original shape, leading to a change in shape to establish a new equilibrium. Local buckling is observed in the lower flange area of the longitudinal girder structure of span-1 in the bridge. This is attributed to tensile stress surpassing the capacity of the section to bear tensile stress. Additionally, the slender/thin shape of the steel section makes it more susceptible to buckling failure. Slenderness is defined as the ratio of length to thickness, and the longitudinal section of span-1 falls into the category of non-compact slenderness. Buckling does not necessarily result in the complete failure of the structure, but it can diminish the structural performance and lead to more significant damage.
Figure 22.
Local Buckling in the Flange Section.
Figure 22.
Local Buckling in the Flange Section.
4.3. Capacity Ratio of Bridge Structure Elements
The capacity ratio (R) is the ratio of the ultimate force or moment applied to the structural member (factored load Pu or Mu or Vu) to the nominal strength of the structural member (Pn or Mn or Vn), which includes a reduction factor. In the bridge structure, where the live load was applied in accordance with the Minister of Transportation Regulation No. 60 of 2012, it was discovered that the capacity ratio values for several structural elements in span-2 of the bridge did not meet the safety criteria. Consequently, the structural members in span-2 of the bridge were reinforced by adding plates to the flange, increasing their thickness by 10 to 15 mm. With the addition of these plates, the structural members as a whole now meet the strength requirements.
5. Conclusion
The following is the conclusion of the description provided in the previous section:
- a.
Static tests conducted in the field indicate that the maximum deflection of the structure in span-1 is -4.60 mm, in span-2 is -11.30 mm, and in span-3 is -3.42 mm. These deflection values still comply with the allowable deflection provisions. Additionally, the maximum stress observed in the section for span-1 is 322.50 MPa, for span-2 is 52.50 MPa, and for span-3 is 24.20 MPa. These stress values remain below the allowable section capacity.
- b.
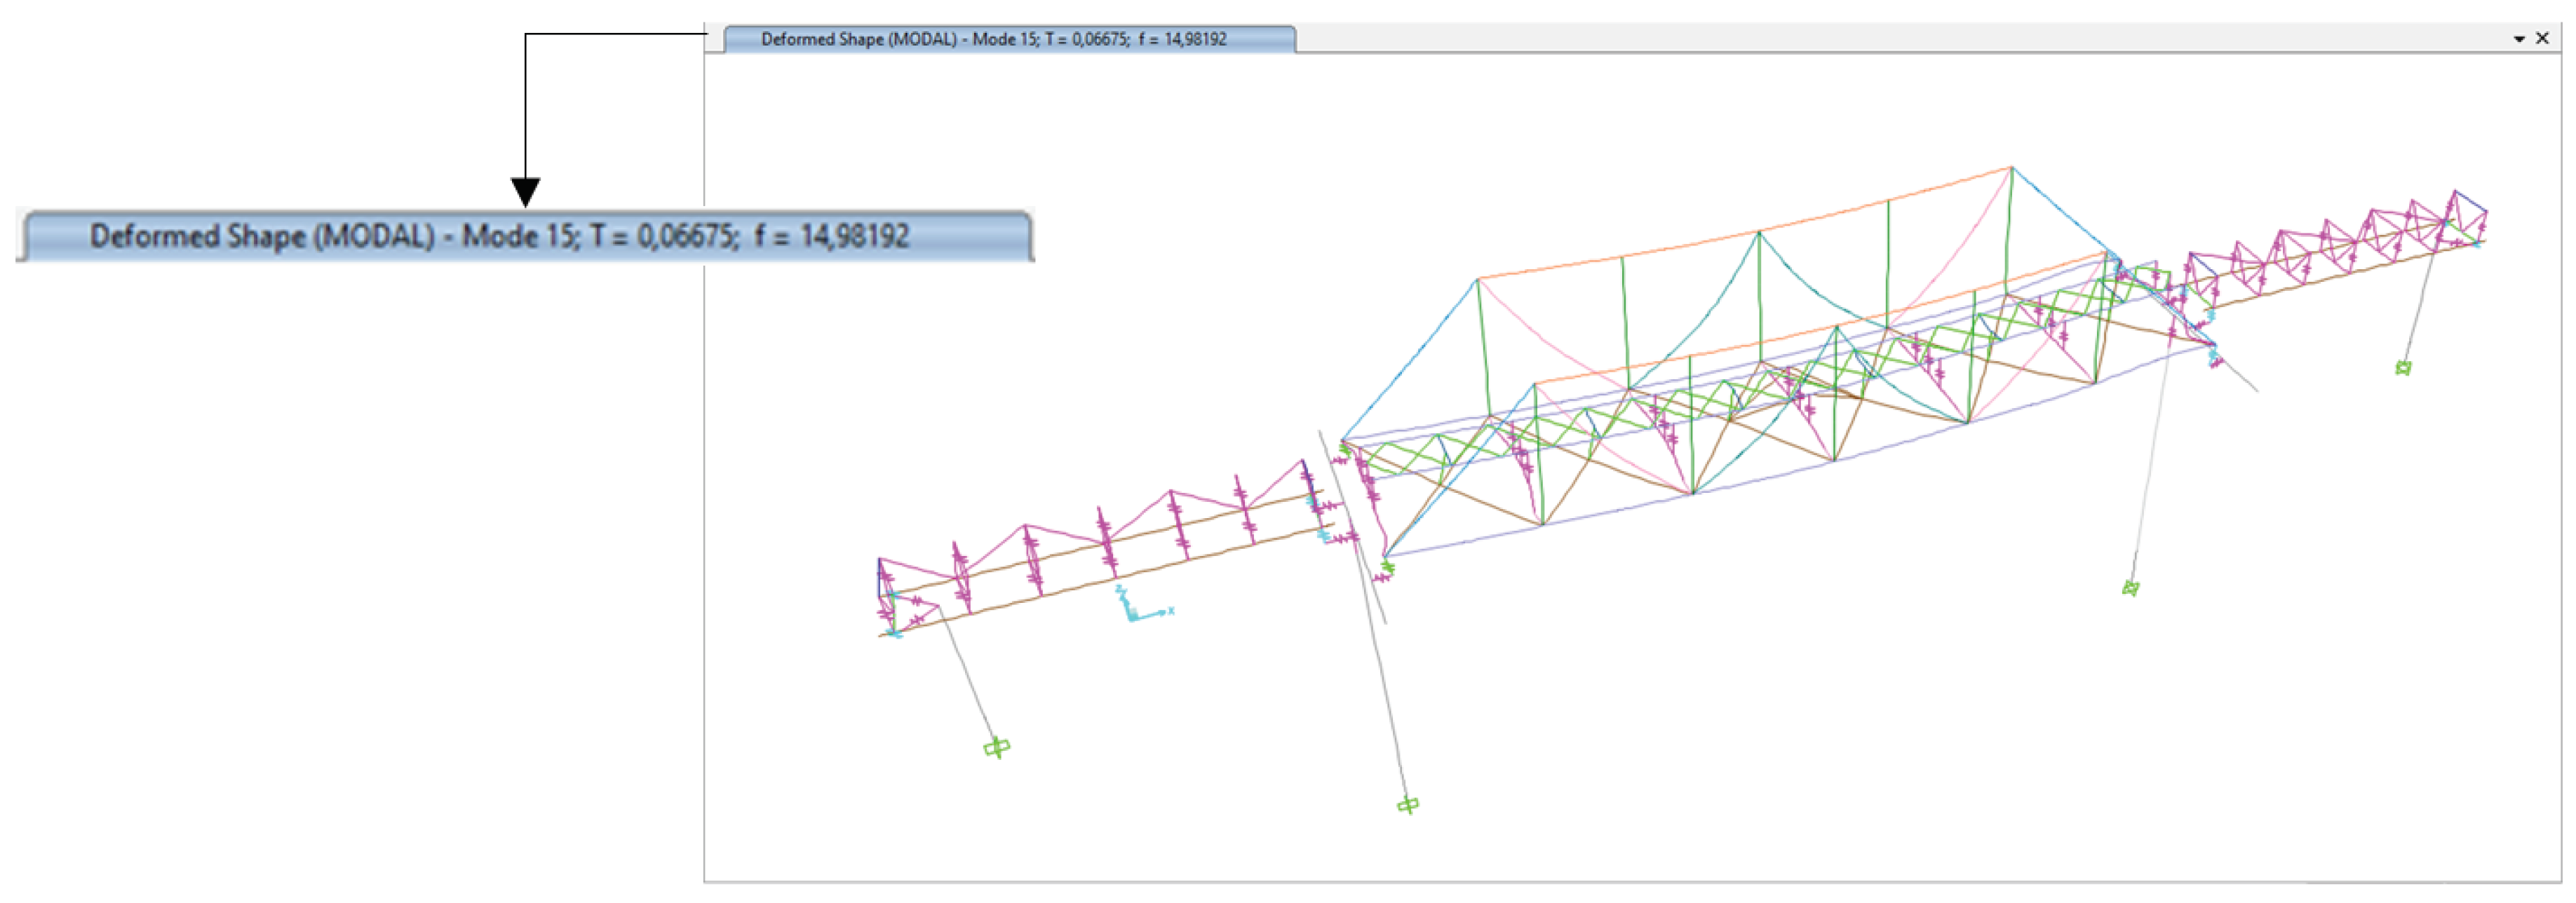
The dynamic tests in the field show that the dominant frequency in the vertical direction (z) of span-1 and span-2 of the bridge is 14.65 Hz, while the results of the structural analysis show that the dominant frequency in the vertical direction (z) is 14.98 Hz, which shows that the structural modelling agrees with the field measurement results.
- c.
Camber was initially designed for the span-2 bridge structure but was not achieved in the implementation. Therefore, it was recommended to use external prestressing with specifications of 2 tendons of 16 strands and a deflection height of 2 meters. This resulted in a camber of 11.82 mm. The external prestressing method applied to span-2 of the bridge can reduce the deflection of the existing bridge structure at 1/2L by 70.08% or 7.92 mm, due to the service load acting on the bridge.
- d.
The capacity ratio values for several structural elements of the span-2 bridge do not meet the safety criteria. Consequently, the structural members are reinforced by adding plates, with thickness ranging from 10 to 15 mm, to the flange of these members. With the addition of these plates, the structural elements as a whole now meet the strength requirements.
Author Contributions
This work was led by Sumargo, who analyzed and provided general direction for the stages of bridge load testing. Mardiana Oesman assisted in and reviewed the bridge load testing process. Fachmi Fadli conducted tests, processed data, reported test results, and wrote manuscripts for journals
Conflicts of Interest
The authors declare no conflict of interest.
References
- J. Bien, M. Kuzawa and T. Kaminski, “Strategies and Tools for the Monitoring of Concrete Bridges,” Structural Concrete, pp. Vol. 21, pp. 1227-1239, 2020. [CrossRef]
- Duvnjak, M. Bartolac, D. Damjanovic and J. Koscak, “Performance Asessment of a Concrete Railway Bridge by Diagnostic Load Testing,” Structural Concrete, pp. pp. 1-14, 2020.
- Duvnjak, D. Damjanovic, M. Bartolac, M. F. Smrkic and A. Skender, “Monitoring and Diagnostic Load Testing of a Damaged Railway Bridge,” Front Built Environ, p. Vol. 5 : 108, 2019. [CrossRef]
- Z. Qi, S. Fang, G. Lin and H. Wang, “Static and Dynamic Experiment of the Behavior of the Constructed Hanjiang Super-major Railway Bridge in Laohekou,” Advanced Materials Research Vols 255-260, pp. 1230-1235, 2011. [CrossRef]
- Bacinskas, Z. Kamaitis, D. Jatulis and A. Kilikevicius, “11th International Conference on Modern Building Materials, Structures and Techniques, MBMST 2013,” Load Testing and Model Updating of a Single Span Composite Steel-Concrete Railway Bridge, pp. 127-135, 2013. [CrossRef]
- B.-K. Lee, H.-S. Kang, I.-M. Sung, J.-O. Lee and N.-H. Rim, “Some Thoughts on Camber in Hight-speed Railway Bridge,” Engineering, 2013.
- Recupero, N. Spinella, P. Colajanni and C. D. Scilipoti, “Increasing the Capacity of Existing Bridges by Using Unbonded Prestressing Technology: A Case Study,” Advances in Civil Engineering, 2014. [CrossRef]
- T. Lou, T. L. Karavasilis and B. Chen, “Assessment of Second-Order Effect in Externally Prestressed Steel-Concrete Composite Beams,” Journal of Bridge Engineering, pp. Vol. 26, Issue 6, 2021. [CrossRef]
- Direktorat Jenderal Bina Marga, Manual Pelaksanaan Pengujian Jembatan, Direktorat Jenderal Bina Marga, 2012.
- G. Nawy, Prestressed Concrete : A Fundamental Approach Fifth Edition Update ACI, AASHTO, IBC 2009 Codes Version, New Jersey 07458: Pearson Education, Inc., Upper Saddle River, 2009.
- Menteri Perhubungan Republik Indonesia, PM 69 Tahun 2018 Tentang Sistem Manajemen Keselamatan Perkeretaapian, Jakarta, 2018.
- Menteri Perhubungan Republik Indonesia, PM 60 Tahun 2012 Tentang Persyaratan Teknis Jalur Kereta Api, Jakarta, 2012.
- Badan Standardisasi Nasional, SNI 2847-2019 Persyaratan Beton Struktural Untuk Bangunan Gedung dan Penjelasan (ACI 318M-14 dan ACI 318RM-14, MOD), Jakarta: Badan Standardisasi Nasional, 2019.
Figure 1.
Cibatu-Garut Railway Map.
Figure 1.
Cibatu-Garut Railway Map.
Figure 2.
(a) Aerial View of the Bridge (b) Steel Structure of the Bridge.
Figure 2.
(a) Aerial View of the Bridge (b) Steel Structure of the Bridge.
Figure 3.
Top View of the Bridge.
Figure 3.
Top View of the Bridge.
Figure 4.
(a) Static Load Diagram for Span-1 of the Bridge, (b) Static Load Diagram for Span-2 of the Bridge, and (c) Static Load Diagram for Span-3 of the Bridge.
Figure 4.
(a) Static Load Diagram for Span-1 of the Bridge, (b) Static Load Diagram for Span-2 of the Bridge, and (c) Static Load Diagram for Span-3 of the Bridge.
Figure 5.
3D Modeling of Bridge Structure.
Figure 5.
3D Modeling of Bridge Structure.
Figure 6.
Top View of Bridge Structure Modeling.
Figure 6.
Top View of Bridge Structure Modeling.
Figure 7.
Side View of Bridge Structure Modeling.
Figure 7.
Side View of Bridge Structure Modeling.
Figure 8.
(a) Installing the LVDT Sensor on the Bridge Structure (b) Installing the Strain Gauge Sensor on the Bridge Structure.
Figure 8.
(a) Installing the LVDT Sensor on the Bridge Structure (b) Installing the Strain Gauge Sensor on the Bridge Structure.
Figure 9.
Accelerometer Sensor Installation on Bridge Structure.
Figure 9.
Accelerometer Sensor Installation on Bridge Structure.
Figure 10.
Deflection of Bridge Structure (a) Deflection of Span-1 of 1/2L Bridge = -3.27 mm (b) Deflection of Span-2 of 1/2L Bridge = -21.88 mm (c) Deflection of Span-3 of 1/2L Bridge = -3.28 mm.
Figure 10.
Deflection of Bridge Structure (a) Deflection of Span-1 of 1/2L Bridge = -3.27 mm (b) Deflection of Span-2 of 1/2L Bridge = -21.88 mm (c) Deflection of Span-3 of 1/2L Bridge = -3.28 mm.
Figure 11.
Dominant Frequency of Bridge Structure Vertical (z) Mode 15 of 14.98 Hz.
Figure 11.
Dominant Frequency of Bridge Structure Vertical (z) Mode 15 of 14.98 Hz.
Figure 13.
Deflection Graph of Bridge Structure Due to Locomotive Static Load.
Figure 13.
Deflection Graph of Bridge Structure Due to Locomotive Static Load.
Figure 14.
Strain Graph of Bridge Structure Girders Due to Locomotive Static Load.
Figure 14.
Strain Graph of Bridge Structure Girders Due to Locomotive Static Load.
Figure 15.
Stress Graph of Bridge Structure Girders Due to Locomotive Static Load.
Figure 15.
Stress Graph of Bridge Structure Girders Due to Locomotive Static Load.
Figure 16.
Dominant Frequency in Vertical Direction (z) of Bridge Structure Girders.
Figure 16.
Dominant Frequency in Vertical Direction (z) of Bridge Structure Girders.
Figure 17.
Side View of the External Prestressing Reinforcement Modeling of the Bridge Structure
Figure 17.
Side View of the External Prestressing Reinforcement Modeling of the Bridge Structure
Table 2.
CC206 Locomotive Specifications.
Table 2.
CC206 Locomotive Specifications.
| Technical Data |
 |
| Locomotive |
CC 206 13 21 |
| Power Source |
Diesel Electric |
| Model |
GE CM20EMP |
| Wheel Specifications |
| Whyte Notation |
0-6-6-0 |
| AAR Wheel Setup |
C-C |
| UIC Classification |
Co’Co’ |
| Dimensions |
| Track Width |
1.067 mm (3 ft 6 in) |
| Length |
15.849 mm (17 yd 1 ft 0 in) |
| Width |
2.743 mm (3 yd 0 ft 0 in) |
| Maximum Height |
3.695 mm (4 yd 0 ft 0 in) |
| Axle Load |
15 ton (15 ton length; 17 ton short) |
| Weight |
| Empty Weight |
88.2 ton (86.8 ton length; 97.2 ton short) |
| Ready Weight |
90 ton (89 ton length; 99 ton short) |
| Performance |
| Maximum Speed |
160 km/h (44 m/s) Original Speed; 120 km/h (33 m/s) Operational Speed |
| Engine Power |
1.680 kW (2.250 hp) |
| Tractive Force |
248 kN (56.000 lbf) |
Table 3.
Dimension of Bridge Structure.
Table 3.
Dimension of Bridge Structure.
| No. |
Description |
Profile Type |
- A.
Bridge Structure |
| 1 |
Girder longitudinal of span-1 and span-3 |
Steel Joist 970.250.10.10 |
| 2 |
Girder longitudinal span-2 |
WF 425.170.18.10 |
| 3 |
Girder transverse of span-1 and span-3 top end |
2L 75.75.8 |
| 4 |
Girder transverse of span-1 and span-3 bottom end |
UNP 140.60.10 |
| 5 |
Girder transverse of span-1 and span-3 middle |
L 75.75.8 |
| 6 |
Bracing of span-1 and span-3 end |
2L 75.75.8 |
| 7 |
Bracing of span-1 and span-3 bottom end |
L 75.75.8 |
| 8 |
Girder transverse of span-2 |
Steel Joist 870.220.10.10 |
| 9 |
Bracing of span-2 bottom |
2L 60.60.8 |
| 10 |
Bracing of span-2 top |
L 55.55.8 |
|
| 1 |
Top and bottom truss |
2UNP 220.80.10 |
| 2 |
Vertical truss |
2UNP 220.80.10 |
| 3 |
Diagonal truss 1 |
2UNP 220.80.10.10 |
| 4 |
Diagonal truss 2 |
2UNP 200.75.10.10 |
| 5 |
Diagonal truss 3 |
2UNP 200.65.10.10 |
Table 4.
Bridge Structural Materials.
Table 4.
Bridge Structural Materials.
| Steel Material |
| Steel Grade |
fy = 349 MPa dan fu = 524 MPa |
| Modulus of Elasticity |
200000 MPa |
| Specific Gravity |
7850 kg/m3
|
| Concrete Material |
| Concrete Grade (fc’) |
Abutment 1 = 41,26 MPa
Abutment 2 = 34,57 MPa
Pillar 1 = 29,17 MPa
Pillar 2 = 30,01 MPa |
| Modulus of Elasticity |
4700 |
| Specific Gravity |
2400 kg/m3
|
| Wood Material |
| Wood Type |
Iron Wood |
| Wood Class |
I |
| Modulus of Elasticity |
125000 kg/cm2
|
| Specific Gravity |
9,0 kN/m3
|
| Stone Masonry Material |
| Modulus of Elasticity |
20000 MPa |
| Specific Gravity |
1900 kg/m3
|
Table 5.
Capacity Ratio of Bridge Structure Elements.
Table 5.
Capacity Ratio of Bridge Structure Elements.
| Span-1 |
| No. |
Struktural Elements |
Profil Type |
Capacity Ratio |
Allow Capacity Ratio |
Description |
| 1 |
Girder longitudinal |
970.250.10.10 |
0,404 |
1,0 |
OK |
| 2 |
Girder transverse top end |
2L 75.75.8 |
0,127 |
1,0 |
OK |
| 3 |
Girder transverse bottom end |
UNP 140.60.10 |
0,060 |
1,0 |
OK |
| 4 |
Girder transverse middle |
L 75.75.8 |
0,066 |
1,0 |
OK |
| 5 |
Bracing end |
2L75.75.8 |
0,101 |
1,0 |
OK |
| 6 |
Bracing middle |
L 75.75.8 |
0,217 |
1,0 |
OK |
| Span-2 |
| No. |
Struktural Elements |
Profil Type |
Capacity Ratio |
Allow Capacity Ratio |
Description |
| 7 |
Girder longitudinal |
WF 425.170.18.10 |
0,597 |
1,0 |
OK |
| 8 |
Girder transverse |
870.220.10.10 |
1,683 |
1,0 |
Not OK |
| 9 |
Bracing bottom |
2L 60.60.8 |
1,045 |
1,0 |
Not OK |
| 10 |
Bracing top |
L 55.55.8 |
0,579 |
1,0 |
OK |
| 11 |
Top truss |
2UNP 220.80.10 |
0,697 |
1,0 |
OK |
| 12 |
Bottom truss |
2UNP 220.80.10 |
2,856 |
1,0 |
Not OK |
| 13 |
Vertical truss |
2UNP 220.80.10 |
0,620 |
1,0 |
OK |
| 14 |
Diagonal truss 1 |
2UNP 220.80.10.10 |
0,571 |
1,0 |
OK |
| 15 |
Diagonal truss 2 |
2UNP 220.75.10.10 |
0,476 |
1,0 |
OK |
| 16 |
Diagonal truss 3 |
2UNP 220.65.10.10 |
0,122 |
1,0 |
OK |
| Span-3 |
| No. |
Struktural Elements |
Profil Type |
Capacity Ratio |
Allow Capacity Ratio |
Description |
| 17 |
Girder longitudinal |
970.250.10.10 |
0,388 |
1,0 |
OK |
| 18 |
Girder transverse top end |
2L 75.75.8 |
0,119 |
1,0 |
OK |
| 19 |
Girder transverse bottom end |
UNP 140.60.10 |
0,060 |
1,0 |
OK |
| 20 |
Girder transverse middle |
L 75.75.8 |
0,063 |
1,0 |
OK |
| 21 |
Bracing end |
2L75.75.8 |
0,096 |
1,0 |
OK |
| 22 |
Bracing middle |
L 75.75.8 |
0,199 |
1,0 |
OK |
Table 6.
Strand Characteristics.
Table 6.
Strand Characteristics.
| Strand Type |
ASTM Grade 270 |
| 13 m (0.5”) |
15 mm (0.6”) |
| Diameter (mm) |
12.7 |
- |
| Nominal Area (mm2) |
98.7 |
140 |
| Nominal Weight (kg/m) |
0.775 |
1.1 |
| Yield Stress (MPa) |
1670 |
1670 |
| Tensile Stress (MPa) |
1860 |
1860 |
| Yield Limit (kN) |
183.7 |
260.7 |
| Modulus (GPa) |
About 195 |
About 195 |
| Relaxation (%) |
Max. 2.5 |
Max. 2.5 |
|
Note: Allowable Stress 45% of Yield Strength. |
Table 9.
Capacity Ratio of Bridge Elements after External Prestressing and Plate Reinforcement.
Table 9.
Capacity Ratio of Bridge Elements after External Prestressing and Plate Reinforcement.
| Span-2 |
| No. |
Struktural Elements |
Profil Type |
Capacity Ratio |
Allow Capacity Ratio |
Description |
| 1 |
Girder longitudinal |
WF 425.170.18.10 |
0,570 |
1,0 |
OK |
| 2 |
Girder transverse |
870.220.10.10 |
0,975 |
1,0 |
OK |
| 3 |
Bracing bottom |
2L 60.60.8 |
0,677 |
1,0 |
OK |
| 4 |
Bracing top |
L 55.55.8 |
0,291 |
1,0 |
OK |
| 5 |
Top truss |
2UNP 220.80.10 |
0,334 |
1,0 |
OK |
| 6 |
Bottom truss |
2UNP 220.80.10 |
0,949 |
1,0 |
OK |
| 7 |
Vertical truss |
2UNP 220.80.10 |
0,235 |
1,0 |
OK |
| 8 |
Diagonal truss 1 |
2UNP 220.80.10.10 |
0,332 |
1,0 |
OK |
| 9 |
Diagonal truss 2 |
2UNP 220.75.10.10 |
0,322 |
1,0 |
OK |
| 10 |
Diagonal truss 3 |
2UNP 220.65.10.10 |
0,044 |
1,0 |
OK |
| 11 |
Girder longitudinal |
H 200.200.8.12 |
0,542 |
1,0 |
OK |
|
Disclaimer/Publisher’s Note: The statements, opinions and data contained in all publications are solely those of the individual author(s) and contributor(s) and not of MDPI and/or the editor(s). MDPI and/or the editor(s) disclaim responsibility for any injury to people or property resulting from any ideas, methods, instructions or products referred to in the content. |
© 2024 by the authors. Licensee MDPI, Basel, Switzerland. This article is an open access article distributed under the terms and conditions of the Creative Commons Attribution (CC BY) license (http://creativecommons.org/licenses/by/4.0/).

