Submitted:
21 February 2024
Posted:
21 February 2024
You are already at the latest version
Abstract
Keywords:
1. Introduction
2. Materials and Methods
2.1. Study subjects
2.2. Clinical and Biochemical Measurements
2.3. Preparation of Stroke Thrombi for Targeted Metabolomics Analysis
2.4. Targeted Metabolomics Analysis
2.5. Statistical Analyses
3. Results
3.1. Clinical features of study population
3.2. Metabolomics analysis
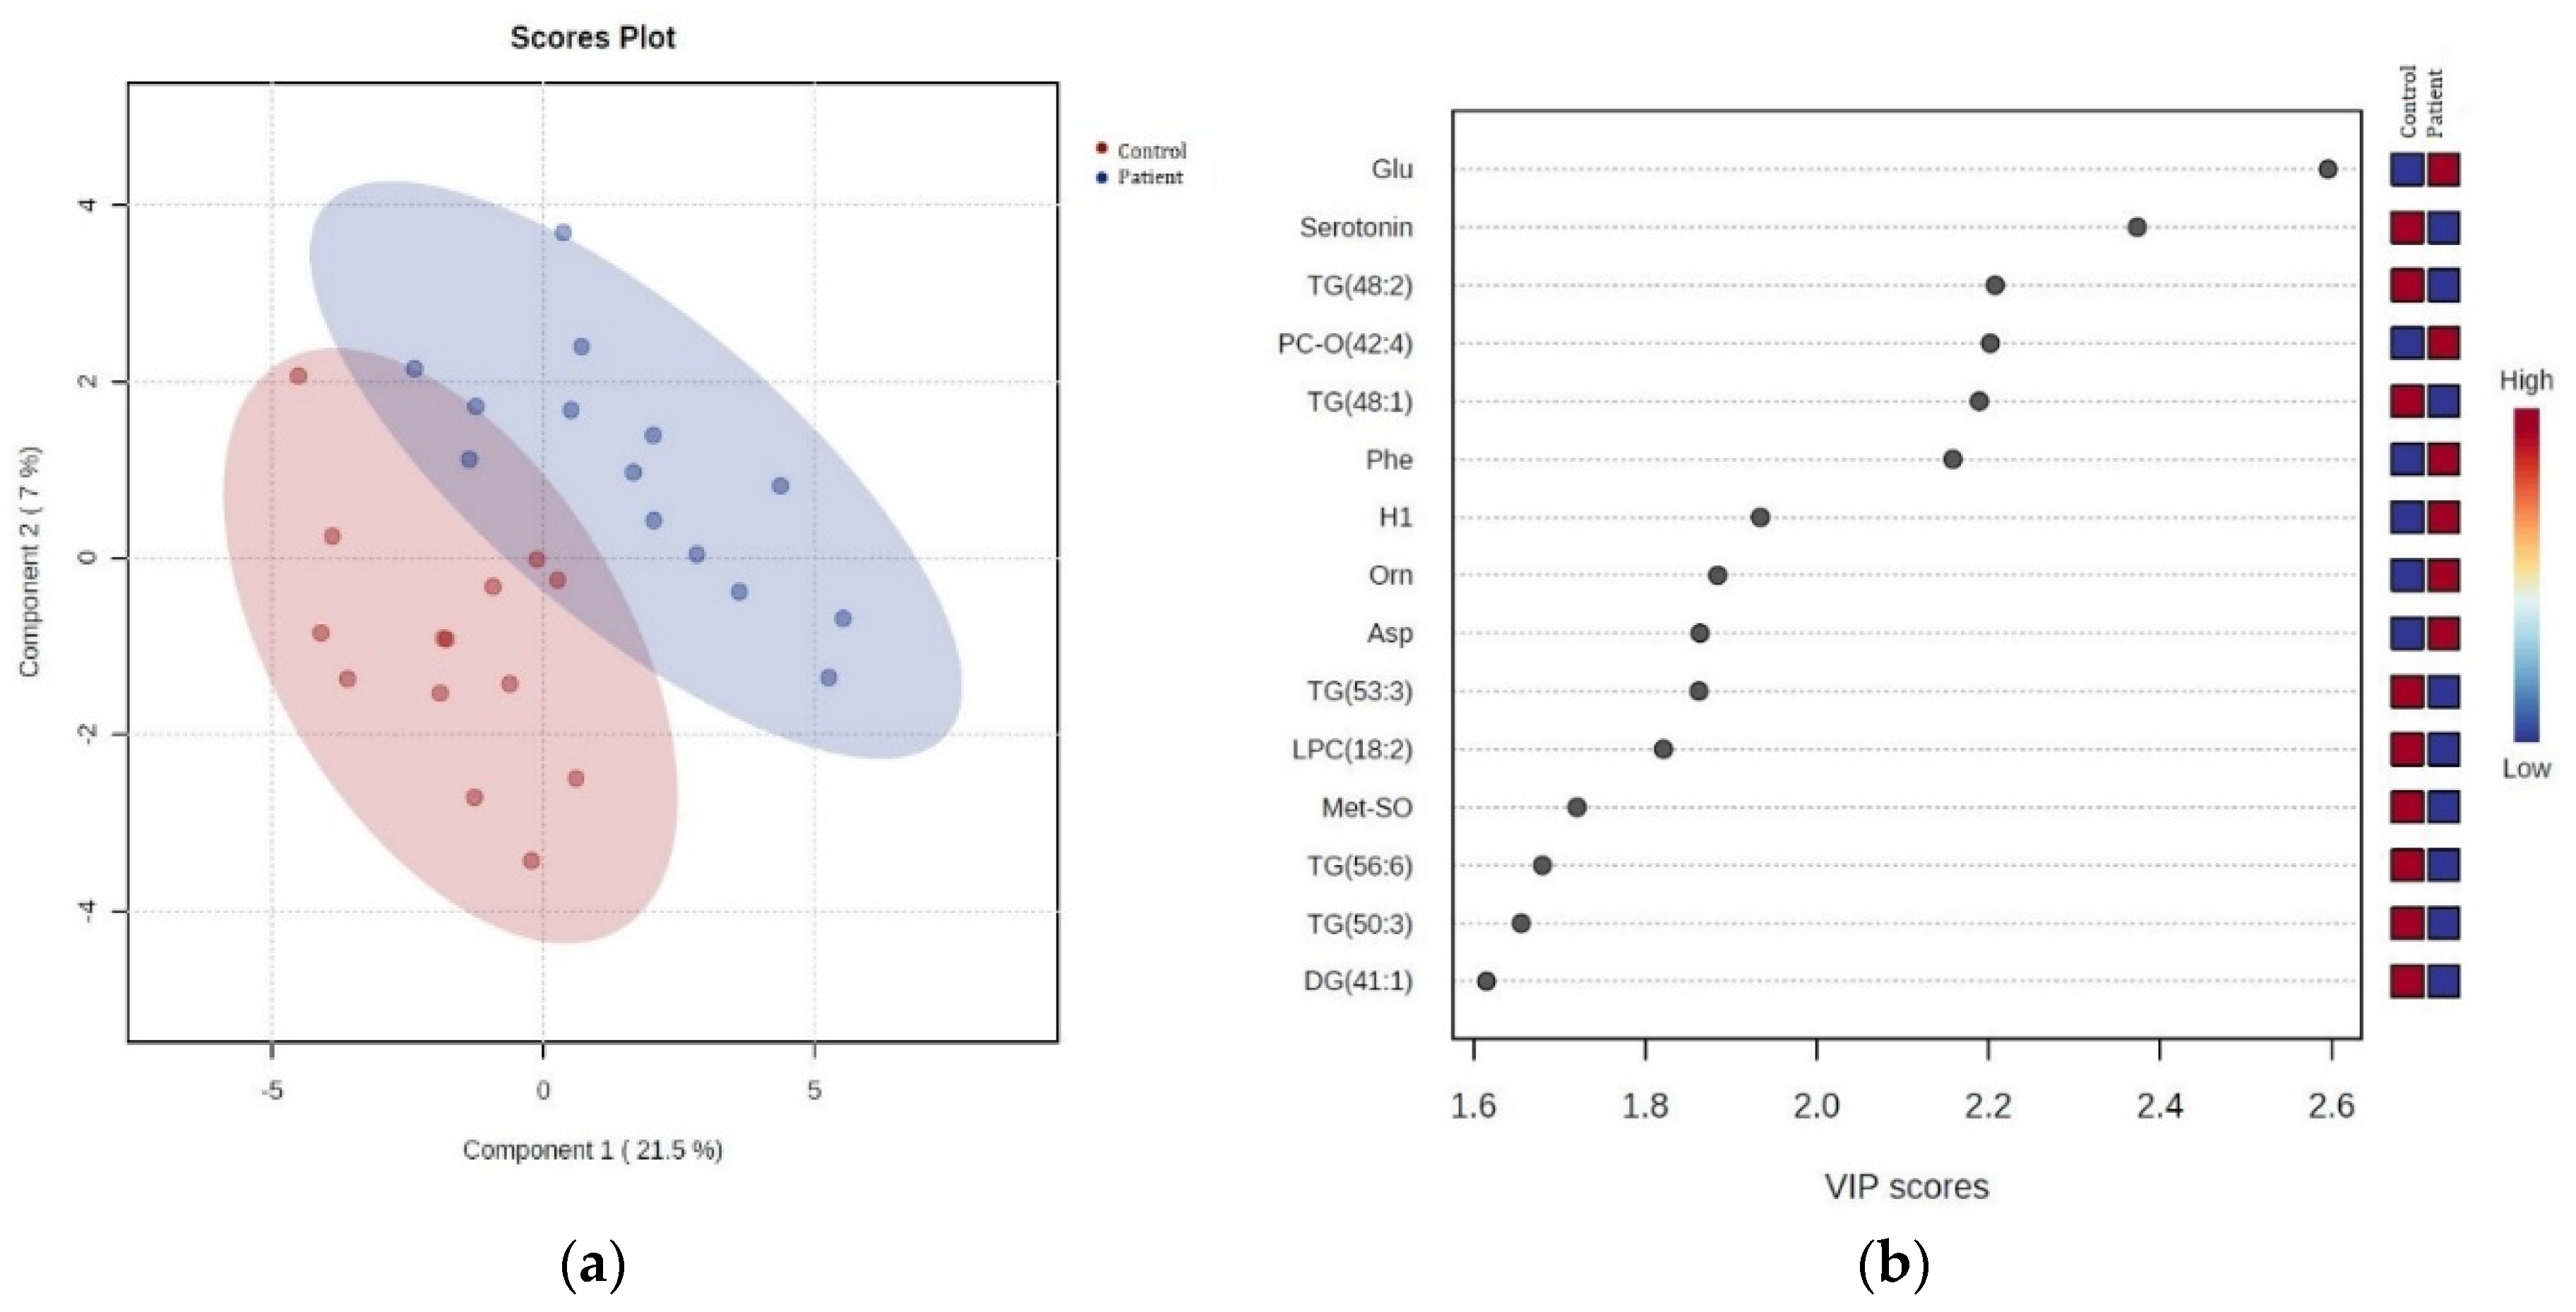
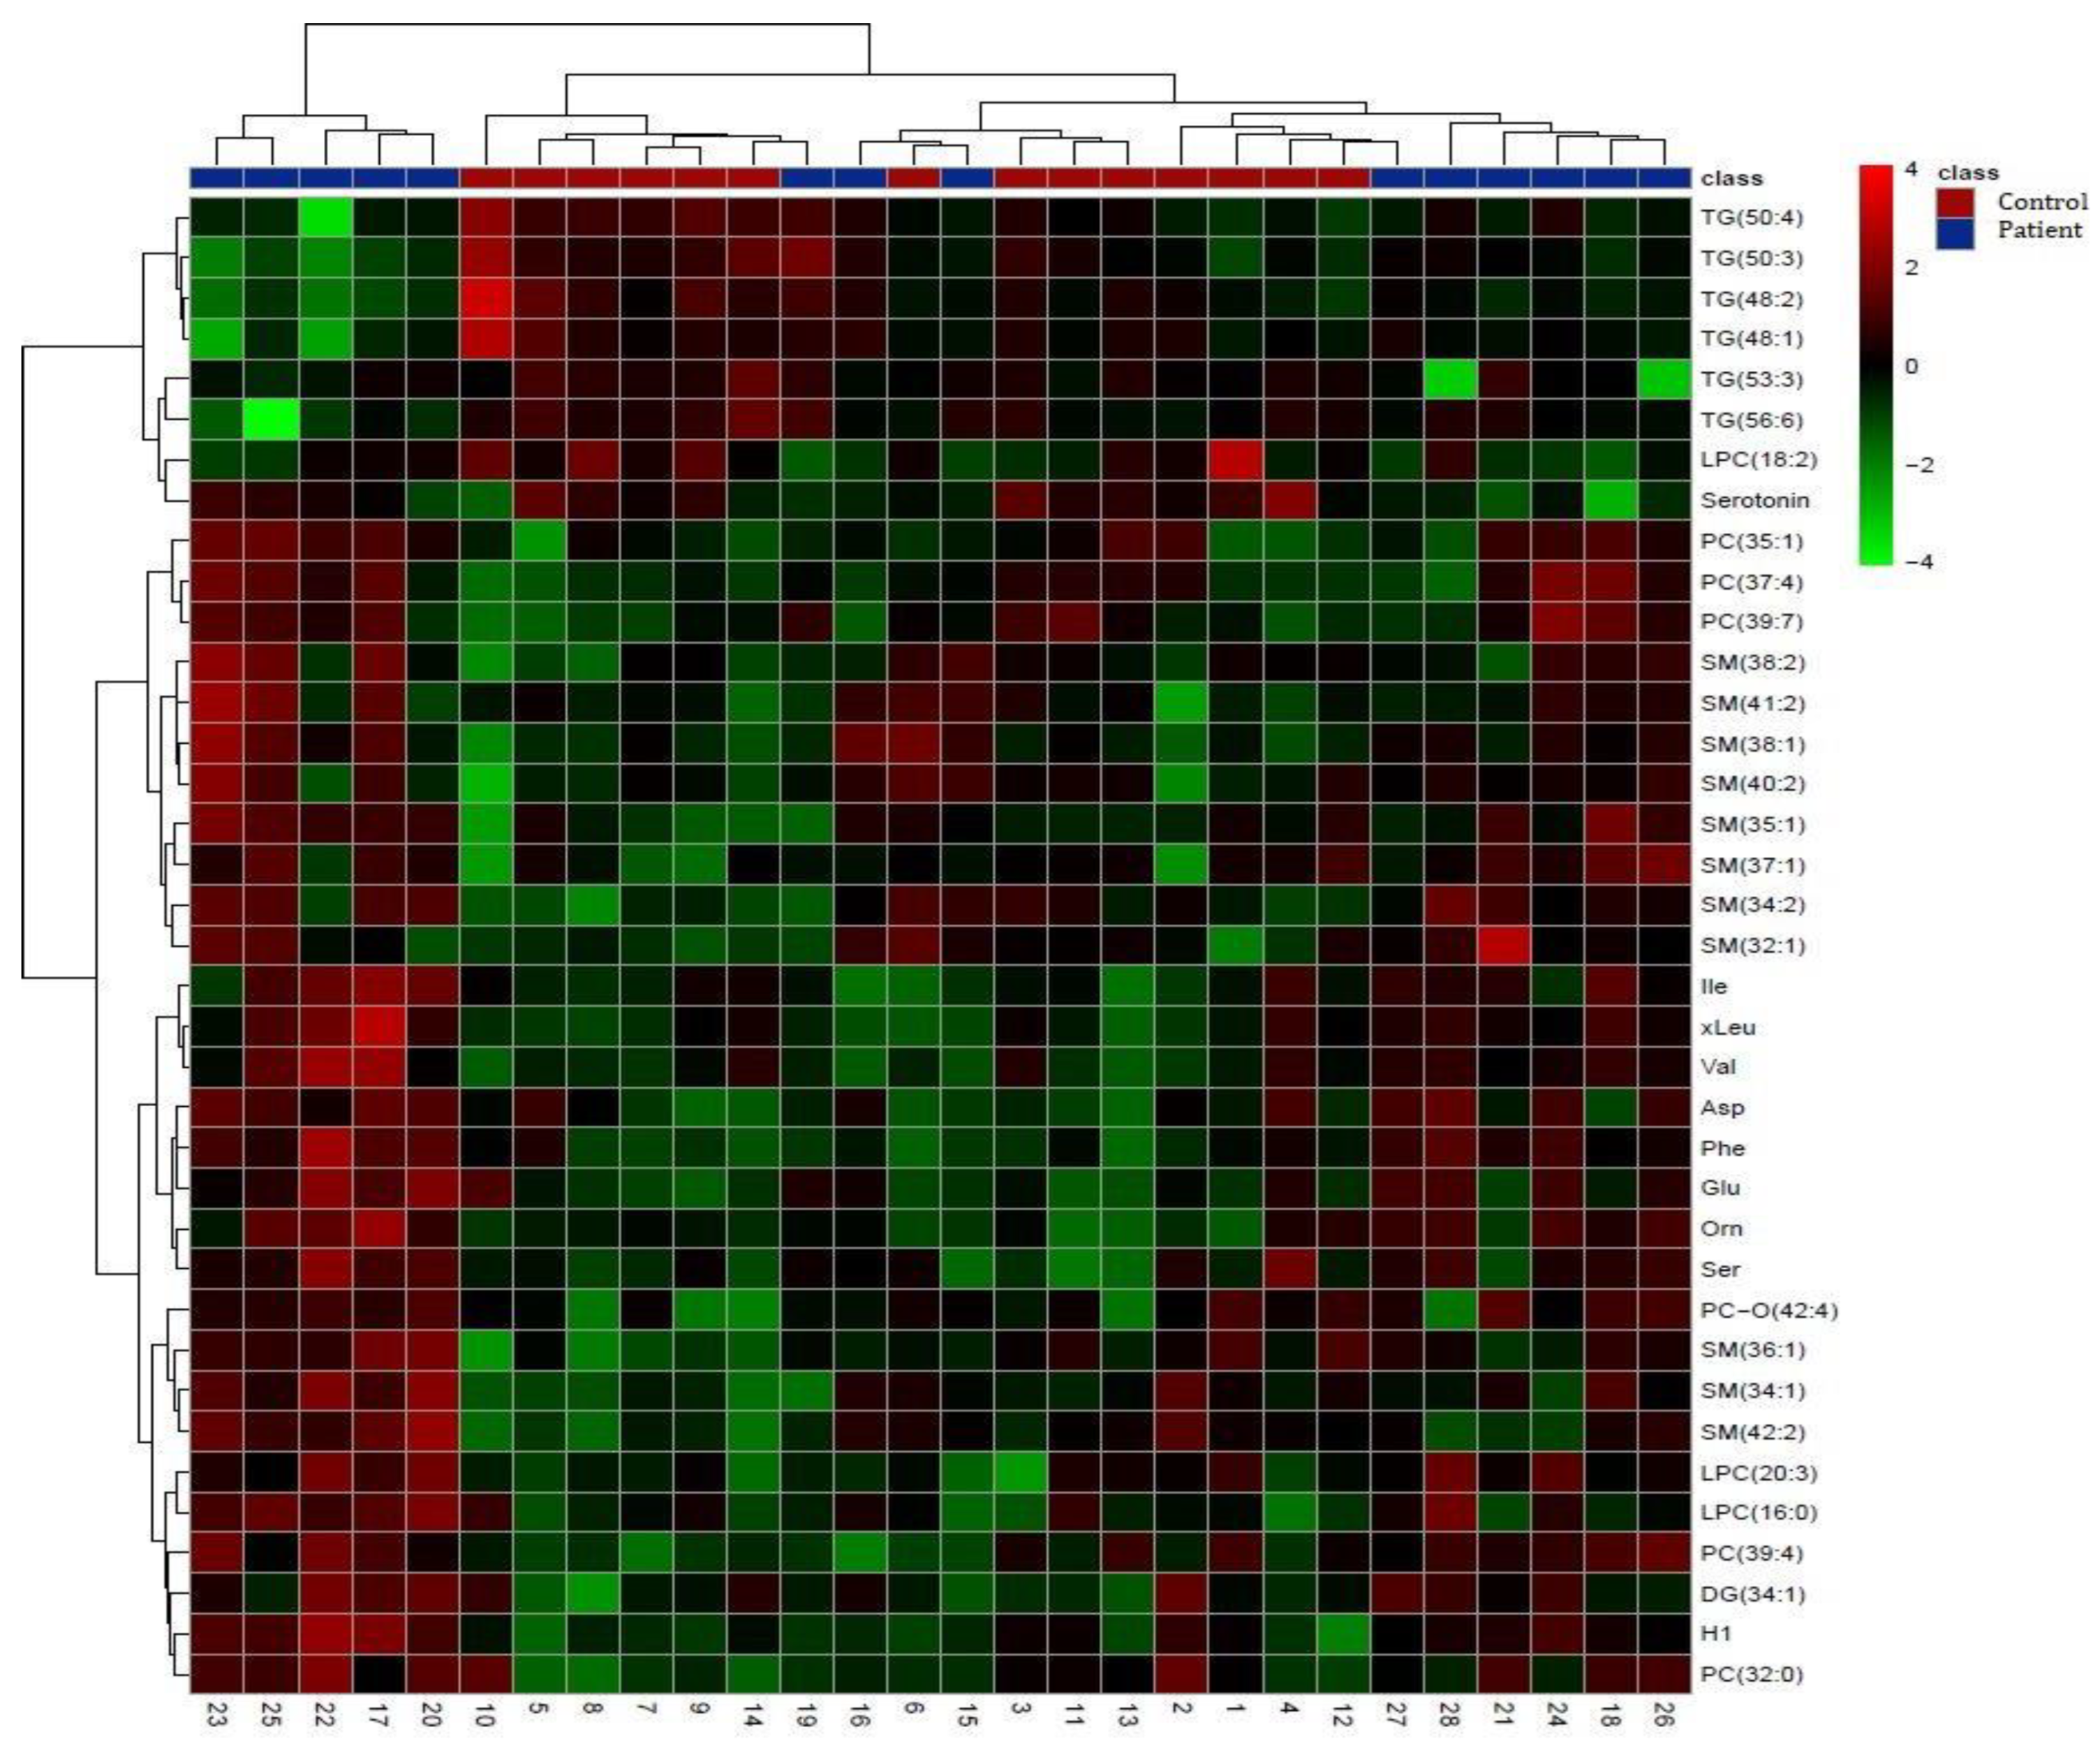
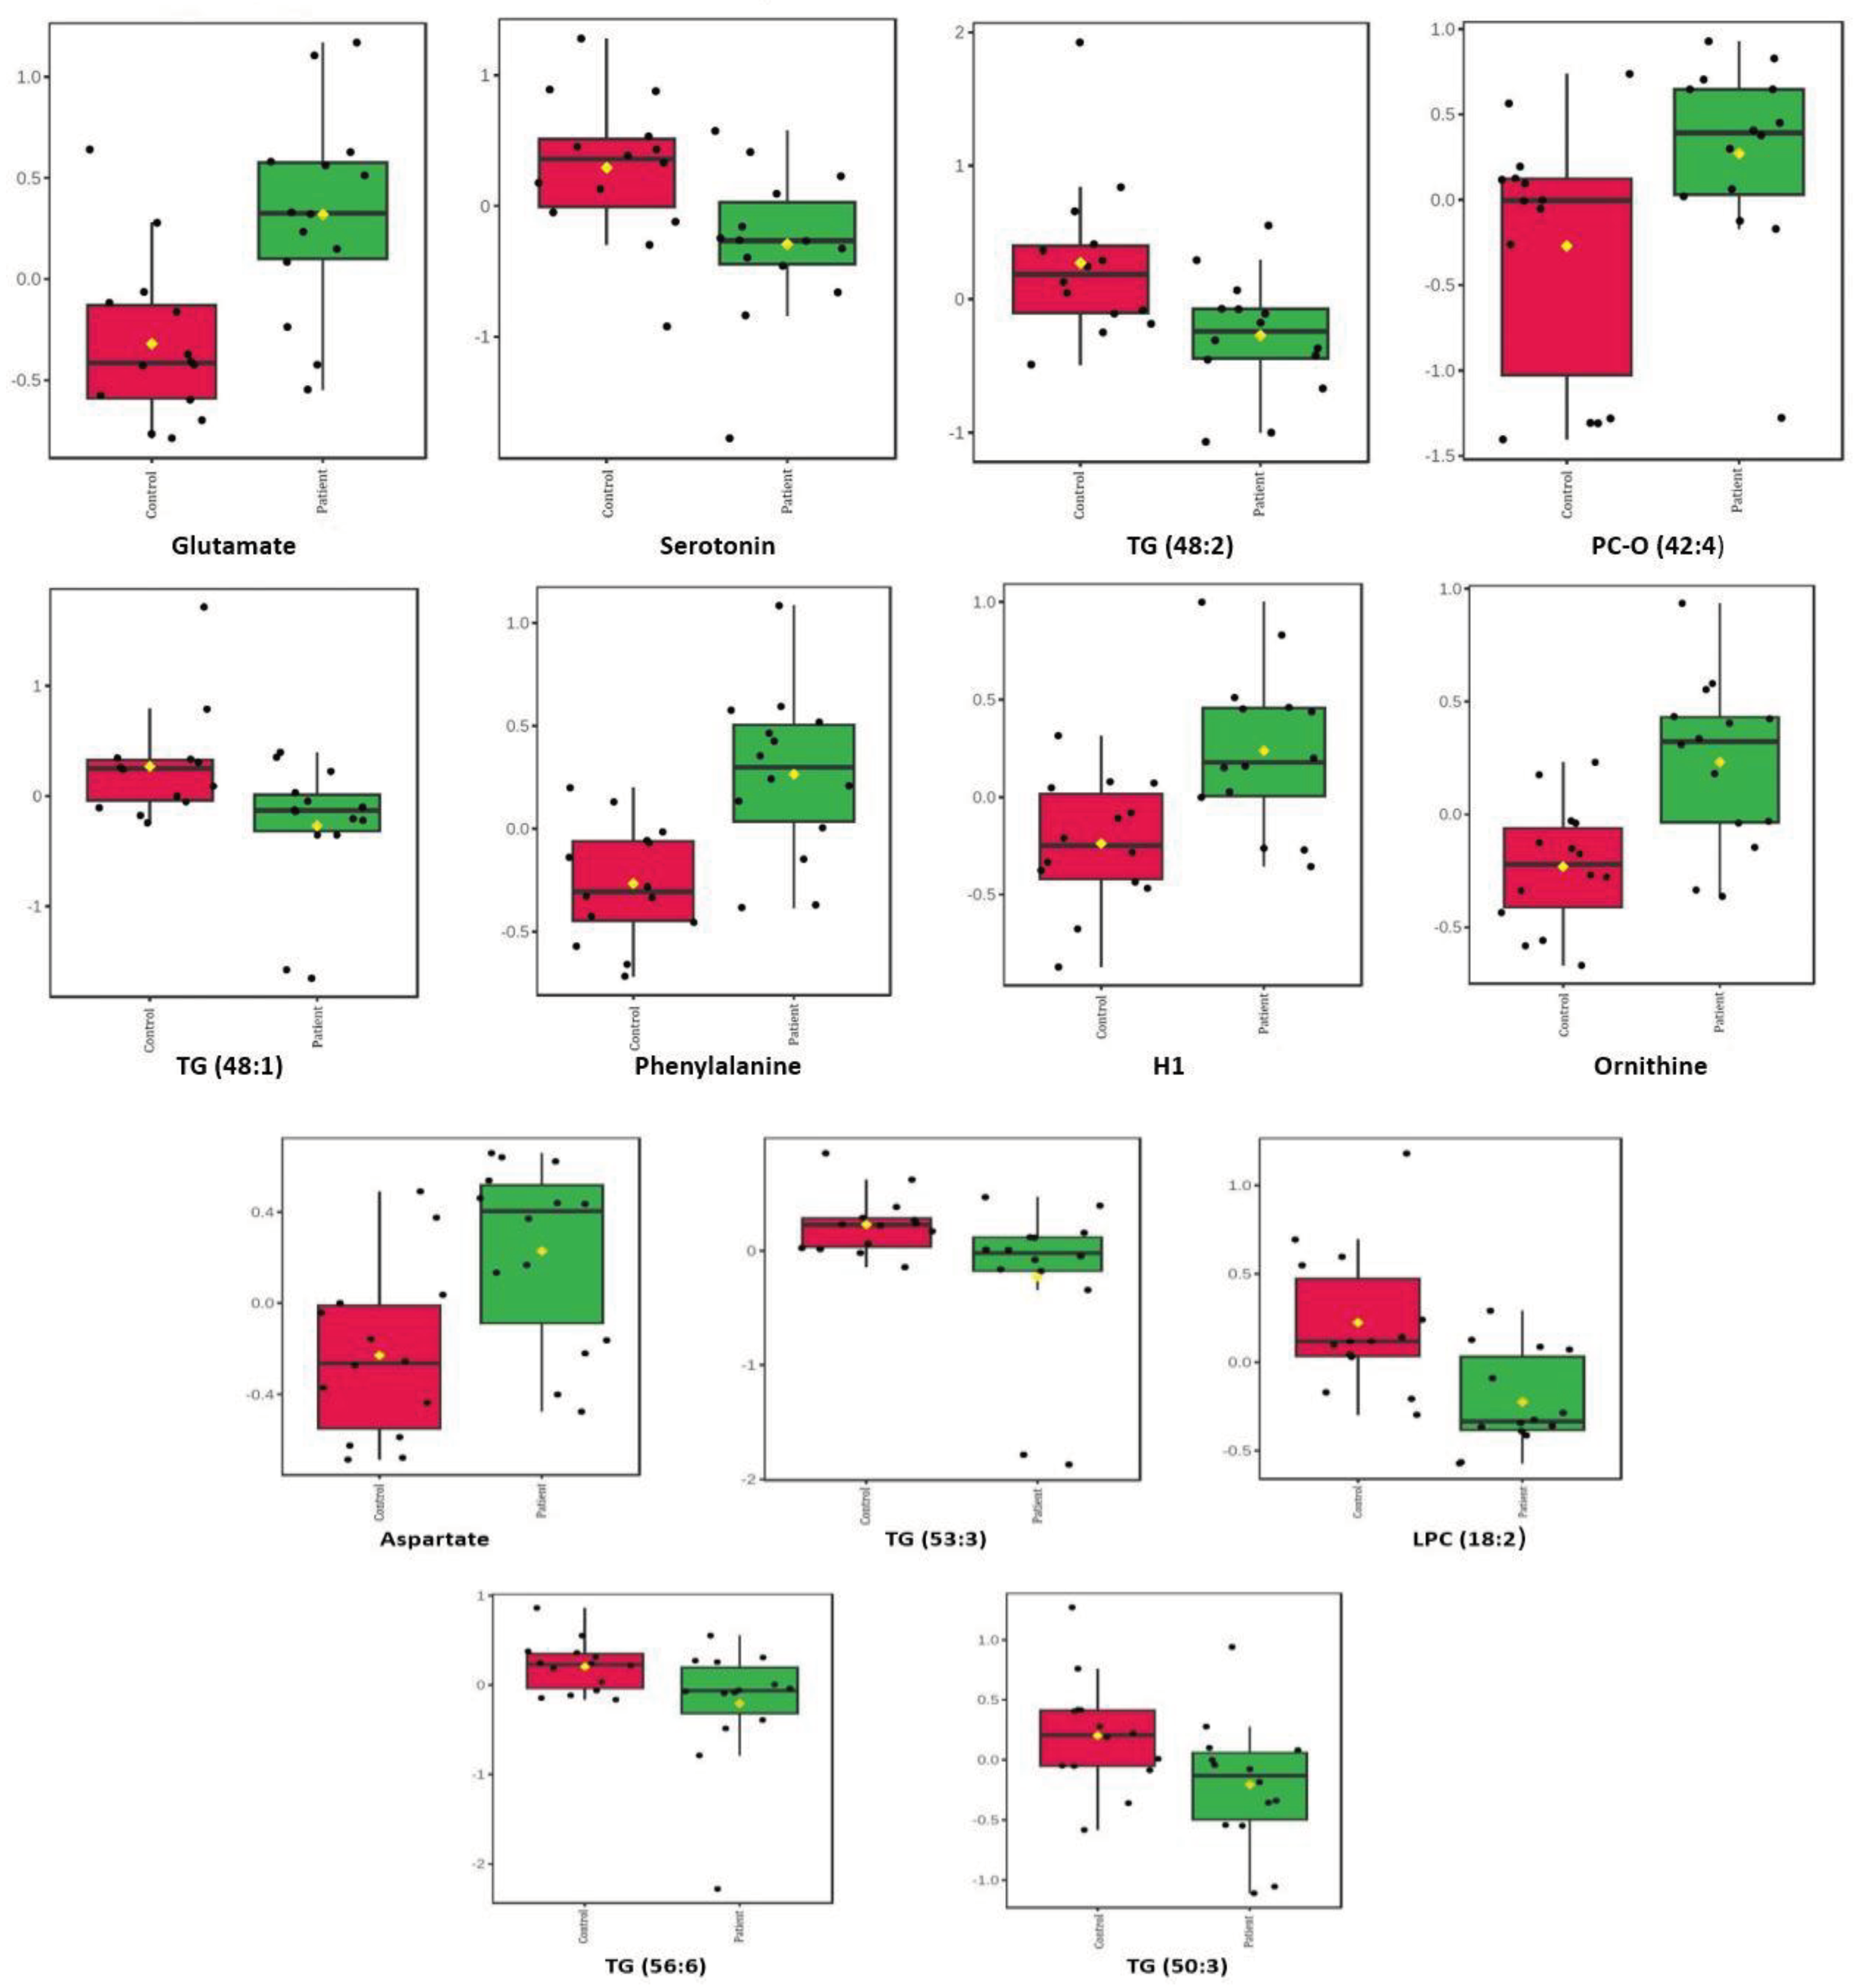
3.2.1. Comparison of patient serums versus control serums
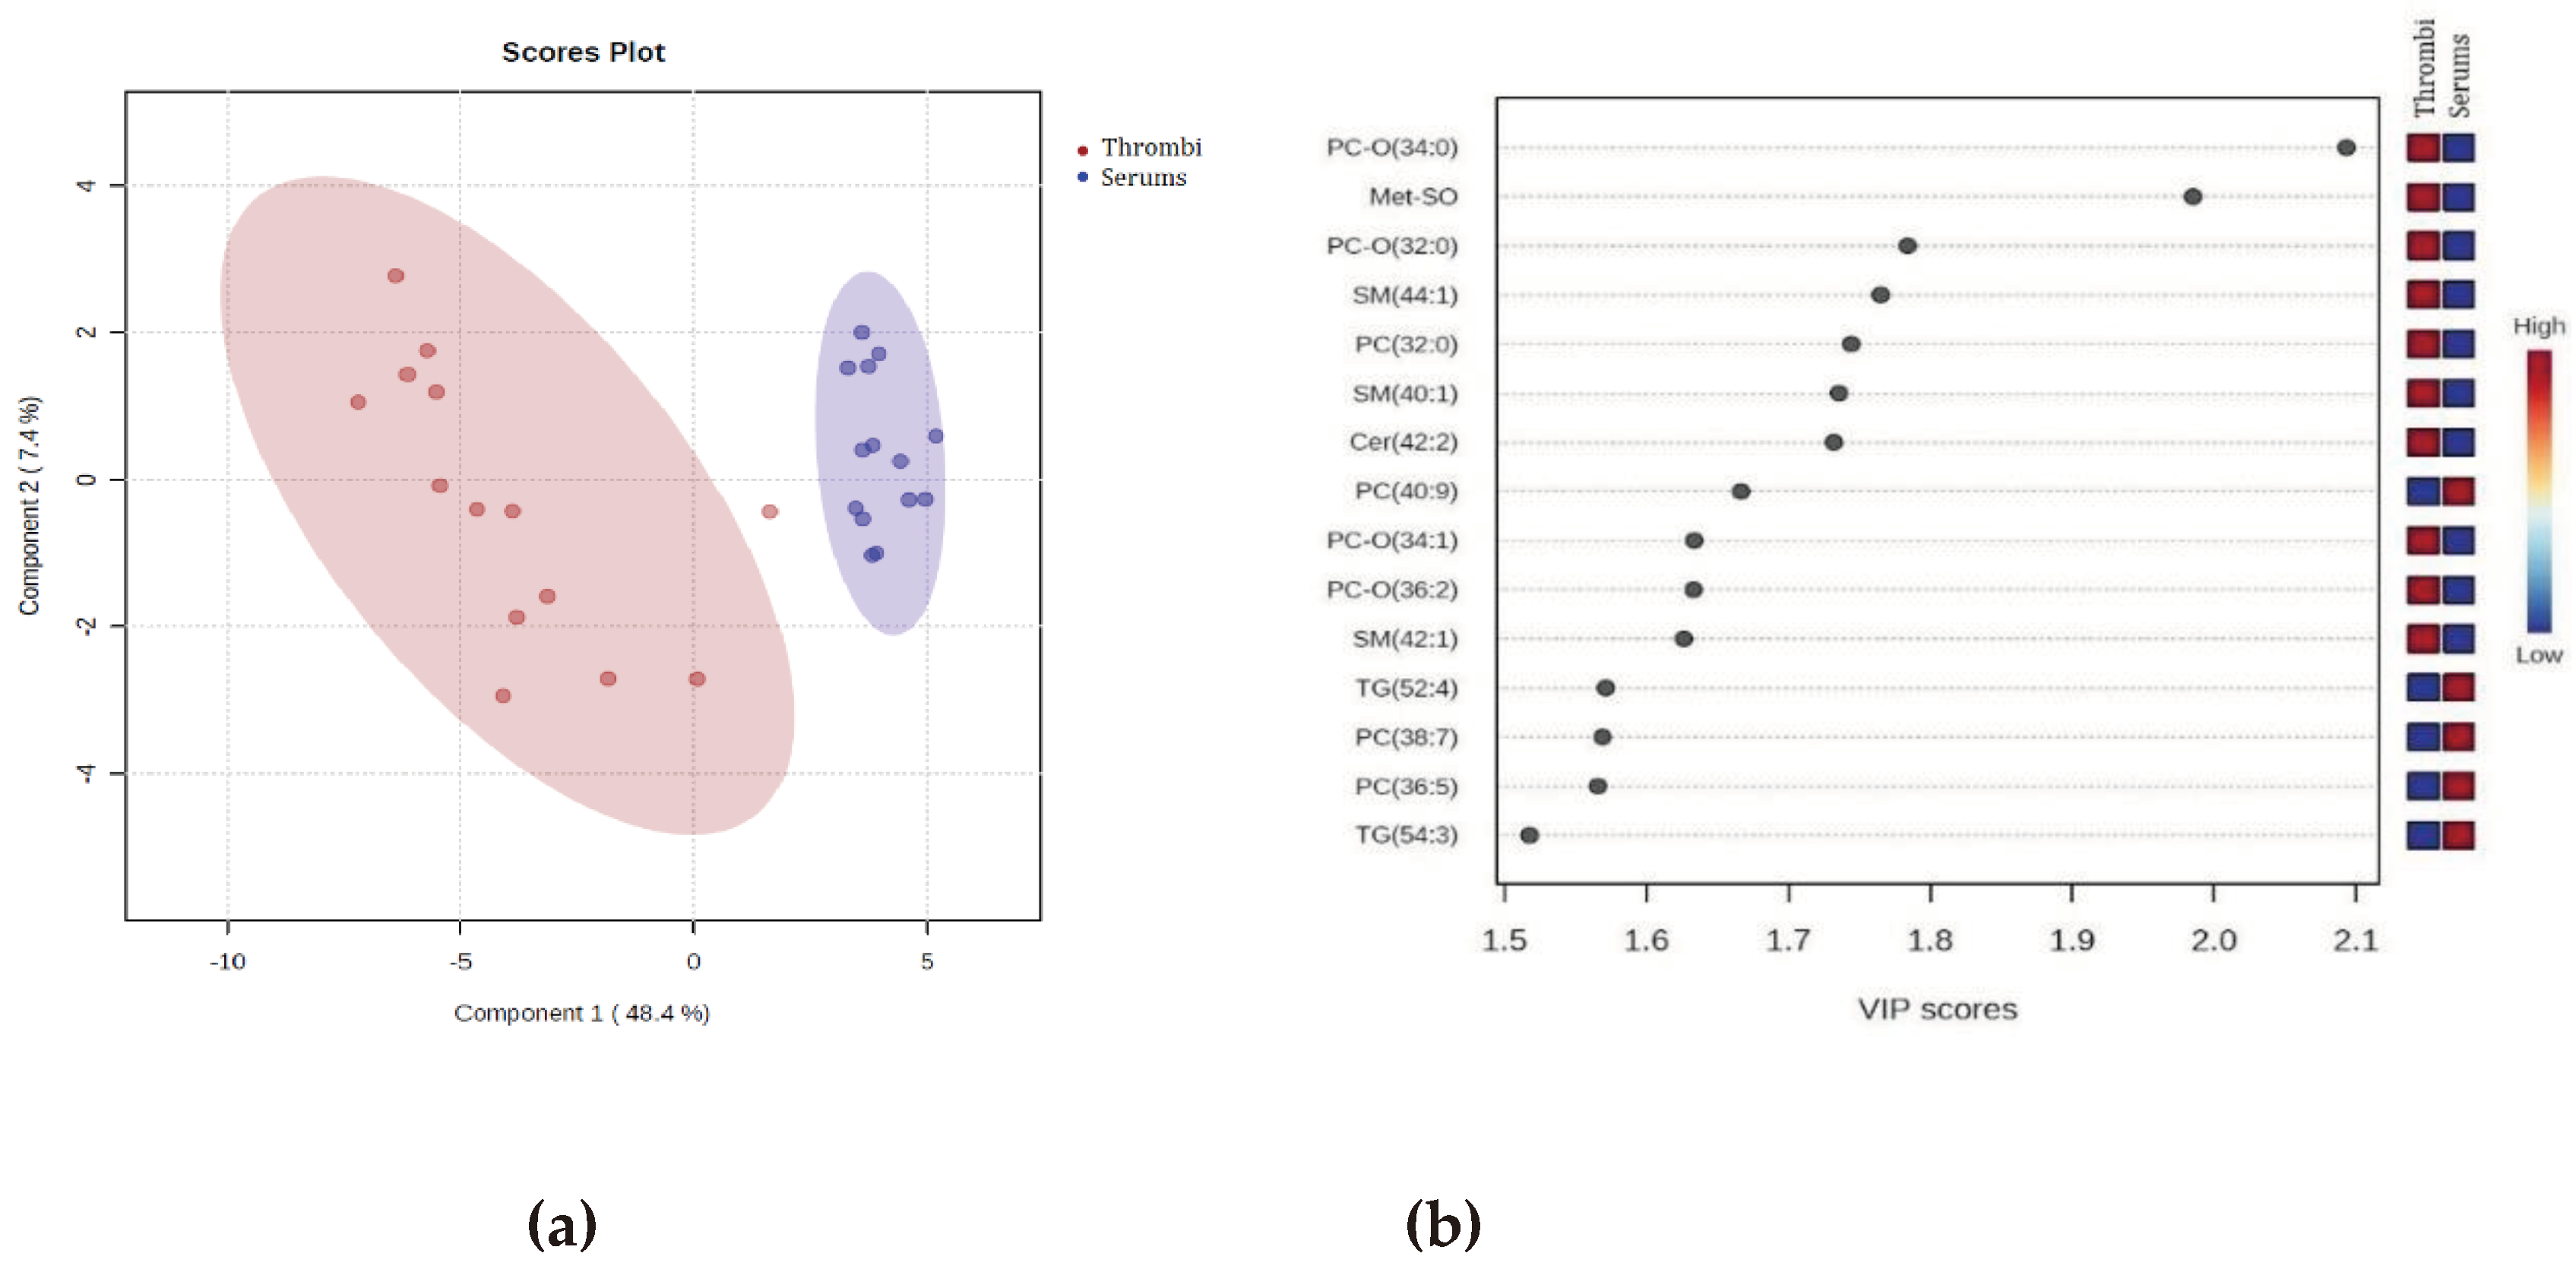
3.2.2. Comparison of patient stroke thrombi versus patient serum
4. Discussion
4.1. Study Limitations
5. Conclusions
Supplementary Materials
Author Contributions
Funding
Institutional Review Board Statement
Informed Consent Statement
Data Availability Statement
Acknowledgments
Conflicts of Interest
References
- Feigin, V.L.; Brainin, M.; Norrving, B.; Martins, S.; Sacco, R.L.; Hacke, W.; Fisher, M.; Pandian, J.; Lindsay, P. World Stroke Organization (WSO): Global Stroke Fact Sheet 2022. Int. J. Stroke 2022, 17, 18–29. [Google Scholar] [CrossRef] [PubMed]
- Gorelick, P.B. The Global Burden of Stroke: Persistent and Disabling. Lancet. Neurol. 2019, 18, 417–418. [Google Scholar] [CrossRef] [PubMed]
- Herpich, F.; Rincon, F. Management of Acute Ischemic Stroke. Crit. Care Med. 2020, 48, 1654. [Google Scholar] [CrossRef] [PubMed]
- Raha, O.; Hall, C.; Malik, A.; D’Anna, L.; Lobotesis, K.; Kwan, J.; Banerjee, S. Advances in Mechanical Thrombectomy for Acute Ischaemic Stroke. BMJ Med. 2023, 2, e000407. [Google Scholar] [CrossRef] [PubMed]
- Meretoja, A.; Keshtkaran, M.; Saver, J.L.; Tatlisumak, T.; Parsons, M.W.; Kaste, M.; Davis, S.M.; Donnan, G.A.; Churilov, L. Stroke Thrombolysis: Save a Minute, Save a Day. Stroke 2014, 45, 1053–1058. [Google Scholar] [CrossRef] [PubMed]
- Han, T.S.; Gulli, G.; Fry, C.H.; Affley, B.; Robin, J.; Fluck, D.; Kakar, P.; Sharma, P. Adverse Consequences of Immediate Thrombolysis-Related Complications: A Multi-Centre Registry-Based Cohort Study of Acute Stroke. J. Thromb. Thrombolysis 2022, 53, 218. [Google Scholar] [CrossRef]
- Jolugbo, P.; Ariëns, R.A.S. Thrombus Composition and Efficacy of Thrombolysis and Thrombectomy in Acute Ischemic Stroke. Stroke 2021, 52, 1131–1142. [Google Scholar] [CrossRef] [PubMed]
- Jacob, M.; Lopata, A.L.; Dasouki, M.; Abdel Rahman, A.M. Metabolomics toward Personalized Medicine. Mass Spectrom. Rev. 2019, 38, 221–238. [Google Scholar] [CrossRef]
- Lee, Y.; Khan, A.; Hong, S.; Jee, S.H.; Park, Y.H. A Metabolomic Study on High-Risk Stroke Patients Determines Low Levels of Serum Lysine Metabolites: A Retrospective Cohort Study. Mol. Biosyst. 2017, 13, 1109–1120. [Google Scholar] [CrossRef]
- Costamagna, G.; Bonato, S.; Corti, S.; Meneri, M. Advancing Stroke Research on Cerebral Thrombi with Omic Technologies. Int. J. Mol. Sci. 2023, 24. [Google Scholar] [CrossRef]
- Khan, A.; Shin, M.S.; Jee, S.H.; Park, Y.H. Global Metabolomics Analysis of Serum from Humans at Risk of Thrombotic Stroke. Analyst 2020, 145, 1695–1705. [Google Scholar] [CrossRef]
- Sun, D.; Tiedt, S.; Yu, B.; Jian, X.; Gottesman, R.F.; Mosley, T.H.; Boerwinkle, E.; Dichgans, M.; Fornage, M. A Prospective Study of Serum Metabolites and Risk of Ischemic Stroke. Neurology 2019, 92, E1890–E1898. [Google Scholar] [CrossRef]
- Tao, S.; Xiao, X.; Li, X.; Na, F.; Na, G.; Wang, S.; Zhang, P.; Hao, F.; Zhao, P.; Guo, D.; et al. Targeted Metabolomics Reveals Serum Changes of Amino Acids in Mild to Moderate Ischemic Stroke and Stroke Mimics. Front. Neurol. 2023, 14, 1153193. [Google Scholar] [CrossRef]
- Li, W.; Shao, C.; Li, C.; Zhou, H.; Yu, L.; Yang, J.; Wan, H.; He, Y. Metabolomics: A Useful Tool for Ischemic Stroke Research. J. Pharm. Anal. 2023, 13, 968–983. [Google Scholar] [CrossRef]
- Chumachenko, M.S.; Waseem, T. V; Fedorovich, S. V Metabolomics and Metabolites in Ischemic Stroke. 33. [CrossRef]
- Daneman, R. The Blood–Brain Barrier in Health and Disease. Ann. Neurol. 2012, 72, 648–672. [Google Scholar] [CrossRef]
- Suissa, L.; Guigonis, J.M.; Graslin, F.; Doche, E.; Osman, O.; Chau, Y.; Sedat, J.; Lindenthal, S.; Pourcher, T. Metabolome of Cerebral Thrombi Reveals an Association between High Glycemia at Stroke Onset and Good Clinical Outcome. Metab. 2020, Vol. 10, Page 483 2020, 10, 483. [Google Scholar] [CrossRef]
- Martha, S.R.; Levy, S.H.; Federico, E.; Levitt, M.R.; Walker, M. Machine Learning Analysis of the Cerebrovascular Thrombi Lipidome in Acute Ischemic Stroke. J. Neurosci. Nurs. 2023, 55, 10–17. [Google Scholar] [CrossRef]
- Turc, G.; Bhogal, P.; Fischer, U.; Khatri, P.; Lobotesis, K.; Mazighi, M.; Schellinger, P.D.; Toni, D.; de Vries, J.; White, P.; et al. European Stroke Organisation (ESO) – European Society for Minimally Neurological Therapy (ESMINT) Guidelines on Mechanical Thrombectomy inAcute Ischaemic StrokeEndorsed by Stroke Alliance for Europe(SAFE). Eur. Stroke J. 2019, 4, 6. [Google Scholar] [CrossRef]
- Berge, E.; Whiteley, W.; Audebert, H.; Marchis, G.M. De; Fonseca, A.C.; Padiglioni, C.; Ossa, N.P. de la; Strbian, D.; Tsivgoulis, G.; Turc, G. European Stroke Organisation (ESO) Guidelines on Intravenous for Acute Ischaemic Stroke. Eur. Stroke J. 2021, 6, I. [Google Scholar] [CrossRef]
- Turc, G.; Tsivgoulis, G.; Audebert, H.J.; Boogaarts, H.; Bhogal, P.; De Marchis, G.M.; Fonseca, A.C.; Khatri, P.; Mazighi, M.; Pérez de la Ossa, N.; et al. European Stroke Organisation – European Society for Minimally Invasive Neurological Therapy Expedited Recommendation on Indication for Intravenous Thrombolysis before Mechanical Thrombectomy in Patients with Acute Ischaemic Stroke and Anterior Circulation Large Vessel Occlusion. Eur. Stroke J. 2022, 7, I. [Google Scholar] [CrossRef]
- Adams, H.P.; Bendixen, B.H.; Kappelle, L.J.; Biller, J.; Love, B.B.; Gordon, D.L.; Marsh, E.E. Classification of Subtype of Acute Ischemic Stroke. Definitions for Use in a Multicenter Clinical Trial. TOAST. Trial of Org 10172 in Acute Stroke Treatment. Stroke 1993, 24, 35–41. [Google Scholar] [CrossRef]
- Hrvatska komora medicinskih biokemičara Priručnik o Preporučenim Metodama u Medicinsko-Biokemijskim Laboratorijima; HKMB: Zagreb, 1998; (Croatian chamber of medical biochemists: Manual on Suggested Methods in Medical-Biochemical Laboratories, HKMB, Zagreb, 1998; Publisher HKMB, Zagreb).
- Friedewald, W.T.; Levy, R.I.; Fredrickson, D.S. Estimation of the Concentration of Low-Density Lipoprotein Cholesterol in Plasma, without Use of the Preparative Ultracentrifuge. Clin. Chem. 1972, 18, 499–502. [Google Scholar] [CrossRef]
- Rubić, I.; Burchmore, R.; Weidt, S.; Regnault, C.; Kuleš, J.; Rafaj, R.B.; Mašek, T.; Horvatić, A.; Crnogaj, M.; Eckersall, P.D.; et al. Multi Platforms Strategies and Metabolomics Approaches for the Investigation of Comprehensive Metabolite Profile in Dogs with Babesia Canis Infection. Int. J. Mol. Sci. 2022, 23, 1575. [Google Scholar] [CrossRef]
- Brouns, R.; De Deyn, P.P. The Complexity of Neurobiological Processes in Acute Ischemic Stroke. Clin. Neurol. Neurosurg. 2009, 111, 483–495. [Google Scholar] [CrossRef]
- Sidorov, E.; Sanghera, D.K.; Vanamala, J.K.P. Biomarker for Ischemic Stroke Using Metabolome: A Clinician Perspective. J. Stroke 2019, 21, 31. [Google Scholar] [CrossRef]
- Aliprandi, A.; Longoni, M.; Stanzani, L.; Tremolizzo, L.; Vaccaro, M.; Begni, B.; Galimberti, G.; Garofolo, R.; Ferrarese, C. Increased Plasma Glutamate in Stroke Patients Might Be Linked to Altered Platelet Release and Uptake. J. Cereb. Blood Flow Metab. 2005, 25, 513–519. [Google Scholar] [CrossRef]
- Ishizaki, F. A Follow-up Study of Platelet-Rich Plasma Serotonin in Clinical Subtypes of Cerebral Infarction. J. Neural Transm. 1987, 69, 123–129. [Google Scholar] [CrossRef]
- Ban, Y.; Watanabe, T.; Miyazaki, A.; Nakano, Y.; Tobe, T.; Idei, T.; Iguchi, T.; Ban, Y.; Katagiri, T. Impact of Increased Plasma Serotonin Levels and Carotid Atherosclerosis on Vascular Dementia. Atherosclerosis 2007, 195, 153–159. [Google Scholar] [CrossRef]
- Golimbet, V.E.; Brusov, O.S.; Faktor, M.I.; Zlobina, G.P.; Lezheiko, T. V.; Lavrushina, O.M.; Petrova, E.A.; Savina, M.A.; Skvortsova, V.I. Effects of the Interaction of Variants of the Serotonin Transporter and Brain-Derived Neurotrophic Factor on Platelet Serotonin Levels in Stroke Patients. Neurosci. Behav. Physiol. 2011, 41, 554–557. [Google Scholar] [CrossRef]
- Berger, M.; Gray, J.A.; Roth, B.L. The Expanded Biology of Serotonin. Annu. Rev. Med. 2009; 60, 355–366. [Google Scholar] [CrossRef]
- de Abajo, F.J. Effects of Selective Serotonin Reuptake Inhibitors on Platelet Function. Drugs Aging 2011, 28, 345–367. [Google Scholar] [CrossRef]
- Nogueira, R.G.; Qureshi, M.M.; Abdalkader, M.; Martins, S.O.; Yamagami, H.; Qiu, Z.; Mansour, O.Y.; Sathya, A.; Czlonkowska, A.; Tsivgoulis, G.; et al. Global Impact of COVID-19 on Stroke Care and IV Thrombolysis. Neurology 2021, 96, E2824–E2838. [Google Scholar] [CrossRef] [PubMed]
- Miedema, I.; Horvath, K.M.; Uyttenboogaart, M.; Koopman, K.; Lahr, M.M.H.; De Keyser, J.; Luijckx, G.J. Effect of Selective Serotonin Re-Uptake Inhibitors (SSRIs) on Functional Outcome in Patients with Acute Ischemic Stroke Treated with TPA. J. Neurol. Sci. 2010, 293, 65–67. [Google Scholar] [CrossRef] [PubMed]
- Gao, J.; Yang, H.; Chen, J.; Fang, J.; Chen, C.; Liang, R.; Yang, G.; Wu, H.; Wu, C.; Li, S. Analysis of Serum Metabolites for the Discovery of Amino Acid Biomarkers and the Effect of Galangin on Cerebral Ischemia. Mol. Biosyst. 2013, 9, 2311–2321. [Google Scholar] [CrossRef] [PubMed]
- Cigdem, B.; Bolayir, A.; Celik, V.K.; Kapancik, S.; Kilicgun, H.; Gokce, S.F.; Gulunay, A. The Role of Reduced Polyamine Synthesis in Ischemic Stroke. Neurochem. J. 2020, 14, 243–250. [Google Scholar] [CrossRef]
- Das, A.; Fröhlich, D.; Achanta, L.B.; Rowlands, B.D.; Housley, G.D.; Klugmann, M.; Rae, C.D. L-Aspartate, L-Ornithine and L-Ornithine-L-Aspartate (LOLA) and Their Impact on Brain Energy Metabolism. Neurochem. Res. 2020, 45, 1438–1450. [Google Scholar] [CrossRef] [PubMed]
- Balasubramanian, R.; Hu, J.; Guasch-Ferre, M.; Li, J.; Sorond, F.; Zhao, Y.; Shutta, K.H.; Salas-Salvado, J.; Hu, F.; Clish, C.B.; et al. Metabolomic Profiles Associated With Incident Ischemic Stroke. Neurology 2022, 98, e483–e492. [Google Scholar] [CrossRef] [PubMed]
- Djite, M.; Chao de la Barca, J.M.; Bocca, C.; Gaye, N.M.; Barry, N.O.; Mbacke, M.N.; Cissé, O.; Kandji, P.M.; Thioune, N.M.; Coly-Gueye, N.F.; et al. A Metabolomic Signature of Ischemic Stroke Showing Acute Oxidative and Energetic Stress. Antioxidants 2024, 13, 60. [Google Scholar] [CrossRef] [PubMed]
- Yong, M.; Kaste, M. Dynamic of Hyperglycemia as a Predictor of Stroke Outcome in the ECASS-II Trial. Stroke 2008, 39, 2749–2755. [Google Scholar] [CrossRef]
- Hafez, S.; Coucha, M.; Bruno, A.; Fagan, S.C.; Ergul, A. Hyperglycemia, Acute Ischemic Stroke, and Thrombolytic Therapy. Transl. Stroke Res. 2014, 5, 442–453. [Google Scholar] [CrossRef]
- Robbins, N.M.; Swanson, R.A. Opposing Effects of Glucose on Stroke and Reperfusion Injury. Stroke 2014, 45, 1881–1886. [Google Scholar] [CrossRef]
- Han, X.; Holtzman, D.M.; McKeel, D.W. Plasmalogen Deficiency in Early Alzheimer’s Disease Subjects and in Animal Models: Molecular Characterization Using Electrospray Ionization Mass Spectrometry. J. Neurochem. 2001, 77, 1168–1180. [Google Scholar] [CrossRef] [PubMed]
- Udagawa, J.; Hino, K. Plasmalogen in the Brain: Effects on Cognitive Functions and Behaviors Attributable to Its Properties. Brain Res. Bull. 2022, 188, 197–202. [Google Scholar] [CrossRef] [PubMed]
- Sagaro, G.G.; Amenta, F. Choline-Containing Phospholipids in Stroke Treatment: A Systematic Review and Meta-Analysis. J. Clin. Med. 2023, 12, 2875. [Google Scholar] [CrossRef]
- Holmes, M. V.; Millwood, I.Y.; Kartsonaki, C.; Hill, M.R.; Bennett, D.A.; Boxall, R.; Guo, Y.; Xu, X.; Bian, Z.; Hu, R.; et al. Lipids, Lipoproteins, and Metabolites and Risk of Myocardial Infarction and Stroke. J. Am. Coll. Cardiol. 2018, 71, 620–632. [Google Scholar] [CrossRef]
- Purroy, F.; Ois, A.; Jove, M.; Arque, G.; Sol, J.; Mauri-Capdevila, G.; Rodriguez-Campello, A.; Pamplona, R.; Portero, M.; Roquer, J. Lipidomic Signature of Stroke Recurrence after Transient Ischemic Attack. Sci. Rep. 2023, 13, 13706. [Google Scholar] [CrossRef]
- Zhang, H.; Hu, Y.Y.; Murong, S.X.; Tong, E.T.; Dhodda, V.K.; Sailor, K.; Dempsey, R.J.; Vemuganti, R.L.R. Sphingolipids in Rat Model of Transient Focal Cerebral Ischemia: Implication for Stroke Injury. J. Neurochem. 2002, 81, 108–111. [Google Scholar] [CrossRef]
- Grösch, S.; Alessenko, A. V.; Albi, E. The Many Facets of Sphingolipids in the Specific Phases of Acute Inflammatory Response. Mediators Inflamm. 2018, 2018. [Google Scholar] [CrossRef]
- Simon, C.G.; Chatterjee, S.; Gear, A.R.L. Sphingomyelinase Activity in Human Platelets. Thromb. Res. 1998, 90, 155–161. [Google Scholar] [CrossRef]
- Romiti, E.; Vasta, V.; Meacci, E.; Farnararo, M.; Linke, T.; Ferlinz, K.; Sandhoff, K.; Bruni, P. Characterization of Sphingomyelinase Activity Released by Thrombin-Stimulated Platelets. Mol. Cell. Biochem. 2000, 205, 75–81. [Google Scholar] [CrossRef]
- Buciuc, M.; Vasile, V.C.; Conte, G.M.; Scharf, E.L. Ceramide Dynamics and Prognostic Value in Acute and Subacute Ischemic Stroke: Preliminary Findings in a Clinical Cohort. J. Neurol. Res. 2020, 10, 209–219. [Google Scholar] [CrossRef]
- Tian, H.P.; Qiu, T.Z.; Zhao, J.; Li, L.X.; Guo, J. Sphingomyelinase-Induced Ceramide Production Stimulate Calcium-Independent JNK and PP2A Activation Following Cerebral Ischemia. Brain Inj. 2009, 23, 1073–1080. [Google Scholar] [CrossRef]
- Gui, Y. kun; Li, Q.; Liu, L.; Zeng, P.; Ren, R.F.; Guo, Z.F.; Wang, G.H.; Song, J.G.; Zhang, P. Plasma Levels of Ceramides Relate to Ischemic Stroke Risk and Clinical Severity. Brain Res. Bull. 2020, 158, 122–127. [Google Scholar] [CrossRef]
- Lee, T.H.; Cheng, C.N.; Lee, C.W.; Kuo, C.H.; Tang, S.C.; Jeng, J.S. Investigating Sphingolipids as Biomarkers for the Outcomes of Acute Ischemic Stroke Patients Receiving Endovascular Treatment. J. Formos. Med. Assoc. 2023, 122, 19–28. [Google Scholar] [CrossRef] [PubMed]
- McGurk, K.A.; Keavney, B.D.; Nicolaou, A. Circulating Ceramides as Biomarkers of Cardiovascular Disease: Evidence from Phenotypic and Genomic Studies. Atherosclerosis 2021, 327, 18–30. [Google Scholar] [CrossRef]
- Yu, Z.F.; Nikolova-Karakashian, M.; Zhou, D.; Cheng, G.; Schuchman, E.H.; Mattson, M.P. Pivotal Role for Acidic Sphingomyelinase in Cerebral Ischemia-Induced Ceramide and Cytokine Production, and Neuronal Apoptosis. J. Mol. Neurosci. 2000, 15, 85–97. [Google Scholar] [CrossRef] [PubMed]
- Mohamud Yusuf, A.; Hagemann, N.; Hermann, D.M. The Acid Sphingomyelinase/ Ceramide System as Target for Ischemic Stroke Therapies. Neurosignals. 2019, 27, 32–43. [Google Scholar] [CrossRef]
- Xue, J.; Yu, Y.; Zhang, X.; Zhang, C.; Zhao, Y.; Liu, B.; Zhang, L.; Wang, L.; Chen, R.; Gao, X.; et al. Sphingomyelin Synthase 2 Inhibition Ameliorates Cerebral Ischemic Reperfusion Injury Through Reducing the Recruitment of Toll-Like Receptor 4 to Lipid Rafts. J. Am. Heart Assoc. 2019, 8. [Google Scholar] [CrossRef]
- Floegel, A.; Kühn, T.; Sookthai, D.; Johnson, T.; Prehn, C.; Rolle-Kampczyk, U.; Otto, W.; Weikert, C.; Illig, T.; von Bergen, M.; et al. Serum Metabolites and Risk of Myocardial Infarction and Ischemic Stroke: A Targeted Metabolomic Approach in Two German Prospective Cohorts. Eur. J. Epidemiol. 2018, 33, 55–66. [Google Scholar] [CrossRef] [PubMed]
- Yang, Z.; Deng, X.; Zhu, J.; Chen, S.; Jiao, C.; Ruan, Y. The Identification of Novel Stroke-Related Sphingolipid Biomarkers Using UPLC-MS/MS. Clin. Chim. Acta 2024, 552, 117652. [Google Scholar] [CrossRef]
- Azizkhanian, I.; Sheth, S.A.; Iavarone, A.T.; Lee, S.; Kakarla, V.; Hinman, J.D. Plasma Lipid Profiling Identifies Biomarkers of Cerebral Microvascular Disease. Front. Neurol. 2019, 10, 474611. [Google Scholar] [CrossRef]
- Lind, L.; Salihovic, S.; Ganna, A.; Sundström, J.; Broeckling, C.D.; Magnusson, P.K.; Pedersen, N.L.; Siegbahn, A.; Prenni, J.; Fall, T.; et al. A Multi-Cohort Metabolomics Analysis Discloses Sphingomyelin (32:1) Levels to Be Inversely Related to Incident Ischemic Stroke. J. Stroke Cerebrovasc. Dis. 2020, 29. [Google Scholar] [CrossRef] [PubMed]
| Stroke thrombi samples |
Mass/mg | Volume of isopropanol / μL |
|---|---|---|
| 1. | 27.1 | 81.3 |
| 2. | 27.8 | 83.4 |
| 3. | 30.8 | 92.4 |
| 4. | 71.0 | 213.0 |
| 5. | 56.5 | 169.5 |
| 6. | 20.8 | 62.4 |
| 7. | 32.8 | 98.4 |
| 8. | 29.3 | 87.9 |
| 9. | 37.0 | 111.0 |
| 10. | 20.8 | 62.4 |
| 11. | 52.2 | 156.6 |
| 12. | 13.3 | 39.9 |
| 13. | 20.7 | 62.1 |
| 14. | 30.9 | 92.7 |
| Patient | Control | p-value | |
|---|---|---|---|
| Age | 70.36±12.82 | 52.29±15.09 | 0.002 |
| Sex M/F | 8/6 | 8/6 | |
| BMI (kg/m2) | 26.34±4.07 | 23.79±5.35 | 0.192 |
| DBP (mmHg) | 79.71±9.21 | 83.79±14.46 | 0.382 |
| SBP (mmHg) | 146.43±16.70 | 135.50±14.31 | 0.074 |
| TG (mmol/L) | 1.51±0.47 | 1.49±0.73 | 0.907 |
| tCH (mmol/L) | 5.17±0.67 | 5.11±1.10 | 0.874 |
| LDL-CH (mmol/L) | 3.07±1.16 | 3.09±1.08 | 0.962 |
| HDL-CH (mmol/L) | 1.02±0.19 | 1.22±0.37 | 0.079 |
| Glucose (mmol/L) | 8.12±1.26 | 5.73±0.85 | <0.0001 |
| PV | 0.91±0.17 | 0.98±0.14 | 0.251 |
| aPTT | 24.37±1.79 | 23.79±2.48 | 0.485 |
| INR | 1.07±0.10 | 1.04±0.06 | 0.464 |
Disclaimer/Publisher’s Note: The statements, opinions and data contained in all publications are solely those of the individual author(s) and contributor(s) and not of MDPI and/or the editor(s). MDPI and/or the editor(s) disclaim responsibility for any injury to people or property resulting from any ideas, methods, instructions or products referred to in the content. |
© 2024 by the authors. Licensee MDPI, Basel, Switzerland. This article is an open access article distributed under the terms and conditions of the Creative Commons Attribution (CC BY) license (http://creativecommons.org/licenses/by/4.0/).


