1. Introduction
The carotid sinus, located at the commencement of the internal carotid artery, is characterized by a slightly thinner vascular wall and an expanded lumen. This anatomical feature induces blood flow separation near the vessel wall and vortex formation, resulting in a region of low oscillatory Wall Shear Stress (WSS). Extensive research [
1,
2,
3,
4,
5,
6,
7,
8,
9] indicates that such low oscillatory WSS can cause arterial endothelial damage and dysfunction, promoting platelet aggregation and the release of growth factors. These processes facilitate the migration of smooth muscle cells from the arterial wall’s medial layer to the intima, where they proliferate. This migration and proliferation lead to the accumulation of cells, contributing to the formation of atherosclerotic plaques and ultimately leading to carotid artery stenosis. When stenosis progresses to occlusion, reduced blood flow can cause cerebral ischemia, leading to prolonged brain hypoperfusion and ischemia, which in turn may result in brain atrophy, cognitive decline [
10], neurological dysfunction [
11], and reduced cerebrovascular reactivity [
12]. Hence, low oscillatory WSS-induced endothelial dysfunction in the carotid sinus is a critical initiating factor in these pathologies.
Understanding the pivotal role of low oscillatory WSS in atherosclerosis development and progression, as well as investigating the relationship between low oscillatory WSS and endothelial dysfunction, including its mechanobiological mechanisms, is at the forefront of cardiovascular biomechanics research [
13,
14,
15]. While animal models and human clinical trials offer direct research approaches, they are influenced by various physiological factors such as respiration and neural activity. Moreover, these methods face challenges like significant individual variability, high costs, extended observation periods, and ethical concerns. In vitro models that simulate endothelial WSS waveforms offer an alternative, free from these physiological influences, and allow for a focused quantitative exploration of the relationship between low oscillatory WSS and endothelial dysfunction and their underlying mechanobiological mechanisms [
16].
Parallel-plate flow chamber systems were among the first methodologies for simulating the fluid shear stress microenvironment in vitro to construct endothelial cell culture models. Chiu et al. [
17] pioneered the use of a parallel-plate flow chamber with a stepped structure for examining endothelial cells’ mechanobiological responses under oscillatory WSS. Subsequently, researchers have employed such chambers with varied structures and dimensions to investigate the impact of low oscillatory WSS on aspects like endothelial cell signal transduction, gene expression, and structural and functional changes [
18,
19], as well as the differentiation of endothelial progenitor cells [
20]. More recently, Wang et al. [
21,
22]developed an endothelial cell culture model that simulates the WSS waveform of oscillatory flow in the common carotid artery post-exercise, exploring the mechanobiological effects and mechanisms triggered by exercise-induced oscillatory WSS.
Despite their utility, these systems for simulating oscillatory WSS typically suffer from limitations such as large size and high manufacturing costs. With the advancement of micro- and nano-manufacturing and microfluidic technologies, researchers have devised various microfluidic chip systems for simulating oscillatory flow WSS, enabling in vitro studies of endothelial cell mechanobiology [
23,
24,
25,
26]. These microfluidic systems offer advantages over parallel-plate flow chambers in terms of reduced size and cost [
27,
28,
29,
30]. However, most of these in vitro models have only qualitatively and coarsely represented the characteristics of oscillatory WSS waveforms, failing to precisely depict the oscillatory flow WSS features at arterial bifurcations and bends. A particular challenge has been the simultaneous representation of both the low oscillatory WSS waveform in the carotid sinus and the high pulsatile flow WSS waveform in the downstream uniform arterial segments within a single endothelial cell culture model.
This study aims to design a microfluidic chip system with a variable cross-section and a stepped structure to concurrently reproduce both the low oscillatory WSS in the carotid sinus and the high pulsatile flow WSS waveforms in the downstream uniform arterial segments. The approach involves designing a stepped, variable cross-section microfluidic channel; simplifying the three-dimensional (3D) fluid dynamics problem into a two-dimensional (2D) Computational Fluid Dynamics (CFD) model, considering the channel’s significantly smaller height compared to its length and width; and finally, using 2D CFD simulations to quantitatively analyze the impact of the microfluidic channel’s step height and width on the oscillatory flow WSS waveforms, leading to the optimization of the channel’s structure and dimensions.
2. Materials and Methods
2.1. Design of the Variable Cross-section Microfluidic Channel
To effectively replicate both the low oscillatory WSS at the carotid sinus and the high mean pulsatile flow WSS waveform in the downstream uniform arterial segments, a variable cross-section microfluidic channel structure was developed based on principles of fluid dynamics and microfluidic chip technology. As illustrated in
Figure 1(a), this channel primarily comprises a stepped variable cross-section flow chamber and circular inlets and outlets with radius R. The stepped flow chamber is divided into two sections: (I) a narrower rectangular area at the front and (II) a wider rectangular area at the rear. The stepped design in the height direction of the narrower section (I) generates vortices near its rear, simulating the low oscillatory flow WSS waveform at the carotid bifurcation’s sinus [
31,
32]. The wider rear section (II) exhibits laminar flow, suitable for modeling the laminar WSS in the uniform part of the carotid bifurcation. By adjusting the height of the step in region (I) relative to the width of region (II), a precise simulation of both low oscillatory WSS and high pulsatile flow WSS waveforms in the downstream uniform arterial segment is achieved.
2.2. Governing Equations of Flow in the Microchannel
Assuming that the fluid within the microfluidic channel is an incompressible Newtonian fluid, its flow adheres to the Navier-Stokes equation
and the continuity equation
where
represents the fluid velocity, μ denotes the fluid viscosity, and
ρ signifies the liquid density.
Assuming a uniformly distributed velocity profile at the inlet, the boundary conditions are established as
Where is the inlet velocity, Q(t) represents the volumetric flow rate of fluid entering the inlet, is the unit vector along the y-axis in the Cartesian coordinate system, is the velocity at the channel wall, and p0 is the pressure at the outlet.
Obtaining analytical solutions for equations (1) and (2) is typically challenging, so three-dimensional CFD numerical simulation is generally employed. Given that the height (h
1 and h
2) of the microchannel structure in this study is considerably smaller than its width (b
1 and b
2) and length (L
1 and L
2), the influence of side boundaries on fluid flow can be neglected in the microfluidic channel far from the inlet and outlet. Therefore, the 3D flow model is simplified to a 2D model on the oxy plane (as shown in
Figure 1(c)). In the rectangular coordinate system oxy, equations (1) and (2) are simplified to
where
u and
v are the flow speeds in the x-direction and y-direction, respectively.
The corresponding boundary conditions are adapted as
Despite the simplification, obtaining analytical solutions for equations (4) to (6) remains complex. Consequently, this study employs 2D CFD numerical simulation to resolve the flow field.
Upon determining the flow field velocity distribution through numerical simulations, the formula for calculating the WSS at the bottom of the microfluidic channel is given by
Specifically, in the wider uniform rectangular channel section (II), disregarding the effects of the front variable cross-section section, side, and outlet boundaries, the flow is treated as a 2D problem between infinitely large microchannels, further simplifying equations (5) to (7) to
Here,
p represents the pressure, with the boundary conditions further simplified to
Under quasi-steady flow conditions, the formula for calculating the WSS at the bottom of the uniform section in the wider rectangular area (II) is [
33]
In this formula, Q(t) is the volumetric flow rate entering the microfluidic channel, and b2 and h2 respectively represent the width and height of the wider rectangular channel in the latter part of the microchannel.
2.3. Carotid Bifurcation Blood Flow WSS Waveform Extraction
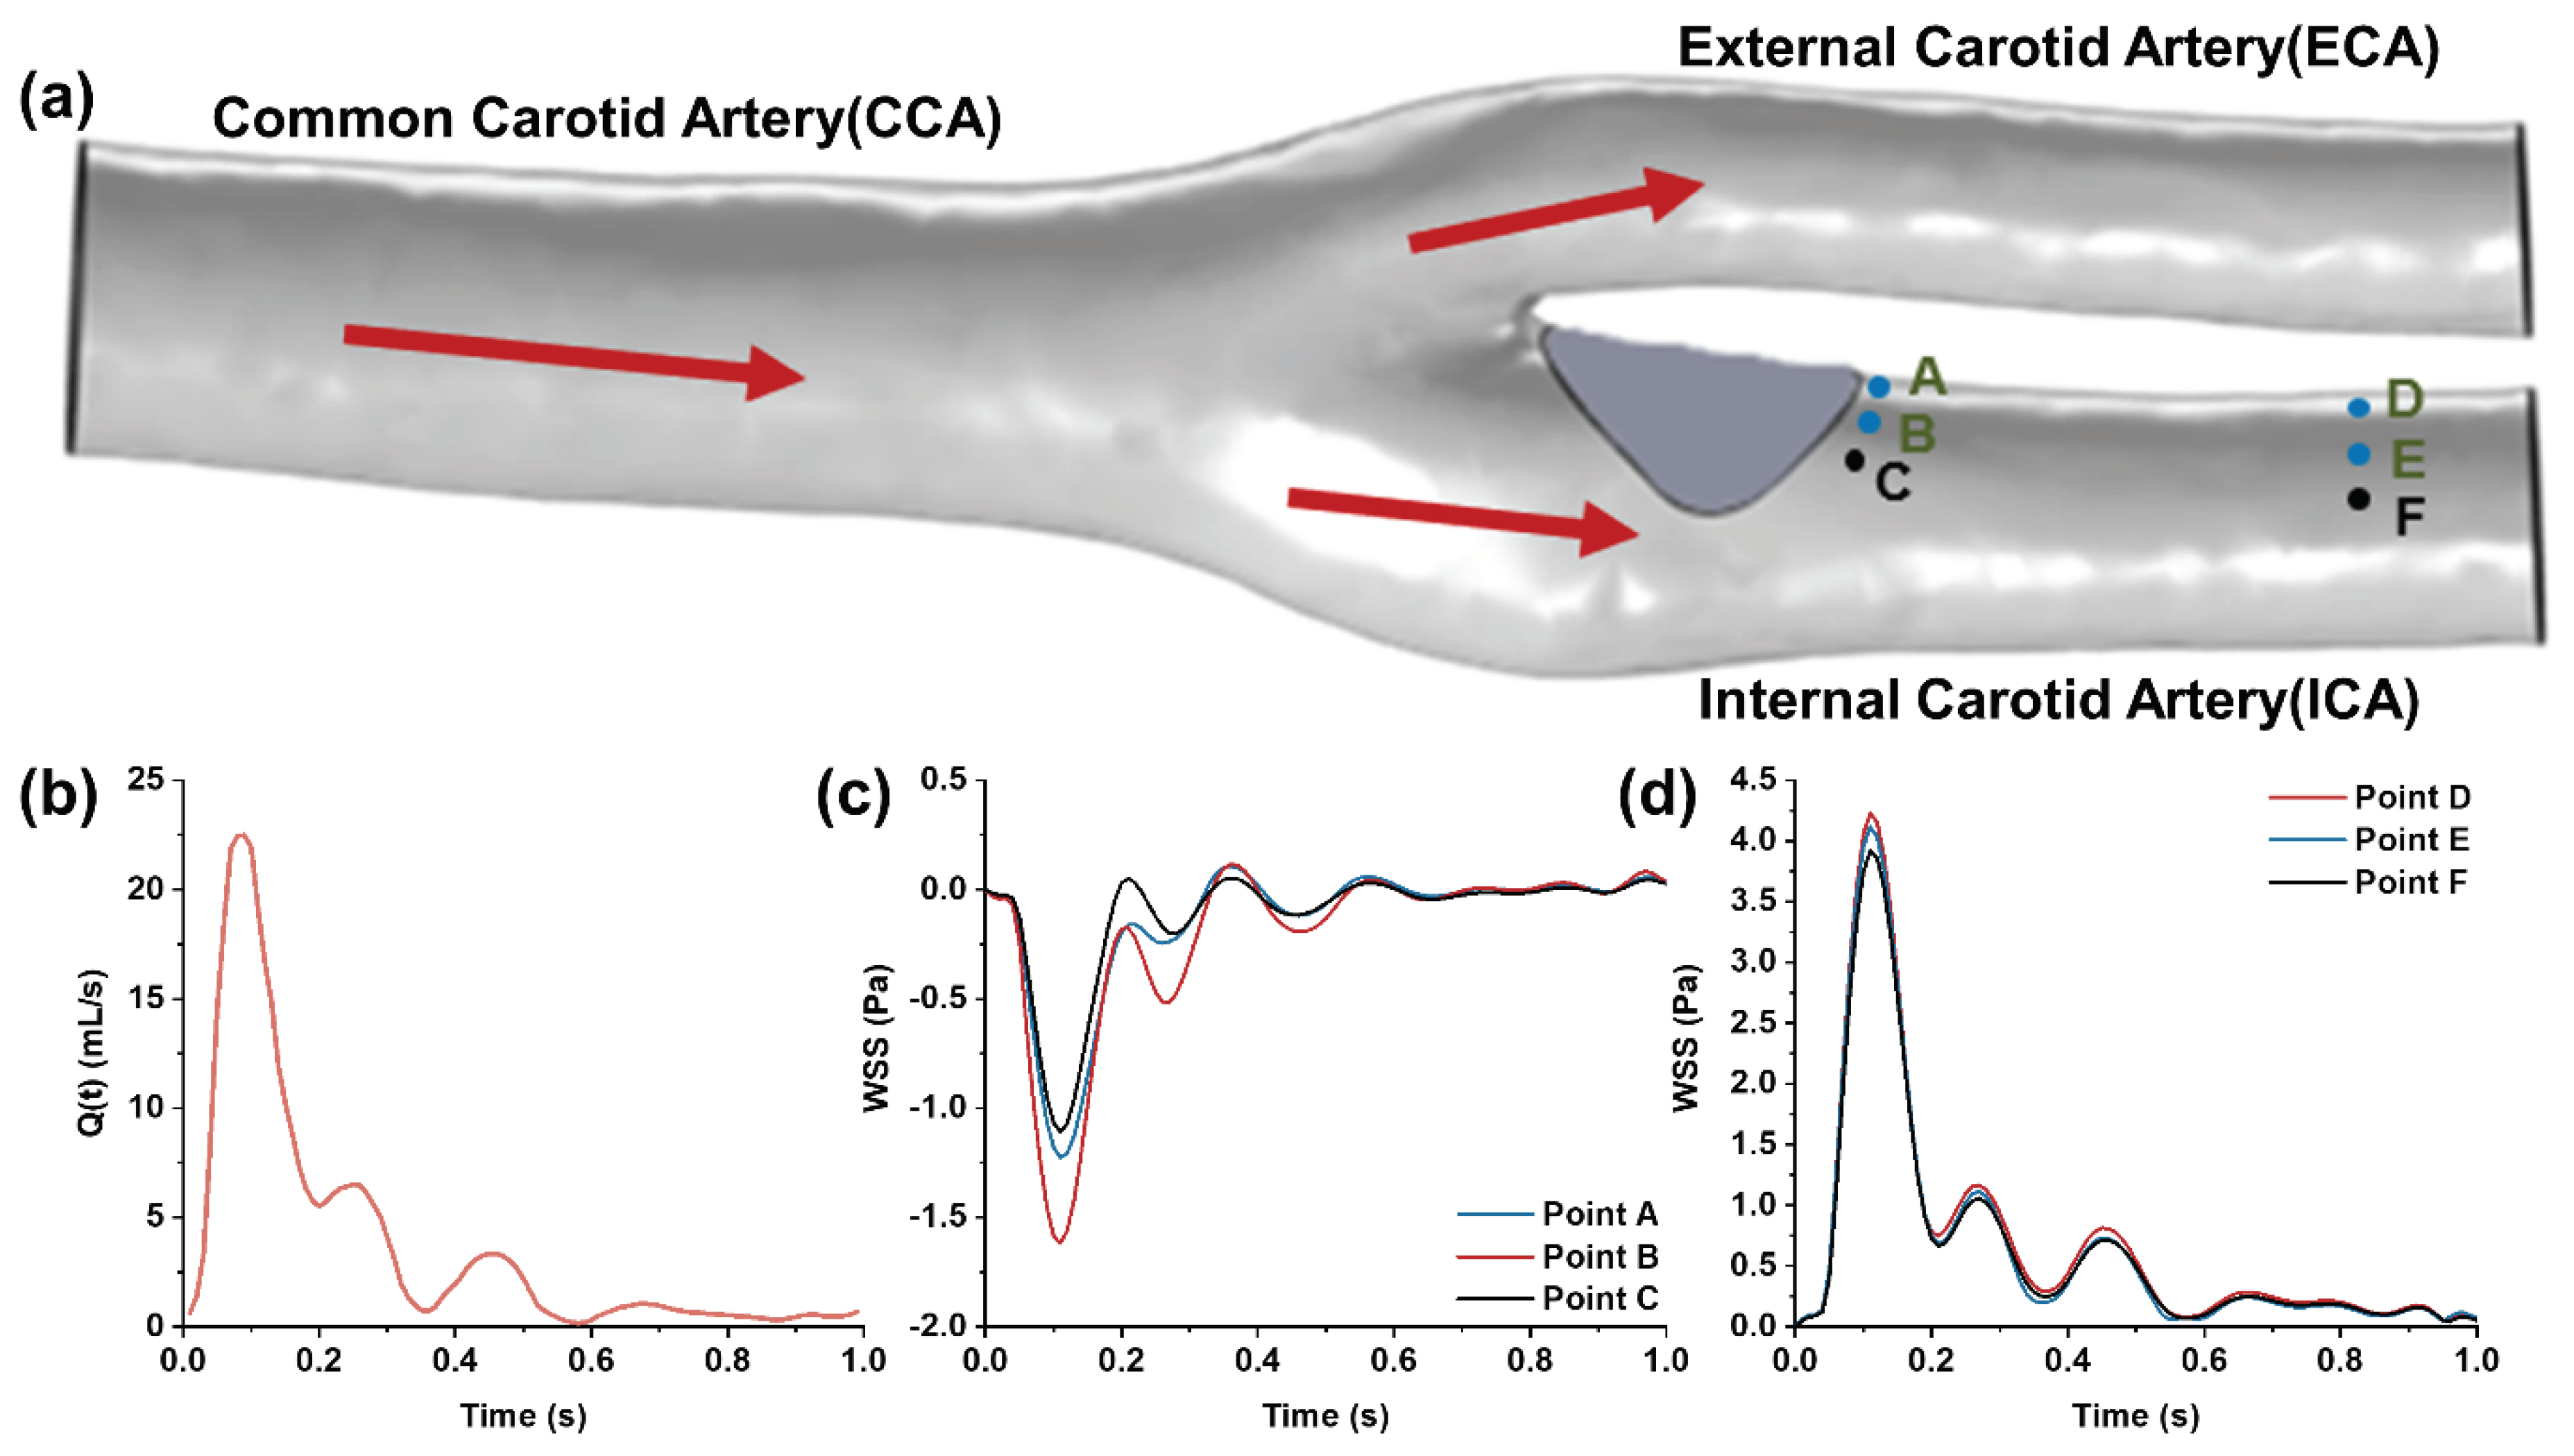
Figure 2.
(a) 3D model of the carotid bifurcation with the stenosis at the internal carotid sinus; (b) Waveform of flow rate at the common carotid artery measured by ultrasound Doppler; (c) Low oscillatory WSS waveform at the site of carotid sinus stenosis; (d) High pulsatile WSS waveform in the downstream segment of the internal carotid artery.
To capture WSS waveforms at various positions within the carotid bifurcation, numerical simulations of the carotid artery’s flow field were performed using COMSOL 6.0, a CFD simulation software. The 3D carotid artery model, reconstructed from actual human medical imaging, includes the common carotid artery, the internal carotid artery with an enlarged sinus, and the external carotid artery. A protruding plaque at the internal carotid sinus was integrated into the model to simulate in vivo stenosis conditions. The model’s total length is 52 mm, with diameters of approximately 6.4 mm for the common carotid artery, 2.6 mm for the internal carotid artery, and 2.2 mm for the external carotid artery. The common carotid artery’s inlet boundary condition was derived from in vivo ultrasound Doppler-measured axial blood flow velocities, processed through the Womersley formula [
34] (see
Figure 2(b)). The outlets of the internal and external carotid arteries were set to a zero-pressure boundary condition (default reference pressure is one standard atmosphere) [
35,
36]. Under low Reynolds number laminar flow and no-slip boundary conditions, the fluid velocity and WSS distribution at the carotid bifurcation were computationally determined. This study focuses on the low oscillatory flow WSS at the disturbed flow site of carotid sinus stenosis (
Figure 2(c)) and the high pulsatile WSS in the downstream uniform arterial segment (
Figure 2(d)) as the target WSS waveform features for simulation in the microfluidic channel.
2.4. CFD Simulation and Optimization of WSS in the Variable Cross-section Microchannel
Figure 3.
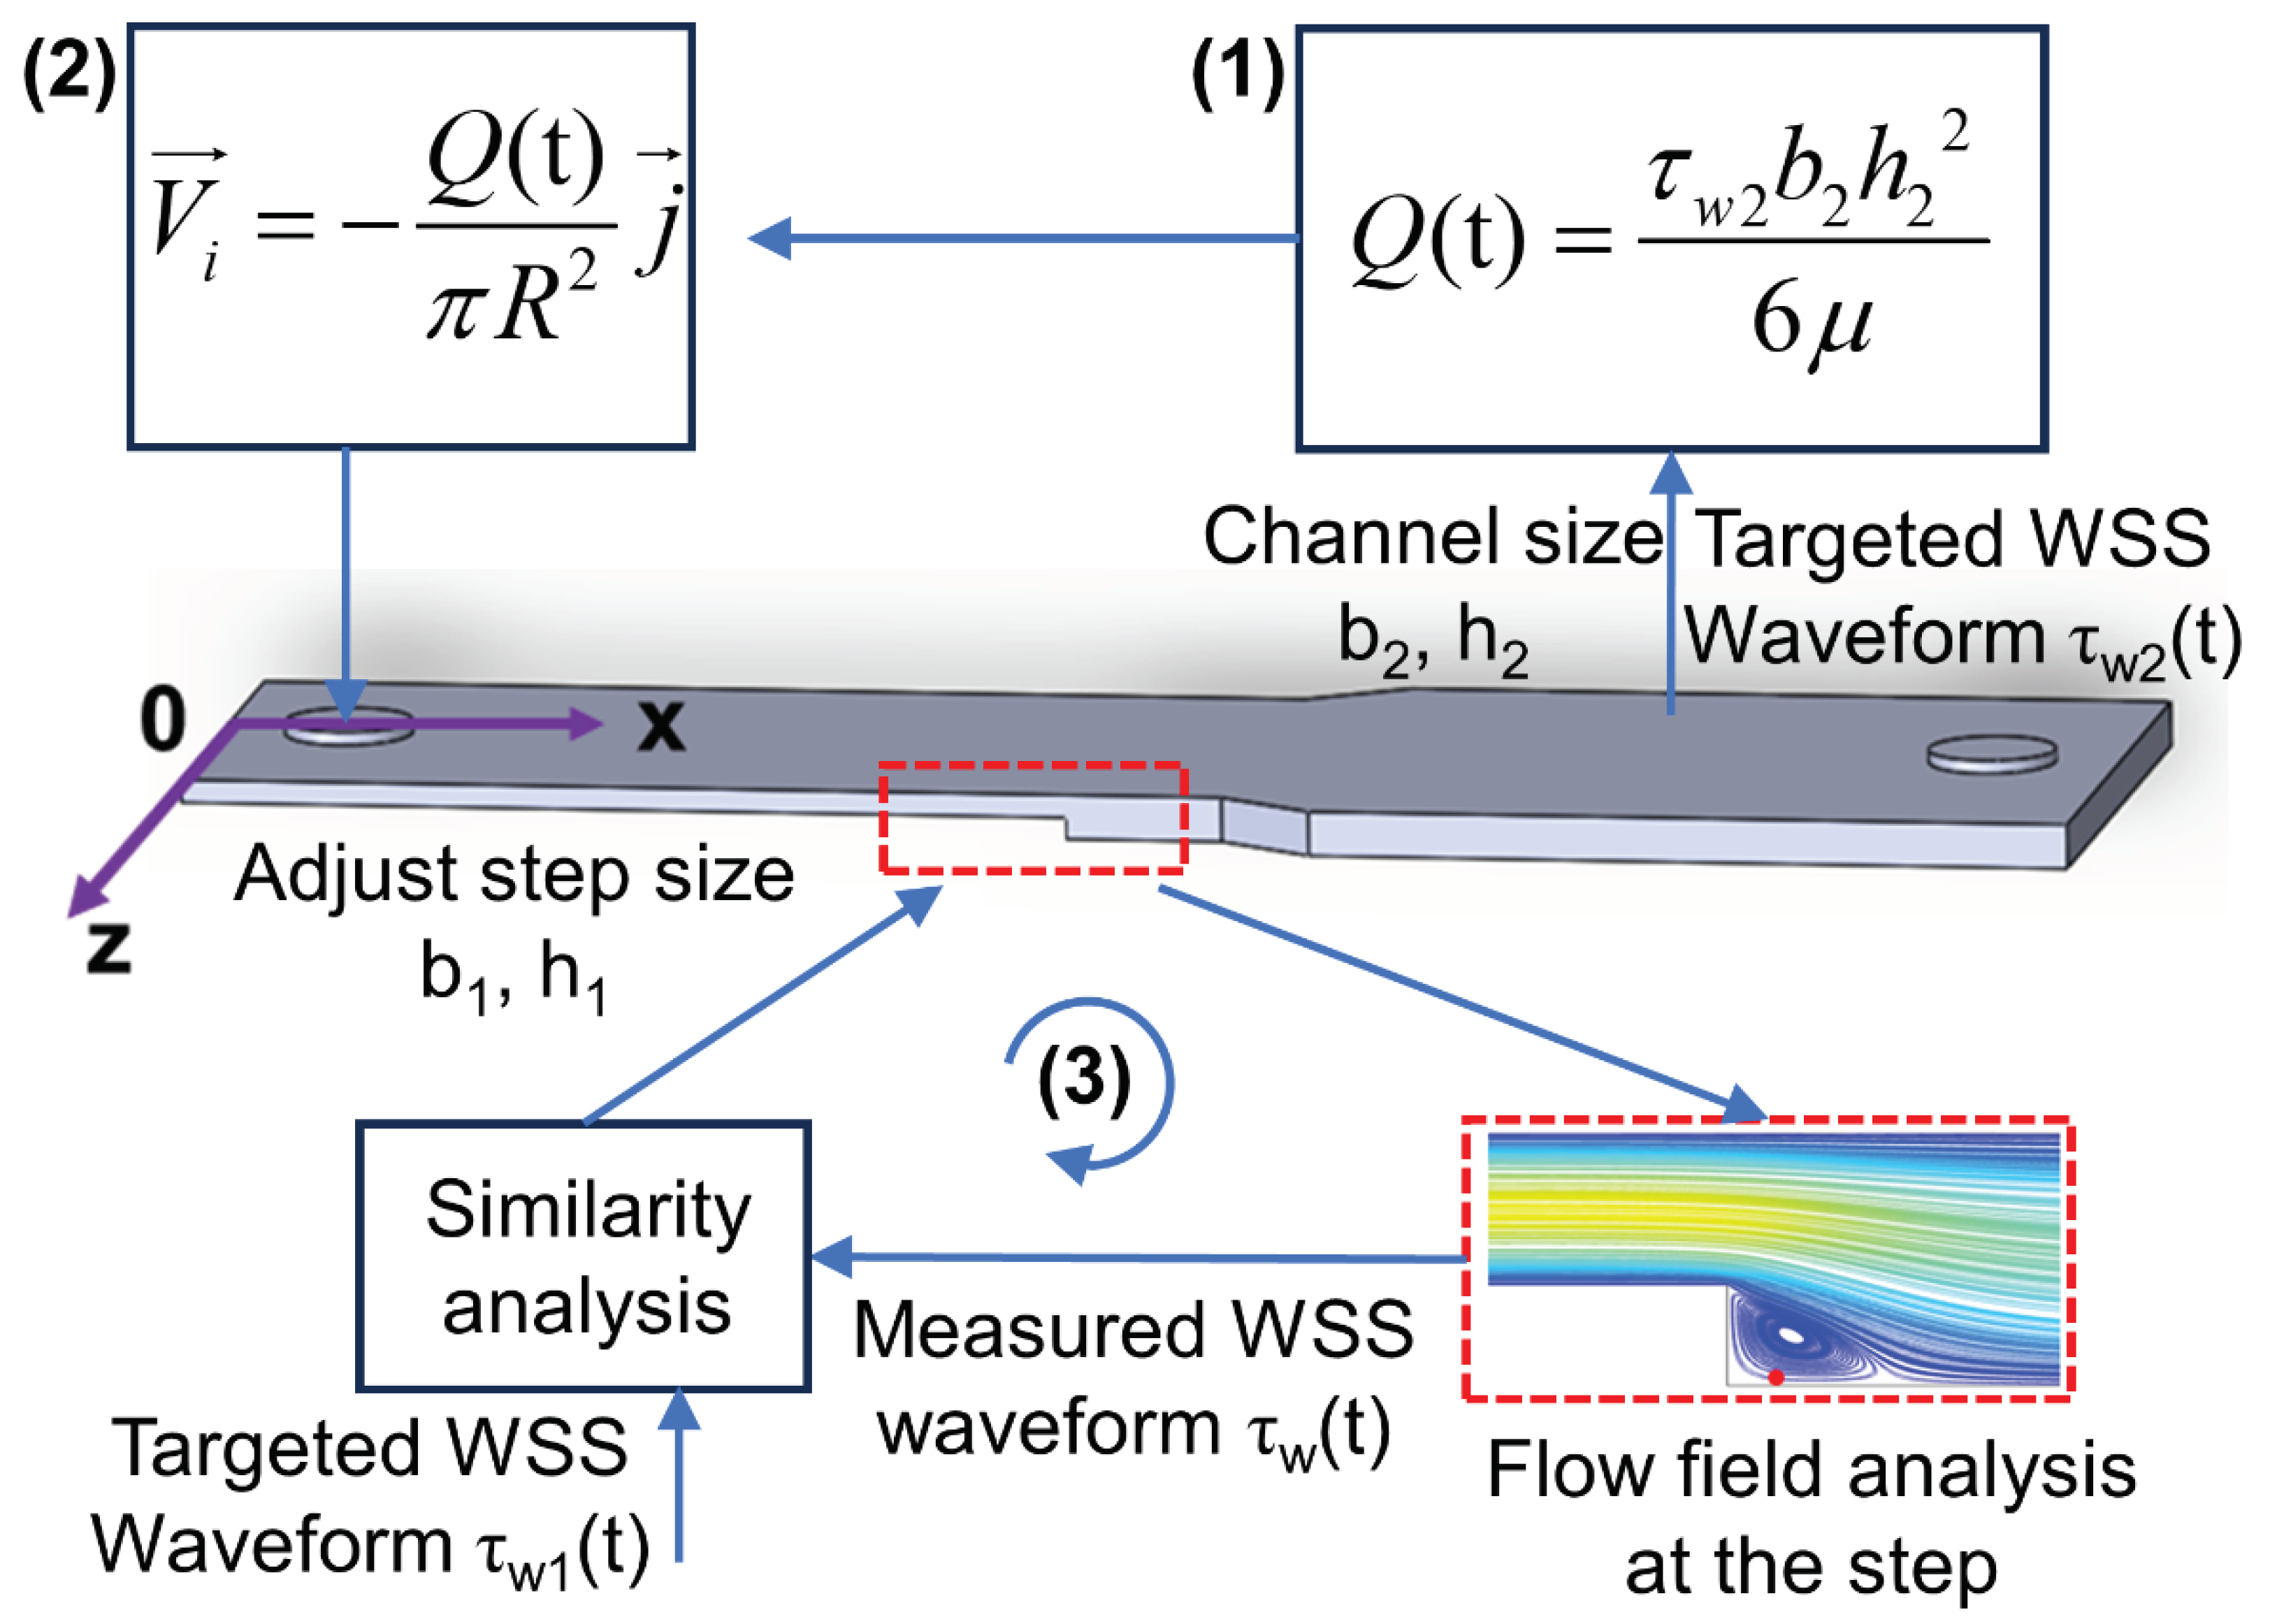
Schematic of the optimization procedures for CFD simulation and structure optimization of the microfluidic channel.
Figure 3.
Schematic of the optimization procedures for CFD simulation and structure optimization of the microfluidic channel.
To replicate the carotid artery’s in vivo WSS waveform characteristics within the microfluidic channel, fluid simulation software was utilized for WSS modeling and microchannel dimension optimization. As depicted in
Figure 3, the process commenced with calculating the fluid volumetric flow rate Q(t) in the microchannel using Equation (13), guided by the high pulsatile shear stress waveform in the downstream uniform arterial segment (shown in
Figure 2(c)), and under the predefined channel dimensions h
2 = 0.15mm and b
2 = 5mm. Subsequently, the velocity waveform at the inlet boundary was deduced from the microchannel inlet’s cross-sectional area. CFD simulation was then employed to obtain the flow field distribution and target WSS waveform at the step, followed by a similarity analysis with the intended low oscillatory WSS waveform. If the detected WSS waveform did not meet the desired similarity, the step dimensions b
1 and h
3 in the microchannel were adjusted, and the process iterated until the step’s WSS waveform achieved satisfactory similarity with the expected pattern. The optimized microchannel dimensions were finalized upon reaching this criterion.
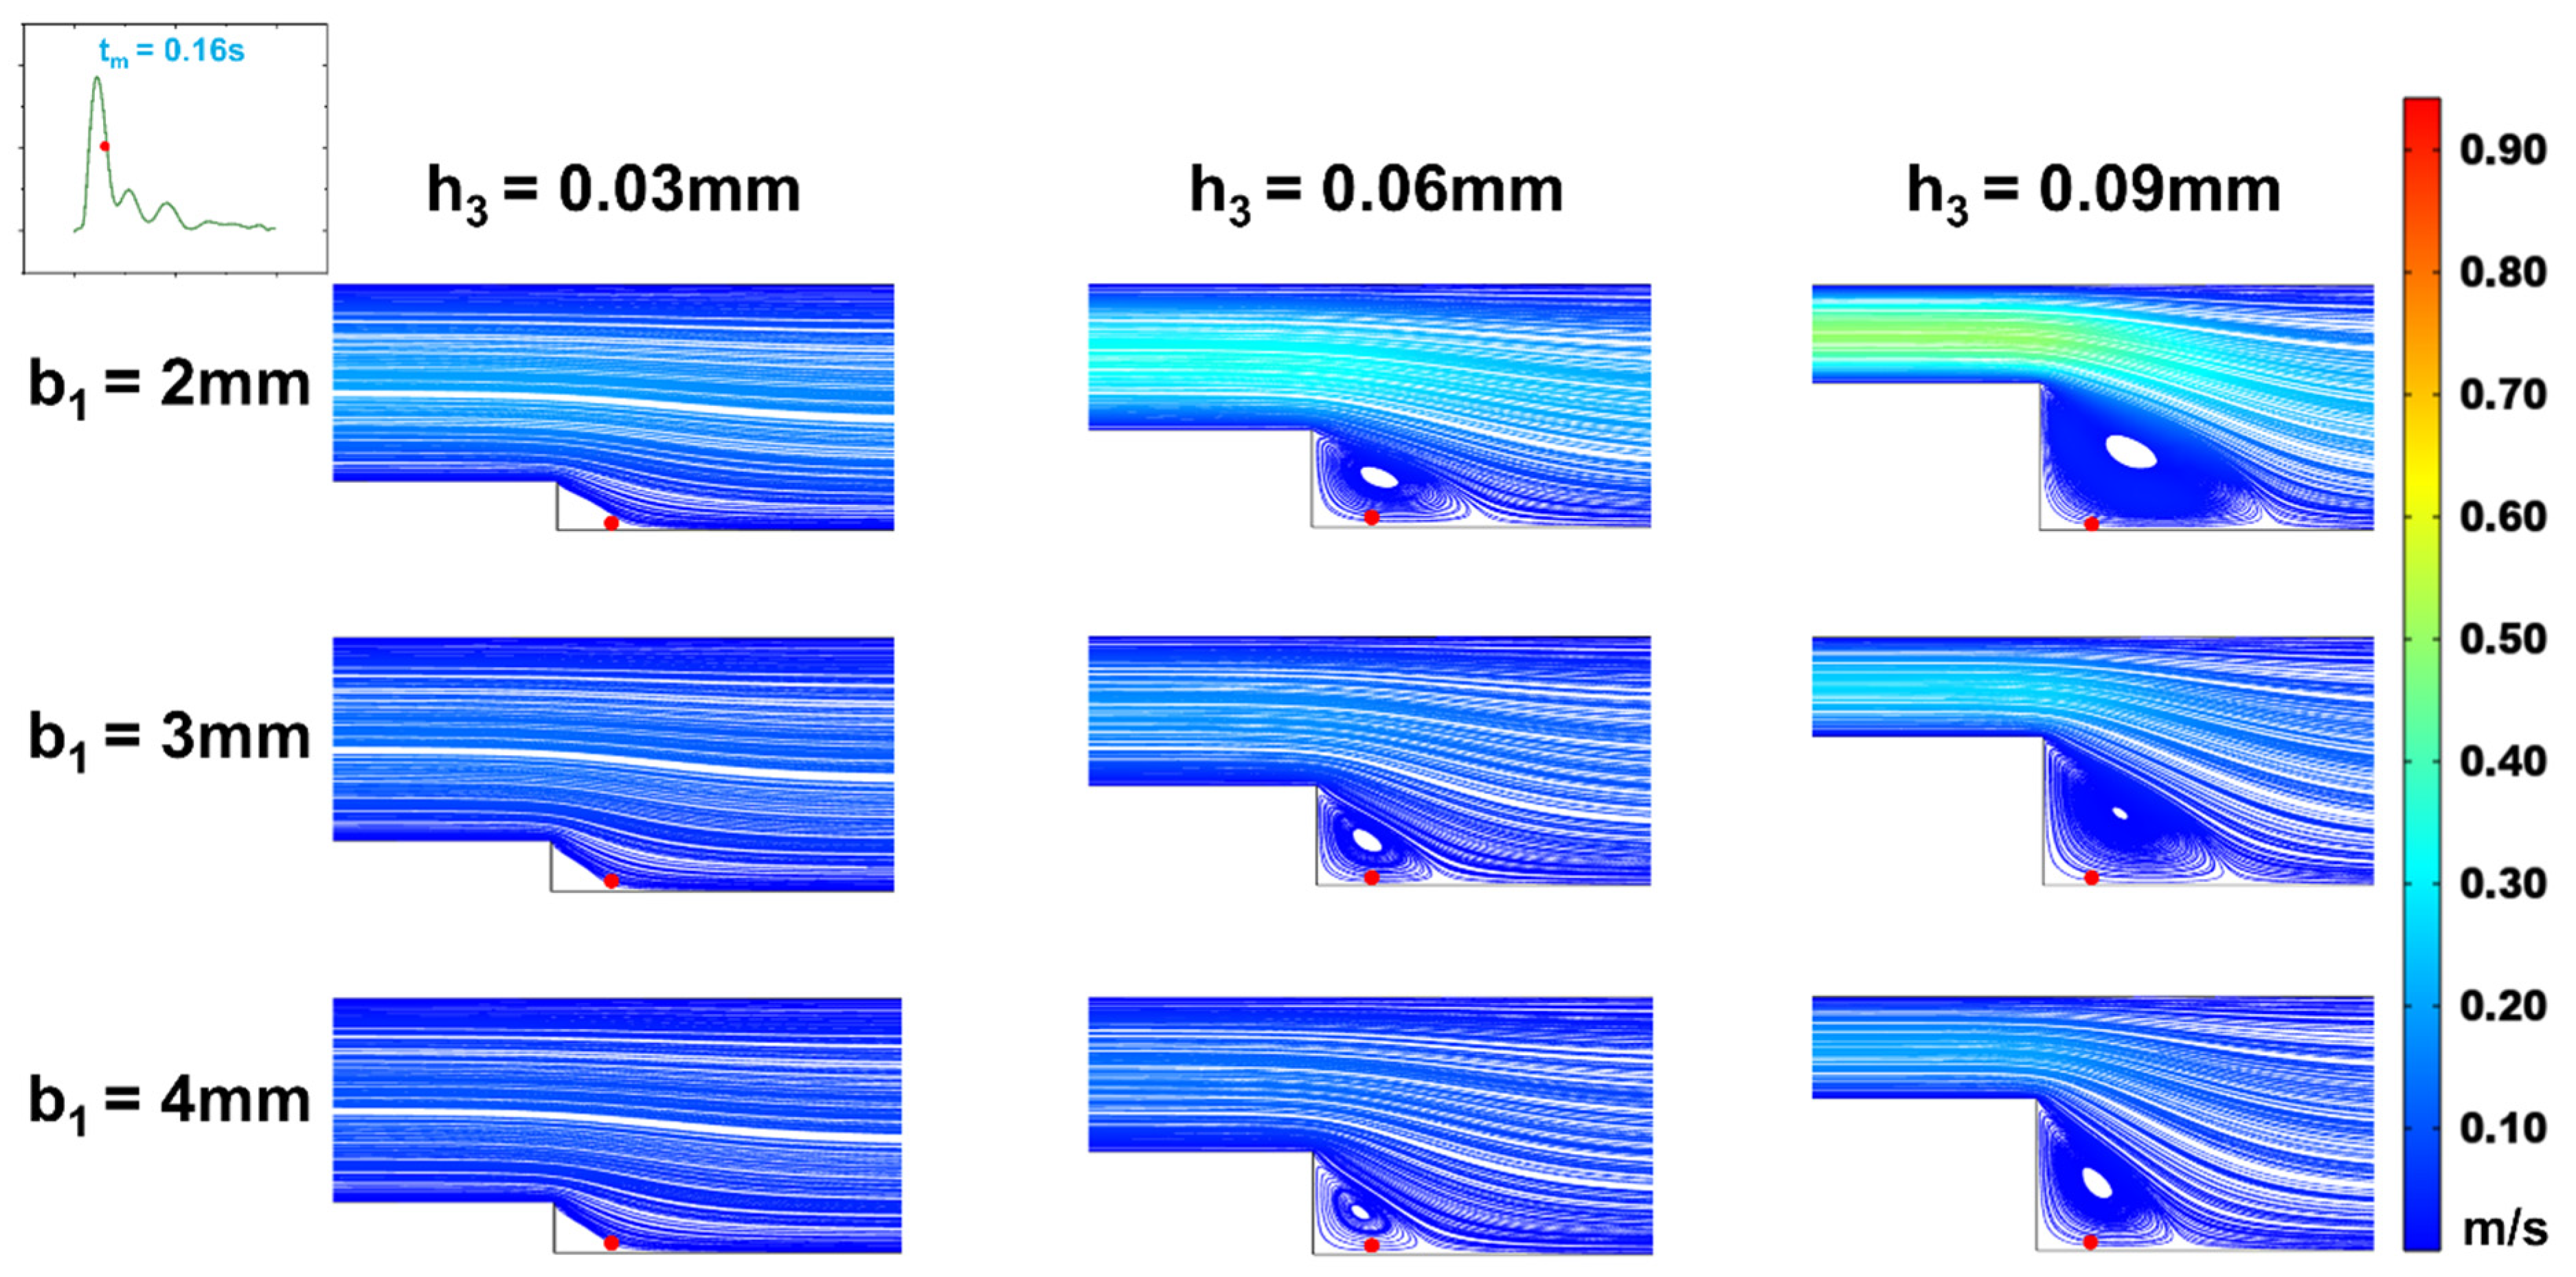
In optimizing the step dimensions within the microchannel, the influence of step height h3 and width b1 on the WSS waveform was initially analyzed, setting the heights and widths to h
3 = 0.03 mm, 0.06mm, 0.09mm and b
1 = 2mm, 3mm, 4mm, respectively. The step was subsequently optimized to attain the desired fitting effect. During optimization, the step height varied in 0.03 mm increments, and the width in 1 mm increments. Furthermore, altering the width of the rear wider area to b
2 = 4mm, the impact of Q(t) variations on the step’s WSS waveform was examined under the same optimization protocol. The best-sized 3D model post-optimization was chosen to assess the WSS waveform consistency in the wider rear area and at the step. Using the coordinate system from
Figure 1, five points at different x-positions were selected in both areas along the microchannel’s central axis (z = 0mm, y = -0.15mm) to examine the WSS waveform. Additionally, vortex changes at the moments of maximum (t
p = 0.11s) and average (t
m = 0.16s) flow velocities were observed at different cross-sectional areas. Lastly, to more directly observe how the low oscillatory WSS waveform varied with changes in the cross-sectional area of region (I), the waveform was extracted at a distance of l = 0.025mm from the step.
The CFD simulation process began by importing the microchannel model, designed in SolidWorks 2021, into COMSOL software for mesh generation. The inlet velocity, determined based on the high WSS waveform anticipated in the downstream microchannel, was set as the inlet condition. The channel walls were defined as no-slip surfaces, and the outlet was set to zero pressure. The study focused on a flow chamber with a narrow section width of b1 = 4mm and step height of h3 = 0.09 mm for mesh independence verification. It was found that with over 60201 mesh elements, the mesh size had a negligible impact on the results. Therefore, for a balance of accuracy and computational efficiency, CFD simulations were conducted with a mesh count exceeding 60201.
3. Results
Employing a 3D reconstructed carotid artery model from clinical imaging and CFD numerical simulations, we obtained the low oscillatory WSS waveform at the carotid sinus and the high pulsatile WSS waveform at the uniform downstream section of the carotid bifurcation. Utilizing the design of a variable cross-section microchannel and controlled inlet flow, we systematically analyzed the influences of channel width (b1), step height (h3), and input flow rate (Q(t)) on the WSS within the microchannel. Through optimization of the microchannel dimensions, we achieved a more precise simulation of both low oscillatory and high pulsatile WSS waveforms in different regions of the microchannel.
3.1. Carotid Artery WSS Waveform Simulation in the Variable Cross-section Microchannel
Figure 4.
(a) WSS waveforms in the wider rectangular region of the microfluidic channel; (b) Low oscillatory WSS waveforms at the stepped site.
Figure 4.
(a) WSS waveforms in the wider rectangular region of the microfluidic channel; (b) Low oscillatory WSS waveforms at the stepped site.
Based on the target WSS waveforms at the carotid bifurcation (
Figure 2c-d), and following the CFD simulation and optimization process for the microchannel (
Figure 3), we obtained simulation results for WSS in different regions of the optimized microchannel (
Figure 4). In the wider rectangular section at the rear of the microchannel (h
2 = 0.15mm, b
2 = 5mm), the WSS waveform closely matched the targeted high pulsatile WSS waveform in the internal carotid artery. This consistency demonstrates that the microchannel structure designed can accurately replicate the high pulsatile WSS waveform in the uniform segment downstream of the carotid bifurcation. Along the fluid flow direction, WSS changes remained consistent, allowing for precise simulation of high pulsatile WSS in this laminar flow region. In the stepped region, after optimizing the channel dimensions (h
3 = 0.09mm, b
1 = 4mm), the produced low oscillatory WSS waveform at the step showed similarity to the WSS changes at the carotid sinus stenosis in terms of oscillation pattern and amplitude. The subtle variations in WSS waveform along the fluid flow direction were attributed to the vortices formed in the stepped area, where differences in velocity gradients at various positions cause WSS variations. Thus, the optimized variable cross-section microchannel successfully simulates both low oscillatory WSS and high pulsatile WSS waveforms of the carotid artery. Moreover, the WSS waveforms from both 3D and 2D simulations at the same location in the stepped area showed good agreement. To optimize computational resources and time, 2D numerical simulation was employed for flow field modeling and dimension optimization in the stepped area.
3.2. Impact of Step Size on Low Oscillatory WSS
Figure 5.
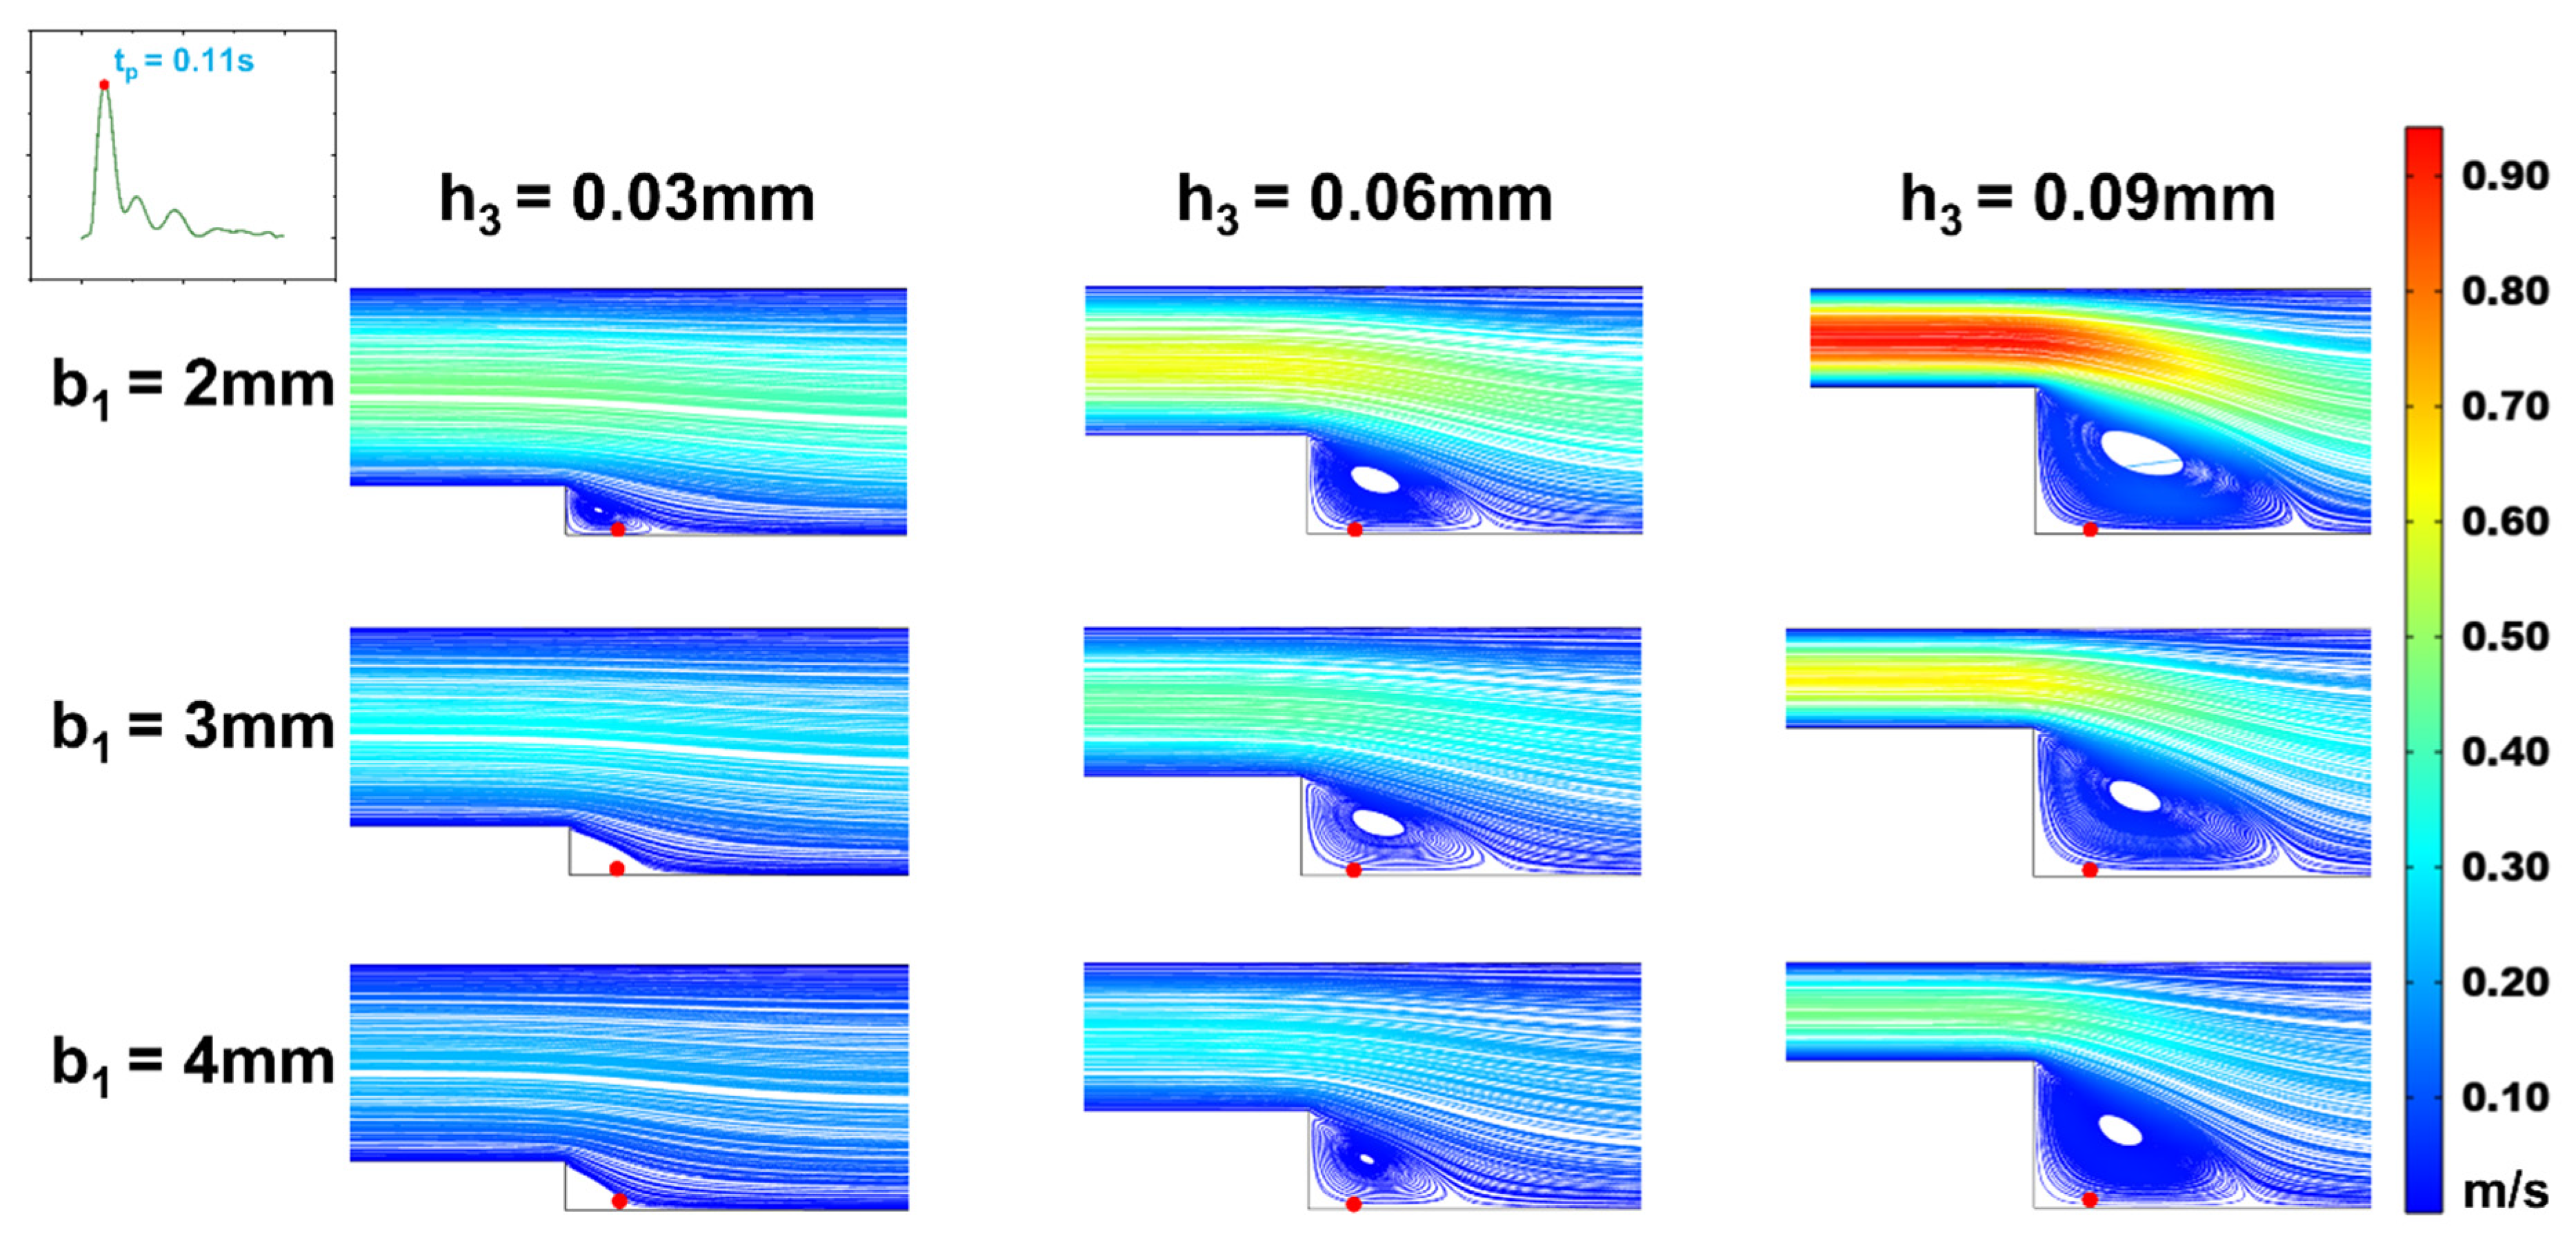
Changes of streamline distributions with step height and width at the stepped site in the time interval of the maximum flow velocity (tp = 0.11s) for b2 = 5 mm.
Figure 5.
Changes of streamline distributions with step height and width at the stepped site in the time interval of the maximum flow velocity (tp = 0.11s) for b2 = 5 mm.
In efforts to precisely simulate the low oscillatory WSS waveform, we analyzed the effects of step height (h
1) and width (b
1) on the low oscillatory WSS generated in the stepped area. Observing vortex changes at the moments of maximum (t
p = 0.11s) and average (t
m = 0.16s) flow velocity (
Figure 5 and
Figure 6), it was found that as the microchannel step width (b
1) increased, the vortex area on the oxy plane gradually diminished. At a height of h
3 = 0.03mm, increasing width b
1 even resulted in the disappearance of the vortex area, making low oscillatory WSS simulation challenging. The size of the vortex area varied consistently with step width b
1 across different cardiac cycle moments, with the vortex area size being directly proportional to the flow rate. As the flow rate decreased, the vortex in the stepped area vanished under microchannel dimensions of b
1 = 2mm, h
3 = 0.03mm. Correspondingly, within the vortex area, the negative oscillation amplitude of the WSS waveform decreased as step width b
1 increased (
Figure 7). This decrease is attributed to reduced flow speed and subsequently lower velocity gradients when inlet flow rate is constant and width increases.
With a fixed microchannel step width (b
1), increasing step height (h
3) led to an enlargement of the vortex area on the oxy plane. The vortex area size correlated directly with the average flow rate at different cardiac cycle moments (
Figure 5 and
Figure 6). Correspondingly, within the vortex area, the negative oscillation amplitude of the WSS waveform increased as step height h
3 increased (
Figure 7).
When keeping the width of region (I) constant and altering step height (h
3), the size and position of the vortex area changed. As the step height (h
3) decreased, the height and width of the vortex area reduced, with its center shifting towards the step. This shift caused the low oscillatory WSS waveform at the same position (
Figure 7) to first increase and then decrease in negative oscillation amplitude as the vortex area’s center moved. When width b
1 decreased, the vortex area remained largely unchanged, but the negative oscillation amplitude of the low oscillatory WSS waveform increased.
3.3. Influence of Wide Area Channel Size on Low Oscillatory WSS
Figure 8.
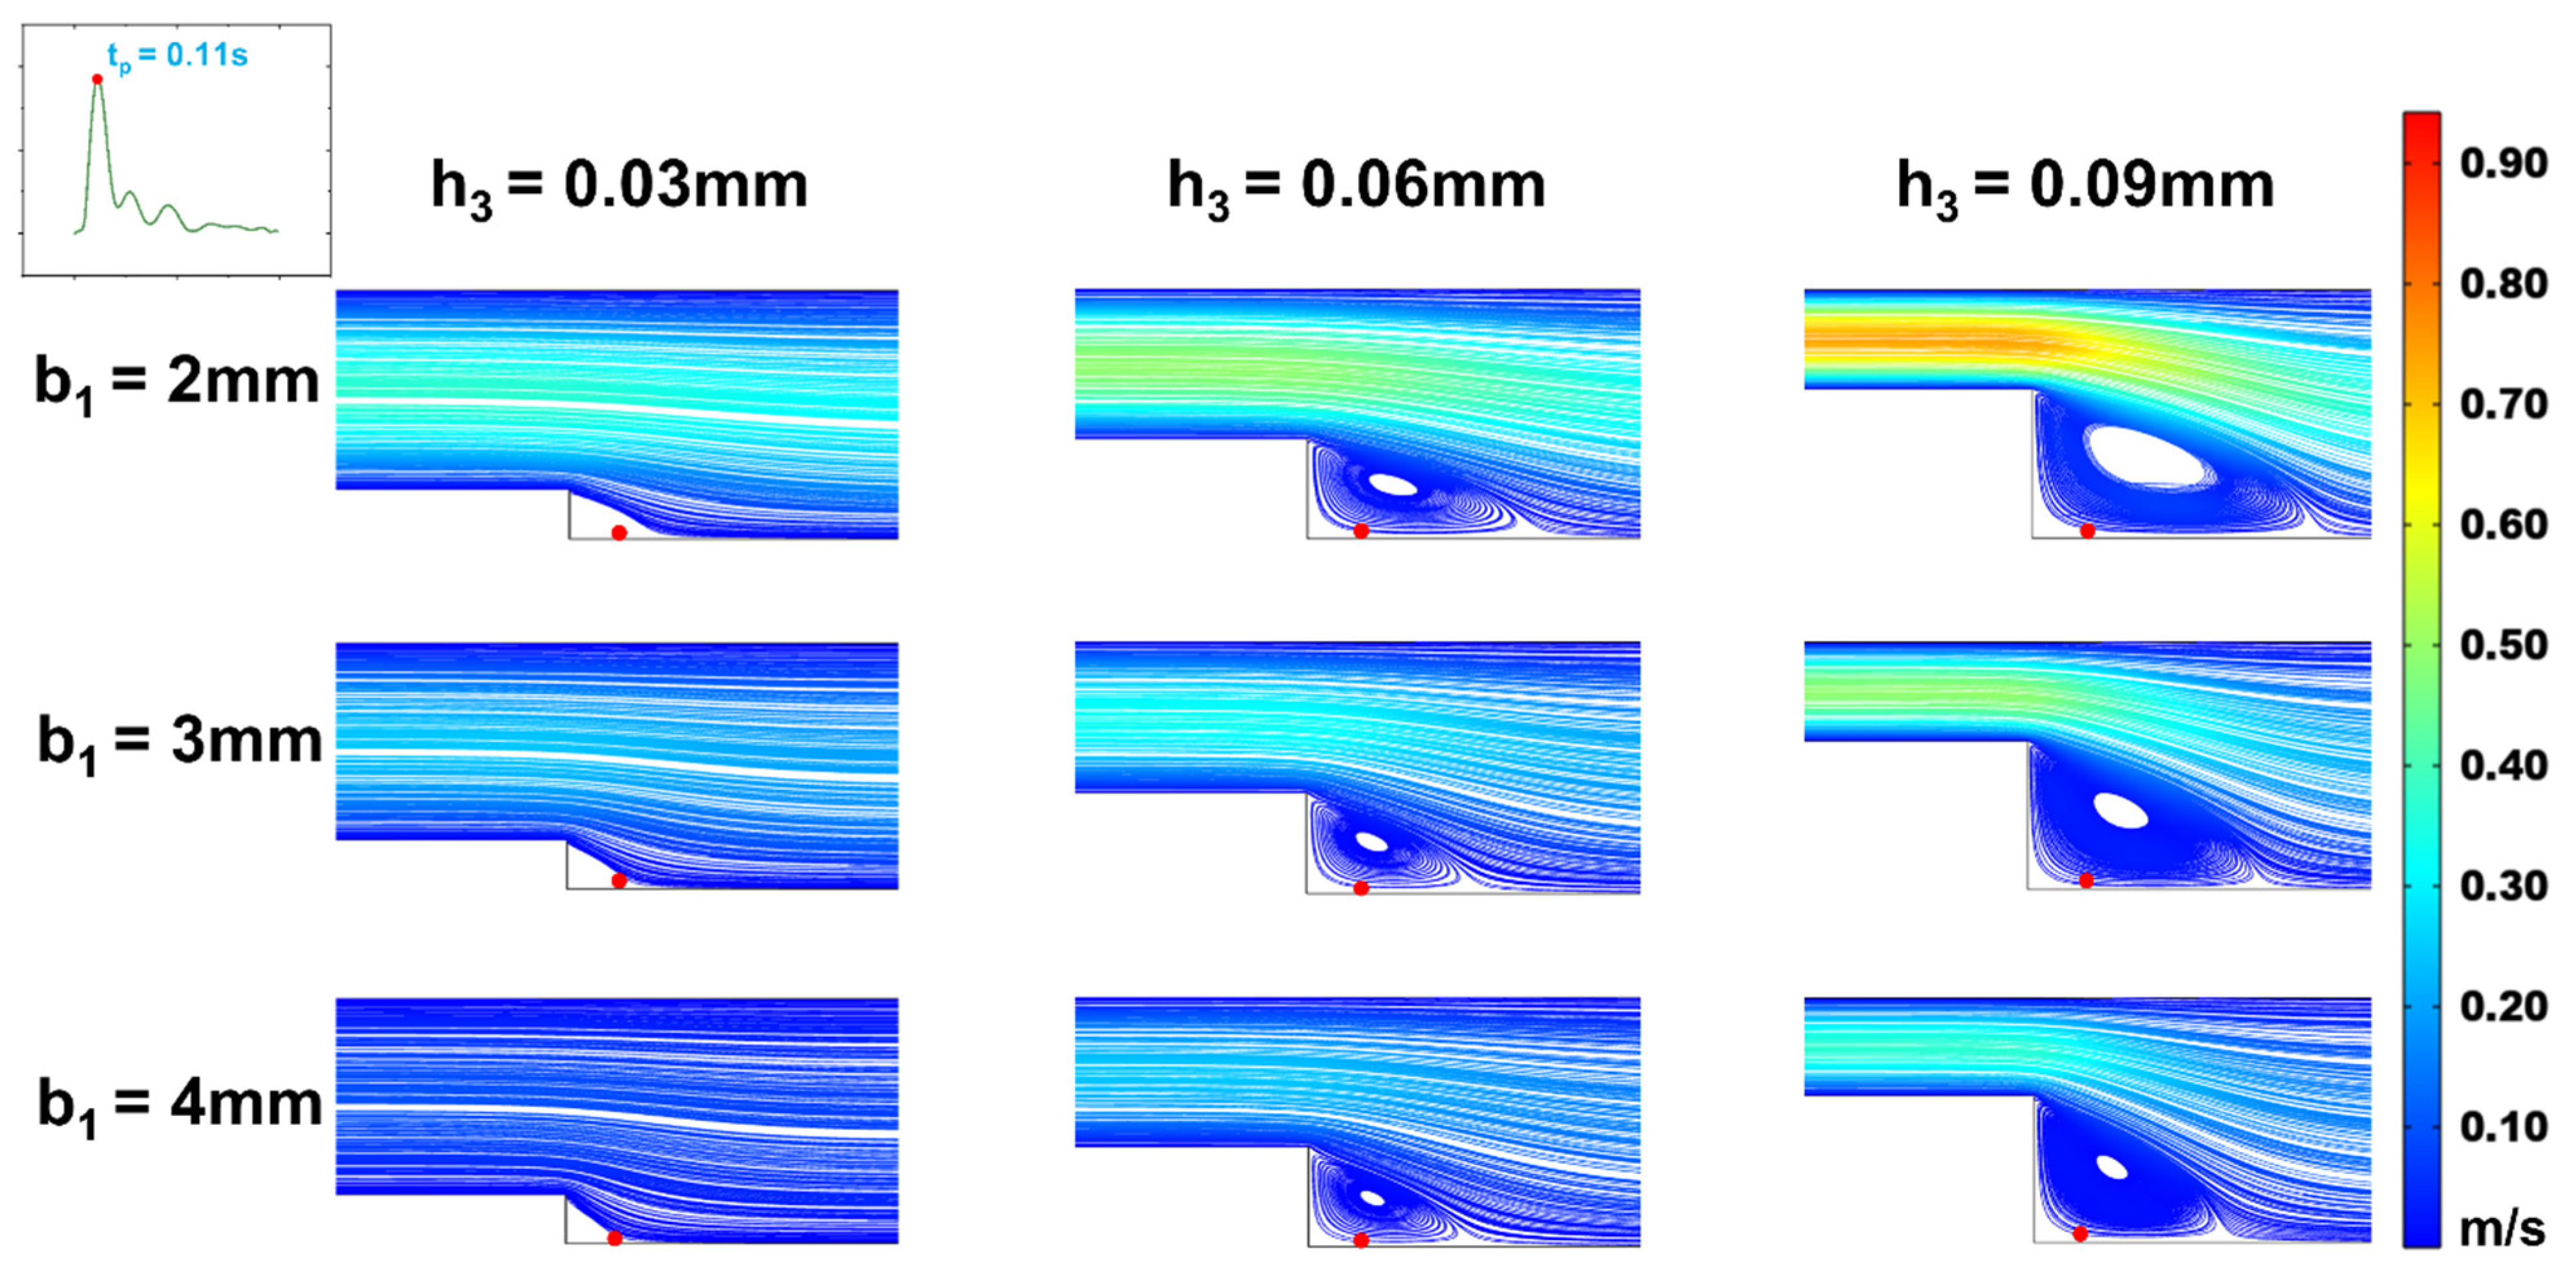
Changes of streamline distributions with step height and width at the stepped site in the time interval of the maximum flow velocity (tp = 0.11s) for b2 = 4 mm.
Figure 8.
Changes of streamline distributions with step height and width at the stepped site in the time interval of the maximum flow velocity (tp = 0.11s) for b2 = 4 mm.
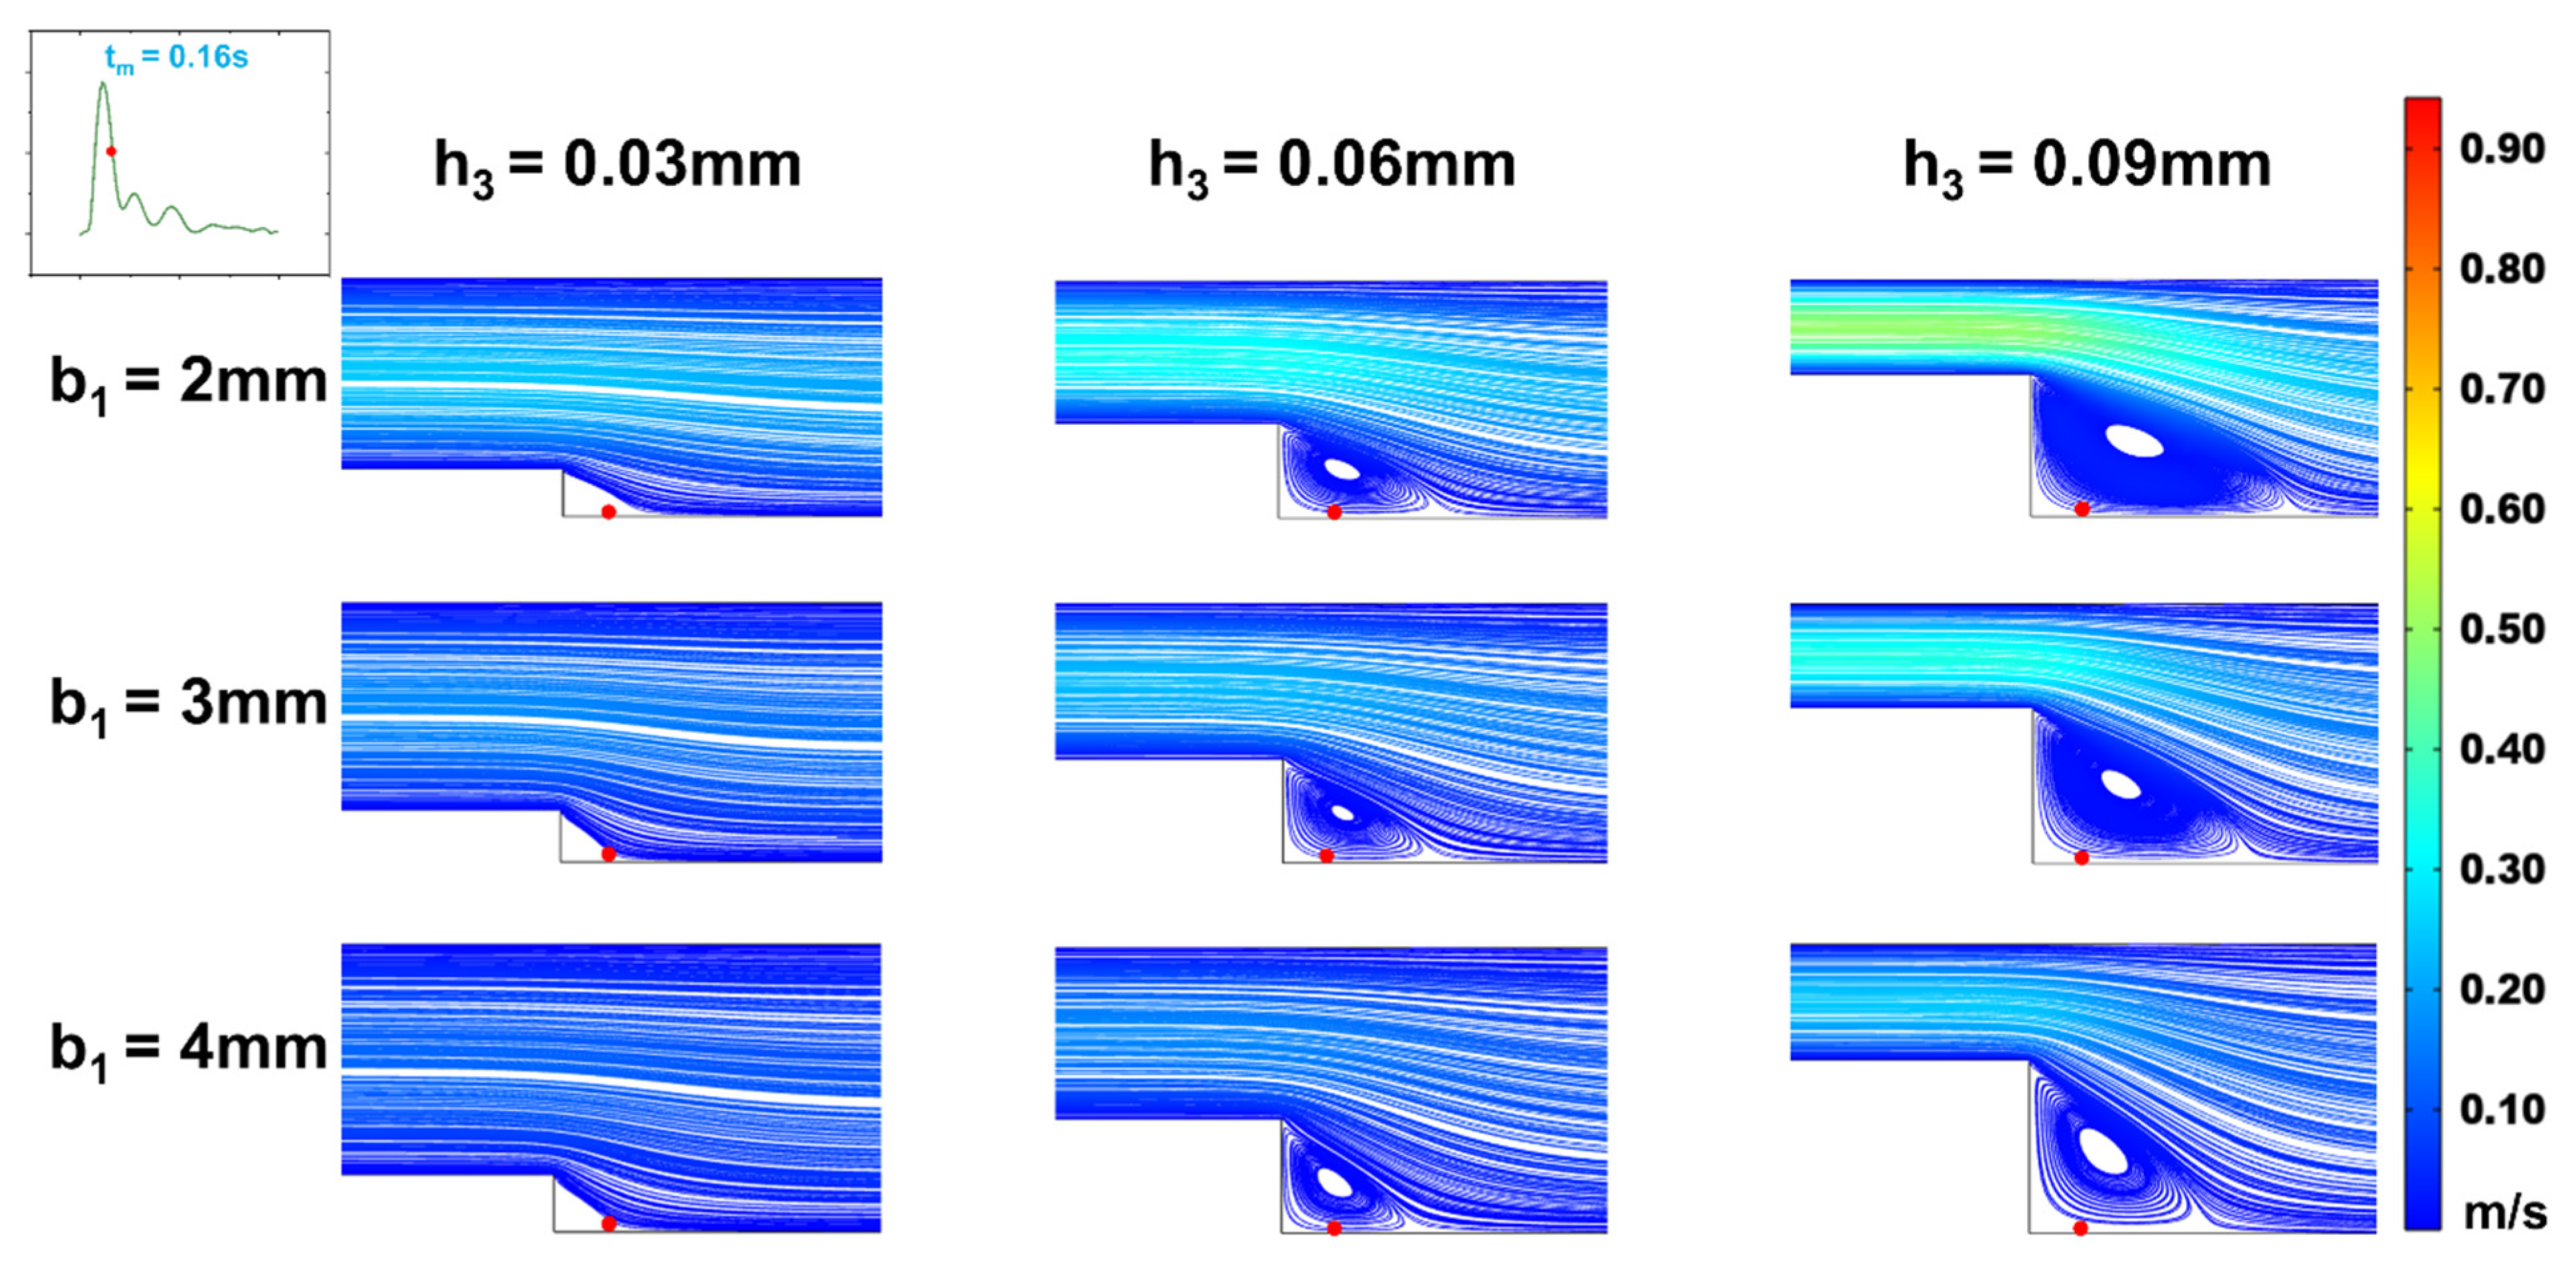
Figure 9.
Changes of streamline distributions with step height and width at the stepped site in the time interval of the average flow velocity (tm = 0.16s) for b2 = 4 mm.
Figure 9.
Changes of streamline distributions with step height and width at the stepped site in the time interval of the average flow velocity (tm = 0.16s) for b2 = 4 mm.
With a fixed target WSS for simulation in the wide area of the microchannel, the channel size in this area determines the internal flow rate (Equation (12)). As shown in
Section 2.2, whether vortices form in the stepped area and how WSS changes under various flow rates within a cardiac cycle depend on the inlet flow rate. Therefore, we investigated the effect of flow rate variations on the vortices and WSS simulation at the step by altering the channel width in the wide area. The simulations (
Figure 8 and
Figure 9) indicated that changing the channel width in the wide area (b
2 = 4mm) resulted in low oscillatory WSS at the step, with variations in step width b
1 and height h
3 following a trend consistent with when b
2 = 5mm (
Figure 5,
Figure 6,
Figure 7,
Figure 8,
Figure 9,
Figure 10). Compared to b
2 = 5mm, the reduced flow rate in the microchannel at b
2 = 4mm diminished the vortex area, leading to the disappearance of vortices at b
1 = 2mm, h
3 = 0.03mm (
Figure 8 and
Figure 9). Simultaneously, the reduced flow rate led to the decrease in the negative oscillation amplitude of the WSS waveform (
Figure 10).
4. Discussion
In this study, leveraging microfluidic technology and fluid dynamics principles, we developed a variable cross-section microfluidic cell culture chamber with a stepped design. This chamber effectively replicates both the low oscillatory WSS found at the carotid sinus and the high pulsatile WSS waveform characteristics in the downstream uniform arterial segment as observed in vivo. Simulation results showed that with a step height of 0.09 mm, a width of 4 mm, and a wider channel width of 5 mm in the variable cross-section microchannel, the stepped area efficiently simulates the low oscillatory WSS features associated with carotid sinus stenosis. The wider portion of the microchannel accurately models the high pulsatile WSS waveform in the uniform arterial section downstream of the carotid sinus. Additionally, the formation of vortices and variations in low oscillatory WSS within the stepped region of the microchannel correlate with the step height, width, and dimensions of the wider channel area. An increase in step width b1 leads to a decrease in both the vortex area and the magnitude of negative WSS oscillations. When the step height h3 falls below 0.03 mm, the vortex area vanishes, challenging the simulation of low oscillatory WSS patterns. The variable cross-section microfluidic channel designed in this research lays a foundational basis for simulating carotid artery WSS waveforms and for conducting in vitro studies on the interplay between low oscillatory WSS at the site of carotid sinus stenosis and arterial endothelial dysfunction.
Author Contributions
Conceptualization, Y.-J.L., D.C. and K.-R.Q.; methodology, Y.-J.L. and K.-R.Q.; software, L.-J.Y.; validation, L.-J.Y. and C.-D.X.; formal analysis, L.-J.Y.; investigation, L.-J.Y. and Z.L.; resources, Y.-J.L.; data curation, L.-J.Y. and Z.L.; writing-original draft preparation, L.-J.Y.; writing-review and editing, D.C. and K.-R.Q.; visualization, L.-J.Y. and C.-D.X.; supervision, Y.-J.L. and K.-R.Q.; funding acquisition, Y.-J.L.,D.C. and K.-R.Q.
Funding
This research was funded by the National Natural Science Foundation of China (12372304) and the Fundamental Research Funds for the Central Universities (DUT22YG226 and DUT22LAB106)
Data Availability Statement
The data presented in this study are available on request from the corresponding author.
Conflicts of Interest
The authors declare no conflicts of interest.
References
- Baratchi, S.; Khoshmanesh, K.; Woodman, O.L.; Potocnik, S.; Peter, K.; McIntyre, P. Molecular Sensors of Blood Flow in Endothelial Cells. Trends Mol Med. 2017, 23, 850–868. [Google Scholar] [CrossRef] [PubMed]
- Bharadvaj, B.K.; Mabon, R.F.; Giddens, D.P. Steady flow in a model of the human carotid bifurcation. Part II--laser-Doppler anemometer measurements. J Biomech. 1982, 15, 363–378. [Google Scholar] [CrossRef]
- Calo, K.; De Nisco, G.; Gallo, D.; Chiastra, C.; Hoogendoorn, A.; Steinman, D.A.; Scarsoglio, S.; Wentzel, J.J.; Morbiducci, U. Exploring wall shear stress spatiotemporal heterogeneity in coronary arteries combining correlation-based analysis and complex networks with computational hemodynamics. Proc Inst Mech Eng H. 2020, 234, 1209–1222. [Google Scholar] [CrossRef]
- Caro, C.G.; Fitzgera, J.M.; Schroter, R.C. Arterial wall shear and distribution of early atheroma in man. Nature. 1969, 223, 1159–1160. [Google Scholar] [CrossRef]
- Dhawan, S.S. ; Avati Nanjundappa, R.P.; Branch, J.R.; Taylor, W.R.; Quyyumi, A.A.; Jo, H.; McDaniel, M.C.; Suo, J.; Giddens, D.; Samady, H. Shear stress and plaque development. Expert Rev Cardiovasc The. 2010, 8, 545–556. [Google Scholar] [CrossRef] [PubMed]
- Genuardi, L.; Chatzizisis, Y.S.; Chiastra, C.; Sgueglia, G.; Samady, H.; Kassab, G.S.; Migliavacca, F.; Trani, C.; Burzotta, F. Local fluid dynamics in patients with bifurcated coronary lesions undergoing percutaneous coronary interventions. Cardiol J. 2021, 28, 321–329. [Google Scholar] [CrossRef] [PubMed]
- Malik, J.; Novakova, L.; Valerianova, A.; Chytilova, E.; Lejsek, V.; Salajova, B.K.; Lambert, L.; Grus, T.; Porizka, M.; Michalek, P. Wall Shear Stress Alteration: a Local Risk Factor of Atherosclerosis. Curr Atheroscler Rep. 2022, 24, 143–151. [Google Scholar]
- Suo, J.; Oshinski, J.N.; Giddens, D.P. ; Blood flow patterns in the proximal human coronary arteries: relationship to atherosclerotic plaque occurrence. Mol Cell Biomech. 2008, 5, 9–18. [Google Scholar]
- Zalud, N.C.; Bulusu, K.V.; Plesniak, M.W. Shear stress metrics associated with pro-atherogenic high-risk anatomical features in a carotid artery bifurcation model. Clin Biomech (Bristol, Avon). 2023, 105, 105956. [Google Scholar] [CrossRef]
- Grunwald, I.Q.; Papanagiotou, P.; Reith, W.; Backens, M.; Supprian, T.; Politi, M.; Vedder, V.; Zercher, K.; Muscalla, B.; Haass, A.; Krick, C.M. Influence of carotid artery stenting on cognitive function. Neuroradiology. 2010, 52, 61–66. [Google Scholar] [CrossRef]
- Cheng, H.L.; Lin, C.J.; Soong, B.W.; Wang, P.N.; Chang, F.C.; Wu, Y.T.; Chou, K.H.; Lin, C.P.; Tu, P.C.; Lee, I.H. Impairments in Cognitive Function and Brain Connectivity in Severe Asymptomatic Carotid Stenosis. Stroke. 2012, 43, 2567–2573. [Google Scholar] [CrossRef]
- Balucani, C.; Viticchi, G.; Falsetti, L.; Silvestrini, M. Cerebral hemodynamics and cognitive performance in bilateral asymptomatic carotid stenosis. Neurology. 2012, 79, 1788–1795. [Google Scholar] [CrossRef]
- Early, K.S.; Stewart, A.; Johannsen, N.; Lavie, C.J.; Thomas, J.R.; Welsch, M. The Effects of Exercise Training on Brachial Artery Flow-Mediated Dilation A Meta-analysis. J Cardiopulm Rehabil Prev. 2017, 37, 77–89. [Google Scholar] [CrossRef] [PubMed]
- Maeda, S.; Miyauchi, T.; Kakiyama, T.; Sugawara, J.; Iemitsu, M.; Irukayama-Tomobe, Y.; Murakami, H.; Kumagai, Y.; Kuno, S.; Matsuda, M. Effects of exercise training of 8 weeks and detraining on plasma levels of endothelium-derived factors, endothelin-1 and nitric oxide, in healthy young humans. Life Sci. 2001, 69, 1005–1016. [Google Scholar] [CrossRef]
- Laufs, U.; Werner, N.; Link, A.; Endres, M.; Wassmann, S.; Jürgens, K.; Miche, E.; Böhm, M.; Nickenig, G. Physical training increases endothelial progenitor cells, inhibits neointima formation, and enhances angiogenesis. Circulation. 2004, 109, 220–226. [Google Scholar] [CrossRef]
- Na, J.T.; Xue, C.D.; Wang, Y.X.; Li, Y.J.; Wang, Y.; Liu, B.; Qin, K.R. Fabricating a multi-component microfluidic system for exercise-induced endothelial cell mechanobiology guided by hemodynamic similarity. Talanta. 2023, 253, 123933. [Google Scholar] [CrossRef] [PubMed]
- Chiu, J.J.; Wang, D.L.; Chien, S.; Skalak, R.; Usami, S. Effects of disturbed flow on endothelial cells. J Biomech Eng. 1998, 120, 2–8. [Google Scholar] [CrossRef]
- Alford, A.I.; Jacobs, C.R.; Donahue, H.J. Oscillating fluid flow regulates gap junction communication in osteocytic MLO-Y4 cells by an ERK1/2 MAP kinase-dependent mechanism. Bone. 2003, 33, 64–70. [Google Scholar] [CrossRef] [PubMed]
- Chien, S. Effects of Disturbed Flow on Endothelial Cells. Ann Biomed Eng. 2008, 36, 554–562. [Google Scholar] [CrossRef]
- Li, J.; He, Y.; Bu, H.; Wang, M.; Yu, J.; Li, L.; Li, H.; Zhang, X.; Cui, X.; Cheng, M. Oscillating shear stress mediates mesenchymal transdifferentiation of EPCs by the Kir2.1 channel. Heart Vessels. 2020, 35, 1473–1482. [Google Scholar] [CrossRef]
- Wang, Y.X.; Liu, H.B.; Li, P.S.; Yuan, W.X.; Liu, B.; Liu, S.T.; Qin, K.R. ROS and NO Dynamics in Endothelial Cells Exposed to Exercise-Induced Wall Shear Stress. Cell Mol Bioeng. 2018, 12, 107–120. [Google Scholar] [CrossRef] [PubMed]
- Wang, Y.X.; Xiang, C.; Liu, B.; Zhu, Y.; Luan, Y.; Liu, S.T.; Qin, K.R. A multi-component parallel-plate flow chamber system for studying the effect of exercise-induced wall shear stress on endothelial cells. Biomed Eng Online. 2016, 15, 154. [Google Scholar] [CrossRef] [PubMed]
- Chen, H.; Cornwell, J.; Zhang, H.; Lim, T.; Resurreccion, R.; Port, T.; Rosengarten, G.; Nordon, R.E. Cardiac-like flow generator for long-term imaging of endothelial cell responses to circulatory pulsatile flow at microscale. Lab Chip. 2013, 13, 2999–3007. [Google Scholar] [CrossRef] [PubMed]
- Lee, J.; Estlack, Z.; Somaweera, H.; Wang, X.; Lacerda, C.M.R.; Kim, J. A microfluidic cardiac flow profile generator for studying the effect of shear stress on valvular endothelial cells. Lab Chip. 2018, 18, 2946–2954. [Google Scholar] [CrossRef]
- Roy, B.; Das, T.; Mishra, D.; Maiti, T.K.; Chakraborty, S. Oscillatory shear stress induced calcium flickers in osteoblast cells. Integr Biol (Camb). 2014, 6, 289–299. [Google Scholar] [CrossRef] [PubMed]
- Shao, J.; Wu, L.; Wu, J.; Zheng, Y.; Zhao, H.; Jin, Q.; Zhao, J. Integrated microfluidic chip for endothelial cells culture and analysis exposed to a pulsatile and oscillatory shear stress. Lab Chip. 2009, 9, 3118–3125. [Google Scholar] [CrossRef] [PubMed]
- Alam, M.K.; Koomson, E.; Zou, H.; Yi, C.; Li, C.W.; Xu, T.; Yang, M. Recent advances in microfluidic technology for manipulation and analysis of biological cells (2007-2017). Anal Chim Acta. 2018, 1044, 29–65. [Google Scholar] [CrossRef] [PubMed]
- Chai, H.; Feng, Y.; Liang, F.; Wang, W. A microfluidic device enabling deterministic single cell trapping and release. Lab Chip 2021, 21, 2486–2494. [Google Scholar] [CrossRef]
- Pattanayak, P.; Singh, S.K.; Gulati, M.; Vishwas, S.; Kapoor, B.; Chellappan, D.K.; Anand, K.; Gupta, G.; Jha, N.K.; Gupta, P.K.; Prasher, P.; Dua, K.; Dureja, H.; Kumar, D.; Kumar, V. Microfluidic chips: recent advances, critical strategies in design, applications and future perspectives. Microfluid Nanofluidics. 2021, 25, 99. [Google Scholar] [CrossRef]
- Saupe, M.; Wiedemeier, S.; Gastrock, G.; Römer, R.; Lemke, K.J.M. Flexible Toolbox of High-Precision Microfluidic Modules for Versatile Droplet-Based Applications. Micromachines. 2024, 15, 250. [Google Scholar] [CrossRef]
- Paik, D.T.; Tian, L.; Williams, I.M.; Rhee, S.; Zhang, H.; Liu, C.; Mishra, R.; Wu, S.M.; Red Horse, K.; Wu, J.C. Single-Cell RNA Sequencing Unveils Unique Transcriptomic Signatures of Organ-Specific Endothelial Cells. Circulation. 2020, 142, 1848–1862. [Google Scholar] [CrossRef] [PubMed]
- Tovar Lopez, F.; Thurgood, P.; Gilliam, C.; Ngan, N.; Pirogova, E.; Khoshmanesh, K.; Baratchi, S. A Microfluidic System for Studying the Effects of Disturbed Flow on Endothelial Cells. Front Bioeng Biotechnol. 2019, 7, 81. [Google Scholar] [CrossRef] [PubMed]
- Xu, G.; Qin, K.R.; Liu, Z.R. Calculation of the Shear Stress in the Parallel- Plate Flow Chamber under Pulsatile Flow Condition. Chinese Quarterly of Mechanics. 2000, 21, 45–51. [Google Scholar]
- Shen, B.Y.; Liu, H.B.; Cao, L.; Qin, K.R. Acute Effects of Different Intensities of Cycling Acute Exercise on Carotid Arterial Apparent Elasticity and Hemodynamic Variables. Biomed Res Int. 2020, 2020, 9027560. [Google Scholar] [CrossRef]
- Alyaseen, N.O.M.; Ahmadpour, A.; Alshara, A.; Rahimzadeh, H. Numerical Simulation of Magneto Hydrodynamics Flow of Blood in Carotid Artery Bifurcation. Jour of Adv Research in Dynamical & Control Systems. 2019, 11, 512–521. [Google Scholar]
- Fojas, J.J.R.; De Leon, R.L. Carotid Artery Modeling Using the Navier-Stokes Equations for an Incompressible, Newtonian and Axisymmetric Flow. APCBEE Procedia. 2013, 7, 86–92. [Google Scholar] [CrossRef]
|
Disclaimer/Publisher’s Note: The statements, opinions and data contained in all publications are solely those of the individual author(s) and contributor(s) and not of MDPI and/or the editor(s). MDPI and/or the editor(s) disclaim responsibility for any injury to people or property resulting from any ideas, methods, instructions or products referred to in the content. |
© 2024 by the authors. Licensee MDPI, Basel, Switzerland. This article is an open access article distributed under the terms and conditions of the Creative Commons Attribution (CC BY) license (http://creativecommons.org/licenses/by/4.0/).
