1. Introduction
Polymer or plastic optical fibers (POF) are large diameter, flexible, low cost, and durable multimode fibers made of different kinds of plastic material, including polymethyl methacrylate (PMMA), polystyrene, polycarbonate and perfluorinated materials [
1,
2]. Although optical fibers are generally made of silica, POF presents the additional advantages of ease of fabrication and operation, low cost, high flexibility, softness, light-weight, higher fracture toughness, higher strain limits, and biocompatibility when compared to silica optical fibers [
3,
4]. Such properties make the POF a relevant technology for applications such as sensors [
5,
6,
7]; local area networks [
1,
8]; and fabrication of devices such as tapers [
9], connectors [
10], couplers [
11,
12], gratings [
13,
14], and even interferometric systems [
13,
15,
16].
Fiber optical filters play a crucial role in communication systems, particularly in wavelength-division multiplexing (WDM). They are also widely employed in spectroscopy and fiber optic sensing. Commercially available, there are two main types of fiber-based filters: fiber Bragg grating (FBG) filters and long-period grating (LPG) filters, both inscribed in the core of a single-mode fiber (SMF). FBG filters function as band rejection filters, whereas LPG filters have the flexibility to be reconfigured into a bandpass filter. This is achieved by using two LPGs in series, facilitating the coupling of resonant light from the fiber core into the cladding and subsequently back into the core [
17]. Nevertheless, these devices are predominantly manufactured using silica fiber [
18,
19,
20]. In recent years, substantial research efforts have been directed towards the development of Fiber Bragg Grating (FBG) filters, exploring alternative materials and techniques [
13,
14,
21,
22]. Furthermore, LPG filters based on POFs for multiple sensing applications have been reported [
21,
23,
24,
25].
Various techniques for creating holes in POFs have been documented, with one such method involving the use of a drill bit [
26,
27], and a mechanical die press print method [
28]. However, these devices are designed for use as sensors. In this work, we take benefit of the valuable technique proposed in [
26,
29] to develop a bandpass filter based on multiple in-Line Holes in POF. Our findings encompass the examination of the spectral transmission of the POF filter with multiple holes spaced by both centimeters and micrometers, employing both in-line and fiber loop mirror schemes, respectively. The results demonstrate that incorporating multiple holes and adopting the fiber loop mirror (FOLM) scheme enables us to fine-tune the bandpass filter. Furthermore, we established that variations in the refractive index within the holes do not alter the profile of the spectral response. However, the response in intensity is sensitive to index changes, and we observed that the loop mirror configuration exhibited heightened sensitivity to refractive index changes at lower concentrations.
2. Experimental Setup
The experimental setup is depicted in
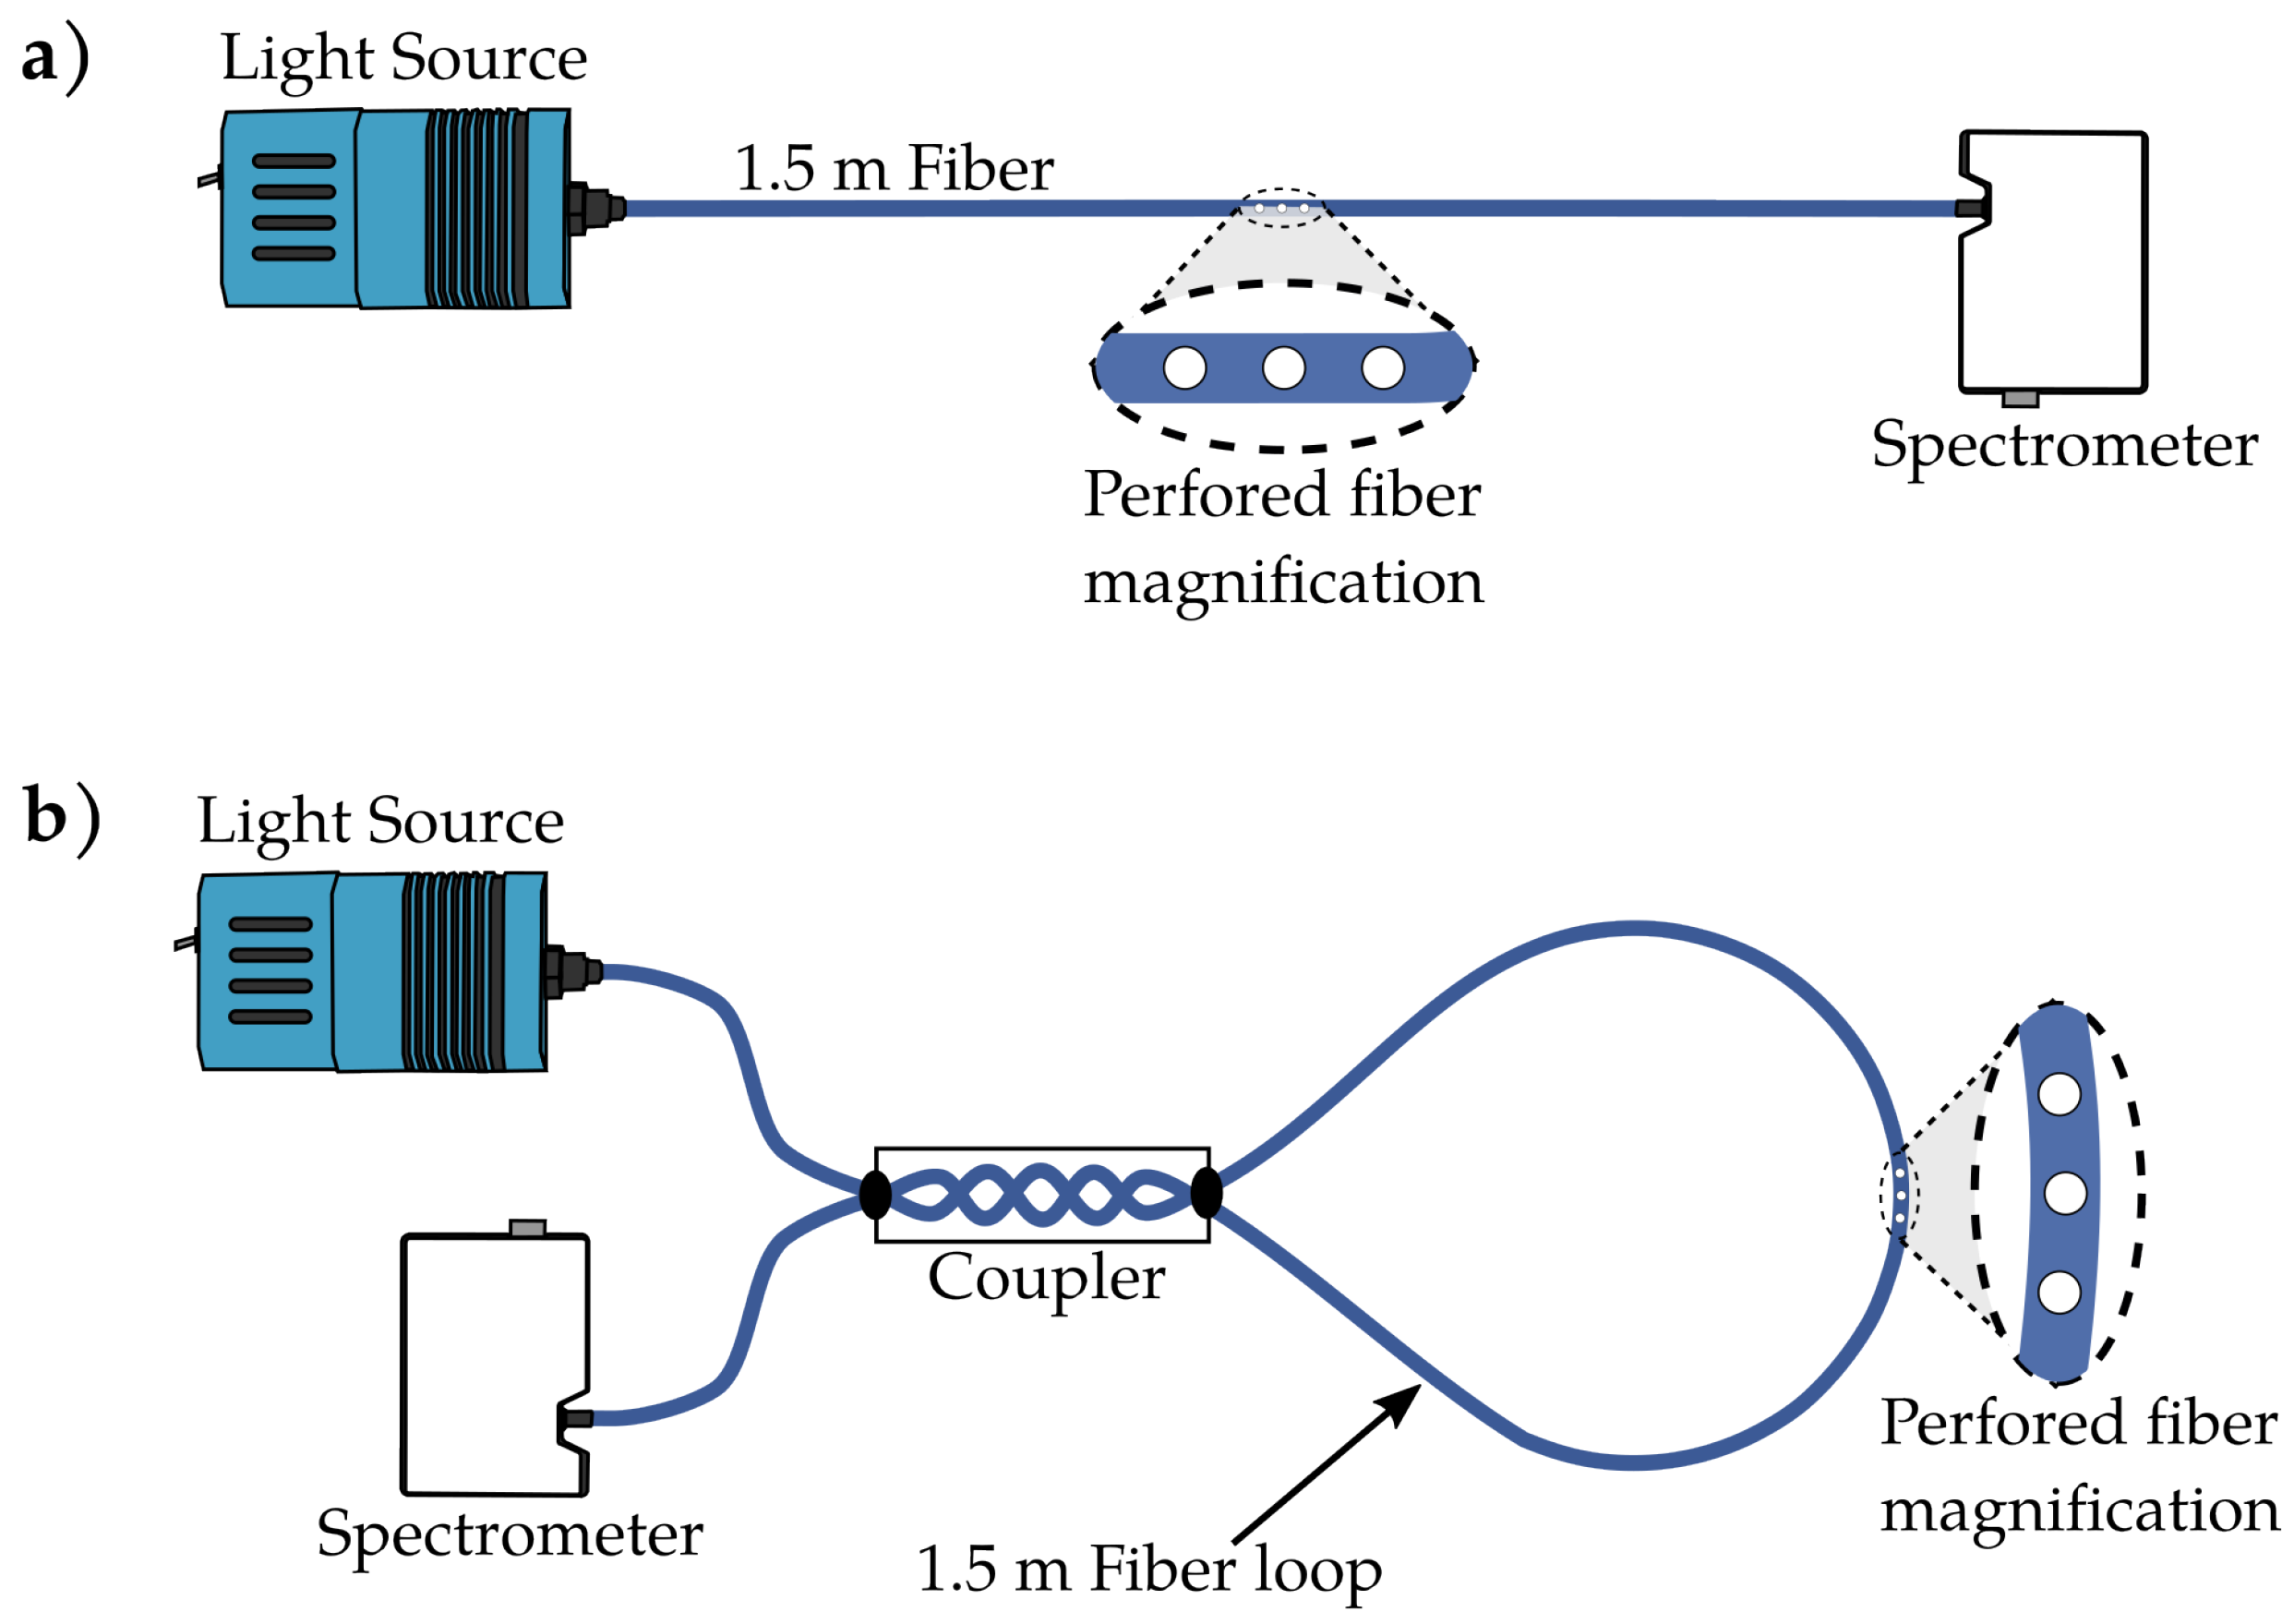
Figure 1, showcasing both the in-line holes (a) and the in-loop mirror holes scheme (b). The configuration involves a 1.5 m long commercial LF-750 Plastic Optical Fiber with a numerical aperture of 0.5. According to technical specifications, the POF core and cladding materials are polymethyl methacrylate and fluorinated polymer, respectively. The refractive index (RI) of the core is 1.49, while that of the cladding is 1.41, forming a step-index profile. The cladding diameter is 750 ± 45 µm, and the core diameter is 735 ± 45 µm. Perforations were made in the middle of the loop, with 1, 2, and 3 holes drilled separately by 500 µm or 1 cm intervals.
The Plastic Optical Fiber Loop Mirror (POFLM) comprises a drum with a 10 cm diameter, around which the POF is coiled. A tungsten lamp serves as a broadband light source, and the output light is analyzed using an Ocean Optics spectrometer (model USB2000CXR). Characterization of the spectral filter is conducted by measuring transmittance as a function of the number of holes. Additionally, the sensing of refractive index is examined by filling the holes with dextrose (D-Glucose, J. T. Baker) concentrations, ranging from distilled water to saturation. The specific dextrose solutions cover a density range from 0 g/100ml (pure distilled water) to 33 g/100ml, with intermediate concentrations at intervals of 3 g/100ml.
Figure 1.
Schematic diagram Fiber optical filters: (a) in line, (b) POFLM configuration.
Figure 1.
Schematic diagram Fiber optical filters: (a) in line, (b) POFLM configuration.
For the POFLM, the coupler manufacturing process follows the same procedure as described in [
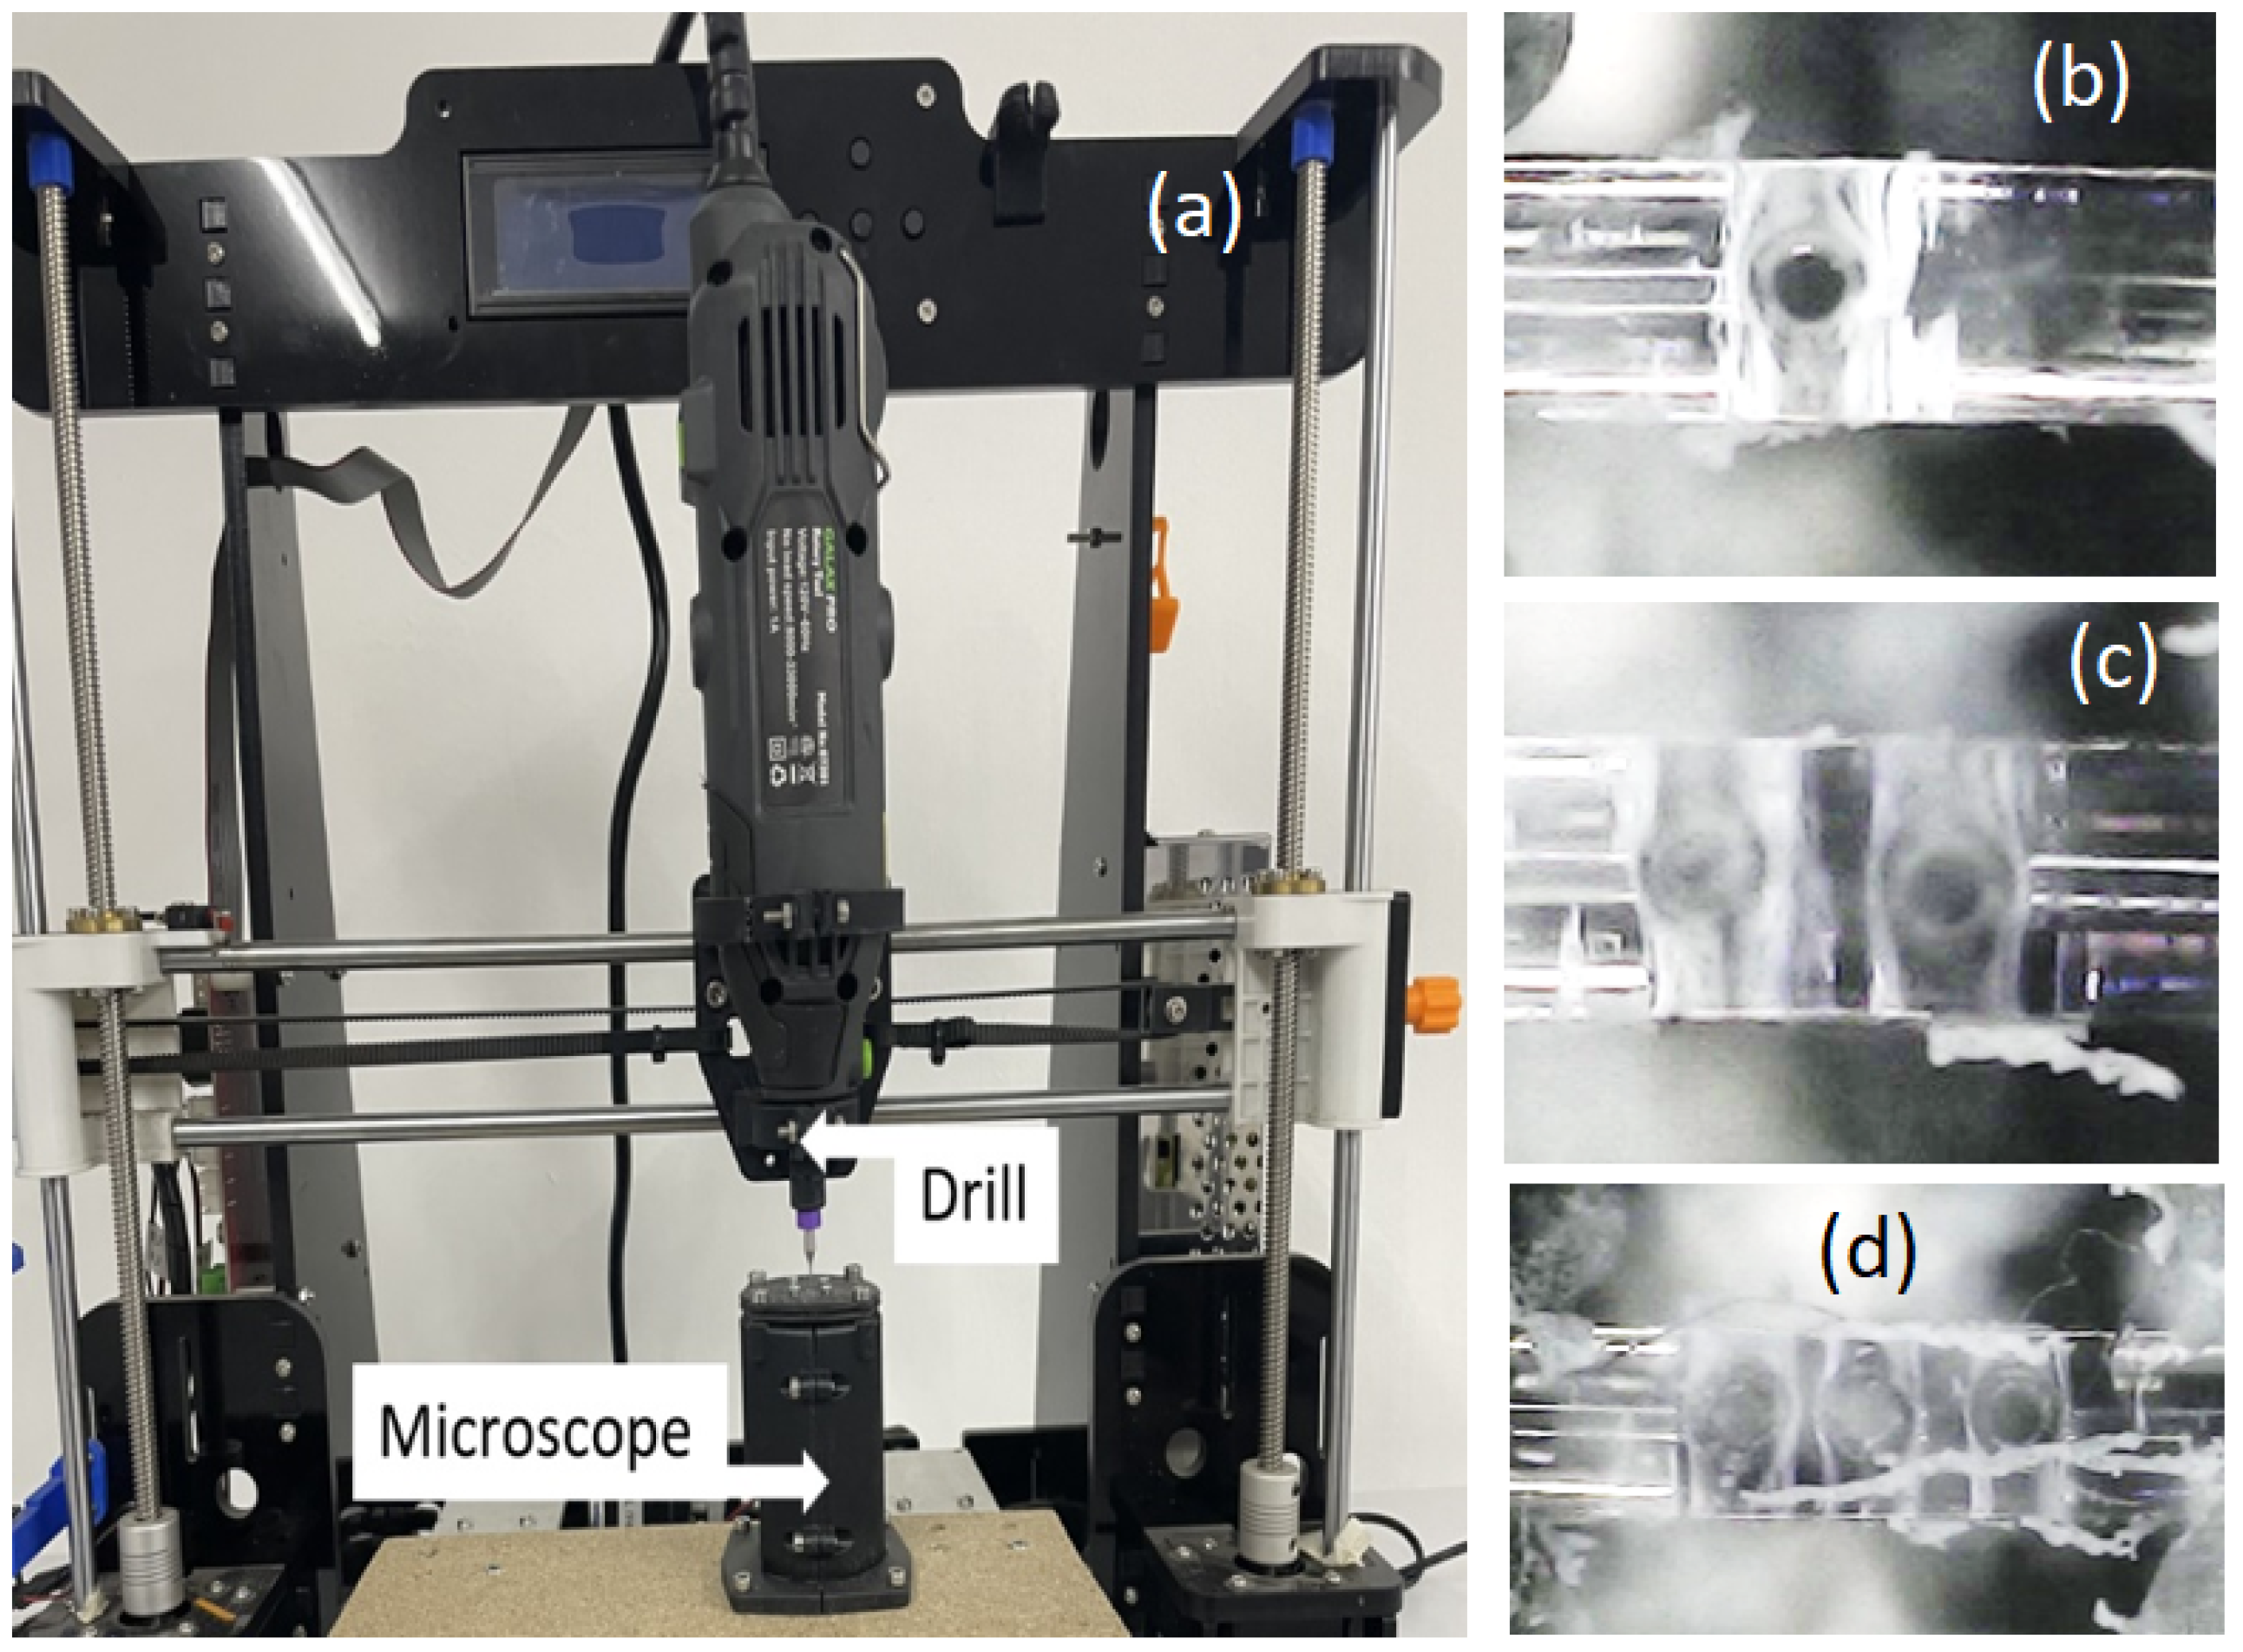
16]. However, in this study, additional environmental protection is provided to the coupler by enclosing it with a metallic tube. The in-line sub-millimeter holes were created using a Computer Numerical Control (CNC) mounted drill for 3D printing, as illustrated in
Figure 2. A 200
m diameter drill was employed in the process, with a commercial optical microscope (Bysameyee, model SA-00) used for real-time monitoring of the perforation. Subsequently, the transmission of several fibers and POFLMs with multiple perforations was measured, as depicted in
Figure 1.
In addition, various solutions, ranging from the lowest to the highest refractive index, were introduced into the holes. Each solution was carefully poured into a small container containing the holes. Due to the challenging removal of the highest index solution from the hole, extra care was taken for accurate results. After measurement, the liquid was extracted using a syringe, absorbed with paper, and then dried by blowing air, ensuring the output power matched that of the hole filled with air. This process was repeated for each solution.
Figure 2.
a) CNC-POF perforation system, b) one hole, c) two holes, and d) three holes. The holes are separated by 500 m.
Figure 2.
a) CNC-POF perforation system, b) one hole, c) two holes, and d) three holes. The holes are separated by 500 m.
3. Results and Discussions
POF exhibits inherent losses attributed to factors such as absorption in the constituent material and Rayleigh scattering. These losses arise from molecular vibrational absorption of groups like C-H, N-H, and O-H, absorption due to electronic transitions within molecular bonds, and scattering resulting from fluctuations in composition, orientation, and density [
30,
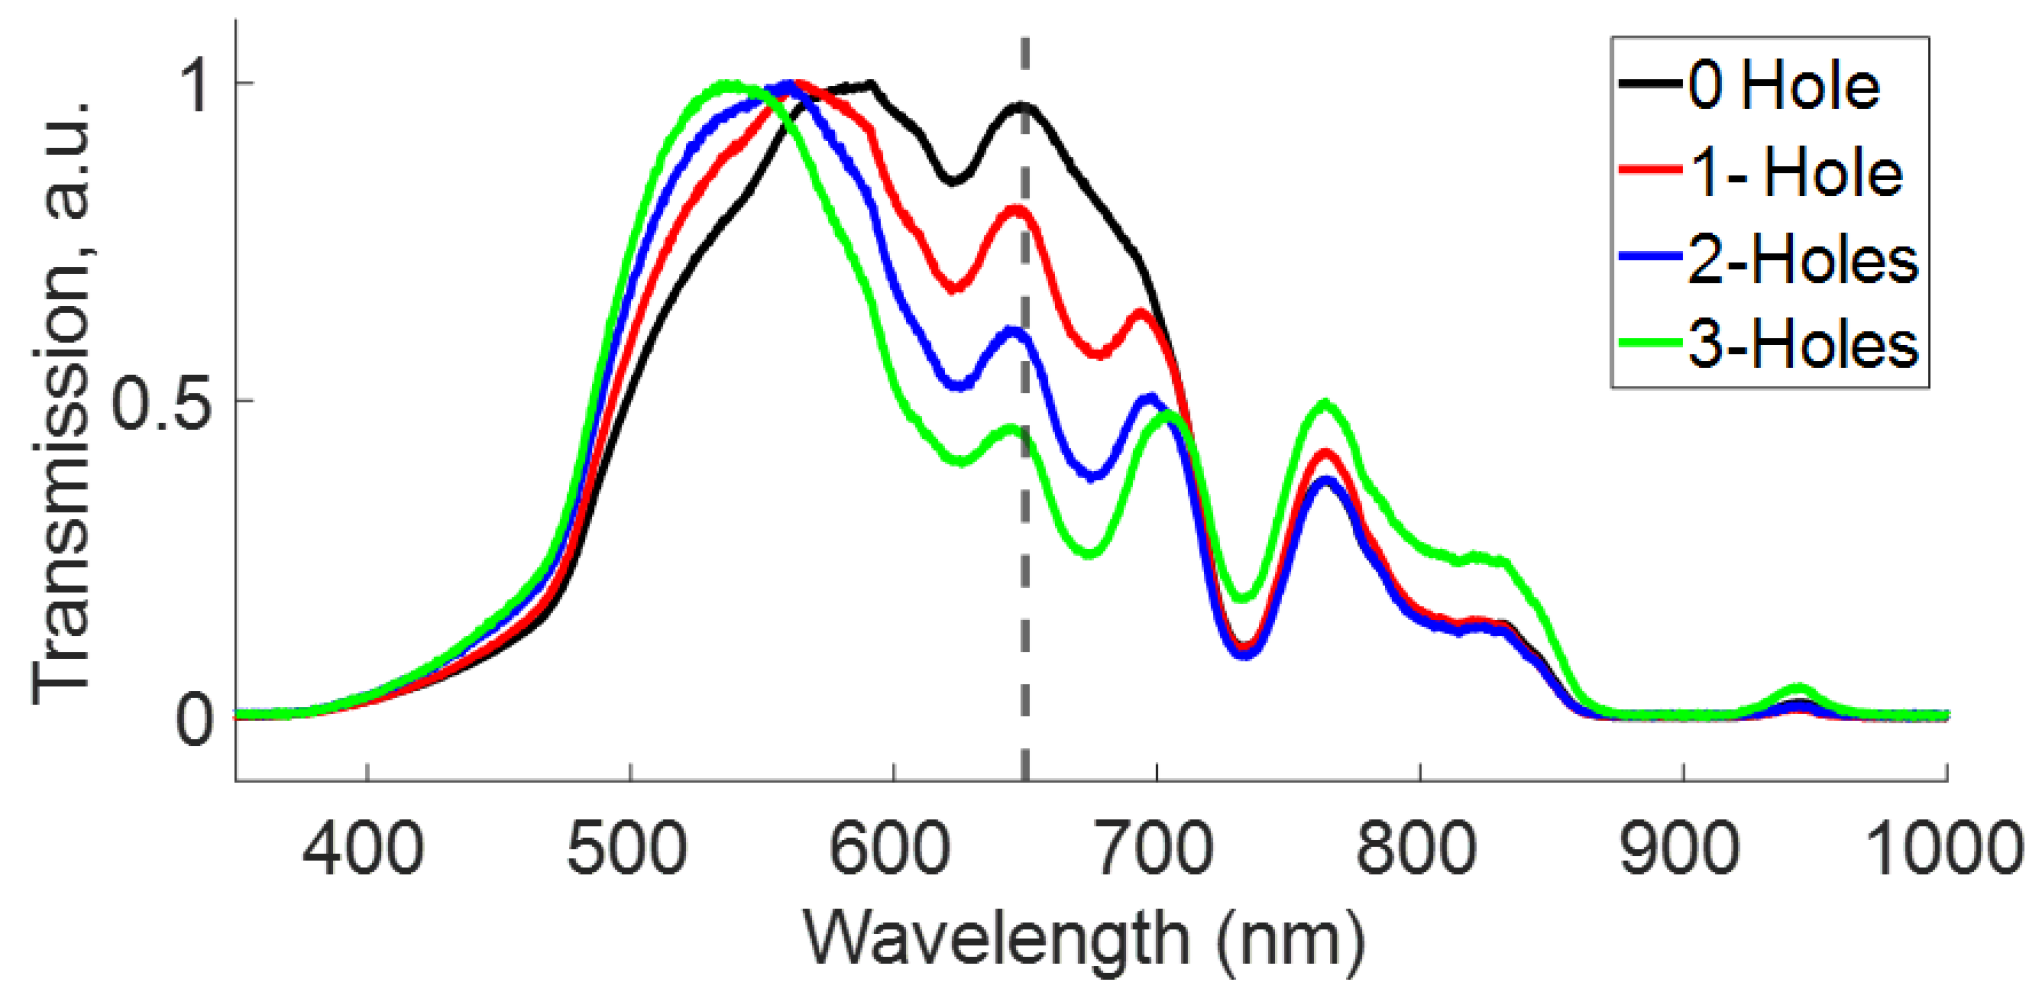
31]. However, extrinsic losses can be introduced into POF by altering its transmission through perforations, as proposed by the authors for refractive index sensing. Experimental results confirm that the spectral transmission of POF is indeed modified by the presence of holes, as illustrated in the traces in
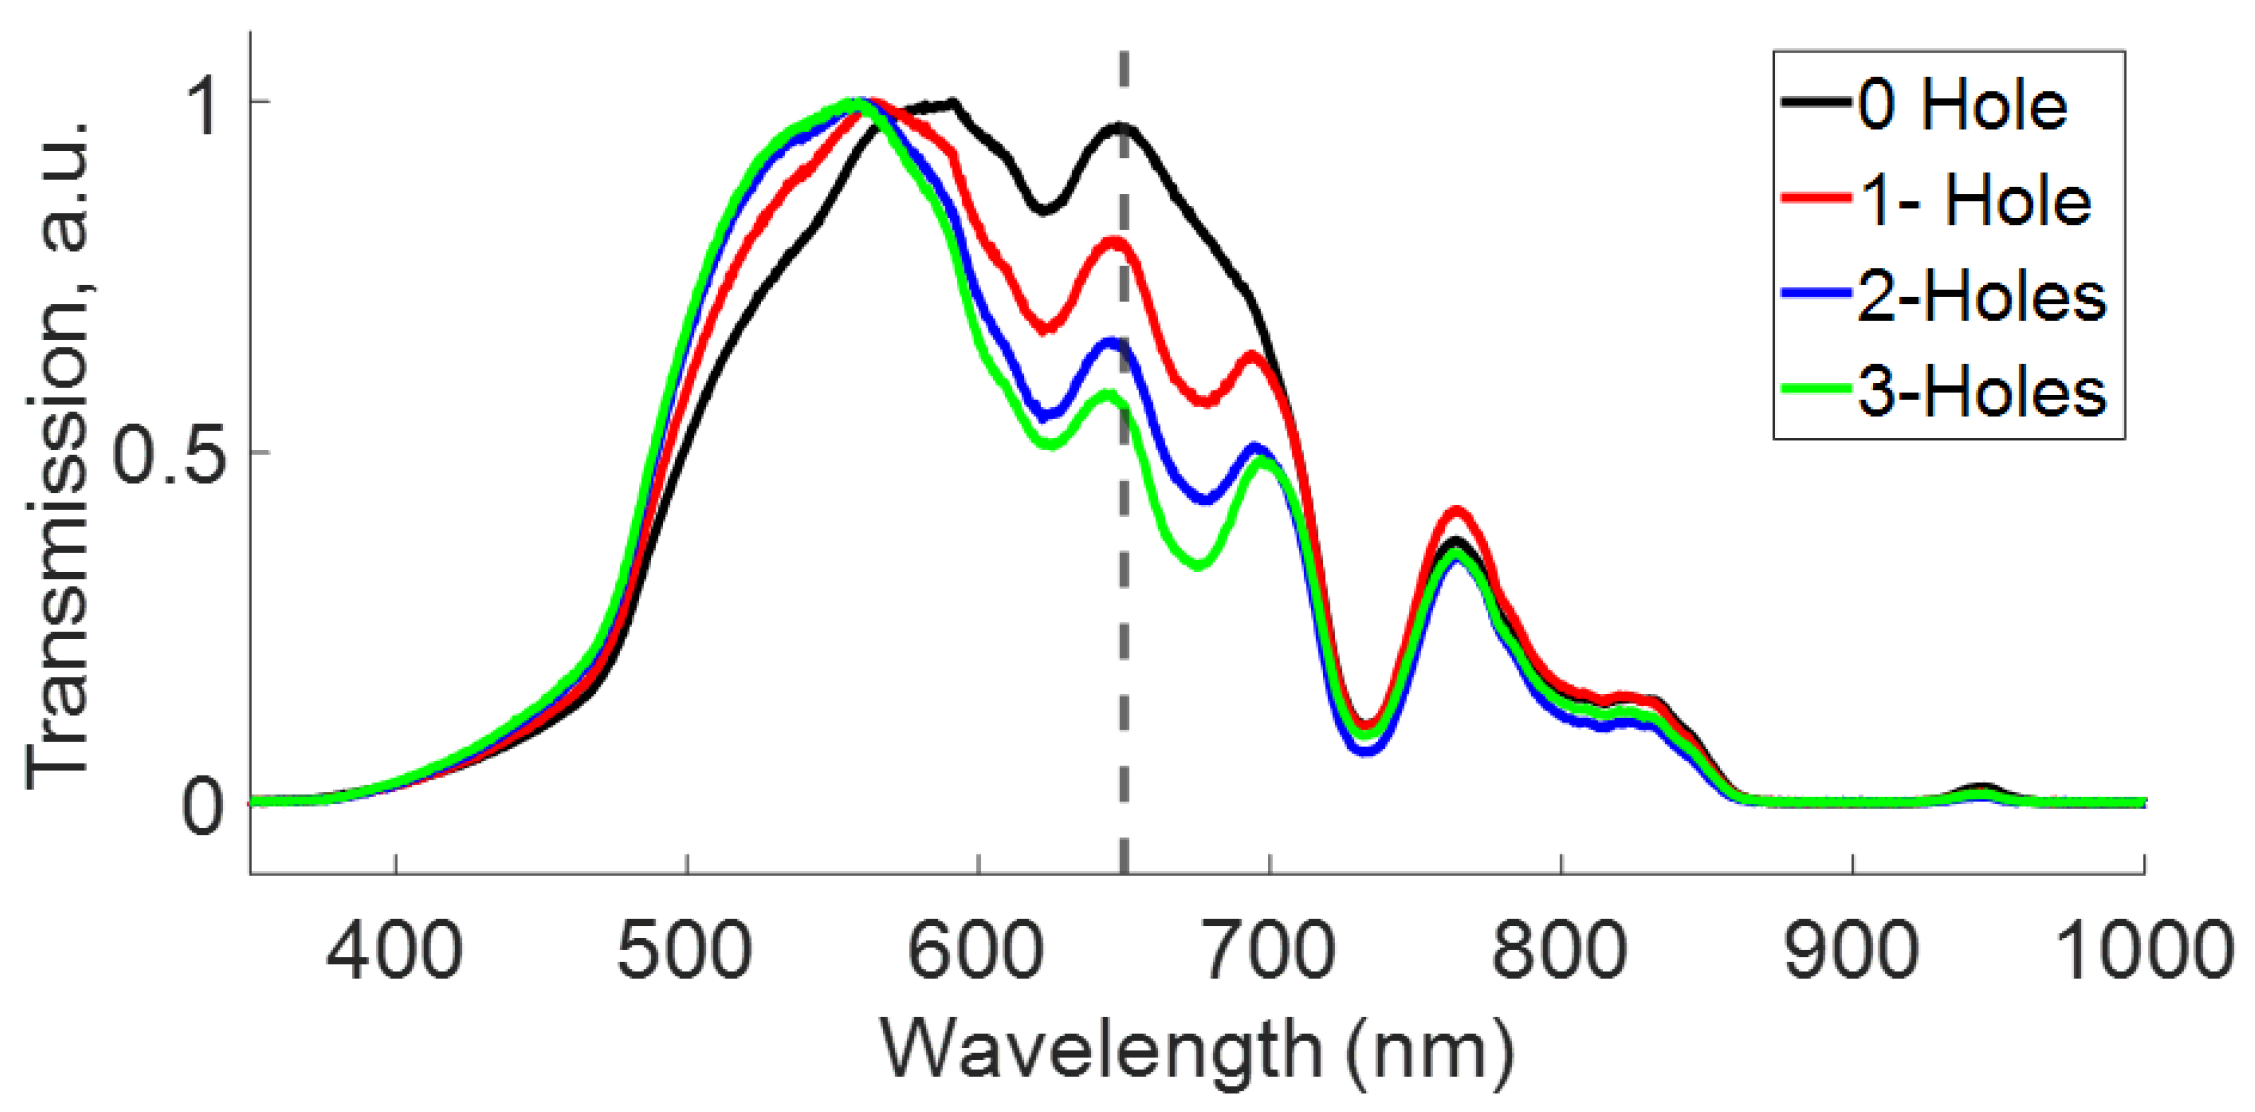
Figure 3. These measurements, depicted in a straight line as shown in
Figure 1(a), reveal two significant regions.
The first region spans approximately 470 nm to 600 nm, where the spectral transmission experiences a blue shift with an increasing number of holes in the POF. In this region, at maximum transmission, the traces exhibit a blue shift of 587nm, 567nm, 556nm, and 536nm for 0, 1, 2, and 3 holes in the fiber, respectively. The second region, encompassing 600nm to 710nm, shows a decrease in transmission intensity as the number of holes in the POF increases. Specifically, at 650 nm (indicated by the dashed line in
Figure 3), a second peak displays a decrease in transmission intensity of 0.963, 0.792, 0.597, and 0.438 for 0, 1, 2, and 3 holes, respectively. This peak also exhibits a modest blue shift as the number of holes is increased. Moreover, the first region indicates a bandpass of approximately 115.78nm measured as the full width at half maximum (FWHM). Considering both regions, an estimated period of the spectral filter is around 120nm. It’s essential to note that the traces are normalized, for the sake of comparison as fibers with more holes exhibit lower transmission intensity.
Figure 3.
Transmission in In-line, several holes separated by 1 cm. The vertical dashed line displays the 650 nm wavelength.
Figure 3.
Transmission in In-line, several holes separated by 1 cm. The vertical dashed line displays the 650 nm wavelength.
Total Internal Reflection (TIR) is the primary phenomenon governing the transmission of light in optical fibers. However, the presence of holes alters the conditions for TIR, as illustrated by Shin in [
26,
29], where the holes are considered as lenses with varying refractive indices in the POF. In our investigation, we measured the transmission through a 1.5 m section of POF with several holes separated by approximately 500 micrometers to assess the impact of the hole distance on our results.
Figure 4 illustrates that the transmissions of fibers with holes separated by micrometers closely resemble the transmission when the holes are spaced 1cm apart, as depicted in
Figure 3, showing a large blue shift of the left peak and signal decay around 650 nm. The results suggest that the elimination of spectral components occurs solely due to the presence of holes. Furthermore, the number of holes allows for tailoring the transmission of the bandpass filter.
On the other hand, taking advantage of the experience acquired in previous work [
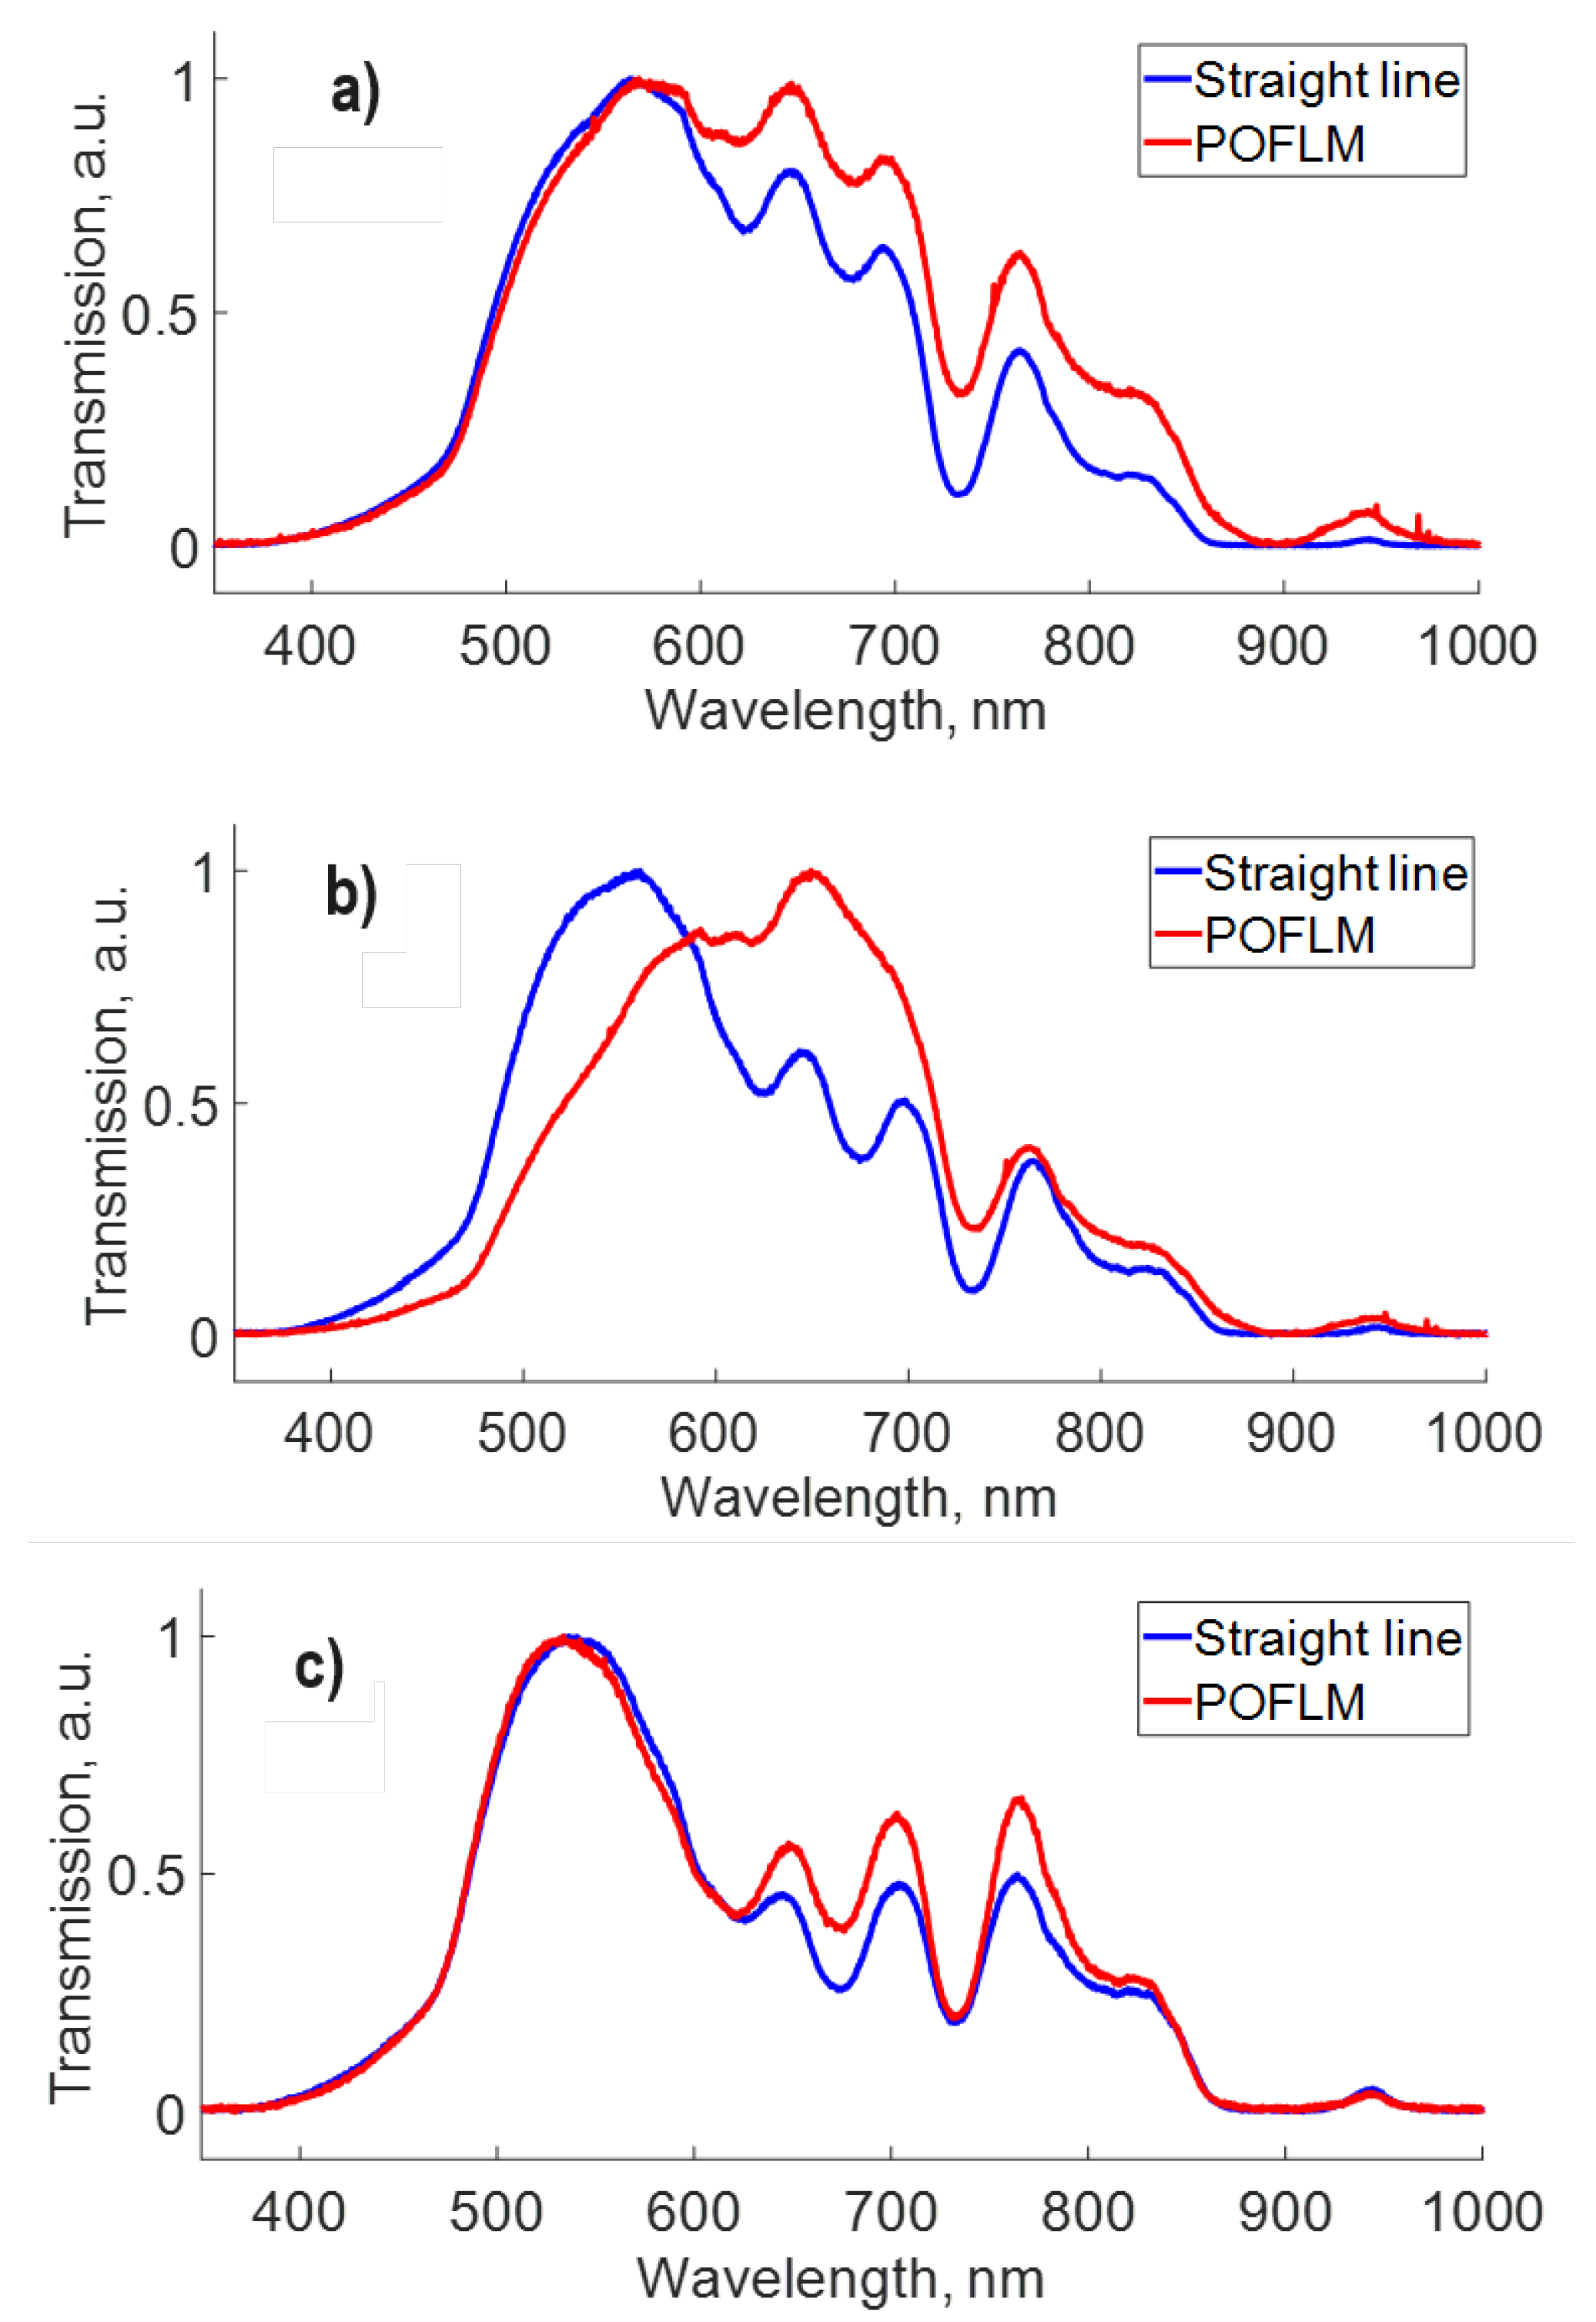
16], we analyzed the response with perforations in the loop of POFLM as shown in
Figure 5, see
Figure 1(b). The first region (470-600 nm) similarly describes a blue shift of traces when increasing the number of holes. However, the second region (600-710 nm) depicts variation in the transmission intensity. Transmission of straight line (blue trace) depicts a minor intensity in the second region, in comparison with a POFLM (red trace) for 1, 2, and 3 holes dis-played in
Figure 5 (a), (b), and (c), respectively. As displayed in the same figures, the results suggest that the bandpass filter can eliminate better in some spectral components in the straight-line scheme configuration than in POFLM. In addition to the perforations, it is possible to note that traces of transmission for POFLM configuration are very different between them, suggesting that the tuning of bandpass is possible in the POFLM. Interestingly, for the POFLM with 2 holes, the maximum of transmission shifts from the first to the second region. We attribute this filter tuning to multimode interference ocurring at the output of POFLM, producing a stable output due to the averaging effect over the modes, as reported in [
32].
The fiber optic loop mirror is widely recognized as a simple and robust structure, created by forming a fiber loop between the output ports of a directional 2X2 coupler. To assess the impact of curvature in the loop fiber within our setup, we conducted measurements on the transmission through a 1.5 m section of fiber, both in a straight line and coiled on a drum.
Figure 6 illustrates that the spectral transmission remains unaffected by the curvature introduced by coiling the fiber on a drum with a 10cm diameter. However, no significant variations in transmission traces were observed within the range of 400nm to 850nm, with a minimal difference of 0.0414 intensity at 764nm. From the observations presented in
Figure 6, we can conclude that the curvatures of the fiber in the drum do not alter the spectral transmission.
The optical directional coupler serves as a crucial component in the construction of a fiber loop mirror. For characterization purposes, we measured the spectrum at the output ports of a specially manufactured directional 2X2 coupler. The coupler was developed using the twisting technique of POF along approximately 5 cm, as illustrated in [
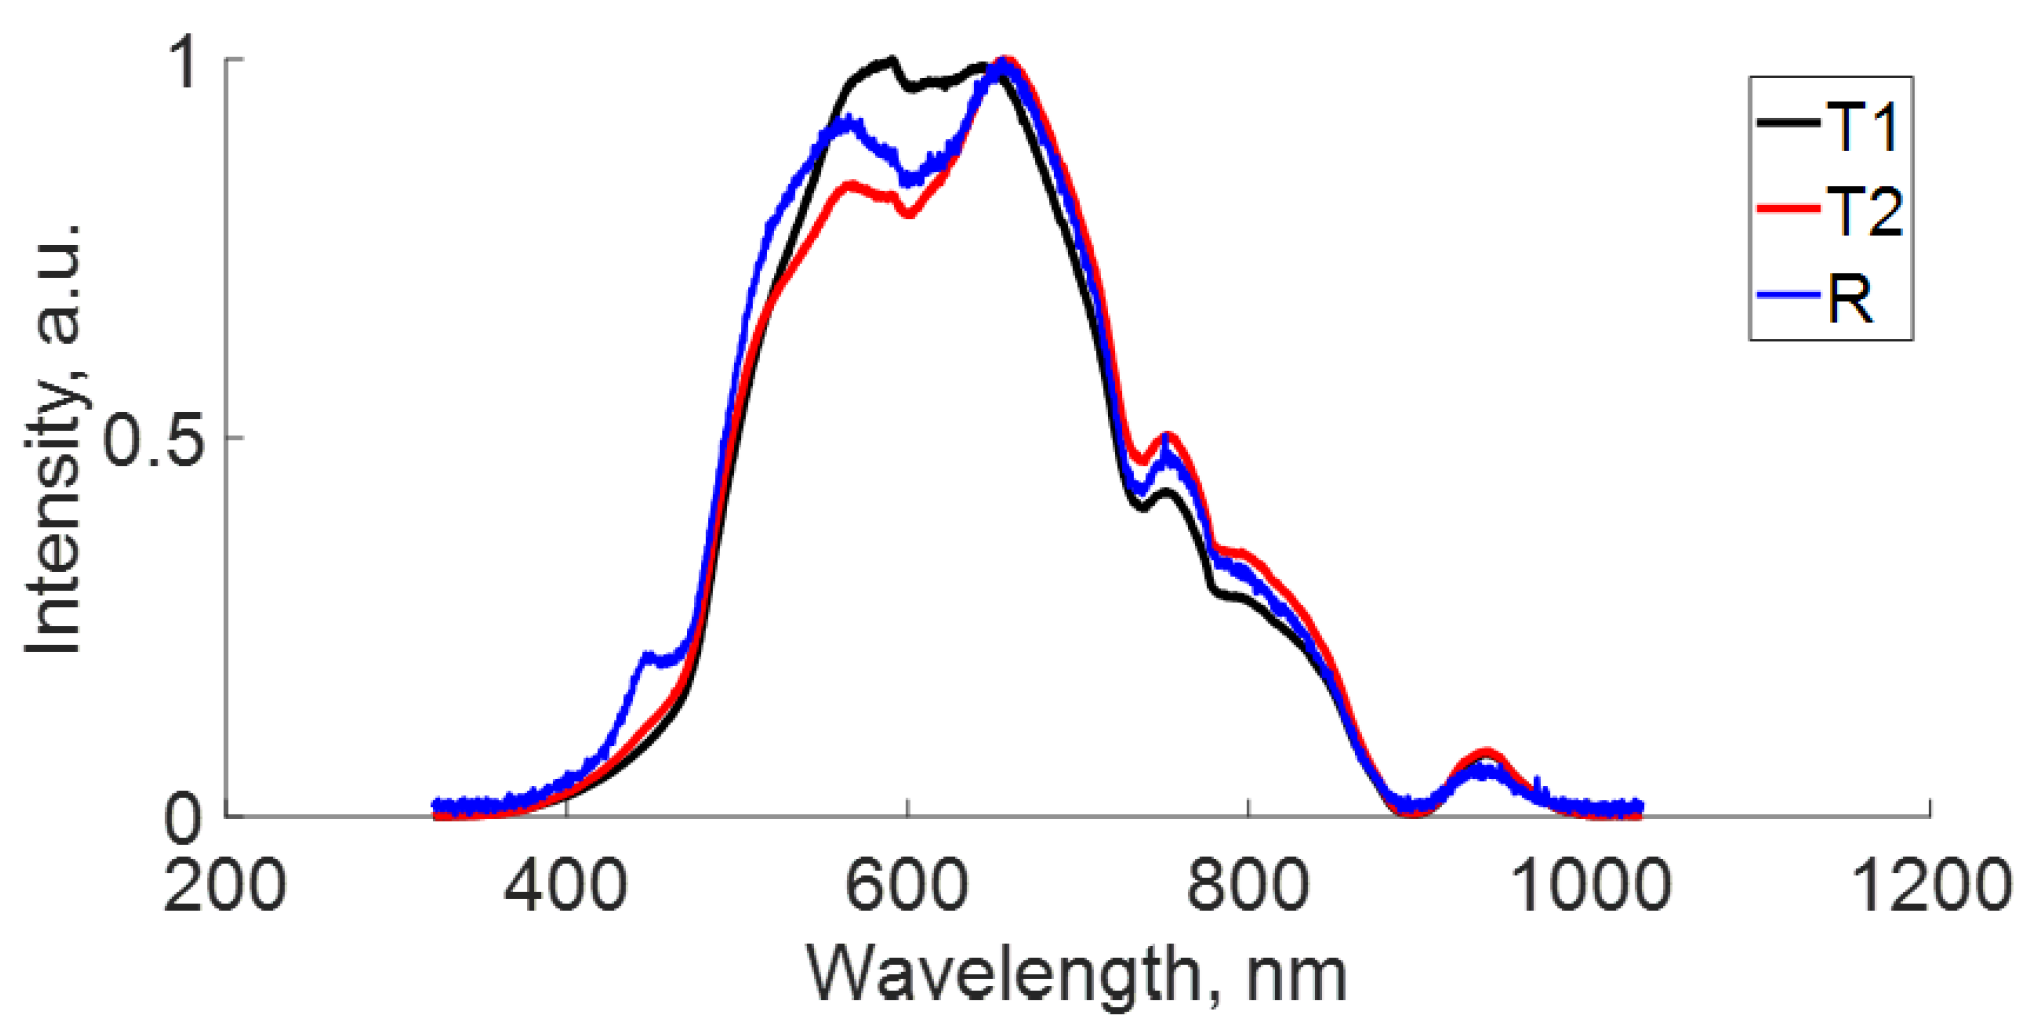
16]. It’s essential to note that one port of the coupler serves as the input for light. The output ports are designated as follows: the output port of the active fiber (the same input fiber) is marked as T1, the output port of the passive fiber (which receives the signal from the active fiber) is marked as T2, and the output port where the signal is reflected by Fresnel reflection is marked as R. The spectra measured at each port are depicted in
Figure 7.
In the same figure, notable differences are observed in the region from 470 nm to 600 nm. However, from 600 nm to 1000 nm, all spectra exhibit a similar behavior. At 591 nm, the traces display an intensity of 1.0, 0.861, and 0.821 for output ports T1, R, and T2, respectively. The traces in the same figure indicate that the fiber optic filter is not affected by the coupler for wavelengths beyond 600nm, as demonstrated in
Figure 5. However, wavelengths before 600nm exhibit different attenuation at each port, suggesting that the filter can be tuned in this region by the coupler.
Figure 7.
Influence of coupler in the spectral response at the outputs T1 (active fiber), T2 (passive fiber), and R (reflected) for a coupler fabricated with two fibers twisted 5 times.
Figure 7.
Influence of coupler in the spectral response at the outputs T1 (active fiber), T2 (passive fiber), and R (reflected) for a coupler fabricated with two fibers twisted 5 times.
It is crucial to note that the coupler was homemade, which may affect the reproducibility of the results. Nevertheless, when compared to conventional optical fibers, the affordability and simplicity of POF technology push traditional fibers to a secondary position in domestic networks. It is anticipated that in the near future, POFs will undergo a market explosion driven by the extensive deployment of fiber to the home (FTTH) and potentially within the home itself. [
33].
Slight variations during manufacturing may impact signals at different output ports, particularly in terms of the coupling ratio. However, deliberate changes were introduced during manufacturing, specifically variations in the torsion of the coupler, to assess the spectral influence of these changes at each output port.
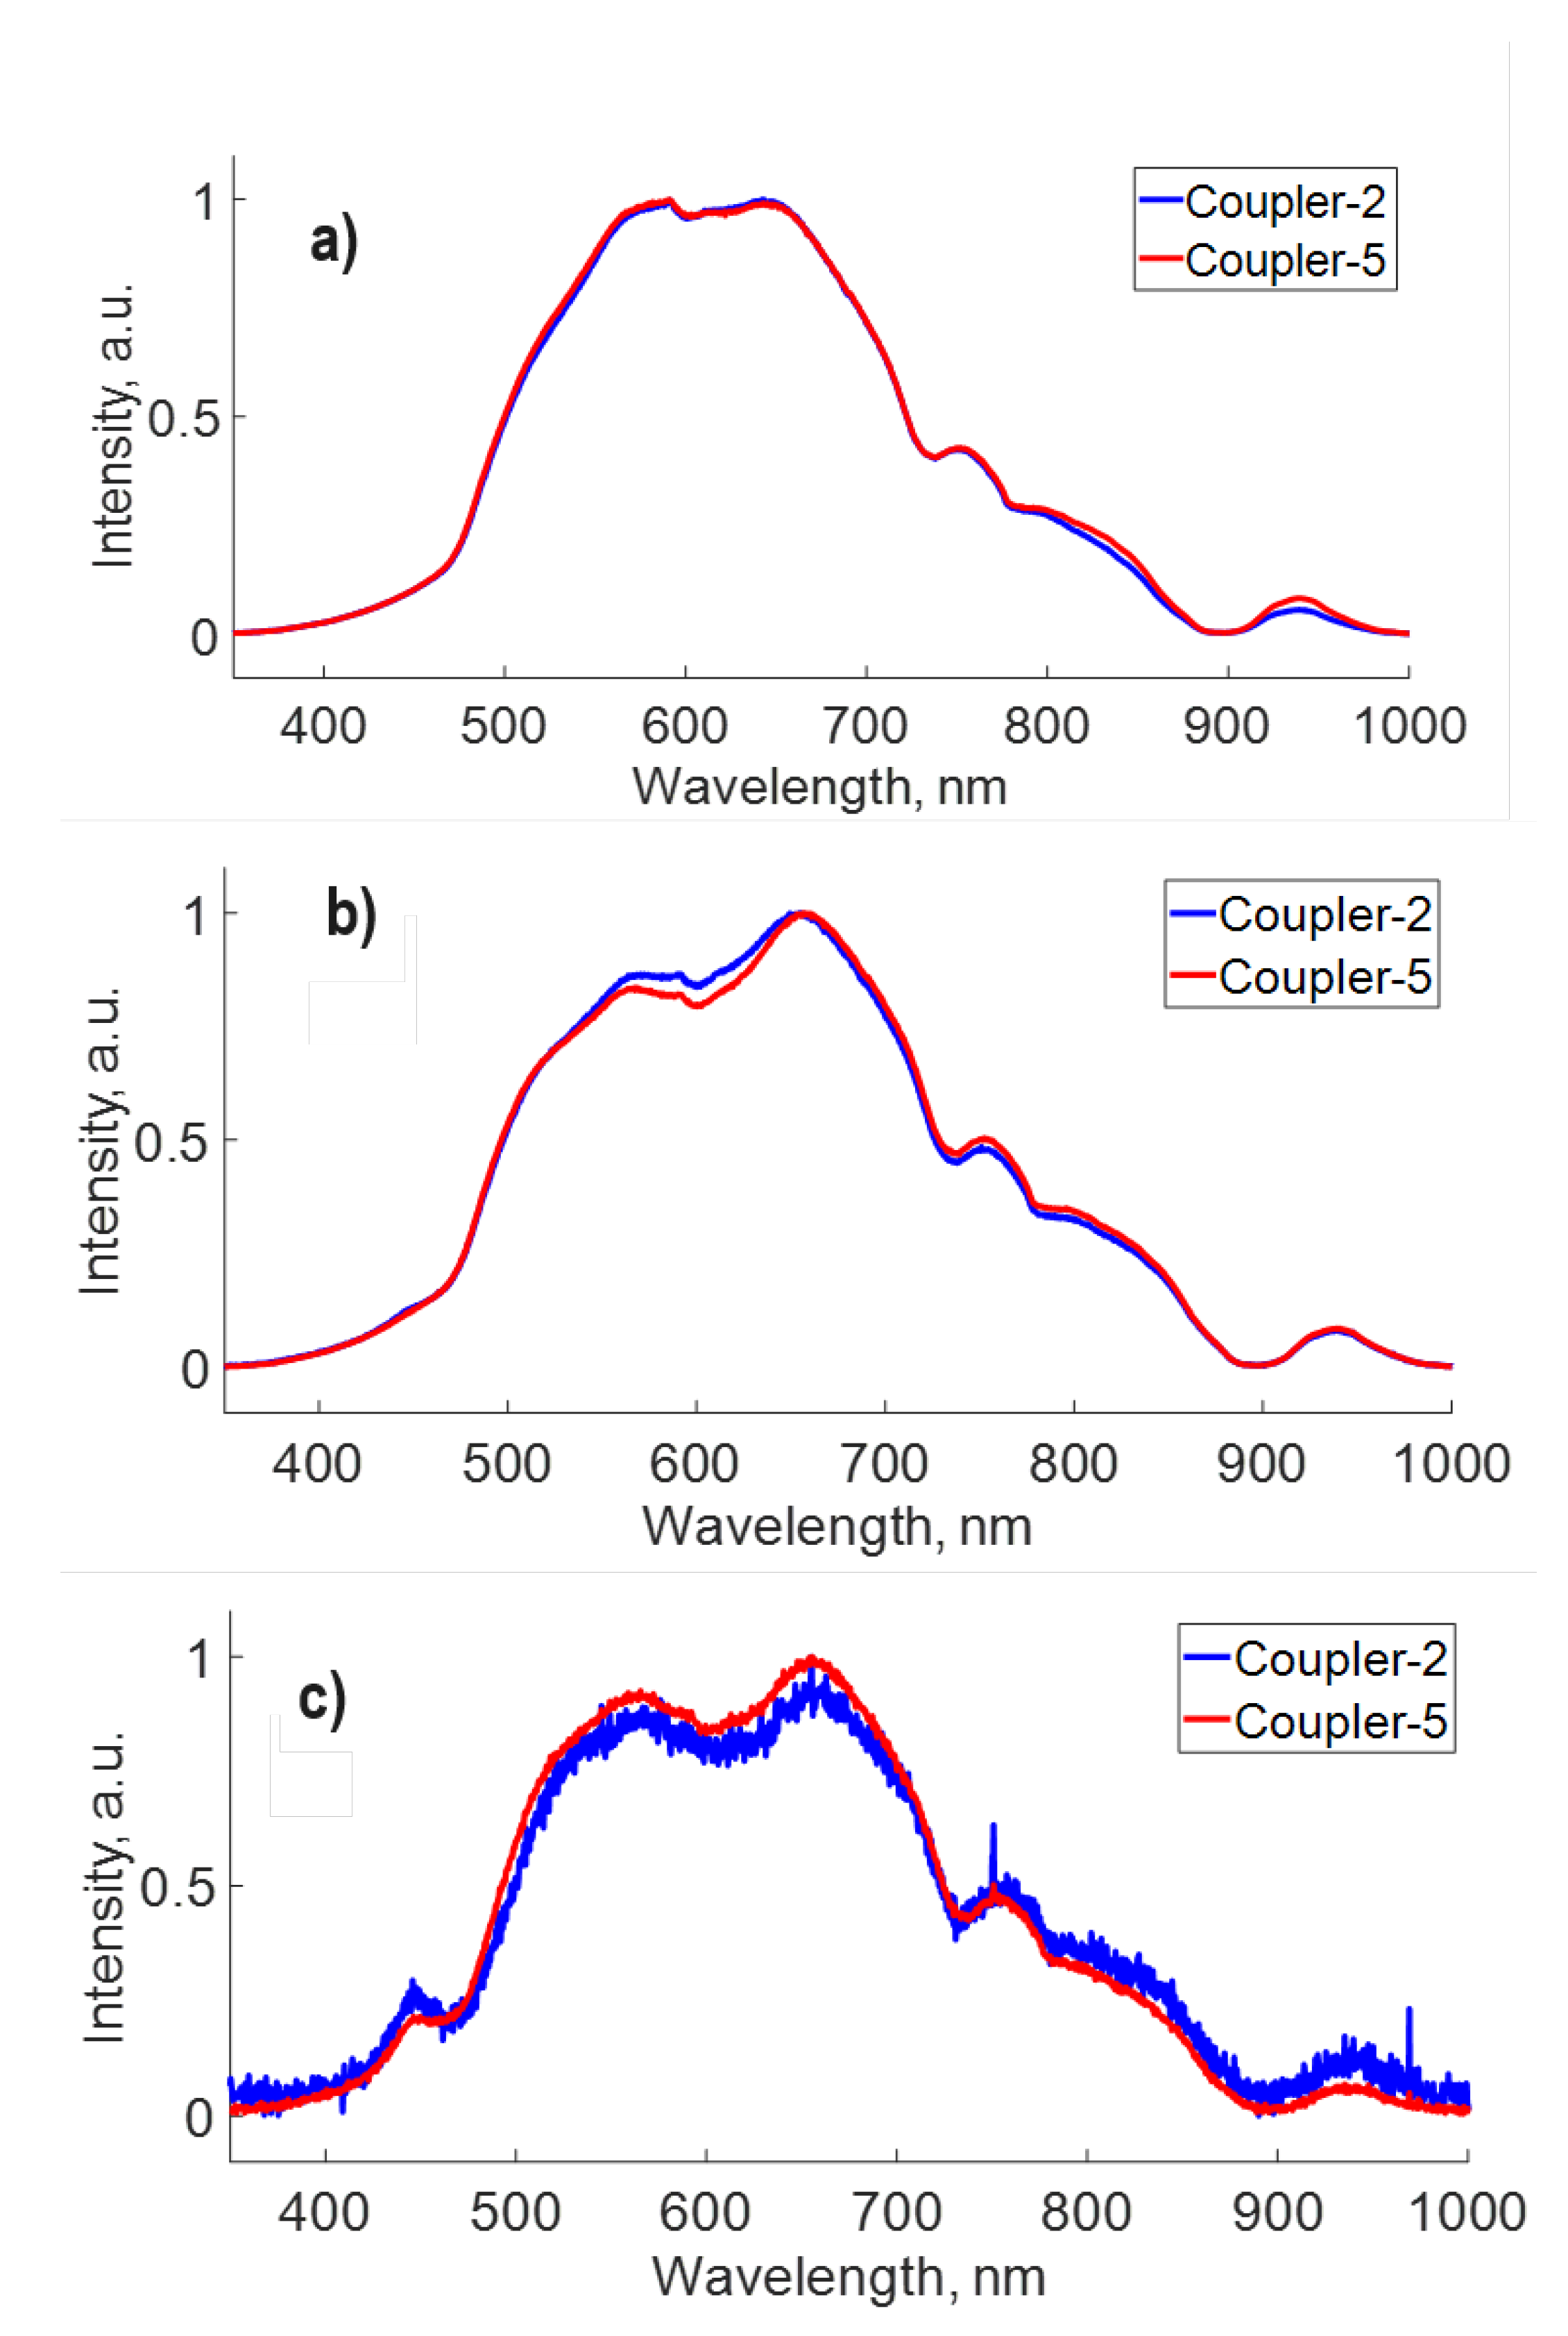
Figure 8 presents a spectral comparison of two couplers, each spectrum measured at the T1, T2, and R output ports, manufactured by twisting the fiber ends with two and five times, respectively. The signal at each output port for both couplers is displayed in
Figure 8a, b, and c. Notably, the spectral traces measured at the respective ports are very similar for both couplers. These traces reveal that the number of twists does not significantly modify the spectral transmission at the output ports.
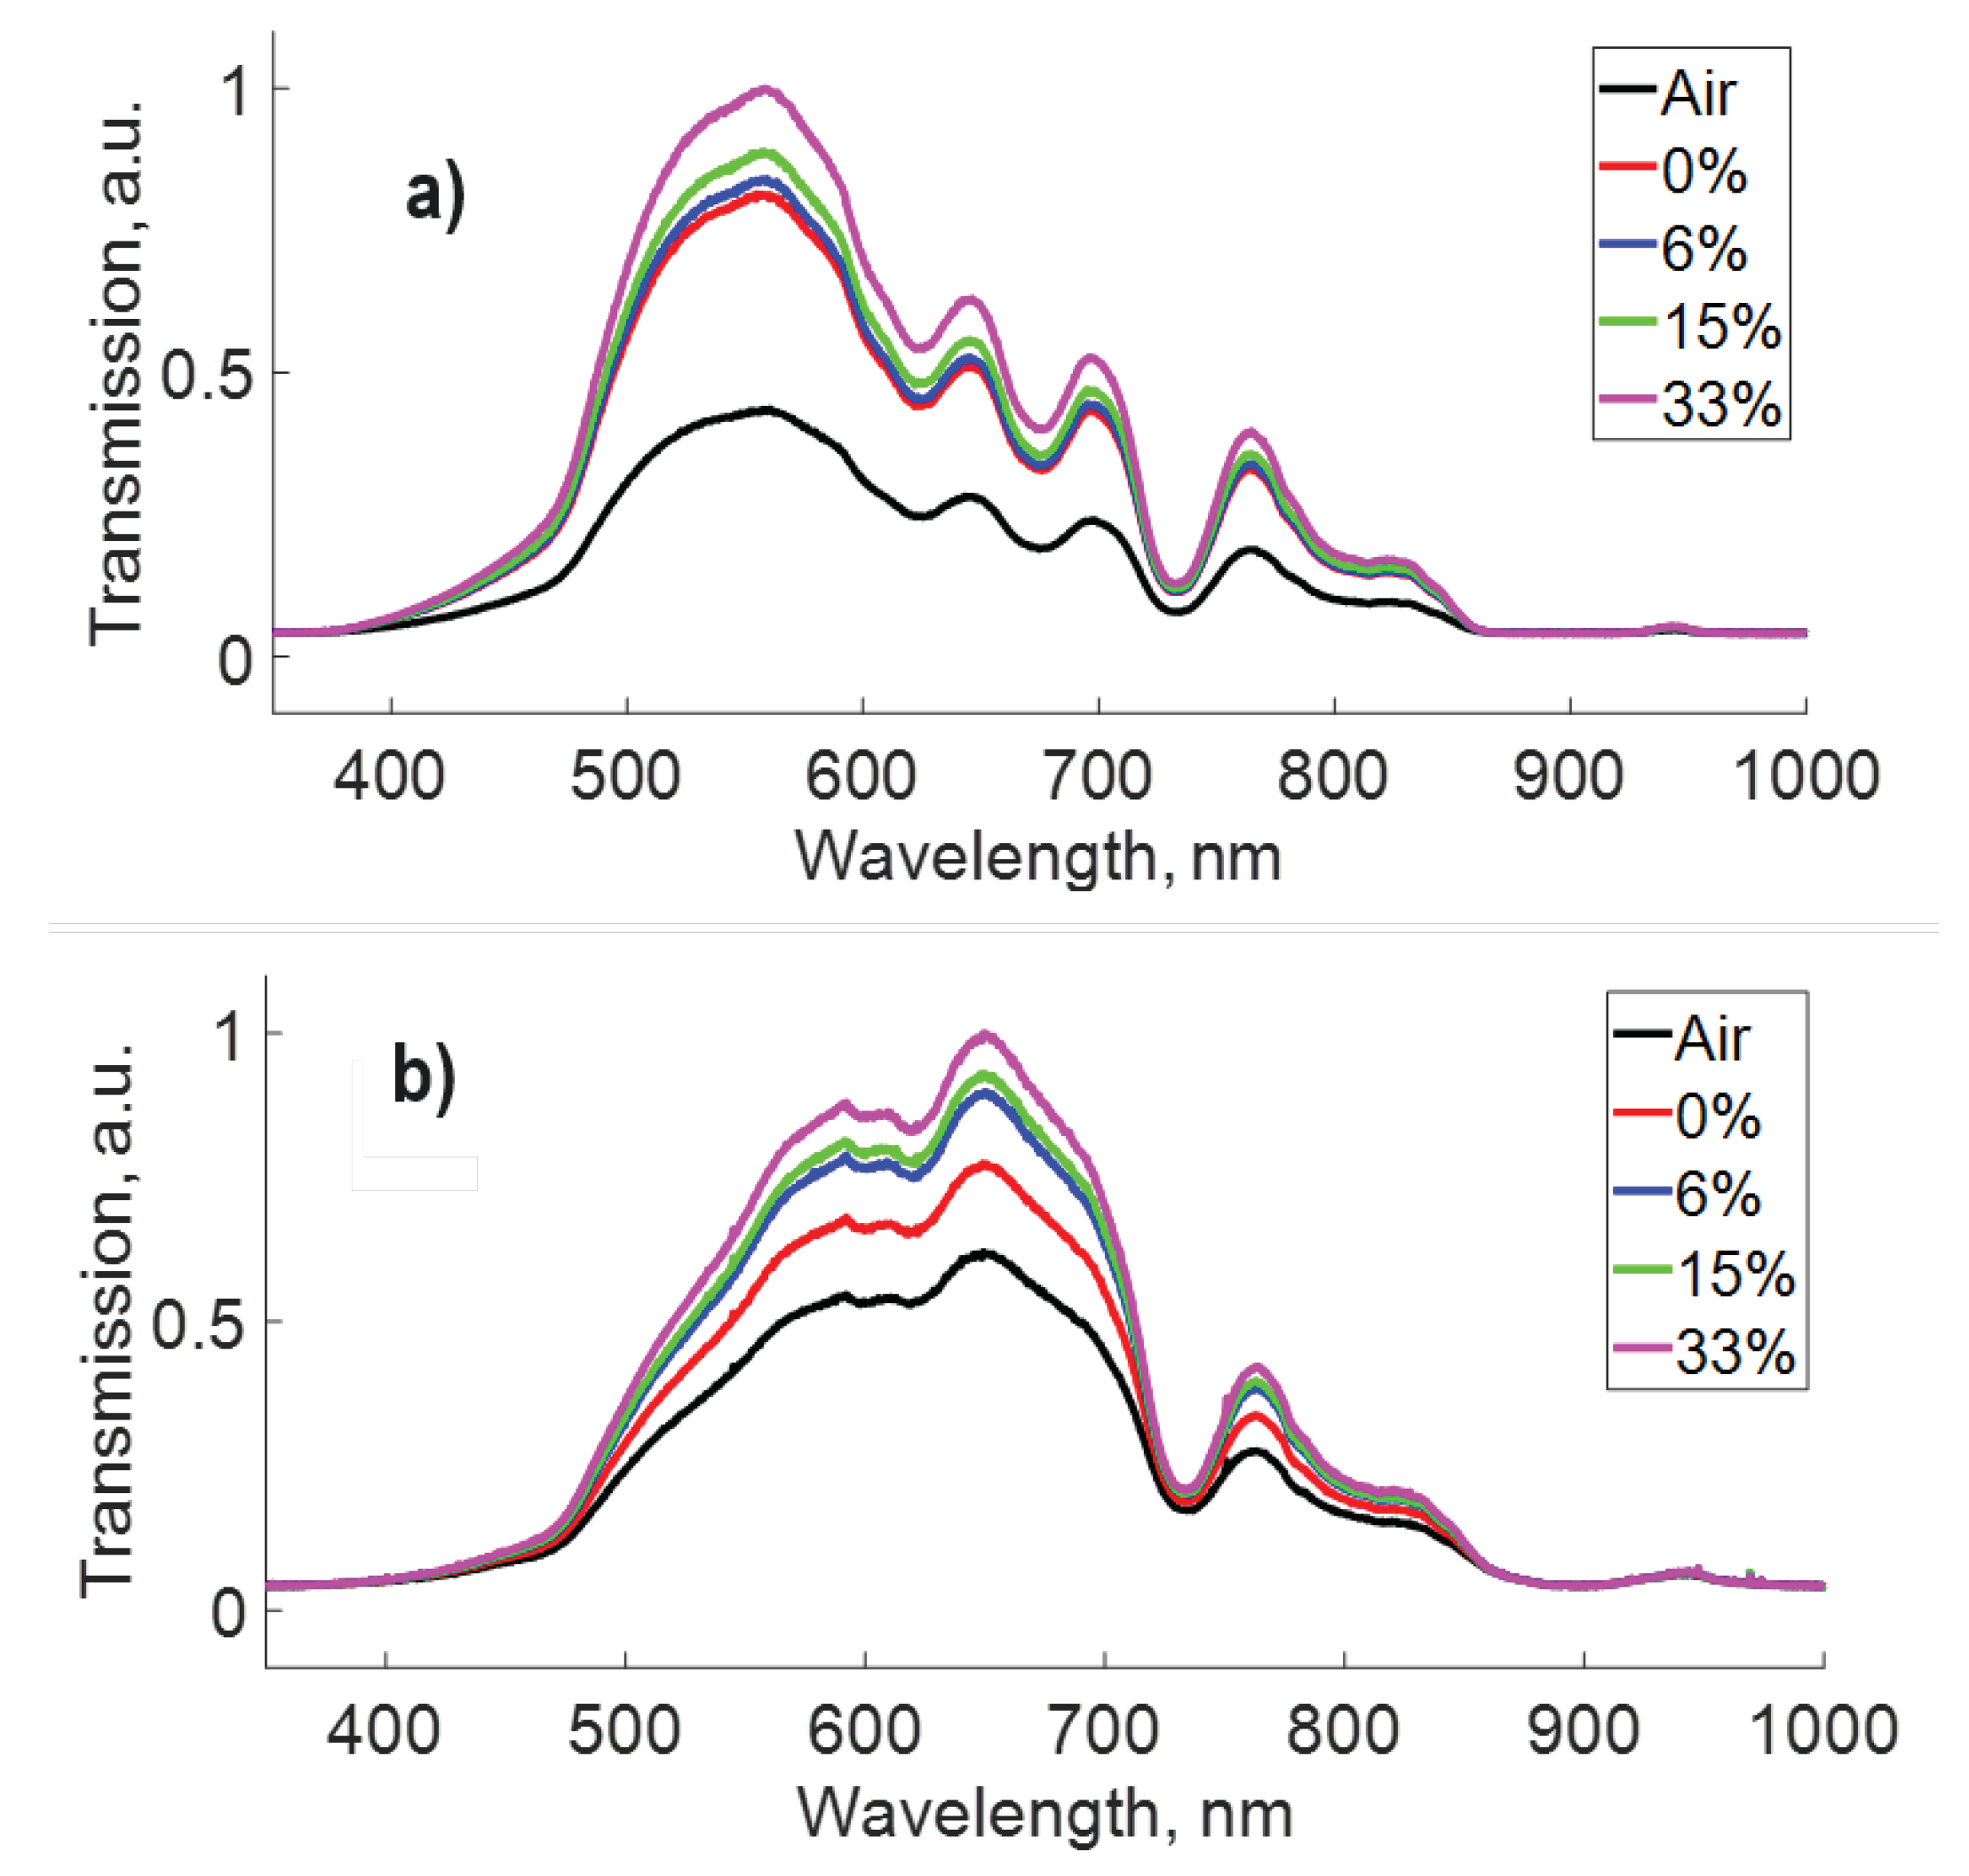
Figure 9 illustrates the transmission measurements of the fiber optical filter (with two holes) for different values of refractive indices of glucose solutin filling the holes, comparing the results for both in-line (straight line) configuration (
Figure 9a) and in-loop mirror (POFLM) configuration (
Figure 9b). In the in-line configuration (
Figure 9a), the transmission of the optical fiber with straight-line holes increases with the rise in refractive index, in line with previous findings [
26,
29]. Similarly, in the in-loop mirror (POFLM) configuration (
Figure 9b), the transmission of the optical fiber with looped holes increases with an increase in refractive index. Notably, in the latter case, the intensity for low concentrations (represented by the red and blue lines) shows significant variations, suggesting the possibility to discriminate low concentration values differing by only 1%, and the potential to lower the resolution and detection limit of the refractive index sensor system with the POFLM scheme configuration.
A significant outcome of the fiber optical filter is that the shaoe of transmission spectrum remains unchanged despite variations in the refractive index in the holes. In other words, the refractive index variations only modifies the intensity of the spectral waveform, but the bandpass filter remains unaltered. This lack of spectral dependence on the refractive index contributes to the robustness, reproducibility, and feasibility of our proposed system.
Figure 9.
Transmission: a) in-line fiber, b) POFLM fiber with two holes, for different glucose concentrations.
Figure 9.
Transmission: a) in-line fiber, b) POFLM fiber with two holes, for different glucose concentrations.
