Submitted:
23 February 2024
Posted:
26 February 2024
You are already at the latest version
Abstract
Keywords:
1. Introduction
2. Materials and Methods
3. Results
4. Conclusions
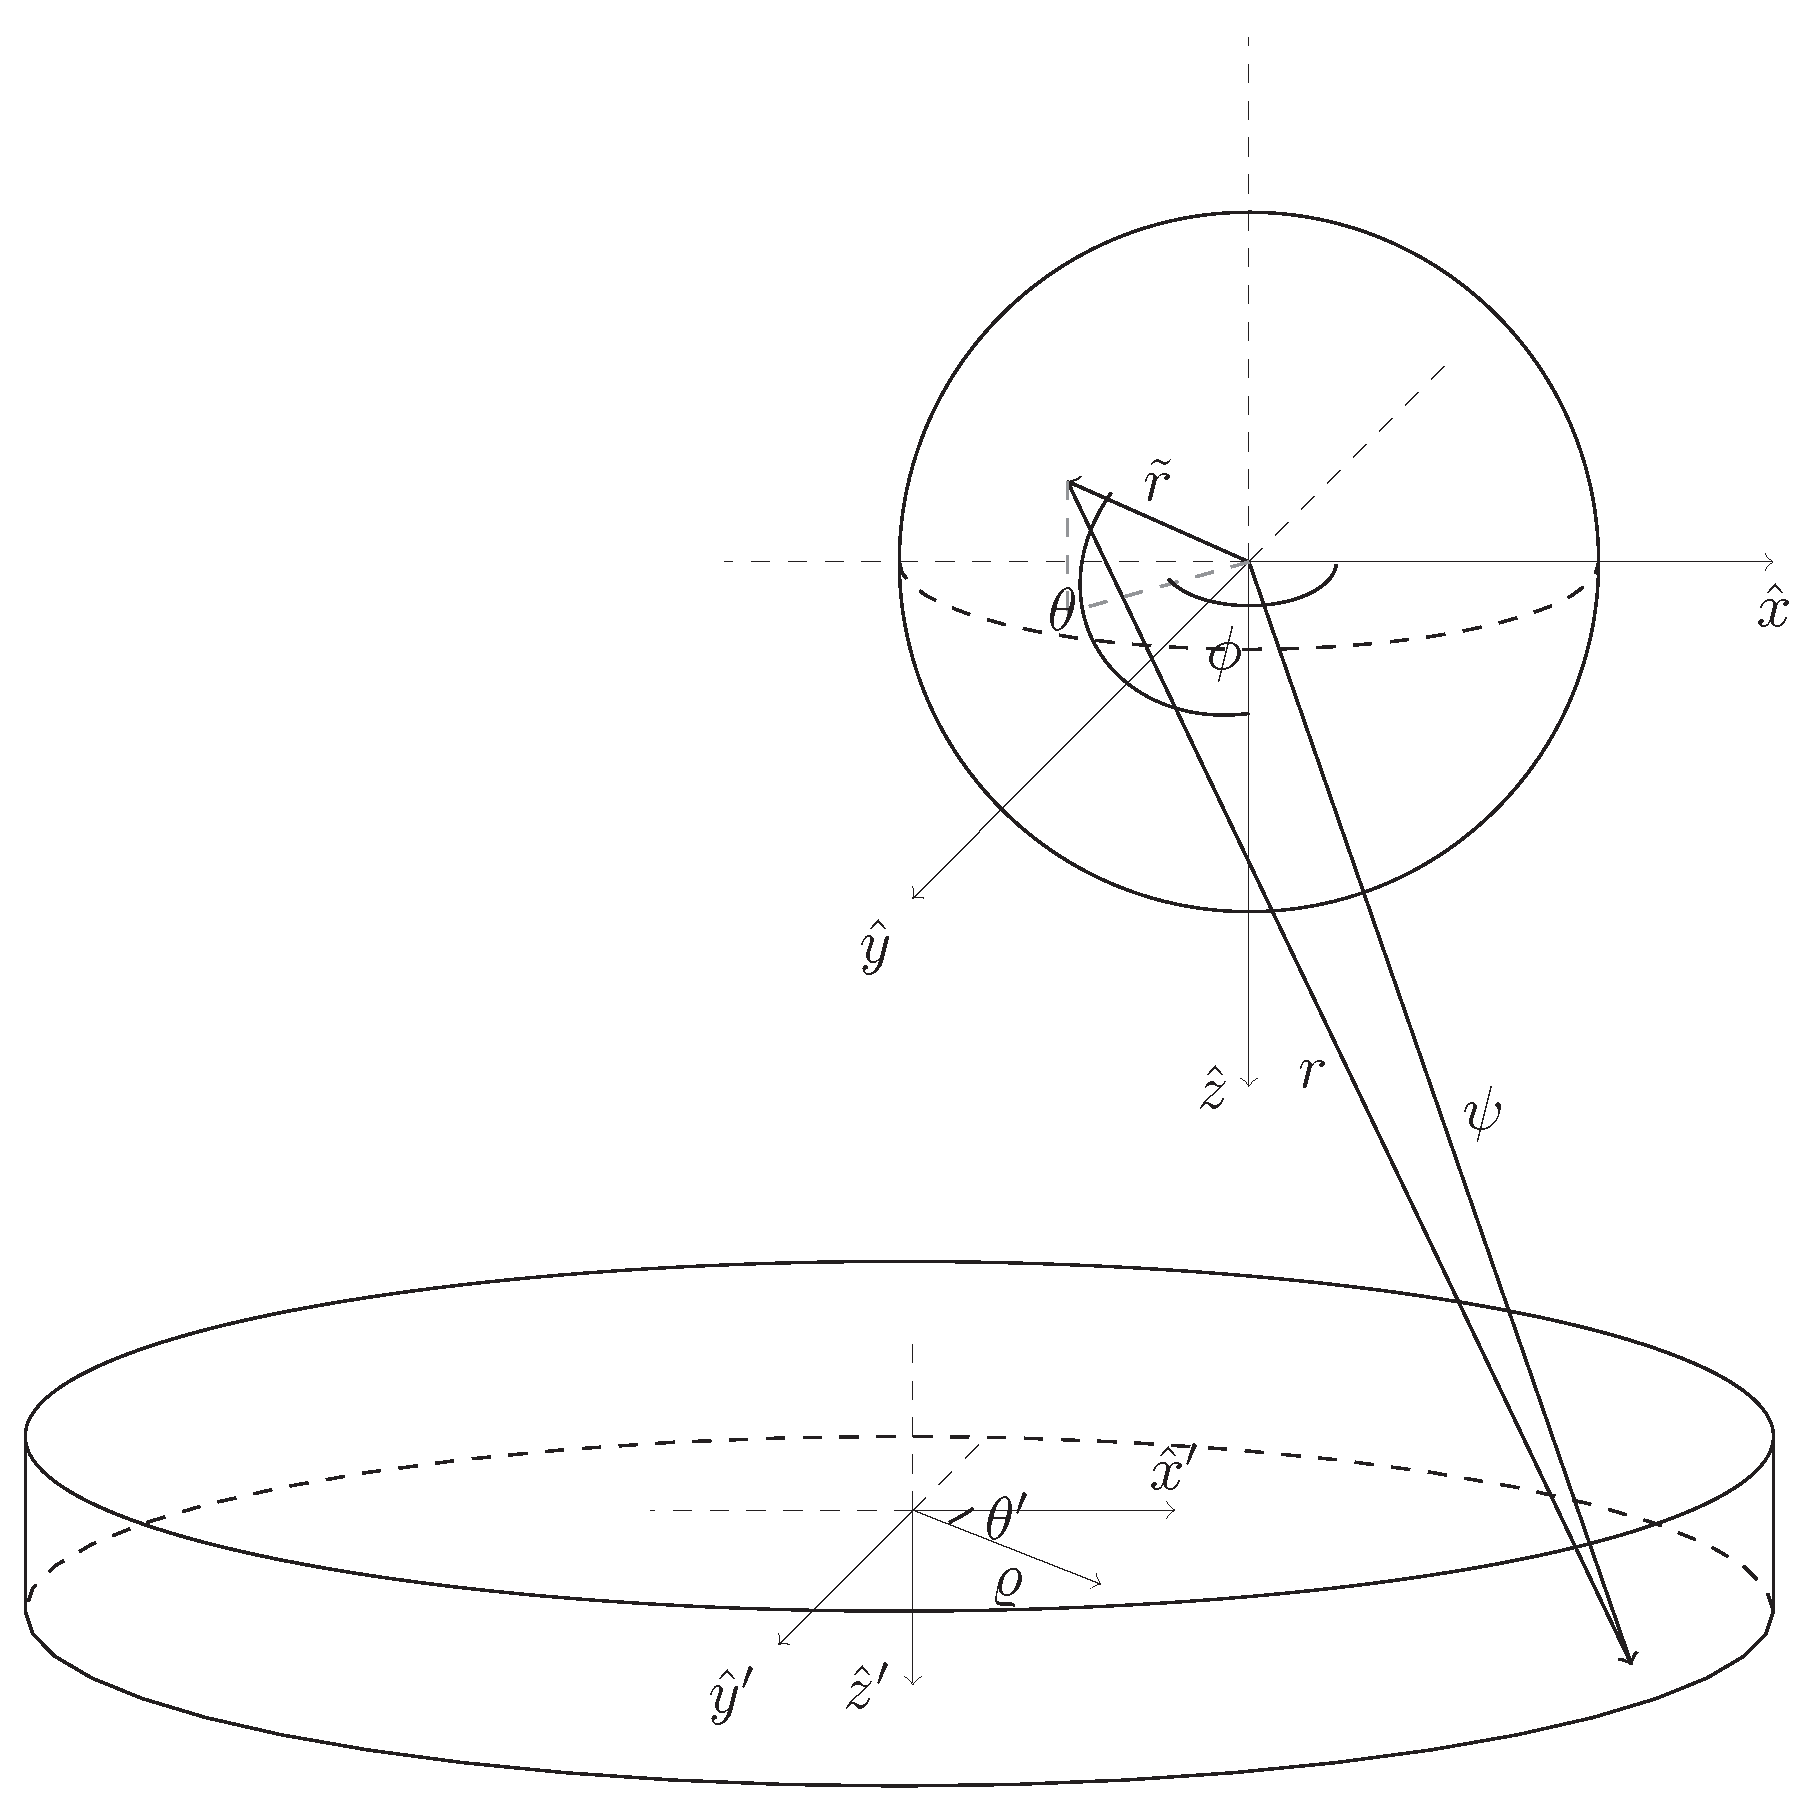
Appendix A. Detailed Calculation Method for Sphere Test Mass Geometry
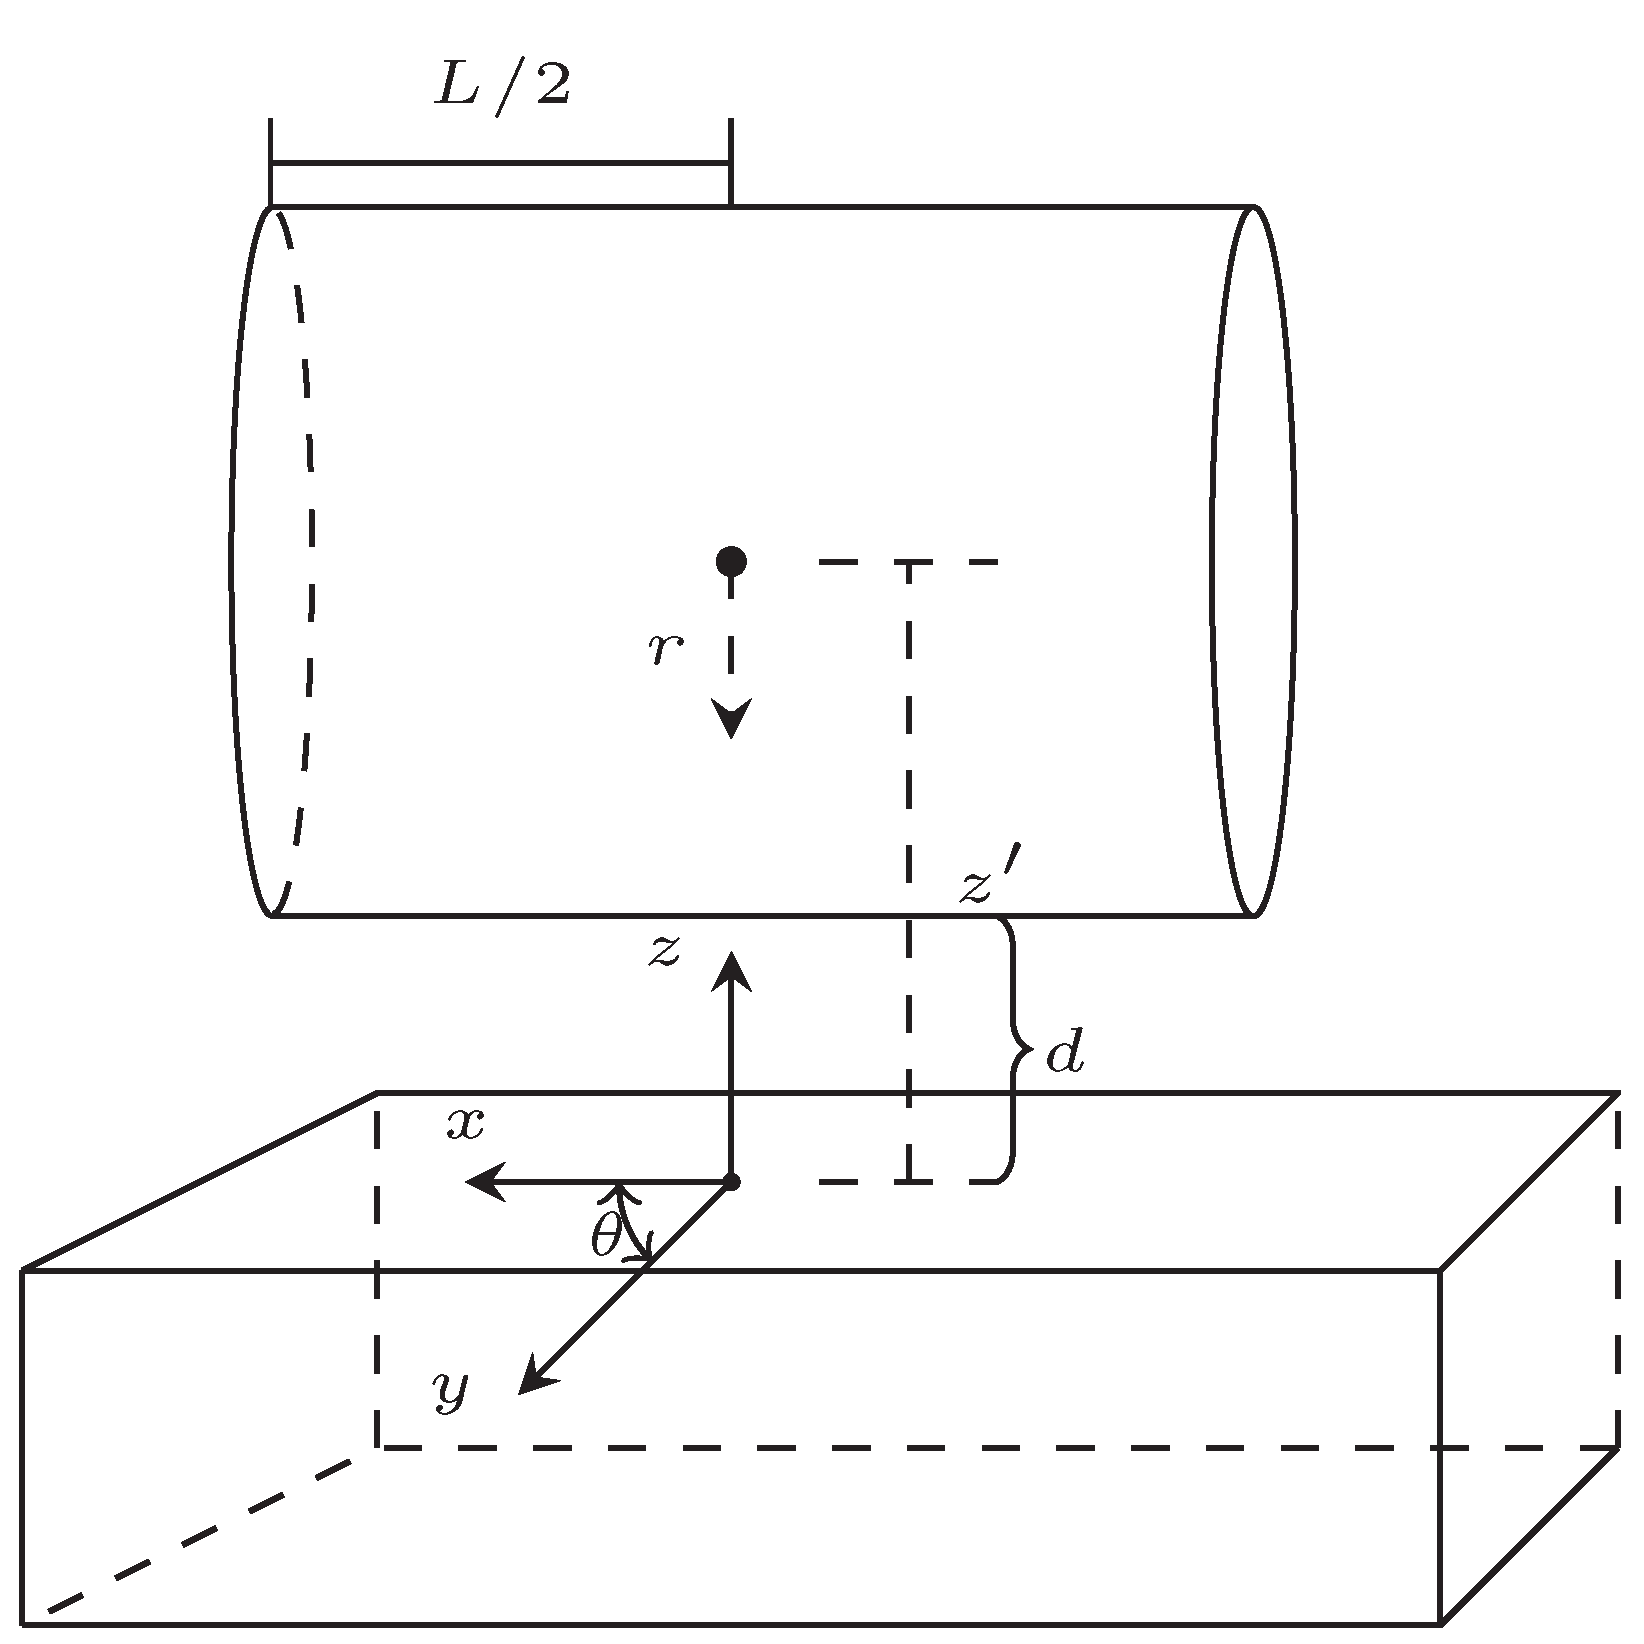
Appendix B. Detailed Calculation Method for Cylinder Test Mass Geometry
- integrate over the source mass
- calculate the field due to the source mass, , along the
- calculate the force, , where is the mass of the test mass calculated
Appendix B.1. n=1
Appendix B.2. n=2
Appendix B.3. n=3
Appendix B.4. n=4
Appendix B.5. n=5
References
- Langacker, P. The standard model and beyond; Taylor & Francis, 2017. [Google Scholar]
- Kiefer, C. Why quantum gravity? Springer, 2007. [Google Scholar]
- Rovelli, C. Quantum gravity; Cambridge university press, 2004. [Google Scholar]
- Weinberg, S. A new light boson? Physical Review Letters 1978, 40, 223. [Google Scholar] [CrossRef]
- Klimchitskaya, G.L.; Mostepanenko, V.M. Dark Matter Axions, Non-Newtonian Gravity and Constraints on Them from Recent Measurements of the Casimir Force in the Micrometer Separation Range. Universe 2021, 7, 343. [Google Scholar] [CrossRef]
- Banks, H.; McCullough, M. Charting the fifth force landscape. Physical Review D 2021, 103, 075018. [Google Scholar] [CrossRef]
- Adelberger, E.; Heckel, B.R.; Hoedl, S.; Hoyle, C.; Kapner, D.; Upadhye, A. Particle-physics implications of a recent test of the gravitational inverse-square law. Physical Review Letters 2007, 98, 131104. [Google Scholar] [CrossRef] [PubMed]
- Klimchitskaya, G.L. Constraints on Theoretical Predictions beyond the Standard Model from the Casimir Effect and Some Other Tabletop Physics. Universe 2021, 7. [Google Scholar] [CrossRef]
- Adelberger, E.; Heckel, B.; Nelson, A. TESTS OF THE GRAVITATIONAL INVERSE-SQUARE LAW. Annual Review of Nuclear and Particle Science 2003, 53, 77–121. [Google Scholar] [CrossRef]
- Tan, W.H.; Du, A.B.; Dong, W.C.; Yang, S.Q.; Shao, C.G.; Guan, S.G.; Wang, Q.L.; Zhan, B.F.; Luo, P.S.; Tu, L.C.; et al. Improvement for testing the gravitational inverse-square law at the submillimeter range. Physical Review Letters 2020, 124, 051301. [Google Scholar] [CrossRef] [PubMed]
- Chen, Y.J.; Tham, W.K.; Krause, D.E.; López, D.; Fischbach, E.; Decca, R.S. Stronger Limits on Hypothetical Yukawa Interactions in the 30–8000 nm Range. Phys. Rev. Lett. 2016, 116, 221102. [Google Scholar] [CrossRef] [PubMed]
- Timberlake, C.; Vinante, A.; Shankar, F.; Lapi, A.; Ulbricht, H. Probing modified gravity with magnetically levitated resonators. Physical Review D 2021, 104, L101101. [Google Scholar] [CrossRef]
- Westphal, T.; Hepach, H.; Pfaff, J.; Aspelmeyer, M. Measurement of gravitational coupling between millimetre-sized masses. Nature 2021, 591, 225–228. [Google Scholar] [CrossRef] [PubMed]
- Sedmik, R.I.P.; Pitschmann, M. Next Generation Design and Prospects for Cannex. Universe 2021, 7. [Google Scholar] [CrossRef]
- Barker, P.F.; Bose, S.; Marshman, R.J.; Mazumdar, A. Entanglement based tomography to probe new macroscopic forces. Physical Review D 2022, 106, L041901. [Google Scholar] [CrossRef]
- Shi, H.; Zhuang, Q. Ultimate precision limit of noise sensing and dark matter search. npj Quantum Information 2023, 9, 27. [Google Scholar] [CrossRef]
- Moore, D.C.; Geraci, A.A. Searching for new physics using optically levitated sensors. Quantum Science and Technology 2021, 6, 014008. [Google Scholar] [CrossRef]
- Kawasaki, A. Measurement of the Newtonian constant of gravitation G by precision displacement sensors. Classical and Quantum Gravity 2020, 37, 075002. [Google Scholar] [CrossRef]
- Tino, G.M. Testing gravity with cold atom interferometry: results and prospects. Quantum Science and Technology 2021, 6, 024014. [Google Scholar] [CrossRef]
- Decca, R.; Lopez, D.; Chan, H.; Fischbach, E.; Krause, D.; Jamell, C. Constraining new forces in the Casimir regime using the isoelectronic technique. Physical Review Letters 2005, 94, 240401. [Google Scholar] [CrossRef]
- Virtanen, P.; Gommers, R.; Oliphant, T.E.; Haberland, M.; Reddy, T.; Cournapeau, D.; Burovski, E.; Peterson, P.; Weckesser, W.; Bright, J.; et al. SciPy 1.0: Fundamental Algorithms for Scientific Computing in Python. Nature Methods 2020, 17, 261–272. [Google Scholar] [CrossRef] [PubMed]
- Bsaibes, T.; Pires, L.; Czaplewski, D.; López, D.; Decca, R.S. Toward a better system for short range precision force measurements. Modern Physics Letters A 2020, 35, 2040002. [Google Scholar] [CrossRef]

| n | from [8] | Many Sector Sample | Large Sector Sample |
|---|---|---|---|
| 1 | |||
| 2 | |||
| 3 | |||
| 4 | |||
| 5 |
| n | from [8] | Cylindrical Test Mass |
|---|---|---|
| 1 | ||
| 2 | ||
| 3 | ||
| 4 | ||
| 5 |
Disclaimer/Publisher’s Note: The statements, opinions and data contained in all publications are solely those of the individual author(s) and contributor(s) and not of MDPI and/or the editor(s). MDPI and/or the editor(s) disclaim responsibility for any injury to people or property resulting from any ideas, methods, instructions or products referred to in the content. |
© 2020 by the authors. Licensee MDPI, Basel, Switzerland. This article is an open access article distributed under the terms and conditions of the Creative Commons Attribution (CC BY) license (https://creativecommons.org/licenses/by/4.0/).


