Preprint
Article

Whey Mediated Synthesis of Silver Nanoparticles, and Optimization of Reduction Reaction Conditions

Altmetrics

Downloads

155

Views

107

Comments

0

Submitted:

26 February 2024

Posted:

26 February 2024

You are already at the latest version

Alerts
Abstract
Green synthesis of silver nanoparticles (AgNPs) using raw Whey has never been reported. Silver nanoparticle formation involves a reduction reaction of silver salt solution with Whey extract. Extract and metal salt concentrations, and temperature can control this reaction. In this work, incubation period, extract, AgNO3, and NaOH concentrations were used as the independent factors using central composite design under response surface methodology. The aim was to elucidate the influence these factors have on the measured UV-Vis absorption spectra fitted with a Voigt function, and to optimize the conditions for nanoparticle formation. The fitting parameters, peak wavelength (λ0), peak area (A), and Full Width at Half Maximum (FWHM), were the responses. Silver nanoparticle formation was only possible in an alkaline environment (pH 10). The peak wavelength and the FWHM are influenced mainly by extract and AgNO3 concentrations. In contrast, the peak area is influenced by a total of 33.54 % from the interaction terms of AgNO3 and extract concentrations with NaOH. Metallic AgNPs were formed for the following parameter ranges: a) Whey (0.4 – 1.6 % v/v), b) AgNO3 (0.15 – 0.6 mM), c) NaOH (10 – 50 mM), and d) Time (20 – 60 min). Silver oxide nanoparticles were also observed.
Keywords: 
Subject: Chemistry and Materials Science  -   Nanotechnology

1. Introduction

Cheese whey is a yellow Cheese whey is a yellow- greem liquid, with high concentration of lactose, metals, and proteins, such as beta-lactoglobulin (~65%), alpha-lactalbumin (~25%), bovine serum albumin (~8%), immunoglobulins, proteose-peptones, lactofrrin and lysozyme [1]. It is produced during cheese making, and it constitutes the main creameries’ byproduct. Dairy waste is extremely burdensome and difficult to manage. To understand the acidity of the problem, it is enough to note that liquid waste of dairy farms reaches 75% - 80% of the incoming milk processed by a cheese factory. Whey has 100 times higher pollutant load than urban wastewater (up to 35,000 mg /L BOD1 compared to 150 to 350 mg / L BOD). This means that a small dairy, which processes 10 tons of milk per day, produces waste equivalent to a polluting capacity of a town of 5,500 inhabitants[2].
Many attempts have been made in order to upcycle and make whey worthwhile, instead of discarding in rivers and streams, resulting in heavily polluted environment. Νowadays cheese whey is of particular scientific interest and it seems to possess many applications, especially in food science and technology. More specific cheese whey can be used by creameries in order to produce cheese, known as “whey cheese”, or to enrich other dairy products, such as milk, chocolate milk, and yogurts, aming to cover athletes’ needs and demands in protein [3]. Whey proteins are of incresed nutritional value (high concentration of essential amino acids) and are used as dietary supplements for muscle growth and enhancing body composition of athletes [3]. Moreover, it seems to exhibit many functional properties in food industry including, its usage in producing edible films [4,5], encapsulating and delivering bioactive compounds [6], forming gells and foams [1] etc.
Silver nanoparticles (AgNPs) have numerous applications in various diverge disciplines such as optoelectronics and biology [7]. Bionanocomposites- biopolymer matrices reinforced with nanomaterials - have potential applications in food packaging replacing non – biodegredable plastic packaging [8]. Silver nanoparticles can be synthesized by a variety of routes. Nowdays ecofriendly scientific methods and procedures seem to be a trend worldwide. Green nanoparticle synthesis is based on using natural sources, such as plant extracts, microorganisms or natural industrial byproducts (e.g. food industries by- products), as reducing agents, instead of using toxic chemicals, with enviromental impact [9]. Silver nanoparticles synthesized using amino acids and incorporated into biopolymers have been shown to have applications in food packaging [10].
Whey protein isolate (WPI) extract has been used for AgNP formation, at room temperature, using a tannin rich extract from Xylocarpus granatum bark [11]. The nanoprticles were formed in alkaline environment (pH 10), and showed a plasmon resonance at 415 nm [11]. A range of silver nitrate and WPI were investigated, and nanoparticles with an average mean diameter of 31 nm were reported [11]. In a different work, whey peptides isolated from whey protein were mixed with silver nitrate and sodum hydroxide, and produced AgNP at 100 °C [12]. Recently large size AgNPs (average diameter 138.6 nm) were also reported using a mixture of WPI, sodium chloride and silvare nitrate solutions, at room temperature under stirring for 15 min [13]. In another work, Lactobacillus paracasei isolated from sweet whey mixed with 3 mM silver nitrate for 2 days produced silver nanoparticles with an average size of 18 nm [14]. Amyloid fibrils also isolated from WPI were mixed with silver nitrate and either with illumination or with mixing with sodium borohydride and trisodium citrate formed silver nanoparticles [15].
In all of these published works, however, whey has not been used without any treatment prior to nanoparticle formation. In contrast, in this work, cheese whey – derived from “Kalathaki Limnou” cheese production, as of now Whey, was used as reducing and caping agent as was obtained from a local dairy plant. In addition, the effects of silver nitrate concentration, Whey concentration, sodium hydroxide concentration, incubation temperature and incubation time on silver nanoparticle formation were investigated using response surface methodology, similarly to a previous work [16]. This is the first time such work has been reported.

2. Materials and Methods

2.1. Chemicals – Whey Cheese Extract

AgNO3 aqueous solution (0.1 M) and sodium hydroxide (NaOH) pellets were purchased from Sigma Aldrich (Steinheim, Germany), whereas ammonium hydroxide solution (NH3) from PENT (Prague, Czechia). Coomassie Brilliant Blue G-250, and BSA were purchased from MERCK (Germany), and Methanol from carlo Erba (France). Phosporic acid (H3PO4) from ACROS ORGANICS (Belgium).
Whey cheese extract was originated from “Kalathaki” Lemnos feta cheese supplied from Chrysafi coorporation.

2.2. Silver Nanoparticle Synthesis

In a typical synthesis procedure, a mixture of AgNO3 and Whey at specific conentrations, was heated in a water bath at a temperature of 60 °C, for 40 minutes. At the end of the 40 minutes, NaOH of chosen concentration, was added to the reaction mixture. Following the addition of NaOH, the heating continued for a specific incubation period, after which the mixture was allowed to cool down to room temperature. The incubation period (Time) was varied from 10 to 40 minutes. The precursor of silver ions[16], AgNO3 concentration ( C A g N O 3 ) varied in the range 0.1 – 2 mM, and Whey concentration ( C W h e y ) in the range 0.2 – 16.67 % v/v. The sodium hydroxide concentration ( C N a O H ) spanned the range 0 – 50 mM. All synthesis was performed in the dark without stirring, and the the final volume was 2.5 mL unless otherwise stated. The incubation time prior to NaOH addition was 40 minutes unless otherwise stated.

2.3. Characterisation Techniques

An aliquot of nanoparticle suspension was used for UV-Vis spectroscopy measurements as described previously [17].
The nanoparticles were measured without prior centrifugation, employing X- Ray Diffraction Patterns (XRD), topographic Atomic Force Microscopy (AFM) images, and Fourier Transform Infrared (FTIR) spectrosocpy [16]. The AgNPs investigated with these techniques (XRD, AFM, FTIR) were prepared with the following conditions: AgNO3 (0.15 mM), Whey (1.2 % v/v), NaOH (40 mM), and incubation period 20 minutes.

2.4. Statistical Analysis, Experimental Design, and Pareto Analysis

The UV-Vis spectra were fitted using a Voigt profile, as described previously [16,17]. The fitting parameters [17]: peak wavelength (λ0), peak area (A), and Full Width at Half Maximum (FWHM) were used as the responces.
The combined effects of the four independent factors: AgNO3 concentration (X1), Whey concentration (X2), NaOH concentration (X3), and incubation period (X4) on the measured UV- Vis spectra using as responses the above fitting parameters, were investigated using central composite design (CCD) under Response Surface Methodology (RSM). Five level coding was used for each of the independent factors as described elsewhere [16,17,18].
The central values for the experimental design were: AgNO3 concentration 0.3 mM, Whey concentration 0.8 % v/v, NaOH concentration 30 mM, and incubation period 40 minutes, with corresponding steps 0.15 mM, 0.4 % v/v, 10 mM, and 10 minutes respectively. A total of 25 runs (Table 1) were conducted in the experiment and the runs were repeated twice each.
A third order polynomial was obtained for each response as function of the coded values (Xi) of the independent factors:
Y r e s p o n s e = β 0 + i β i X i + i , i β i i X i 2 + i , i , i β i i i Χ ι 3 + i , j β i j X i X j + i , j , k β i j k X i X j X k
where β‘s are the regression coefficients [16,19].
Standard procedures were applied to assess the quality of the regression polynomials [18]. Analysis Of Variance (ANOVA) was applied to assess the significance and adequacy of the model, as well as the significance of the regression coefficients appearing in the derived polynomial [20].
The magnitude and sign of the regression coefficients was used as a measure of the importance of the various independent factors and their interactions at significance level 5% (p-value < 0.05), unless otherwise stated. Not statistically significant terms were excluded from the polynomial models except of those required for a hierarchical model [16].
To assist our investigation further, pareto analysis was employed using the perecentage effect of each factor (Pi) on nanoparticle formation [21]:
P i = β i 2 β i 2 100 , i 0

2.5. Total Protein Assay

Total Whey protein determination was performed using the Bradford assay [22]. This assay is based on the binding [23] of a dye (Coomassie Brilliant Blue G-250) to proteins through electrostatic and hydrophobic interactions that leads to the formation of a blue complex with a maximum absorption at 595 nm. The change in absorbance at 595 nm is directly proportional to the protein concentration of a sample. Briefly in 10 ml polystyrene test tubes 6 standard BSA solution of different concentrations (10, 20, 40, 60, 80 and 100 μg / mL) were prepared using the BSA working solution and distilled water. Whey was diluted 1:10 and Bradford working solution was added in all the solutions/test tubes (standard and whey sample). The mixtures were stirred and incubated at room temperature for 15 min. A linear curve of the absorbance at 595 nm as function of the BSA standards was constructed, and a linear fit was obtained. The Whey sample absorbance at 595 nm was then converted into an equivalent BSA concentration. The measurements were repeated three times.

3. Results

3.1. UV-Vis Spectra Analysis

A color change of the reaction solution, and a bell-shaped absorption band within the range 400 – 490 nm is indication for silver nanoparticle formation [24].
No nanoparticle formation could be observed without the addition of sodium hydroxide. The pH of the Whey extract was measured to be 5.71 prior to NaOH addition. The investigation showed a complex behavior of the measured absorption spectra as a function of Whey and AgNO3 concentrations (Supporting Information: Figures S1 and S2), at NaOH 20 mM, and incubation time 20 min.
Brown color was observed for Whey concentrations 0.05 % v/v (Supporting Information: Figure S2a), and 0.2 % v/v (Supporting Information: Figure S2b), whereas a yellow color for Whey concentrations 0.8 % v/v (Supporting Information: Figure S2c), 1.2 % v/v (Supporting Information: Figure S2d), and 2 % v/v (Supporting Information: Figure S2e). The color intensity increased with silver nitrate concentration (Supporting Information: Figure S1). The characteristic bell-shaped absorption band, however, was only observed: a) for AgNO3 0.25 mM and all Whey concentrations except 0.05 % v/v (Supporting Information: Figure S1a), and b) for Whey 1.2 % v/v and AgNO3 concentrations smaller than 1 mM (Supporting Information: Figure S2d).
In Figure 1, the combined effects of AgNO3, Whey and NaOH concentrations on the UV-Vis absorption spectra are plotted. An absorption peak of plasmon resonance at about 410 nm can be observed in all spectra. The lowest Whey concentration 0.05 % v/v (Figure 1a,c,e) exhibited a second broader absorption band with a peak centered at about 500 nm. The absorption band at about 500 nm appears to be either less pronounced or completely absent in UV-Vis spectra of NaOH 40 mM (Figure 1c,d), compared to the one of NaOH 20 mM (Figure 1a,b) and NaOH 60 mM (Figure 1e,f). Overall, the increase of AgNO3 concentration caused a blue shift along with an absorbance increase. A Voigt profile has been shown to fit adequate with UV – Vis spectra of AgNPs solution in a previous study, providing a method of correlation between nanoparticle formation and synthesis parameters [16]. In the present study, however, a single Voigt profile may not be sufficient due to the observed absorption band at about 500 nm (Supporting Information: Tables S1 and S2). Charge transfer between nanoparticles [25], their crystallinity [26,27], and agglomeration [28] may influence the observed UV-Vis spectrum. Moreover, silver oxide (Ag2O) nanoparticles (AgONPs) may also be present in the reaction solution in addition to AgNPs [29].
The presence of Ag2O in the current study, could be attributed to the following chemical reaction between silver nitrate and sodium hydroxide,
A g N O 3 a q + N a O H a q A g O H s + N a N O 3 a q
however silver hydroxide is known to be unstable according to the following chemical reaction [30]
2 A g + a q + O H a q A g 2 O s + H 2 O
It was observed that no nanoparticle formation could take place without both NaOH and Whey addition. Therefore, the AgNPs/ AgONPs formation was controlled by the combined effect of silver nitrate, sodium hydroxide and Whey concentrations.
Gallardo and colleagues [30], demonstrated that ammonia selectively dissolves only Ag2O particles, without affecting metallic silver nanoparticles. This proved also to be the case of the current study, whereby ammonia addition resulted in the absence of the absorption band at about 500 nm whereas the absorption band at about 410 nm was not affected (Supporting Information: Figure S3 and Table S3).
This investigation showed that AgNPs can be synthesized using cheese Whey. This synthesis involves the reduction of silver ions (Ag+2) into elemental silver (Ag0) [31]. Therefore, the following redox reaction takes place:
A g + 2 + W h e y A g 0 + W h e y + 2
where Whey acts as the reducing agent. Whey is rich in proteins, which have amino acids as a building block and can be easily oxidized [10]. The synthesis of silver nanoparticles using cheese Whey was possible under alkaline conditions (pH of reaction solution was measured to be equal to 10), which was in accordance with previous work using tyrosine [10]. All amino acids have in their structure a carboxyl and an amino group bonded to the same carbon anion with an R- group [10,32]. In an alkaline environment the amino acids are anionic (H2NCH(R)COO-) [32] and act as reducing agents. Silver nanoparticles could not be observed without the addition of cheese Whey. Therefore, synthesized silver nanoparticles must depend on AgNO3, Whey and NaOH concentrations.
A blue shift of the peak wavelength and narrowing of the FWHM was observed with incubation period (Supporting Information: Figure S4 and Table S4). The silver nanoparticles used for AFM and FTIR measurements had the following parameters: peak wavelength 412.6 nm, peak area 137.4, and FWHM 88.7 nm (Supporting Information: Figure S4 and Table S4).

3.2. AgNP Characterization

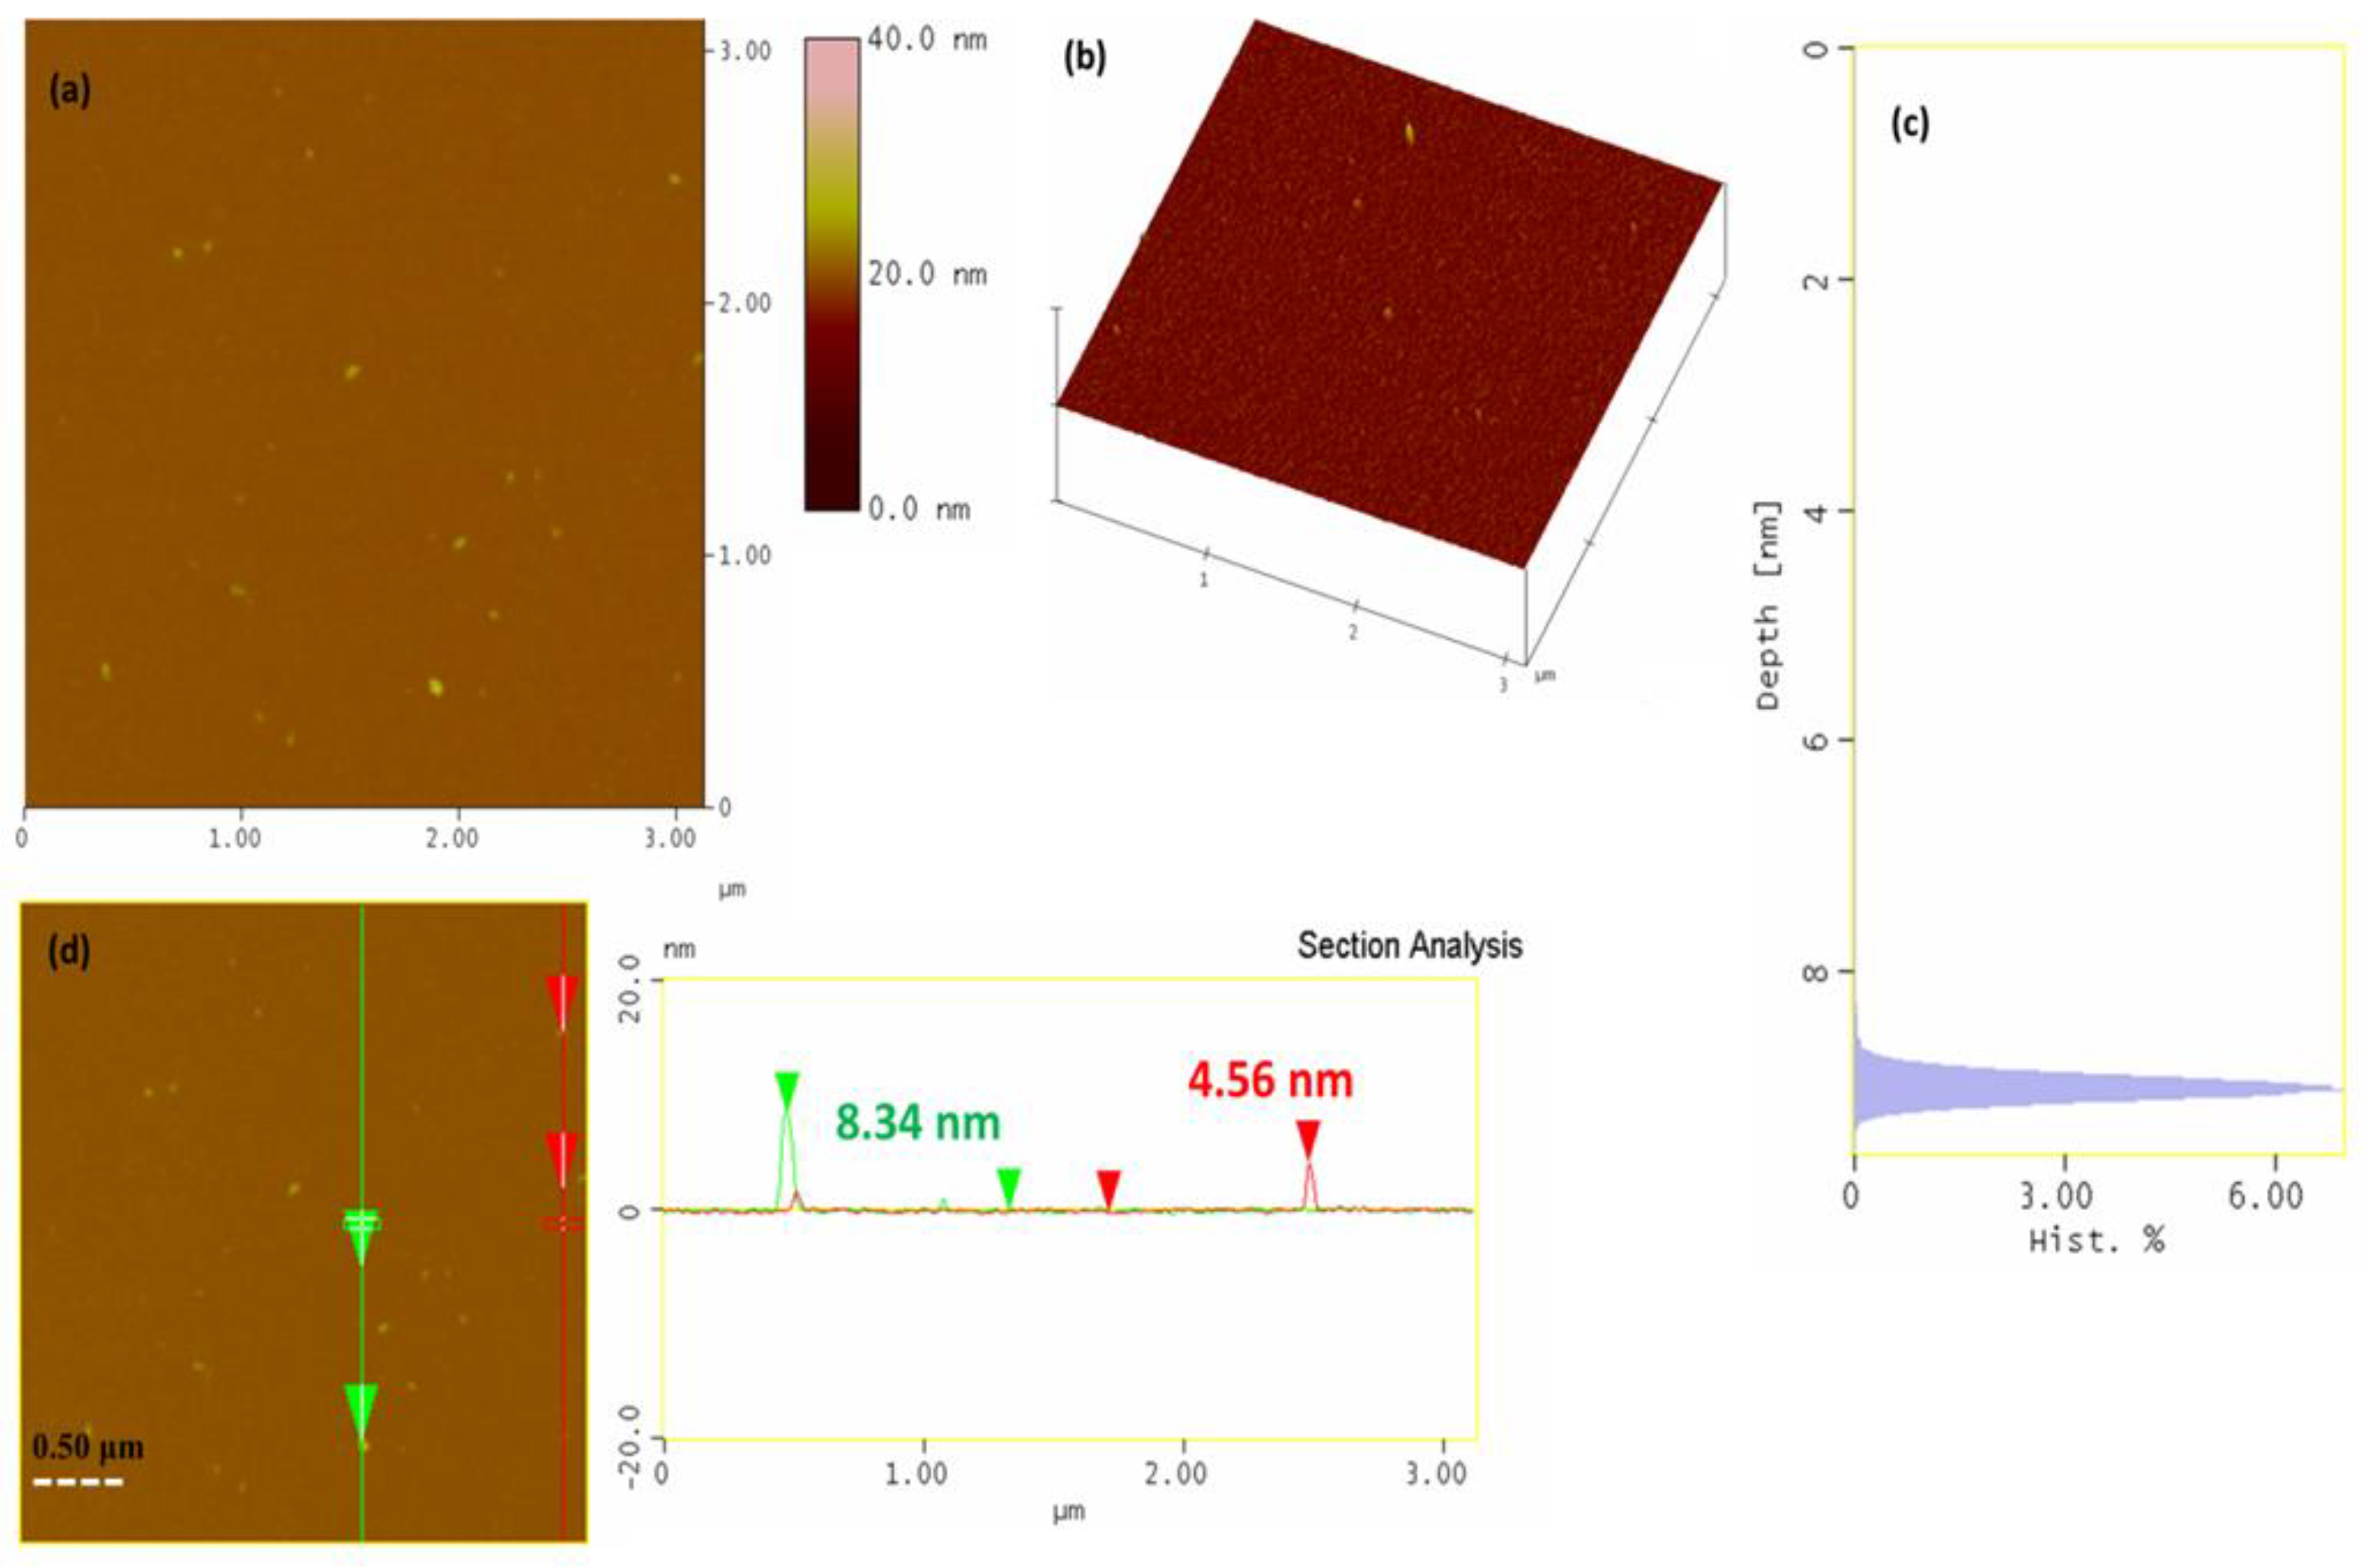
Based on the UV-VIS spectra analysis, AgNPs corresponding to Figure 1d were further investigated. AFM topographic images of AgNPs on Si- wafer substrate, are shown in Figure 2, where single dispersed nanoparticles can be observed with sizes ranging from 4.5 – 9.0 nm, like a previous work [16].
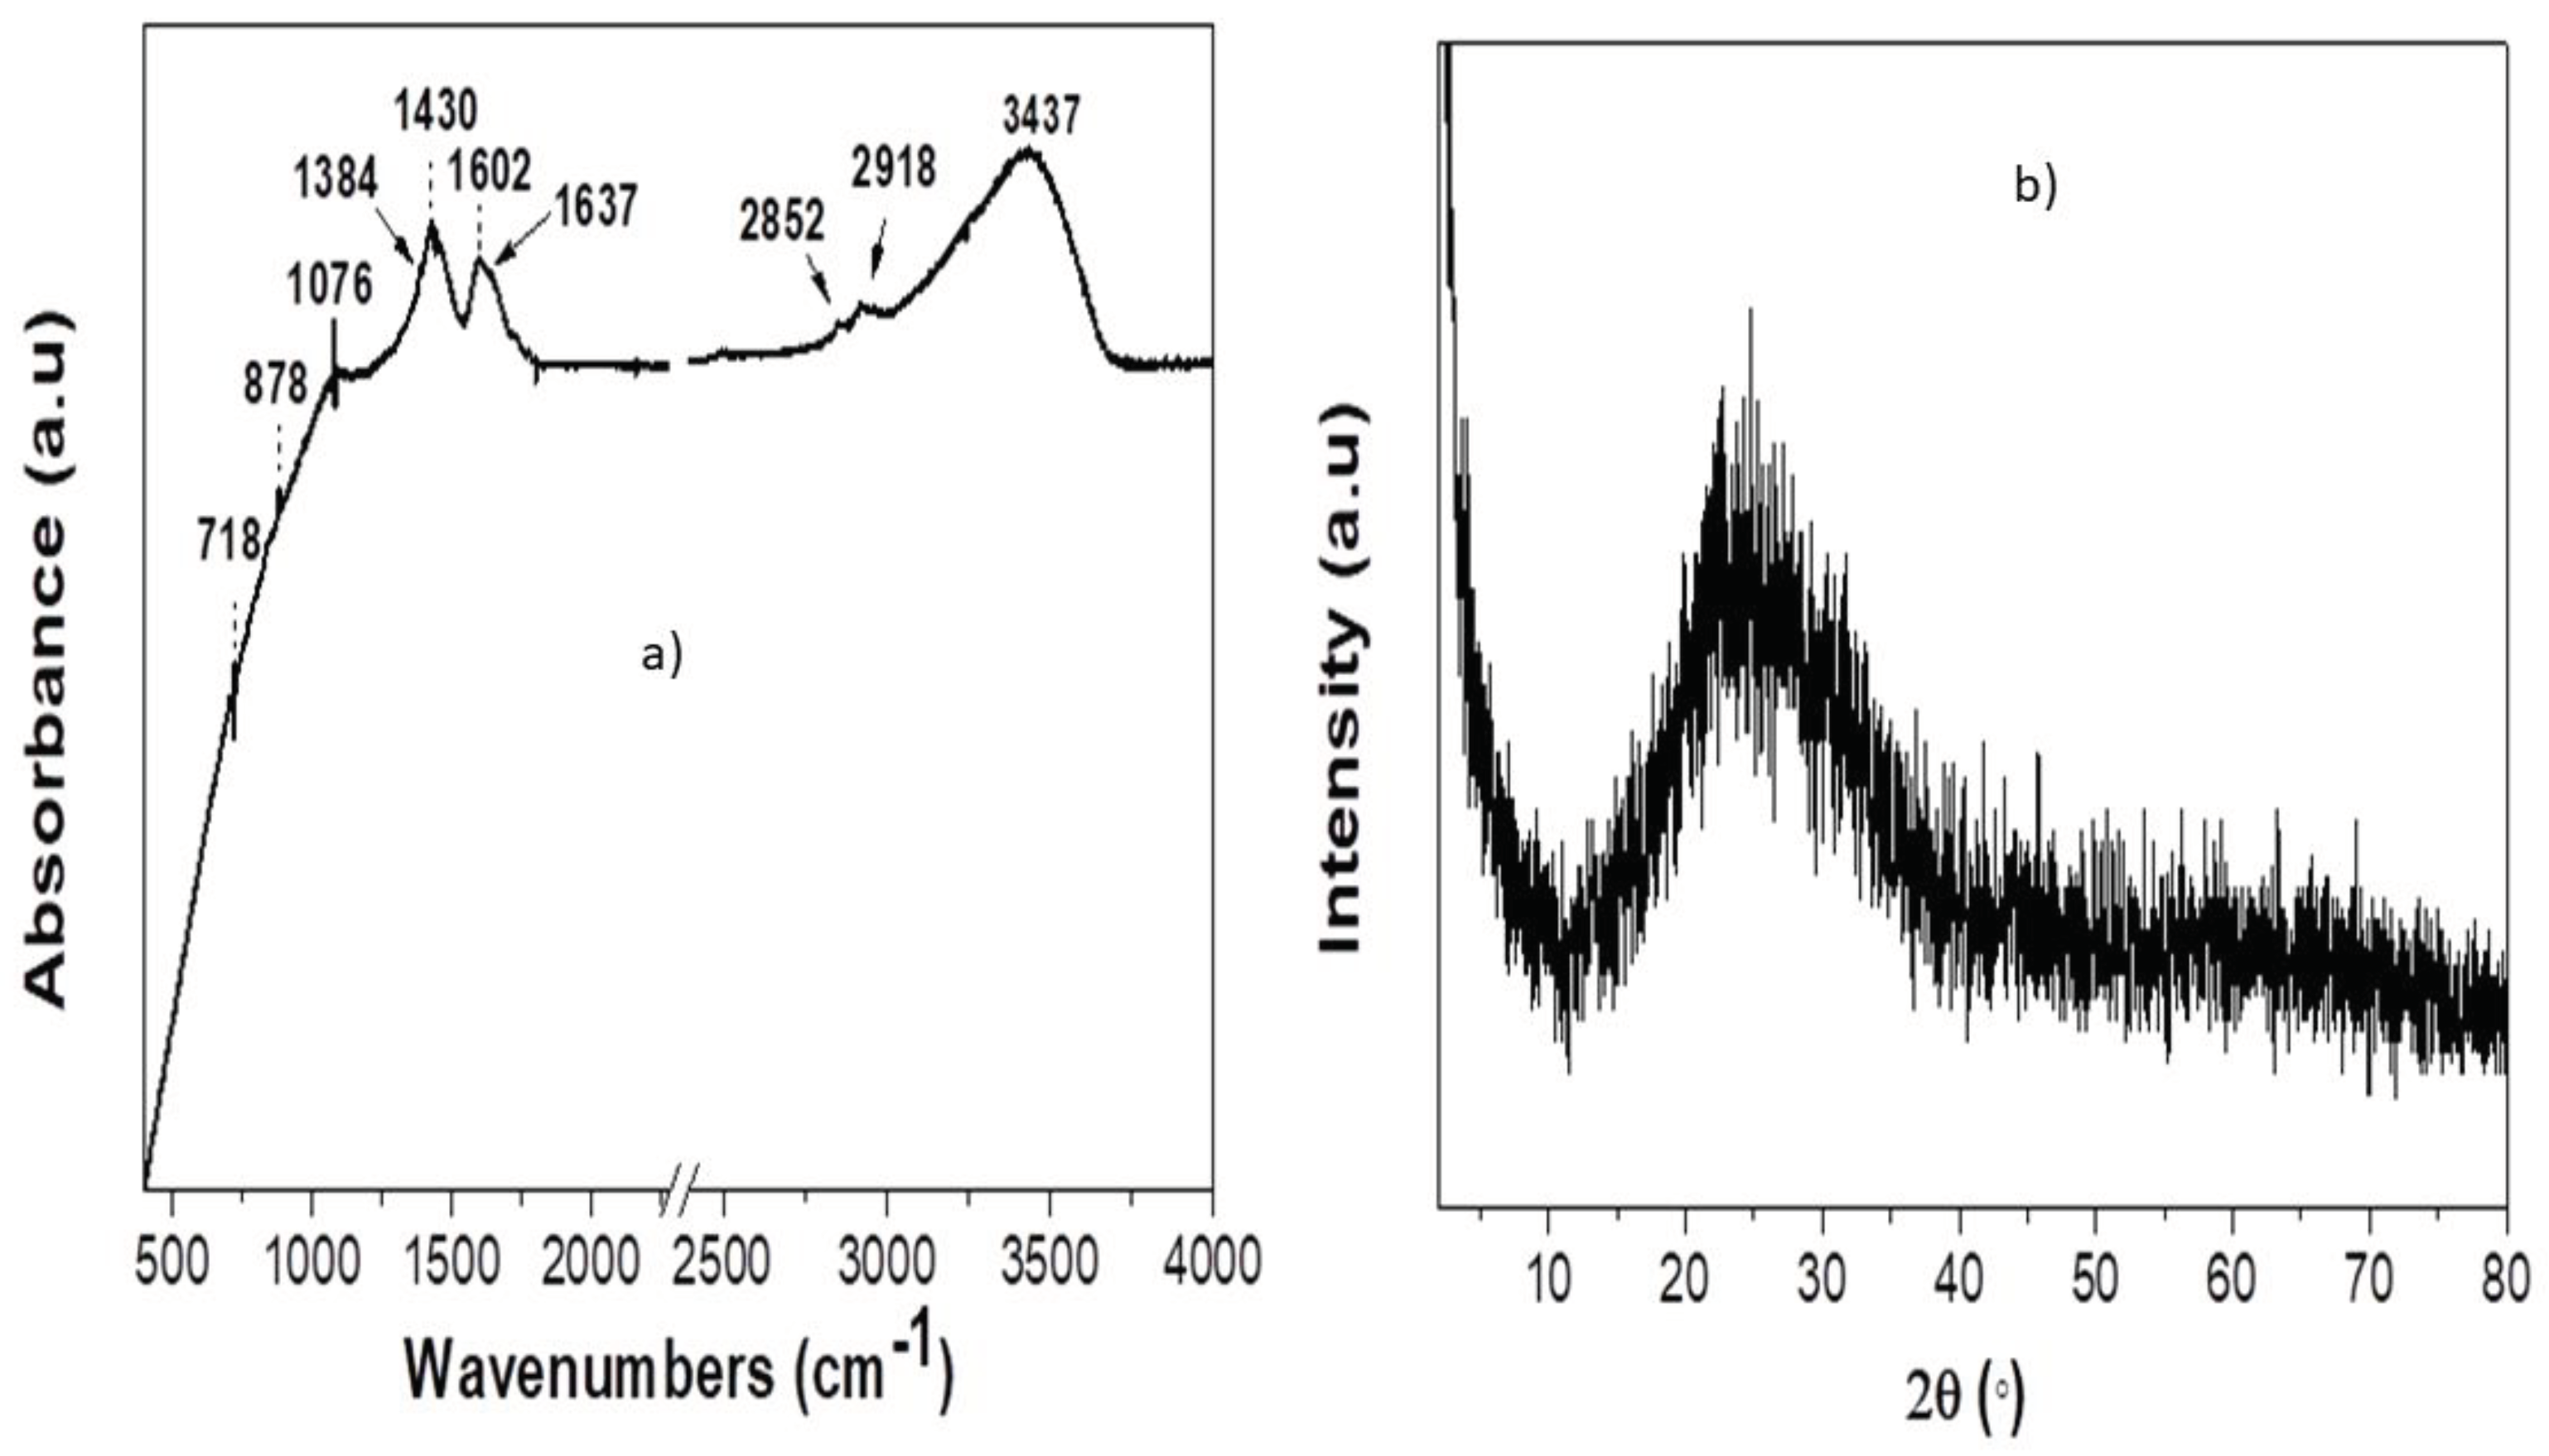
An FTIR spectrum identifying the ligands attached to the AgNPs surface is plotted in Figure 3a. The peaks observed at 718 cm-1 and 878 cm-1, were assigned to =C-H bending peaks [33,34]. The peak at 1076 cm-1 can be attributed to alkoxy group [35], whereas the peak at 1430 cm-1 to C-H bending bands [36]. The band at 1602 cm-1 originates from C=C stretching vibrations of alkenes and C-H bending peaks of aromatics [37]. There seems to be an extra contribution at 1637 cm-1 which is characteristic of Whey protein [38]. The peaks observed at 2852 cm-1 and 2918 cm-1, have their origin from C-H stretching vibrations either from -C-H- or -C-H2- aliphatic compounds [37,39]. Finally, the band at 3437 cm-1 originates either from O-H or NH- stretching vibrations [37,39].
The XRD pattern of dry powder obtained from the formed AgNPs synthesized by Whey is shown in Figure 3b. XRD analysis exhibited poor crystallinity of the sample with a broad peak formed at ~25° possibly caused by the Whey, although Ag contributions superimposed on the board pattern are visible. This is rational since the characteristic peaks of AgNPs are not easily recognizable when synthesized using natural products. A similar XRD pattern was also observed in a previous work [16].

3.3. Bradford Assay

The Whey sample absorbance at 595 nm was converted to BSA equivalent as shown in Table 2 (Supporting Information: BSA standard calibration curve Figure S5).
In our measurements 70 μg of Whey (diluted 1:10 due to whey turbidity) were added to a final volume of 2 mL. Therefore, our BSA equivalent per μg of Whey was calculated as follows:
16.93 2 1 70 10 = 4.84   μ g μ l   W h e y
Therefore, the equivalent concentration of the cheese Whey stock solution was measured to be 4.78 ± 0.05 μg/ μL of Whey.

3.4. Statistical Analysis

Central Composite Design under Response Surface Methodology [20] was applied to elucidate the combined effects of AgNO3, Whey and NaOH concentrations and incubation period on the synthesis of silver nanoparticles using Whey (Table 1). The obtained third order polynomials were assessed using ANOVA (Supporting Information: Table S5). Large F values and small p- values (< 0.05), were obtained demonstrating that all three models are appropriate [20].
The regression coefficients for peak wavelength (λ0), peak area (A), and FWHM are given in Table 3, Table 4 and Table 5, respectively. The coefficient of determination (R2) was above 97% indicating a good fit [18,40]. Models’ adequacy was tested using standard tools, and normal distribution for the residuals as well as independence of variance could be assumed [18,20].
The peak wavelength (Table 3) is affected by AgNO3 concentration (X1), followed by Whey concentration (X2) as far as linear terms are concerned. The quadratic terms of these two factors have similar magnitude but opposite sign. The interaction terms of AgNO3 concentration with Whey concentration, and Whey concentration with incubation period (X4) have similar contribution. The largest contribution of the third order terms originates from the term with Whey concentration (squared) and AgNO3 concentration followed by the third order term of Whey concentration (cubed). Statistically significant were also the third order term of Whey and NaOH concentration (X3) and incubation period, followed with the third order term of NaOH concentration (cubed) with opposite sign and roughly half in magnitude.
The peak area (Table 4) is affected mainly by second and third order terms. The largest contributions originate from the third order term of AgNO3 concentration (X1) (cubed) followed by the interaction term of Whey (X2) and NaOH concentration (X3). At a slightly smaller magnitude but with opposite sign to the previous terms, follow the quadratic term of Whey concentration and the interaction term of AgNO3 and NaOH concentrations. The third order term of Whey concentration (cubed) and the third order term of AgNO3, Whey and NaOH concentrations have similar magnitude and sign, and are twice as big compared to the third order term of NaOH concentration (cubed). The linear terms of AgNO3, Whey and NaOH concentrations were significant at significance level 15% (p-value < 0.15). At the same level the interaction terms of AgNO3 with Whey concentrations, and AgNO3 concentration with incubation period were also significant with the same magnitude and sign.
The largest contribution on the peak width (Table 5) is from the quadratic term of Whey concentration (X2). This is followed by the quadratic and cubed terms of AgNO3 concentration (X1) with similar magnitude but opposite sign. The cubed term of Whey concentration also has similar magnitude and sign to the quadratic term of AgNO3 concentration. Following in magnitude are the linear terms of AgNO3 concentration and Whey concentration with opposite sign. The quadratic and cubed terms of incubation period (X4) are also significant. The linear term on incubation period is significant at significance level 15%. The interaction terms of AgNO3 and NaOH concentrations, AgNO3 concentration and incubation period, and NaOH concentration with incubation period are also significant at this level with similar magnitude. The first two interaction terms have a negative sign in contrast to the last. The third order terms of AgNO3 and Whey concentrations with incubation period, and Whey and NaOH concentrations with incubation period are also significant at a level of 15%.
Therefore, the following polynomials can be written:
Y ( p e a k   w a v e l e n g t h ) = 408.69 + 17.4 X 1 + 10.067 X 2 9.373 X 1 2 + 8.908 X 2 2 1.798 X 1 X 2 1.689 X 2 X 4 7.869 X 2 3 0.497 X 3 3 24.55 X 1 X 2 2 + 0.990 X 2 X 3 X 4
Y ( A r e a ) = 302.8 + 29.8 X 1 18.1 X 2 31.3 X 3 29.10 X 2 2 22.78 X 1 X 3 12.84 X 1 X 4 + 38.41 X 2 X 3 + 45.8 X 1 3 + 20.12 X 2 3 + 11.32 X 3 3 + 21.8 X 1 X 2 X 3
Y ( F W H M ) = 105.63 13.18 X 1 + 18.31 X 2 6.28 X 4 20.91 X 1 2 + 27.29 X 2 2 + 2.98 X 4 2 2.98 X 1 X 3 2.32 X 1 X 4 + 2.38 X 3 X 4 + 21.79 X 1 3 19.587 X 2 3 + 3.197 X 4 3 + 2.37 X 1 X 2 X 4 + 2.77 X 2 X 3 X 4
for peak wavelength, peak area, and FWHM respectively.
Pareto analysis percentages are shown in Table 6 for all responses for only the significant terms. The linear terms on AgNO3 (X1) and Whey (X2) contribute 32.5 % to peak wavelength, in contrast they contribute 19.81 % to FWHM, and 0 % in peak area. The quadratic terms on AgNO3 and Whey contribute 13.45 % to peak wavelength, whereas only the quadratic term of Whey contributes 14.24 % to peak area. In FWHM the total contribution from the quadratic terms of AgNO3, Whey, and incubation period (X4) equals 46.37 %. There is a very small contribution of interaction terms for both the peak wavelength and FWHM. In contrast the interaction terms of NaOH (X3), or equivalent pH, with AgNO3 and Whey concentrations contribute a total of 33.54 % on peak area. The largest contribution originates from the third order terms for both the peak wavelength and the peak area, with total contribution 53.56 %, and 52.22 % respectively. A significant contribution 33.83 % from the third order terms is noticeable for FWHM.

4. Discussion

The nanoparticle formation was only possible in alkaline environment (pH level 10), in accordance with previous works [10,11]. Cheese Whey is rich in amino acids and proteins [41]. Whey protein exhibits an isoelectronic point at pH of 5.2 – 5.9 [11,42], and amino acids at about pH of 5. 6 [10]. In an alkaline environment, the molecules have a net negative charge which allows them to bind to positive silver ions [10,11].
Silver nanoparticles from whey protein powder mixed with a tannin – rich extract, with mean diameter 31 nm and plasmon resonance at 415 nm have been reported [11]. The Whey powder concentration varied in the range 0.005 % w/v – 0.05 % w/v, and the silver nitrate concentration in the range 0.29 mM – 11.8 mM [11]. In a recent work, silver nanoparticles were formed using a mixture of whey protein isolate, NaCl, AgNO3, and NaBH4 solutions [13]. The average nanoparticle diameter was 138.6 nm and could be tuned in the range 22.5 – 149.6 nm [13]. Although whey protein isolate was a key component for nanoparticle formation, in both reported protocols additional chemicals were used [11,13]. In contrast, in this work, raw whey as provided from a dairy industry without any further treatment was used with the addition of sodium hydroxide. This, to our knowledge, is the first time such a protocol has been reported.
The analysis of the UV-Vis spectra along with the statistical analysis confirm that the synthesized silver nanoparticles depend on AgNO3, Whey and NaOH concentrations. This can be confirmed by the polynomial model and the corresponding pareto analysis describing the peak area under the measured UV-Vis absorption curve, since it counts for the ensemble of the silver nanoparticles2. In particular, the NaOH concentration has a significant effect on peak area through its interaction term with both AgNO3, and Whey concentrations.
In contrast, the nanoparticle average size (as described by the peak wavelength) as well as the size distribution as described by FWHM have very small dependence on NaOH concentration. This could be attributed to the fact that NaOH has a dual role on nanoparticle synthesis, one is to provide the alkaline conditions and the other to tune nanoparticle parameters. Incubation period is also used for tunning, whereas AgNO3 and Whey concentrations are the most important for the synthesis as expected.
The experimental investigation showed that metallic silver and silver oxide nanoparticles can coexist on the reaction solution. Metallic silver nanoparticles (AgNPs) were obtained for the following parameter ranges: a) Whey concentration 0.4 – 1.6 % v/v; b) AgNO3 concentration 0.15 – 0.6 mM; c) NaOH concentration 10 – 50 mM, and d) incubation period 20 – 60 min. The silver nitrate and Whey concentration ranges (using the BSA equivalent) are in close agreement with previous work [11]. Within these ranges the polynomial models are valid.
This work opens the possibility for size tuning of silver nanoparticles using a cheap by- product of the dairy industry. The formed nanoparticles will be investigated in the future for their antibacterial properties, as well as for their applications in areas such as food packaging [43]and photocatalytic dye degradation [44].

5. Conclusions

A novel protocol was developed for silver nanoparticle synthesis utilizing a cheap by-product of food industry; cheese whey from “Kalathaki Limnou” cheese production. The investigation focused on the independent factors, namely, incubation period, silver nitrate, Whey, and sodium hydroxide concentrations and their influence on nanoparticle formation. The fitting parameters, peak wavelength, peak area, and FWHM, of a Voigt profile fitted on the measured UV-Vis spectra were used as responses. Nanoparticle formation was only possible in an alkaline environment. The AgNPs synthesis following this proposed protocol underlines the advantages regarding a) its short time, as it was not necessary any elaboration of the materials (e.g. whey), b) its low cost, and c) the fact that a very pollutant food industry byproduct was deployed, helping this way in its managing.

Supplementary Materials

The following supporting information can be downloaded at the website of this paper posted on Preprints.org., Figure S1: Effect of Whey and AgNO3 concentrations on UV-Vis absorption spectra. AgNO3 concentration: a) 0.25 mM, b) 0.5 mM, c) 0.75 mM, d) 1 mM. Whey concentrations (legend): 0.05 % v/v, 0.2 % v/v, 0.8 % v/v, 1.2 % v/v, and 2 % v/v. Incubation temperature 60 °C. Incubation period 20 minutes. NaOH concentration 20 mM. Incubation time prior to NaOH addition 40 minutes.; Table S1: Fitting parameters of a Voigt function (λ0, A and FWHM) discussed in text, for two bands observed at the UV-Vis spectra at different NaOH and AgNO3 concentrations. Whey concentration 0.05 % v/v, and incubation temperature 60 °C. Incubation period 20 minutes. Incubation time prior to NaOH addition 40 minutes.; Figure S2: Effect of Whey and AgNO3 concentrations on UV-Vis absorption spectra. Whey concentration: a) 0. 05 % v/v, b) 0.2 % v/v, c) 0.8 % v/v, d) 1.2 % v/v, and e) 2 % v/v. AgNO3 concentrations (legend): 0.25 mM, 0.5 mM, 0.75 mM, 1 mM, and 1.5 mM. Incubation temperature 60 °C. Incubation period 20 min. NaOH concentration 20 mM. Incubation time prior to NaOH addition 40 minutes.; Table S2: Fitting parameters of a Voigt function (λ0, A and FWHM) discussed in text, for UV-Vis spectra at different NaOH and AgNO3 concentrations. Whey concentration 1.2 % v/v, and incubation temperature 60 °C. Incubation period 20 minutes. Incubation time prior to NaOH addition 40 minutes.; Figure S3: Effect of addition of ammonia (NH3) on UV-Vis absorption spectra after silver nanoparticles synthesis. The silver nanoparticles were synthesized using Whey extract 0.05 % v/v, for two AgNO3 concentrations: a) 0.25 mM, and b) 1.5 mM. NaOH concentration 20 mM. Incubation temperature 60 °C. Incubation period 20 min. Incubation time prior to NaOH addition 40 minutes. In panel (b), the spectrum with NH3 has been diluted with distilled water with ratio 1:9.; Table S3: Fitting parameters of Voigt function (λ0, A, FWHM) discussed in text, for UV-Vis spectra with and without the addition of ammonia (NH3) after nanoparticle synthesis, for different AgNO3 concentrations. The silver nanoparticles were synthesized using Whey extract 0.05 % v/v, and NaOH 20 mM. Incubation temperature 60 °C. Incubation period 20 minutes. Incubation time prior to NaOH addition 40 minutes.; Figure S4: Effect of incubation period (Time) after addition of NaOH on UV-Vis absorption spectra. Whey concentration 1.2 % v/v, AgNO3 concentration 0.15 mM, and NaOH concentration 40 mM. Incubation temperature 60 °C, and incubation time prior to NaOH addition 40 minutes.; Table S4: Fitting parameters of Voigt function (λ0, A, FWHM) discussed in text, for UV-Vis spectra for different incubation period. The silver nanoparticles were synthesized using Whey extract 1.2 % v/v, AgNO3 concentration 0.15 mM, and NaOH 40 mM. Incubation temperature 60 °C. Incubation time prior to NaOH addition 40 minutes.; Figure S5: BSA standard calibration curve. Measured absorbance at 595 nm from standard BSA solutions, and the best linear fit. The inset shows the slope, the intercept and R squared of the fit.; Table S5: ANOVA for multiple regression polynomial of responses of AgNPs by Whey, as a function of the independent factors.;

Author Contributions

Conceptualization, Christina Megetho Gkaliouri and Nickolas Rigopoulos; Data curation, Christina Megetho Gkaliouri, Nickolas Rigopoulos, Nikolaos Chalmpes and Viktoria Sakavitsi; Formal analysis, Nickolas Rigopoulos, Nikolaos Chalmpes, Viktoria Sakavitsi and Dimitrios Gournis; Funding acquisition, Nikolaos Chalmpes and Dimitrios Gournis; Investigation, Christina Megetho Gkaliouri, Nickolas Rigopoulos, Nikolaos Chalmpes, Viktoria Sakavitsi and Dimitrios Gournis; Methodology, Nickolas Rigopoulos and Dimitrios Gournis; Project administration, Christina Megetho Gkaliouri, Nickolas Rigopoulos, Nikolaos Chalmpes, Viktoria Sakavitsi and Dimitrios Gournis; Resources, Dimitrios Gournis; Supervision, Nickolas Rigopoulos and Dimitrios Gournis; Validation, Nickolas Rigopoulos, Nikolaos Chalmpes, Viktoria Sakavitsi and Dimitrios Gournis; Visualization, Christina Megetho Gkaliouri and Nickolas Rigopoulos; Writing – original draft, Christina Megetho Gkaliouri, Nickolas Rigopoulos, Nikolaos Chalmpes, Viktoria Sakavitsi and Dimitrios Gournis; Writing – review & editing, Christina Megetho Gkaliouri, Nickolas Rigopoulos, Nikolaos Chalmpes, Viktoria Sakavitsi and Dimitrios Gournis. All authors have read and agreed to the published version of the manuscript.

Funding

This work was supported partially by the project “National Infrastructure in Nanotechnology, Advanced Materials and Micro-/Nanoelectronics” (MIS-5002772) which was implemented under the action ‘‘Reinforcement of the Research and Innovation Infrastructure”, funded by the Operational Programme ‘‘Competitiveness, Entrepreneurship and Innovation” (NSRF 2014-2020), and co-financed by Greece and the European Union (European Regional Development Fund). N.C gratefully acknowledges the IKY foundation for the financial support. This research was also co-financed by Greece and the European Union (European Social Fund- ESF) through the Operational Programme ‘‘Human Resources Development, Education and Lifelong Learning” in the context of the project ‘‘Strengthening Human Resources Research Potential via Doctorate Research” (MIS-5000432), implemented by the State Scholarships Foundation (ΙΚY).

Data Availability Statement

The data presented in this study are available on request from the corresponding author.

Acknowledgments

Nickolas Rigopoulos and Christina Megetho Gkaliouri would like to acknowledge the valuable technical support of Andreas Petsas from the Department of Food Science and Nutrition, University of the Aegean.

Conflicts of Interest

The authors declare no conflicts of interest. The authors have no competing interests to declare that are relevant to the content of this article. All authors certify that they have no affiliations with or involvement in any organization or entity with any financial interest or non-financial interest in the subject matter or materials discussed in this manuscript. The authors have no financial or proprietary interests in any material discussed in this article. The datasets generated during and/or analyzed during the current study are available from the corresponding author upon reasonable request. The funders had no role in the design of the study; in the collection, analyses, or interpretation of data; in the writing of the manuscript; or in the decision to publish the results.
1
B. O. D.: Biochemical Oxygen Demand
2
UV – Vis spectra without the addition of either of the reactants did not show any absorption feature in the measured range.

References

  1. Kinsella JE, Whitehead DM. Proteins in Whey: Chemical, Physical, and Functional Properties, 1989, p. 343–438. [CrossRef]
  2. Elafros G. Novel process for cleaning waste from cheese industry 2014.
  3. Ha E, Zemel MB. Functional properties of whey, whey components, and essential amino acids: Mechanisms underlying health benefits for active people (Review). Journal of Nutritional Biochemistry 2003;14:251–8. [CrossRef]
  4. Chen H. Functional Properties and Applications of Edible Films Made of Milk Proteins. J Dairy Sci 1995;78:2563–83. [CrossRef]
  5. Gounga ME, Xu S-Y, Wang Z. Whey protein isolate-based edible films as affected by protein concentration, glycerol ratio and pullulan addition in film formation. J Food Eng 2007;83:521–30. [CrossRef]
  6. Gunasekaran S, Ko S, Xiao L. Use of whey proteins for encapsulation and controlled delivery applications. J Food Eng 2007;83:31–40. [CrossRef]
  7. Asefian S, Ghavam M. Green and environmentally friendly synthesis of silver nanoparticles with antibacterial properties from some medicinal plants. BMC Biotechnol 2024;24. [CrossRef]
  8. Youssef AM, El-Sayed SamahM. Bionanocomposites materials for food packaging applications: Concepts and future outlook. Carbohydr Polym 2018;193:19–27. [CrossRef]
  9. Dipankar C, Murugan S. The green synthesis, characterization and evaluation of the biological activities of silver nanoparticles synthesized from Iresine herbstii leaf aqueous extracts. Colloids Surf B Biointerfaces 2012;98:112–9. [CrossRef]
  10. Shankar S, Rhim JW. Amino acid mediated synthesis of silver nanoparticles and preparation of antimicrobial agar/silver nanoparticles composite films. Carbohydr Polym 2015;130:353–63. [CrossRef]
  11. Srisod S, Motina K, Inprasit T, Pisitsak P. A green and facile approach to durable antimicrobial coating of cotton with silver nanoparticles, whey protein, and natural tannin. Prog Org Coat 2018;120:123–31. [CrossRef]
  12. Ghodake G, Shinde S, Saratale RG, Kadam A, Saratale GD, Patel R, et al. Whey peptide-encapsulated silver nanoparticles as a colorimetric and spectrophotometric probe for palladium(II). Microchimica Acta 2019;186:763. [CrossRef]
  13. Zeng A, Wang B, Zhang C, Yang R, Yu S, Zhao W. Physicochemical properties and antibacterial application of silver nanoparticles stabilized by whey protein isolate. Food Biosci 2022;46. [CrossRef]
  14. Viorica RP, Pawel P, Boguslaw B. Use of Lactobacillus paracasei isolated from whey for silver nanocomposite synthesis: Antiradical and antimicrobial properties against selected pathogens. J Dairy Sci 2021;104:2480–98. [CrossRef]
  15. Lai YR, Lai JT, Wang SSS, Kuo YC, Lin TH. Silver nanoparticle-deposited whey protein isolate amyloid fibrils as catalysts for the reduction of methylene blue. Int J Biol Macromol 2022;213:1098–114. [CrossRef]
  16. Rigopoulos N, Thomou E, Kouloumpis A, Lamprou ER, Petropoulea V, Gournis D, et al. Optimization of Silver Nanoparticle Synthesis by Banana Peel Extract Using Statistical Experimental Design, and Testing of their Antibacterial and Antioxidant Properties. Curr Pharm Biotechnol 2019;20:858–73. [CrossRef]
  17. Rigopoulos N, Gkaliouri CM, Sakavitsi V, Gournis D. Full Factorial Design Synthesis of Silver Nanoparticles Using Origanum vulgare 2023. [CrossRef]
  18. El-Naggar NEA, Abdelwahed NAM. Application of statistical experimental design for optimization of silver nanoparticles biosynthesis by a nanofactory Streptomyces viridochromogenes. Journal of Microbiology 2014;52:53–63. [CrossRef]
  19. Biswas S, Mulaba-Bafubiandi AF. Optimization of process variables for the biosynthesis of silver nanoparticles by Aspergillus wentii using statistical experimental design. Advances in Natural Sciences: Nanoscience and Nanotechnology 2016;7:045005. [CrossRef]
  20. Montgomery DC. Design and Analysis of Experiments Eighth Edition. 1984.
  21. Asadzadeh F, Maleki-Kaklar M, Soiltanalinejad N, Shabani F. Central composite design optimization of zinc removal from contaminated soil, using citric acid as biodegradable chelant. Sci Rep 2018;8. [CrossRef]
  22. Bradford MM. A rapid and sensitive method for the quantitation of microgram quantities of protein utilizing the principle of protein-dye binding. Anal Biochem 1976;72:248–54. [CrossRef]
  23. Grintzalis K, Georgiou CD, Schneider Y-J. An accurate and sensitive Coomassie Brilliant Blue G-250-based assay for protein determination. Anal Biochem 2015;480:28–30. [CrossRef]
  24. Dada AO, Adekola FA, Adeyemi OS, Bello OM, Oluwaseun AC, Awakan OJ, et al. Exploring the Effect of Operational Factors and Characterization Imperative to the Synthesis of Silver Nanoparticles. Silver Nanoparticles - Fabrication, Characterization and Applications, InTech; 2018. [CrossRef]
  25. Quinten M. Optical Properties of Nanoparticle Systems. Wiley - Vch Verlag GmbH & Co. KGaA; 2011. [CrossRef]
  26. Khan MAM, Kumar S, Ahamed M, Alrokayan SA, AlSalhi MS. Structural and thermal studies of silver nanoparticles and electrical transport study of their thin films. Nanoscale Res Lett 2011;6:1–8. [CrossRef]
  27. Molleman B, Hiemstra T. Surface Structure of Silver Nanoparticles as a Model for Understanding the Oxidative Dissolution of Silver Ions. Langmuir 2015;31:13361–72. [CrossRef]
  28. Valenti LE, Giacomelli CE. Stability of silver nanoparticles: agglomeration and oxidation in biological relevant conditions. Journal of Nanoparticle Research 2017;19. [CrossRef]
  29. Manikandan V, Velmurugan P, Park J-H, Chang W-S, Park Y-J, Jayanthi P, et al. Green synthesis of silver oxide nanoparticles and its antibacterial activity against dental pathogens. 3 Biotech 2017;7:72. [CrossRef]
  30. Gallardo OAD, Moiraghi R, Macchione MA, Godoy JA, Pérez MA, Coronado EA, et al. Silver oxide particles/silver nanoparticles interconversion: susceptibility of forward/backward reactions to the chemical environment at room temperature. RSC Adv 2012;2:2923. [CrossRef]
  31. Ahmed S, Ahmad M, Swami BL, Ikram S. A review on plants extract mediated synthesis of silver nanoparticles for antimicrobial applications: A green expertise. J Adv Res 2016;7:17–28. [CrossRef]
  32. Nelson DL, Cox MM. Lehninger Principles of Biochemistry 7th. vol. 2. Macmillan International Higher Education; 2017.
  33. Deshmukh AR, Gupta A, Kim BS. Ultrasound Assisted Green Synthesis of Silver and Iron Oxide Nanoparticles Using Fenugreek Seed Extract and Their Enhanced Antibacterial and Antioxidant Activities. Biomed Res Int 2019;2019:1–14. [CrossRef]
  34. Trivedi MK, Dahryn Trivedi AB, Khemraj Bairwa HS. Fourier Transform Infrared and Ultraviolet-Visible Spectroscopic Characterization of Biofield Treated Salicylic Acid and Sparfloxacin. Nat Prod Chem Res 2015;03. [CrossRef]
  35. Alavi M, Karimi N. Characterization, antibacterial, total antioxidant, scavenging, reducing power and ion chelating activities of green synthesized silver, copper and titanium dioxide nanoparticles using Artemisia haussknechtii leaf extract. Artif Cells Nanomed Biotechnol 2018;46:2066–81. [CrossRef]
  36. Ruíz-Baltazar Á de J, Reyes-López SY, Mondragón-Sánchez M de L, Estevez M, Hernández-Martinez AR, Pérez R. Biosynthesis of Ag nanoparticles using Cynara cardunculus leaf extract: Evaluation of their antibacterial and electrochemical activity. Results Phys 2018;11:1142–9. [CrossRef]
  37. Gharibshahi L, Saion E, Gharibshahi E, Shaari A, Matori K. Structural and Optical Properties of Ag Nanoparticles Synthesized by Thermal Treatment Method. Materials 2017;10:402. [CrossRef]
  38. Gbassi G, Yolou F, Sarr S, Atheba P, Amin C, Ake M. Whey proteins analysis in aqueous medium and in artificial gastric and intestinal fluids. Int J Biol Chem Sci 2012;6. [CrossRef]
  39. Kora AJ, Arunachalam J. Green Fabrication of Silver Nanoparticles by Gum Tragacanth ( Astragalus gummifer ): A Dual Functional Reductant and Stabilizer. J Nanomater 2012;2012:1–8. [CrossRef]
  40. Kaushik R, Saran S, Isar J, Saxena RK. Statistical optimization of medium components and growth conditions by response surface methodology to enhance lipase production by Aspergillus carneus. J Mol Catal B Enzym 2006;40:121–6. [CrossRef]
  41. Boumba VA, Voutsinas LP, Philippopoulos CD. Composition and nutritional value of commercial dried whey products from feta cheese manufacture. Int J Dairy Technol 2001;54:141–5. [CrossRef]
  42. Mohebrad B, Rezaee A, Sohrabi B. Effect of isoelectric point on cheese whey wastewater treatment using a microbial electrochemical system. Bioelectrochemistry 2019;130. [CrossRef]
  43. Tran QH, Nguyen VQ, Le AT. Corrigendum: Silver nanoparticles: Synthesis, properties, toxicology, applications and perspectives (Advances in Natural Sciences: Nanoscience and Nanotechnology 4 (033001) DOI: 10.1088/2043-6262/4/3/033001). Advances in Natural Sciences: Nanoscience and Nanotechnology 2018;9. [CrossRef]
  44. Trieu QA, Le CTB, Pham CM, Bui TH. Photocatalytic degradation of methylene blue and antibacterial activity of silver nanoparticles synthesized from Camellia sinensis leaf extract. J Exp Nanosci 2023;18. [CrossRef]
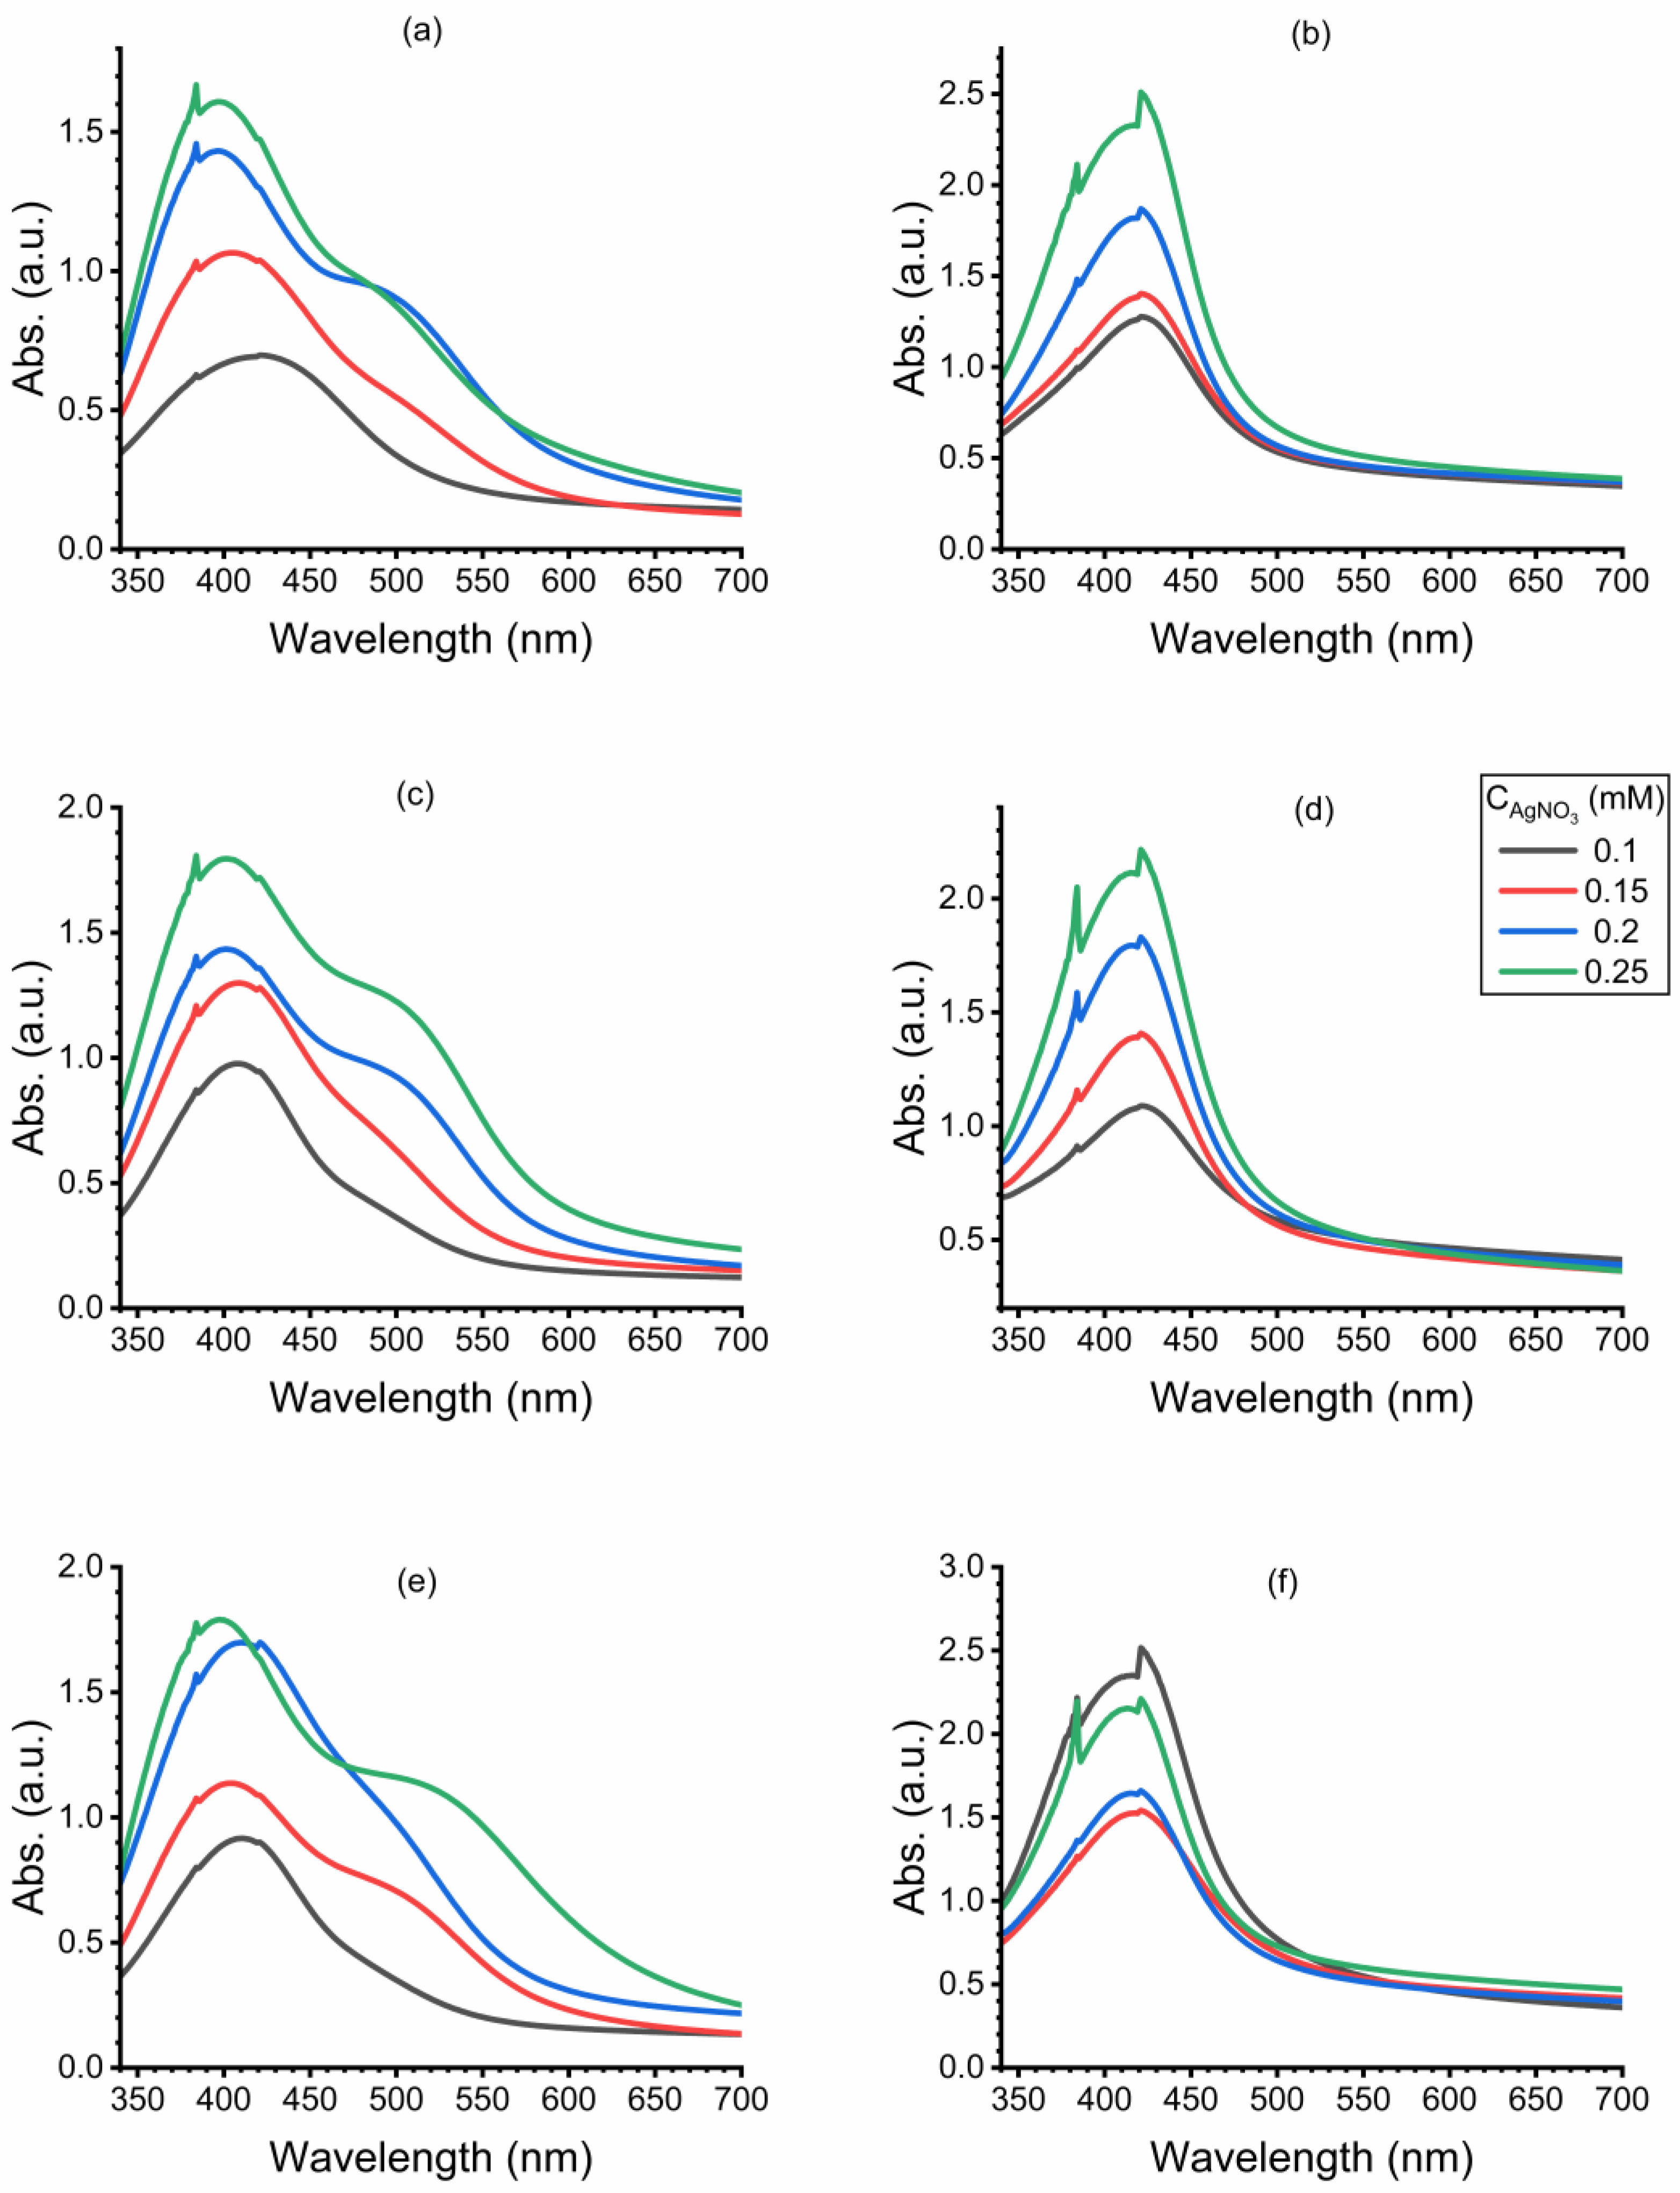
Figure 1. Effects of Whey, AgNO3, and NaOH concentrations on UV-Vis absorption spectra. a) Whey concentration 0.05 % v/v and NaOH concentration 20 mM, b) Whey concentration 1.2 % v/v and NaOH concentration 20 mM, c) Whey concentration 0.05 % v/v and NaOH concentration 40 mM, d) Whey concentration 1.2 % v/v and NaOH concentration 40 mM, e) Whey concentration 0.05 % v/v and NaOH concentration 60 mM, and f) Whey concentration 1.2 % v/v and NaOH concentration 60 mM. AgNO3 concentrations (legend): 0.1 mM, 0.15 mM, 0.2 mM, and 0.25mM. Incubation temperature 60 °C. Incubation time prior to addition of NaOH 40 minutes. Incubation period 20 minutes.
Preprints 99869 g001
Figure 2. a) AFM height image, b) 3D topography, c) Depth histogram, and d) cross-sectional analysis of Ag NPs.
Preprints 99869 g002
Figure 3. a) FTIR spectrum and b) X-ray diffraction pattern of AgNPs synthesized by Whey.
Preprints 99869 g003
Table 1. Coded and real values (in parentheses) of the four independent synthesis parameters (factors: X1, X2, X3, and X4), used for AgNPs synthesis by Whey, under CCD. The measured responses were the means of the Voigt profile parameters discussed in the text.
Run X1
(Cnitric mM)
X2
(CWhey % v/v)
X3 (CNaOH mM) X4
(Time min)
Responses
λ0 (nm) A
(a.u.a)
FWHM (nm)
1 0 (0.3) 0 (0.8) -2(10) 0 (40) 411 250 101
2 -1 (0.15) -1 (0.4) -1 (20) 1 (50) 413 191 106
3 -1 (0.15) 1 (1.2) -1 (20) 1 (50) 415 202 97
4 -1 (0.15) -1 (0.4) -1 (20 -1 (30) 410 190 104
5 -1 (0.15) 1 (1.2) -1 (20) -1 (30) 423 171 111
6 1 (0.45) -1 (0.4) -1 (20) 1 (50) 403 421 126
7 1 (0.45) 1 (1.2) -1 (20) -1 (30) 405 282 132
8 1 (0.45) -1 (0.4) -1 (20) -1 (30) 398 490 139
9 1 (0.45) 1 (1.2) -1 (20) 1 (50) 399 346 112
10 -2 (0) 0 (0.8) 0 (30) 0 (40) n/ab n/ab n/ab
11 0 (0.3) -2 (0) 0 (30) 0 (40) 487 62 335
12 0 (0.3) 0 (0.8) 0 (30) 0 (40) 407 274 105
13 0 (0.3) 0 (0.8) 0 (30) -2 (20) 410 322 105
14 0 (0.3) 0 (0.8) 0 (30) 2 (60) 409 312 131
15 0 (0.3) 2 (1.6) 0 (30) 0 (40) 402 311 95
16 2 (0.6) 0 (0.8) 0 (30) 0 (40) 406 724 170
17 -1 (0.15) 1 (1.2) 1 (40) -1 (30) 422 221 107
18 -1 (0.15) -1 (0.4) 1 (40) 1 (50) 412 175 111
19 -1 (0.15) 1 (1.2) 1 (40) 1 (50) 418 229 108
20 -1 (0.15) -1 (0.4) 1 (40) -1 (30) 410 150 107
21 1 (0.45) -1 (0.4) 1 (40) -1 (30) 401 284 128
22 1 (0.45) -1 (0.4) 1 (40) 1 (50) 401 215 109
23 1 (0.45) 1 (1.2) 1 (40) 1 (50) 401 315 124
24 1 (0.45) 1 (1.2) 1 (40) -1 (30) 400 382 117
25 0 (0.3) 0 (0.8) 2 (50) 0 (40) 405 306 110
aa.u. = arbitary units, bn/a = not applicable.
Table 2. Measured absorbance at 595 nm from Whey samples, derived BSA equivalent, and BSA per μg of Whey.
A595nm (a.u.) BSA-eq (μg/ml) BSA per μg of Whey (μg/μL whey)
0.647 16.93 4.84
0.640 16.69 4.77
0.636 16.55 4.73
aa.u. = Arbitary units.
Table 3. Estimated regression coefficients for AgNPs synthesis, for the peak wavelength λ0 using CCD.
Variables Coefficient Coefficient SE t- test p-value
Intercept 408.69 0.862 474.12 0.000
Cnitric (X1) 17.40 1.36 12.77 0.000
CWhey (X2) 10.067 0.528 19.07 0.000
CNaOH (X3) 0.393 0.528 0.74 0.478
Time (X4) -0.373 0.305 -1.22 0.256
X1X1 -9.373 0.681 -13.75 0.000
X2X2 8.908 0.341 26.14 0.000
X3X3 -0.011 0.341 -0.03 0.974
X1X2 -1.798 0.373 -4.82 0.001
X2X3 0.015 0.373 0.04 0.968
X2X4 -1.689 0.373 -4.53 0.002
X3X4 0.297 0.373 0.80 0.449
X2X2X2 -7.869 0.215 -36.52 0.000
X3X3X3 -0.497 0.215 -2.31 0.050
X1X2X2 -24.55 1.41 -17.37 0.000
X2X3X4 0.990 0.373 2.65 0.029
R2 = 99.75 %.
Table 4. Estimated regression coefficients for AgNPs synthesis, for the peak area A using CCD.
Variables Coefficient Coefficient SE t- test p-value
Intercept 302.8 18.5 16.38 0.000
Cnitric (X1) 29.8 14.5 2.06 0.073
CWhey (X2) -18.1 11.3 -1.60 0.148
CNaOH (X3) -31.3 11.3 -2.77 0.024
Time (X4) -3.97 6.54 -0.61 0.560
X1X1 -1.1 14.6 -0.07 0.943
X2X2 -29.10 7.31 -3.98 0.004
X3X3 -6.16 7.31 -0.84 0.424
X1X2 -12.72 8.00 -1.59 0.151
X1X3 -22.78 8.00 -2.85 0.022
X1X4 -12.84 8.00 -1.60 0.147
X2X3 38.41 8.00 4.80 0.001
X1X1X1 45.8 10.1 4.53 0.002
X2X2X2 20.12 4.62 4.35 0.002
X3X3X3 11.32 4.62 2.54 0.040
X1X2X3 21.80 8.00 2.72 0.026
R2 = 97.96 %.
Table 5. Estimated regression coefficients for AgNPs synthesis, for the peak FWHM using CCD.
Variables Coefficient Coefficient SE t- test p-value
Intercept 105.63 2.84 37.22 0.000
Cnitric (X1) -13.18 2.22 -5.94 0.002
CWhey (X2) 18.31 1.74 10.54 0.000
CNaOH (X3) 0.18 1.00 0.18 0.867
Time (X4) -6.28 1.74 -3.61 0.015
X1X1 -20.91 2.24 -9.32 0.000
X2X2 27.29 1.12 24.33 0.000
X4X4 2.98 1.12 2.66 0.045
X1X2 -0.71 1.23 -0.58 0.586
X1X3 -2.98 1.23 -2.42 0.060
X1X4 -2.32 1.23 -1.89 0.117
X2X3 1.57 1.23 1.28 0.257
X2X4 -0.09 1.23 -0.07 0.944
X3X4 2.38 1.23 1.94 0.111
X1X1X1 21.79 1.55 14.05 0.000
X2X2X2 -19.587 0.709 -27.61 0.000
X4X4X4 3.197 0.709 4.51 0.006
X1X2X4 2.37 1.23 1.93 0.111
X2X3X4 2.77 1.23 2.25 0.074
R2 = 99.77 %.
Table 6. Pareto analysis for significant terms in the third order model for peak wavelength λ0, peak area A, and FWHM.
Peak wavelength λ0 Peak Area A FWHM
Term Per. Efa (%) Term Per. Ef (%) Term Per. Ef (%)
X 1 24.35 X 2 2 14.24 X 1 6.76
X 2 8.15 X 1 X 3 8.73 X 2 13.05
X 1 2 7.07 X 2 X 3 24.81 X 1 2 17.02
X 2 2 6.38 X 1 3 35.27 X 2 2 29.00
X 1 X 2 0.26 X 2 3 6.81 X 4 2 0.35
X 2 X 4 0.23 X 3 3 2.15 X 1 3 18.49
X 2 3 4.98 X 1 X 2 X 3 7.99 X 2 3 14.94
X 3 3 0.02 X 4 3 0.4
X 1 X 2 2 48.48
X 2 X 3 X 4 0.08
aPer. Ef = Percentage effect.
Disclaimer/Publisher’s Note: The statements, opinions and data contained in all publications are solely those of the individual author(s) and contributor(s) and not of MDPI and/or the editor(s). MDPI and/or the editor(s) disclaim responsibility for any injury to people or property resulting from any ideas, methods, instructions or products referred to in the content.
Copyright: This open access article is published under a Creative Commons CC BY 4.0 license, which permit the free download, distribution, and reuse, provided that the author and preprint are cited in any reuse.
Prerpints.org logo

Preprints.org is a free preprint server supported by MDPI in Basel, Switzerland.

Subscribe

© 2024 MDPI (Basel, Switzerland) unless otherwise stated