1. Introduction
As a new green mining technology, backfill mining has been popularized and applied in mining [
1,
2]. The strength of the cemented paste backfill (CPB) determines the stability of the goaf. The strength of the CPB is not only related to the mass concentration of the backfill slurry, curing age, sand-cement ratio and other factors, but also to the size and shape of the CPB. The mechanical properties of the material will change with the size of the material, and this special property is called the size effect [
3,
4,
5,
6]. Under the conditions of high sand-cement ratio and small-sized specimens, the CPB will have low strength accuracy because the test strength value of the CPB is less than 10% of the range of the press. Therefore, in order to facilitate the testing and computation of the strength value of the CPB under the condition of high sand-cement ratio, it is necessary to explore the size effect of the CPB under different sizes.
At present, there have been some studies on the size effect of CPB at home and abroad. For the cube CPB specimens, Neville[
7] conducted Uniaxial compressive strength (UCS) on cement mortar cubes of 3 sizes (70
mm, 125,
mm 150
mm), and found that the strength of the 70
mm specimen was greater than that of the 125
mm and 150
mm. Bayram et al. [
8] analyzed the strength properties and ultrasonic wave velocity of CPB with sizes of 10
cm and 20
cm respectively, and found that there is a very obvious size effect on the strength of CPB, and the strength of the 10
cm block is greater than that of the 20
cm block. Gan et al. [
9] tested the strength of different sizes of CPB specimens by preparing CPB specimens with a sand-cement ratio of 4:1. The experiment showed that the peak strength of CPB specimens with a size of 200
mm was only half of 70.7
mm. For cylinder backfill specimens, Xu et al. [
10] conducted experiments on the ratio of full tailings CPB of different sizes, and showed that the sand-cement ratio was 4:1-8:1, and under the same height-diameter ratio, the UCS of the CPB of the
φ76.2
mm×152.4
mm cylinder is greater than that of the
φ50.8
mm×101.6
mm cylinder. The conclusion is similar to that of the strength of the cube specimens, both of which show that the strength of the CPB specimens with smaller size is higher. When Hassani et al. [
11] studied the influence of the size of CPB with a sand-cement ratio of 6:1 on the UCS, they found that the UCS of the CPB increases with the increase of the size when the diameter of the cylinder is within 15.2
cm, and the diameter exceeds 15.2
cm, the results were reversed. This shows that the increase of the UCS and diameter of the cylinder CPB does not completely show a positive correlation. For the different shapes of CPB specimens, Ye et al. [
12] prepared cube and cylinder CPB specimens with a sand-ash ratio of 4:1-8:1 and a concentration of 65%-72%. Under the condition of and mass concentration, the strength test results show that the UCS of 70.7
mm cube >
φ7.08
cm × 14.2
cm cylinder >
φ5.13
cm × 10
cm cylinder, that is, the shape of the specimen has a significant impact on the UCS of the CPB. For the CPB specimens with different height-diameter ratios, Wang et al. [
13] conducted an experiment to test the UCS of cylinder CPB specimens with a sand-cement ratio of 4:1, φ50
mm, and a height-diameter ratio of 1:1-1:5. The results show that with the increase of the height-diameter ratio, the UCS of the CPB specimen shows an inversely proportional function and gradually decreases.
The above studies show that size, shape, and height-diameter ratio have a significant impact on the UCS of the CPB. Between 4:1-8:1. At present, many mines at home and abroad are filled with high sand-cement ratio due to filling methods or other factors. At this time, the UCS of high sand-cement ratio CPB is low, and its UCS cannot be accurately tested under the large range of ordinary servo presses in the laboratory. Based on this, in this paper, the CPB specimens with high sand-cement ratios of 8:1, 12:1, and 24:1, mass concentrations of 71%, 72%, and 73%, and aspect ratios of 0.5, 1, and 2 were used to carry out a axial compression test. The significant effects of sand-cement ratio, mass concentration, and aspect ratio on the UCS of the CPB were investigated by the response surface design method, and the size effect and failure characteristics of the CPB were analyzed, the strength size effect mechanism of high sand-cement ratio CPB was revealed, and the UCS conversion model under different height-diameter ratios with high sand-cement ratio were established. It provides a theoretical basis for the design UCS parameters of mine CPB.
2. Experimental Design
2.1. Experimental Materials and Tools
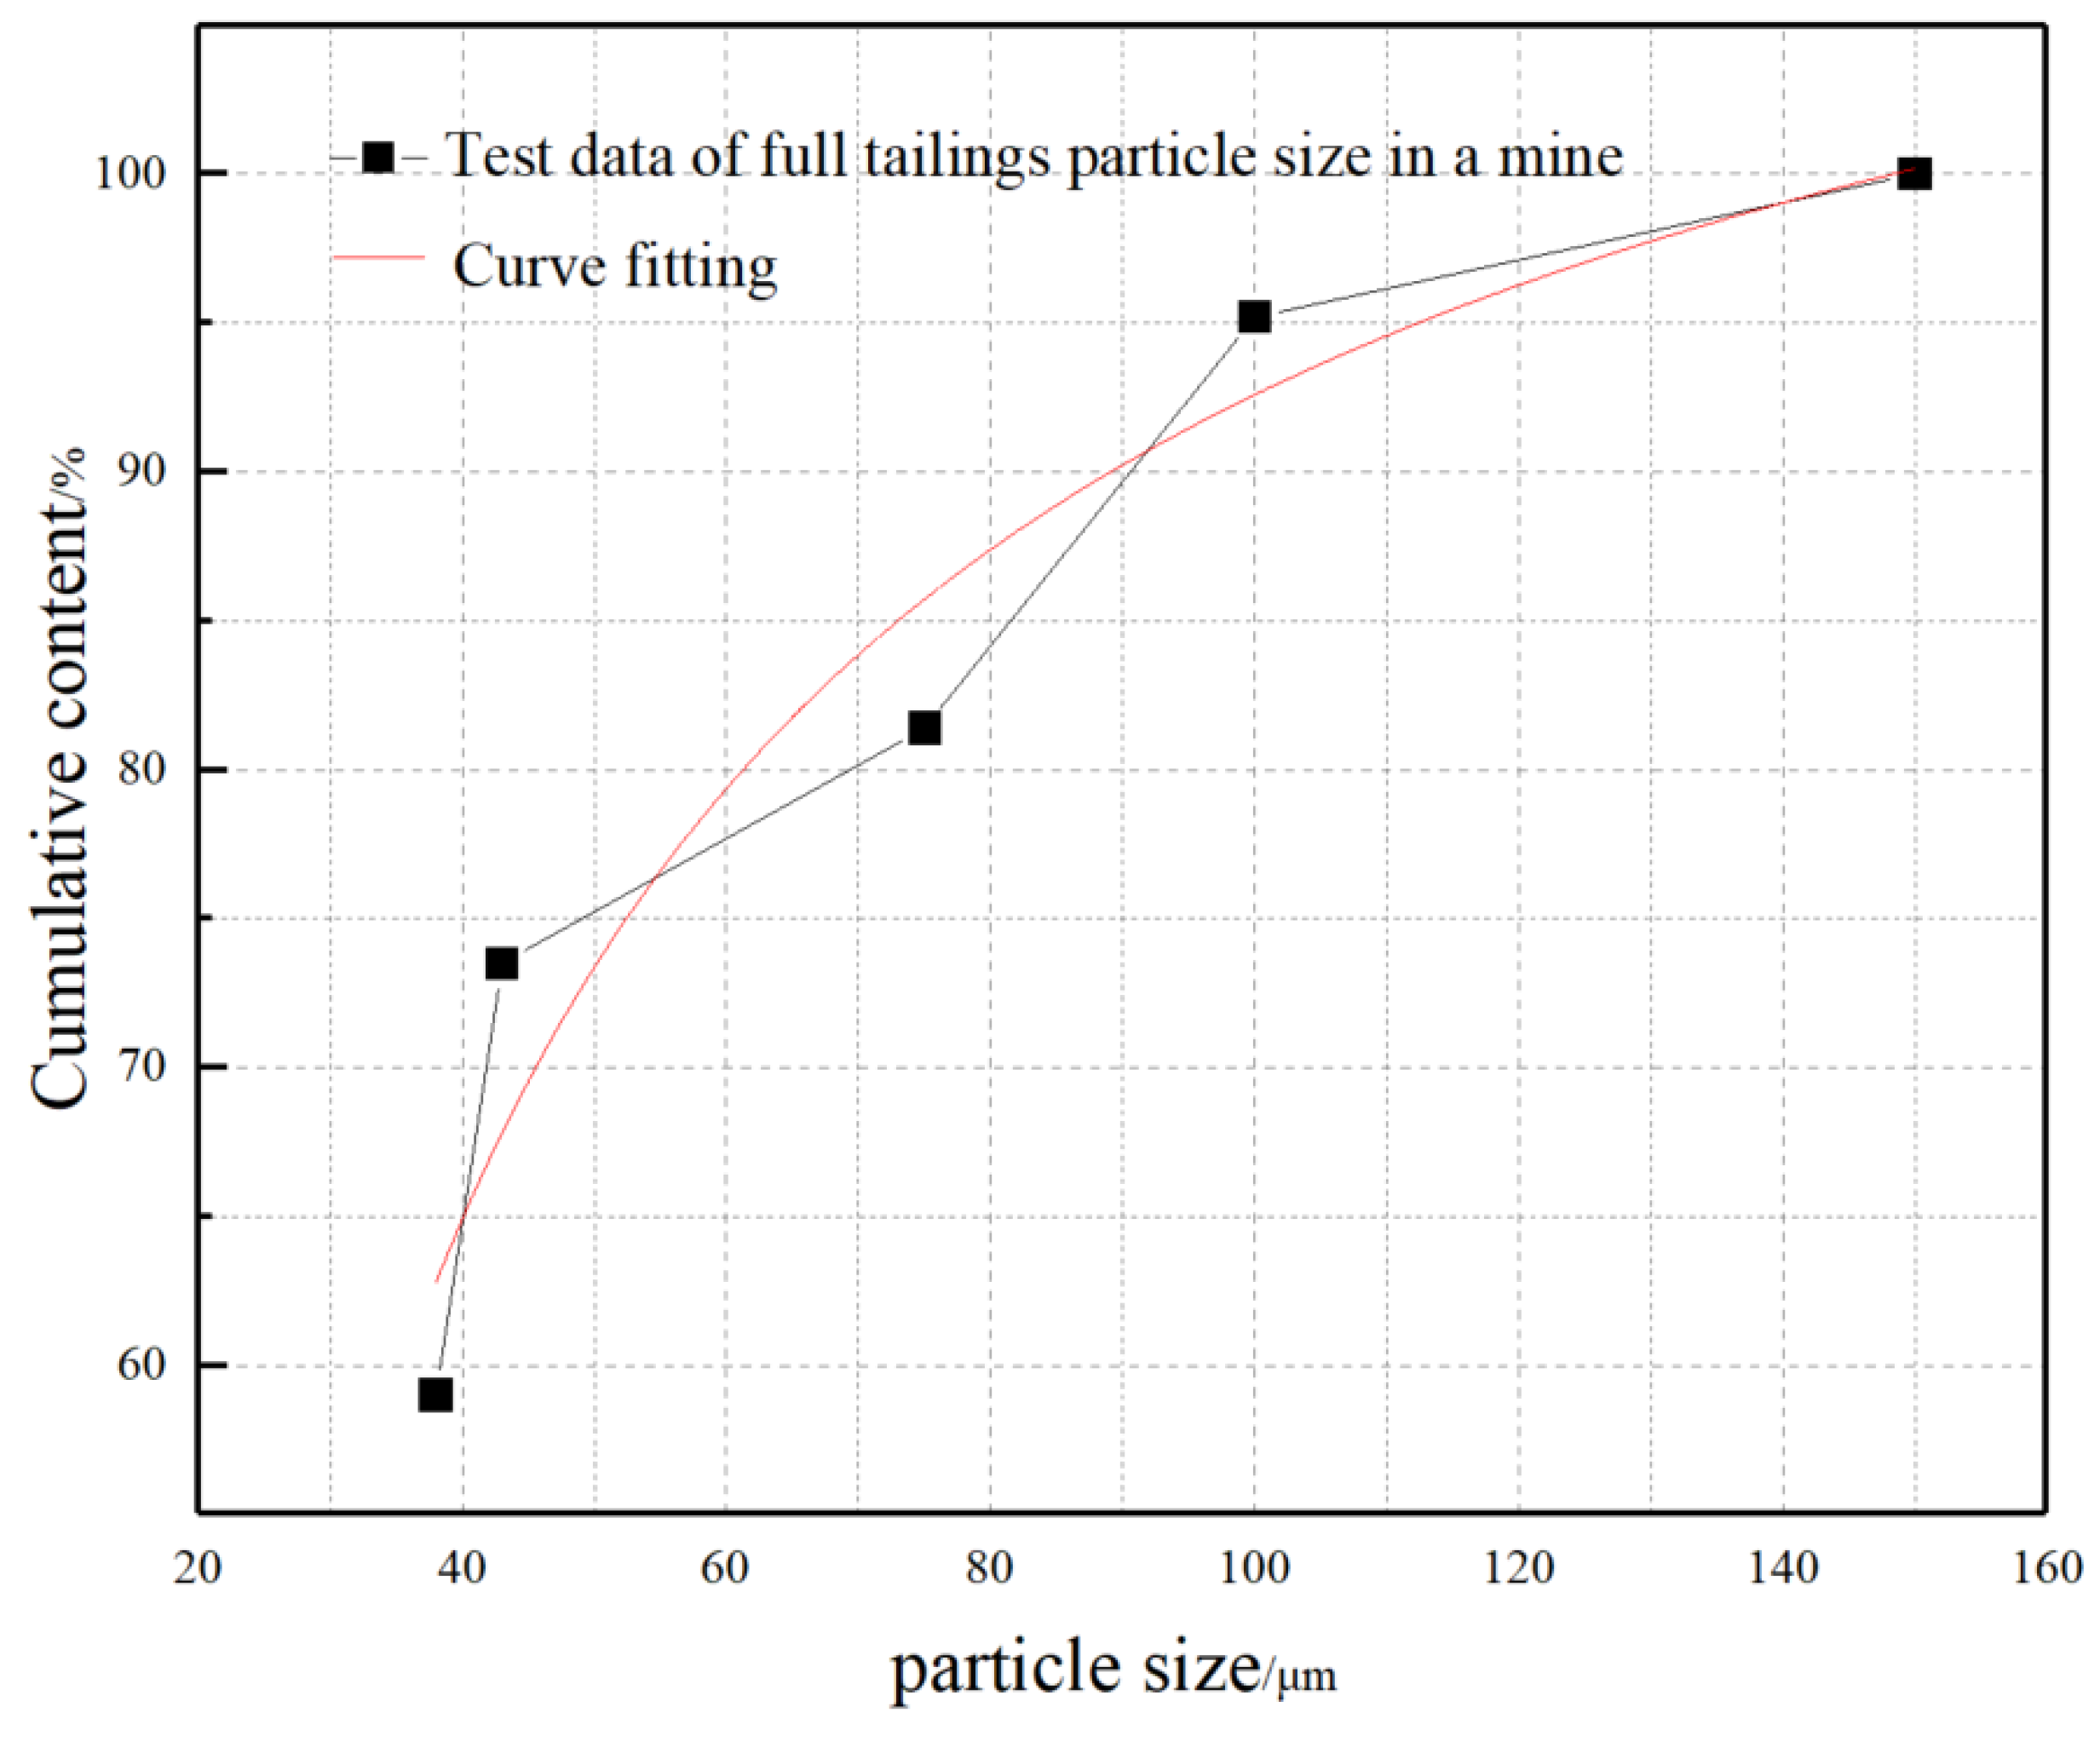
The experimental materials mainly include tailings, cement and water. The tailings are all tailings of a copper mine. The particle gradation curve of the tailings is shown in
Figure 1. The tailings density is 2600
kg/m³ and the average particle size is 0.04
mm. The cement adopts 32.5 slag Portland cement produced by a cement factory, and the mixing water is the water used in a mine dressing plant. No additives are added during the preparation of filling slurry. Two kinds of molds were used for the preparation of CPB, 70.7
mm×70.7
mm×70.7
mm and 100
mm×100
mm×100
mm cube molds.
2.2. Experimental Scheme
After the preparation of test materials and tools, firstly, design the filling slurry sand-cement ratio (8, 12, 24) and mass concentration (71%, 72%, 73%). Secondly, four types of CPB were made, the 70.7mm infill was used as the reference specimen for the following analysis; the infill samples with aspect ratios of 1 and 2 were prepared by a set of 100mm cube molds; the infill samples with an aspect ratio of 0.5 were prepared by two sets of 100mm cube test block splicing. Then, it is put into an environment with a temperature of 20°C and a humidity of more than 90% for curing after the preparation is completed, and the curing age is 28 days(d). Finally, due to the small loading size of the press, it is not suitable for the CPB with aspect ratio of 1:2 in this experiment. Before uniaxial compression, the backing plate of the CPB needs to be remanufactured to ensure the same material as the loading backing plate of the equipment. The UCS test of the filling body is carried out with an electro-hydraulic servo press, and the loading rate is 0.1kN/s.
2.3. Experimental Design
This paper mainly explores the size effect of CPB with different aspect ratios. The Box-behnken in Response Surface Methodology (RSM for short) was used for experimental design. The experiment selects three independent variables and one dependent variable. The dependent variable is the 28d UCS of the CPB, and the independent variables are the aspect ratio, mass concentration, and sand-cement ratio. The aspect ratios of the CPB were 1:2 (100mm×200mm), 1:1 (100mm×100mm), 2:1 (200mm×100mm), and the mass concentrations are 71%, 72%, and 73%; and the sand-cement ratios were 8, 12, 24 respectively. According to Box-behnken, the experimental design is divided into 17 groups of experiments.
3. Analysis of RSM Experimental Results
According to the test results of UCS of 17 groups of CPB, the influence law of sand-cement ratio and mass concentration on the UCS and size effect of CPB was analyzed respectively, and the three independent variables of aspect ratio, mass concentration and sand-cement ratio on the CPB were analyzed. The degree of significant influence on 28
d UCS. The results of the UCS test of the CPB are shown in
Table 1.
3.1. Analysis of the Sand-Cement Ratio on the UCS and Size Effect of the CPB
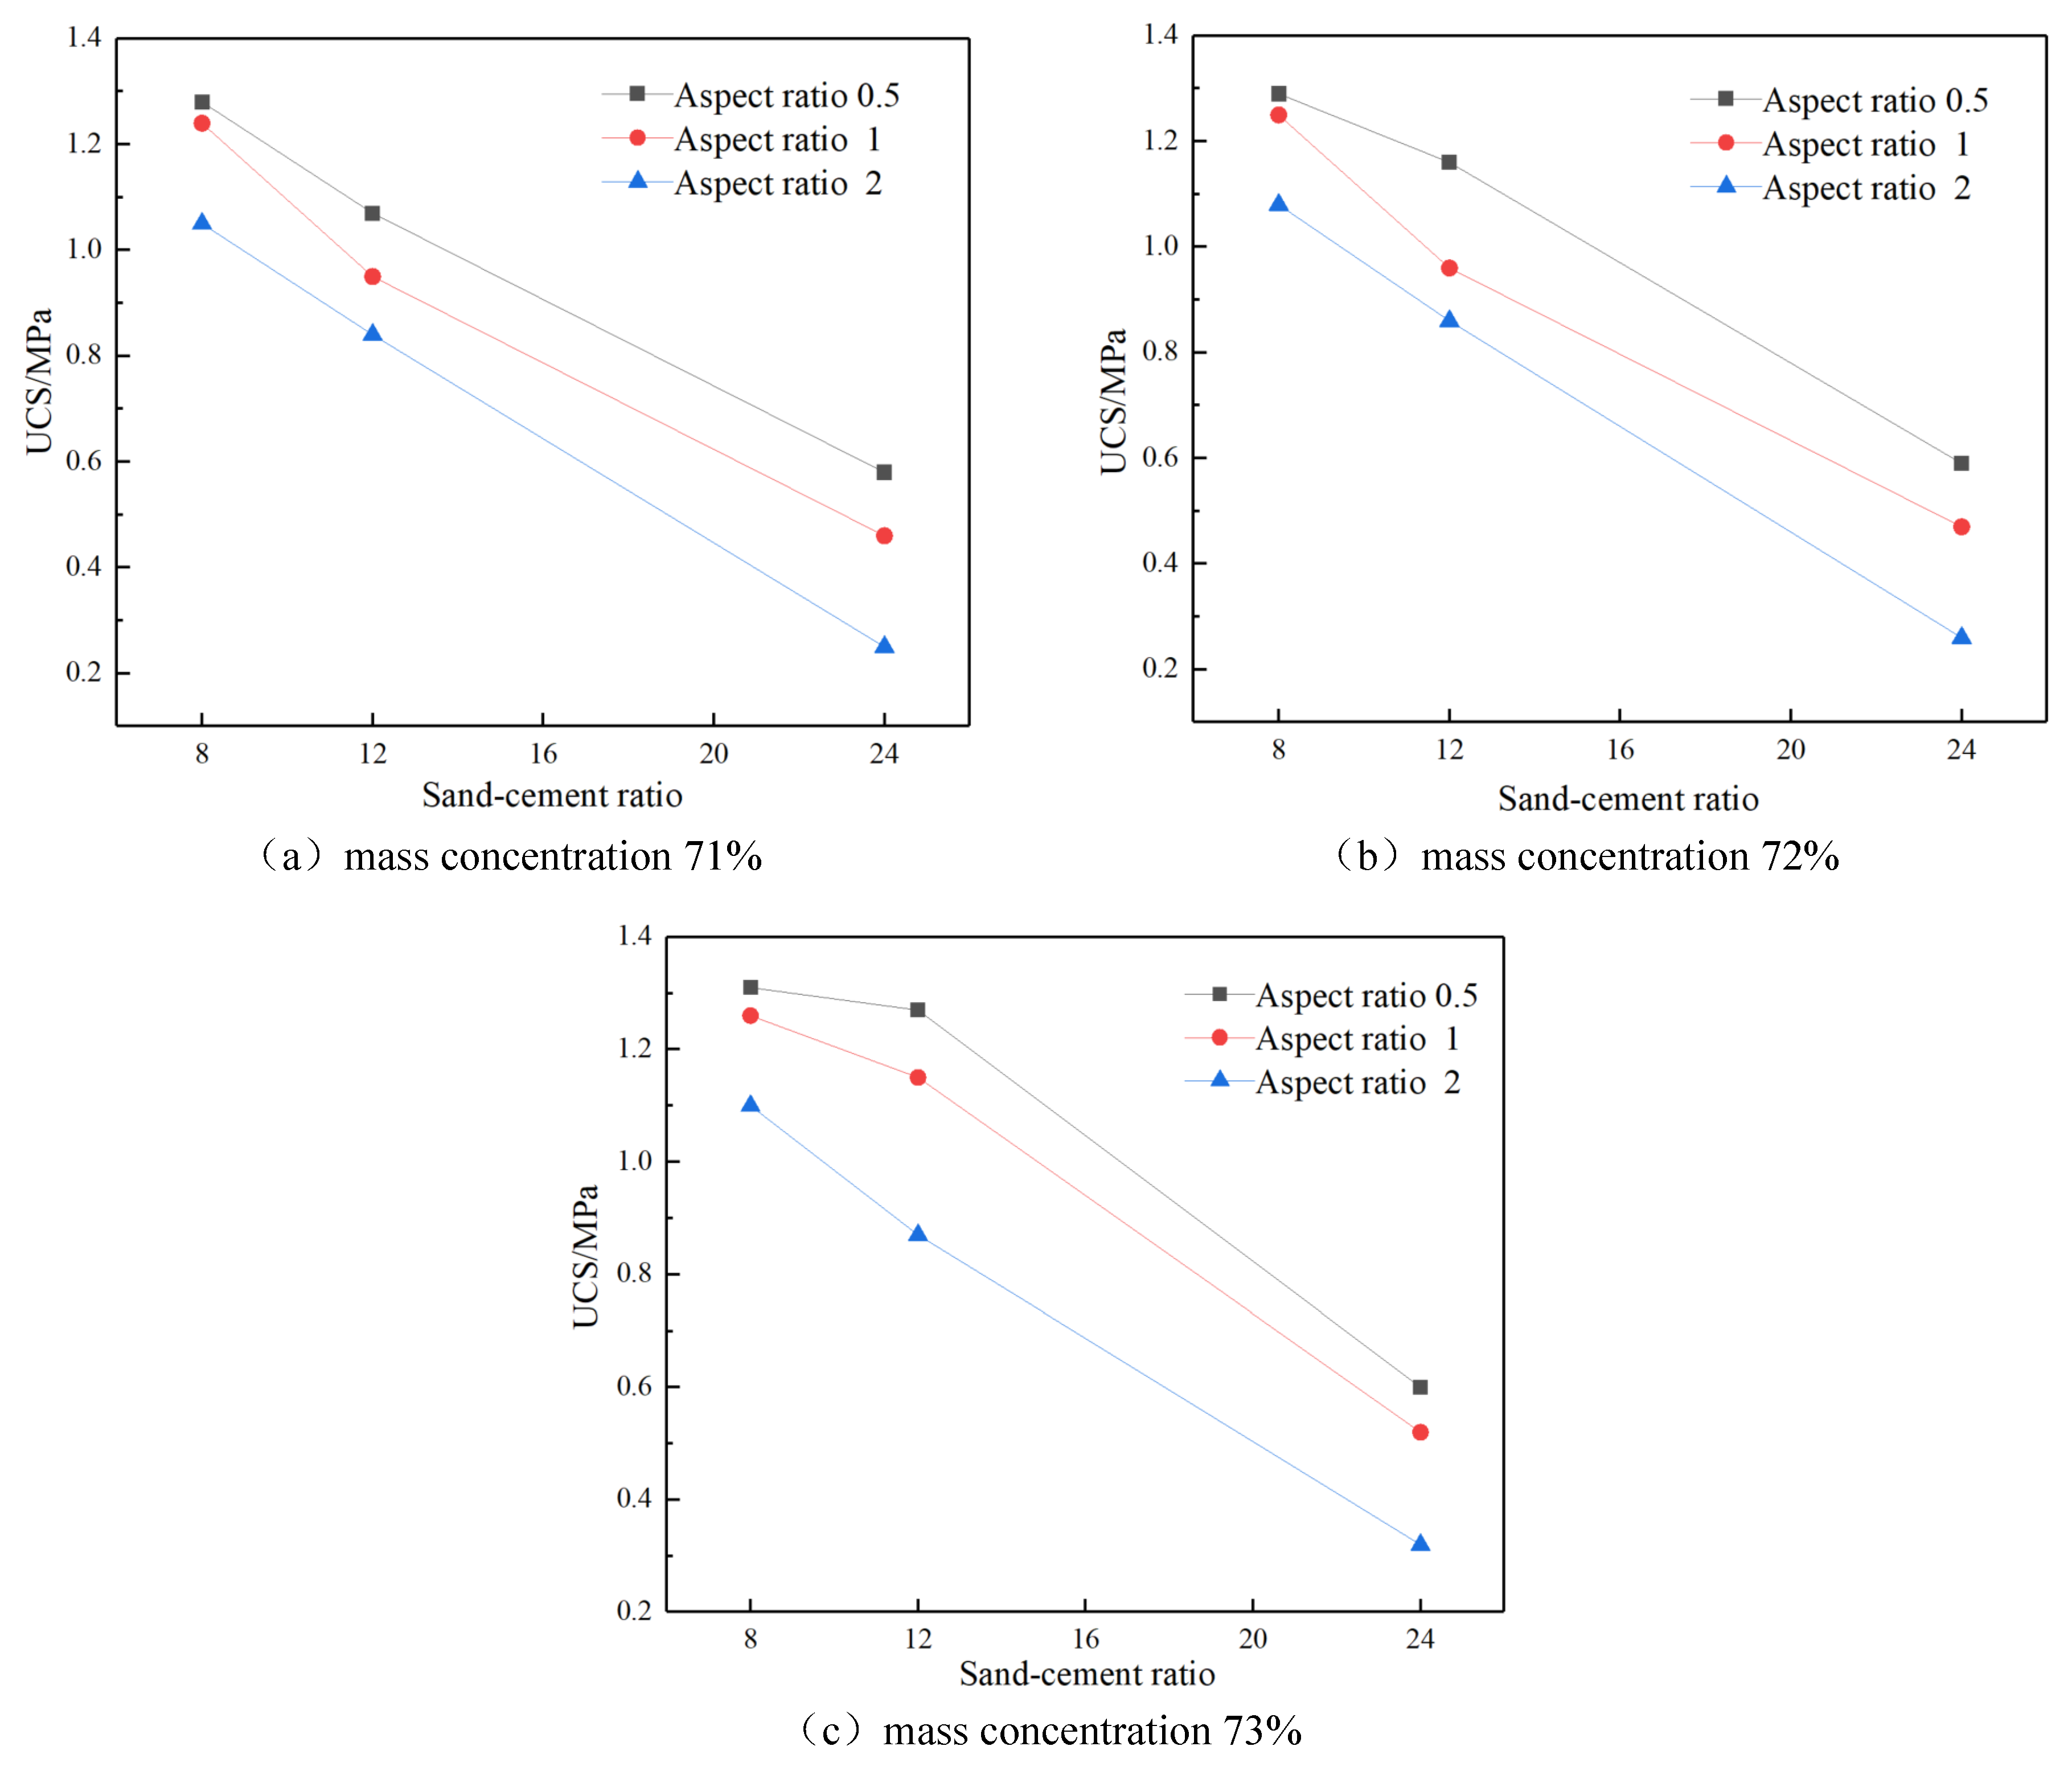
Under the conditions of the same slurry mass concentration, the relationship between the sand-cement ratio and UCS of the CPB of each size is shown in
Figure 2. It can be seen from
Figure 2 that under the same slurry concentration, the common knowledge for the sand-cement ratio is that the UCS of the CPB decreases with the increase of the sand-cement ratio. In this experiment, the UCS of the CPB with three aspect ratios decreases with the increase of the sand-cement ratio. When the sand-cement ratio increased from 8 to 24, the UCS of the CPB decreased by a maximum of 75%. Under the same slurry mass concentration, the order of the UCS of the CPB of each size is: the aspect ratio is 0.5> the aspect ratio is 1> the aspect ratio is 2. There is a large difference in strength between different sizes, and the maximum difference in strength is 55%, which indicates that there is an obvious size effect in the CPB of each size, and the high sand-cement ratio has a greater impact on the size effect of the CPB.
3.2. Analysis of the Mass Concentration on the UCS and Size of the CPB
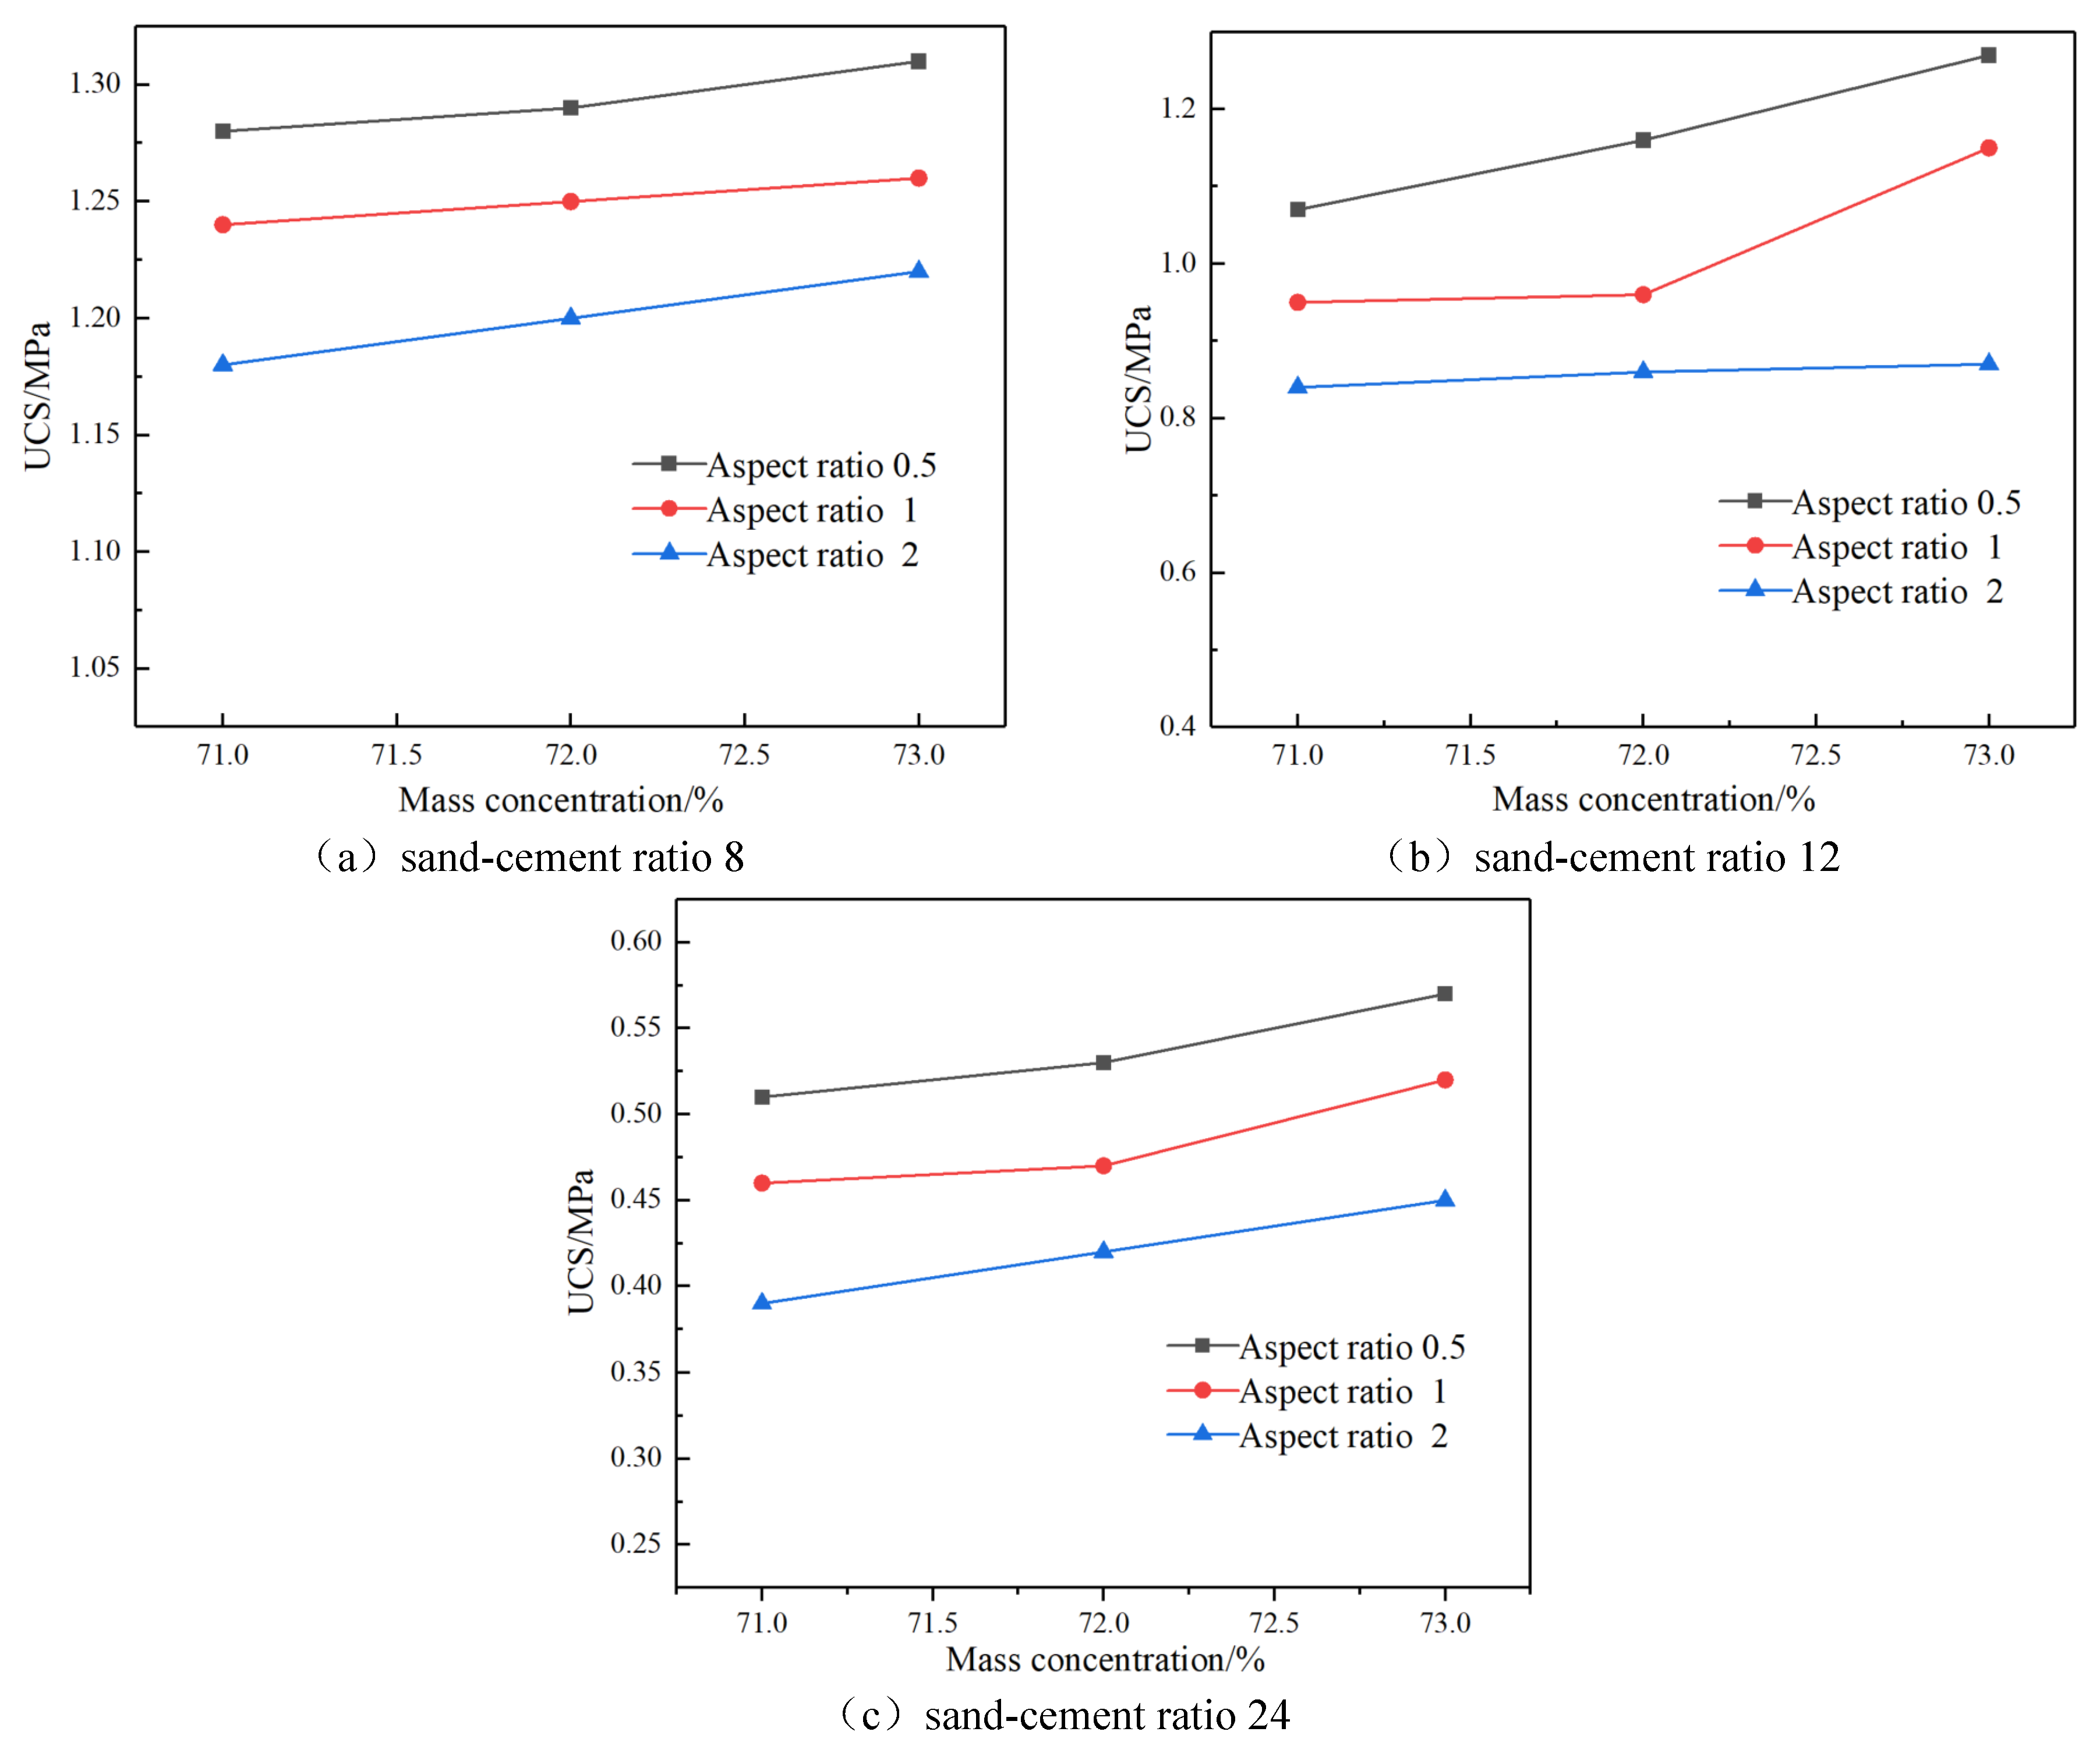
Under the conditions of the same sand-cement ratio, the relationship between the mass concentration of the CPB slurry and the UCS of each size is shown in
Figure 3. It can be seen from
Figure 3 that under the same sand-cement ratio, the UCS of the CPB with the three aspect ratios increases with the increase of the mass concentration. This can be explained as the phenomenon of segregation and stratification and uneven particle distribution in the slurry when the mass concentration is low [
14], resulting in an increase in the pores of the CPB and a decrease in the final UCS; as the mass concentration increases, the degree of segregation and stratification in the slurry decreases, the UCS increases gradually. In this experiment, when the mass concentration increased from 71% to 73%, the UCS of the CPB increased by 21% at the maximum, and the increasing trend was relatively slow. Under the same sand-cement ratio, the order of the UCS of the CPB of each size is as follows: the aspect ratio is 0.5> the aspect ratio is 1> the aspect ratio is 2. The difference in UCS between each size is small, and the maximum difference in strength is 29%, which indicates that the mass concentration of the CPB has little effect on the size effect of the three high-to-width ratio CPB.
3.3. Analysis of Variance Results
The UCS results measured according to the experimental design in
Table 1 were input into the Design-Expert software, and the results of variance analysis were shown in
Table 2. It can be seen from
Table 2 that the
F value of the model is 68.05, and the
P value is less than 0.0001, which means that the model has a significant impact. Three independent variables have different degrees of significant influence on the 28
d UCS of the CPB. Among them, the
F value of the independent variable
C (sand-cement ratio) is 188.54, and the
P value is less than 0.0001, which is a very significant influencing factor; the independent variable The
F value of
A (aspect ratio) is 14.24, and the
P value is less than 0.005, which is a sub-significant factor; the
F value of the independent variable
B (mass concentration) is 0.90, and the
P value is > 0.1, which is a weakly significant factor. This conclusion also verifies the conclusions of Sections 3.1 and 3.2.
The multiple linear regression analysis function of the Design-Expert software was used to carry out regression analysis on the UCS of the CPB. In order to make the regression equation fit well and control and predict variables accurately, a multiple linear regression model of the following formula (1) is established:
In the formula: f is the 28d UCS of the CPB of the dependent variable; x1 is the aspect ratio of the CPB; x2 is the mass concentration of the CPB; x3 is the sand-cement ratio of the CPB slurry.
The goodness of fit R2 of the model is 0.93, and the fitting effect is good, and the model can effectively predict the 28d UCS of the CPB under the conditions of different aspect ratios, mass concentrations and sand-cement ratios.
4. Size Effect Analysis of UCS of the CPB under the High Sand-Cement Ratio Backfill
According to the results of the RSM test, the aspect ratio is a significant factor affecting the UCS of the CPB. It is necessary to further analyze the UCS failure characteristics and size effect mechanism of the CPB under different aspect ratios.
4.1. Size Effect Degree Analysis of UCS
In order to quantitatively analyze the size-effect relationship of the UCS of CPB, a 70.7
mm cube specimen was used as the reference size, and the aspect ratios were 0.5 (100
mm/200
mm), 1 (100
mm/100
mm), 2 (200
mm/100
mm) specimens as non-reference dimensions. The concept of size effect degree in concrete size effect analysis was introduced to describe the size effect of the UCS of the CPB cube specimens[
15], and the size effect degree was calculated according to formula (2):
In the formula: γa represents the size effect degree; fs is the UCS of the CPB of the reference size; fa is the UCS of the CPB with size a.
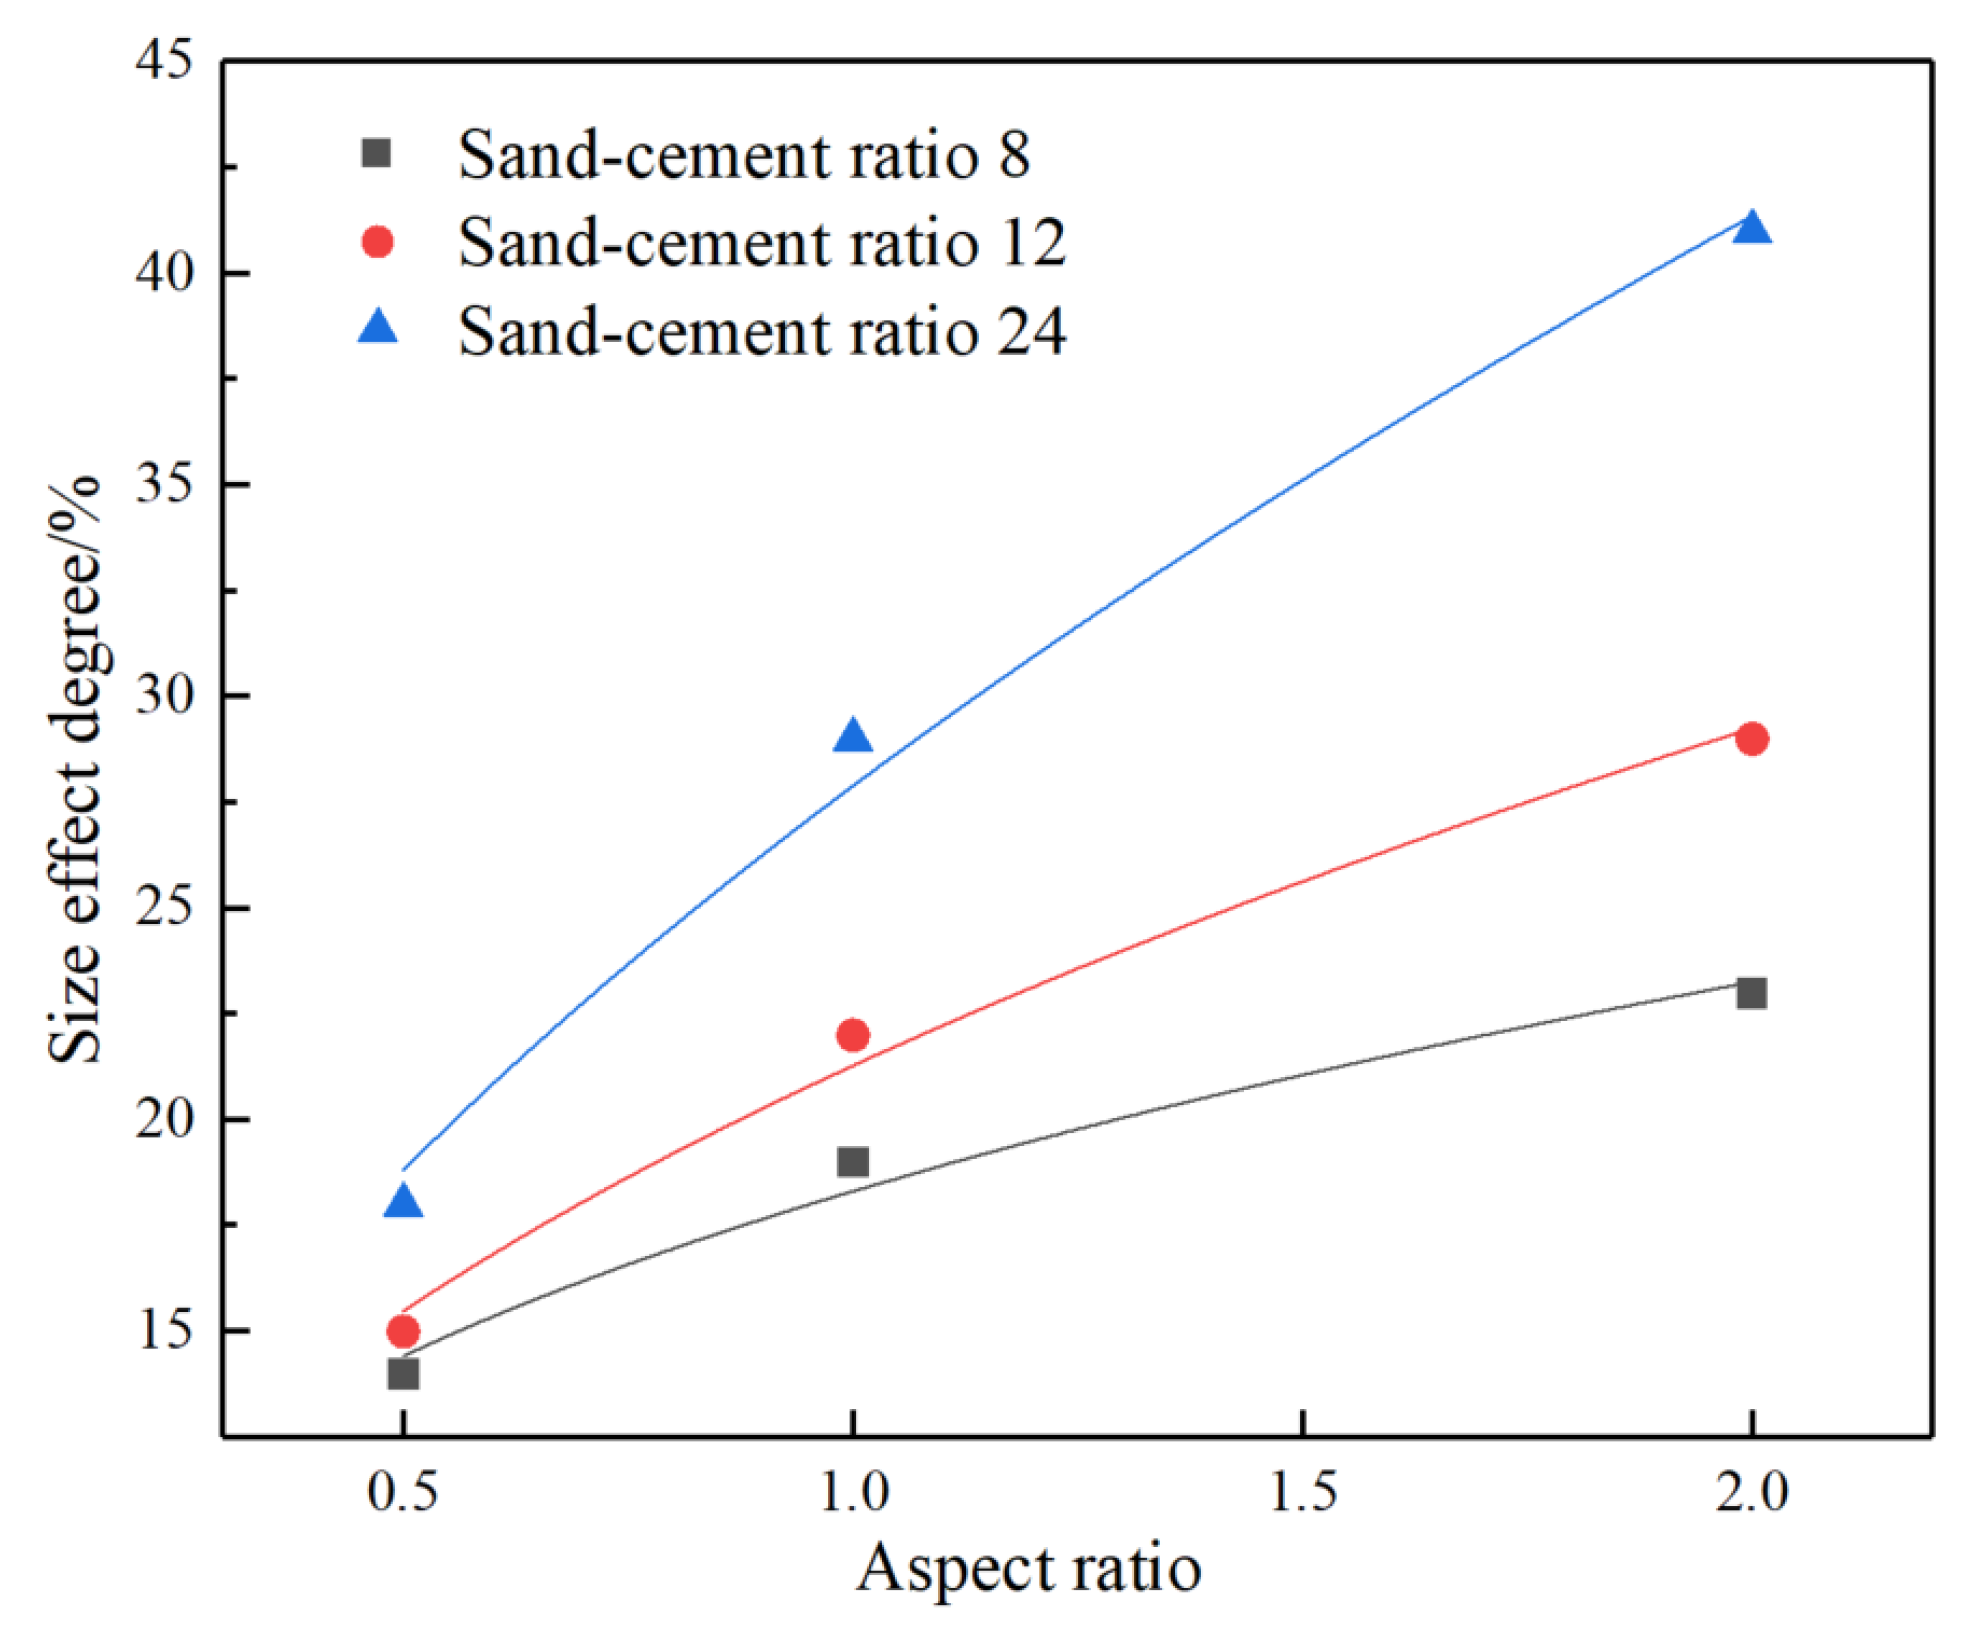
Since the influence of the concentration is small, only 73% of the mass concentration is taken as an example, and the relationship between the size effect and the UCS of the CPB under the three sand-cement ratios is calculated as shown in
Figure 4. It can be seen from
Figure 4 that the size effect of the CPB increases with the increase of the aspect ratio, but the increasing trend gradually tends to be gentle, and the two show a logarithmic function relationship. The variation range of size effect degree under the condition of high sand-cement ratio is larger than that of low sand-cement ratio, and the maximum change range of size effect degree reaches 46%. Combined with the previous experimental results, it can be seen that the size effect degree of the aspect ratio of 0.5 is the lowest, that is, the UCS is the largest, the aspect ratio is 1, and the size effect degree of the aspect ratio of 2 is the highest, that is, the UCS is the lowest.
4.2. Analysis of UCS Failure Characteristics of CPB with Different Aspect Ratios
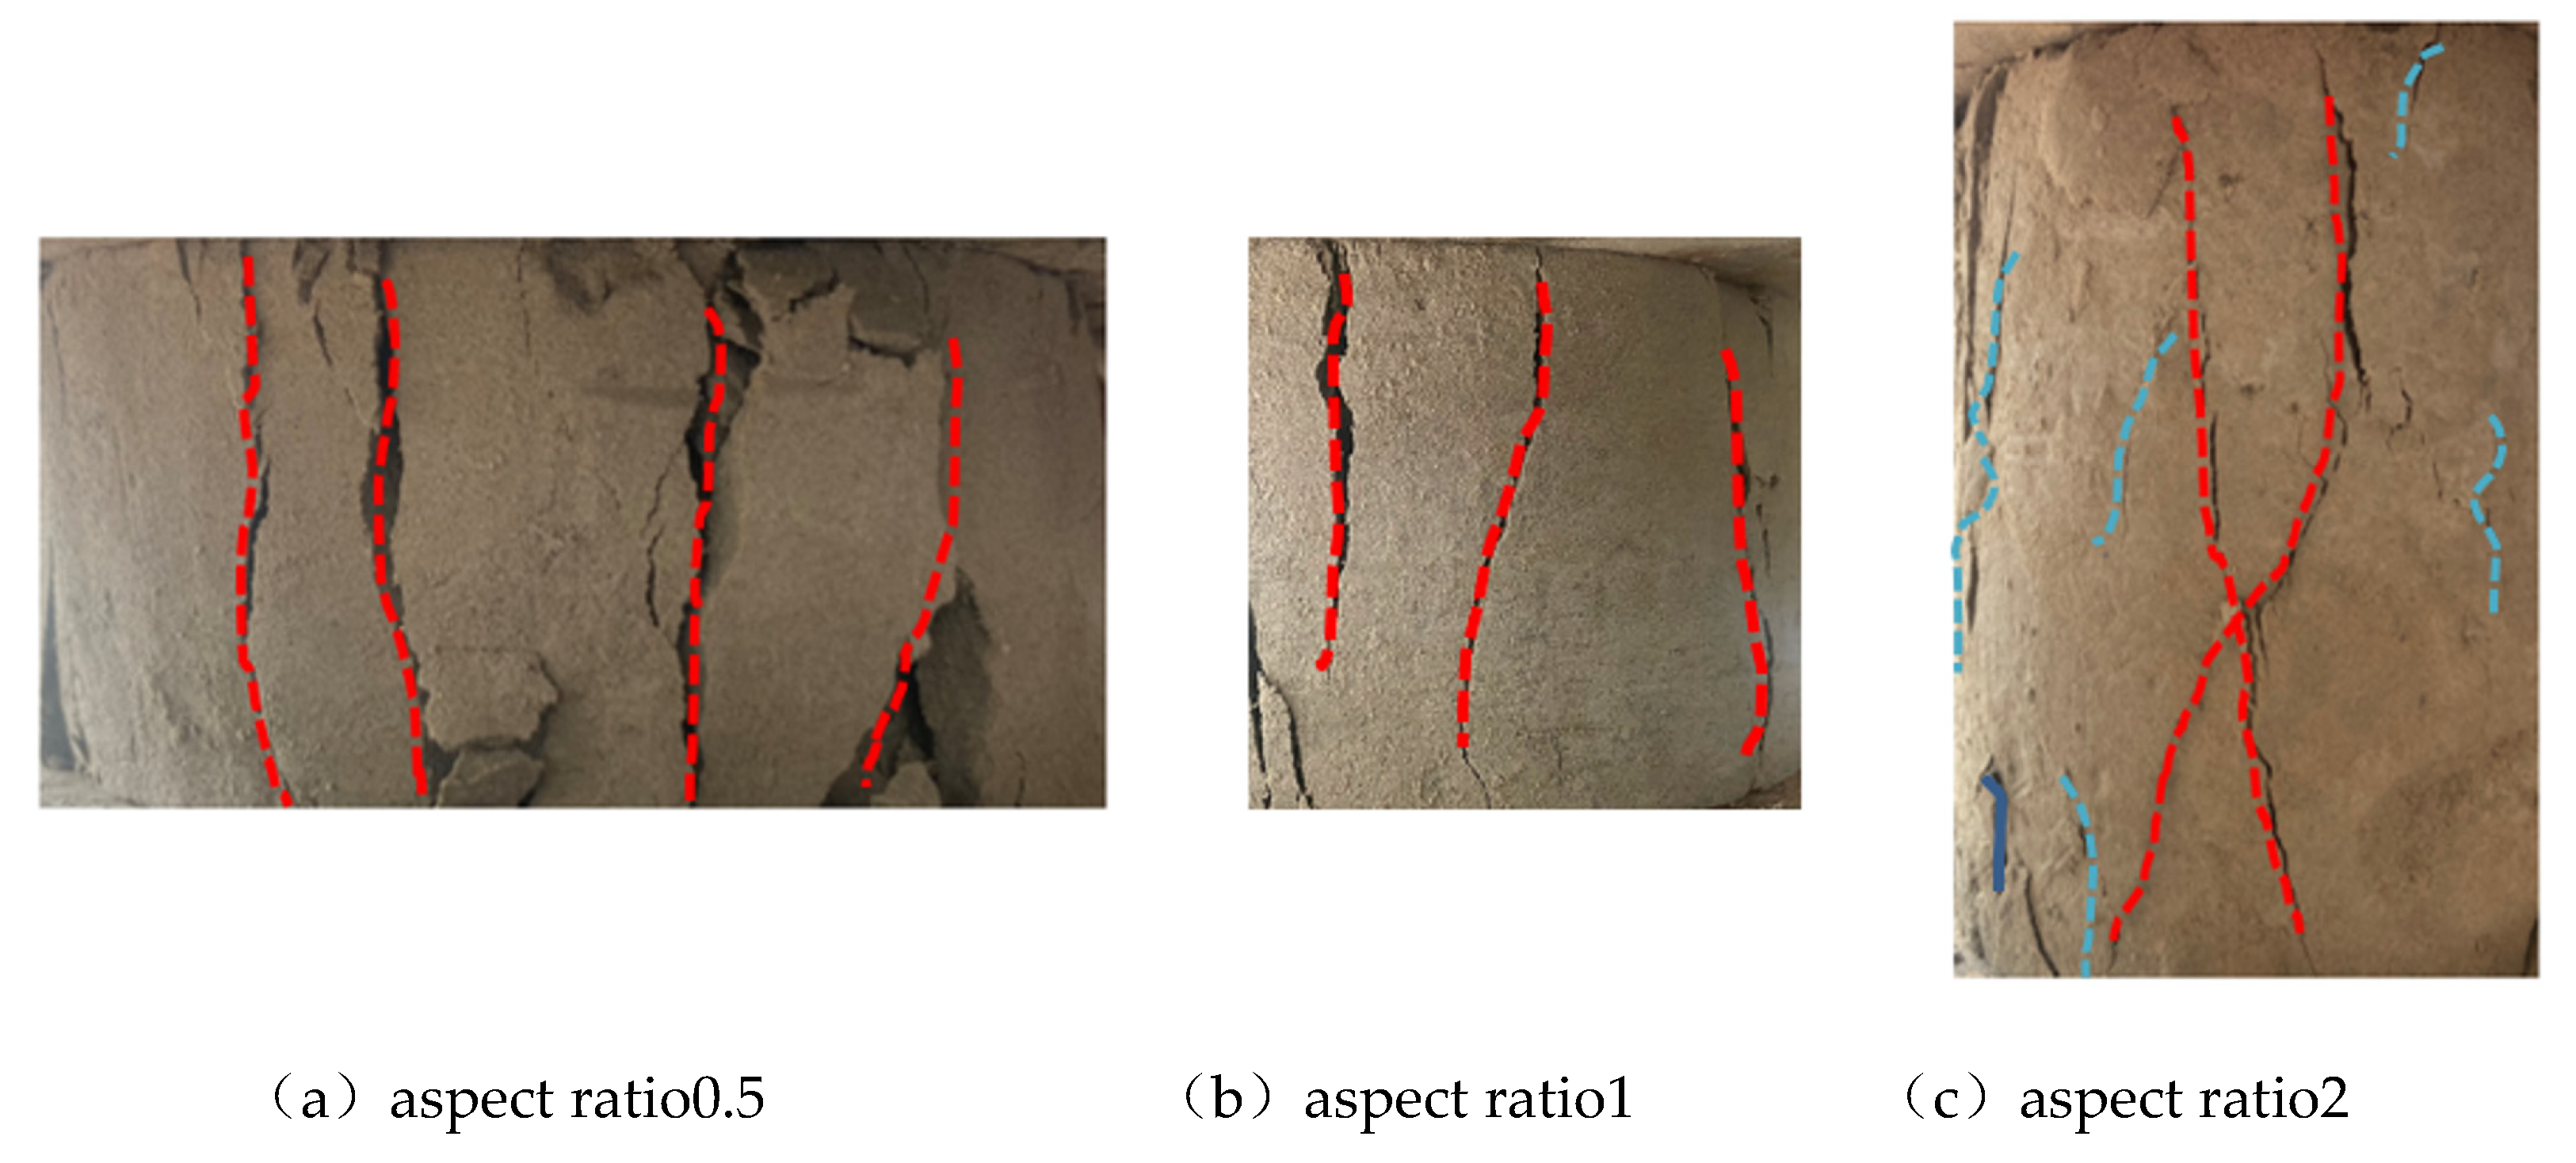
The UCS failure characteristics of the three types of CPB with aspect ratios of 0.5, 1, and 2 are shown in
Figure 5. It can be seen from
Figure 5 that when the aspect ratio is 0.5 and 1, there are four and three through main cracks (red dotted lines in the
Figure 5) that are approximately parallel to the loading direction on the surface of the specimen, respectively, showing the characteristics of splitting failure. When the aspect ratio is 2, two main cracks appear on the surface of the specimen, which are obviously interlaced with each other, and continue to develop in an X shape. At the same time, there are many secondary cracks (blue dotted lines in the
Figure 5), showing the characteristics of splitting failure.
4.3. Mechanism Analysis of Size Effect of UCS
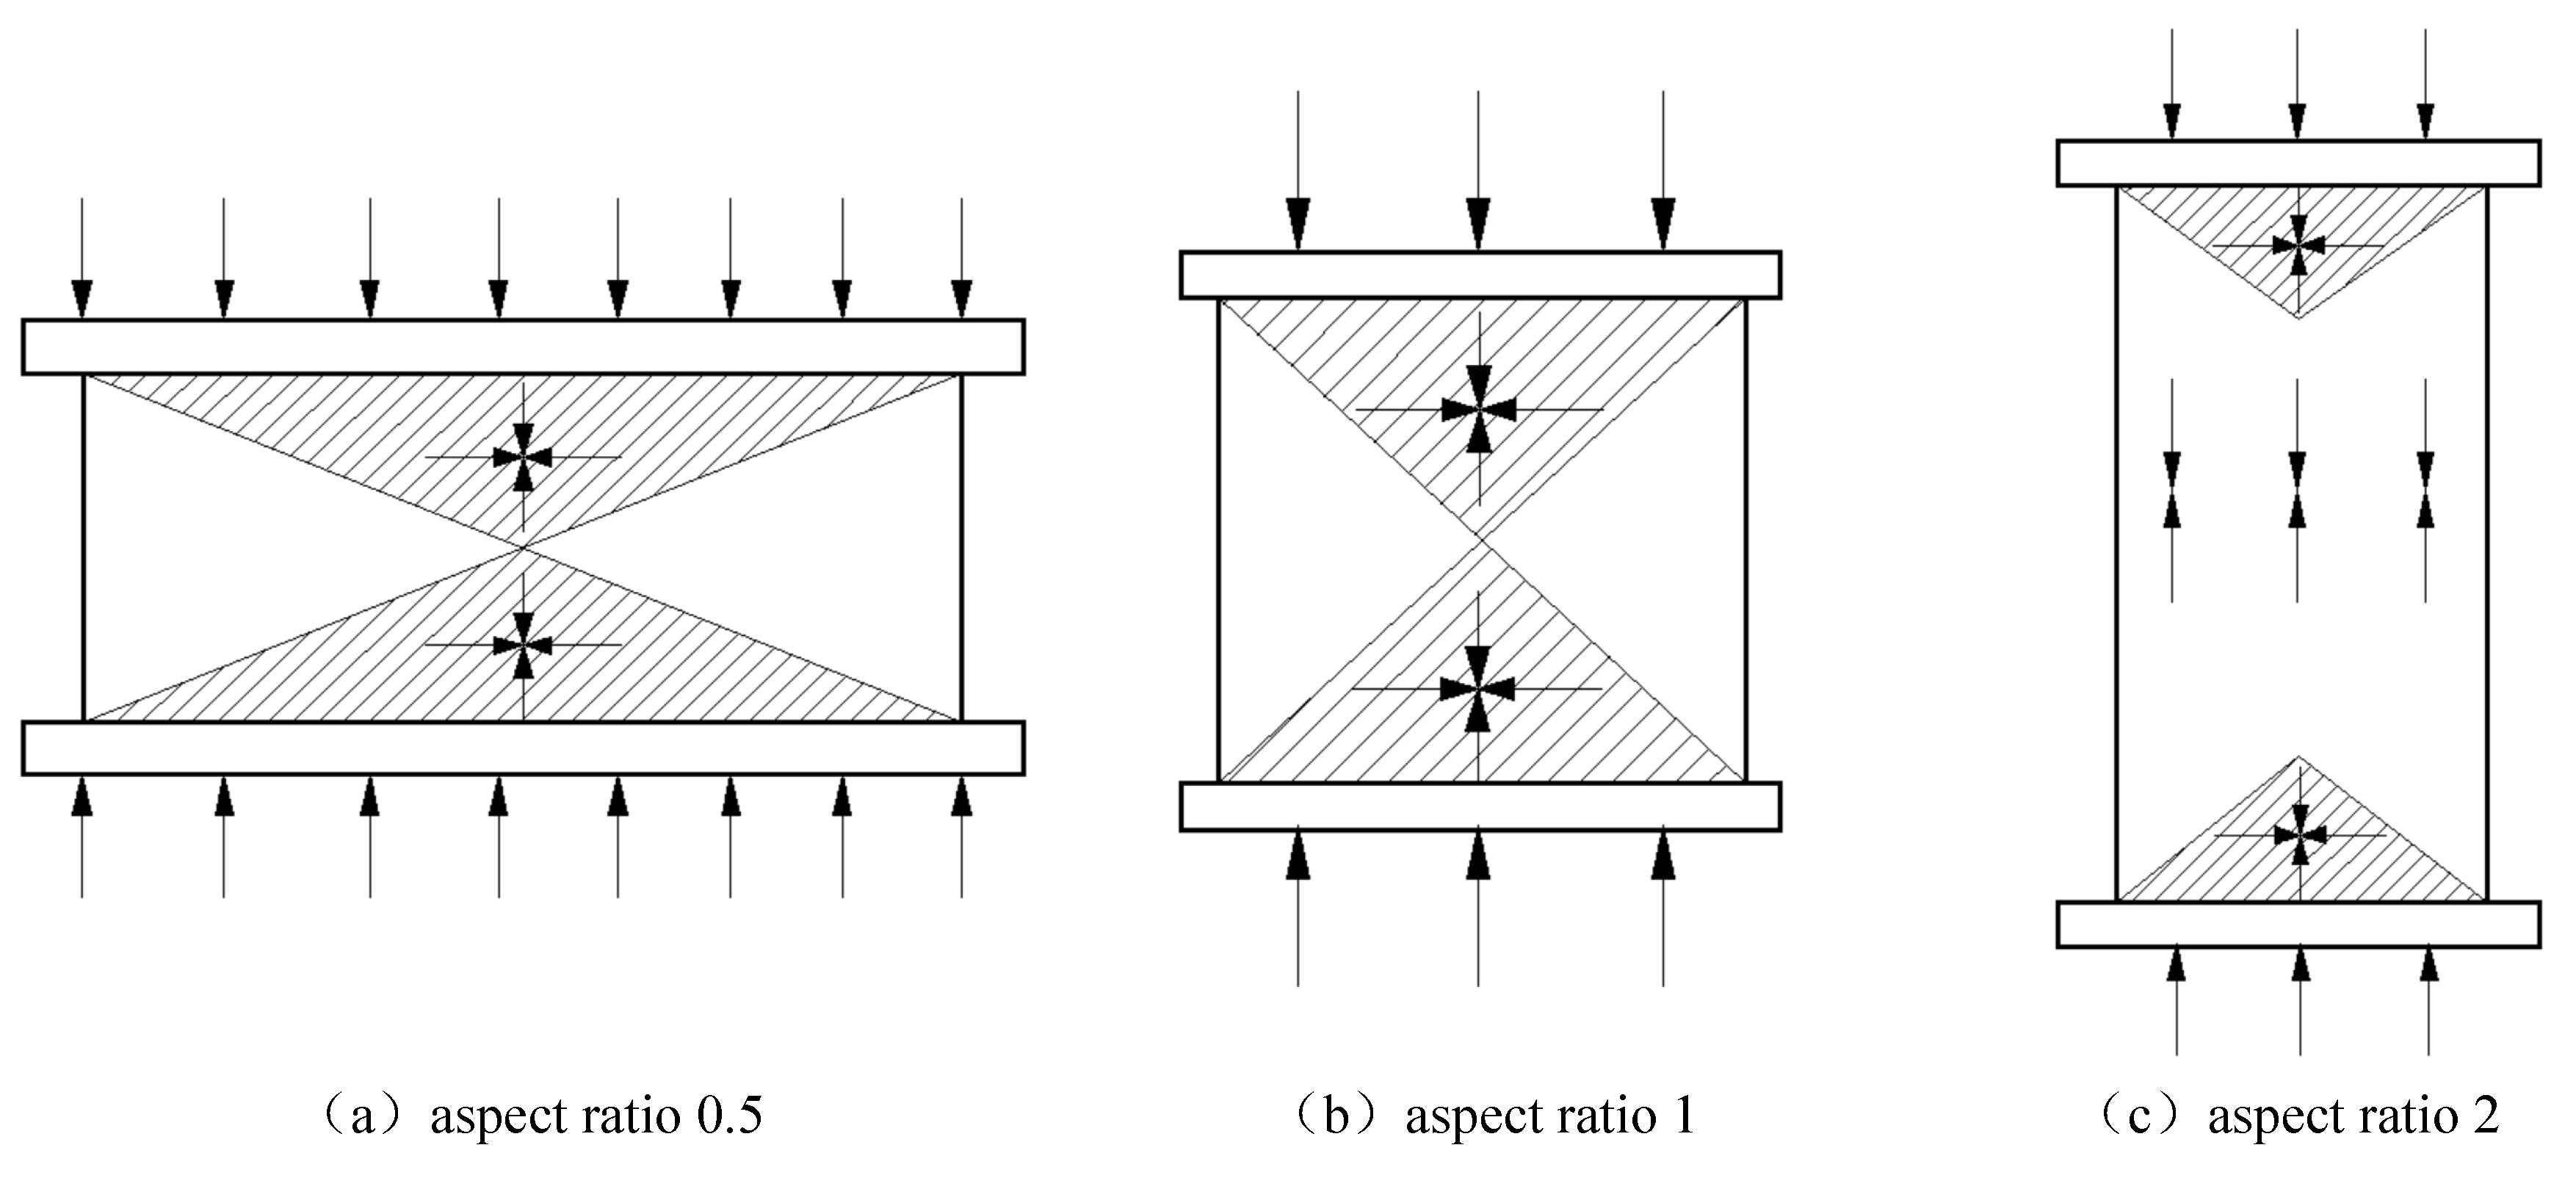
When the aspect ratio is 0.5 and 1, under the condition of uniaxial compression, the stiffness of the upper and lower backing plates is much greater than that of the CPB, resulting in friction between the backing plate and the upper and lower ends of the backfill specimen. The lateral deformation under compression (Poisson's ratio effect) is limited by the friction between the end face of the CPB and the backing plate, which can be called the end effect. Therefore, a three-dimensional conical compressive stress zone will be formed at the upper and lower ends of the specimen (
Figure 6a,
Figure 6b), and the area of the stress zone of the specimen with an aspect ratio of 0.5 is larger than that of the CPB with an aspect ratio of 1. Due to the low height, the conical stress zones at the upper and lower ends must be connected to each other, and the whole is close to the three-way stress state. Under this experimental condition, the measured UCS of the CPB must be greater than the actual UCS. Only the stiffness of the backing plate is exactly the same as that of the CPB can completely eliminate the above end effect. It is difficult to find pads with the same stiffness.
When the aspect ratio is 2, the height of the CPB is higher, and the upper and lower ends of the CPB are still subjected to the end effect brought by the backing plate, but the middle part of the CPB is in a one-dimensional compression state (as shown in
Figure 6c), the stress is more uniform, less affected by the end effect, and the UCS is low. Therefore, the UCS measured under the condition of this aspect ratio is closer to the actual UCS of the CPB.
4.4. Finite Element Analysis of Size Effect of UCS
According to the above theoretical results, the concrete damage criterion in the finite element analysis software ABAQUS is used for modeling and analysis. The size of the CPB model is 200
mm×100
mm×100
mm, 100
mm×100
mm×100
mm, and 100
mm×100
mm×200
mm, respectively. The model parameters are as follows: the density of the CPB is 1900
kg/m³, the elastic modulus is 0.6
GPa, and the Poisson’s ratio is 0.2; the upper and lower backing plates have a density of 7850
kg/m³, an elastic modulus of 206
GPa, and a Poisson’s ratio of 0.3. Constrain the bottom plate, apply displacement load to the upper plate, and reduce the displacement by 5
mm. In order to facilitate data reading and analysis, the finite element analysis of the CPB only takes the concentration of 73% and the sand-cement ratio of 8 as an example. The stress field results are shown in
Figure 7.
According to the analysis results of the stress field in Figure 7(a)(b), it can be seen that when the aspect ratio of the CPB is 0.5 and 1, most of the three-dimensional stress compression zones appear at the upper and lower ends of the CPB, and the aspect ratio is the area of the three-dimensional stress region of 0.5 is larger than that of the CPB with an aspect ratio of 1. The three-dimensional stress regions at the upper and lower ends of the two are basically in a connected state, and there is no obvious one-dimensional stress region in the middle. The CPB with an aspect ratio of 2, as shown in
Figure 7(c), has a small portion of stress compression zones at the upper and lower ends, and all of them are one-dimensional stress compression zones. From the stress field data, it can be seen that the UCS of the CPB with an aspect ratio of 2 is the lowest, and the CPB with an aspect ratio of 0.5 is the highest. The above analysis verifies the rationality of the theoretical analysis.
5. The Conversion Model of the UCS of the CPB between Different Aspect Ratios
It can be seen from the above analysis that when the aspect ratio is 2, the middle of the CPB is in a state of uniaxial compression, and the end effect is small. At this time, the UCS is closest to the actual UCS of the CPB. Therefore, taking the UCS of the CPB with an aspect ratio of 2 as the reference value, in order to make the regression model fit the various parameters of the UCS calculation, the non-linear fitting method was used to establish the UCS conversion model of the CPB with an aspect ratio of 2 and an aspect ratio of 0.5 and 1, respectively. This conversion model adopts the power function product model, such as formula (3):
In the formula: Fm represents the reference UCS of the CPB with an aspect ratio of 2; Fn represents the UCS of the CPB with an aspect ratio of 0.5; Fz represents the UCS of the CPB with an aspect ratio of 1; a and b both represent regression coefficients.
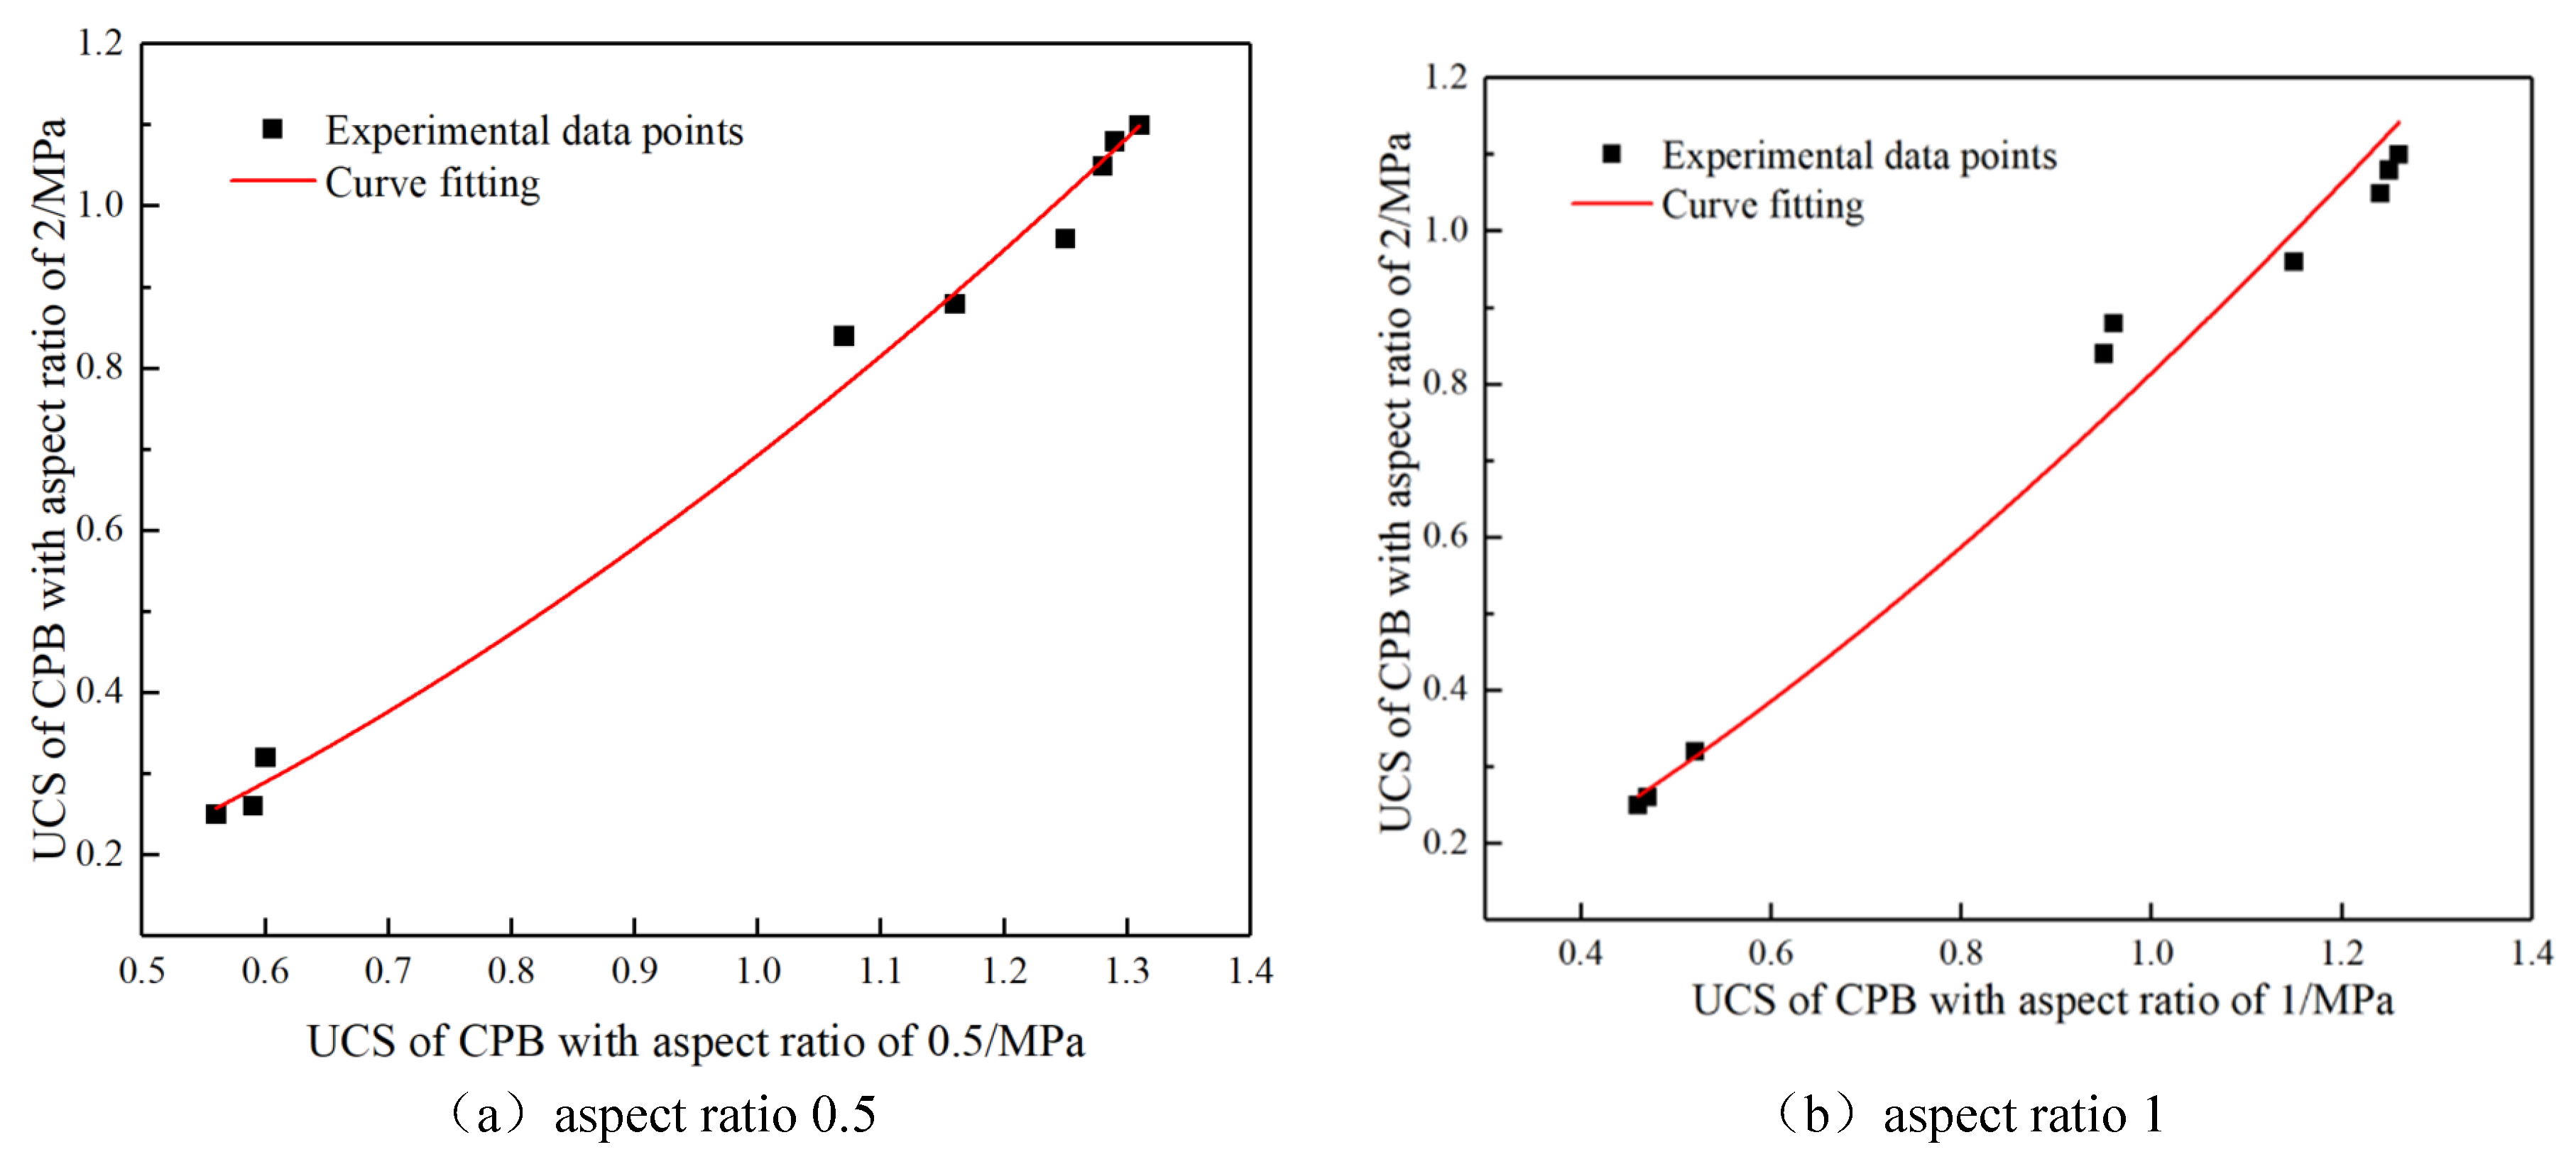
The UCS of the CPB with an aspect ratio of 0.5 and 1 is taken as the x-axis, and the UCS of the CPB with an aspect ratio of 2 is taken as the y-axis. (Fn, Fm) and (Fz, Fm).
The fitting results of the UCS conversion function are shown in
Figure 8. It can be seen from
Figure 8 that the UCS conversion functions of aspect ratio 2 and aspect ratio 0.5 and 1 are all in a power function relationship. The goodness of fit
R2 of the two curves is greater than 0.95, and the curve fitting effect is good. Under the conditions of each concentration and sand-ash ratio, the UCS conversion points are staggered and distributed on both sides of the fitting curve, and the degree of dispersion is low. The parameters of the curve function expression are shown in
Table 3. Through the function conversion model, the sand-ash ratio 8-24 and the intensity conversion of different aspect ratios under the experimental conditions of the mass concentration of 71%-73% can be converted, so that the conversion result is closer to the actual UCS of the CPB in the laboratory value.
6. Conclusion
(1) Through the RSM experimental analysis, it can be seen that in the low sand-cement ratio 8:1-24:1, the mass concentration is in the range of 71%-73%, the sand-cement ratio and aspect ratio have a significant impact on the UCS of the CPB, while the mass concentration of the CPB slurry has a weak significant effect on the UCS of the CPB. Under the conditions of the same slurry mass concentration and sand-cement ratio, the order of the UCS of the CPB of each size is as follows: the aspect ratio is 0.5> the aspect ratio is 1> the aspect ratio is 2.
(2) The aspect ratio of 0.5 has the lowest size effect degree and the highest UCS; the aspect ratio of 1 is the second. The aspect ratio of 2 has the highest size effect degree and the lowest UCS. When the aspect ratio is 0.5 and 1, the splitting failure of the CPB is dominant, and when the aspect ratio is 2, the CPB is dominated by shear failure and develops in an X-shape.
(3) The three-dimensional stress caused by the obvious end effect of the aspect ratio of 0.5 and 1 makes the UCS of the CPB higher. The aspect ratio of 2 is due to the lower end effect at the ends and the uniform one-dimensional stress in the middle, which makes the UCS lower. In the laboratory, the UCS of the CPB with an aspect ratio of 2 is closer to the actual UCS of the CPB, and the UCS of the CPB with an aspect ratio of 0.5 and 1 is higher than the actual UCS.
(4) The results of the finite element analysis of the stress field show that most of the three-dimensional stress compression zones appear at the upper and lower ends of the CPB with an aspect ratio of 0.5 and 1; a small portion of stress compression zones at the upper and lower ends of the CPB with an aspect ratio of 2, and the rest are all one-dimensional stress compression zones, which verifies the rationality of the theoretical analysis.
(5)The UCS between different aspect ratios is in a power function relationship. The two groups UCS conversion models can convert the backfill strength values between different aspect ratios into more accurate and practical UCS of the CPB.
Author Contributions
LH conducted indoor experimental design and analysis, W HJ conducted theoretical analysis, B LJ established a model. All authors read and approved the final manuscript.
Funding
This work was supported by the Key Program of National Natural Science Foundation of China (Grant No. 51834001); Key Program of National Natural Science Foundation of China (Grant No. 52130404).
Ethics Approval and Consent to Participate
This research does not involve any ethical issues and all participants have agreed.
Consent for Publication
All participants in the paper have agreed to publish.
Availability of Data and Materials
The datasets used and/or analyzed during the current study are available from the corresponding author on reasonable request.
Competing Interests
The authors declare that they have no competing interests.
References
- Qian, M.G. , Xu J. L., Wang J.C. Further on the sustainable mining of coal. Journal of China Coal Society. 2018, 43, 1–13. [Google Scholar]
- Wu, A.X.; Wang, Y.; Wang, H.J. Status and Prospects of the Paste Backfill Technology. Journal of China Metal Mine. 2016, 7, 1–9. [Google Scholar]
- Shi, J.X. Research and Application of Slurry Expansion Filling Material Properties; China University of Mining and Technology Press: Xuzhou, China, 2013. [Google Scholar]
- Chen, Y.; Huang, Y.H.; Cao, P.; Liang, Y.Y.; Li, N.; Juan, L.L. Experimental study on strength and deformation size effect of soft rock with different height-diameter ratios. Journal of Central South University: Natural Science Edition. 2010, 41, 1073–1078. [Google Scholar]
- Hudson, J.A.; Crouch, S. Soft stiff and servo-controlled testing machines. Engineering Geology. 1972, 6, 155–189. [Google Scholar] [CrossRef]
- Gonzatti, C.; Zorzi, L.; Agostini, I.M.; Fiorentini, J.A.; Viero, A.P.; Philipp, R.P. In situ strength of coal bed based on the size effect study on the uniaxial compressive strength. International Journal of Mining Science and Technology. 2014, 24, 747–754. [Google Scholar] [CrossRef]
- Neville, A.M. The Influence of Size of Concrete Test Cubes on Mean Strength and Standard Deviation. Magazine of Concrete Research. 1956, 8, 101–110. [Google Scholar] [CrossRef]
- Bayram, E.; Tekin, Y.; Kulekci, G. Strength and ultrasonic properties of cemented paste backfill. Ultrasonics. 2014, 54, 195–204. [Google Scholar]
- Gan, D.Q.; Han, L.; Liu, Z.; Zhao, H. Experimental study on size effect of compressive strength of cemented backfill. Metal Mines. 2018, 1, 32–36. [Google Scholar]
- Xu, M.F.; Jin, A.B.; Guo, L.J.; Liu, G.S.; Xu, W.X. Experimental study on size effect of full tailings cemented backfill specimen strength. China Mining Industry. 2016, 25, 87–92. [Google Scholar]
- Hassani, F.P.; Nokken, M.R.; Annor, A. Physical and mechanical behavior of various combinations of mine fill materials. CIM Magazine/Bullet. 2007, 2, 22–24. [Google Scholar]
- Ye, G.X.; Xie, L.K.; Guo, L.J.; Liu, G.S.; Wang, H. Research on the strength of filling samples with different shapes and sizes. China Mining Industry. 2016, 24, 128–131. [Google Scholar]
- Wang, L.T.; Xiong, Z.Q.; Su, C.D. Analysis of size effect and failure characteristics of pillars filled with modified high-water materials. Coal Science and Technology. 2021, 49, 82–88. [Google Scholar]
- Li, L.T. Research on the Segregation Mechanism and Control Technology of Jinchuan Coarse Aggregate Filling Slurry; University of Science and Technology Beijing: Beijing, China, 2020. [Google Scholar]
- Su, J.; Fang, Z. Size effect of compressive strength of ordinary concrete and high-strength concrete. Journal of Building Materials. 2013, 16, 1078–1081. [Google Scholar]
|
Disclaimer/Publisher’s Note: The statements, opinions and data contained in all publications are solely those of the individual author(s) and contributor(s) and not of MDPI and/or the editor(s). MDPI and/or the editor(s) disclaim responsibility for any injury to people or property resulting from any ideas, methods, instructions or products referred to in the content. |
© 2024 by the authors. Licensee MDPI, Basel, Switzerland. This article is an open access article distributed under the terms and conditions of the Creative Commons Attribution (CC BY) license (http://creativecommons.org/licenses/by/4.0/).
