Submitted:
26 February 2024
Posted:
26 February 2024
You are already at the latest version
Abstract
Keywords:
1. Introduction
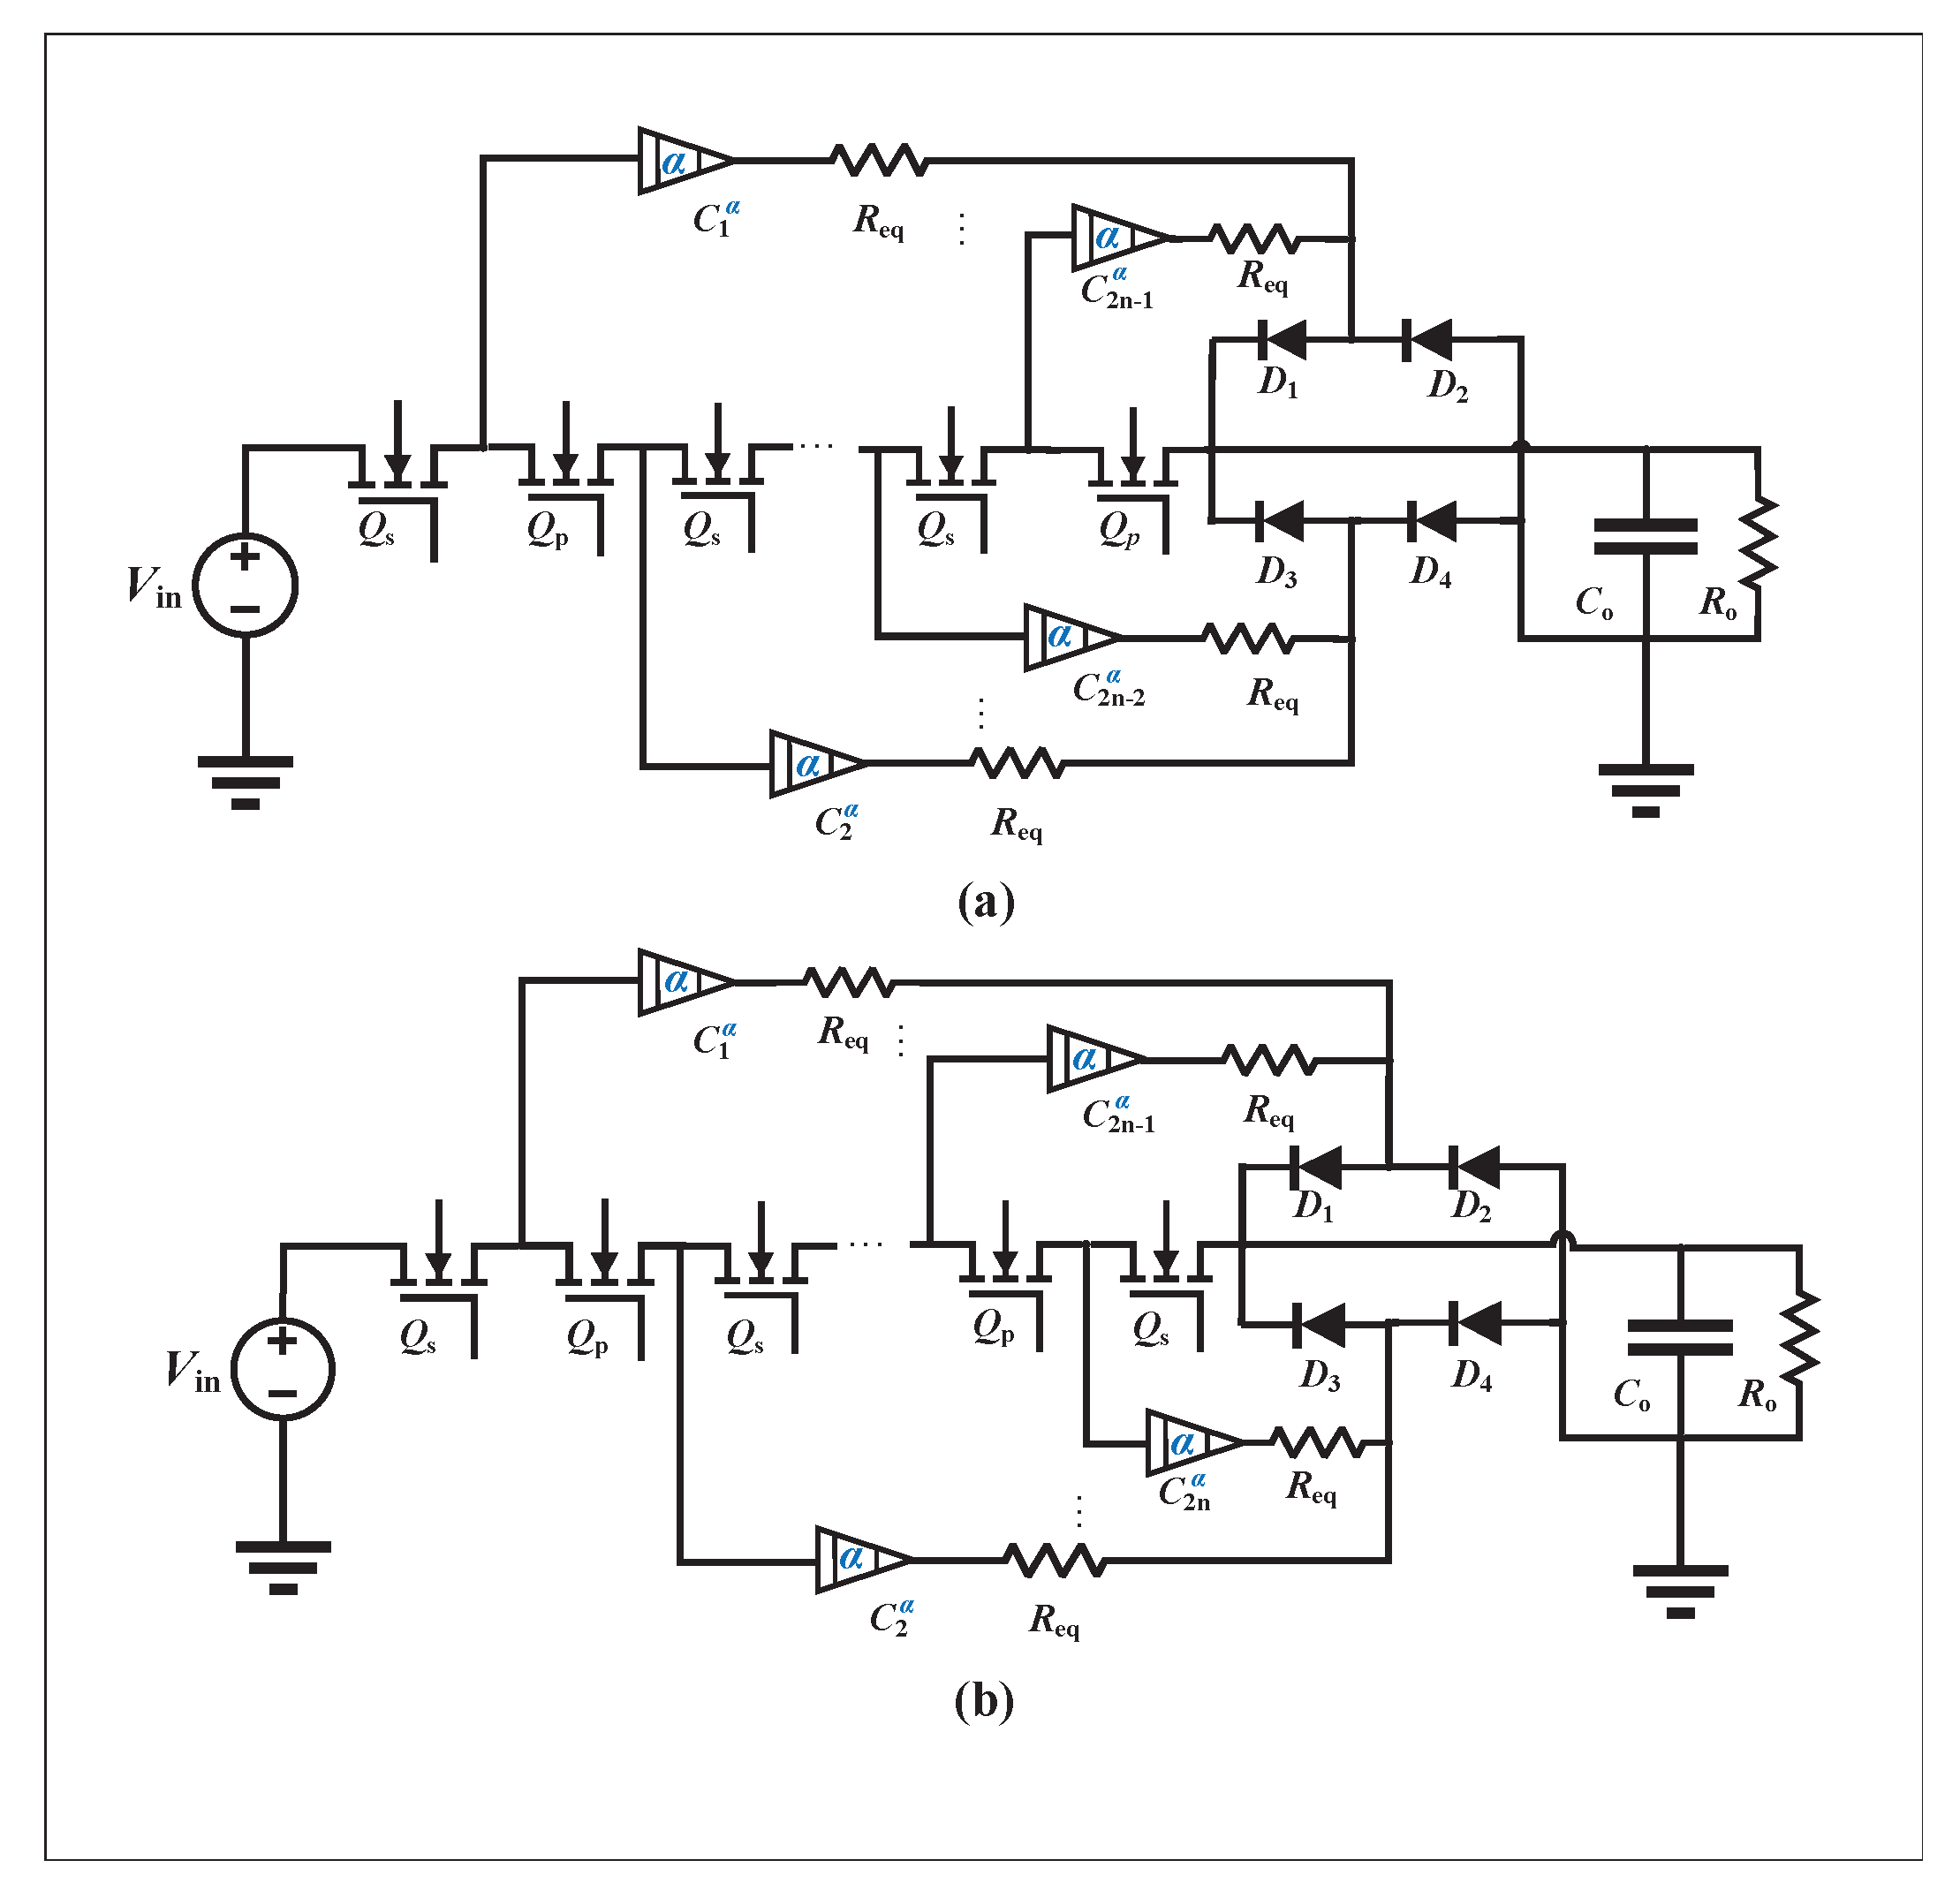
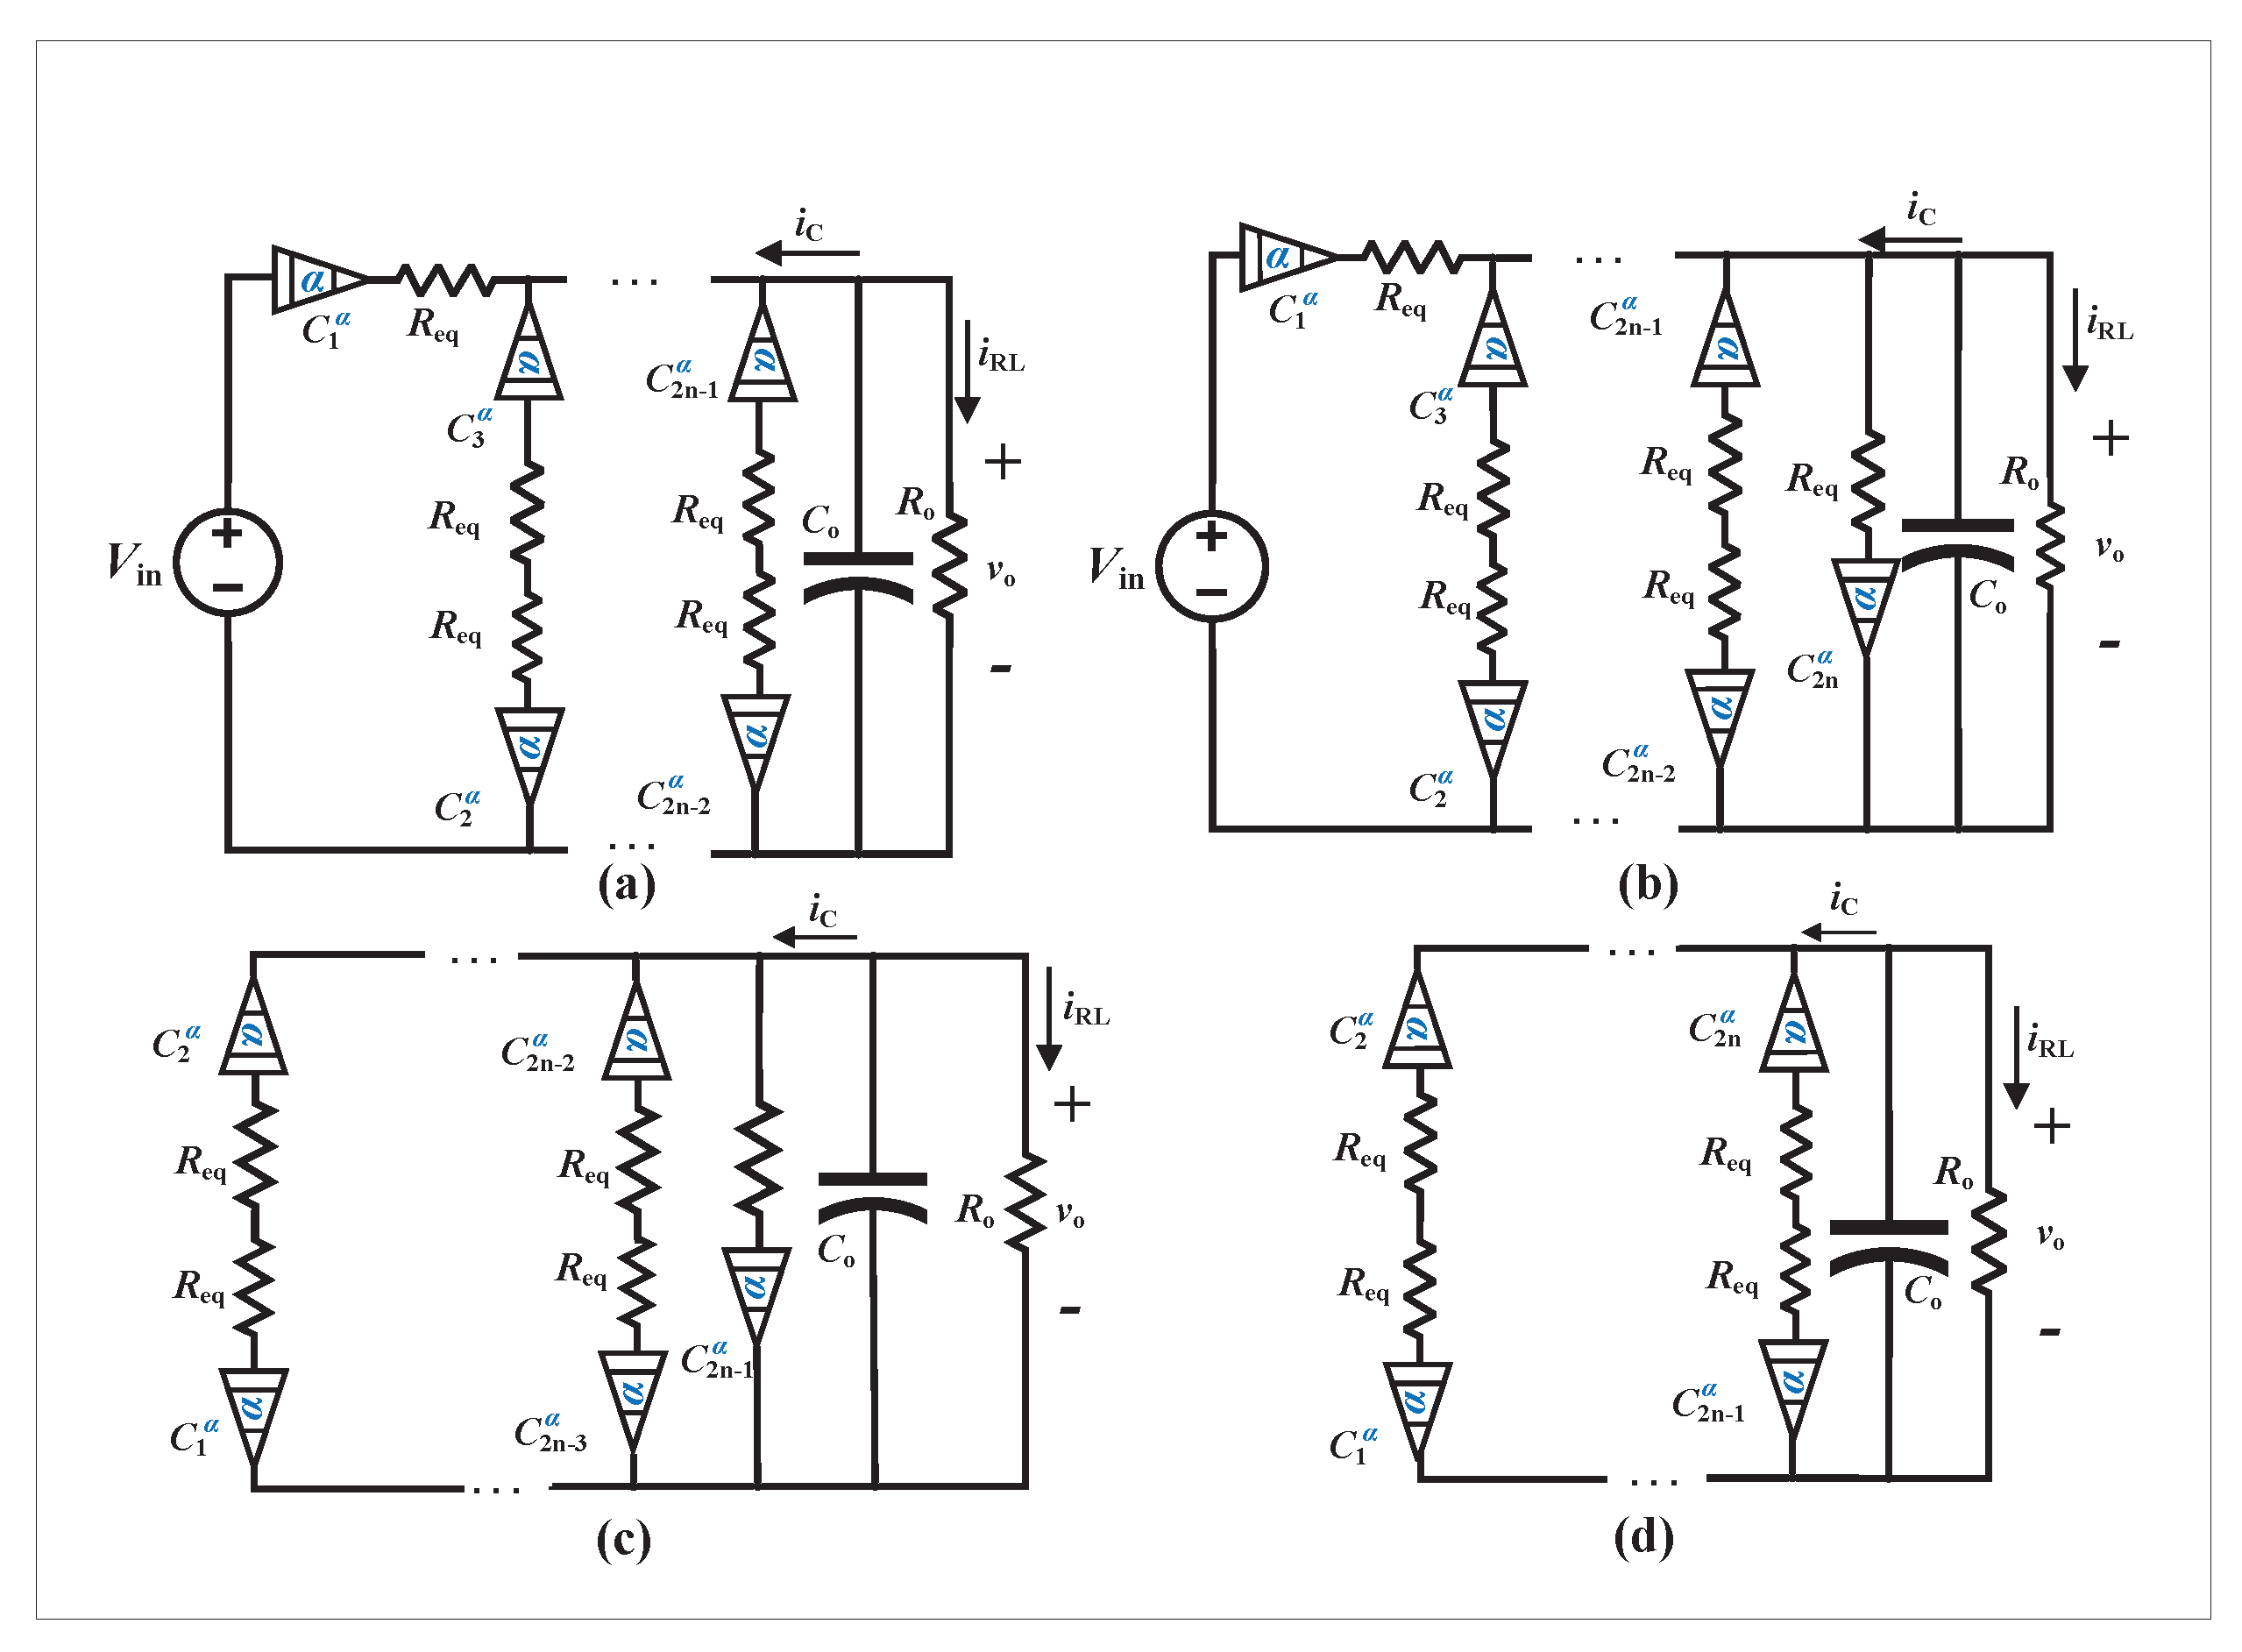
- By introducing the fractional-order modeling technique, this work bridges the gap between micro characteristics of capacitors and macro characteristics of SCCs.
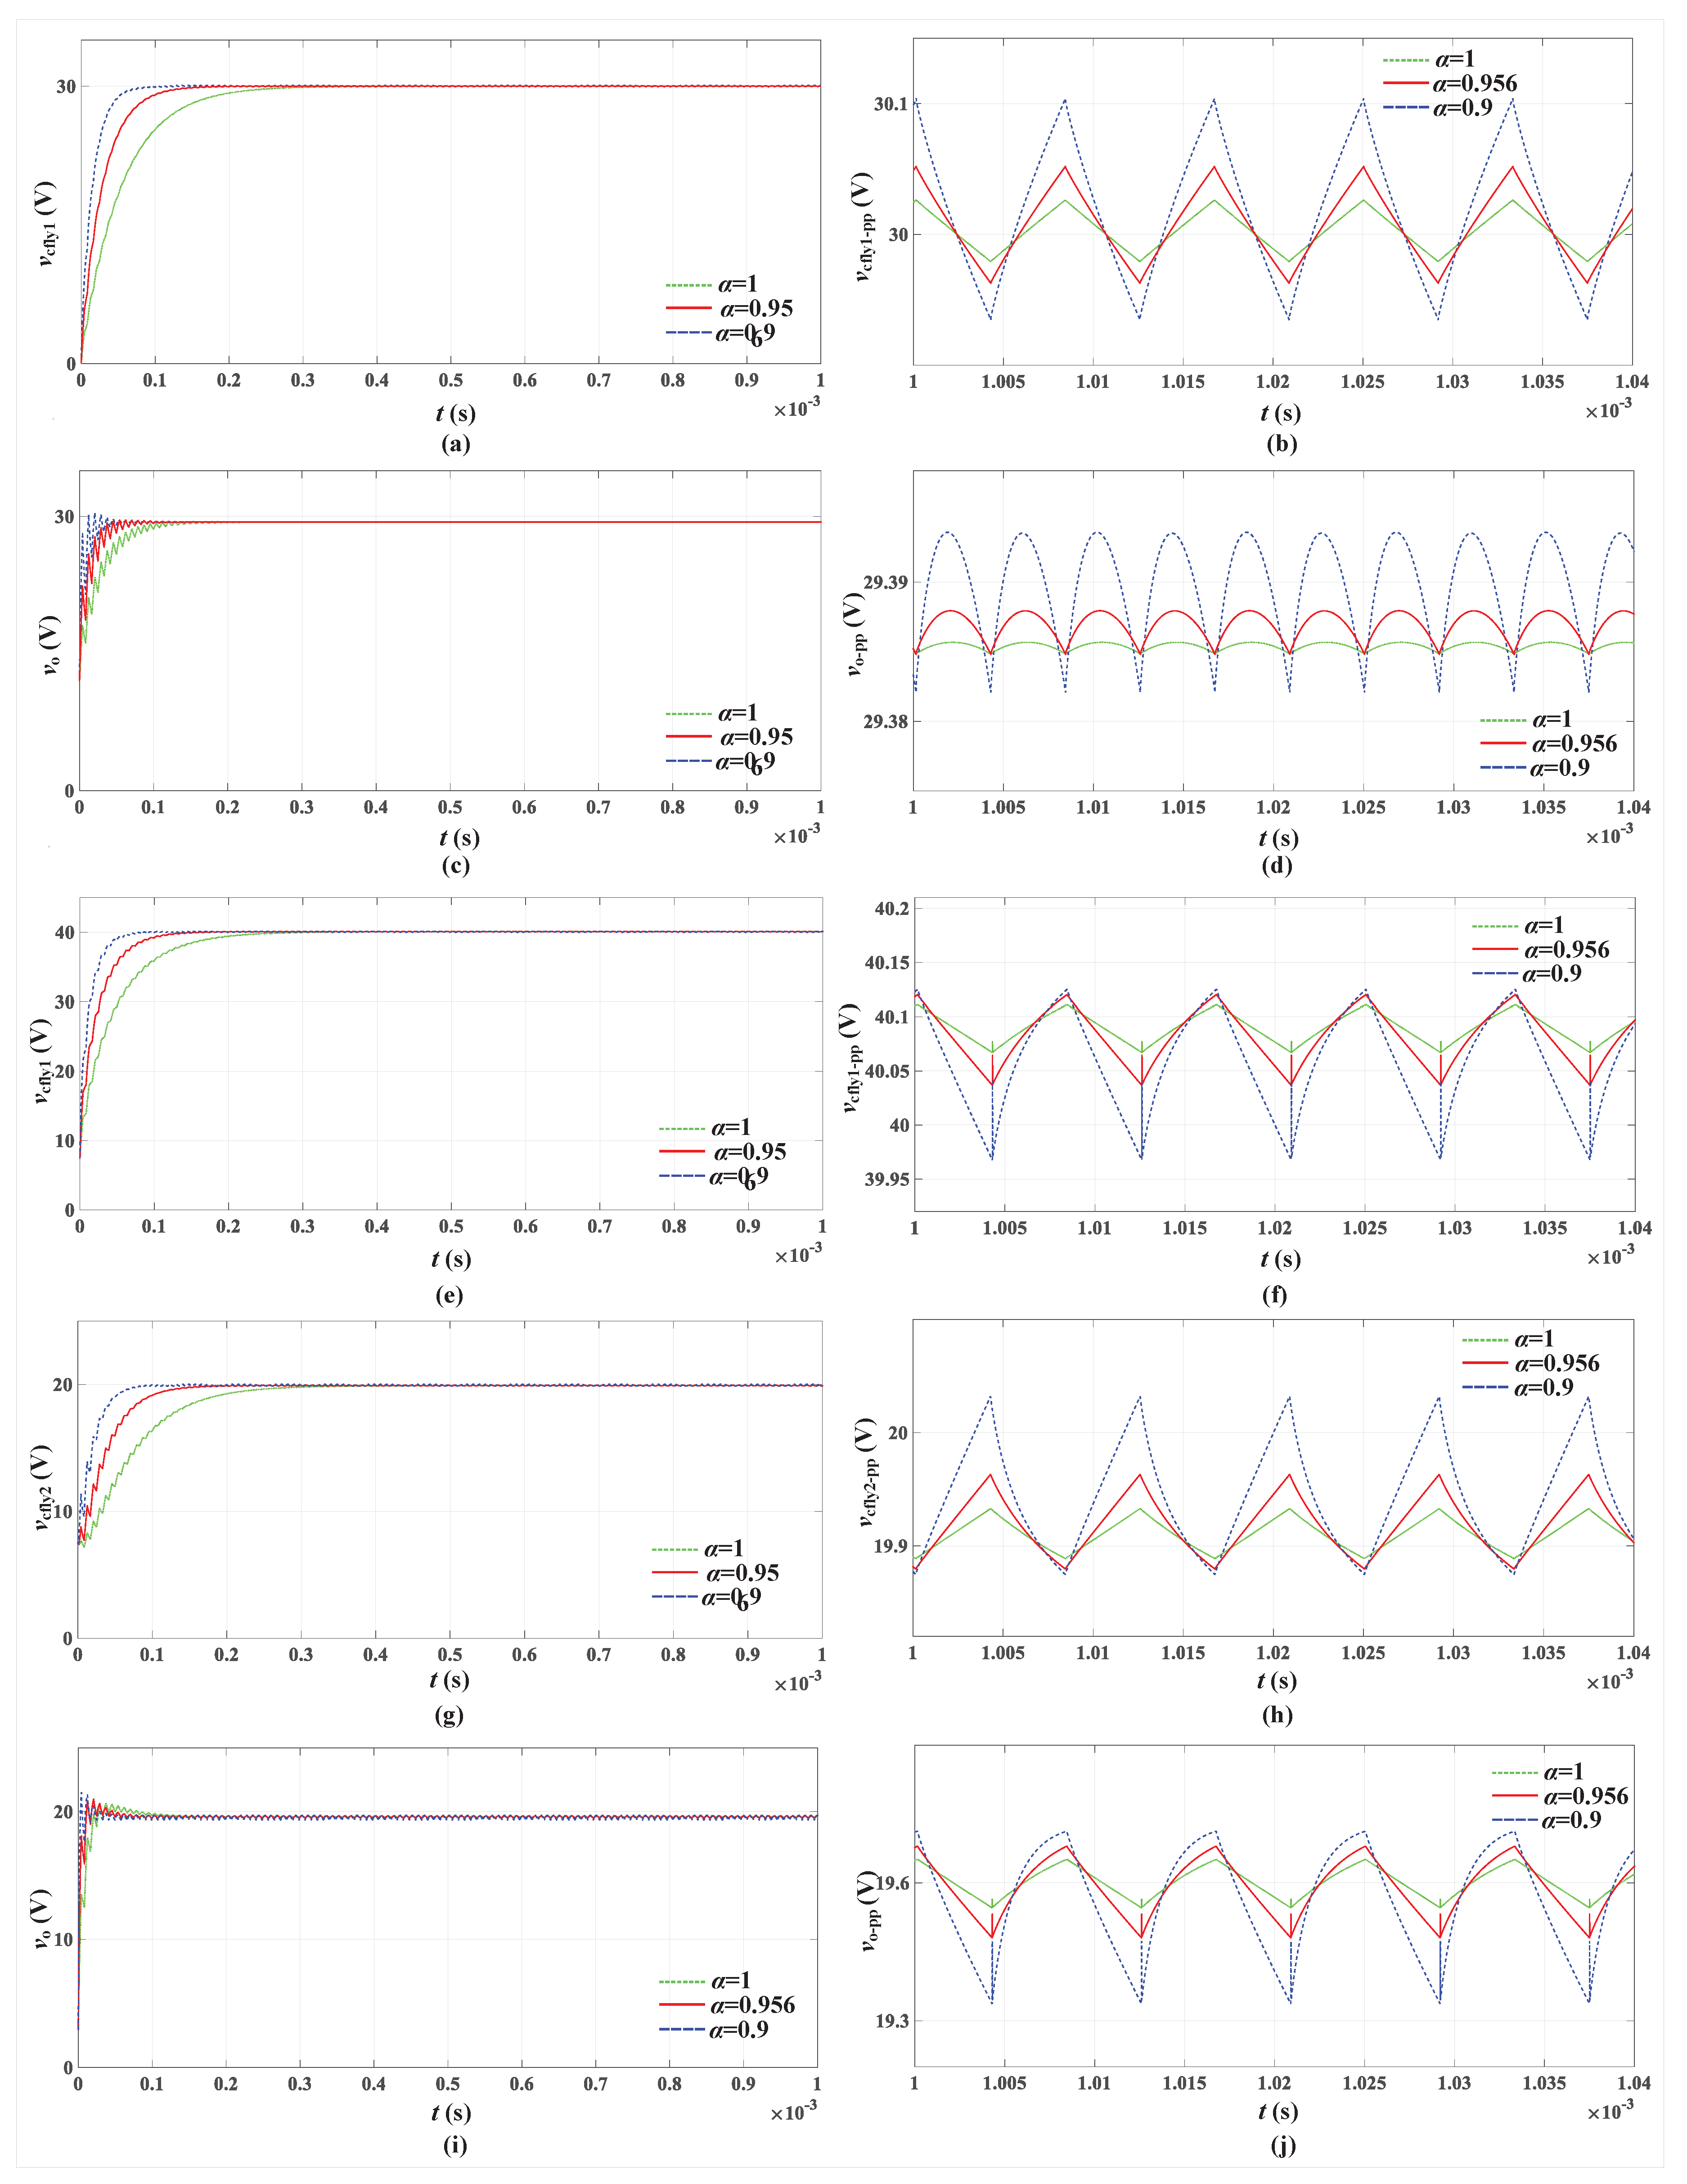
- By employing the fractional-order analysis method, the impact of parameter drift of capacitors on the power loss of SCCs can be characterized in more accurate way.
2. A Circuit Analysis Framework Based on Fractional-Order Model
2.1. Unified fractional-order equivalent model of capacitors
2.2. Fractional-order modeling of SCCs
3. Efficiency Analysis of SCCS Based on FO Model
3.1. Charge Redistribution Phase
3.2. Loading Phase
4. Validation and Discussion
5. Conclusion
Funding
Data Availability Statement
Conflicts of Interest
References
- Ivo Petráš. Fractional-Order Nonlinear Systems: Modeling, Analysis and Simulation; Springer-Verlag Heidelberg: Berlin, 2011. [Google Scholar] [CrossRef]
- Furati, K.M.; Sarumi, I.O.; Khaliq, A.Q.M. Fractional model for the spread of COVID-19 subject to government intervention and public perception. Applied Mathmatical Modelling 2021, 95, 89–105. [Google Scholar] [CrossRef]
- Ahmad, S.; Haq, S.U.; Ali, F.; Khan, L.; Eldin, S.M. Free convection channel flow of couple stress casson fluid: A fractional model using Fourier’s and Fick’s laws. Frontiers in Physics 2023, 11. [Google Scholar] [CrossRef]
- David, S.A.; Inacio Jr, C.M.C.; Nunes, R.; Machado, J.A.T. Fractional and fractal processes applied to cryptocurrencies price series. Journal of Advanced Research 2021, 32, 85–98. [Google Scholar] [CrossRef]
- Yu, D.; Liao, X.; Wang, Y. Modeling and Analysis of Caputo–Fabrizio Definition-Based Fractional-Order Boost Converter with Inductive Loads. Fractal and Fractional. 2024, 8, 81. [Google Scholar] [CrossRef]
- Seeman, M.D. A Design Methodology for Switched-Capacitor DC-DC Converters; University of California: Berkeley, 2009. [Google Scholar] [CrossRef]
- Sanders, S.R.; Alon, E.; Le, H.; Seeman, M.D.; John, M.; Ng, V.W. The Road to Fully Integrated DC-DC Conversion via the Switched-Capacitor Approach. IEEE Transactions on Power Electronics 2013, 28, 4146–4155. [Google Scholar] [CrossRef]
- Cheung, C.K.; Tan, S.K.; Tse, C.K.; Ioinovici, A. On Energy Efficiency of Switched-Capacitor Converters. IEEE Transactions on Power Electron 2013, 28, 862–876. [Google Scholar] [CrossRef]
- Beck, Y.; Eden, N.; Sandbank, S.; Singer, S.; Smedley, K.M. On Loss Mechanisms of Complex Switched Capacitor Converters. IEEE Transactions on Circuits and Systems 2015, 62, 2771–2780. [Google Scholar] [CrossRef]
- Lei, Y.; Liu, W.; Pilawa-Podgurski, R. An analytical method to evaluate and design hybrid switched-capacitor and multilevel converters. IEEE Transactions on Power Electronics 2017, 33, 2227–2240. [Google Scholar] [CrossRef]
- Ye, Z.; Sanders, S.R.; Pilawa-Podgurski, R. Modeling and comparison of passive component volume of hybrid resonant switched-capacitor converters. IEEE Transactions on Power Electronics 2022, 37, 10903–10919. [Google Scholar] [CrossRef]
- Henry, J.M.; Kimball, J.W. Switched-Capacitor Converter State Model Generator. IEEE Transactions on Power Electronics 2012, 27, 2415–2425. [Google Scholar] [CrossRef]
- Ben-Yaakov, S. On the Influence of Switch Resistances on Switched-Capacitor Converter Losses. IEEE Transactions on Industrial Electronics 2012, 59, 638–640. [Google Scholar] [CrossRef]
- Jawalikar, P.; Patle, N.; Sahoo, B.D. Time-Domain Modeling and Analysis of Switched-Capacitor Converters. IEEE Transactions on Power Electronics 2020, 35, 8276–8286. [Google Scholar] [CrossRef]
- Krstic, M.; Eren, S.; Jain, P. Curvature-Based Average Modeling of Switched-Capacitor Converters. IEEE Journal of Emerging and Selected Topics in Power Electronics 2021, 9, 5929–5940. [Google Scholar] [CrossRef]
- Henry, J.M.; Kimball, J.W. Practical Performance Analysis of Complex Switched-Capacitor Converters. IEEE Transactions on Power Electronics 2011, 26, 127–136. [Google Scholar] [CrossRef]
- Xu, J.; Gu, L.; Rivas-Davila, J. Effect of Class 2 Ceramic Capacitor Variations on Switched-Capacitor and Resonant Switched-Capacitor Converters. IEEE Journal of Emerging and Selected Topics in Power Electronics 2020, 8, 2268–2275. [Google Scholar] [CrossRef]
- Mustafa, Y.; Subburaj, V.; Ruderman, A. Revisited SCC Equivalent Resistance High-Frequency Limit Accounting for Stray Inductance Effect. IEEE Journal of Emerging and Selected Topics in Power Electronics 2021, 9, 638–646. [Google Scholar] [CrossRef]
- Zheng, D.; Yang, Y.; Hu, S.; Deng, Y. Medium Frequency Output Impedance Limits of Switched-Capacitor Circuits. IEEE Transactions on Power Electronics 2023, 38, 2156–2168. [Google Scholar] [CrossRef]
- Elwakil, A.S. Fractional-order circuits and systems: An emerging interdisciplinary research area. IEEE Circuits and Systems Magazine 2010, 10, 40–50. [Google Scholar] [CrossRef]
- Liang, G.; Qi, Z.; Ma, L.; Liu, C. Passivity Criterions of Networks With General Fractional Order Coupled Inductors. IEEE Access 2019, 7, 48880–48889. [Google Scholar] [CrossRef]
- Zhao, X.; Chen, Y.; Chen, L.; Wang, H.; Huang, W.; Chen, J. On full-life-cycle SOC estimation for lithium batteries by a variable structure based fractional-order extended state observer. Applied Energy 2023, 351. [Google Scholar] [CrossRef]
- Huang, Y.; Chen, X. A fractional-order equivalent model for characterizing the interelectrode capacitance of MOSFETs. Compel 2022, 41, 1660–1676. [Google Scholar] [CrossRef]
- Chen, X.; Xi, L.; Zhang, Y. Fractional techniques to characterize non-solid aluminum electrolytic capacitors for power electronic applications. Nonlinear Dynamics 2019, 98, 3125–3141. [Google Scholar] [CrossRef]
- Allagui, A.; Benaoum, H.; Elwakil, A.A.; Alshabi, M. Extended RC Impedance and Relaxation Models for Dissipative Electrochemical Capacitors. IEEE Transactions on Electron Devices 2022, 69, 5792–5799. [Google Scholar] [CrossRef]
- Chen, X.; Zheng, F.; Wei, Y. A Comparison Study of Time Domain Computation Methods for Piecewise Smooth Fractional-Order Circuit Systems. Fractal Fract 2023, 7, 230. [Google Scholar] [CrossRef]
- Chen, X.; Chen, Y.; Zhang, B.; Qiu, D. A modeling and analysis method for fractional-order DC-DC converters. IEEE Transactions on Power Electronics 2016, 32, 7034–7044. [Google Scholar] [CrossRef]
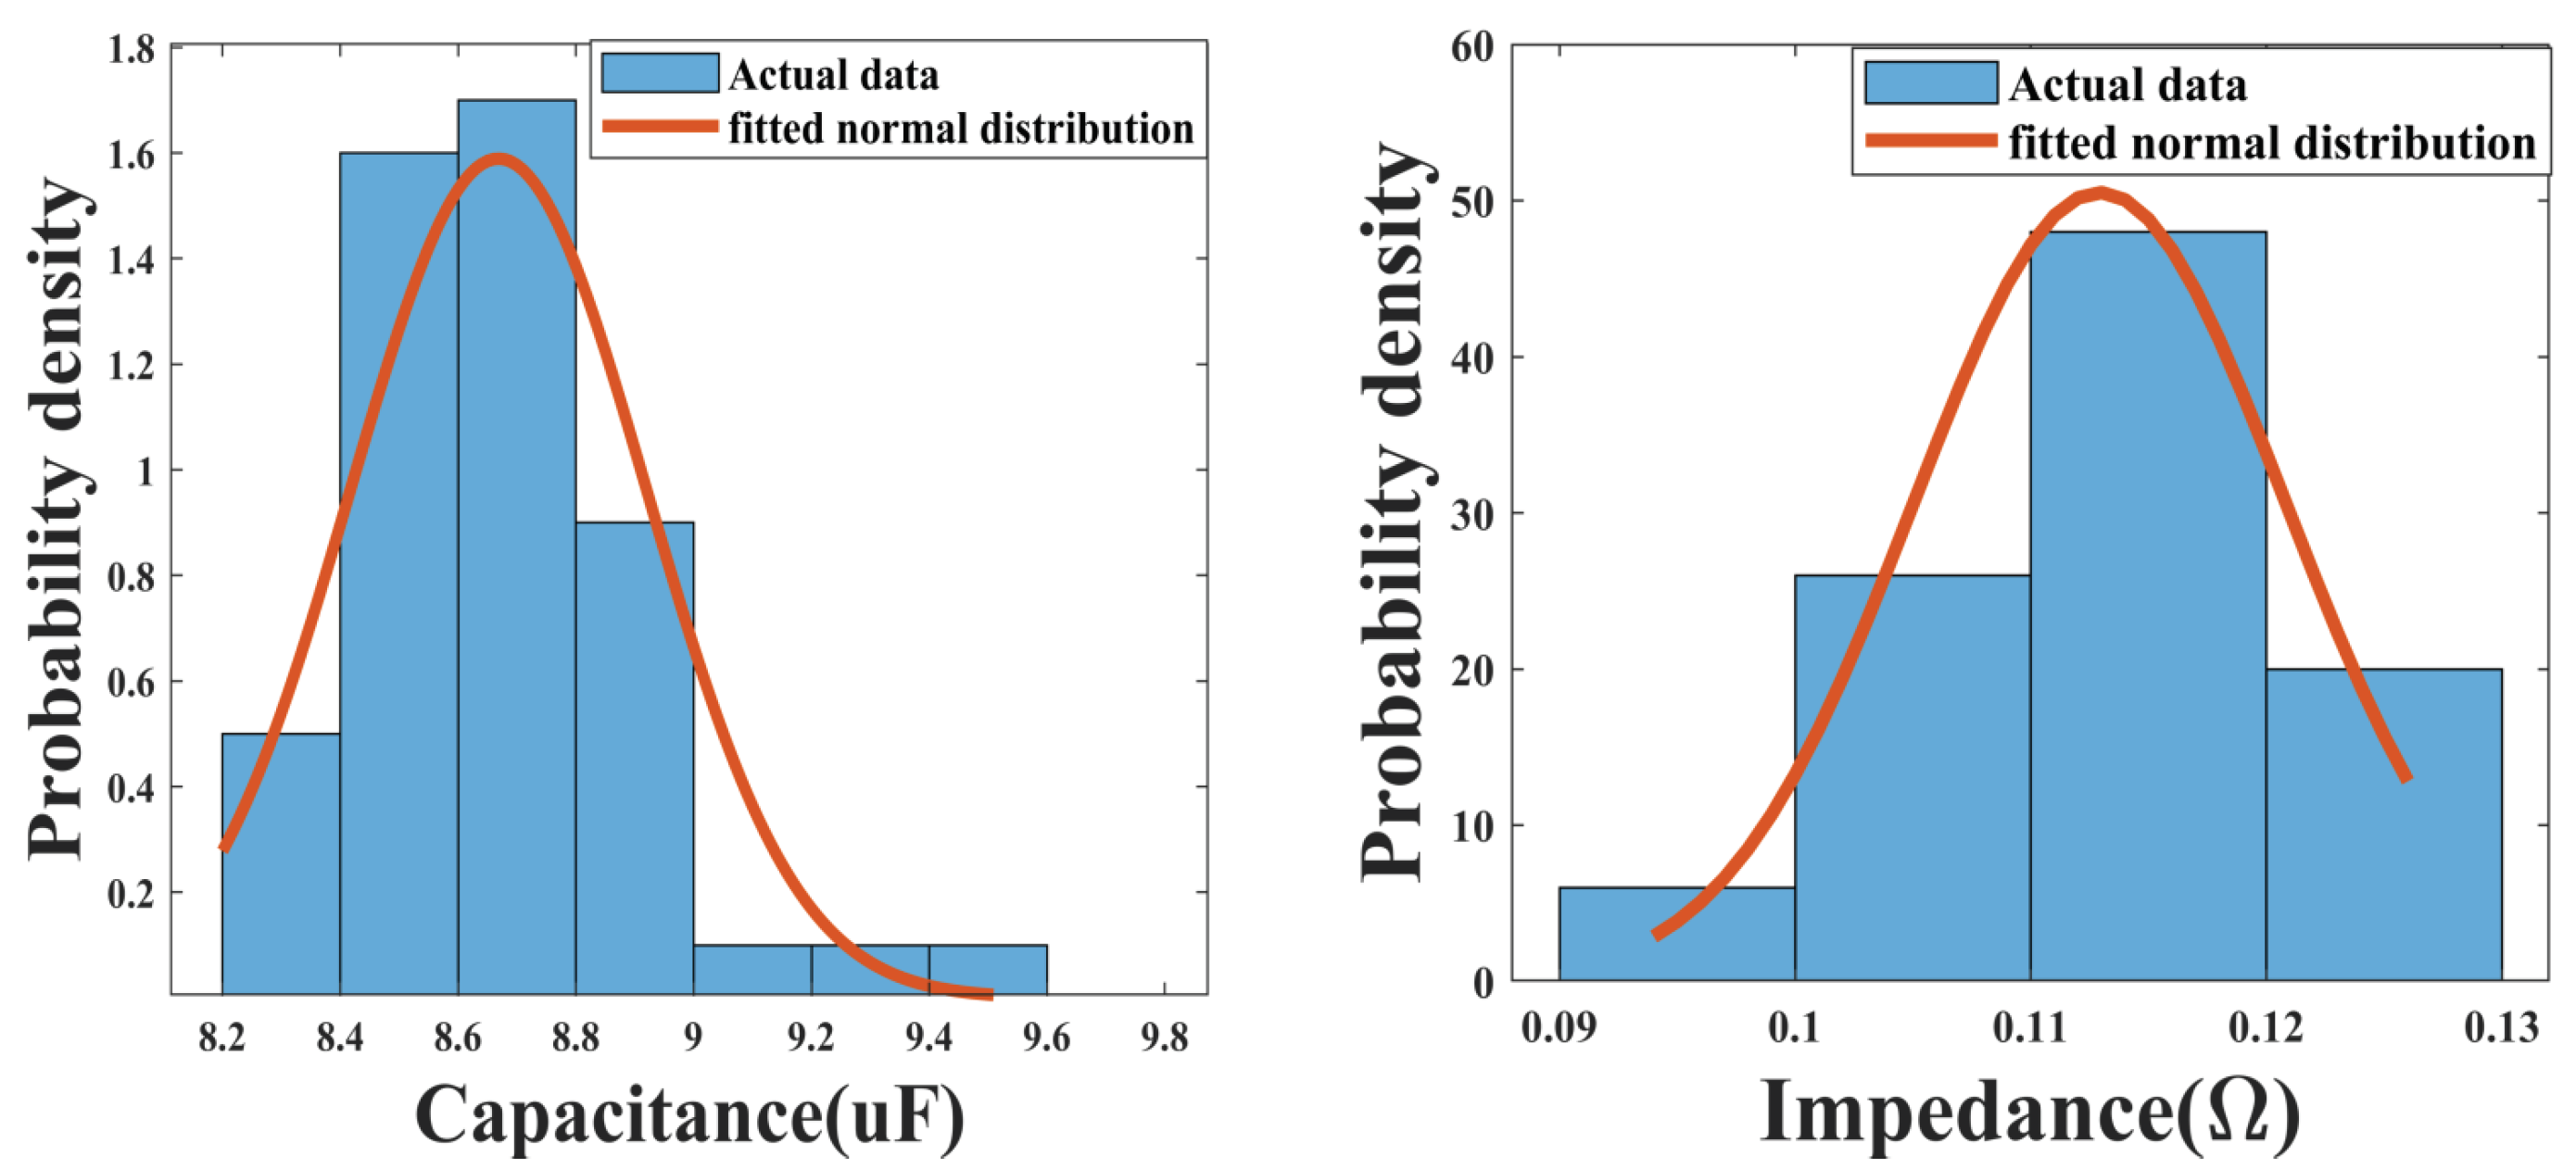
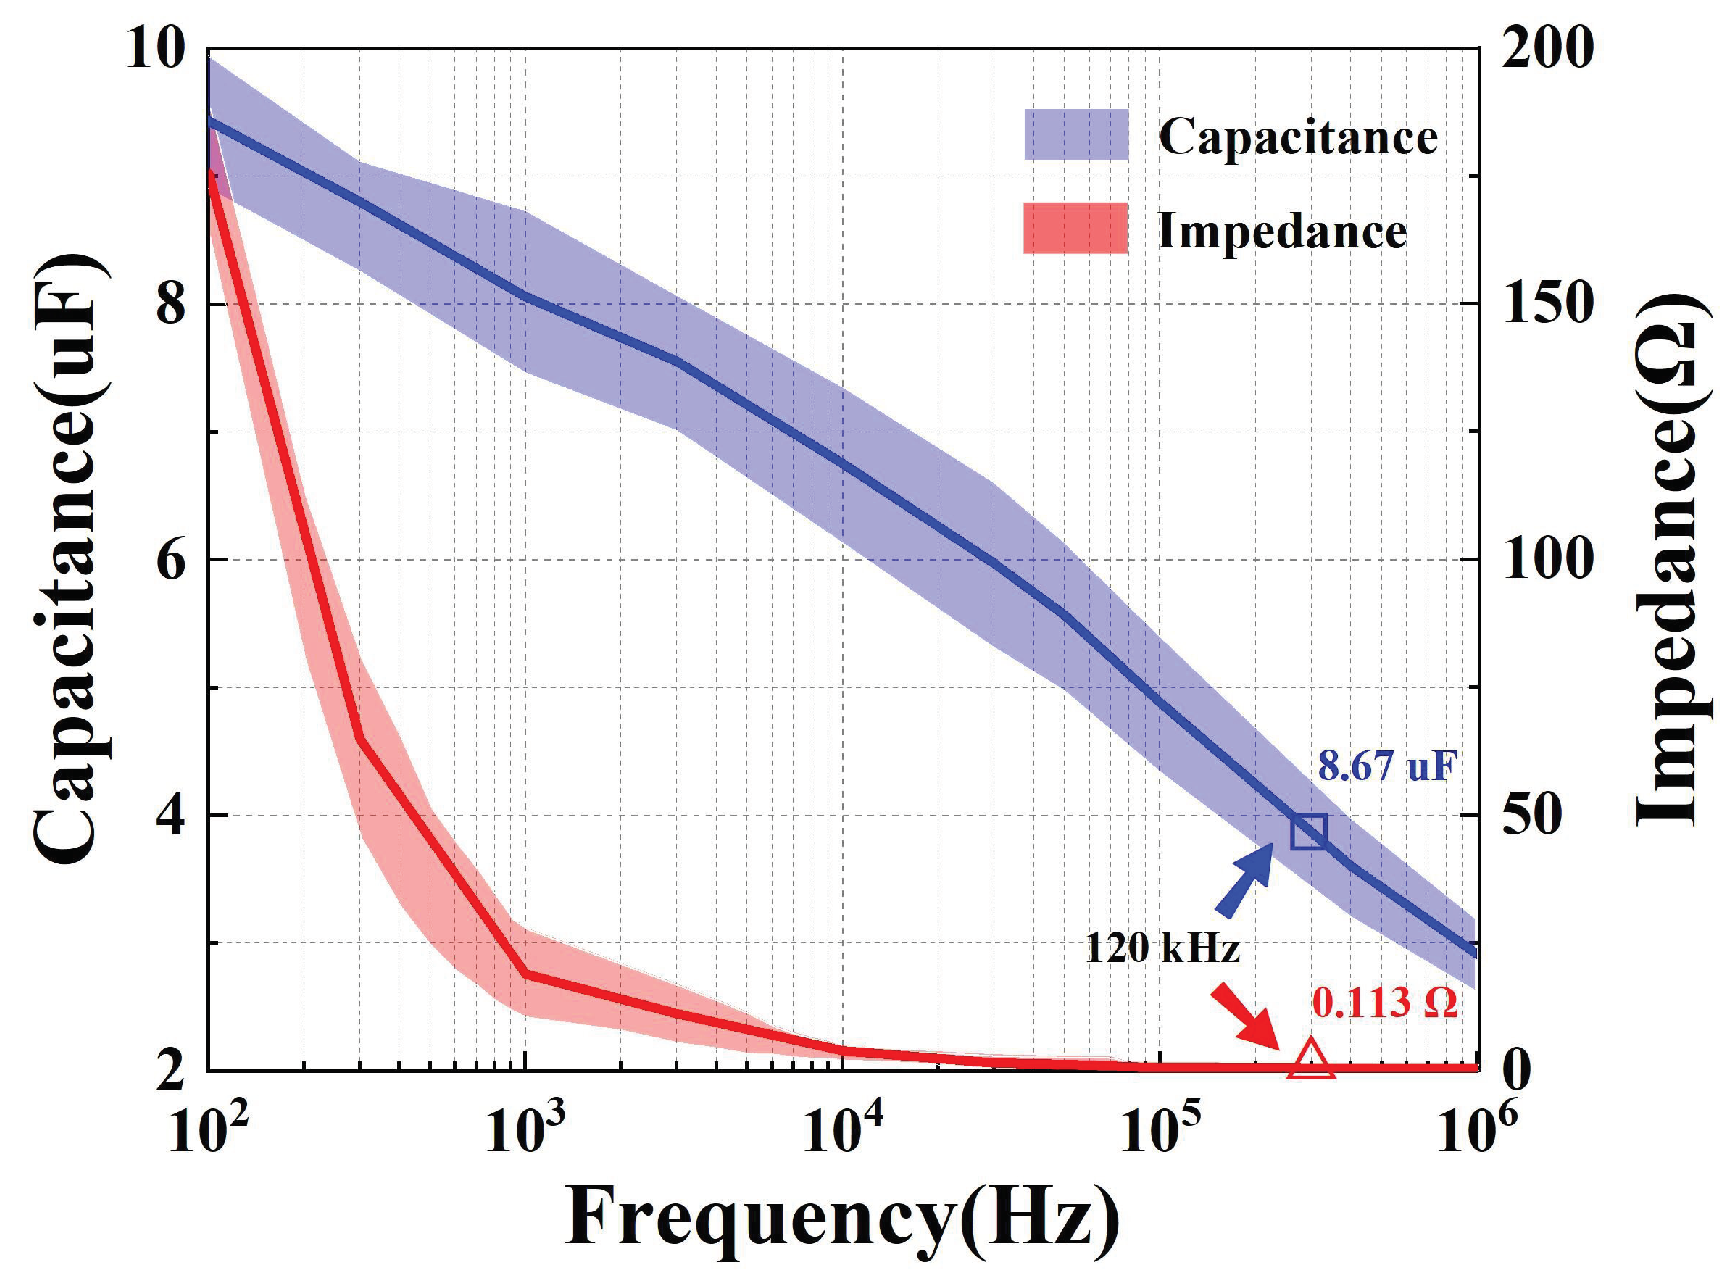
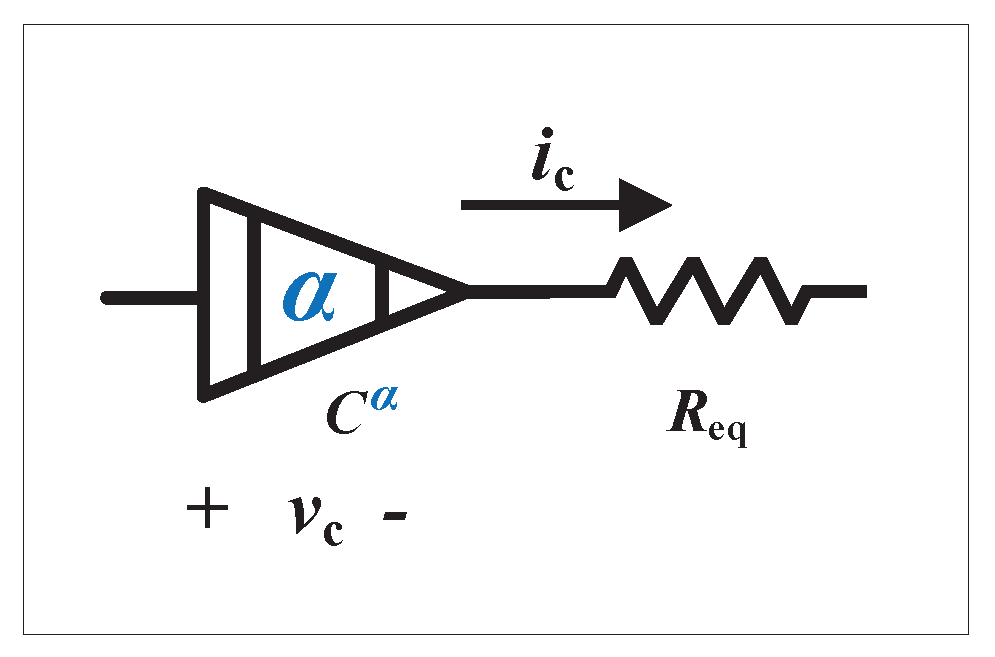
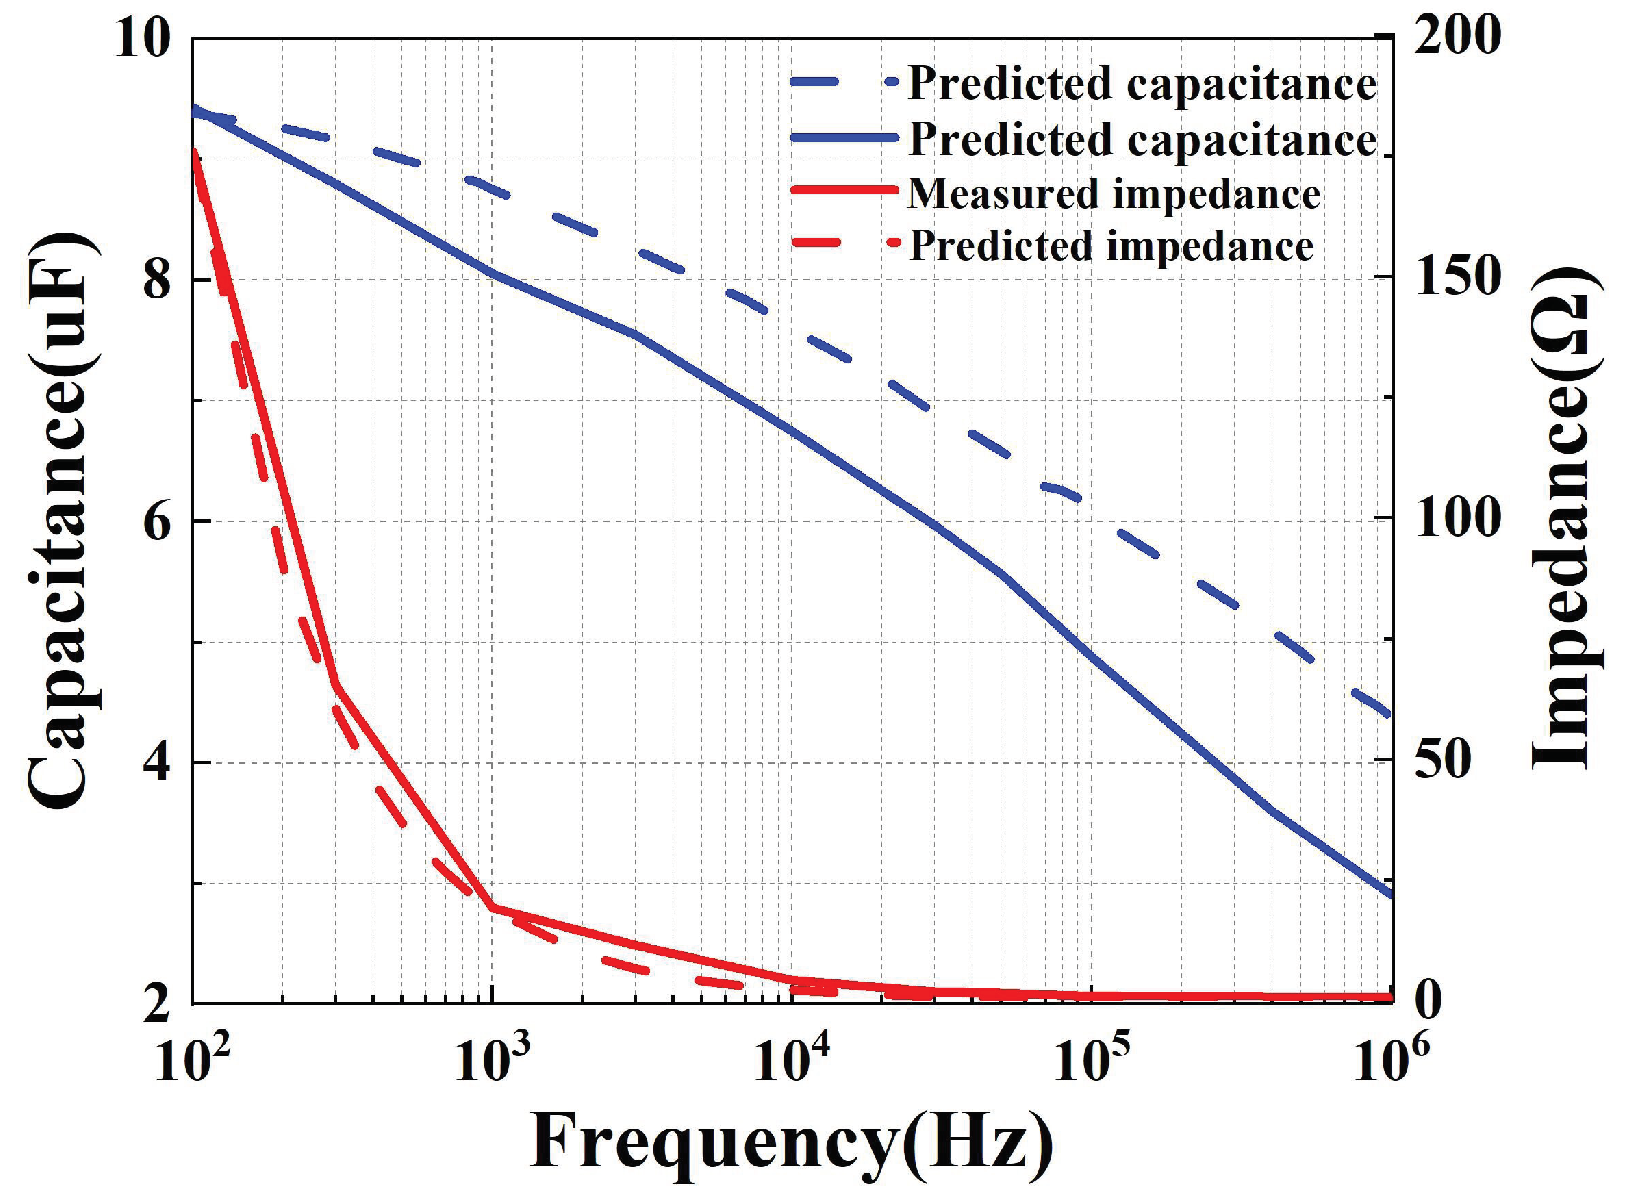
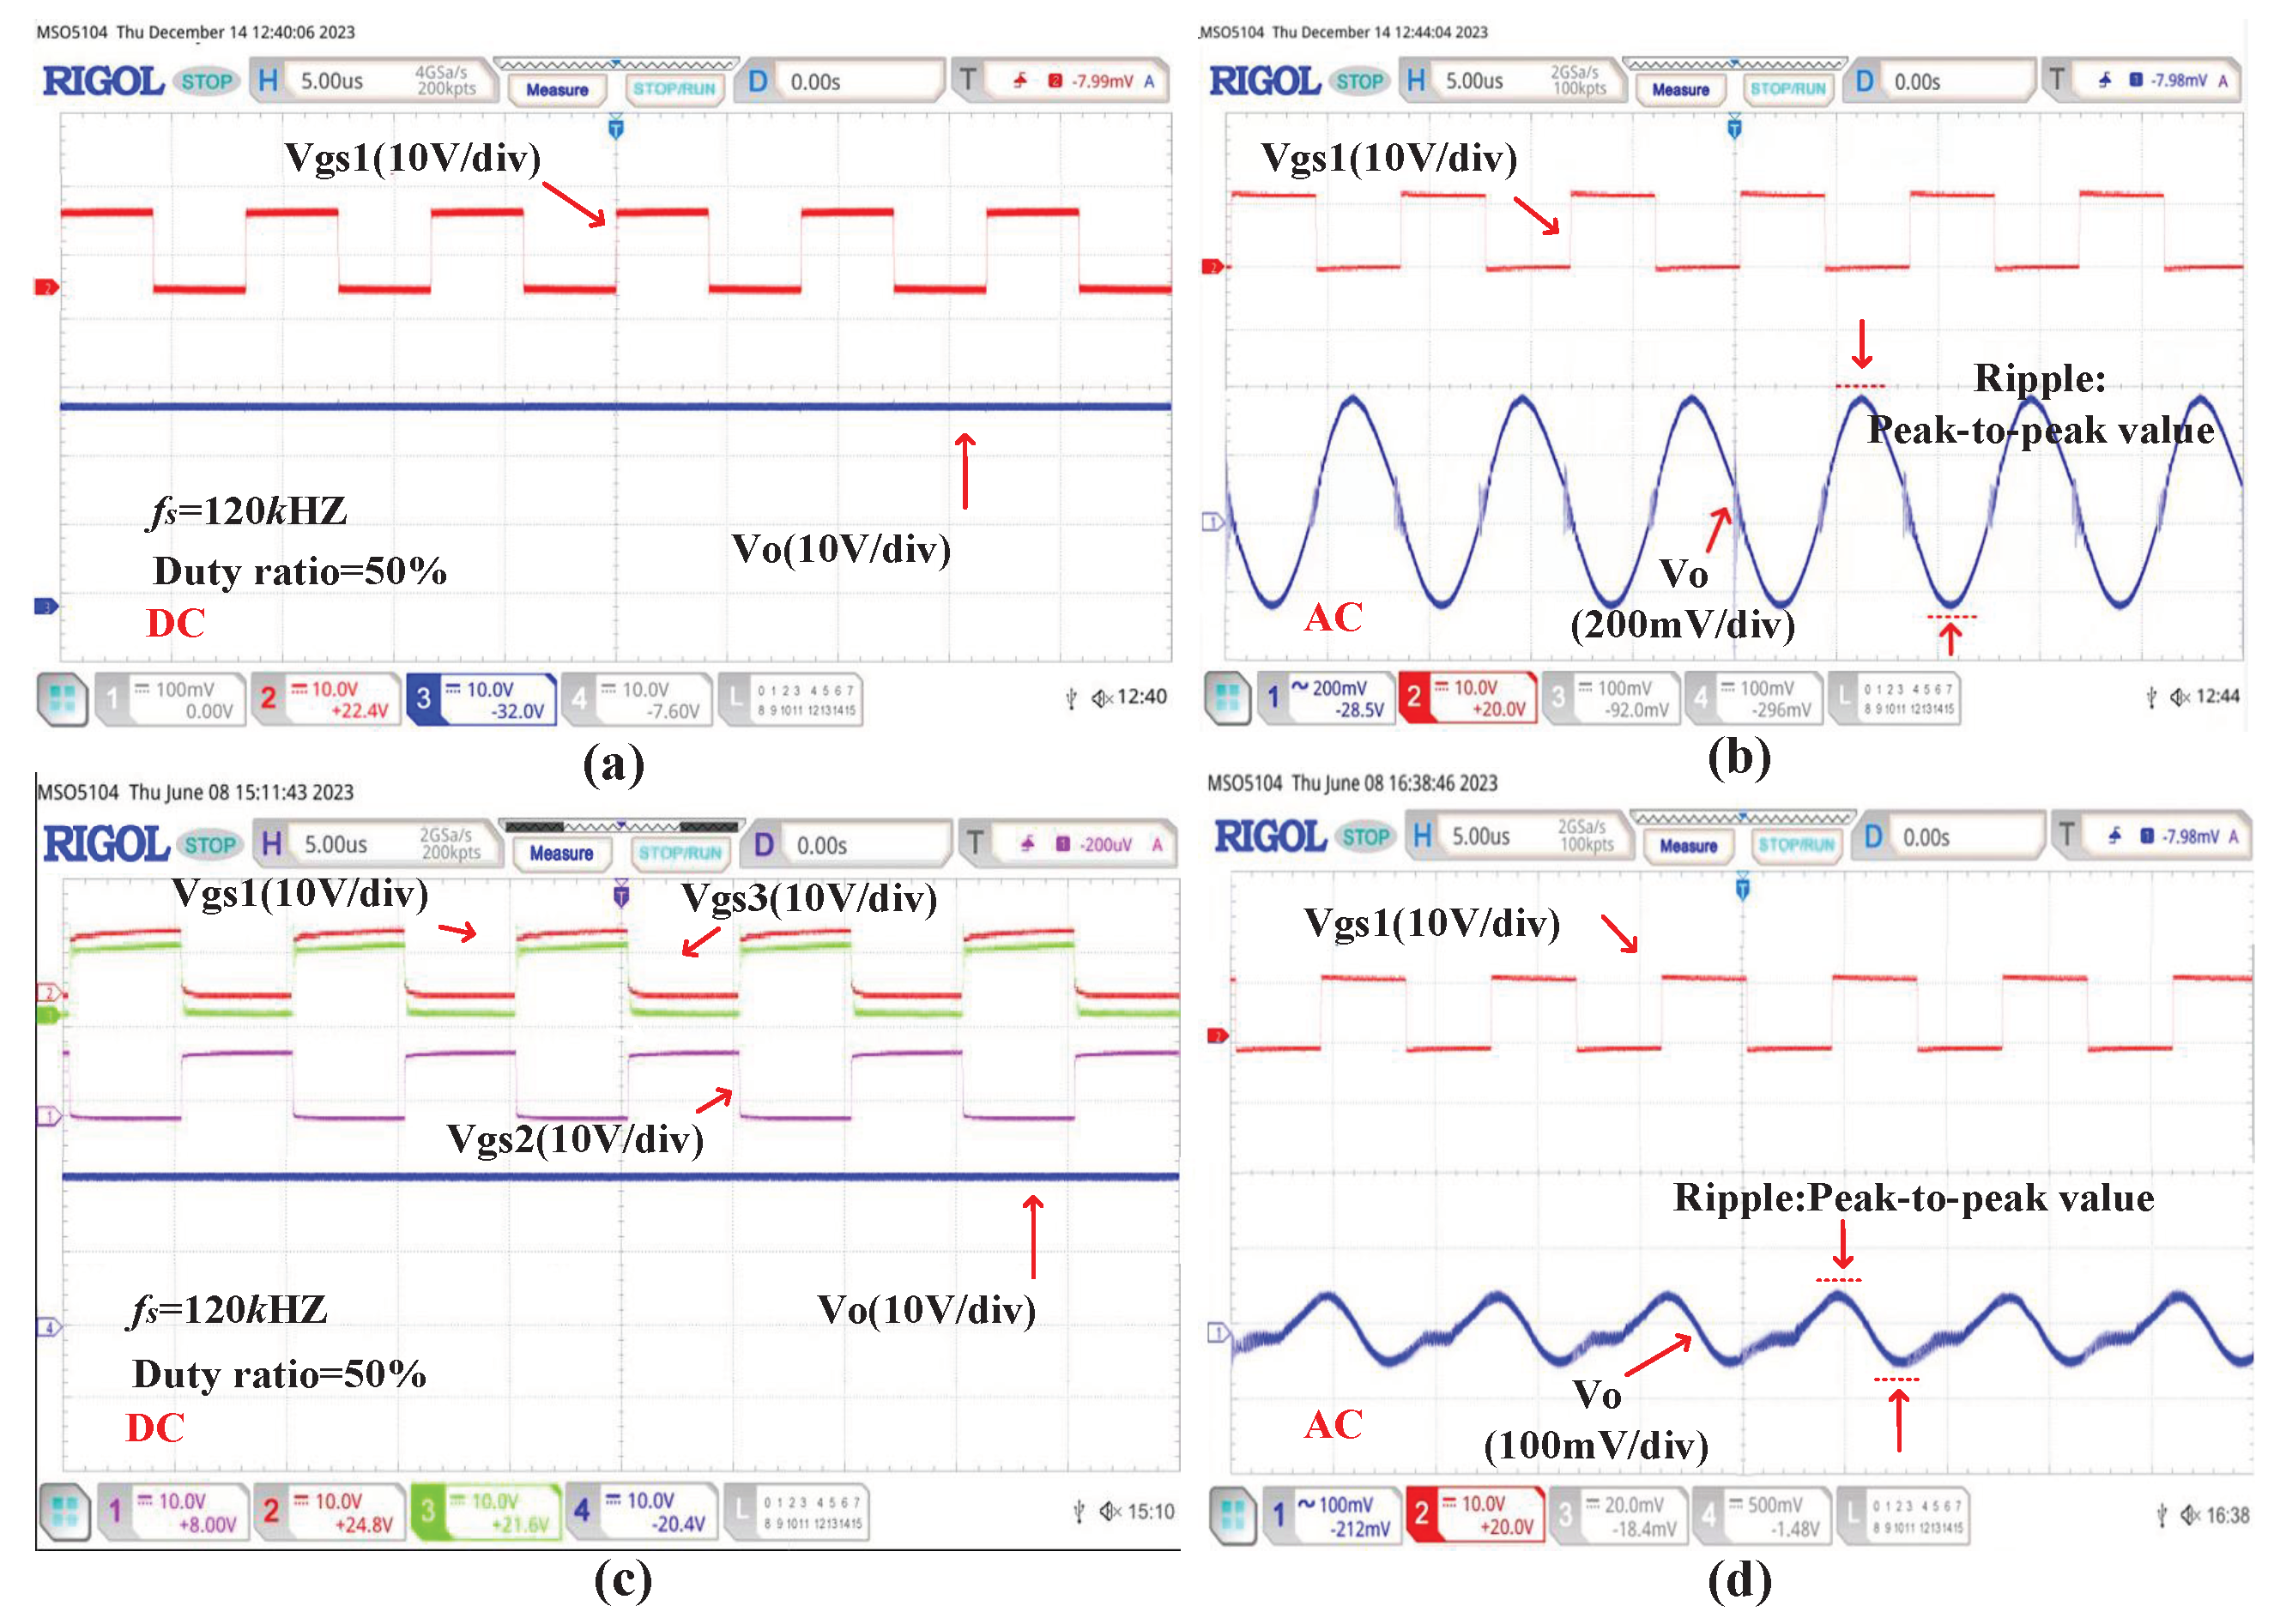
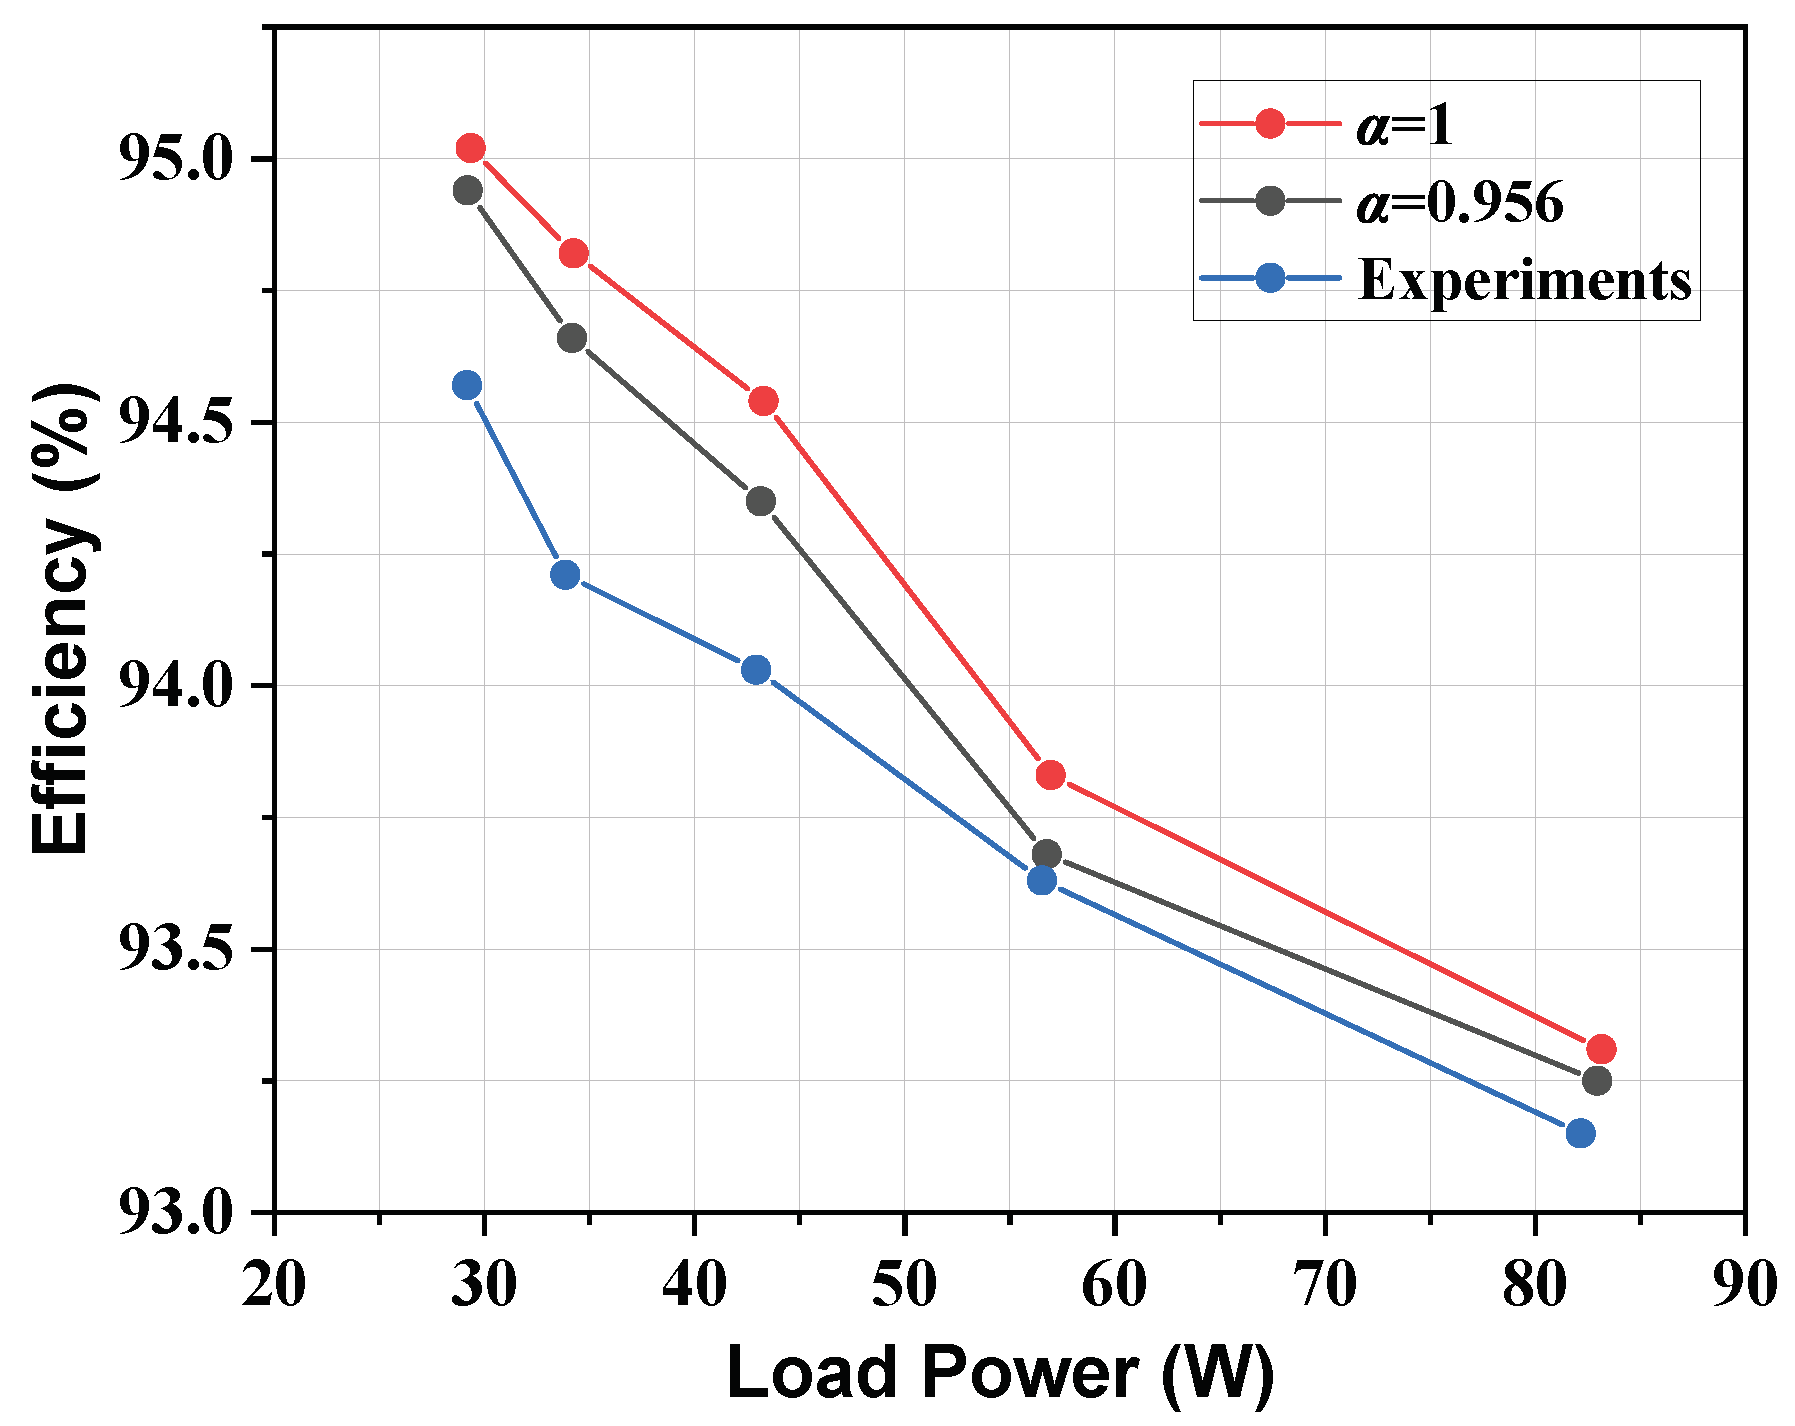
| Test cases | Voltage (V) | |||
|---|---|---|---|---|
| Simulation 2:1 () | 30.05 | 29.98 | 29.38 | 29.38 |
| 2:1 () | 30.06 | 29.96 | 29.37 | 29.37 |
| 2:1 () | 30.08 | 29.91 | 29.36 | 29.36 |
| Experiment 2:1 | 30.12 | 29.92 | 29.22 | 29.22 |
| Simulation 3:1 () | 40.11 | 40.08 | 19.61 | 19.58 |
| 3:1 () | 40.13 | 40.04 | 19.64 | 19.48 |
| 3:1 () | 40.17 | 39.86 | 19.71 | 19.37 |
| Experiment 3:1 | 40.20 | 39.97 | 19.94 | 19.42 |
Disclaimer/Publisher’s Note: The statements, opinions and data contained in all publications are solely those of the individual author(s) and contributor(s) and not of MDPI and/or the editor(s). MDPI and/or the editor(s) disclaim responsibility for any injury to people or property resulting from any ideas, methods, instructions or products referred to in the content. |
© 2024 by the authors. Licensee MDPI, Basel, Switzerland. This article is an open access article distributed under the terms and conditions of the Creative Commons Attribution (CC BY) license (http://creativecommons.org/licenses/by/4.0/).


