1. Introduction
Microalgae comprising several bioactive compounds, such as polyunsaturated fatty acids, polysaccharides, astaxanthin, and beta-glucan that exhibit therapeutic potency have garnered increasing attention for their application in various diseases, especially those associated with immune regulation [
1,
2]}.
Coccomyxa subellipsoidea KJ (C-KJ; IPOD FERM BP-22254), a green alga that accumulates lipids and metals in the cytoplasm, is a significant contributor to these bioactive compounds and has been implicated in several diseases [
3,
4]. For instance, monogalactosyl diacylglyceride isolated from
Coccomyxa sp. suppresses viral replication in the genital cavity of herpes simplex virus type-2-infected mice [
5]. The minerals and metals, including zinc and copper, highly accumulate in the
Coccomyxa cell bodies and play crucial roles in the transcription factors or signaling molecules that are necessary for the immune response [
6]. Additionally, the crude polysaccharide AEX isolated from
Coccomyxa gloeobotrydiformis modulates immune responses in chickens [
7] and also suppresses lipopolysaccharide (LPS)-induced inflammatory responses in a macrophage cell line (RAW 246.7) [
8]. However, despite these reports on the effects of
Coccomyxa extracts on immune modulation that have been detected mainly using cytokine profiles, their detailed immune cell profiling remains elusive.
Helper T cell subsets, characterized by specific cytokine profiles, play an important role in shifts in immune conditions [
9]. Each subset is specifically induced by cytokines released by pathogen-induced immune reactions. Toll-like receptors (TLR) are well-defined pattern recognition receptors involved in the induction of innate and acquired immunity [
10,
11]. They signal through specific ligands in different microbes and recognize pathogen-associated molecular patterns, such as LPS and CpGs, to induce innate immune responses.
Coccomyxa contains AEX, lipids, and unidentified unique molecules; however, lipid-based molecules such as LPS are prone to abortion during the purification process of water-soluble materials. Moreover, the polysaccharides derived from
Coccomyxa suppress LPS-induced inflammation by modulating the regulation of various signaling pathways [
8]. In our previous study, we showed that C-KJ extracts induce the differentiation of highly competent stem cell-like memory T cells (T
scm) [
12] and suppress the superantigen-induced immune responses in vitro [
13]. Additionally, in a clinical study, C-KJ supplementation suppressed the deterioration of physical conditions related to immune and neuronal functions in healthy adults [
14]. These studies indicate that the C-KJ components do not function as ligands of TLR, suggesting the existence of a new molecular mechanism associated with the modulation of the immune system for T cell regulation by
Coccomyxa components.
Furthermore, sterols also regulate innate and acquired immunity [
15,
16]. The sterols contained in
Coccomyxa are similar to those in evolutionarily higher plants, and no specific sterols or steroids are identified in this species [
17]. Therefore, sterols may not be the major players in imparting the unique functions of C-KJ extracts. In contrast,
Coccomyxa contains high amounts of minerals such as zinc and copper [
4]. Among these low-molecular-weight molecules, zinc plays a crucial role in maintaining homeostasis of the immune system [
18,
19]. Many transcription factors are zinc-finger proteins, and defects in these proteins can lead to serious immune dysfunction [
20]. Therefore, enhancing the expression of genes involved in mineral regulation may contribute to addressing these issues. Because transcriptome analysis has been demonstrated as a powerful tool to unravel the intricate molecular interactions involved in immune regulation, it might provide insights into the molecules that function as key factors in the immune system’s regulation, such as minerals like zinc that are often linked to larger molecules, such as glucosides or protein complexes.
Based on these findings, we hypothesize a novel molecular mechanism associated with the modulation of the immune system by Coccomyxa components, particularly in T cell regulation. To test this hypothesis, in this study, we aimed to investigate the gene expression profile of T cells induced by water-soluble Coccomyxa extract components, using microarray and real-time PCR techniques together with detailed flow cytometry (FCM) analysis. The findings of this study will unveil the potential dual regulation by meal- and mineral-related pathways and interleukin (IL)-17-related pathways, shedding light on unexplored aspects of immune modulation by C-KJ components.
2. Materials and Methods
2.1. Ethical Approval
Human peripheral blood mononuclear cells (PBMCs) were derived from healthy donors (HDs) after receiving written informed consent from the participants and were approved by the Institutional Review Board of the Tokai University Human Research Committee (approval no. 20R051, 21R059). The study was conducted in accordance with the guidelines of the Declaration of Helsinki and the Japanese federal regulations outlined for the protection of human participants. Healthy donors without a history of malignant diseases were selected to obtain blood samples for this study.
2.2. Preparation of Human PBMCs
RPMI 1640 medium and supplements were purchased from Nissui Co. Ltd. (Tokyo, Japan) and peripheral blood (PB; 50 mL) was collected from each HD in the morning using Vacutainer ACD tubes (NIPRO Corporation, Osaka, Japan) containing heparin. The collected PB was immediately transferred to a 10 mL Ficoll-Hypaque density gradient medium (Sigma-Aldrich, London, UK) and centrifuged (500 × g, 30 min, 20 °C) to isolate mononuclear cells. The remaining erythrocytes were removed by osmotic lysis. The cells were washed with phosphate-buffered saline (PBS) for 5 min at 300 × g, 4 °C, and the cell number was counted.
2.3. Preparation of C-KJ Fractions
Lyophilized C-KJ sample (2.5 g; IPOD FERM BP-22254) was added to 25 mL distilled water and incubated with shaking at 37 °C, 100 rev/min for 6 h followed by precipitation with 5 mg/mL polyethyleneimine (final concentration; 0.05%). The suspension was centrifuged at 3,600 × g for 10 min, and the supernatant was salt-precipitated till 80% saturation using ammonium sulfate. The precipitates were desalinated and applied to a Hitrap DEAE FF column equilibrated with 10 mM phosphate buffer (pH 7.0); the proteins were eluted using a 10–1,000 mM NaCl gradient followed by sodium dodecyl-polyacrylamide gel electrophoresis profiling of the peaks. The eluents amplifying the protein bands were pooled and used as the protein (P) fraction. The supernatants of ammonium sulfate were desalted, concentrated, and precipitated using 80% (v/v) ethanol. The precipitate was dissolved in water to obtain the water-soluble sugar (S) fraction.” The (S) fraction was further fractionated using anion exchange chromatography and divided into acidic (AS), neutral (NS), and basic sugar (BS) fractions. Briefly, the (S) fraction was subjected to a DEAE-650M column (TOYOPEARL, 40 mL column volume), washed with distilled water, and eluted with two column volumes of 100, 200, 300, 400, 500, and 1,000 mM NaCl solutions. The presence of sugar was detected by the phenol sulfuric acid method, and the fractions containing sugar were collected and dialyzed in distilled water with a 3.5 kDa membrane. The dialyzed product was concentrated using an evaporator to obtain BS. The column chromatography of the flow-through fraction using a CM-650 column (TOYOPEARL, 40 mL column volume) followed by washing with distilled water and elution with the above-mentioned concentrations of NaCl solutions yielded AS. Subsequently, the flow-through of the CM columns was dialyzed and concentrated, as described above, to obtain NS.
2.4. Culture of Human PBMCs
The cells were seeded in 6-well plates and cultured at a density of 1 × 10⁶ cells/mL in RPMI 1640 medium (Nissui Co. Ltd.) containing 10% fetal calf serum (Sigma Aldrich, Missouri, USA) and antibiotics (streptomycin, 0.1 mg/mL, penicillin 100 unit/mL, Meiji Seika, Tokyo, Japan) in the presence of 1 µg/mL toxic shock syndrome toxin-1 (TSST-1; Toxin Tec. Sarasota, USA) at 37 °C and 5% CO2. The cells were incubated with varying concentrations of C-KJ fractions in culture medium, collected at 72 h, washed with PBS, and stained with fluorochrome-labeled monoclonal antibodies (mAbs) for FCM analysis. In the presence of cortisol, the cells were cultured for 72 and 216 h, and the hydrocortisone concentration was 1 μM. Signal transducer and activator of transcription 3 (STAT3) inhibition assay was performed using 1 μM Sttatic (Axon Medchem, Reston, VA, USA). After 72 h, the supernatant and cells were collected and RNA was extracted from the cells.
2.5. Analysis of Immune Cell Composition Using FCM
Mononuclear cells were collected from each well, quantified, and stained with appropriate dilutions of fluorochrome-labeled mAbs for 15 min at 4 °C, followed by washing with 1% (w/v) bovine serum albumin (Sigma Aldrich) in PBS. Cells were analyzed for the surface expression of differentiation antigens using a BD LSRFortessa
TM flow cytometer (BD Biosciences, Franklin Lakes, NJ, USA). For each analysis, living white blood cells or lymphocytes were gated for propidium iodide and analyzed using FlowJo software v10.3 (BD Biosciences, San Jose, CA, USA). The mAbs used for staining are listed in
Table S1.
2.6. Quantification of Cytokines Secreted by Cultured PBMCs
Supernatants of the cultured cells were collected for cytokine quantitation using bead-based multiplex LEGENDplex (BioLegend, San Diego, USA) according to the manufacturer’s instructions. Briefly, 25 µL of supernatant was mixed with 25 µL of capture beads and incubated for 2 h at 25℃. The beads were then washed, mixed with detection antibodies, and incubated for 1 h at room temperature. Subsequently, streptavidin–phycoerythrin was added and the mixture was incubated for 30 min at room temperature. Finally, the beads were washed and analyzed by FCM. The cytokines IL-1β, interferon (IFN)-α, IFN-γ, tumor necrosis factor-α (TNF-α), monocyte chemotactic protein (MCP)-1, IL-2, IL-4, IL-5, IL-6, IL-8, IL-9, IL-10, IL-12p70, IL-13, IL-17A, IL-17F, IL-18, IL-22, IL-23, and IL-33 were quantified. Analysis was performed using the BD FACSVerseTM Flow Cytometer (BD Biosciences). The data were analyzed in pg/mL using LEGENDPlex™ V8.0 (BioLegend). IFN-γ was quantified using ELISA with serially diluted samples using OptEIATM Human IFN-γ ELISA Set (BD Biosciences) according to the manufacturer’s instructions.
2.7. Purification of T Cells
A Pan T Cell Isolation Kit (Miltenyi Biotec, Bergisch Gladbach, Germany) was used for T cell sorting. PBMCs were cultured as described previously for 72 h. Briefly, the cells were collected, washed, and incubated with the Pan T-cell biotin-antibody cocktail at 4 °C for 5 min. Afterward, 40 µL wash buffer followed by 20 µLion Pan T cell microbead cocktail were added and incubated at 4 °C for 10 min. The T cells were then sorted using the Automacs system (program: depletion; Miltenyi Biotec) and labeled using CellTrace™ Cell proliferation kits (Thermo Fisher Scientific, Massachusetts, USA) following the manufacturer’s instructions.
2.8. Microarray and Quantitative Real-Time PCR (qRT-PCR) Analysis
Cells were stored in TRIzol (Invitrogen, Carlsbad, CA, USA) at −80℃ and extracted according to the manufacturer’s instructions. RNA concentration was determined by measuring the absorbance at 260 nm using a NanoDrop1000 (Thermo Fisher Scientific, Rockford, IL). Purity was estimated using a relative ratio of 260/280 nm, and integrity was checked by agarose gel electrophoresis. The samples with > 95% purity and integrity were used for further analysis. cDNAs were synthesized from total RNA (2 μg) using a High-capacity cDNA Reverse Transcription Kit (Life Technologies, CA, USA). Microarray analysis on a 3D gene-DNA chip was outsourced to Toray Industries, Inc. (Tokyo, Japan). 3D gene measurements were performed in triplicate (n = 3).
TaqMan probes for human metallothionein 1 and 2 (ID Hs01591333_g1, Hs00831826_s1, Thermo Fisher Scientific Co. Ltd., MA, USA) were used, and qRT-PCR was conducted using Applied Biosystems StepOnePlus Real-Time PCR Systems. Commercially available TaqMan Fast Universal PCR Master Mix (Thermo Fisher Scientific, Rockford, IL) was used for PCR amplification and detection. All samples were analyzed in triplicate (n = 3).
2.9. Zinc Quantification
Lyophilized samples were subjected to thermal decomposition and concentration in the presence of sulfuric acid and nitric acid and dissolved in nitric acid. Zn and Cu were quantified using Inductively Coupled Plasma Mass Spectrometry (Torey Research Center, Tokyo, Japan).
2.10. Data Analysis
The data were imported into GeneSpring GX14.9.1 software (Agilent Technologies, Santa Clara, CA, USA) for filtering and basic statistical analysis. Differentially expressed genes (DEGs) in TSST-1, TSST-1 (P), and TSST-1 (AS) were identified with a cut-off of a Benjamini–Hochberg adjusted p < 0.05 and those with a fold change of at least 2.0 according to Welch’s t-test were considered significantly differentially expressed when they had a. Unsupervised hierarchical clustering, and principal component analyses were performed to visualize the overall expression characteristics of all samples used in this study. Biological function and pathway analyses were performed using the online Database for Annotation, Visualization, and Integrated Discovery (DAVID) toolkit 6.8, which is an ontology-based web tool (
https://david.ncifcrf.gov/home.jsp). Gene lists defined as DEG for each group were uploaded using official gene symbols to identify enriched gene ontologies for gene expression and functional pathway analyses. The biological functions of the selected genes were analyzed using the Gene Ontology (GO) database [
21] and the Kyoto Encyclopedia of Genes and Genomics (KEGG) [
22]. Protein–protein interactions and gene function prediction analyses were performed using GeneMANIA (
http://genemania.org/).
2.11. Statistical Analyses
For real-time PCR, LEGENDplex and volcano plots, statistical analyses were performed using one-way repeated ANOVA and paired Student’s t-test (Microsoft Excel) (Microsoft, Redmond, WA, USA). Data are presented as means ± standard deviation.
4. Discussion
Studies on immune regulation by green algal components, including those from
Coccomyxa, are limited [
2,
5,
6,
7,
25,
26]. Herein, we undertook a comprehensive investigation into the immune regulatory properties of C-KJ extracts, specifically focusing on the fractionation process, T cell characterization, and changes in gene expression. Our findings reveal a multifaceted effect of C-KJ components on the immune system, with notable outcomes in T cell activation and the expression of key genes. The fractionation of C-KJ extracts allowed us to pinpoint the unique properties of (P) and (AS) fractions, shedding light on their distinct roles in modulating the immune response. Both fractions demonstrated similar effects on T cell activation and the expression of surface markers related to T
scm, underscoring the significance of non-protein factors in immune regulation.
Consistent with our previous study [
13], here we showed that both (P) and (AS) treatments decreased IL-2 and increased IL-17 expression. On the contrary, IL-5 and IL-13 production decreased by (P) and (AS) treatments, which differs from the results of our previous study [
13]. This discrepancy between the results could be because we used partially purified (P) and (AS) in this study, which may have depleted some Th2 cytokine-inducing factors. Another study has shown that the water extract of
Chlorella sorokiniana enhanced T cell secretion of Th1 cytokines and concomitantly enhanced TNF-α [
27], which was decreased by C-KJ extract. Nonetheless, the secretion of inflammatory cytokines, such as IL-6, IL-1β, and TNF-α, has been shown to decrease in RAW 246.7 macrophage cell lines by
Coccomyxa gloeobotrydiformis extracts [
8]. Taken together, these studies suggest the presence of various unique immune modulators in the water-soluble components of green algae.
As the crude extract of C-KJ was heat-treated, which presumably may have denatured almost all proteins, we speculated that the proteins themselves may not bear the functionality of immune system remodeling. Therefore, we focused on investigating the effect of C-JK extracts on T cell activation and differentiation to identify new immune regulatory factors, especially those related to glycosides.
To this end, we purified T cells and performed microarray analysis, which revealed that (AS) and (P) exhibited highly similar gene profiles for immune regulation in the GO, KEGG, and STRING analyses. These findings suggest that the components affecting immune regulation are glycosides or other low molecular weight molecules bound to larger molecules. In the analyses, (P)-and (AS)-treated T cells expressed a significantly higher number of genes related to pathways involving immune regulation. (P) and (AS) demonstrated a dual role in immune modulation—they decreased Th2 cytokines together with class II MHC [
28], suggesting a potential regulatory role of these components in the regulation of allergic inflammation [
29]. Meanwhile, (P) and (AS) partially regulated the Th1 response by suppressing IL-2 production. Moreover, the level of IL-9, categorized as Th9, exhibited an upward trend, suggesting a possible enhancement of the Th17 response [
30] by secreting IL-21 [
31]. Th17 cells, a subset of helper T cells, play a crucial role in inducing neutrophil mobilization and exerting anti-pathogenic effects [
32]. Therefore, the Th17 response might contribute partially to the observed effects of water-soluble
Coccomyxa extract in our clinical study [
14]. Moreover, (P) and (AS) enhanced the expression of chemokine genes, including
CXCL2 and
CXCL8. The increased secretion of IFN-γ and IL-10 suggests the induction of a non-biased immune response other than C-KJ components-induced Th2 reduction. These findings collectively underscore the multi-faceted impact of (P) and (AS) fractions on immune regulation, implicating their potential significance in therapeutic interventions and immune-related studies.
Coccomyxa has been recognized as an alga that accumulates high levels of metals and minerals [
4,
33]. In this study, we identified a prominent gene category associated with metal and mineral ion-related genes, including zinc and copper, which exhibited an increase in (P) and (AS) fractions. Specifically, genes of the MT family that bind to metal and mineral ions, mainly zinc and copper, are highly expressed [
34,
35,
36]. MT1 and MT2 are involved in immune regulation, while MT3 is usually involved in the neural system
25. Usually, the zinc signal mediated via zinc transporters [
37] enhance the expression of MTF-1 transcription factor, leading to the transcription of
MT. These studies suggest that the abundant mineral and metal content in C-KJ components may induce
MT expression. However, we did not observe any increase in these transporters, suggesting the existence of a specific pathway induced by C-KJ components that merits further exploration.
MT–zinc axis is closely associated with immune regulation in infectious diseases or atopies [
29,
38]. MT1 and MT2 are two major MTs involved in immune function [
35]; however, the distinct roles of MT1 and MT2 have not been clarified. T-bet, the master regulator of the Th1 subset, requires zinc as a cofactor, and defect in T-bet suppresses Th1 subset differentiation [
39]. MT1 shifts the differentiation of Th cells towards Treg cells [
23] and downregulates MHC-II and IL-1β, IL-6, IL-12, and TNF-α on the dendritic cells [
28,
40]. A previous study has reported that the immune system activation possibly involves the induction of MT by TSST-1; however, TSST-1 did not affect IL-1 or TNF-α levels but enhanced that of IL-6 in mouse liver. Moreover, the study showed that IL-6 induction preceded MT mRNA induction in normal-cytokine-producing mice but not in low-cytokine-producing mice [
41]. Therefore, the study could not reach a consensus on whether MT induces IL-6, followed by IL-17 stimulation or not. For the chemokine gene expression, under the MT1/MT2 deficient condition, the number of circulating lymphocytes decreases, suggesting MT is a chemoattractant [
42]. However, in this study, we did not find any strong correlation between MT and chemokines in the protein–protein interaction network analysis.
Therefore, we further examined
MT1 and
MT2 expression to explore the relationship between the expression of MT and immune-related genes.
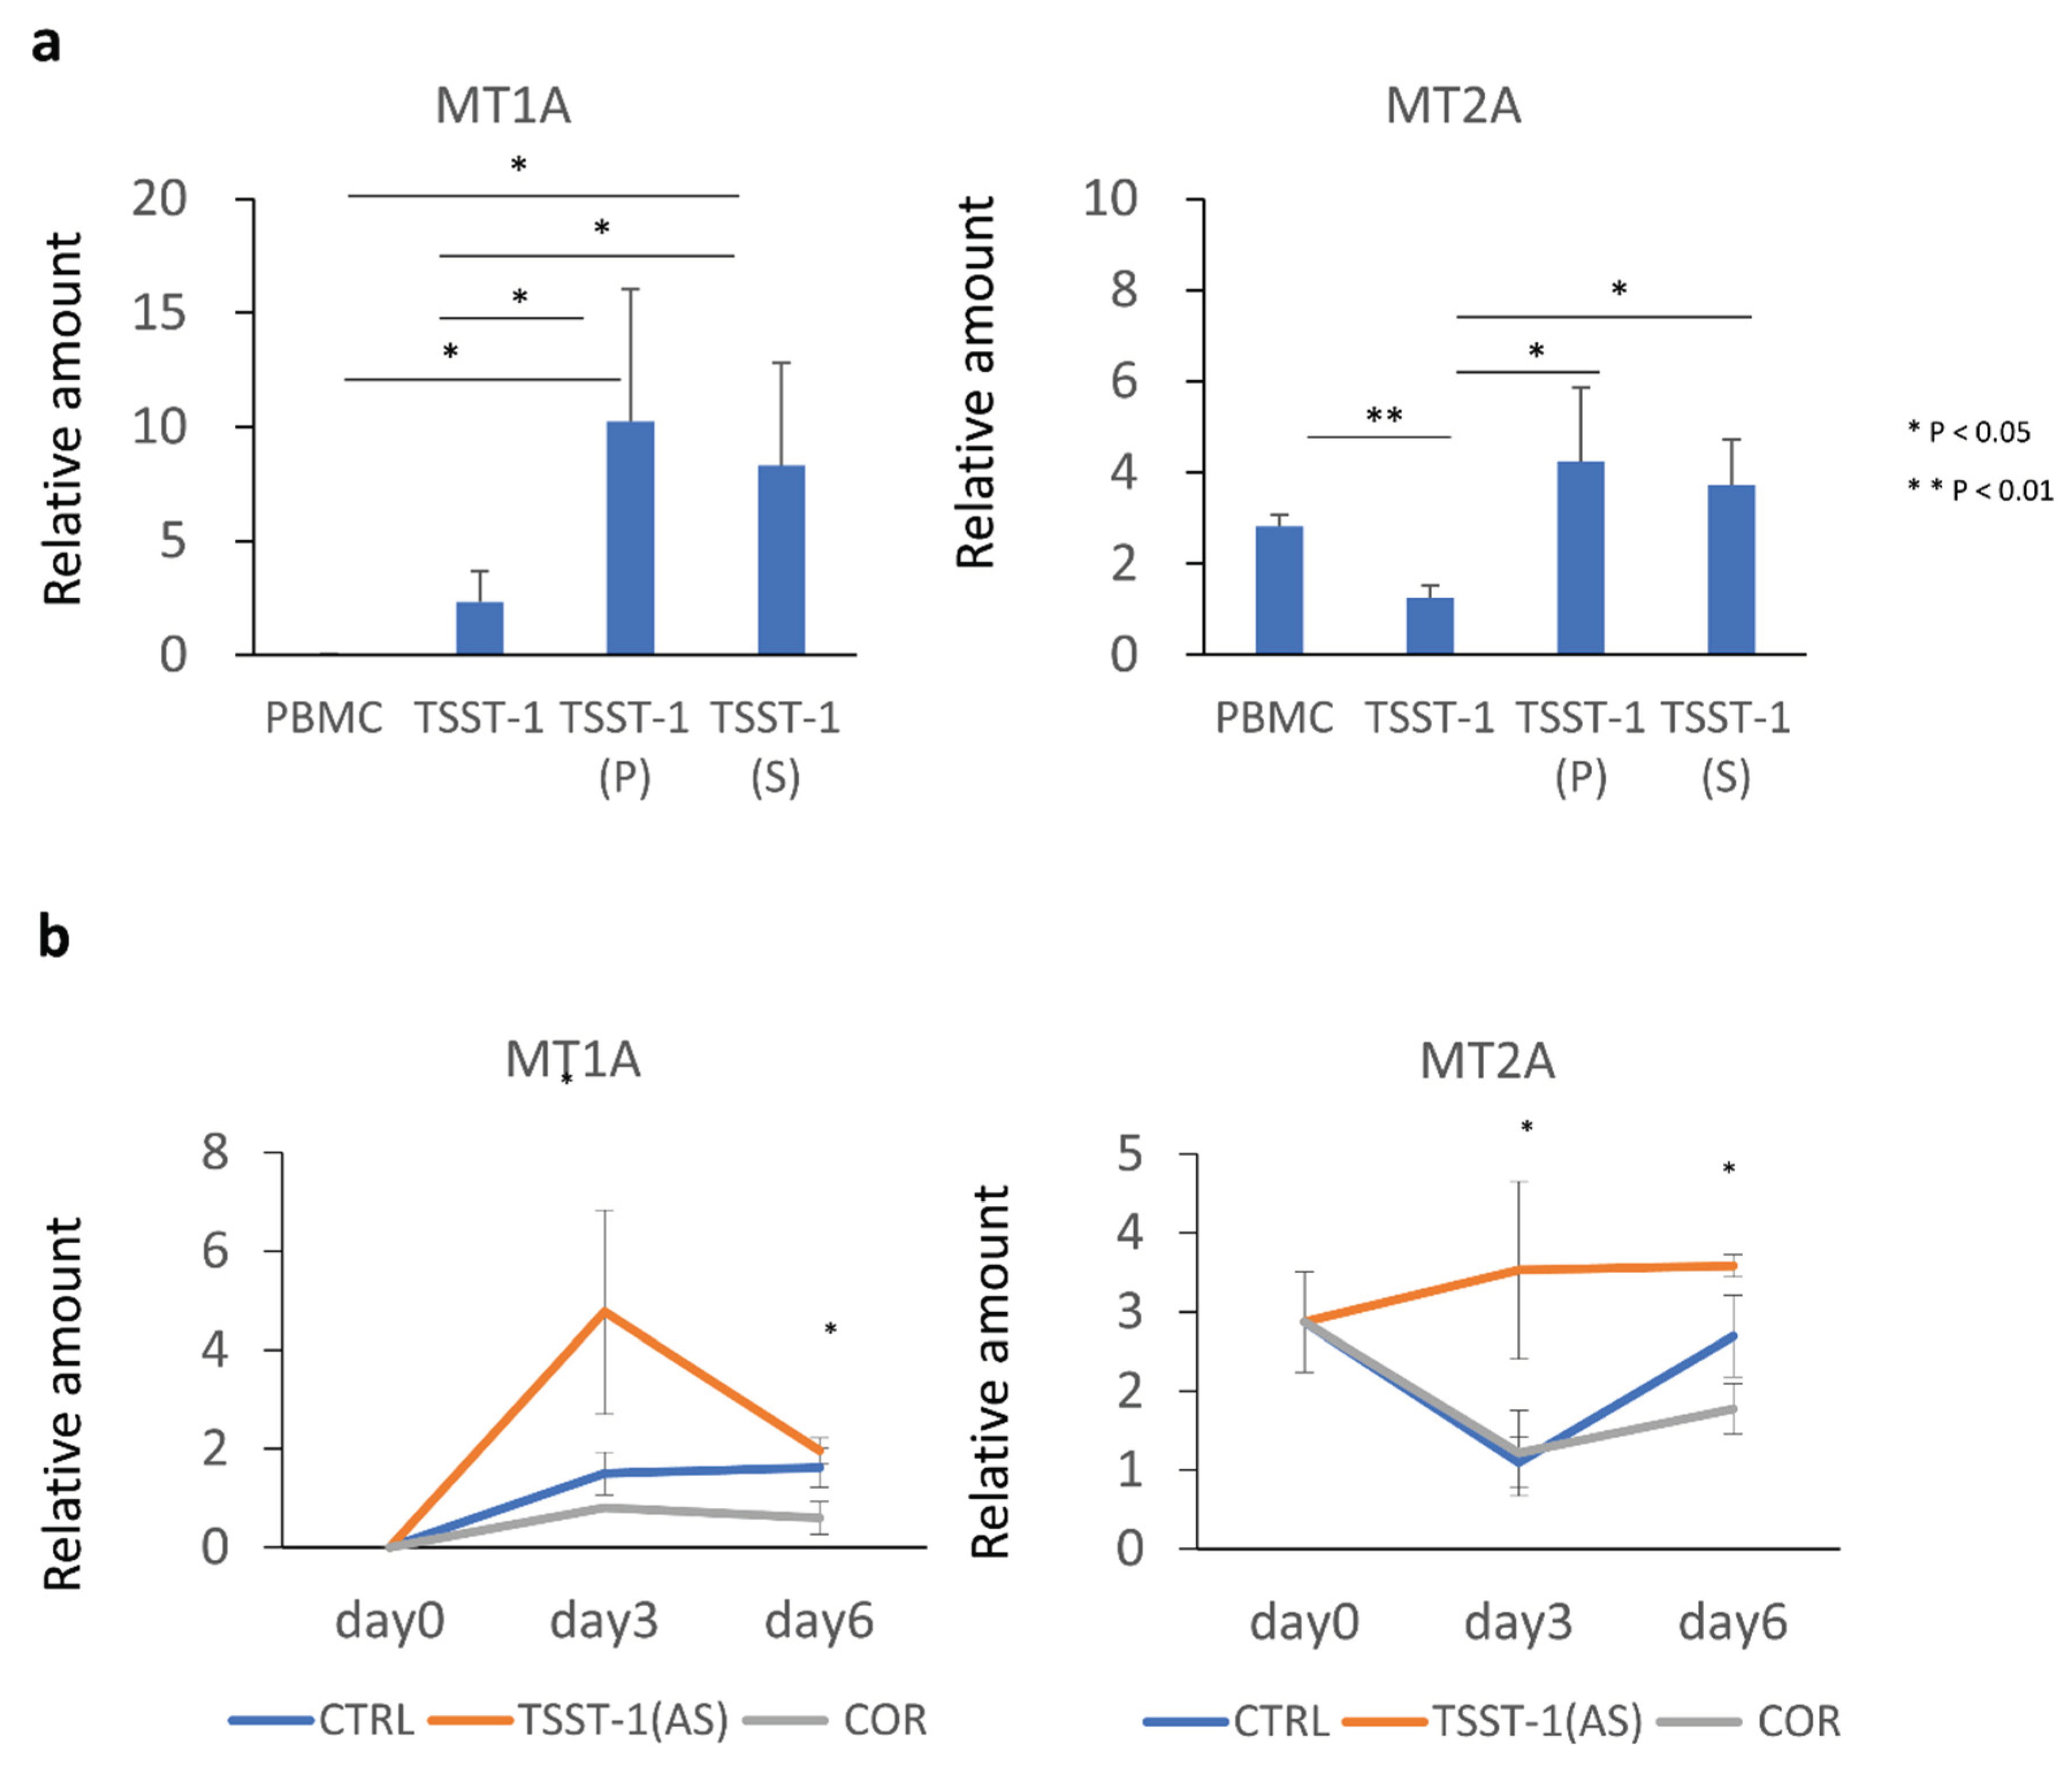
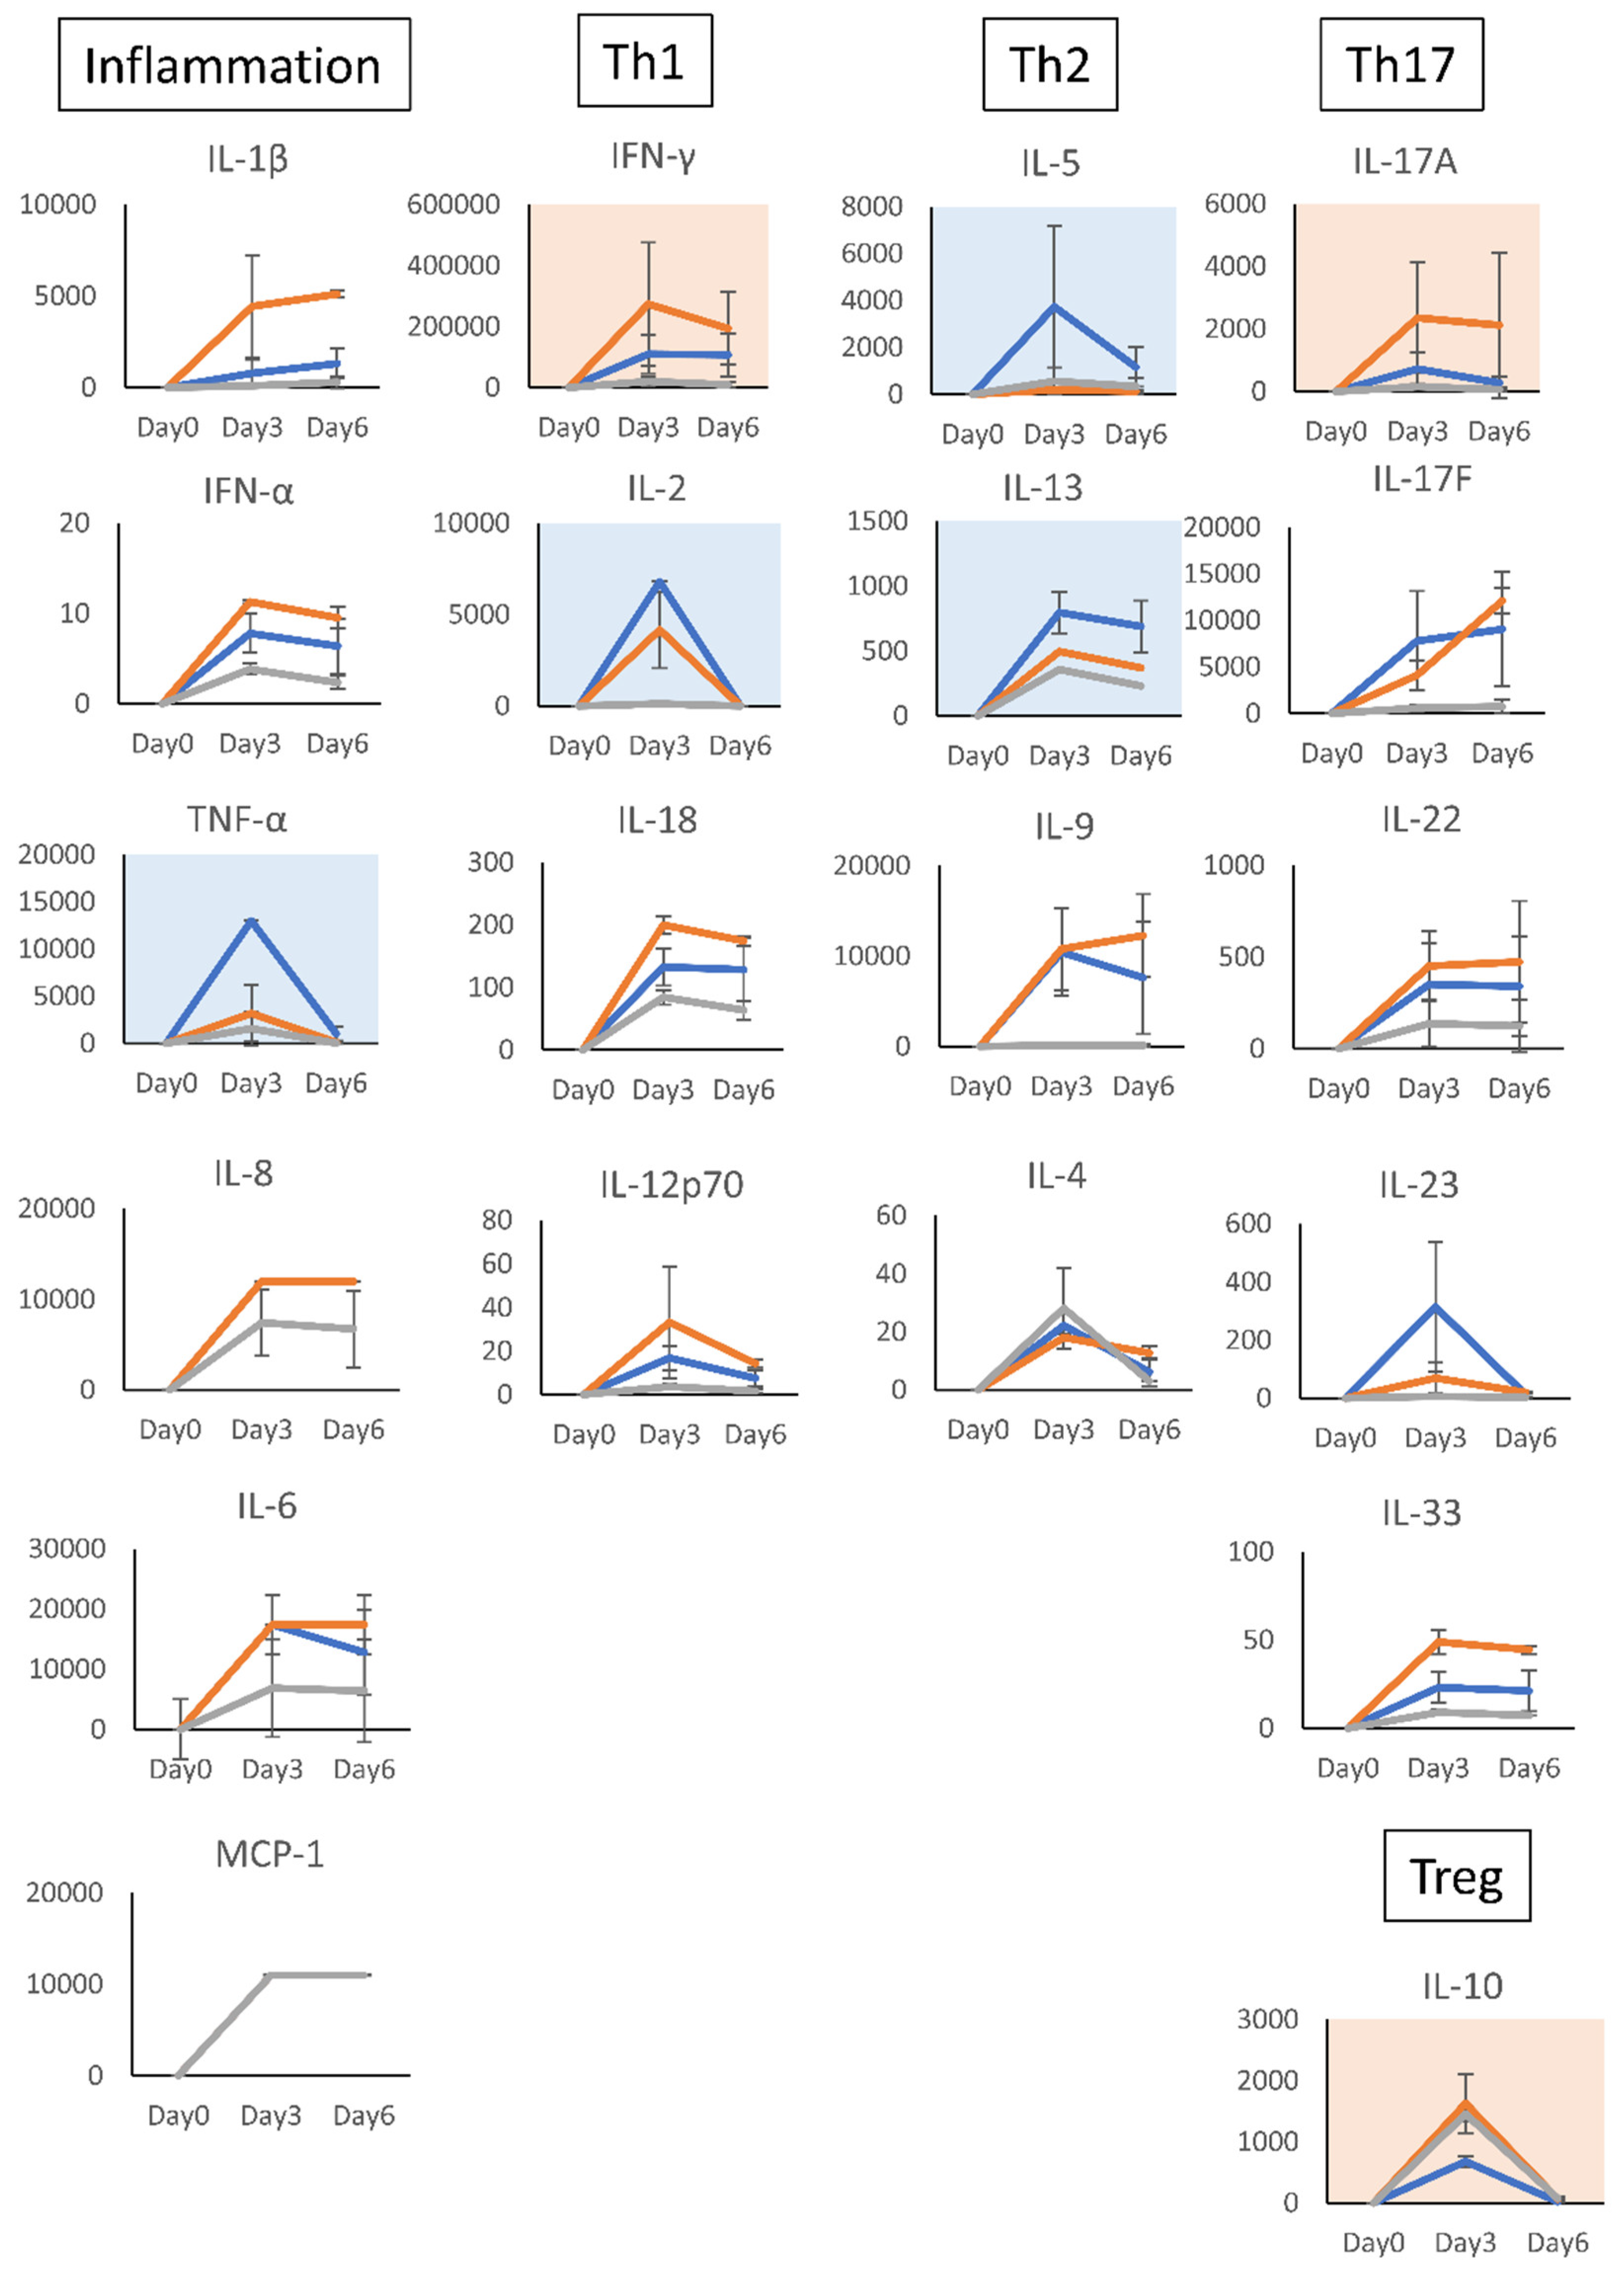
MT1 expression was transiently enhanced after TSST-1 stimulation, whereas
MT2 expression was downregulated. C-KJ (AS) enhanced
MT1 expression and maintained
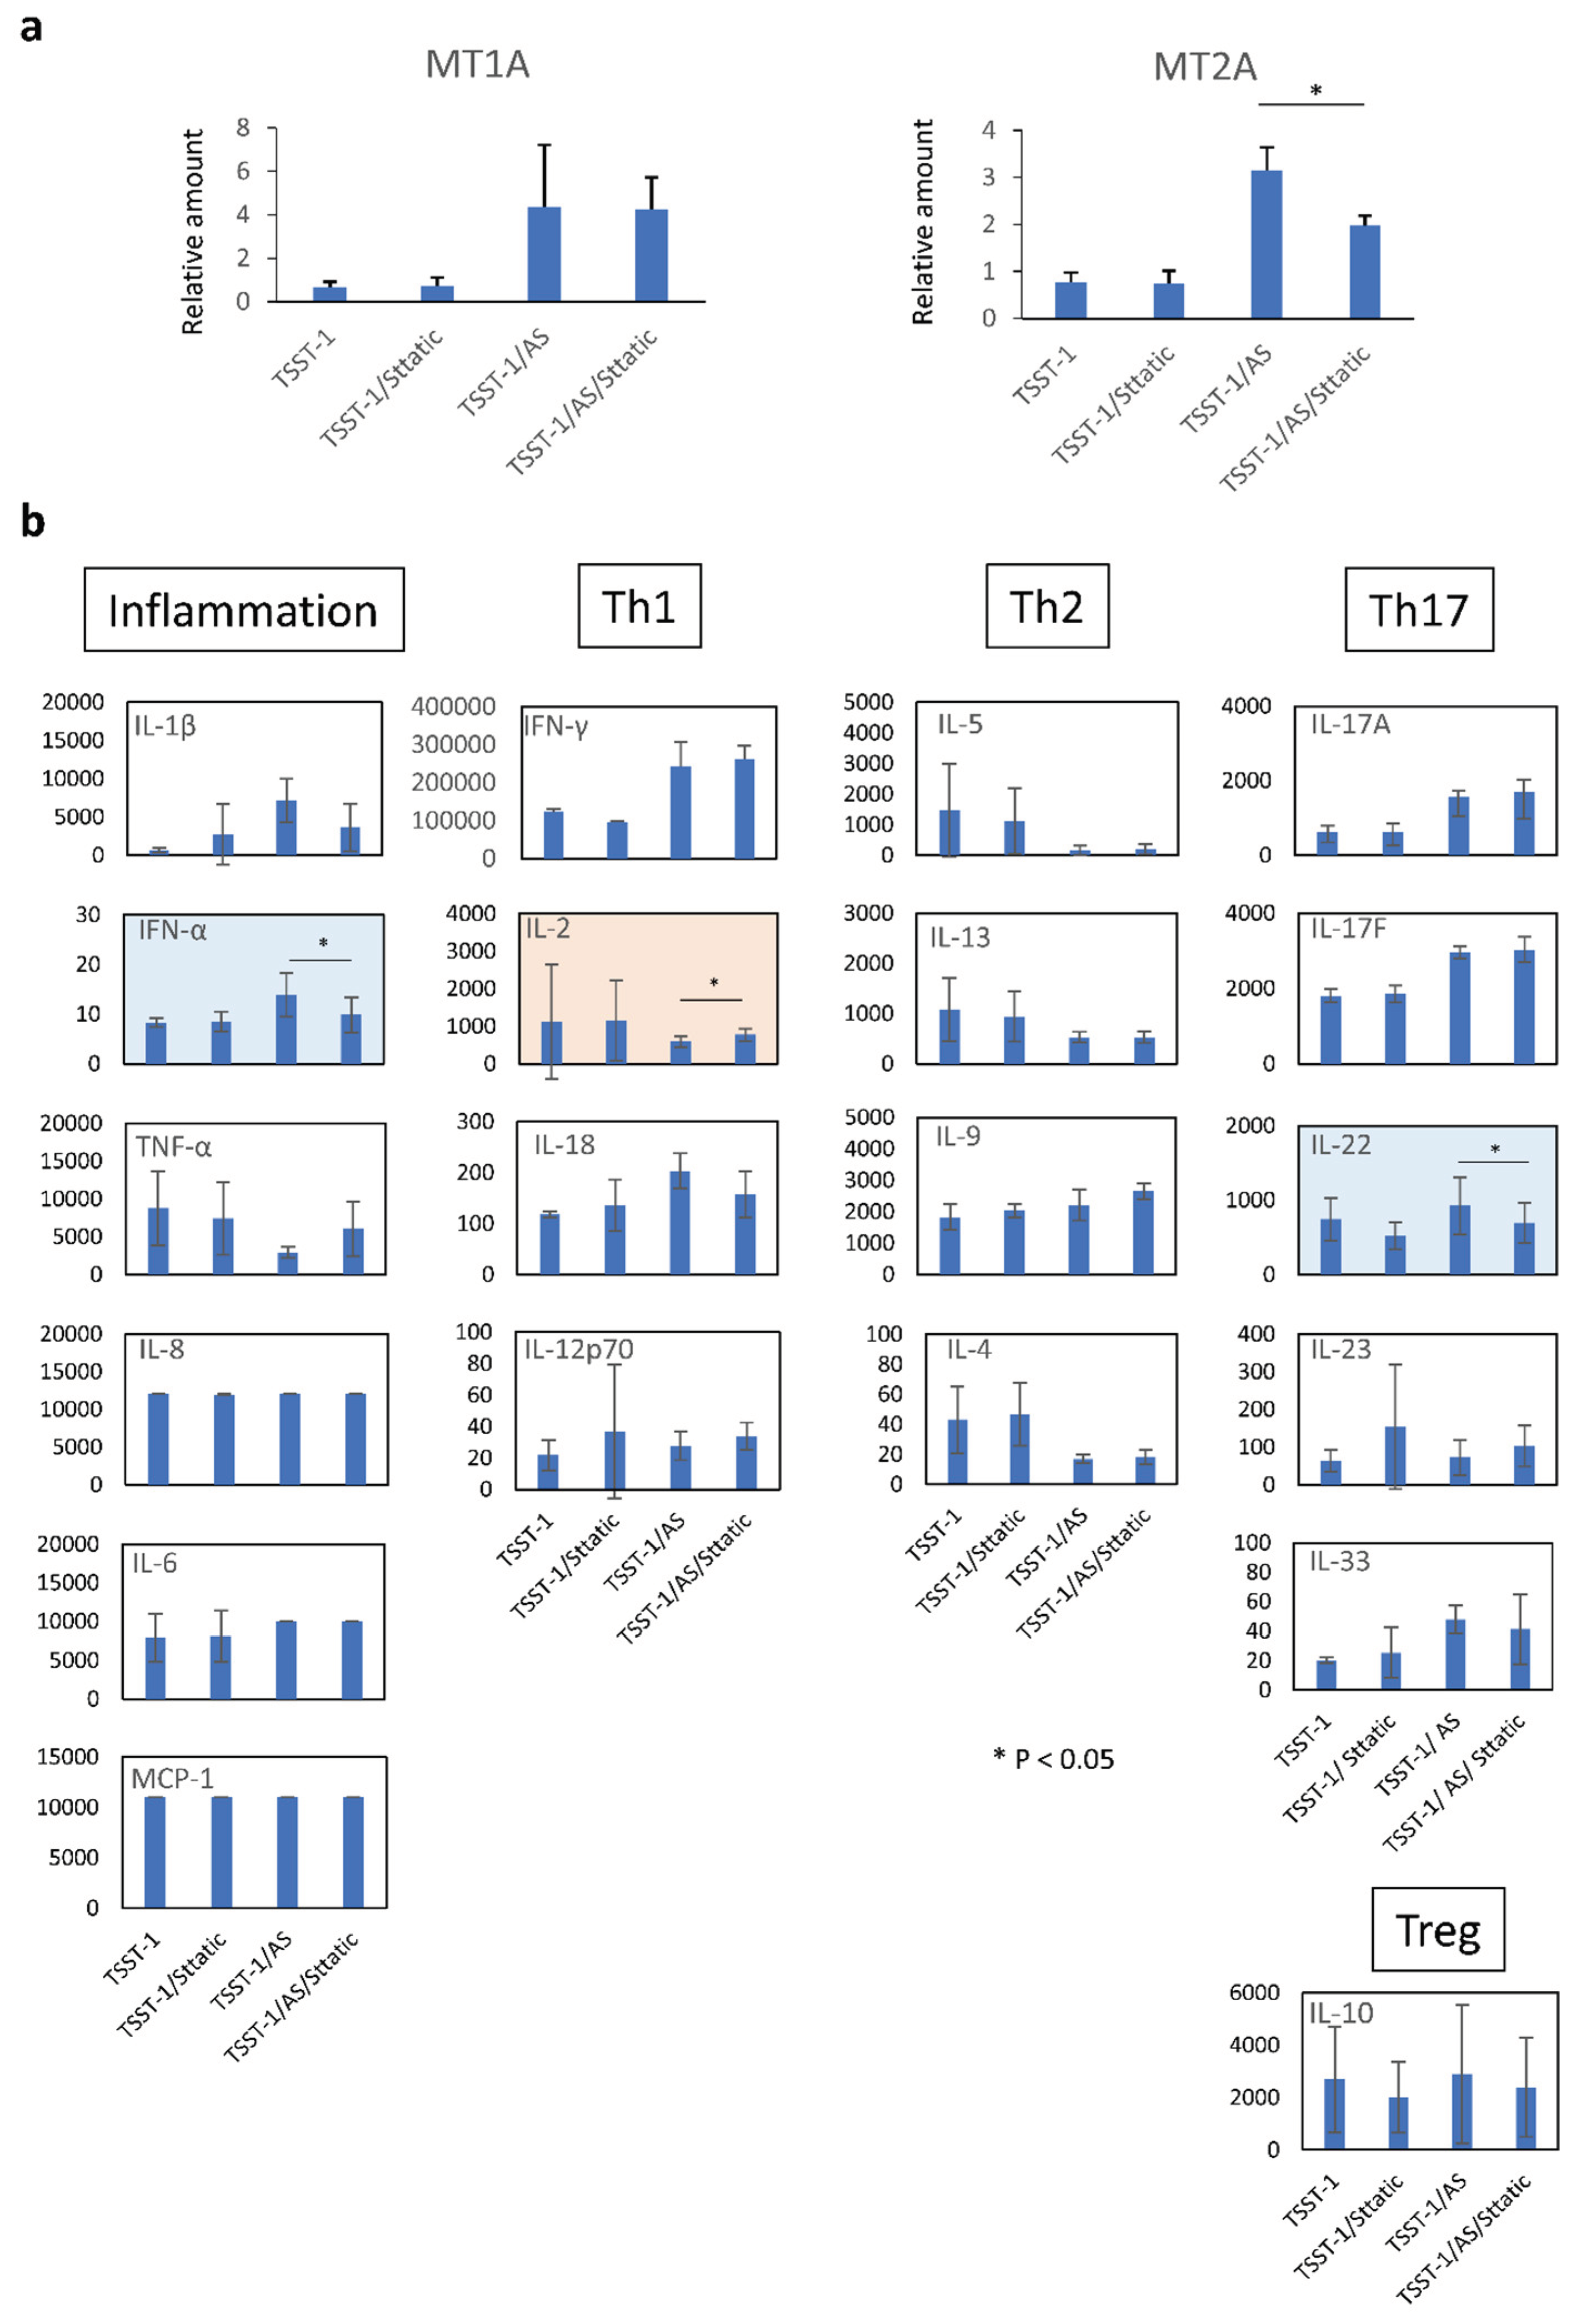
MT2A expression. Moreover,
MT2A expression was partially affected by STAT-3, which enhanced IL-17 expression, indicating that
MT2A expression was induced in conjunction with an IL-17-related inflammatory response. However, this finding contradicts those of previous studies demonstrating that IL-17 expression is suppressed by MTs [
28,
43]. Moreover, the response is not equivalent to the immune suppression caused by zinc itself, which specifically suppresses Th2 cytokines and increases Th1 cytokines [
20]. Similarly, it does not align with the response to COR, as both MT1 and MT2A expression decreased under COR treatment. Moreover, KEGG pathway analysis revealed more prominent immune-related gene expression in the (P) treatment group, suggesting that the (P) fraction involves more immune modification factors. Because the (P) and (AS) fractions were dialyzed and almost all free metal ions were speculated to be depleted, the zinc and copper ions detected in these fractions suggested their existence as glycosides or metal-binding proteins. Together, these findings suggest that the effect of the C-KJ component is likely induced by zinc or copper-related glycoside or the derivative(s).
Because of this complexity, the relationship between the enhanced immune response, specifically cytokine production, and MT or zinc remains elusive. However, inflammatory cytokines have been shown to induce the upregulation of ZIP-8, a zinc-importer, and the uptake of zinc enhances IL-6 production, suggesting a feedback loop between inflammation and zinc uptake [
44]. Because C-KJ involves zinc, the increased zinc uptake could potentially induce or maintain MT expression in T cells, which, in turn, might further enhance IL-17 or IL-22 production through elevated IL-6 levels. However, inflammation induced by C-KJ components may lead to concurrent zinc uptake and MT expression, or the unique cytokine profile associated with inflammation may contribute to enhanced MT expression. A comprehensive analysis is imperative to elucidate the mechanism underlying the C-KJ components.
While our study provides valuable insights, it is crucial to acknowledge its limitations. Our focus was on the fractionated components of C-KJ, highlighting the need for further study to purify and identify the active principles of these extracts. Additionally, it is essential to conduct further investigations using in vivo models to validate and extend our findings.
Figure 1.
Effect of the protein and sugar sub-fractions of C-KJ on the T cell differentiation. (a) CD3 expression (histograms) and CD45RA/CD62L expression on CD3+ T cells (quadrants). TSST-1, TSST-1 treatment; TSST-1 (CE), TSST-1 + crude extract; TSST-1 (P); TSST-1 + protein fraction; TSST-1 (S), TSST-1 + sugar fraction; TSST-1(Int), TSST-1 + intermediate molecular fraction. The percentages of CD3+ and CD45RA/CD62L + (DP) cells are shown; (b) The same expression in the T cells stimulated with partially purified C-KJ components. TSST-1 (AS); TSST-1 + acidic sugar fraction, TSST-1 (NS); TSST-1 + neutral sugar fraction, TSST-1 (BS) TSST-1 + basic sugar fraction. TSST-1, the percentages of CD3+ and CD45RA/CD62L + cells are shown. The number of DP positive cells (c); CD95 (d); CD45RO (e); CCR7 (f); and CD127 (g). Open bars, small lymphocyte-gated cells; Closed bars, large lymphocyte-gated cells. n = 3. mean ± standard deviation (SD) is shown. No significant change was observed among the fractions.
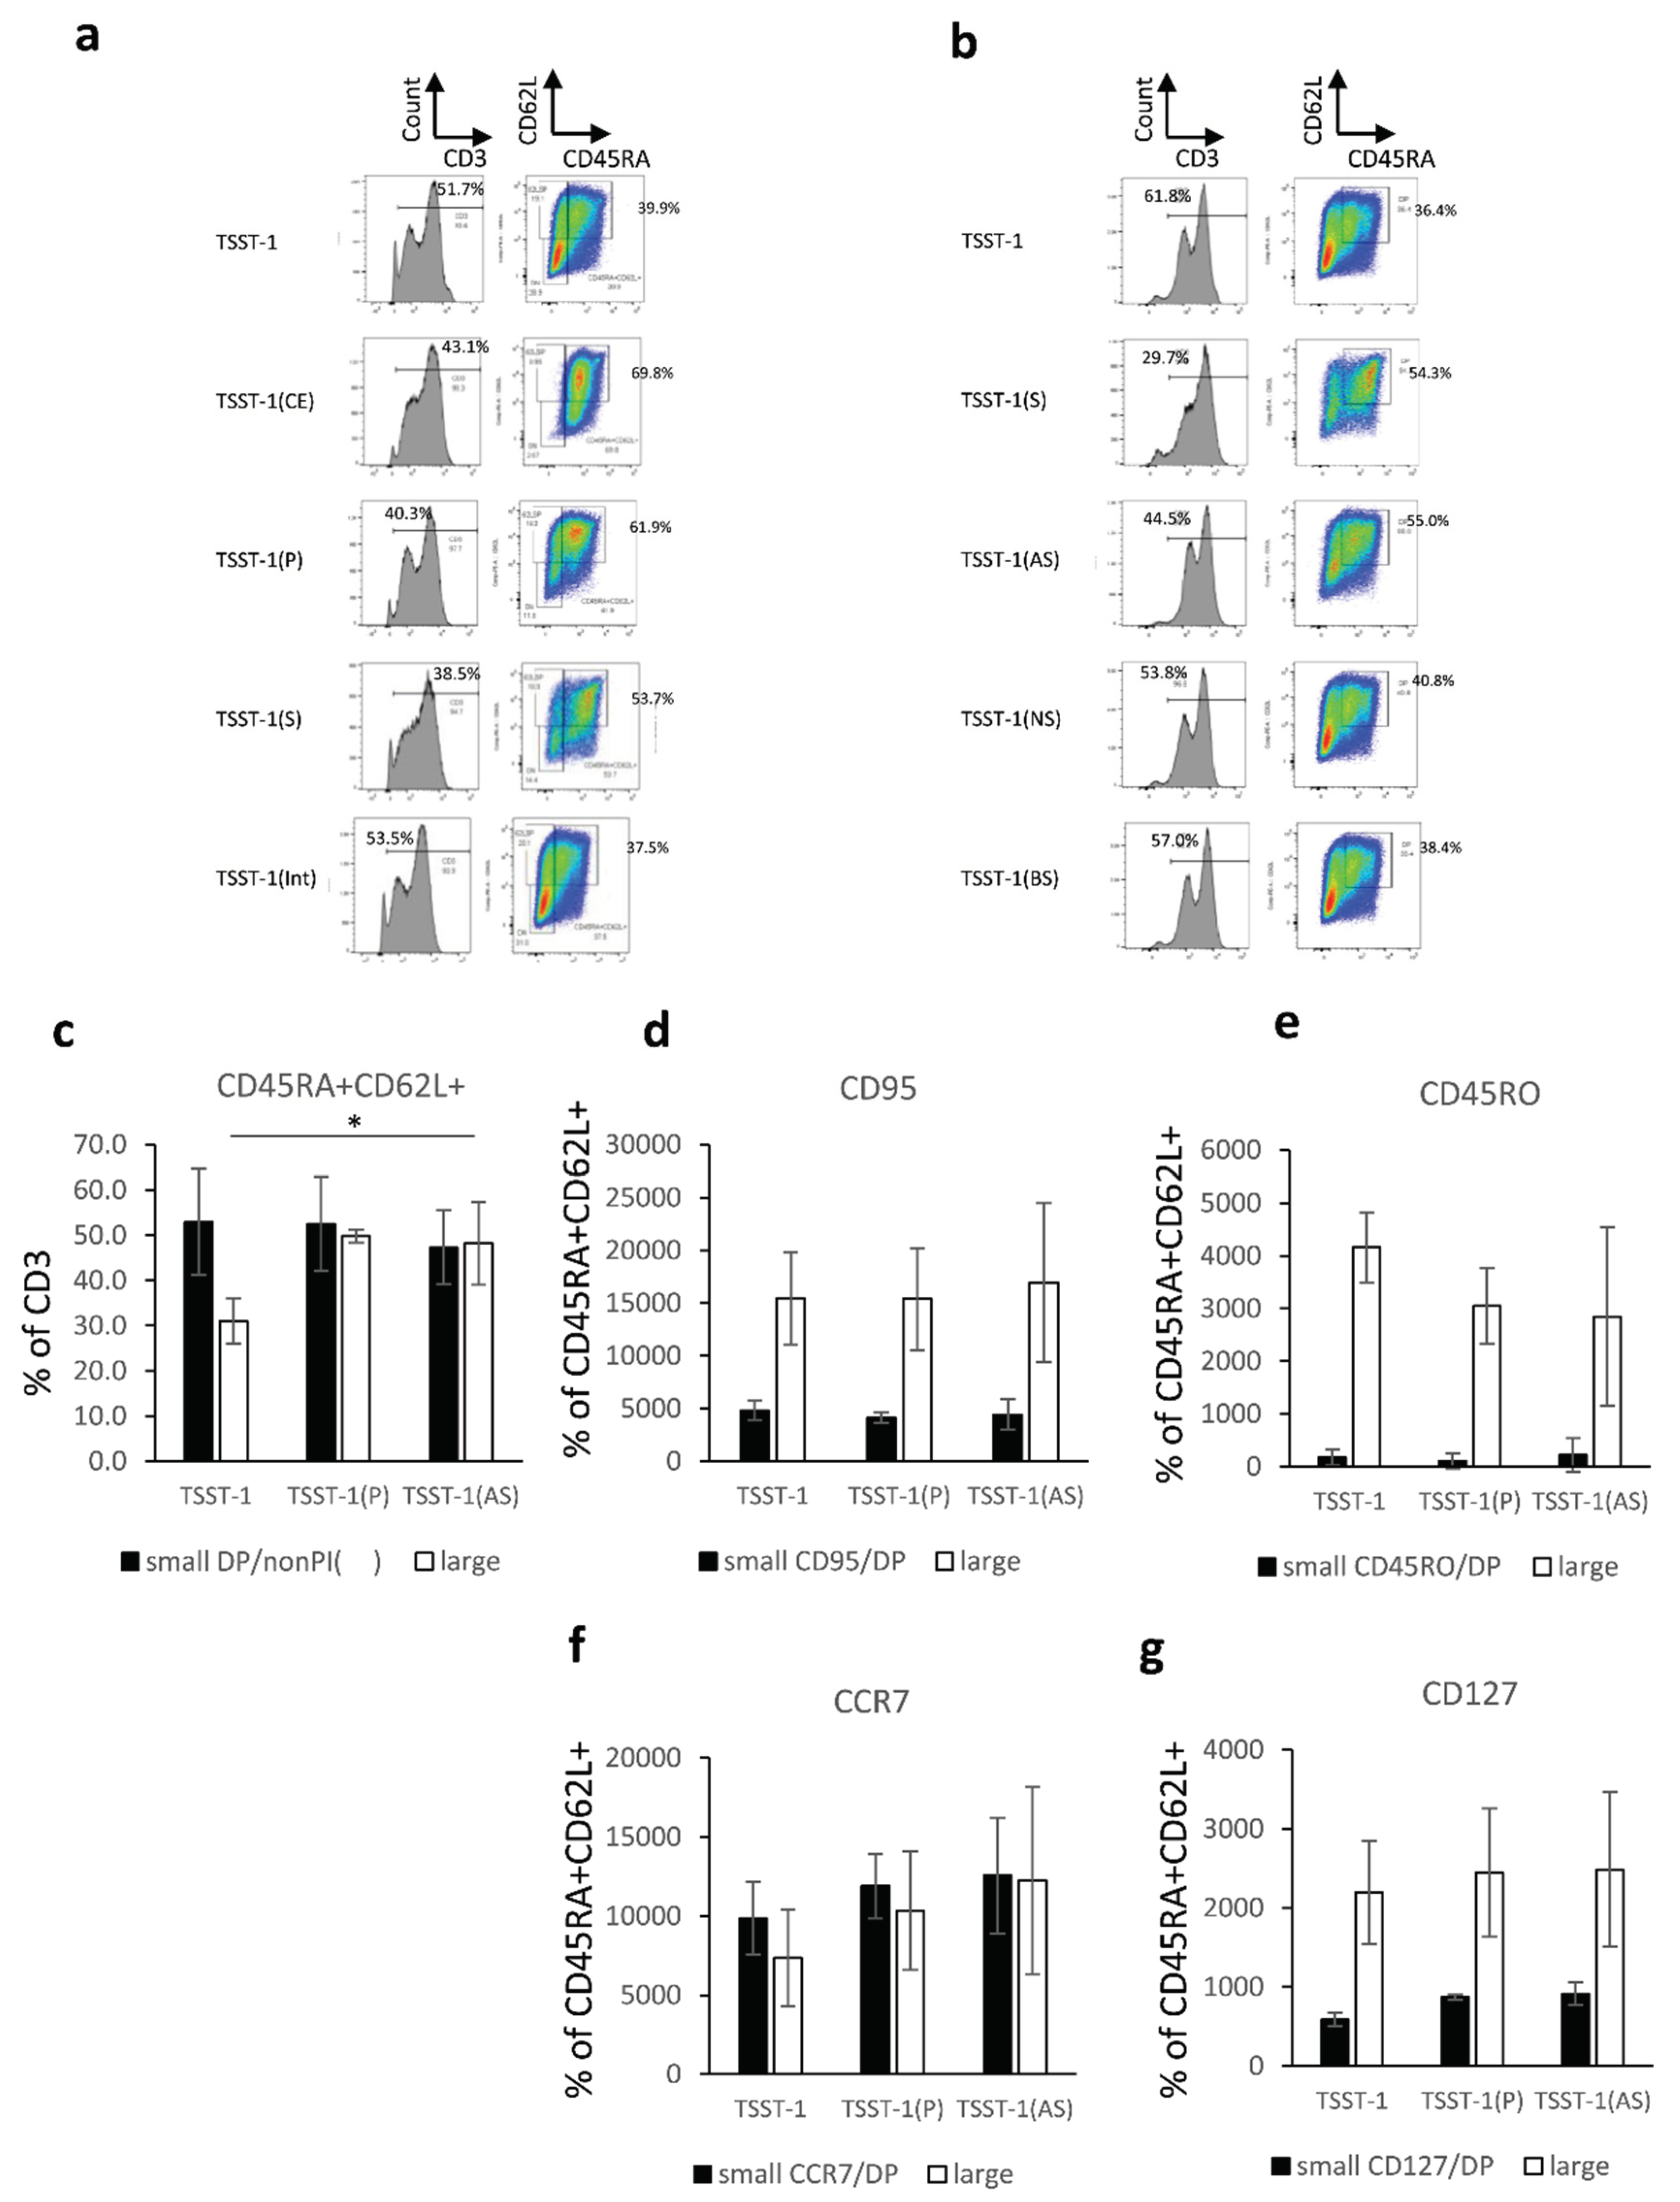
Figure 2.
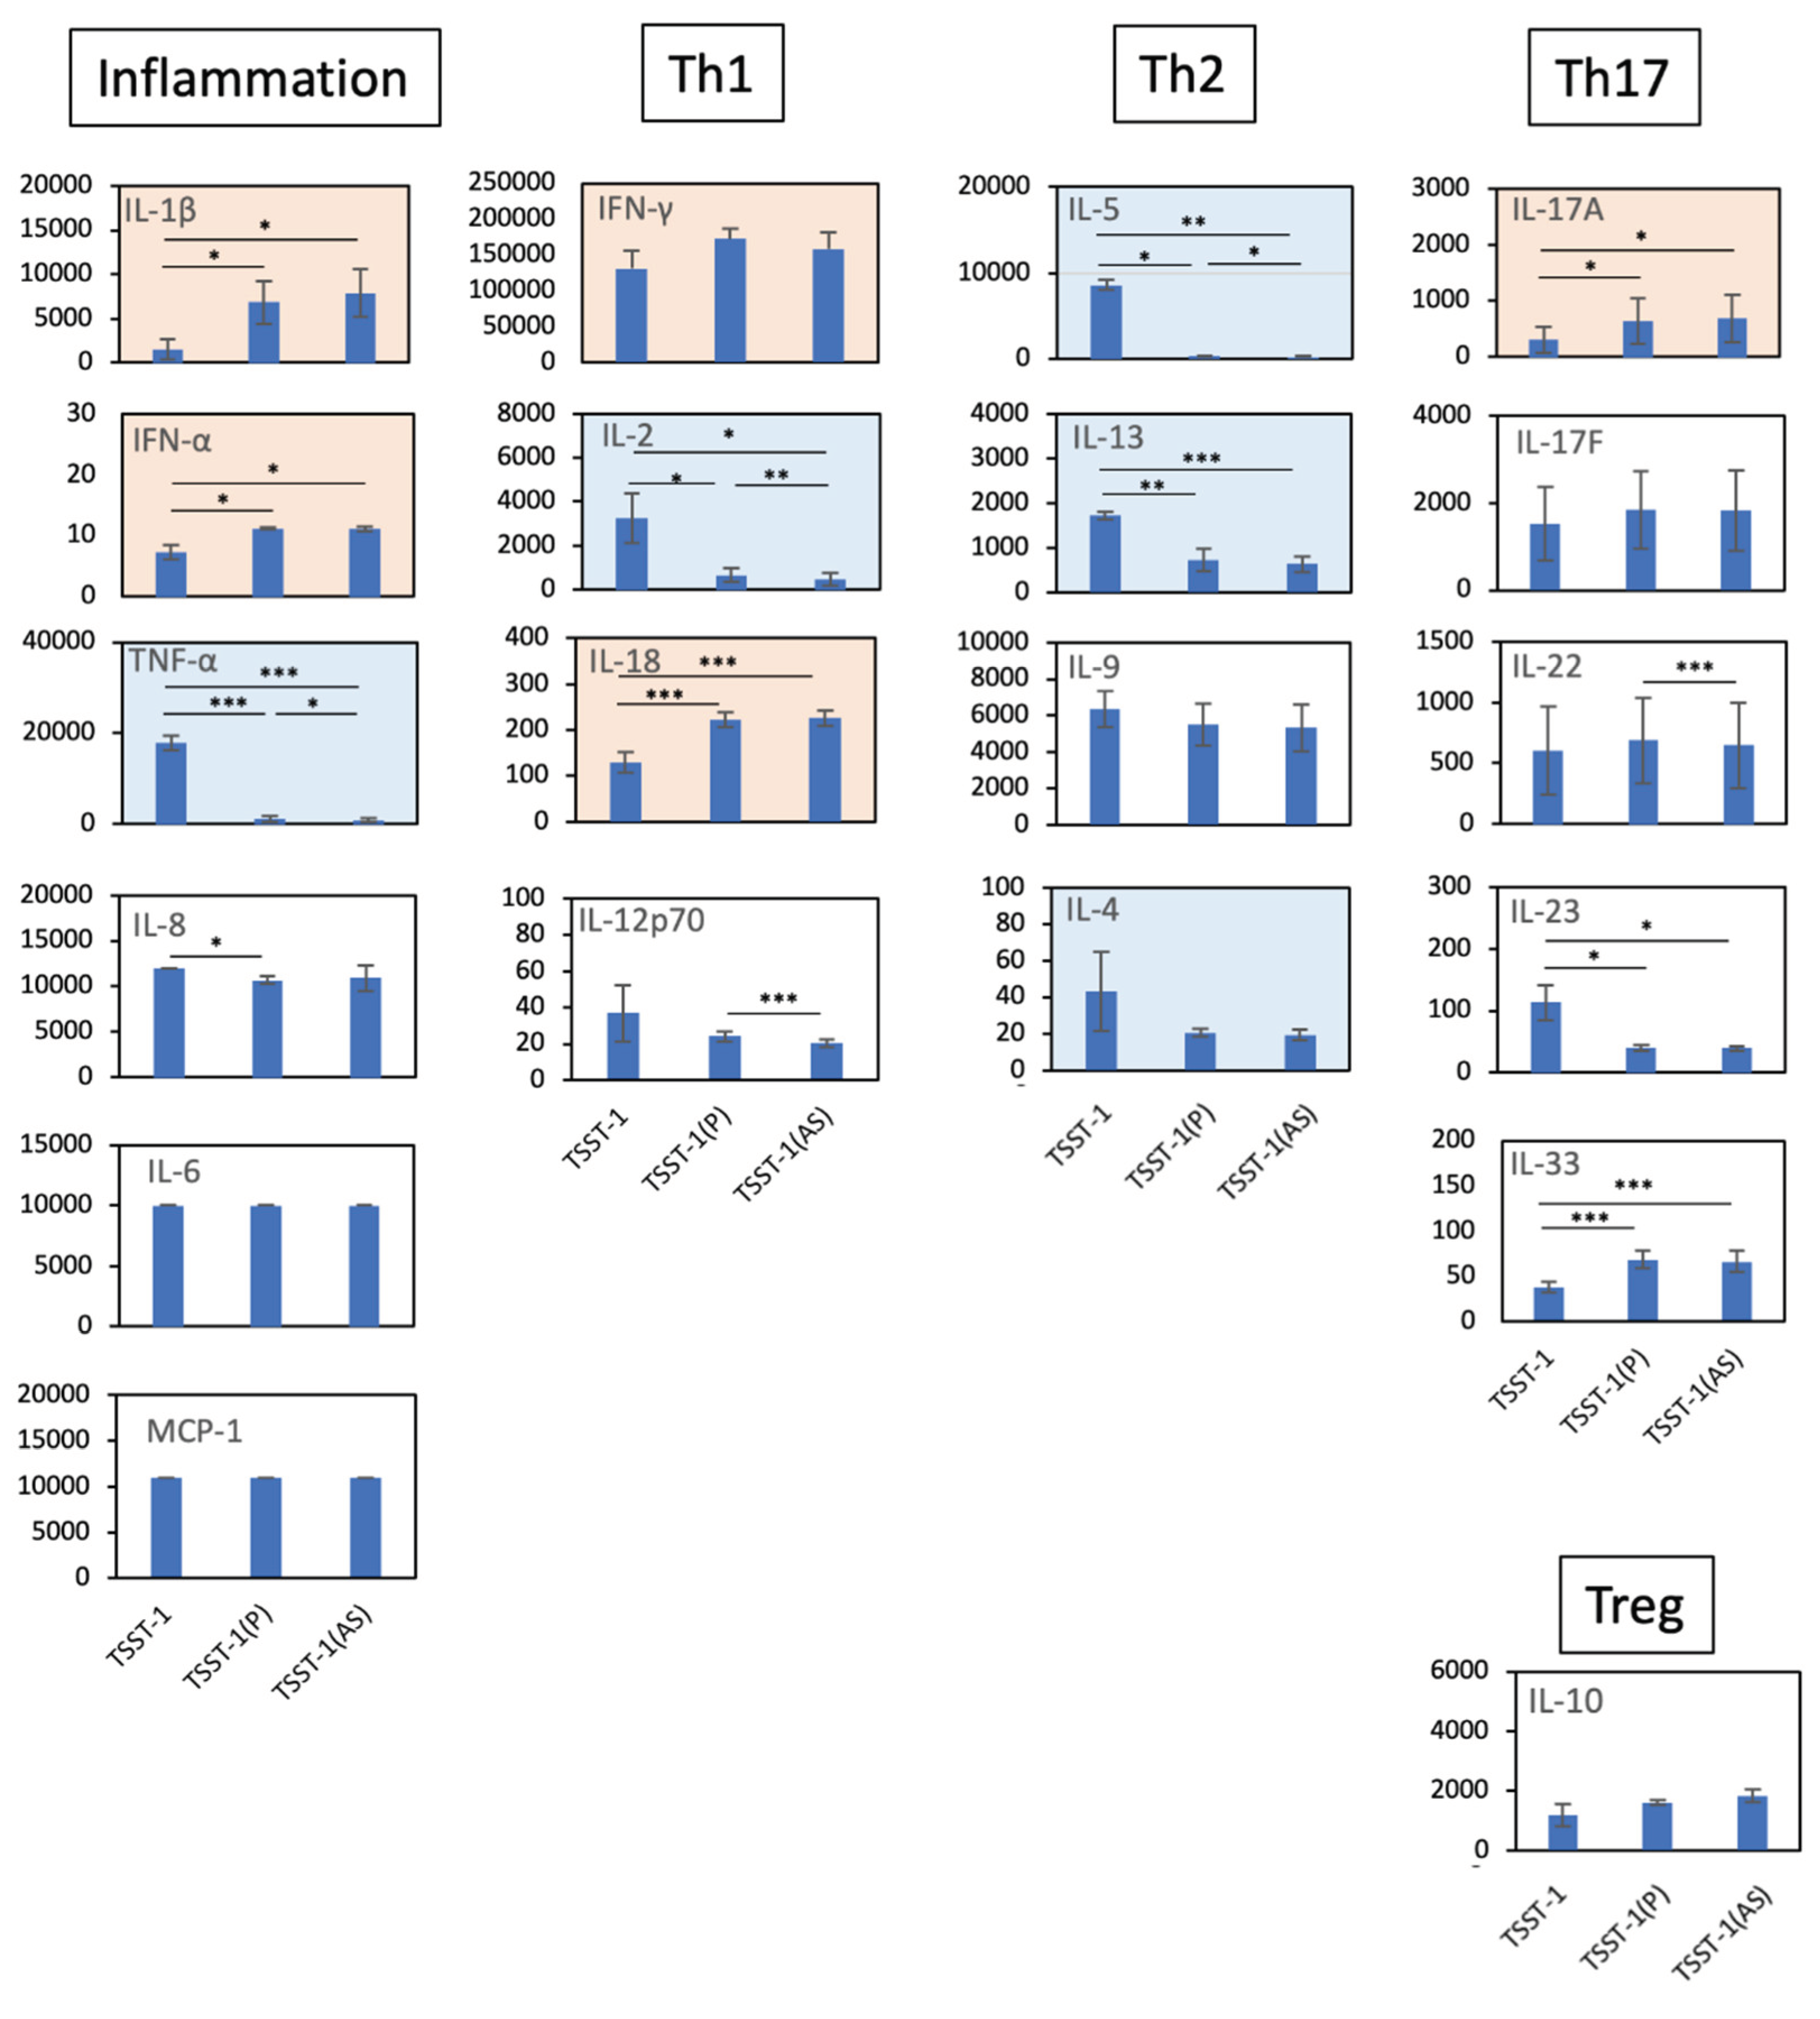
Effect of the TSST-1 (P) and TSST-1 (AS) of C-KJ on the cytokine production of human PBMCs. Cytokine levels in the supernatants of TSST-1-stimulated PBMC in the presence of C-KJ components were measured using a LEGENDplex multi-channel cytokine evaluation kit. Inflammation; inflammation-related cytokines TNF-α and IL-6. Th1, Th1 cytokines IFN-γ and IL-2; Th2, Th2 cytokines IL-5, IL-13, IL-9, and IL-4; Th17, Th17 cytokines IL-17A, IL-17F, and IL-22; Treg, Treg cytokines IL-10. Pink panels, upregulated cytokines; blue panels, downregulated cytokines. n = 3. Data show mean ± SD. * p < 0.05, ** p < 0. 01, ** p < 0. 001.
Figure 3.
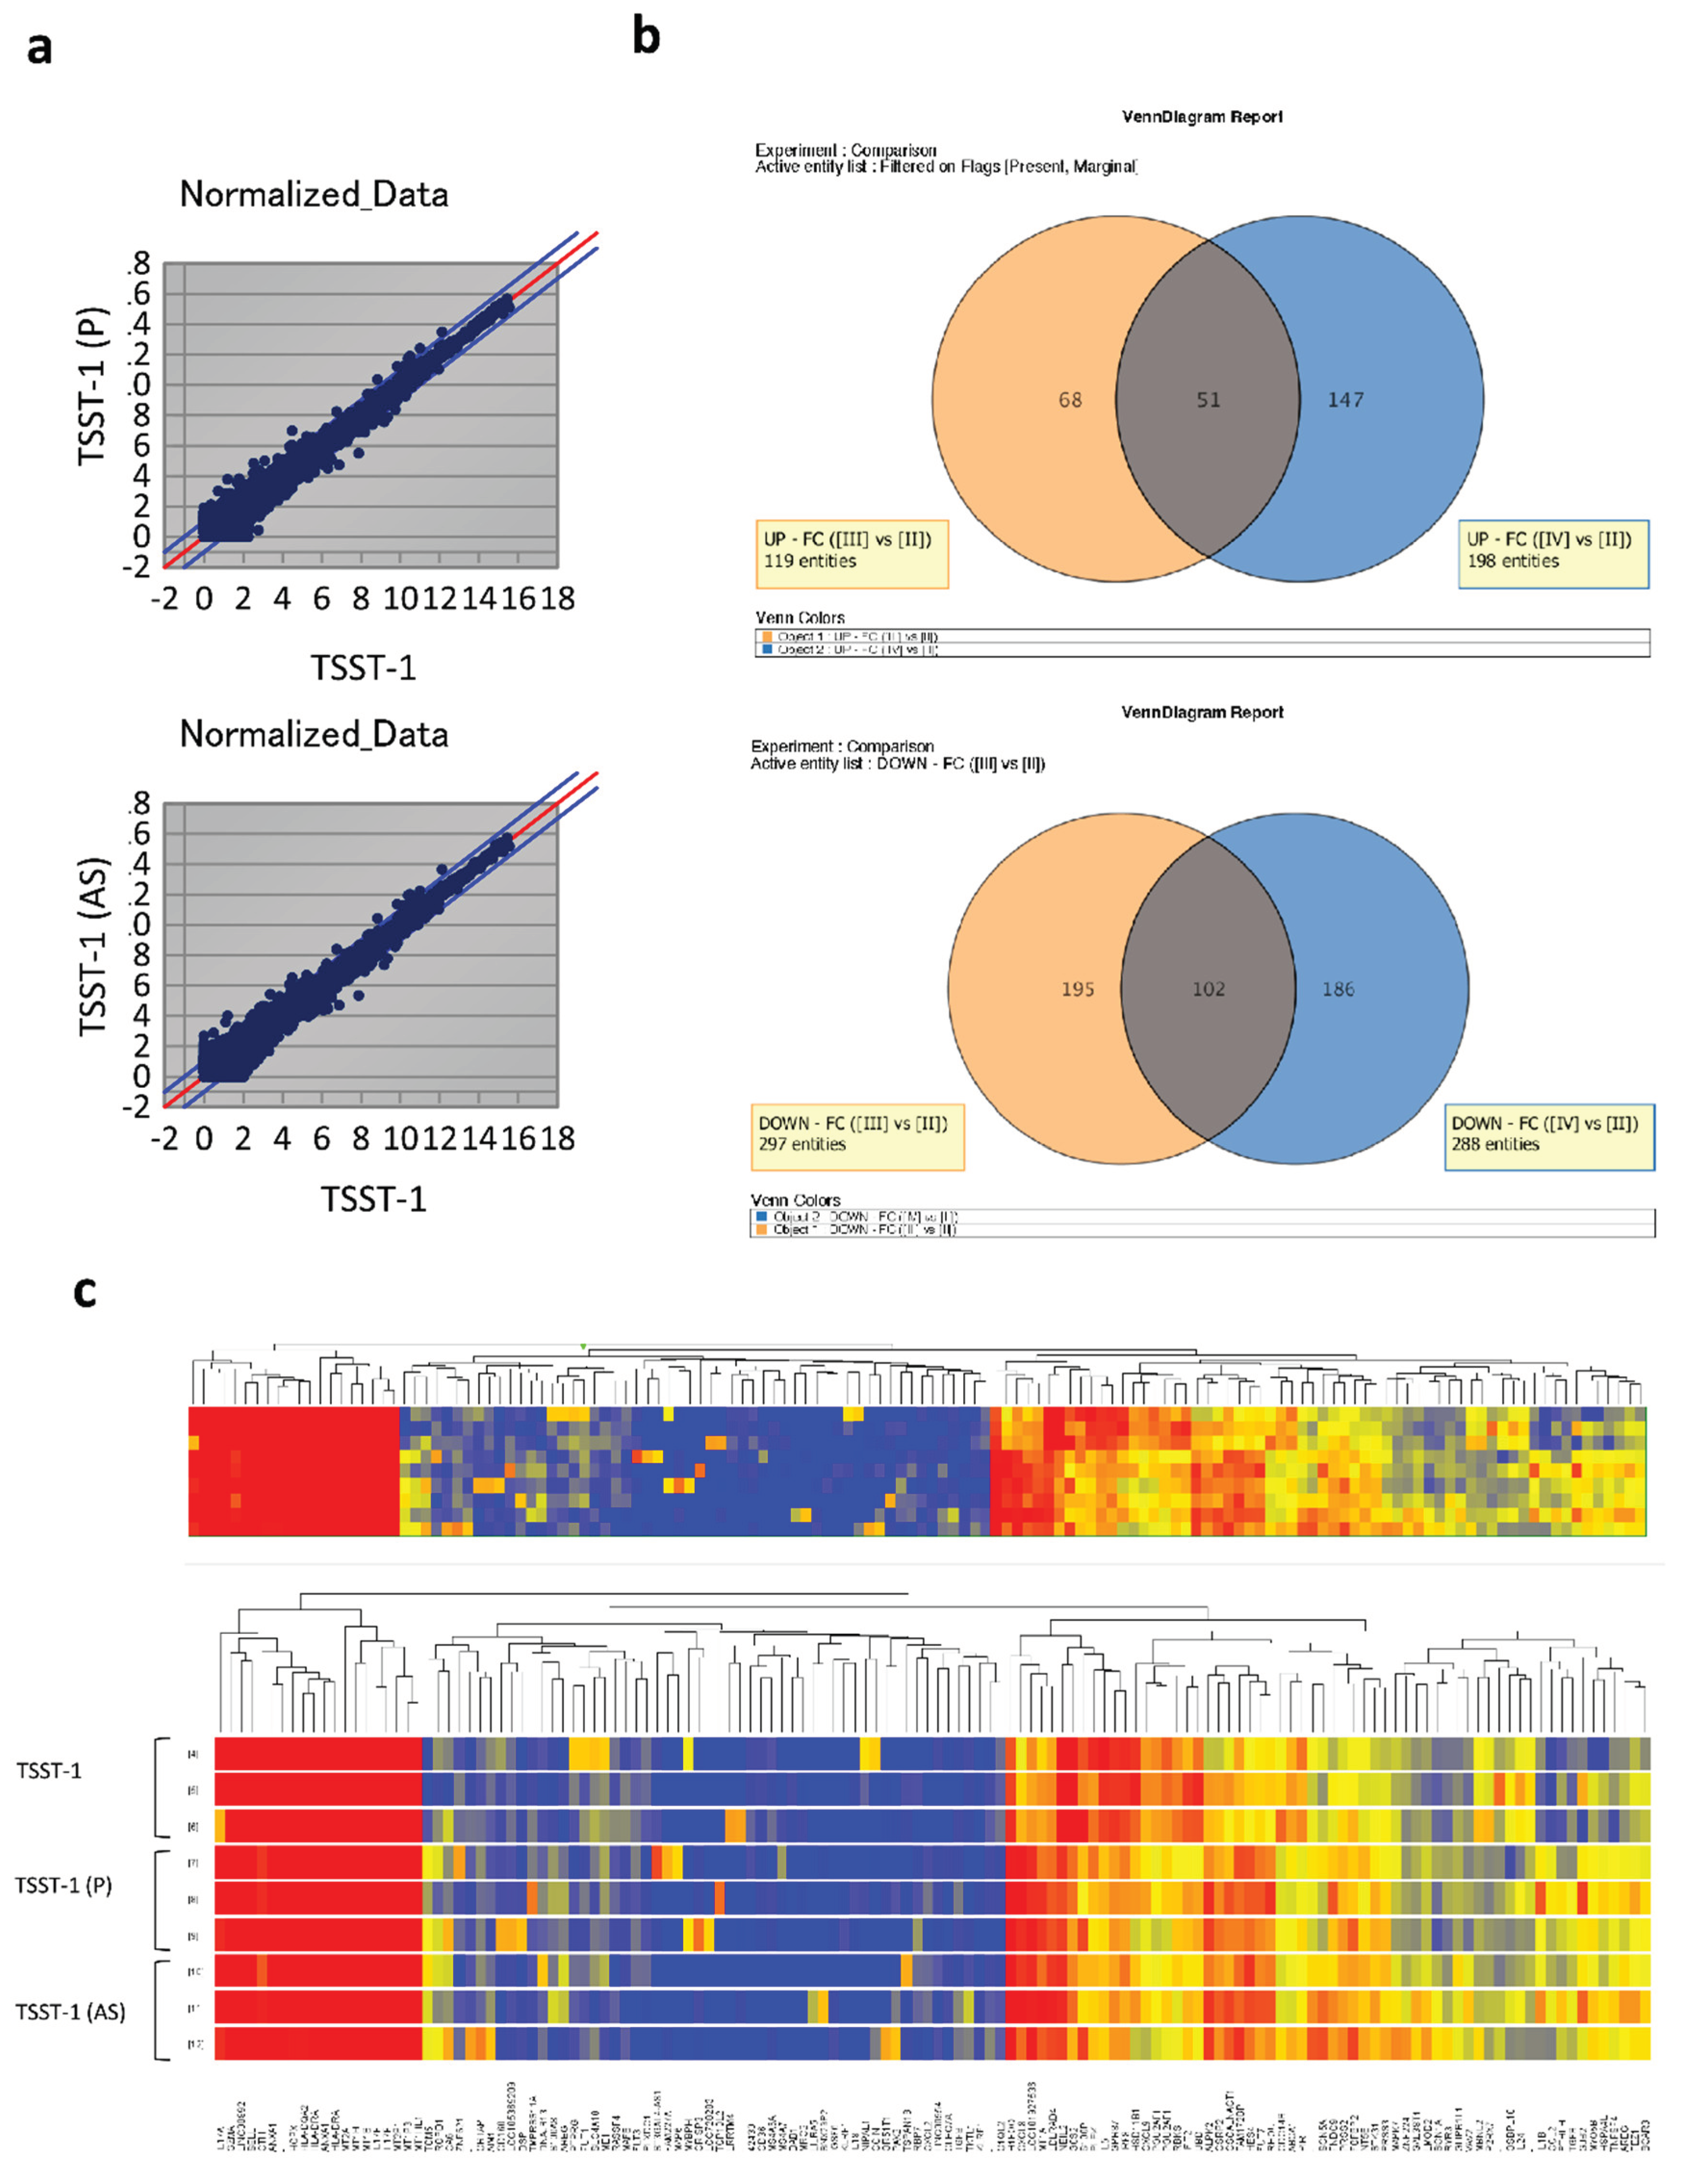
Analysis of differentially expressed genes (DEGs) based on the datasets obtained from TSST-1, TSST-1 (P) and TSST-1 (AS) T cells. The microarray analysis data (n = 3). (a) MA plots of TSST-1 vs. TSST-1 (P) (upper panel) and TSST-1 vs. TSST-1 (AS) (lower panel); (b) Venn diagram of increased DEGs of TSST-1 (P) (Orange) and TSST-1 (AS) (Blue) (upper panel) and decreased DEGs (lower panel); (c) Hierarchical clustered heatmap of TSST-1 (upper three columns), TSST-1 (P) (middle three columns), and TSST-1 (AS) (lower three columns).
Figure 4.
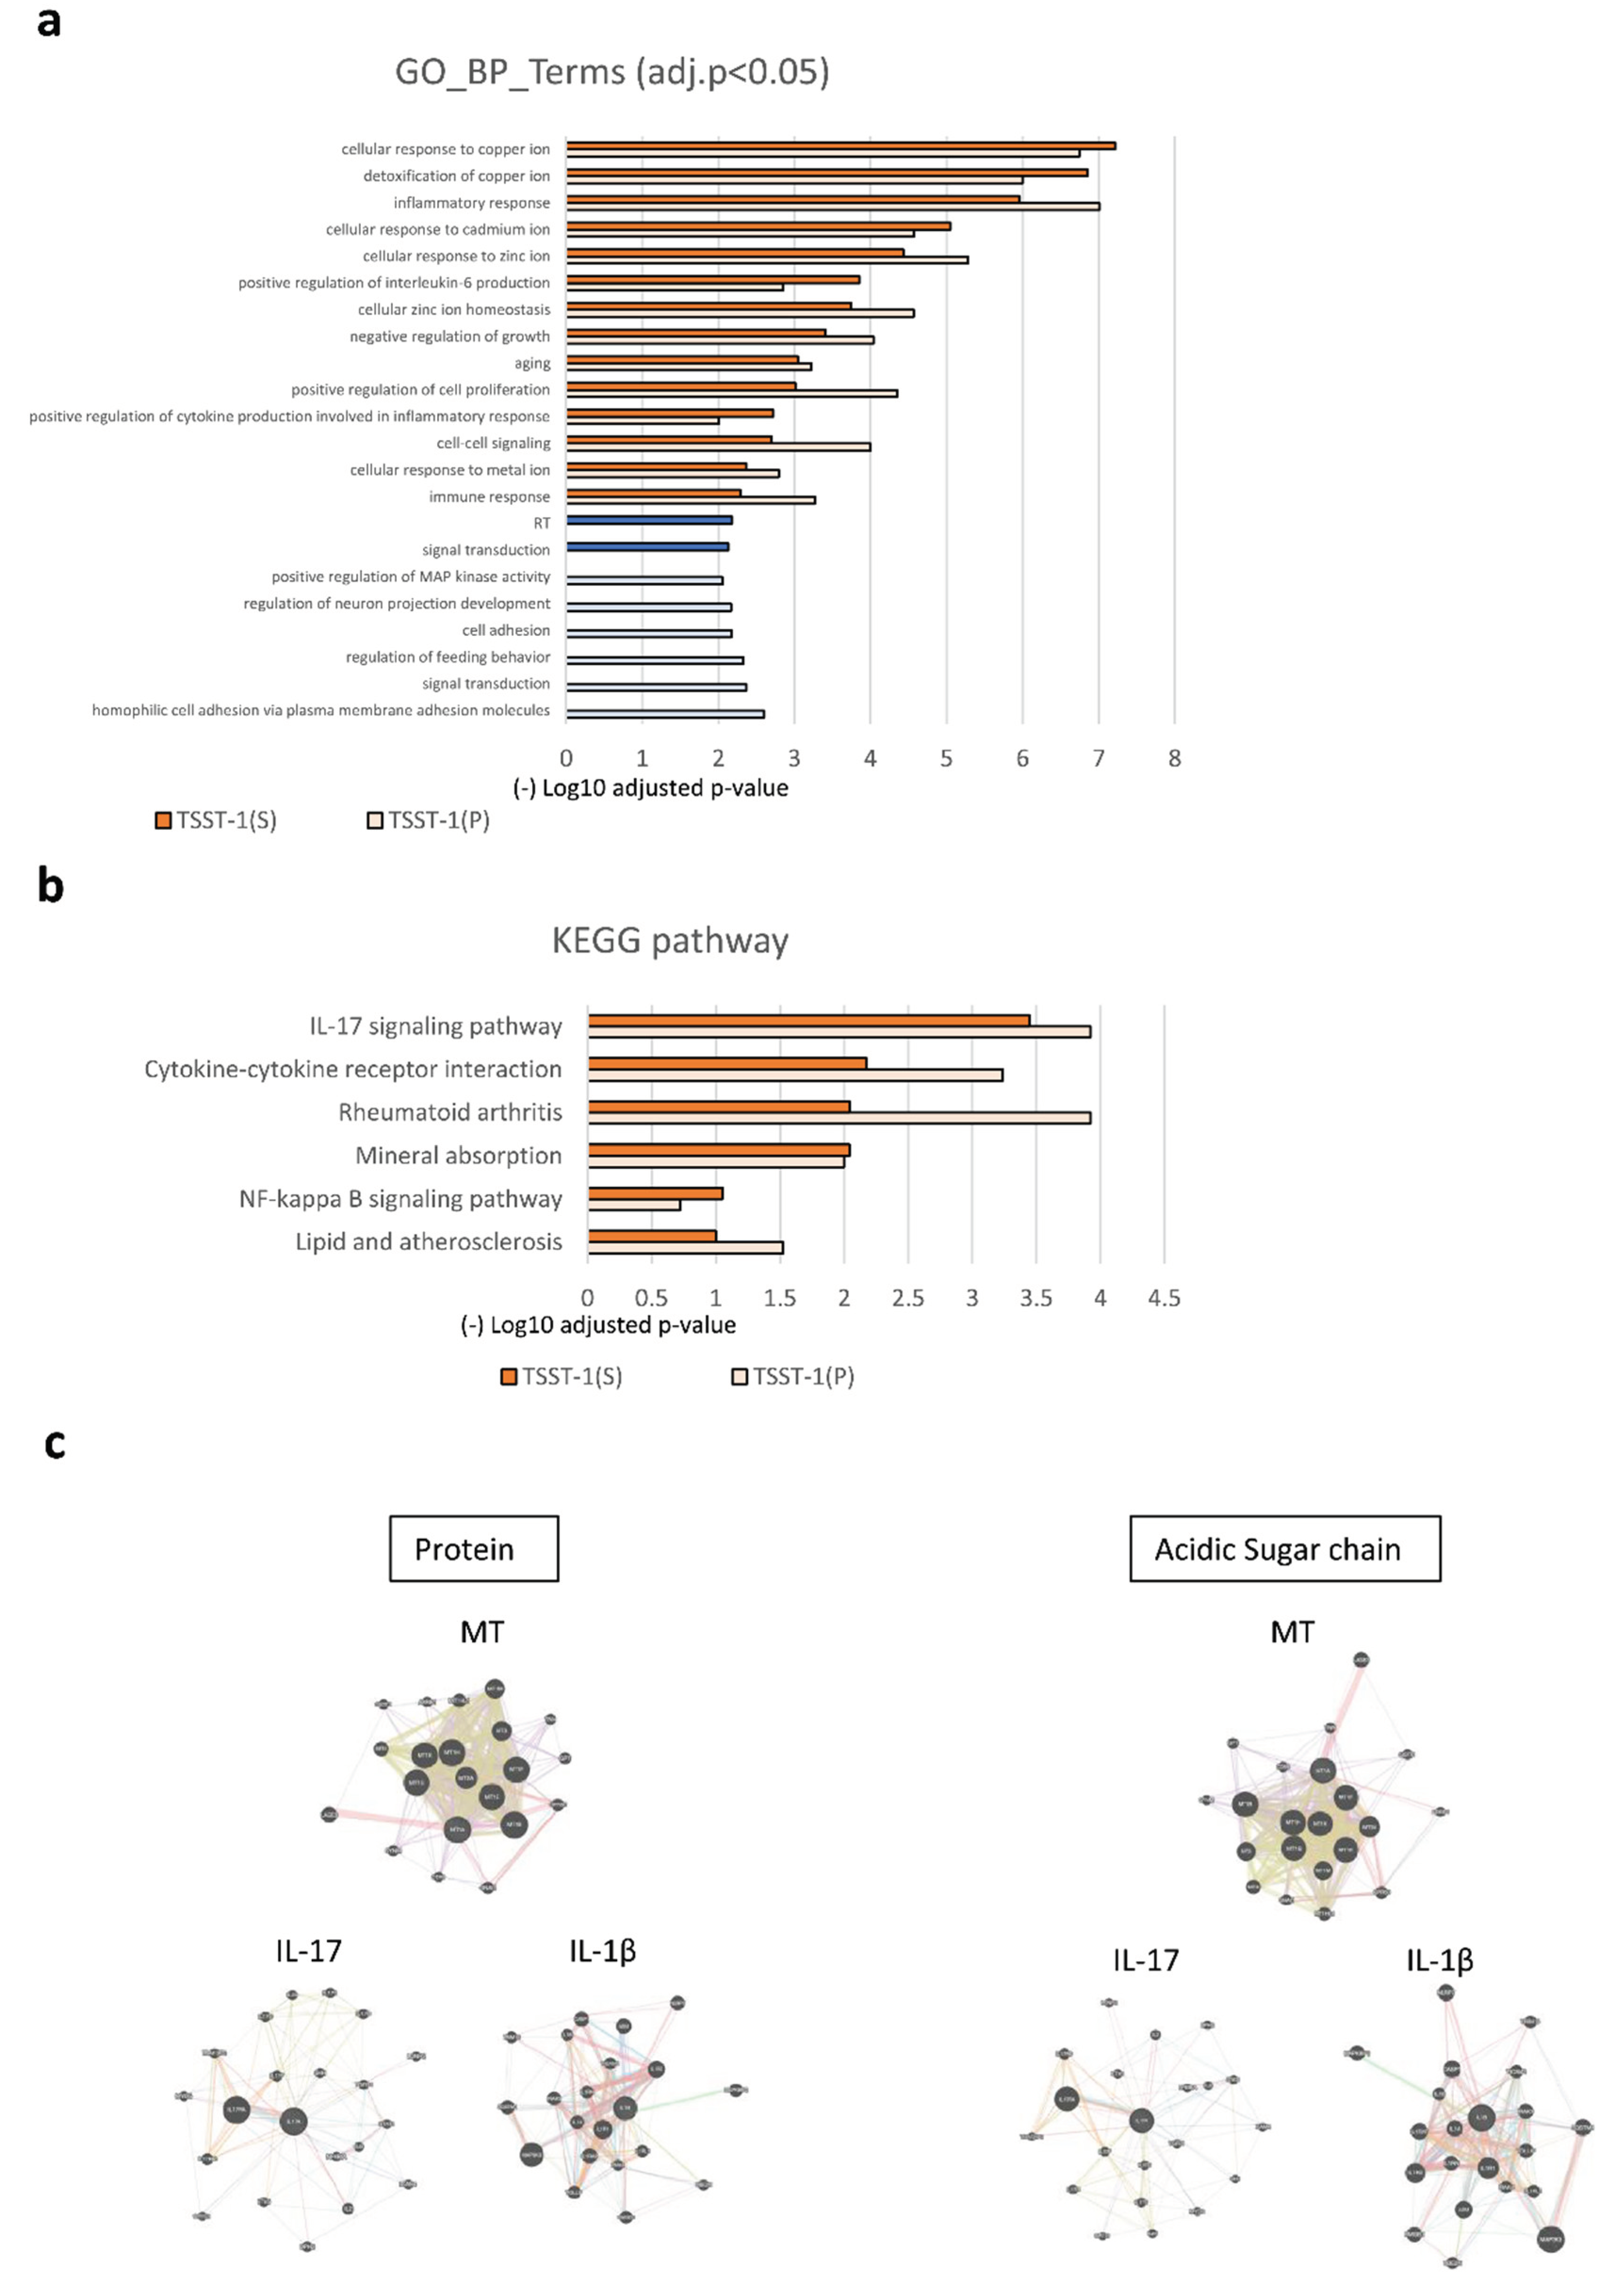
GO, KEGG, and Protein–Protein Interaction Networks analyses of DEGs. (a–c) GO (a); KEGG pathway analysis (b); and protein–protein Interaction analyses (c). In (a) and (b), the upregulated pathway is shown in orange, and the downregulated pathway is shown in blue [dark; TSST-1 (AS), pale; TSST-1 (P)]. (-) log10 adjusted p-values are shown. The results of the protein–protein interaction network analysis of TSST-1 vs. TSST-1 (P) (left panels) and TSST-1 vs. TSST-1 (AS) (right panels) are shown in (c). One prominent category is MT (upper panel), and the other is cytokines (lower panels). Two representative categories of IL-17 (lower left panel) and IL-1β (lower right panel) are shown.
Figure 5.
Effect of the TSST-1 (P) and TSST-1 (AS) of C-KJ on the metallothionein (MT) mRNA production of human PBMCs. Effect of the C-KJ fraction on (a) MT expression and (b) kinetics of MT expression. The real-time PCR results for MT1A (left panel) and MT2A (right panel) are shown. In (a), Vertical lines represent relative amounts of MT mRNA. In (b) Blue line, TSST-1; red line, TSST-1 (AS); gray line; (COR). The samples were obtained on days 0, 3, and 6, and the mRNA levels were analyzed; (n = 3). Data show mean ± SD; * p < 0.05 and ** means p < 0.01.
Figure 6.
Effect of the acidic sugar fractions of Coccomyxa extracts and cortisol on the cytokine production of human T cells. Cytokines in the supernatants of TSST-1-stimulated PBMC cultured in the presence of (AS) or COR for 0–6 days were measured using the LEGENDplex multi-channel cytokine evaluation kit. Inflammation means inflammation-related cytokines TNF-a and IL-6. Th1: Th1 cytokines, IFN-γ and IL-2; Th2: Th2 cytokines, IL-5, IL-13, IL-9, and IL-4; Th17: Th17 cytokines, IL-17A, IL-17F, and IL-22; Treg, Treg cytokines, IL-10. Pink panels, upregulated cytokines; blue panels, downregulated cytokines. n = 3; mean ± SD is shown. * p < 0.05, ** p < 0.001.
Figure 7.
Effect of the STAT-3 on MT expression and cytokine production of human T cells. The real-time PCR results for MT1A (left panel) and MT2A (right panel) are shown. Vertical lines represent relative amounts of MT mRNA. The cytokines in the supernatants of TSST-1-stimulated PBMC cultured in the presence of (AS) (a) and STAT-3 inhibitor, sttatic (b). Inflammation: inflammation-related cytokines, TNF-α and IL-6; Th1, Th1 cytokines, IFN-γ and IL-2; Th2: Th2 cytokines, IL-5, IL-13, IL-9, and IL-4; Th17; Th17 cytokines, IL-17A, IL-17F, and IL-22; Treg: Treg cytokines, IL-10. Pink panels, upregulated cytokines; blue panels, downregulated cytokines; n = 3; data show mean ± SD is shown; *p < 0.05.

