1. Introduction
Nitrogen, in the form of molecular dinitrogen, N
2, is the most abundant element on earth’s atmosphere. Its presence is vital for all living organisms since it plays a crucial role in photosynthesis [1-3]. Thus, biological dinitrogen fixation occurs in the most active nitrogenase metalloenzyme namely the FeMoco where under ambient conditions is converted to ammonia, NH
3 according to the following equation [4]:
The N2 reduction to NH3 process, described by (1), proceeds in eight subsequent steps/cycles in each of which, an e- and a proton are provided to the FeMoco-N2 adduct. The total of eight e- are provided by another nitrogenase protein, namely the nitrogenase reductase containing an [4Fe4S] cluster [5]. On the other hand, the eight protons are thought to be supplied from the aqueous environment or through homocitrate perhaps via α-H195 enzyme [6]. The protons are added after the addition of the e- in each of the eight sequential steps in order to neutralize the appearing charge [5].
Conversion of N
2 to NH
3 is of paramount importance not only for biological processes but also for industry as well. Large-scale industrial production of ammonia became a necessity since 19
th century due to the rapidly increasing demand for fertilizers. In the rise of 20
th century, the German chemist, Fritz Haber together with his assistant
Robert Le Rossignol devised a method for ammonia production in laboratory scale [7]. Later on, another German chemist, Carl Bosch of BASF, further developed this method for ammonia production to industrial-scale. The so called Haber-Bosch method revolutionized the production of synthetic ammonia and fertilizers leading to a rapid expansion of World population from 1.6 billion in the beginning of 20
th to today’s 8.1 billion. The Haber-Bosch method is still the main method for industrial ammonia production, considered as one of the most impactful invention thought to produce
bread from air [8]. Conversion of dinitrogen to ammonia by the Haber-Bosch method is described by the following equation [4]:
As can be seen from (2), production of ammonia with the Haber-Bosch method proceeds under harsh conditions of temperature and pressure being its major drawback. In addition, it is estimated that the energy consumption due to the worldwide use of the Haber-Bosch method, accounts for 1 – 2% of the annual global energy consumption [4]. It should be also noticed that the Haber-Bosch method leaves a high CO2 footprint accounting for the 2% of the total CO2 emissions worldwide [7,9].
Recognizing the drawbacks of the Haber-Bosch method, the scientific community before several decades ago, started a continuing effort up to day, to replace it by an alternative method which will proceed under ambient conditions. Various strategies have been proposed to achieve this goal. Along these lines, research is basically focused on three approaches namely the electrocatalysis, the photocatalysis and the biocatalysis [10]. Usually, these strategies involve transition metals either in the form of either transition metal complex (homogeneous catalysis) or in the form of nanoparticles (heterogeneous catalysis) [11]. The electrocatalytic methods [12,13] are very attractive since they thought of as producing the so called ‘green ammonia’ [14]. The later term refers to ammonia produced used fully renewable and carbon free methods and in this respect the electrochemical synthesis is suitable since the H2 needed is obtained from electrolysis avoiding other methods which leave high CO2 footprint. However, the electrocatalytic methods are still far from application in industrial large-scale NH3 production since they suffer from low yields of NH3 and Faradaic Efficiencies [15]. On the other hand, photocatalytic methods are advantageous due to use of light and photocatalyst to produce ammonia via a heterogeneous process but they also have some drawbacks e.g. low ammonia yields, low reduction power of the photo-generated e-, etc. [16]. Finally, the third strategy is the biological N2 reduction to NH3 [11]. The biological catalysts are enzymes i.e. nitrogenases used in electrochemical Nitrogen Reduction Reaction (NRR) [17].
Studies on dinitrogen fixation and activation by transition metal complexes constitute the overwhelming part in the field of ammonia synthesis [18-21]. The first dinitrogen complex [(H3N)5Ru(N2)]2+ was synthesized in 1965 by Allen et al., [22]. Since then, a great number of studies on this topic have appeared in the literature which were focused on two directions: a) Synthesis of biomimetic complexes mimicking nitrogenase [23] and b) various other mononuclear or polynuclear transition metal complexes for N2 functionalization [24,25].
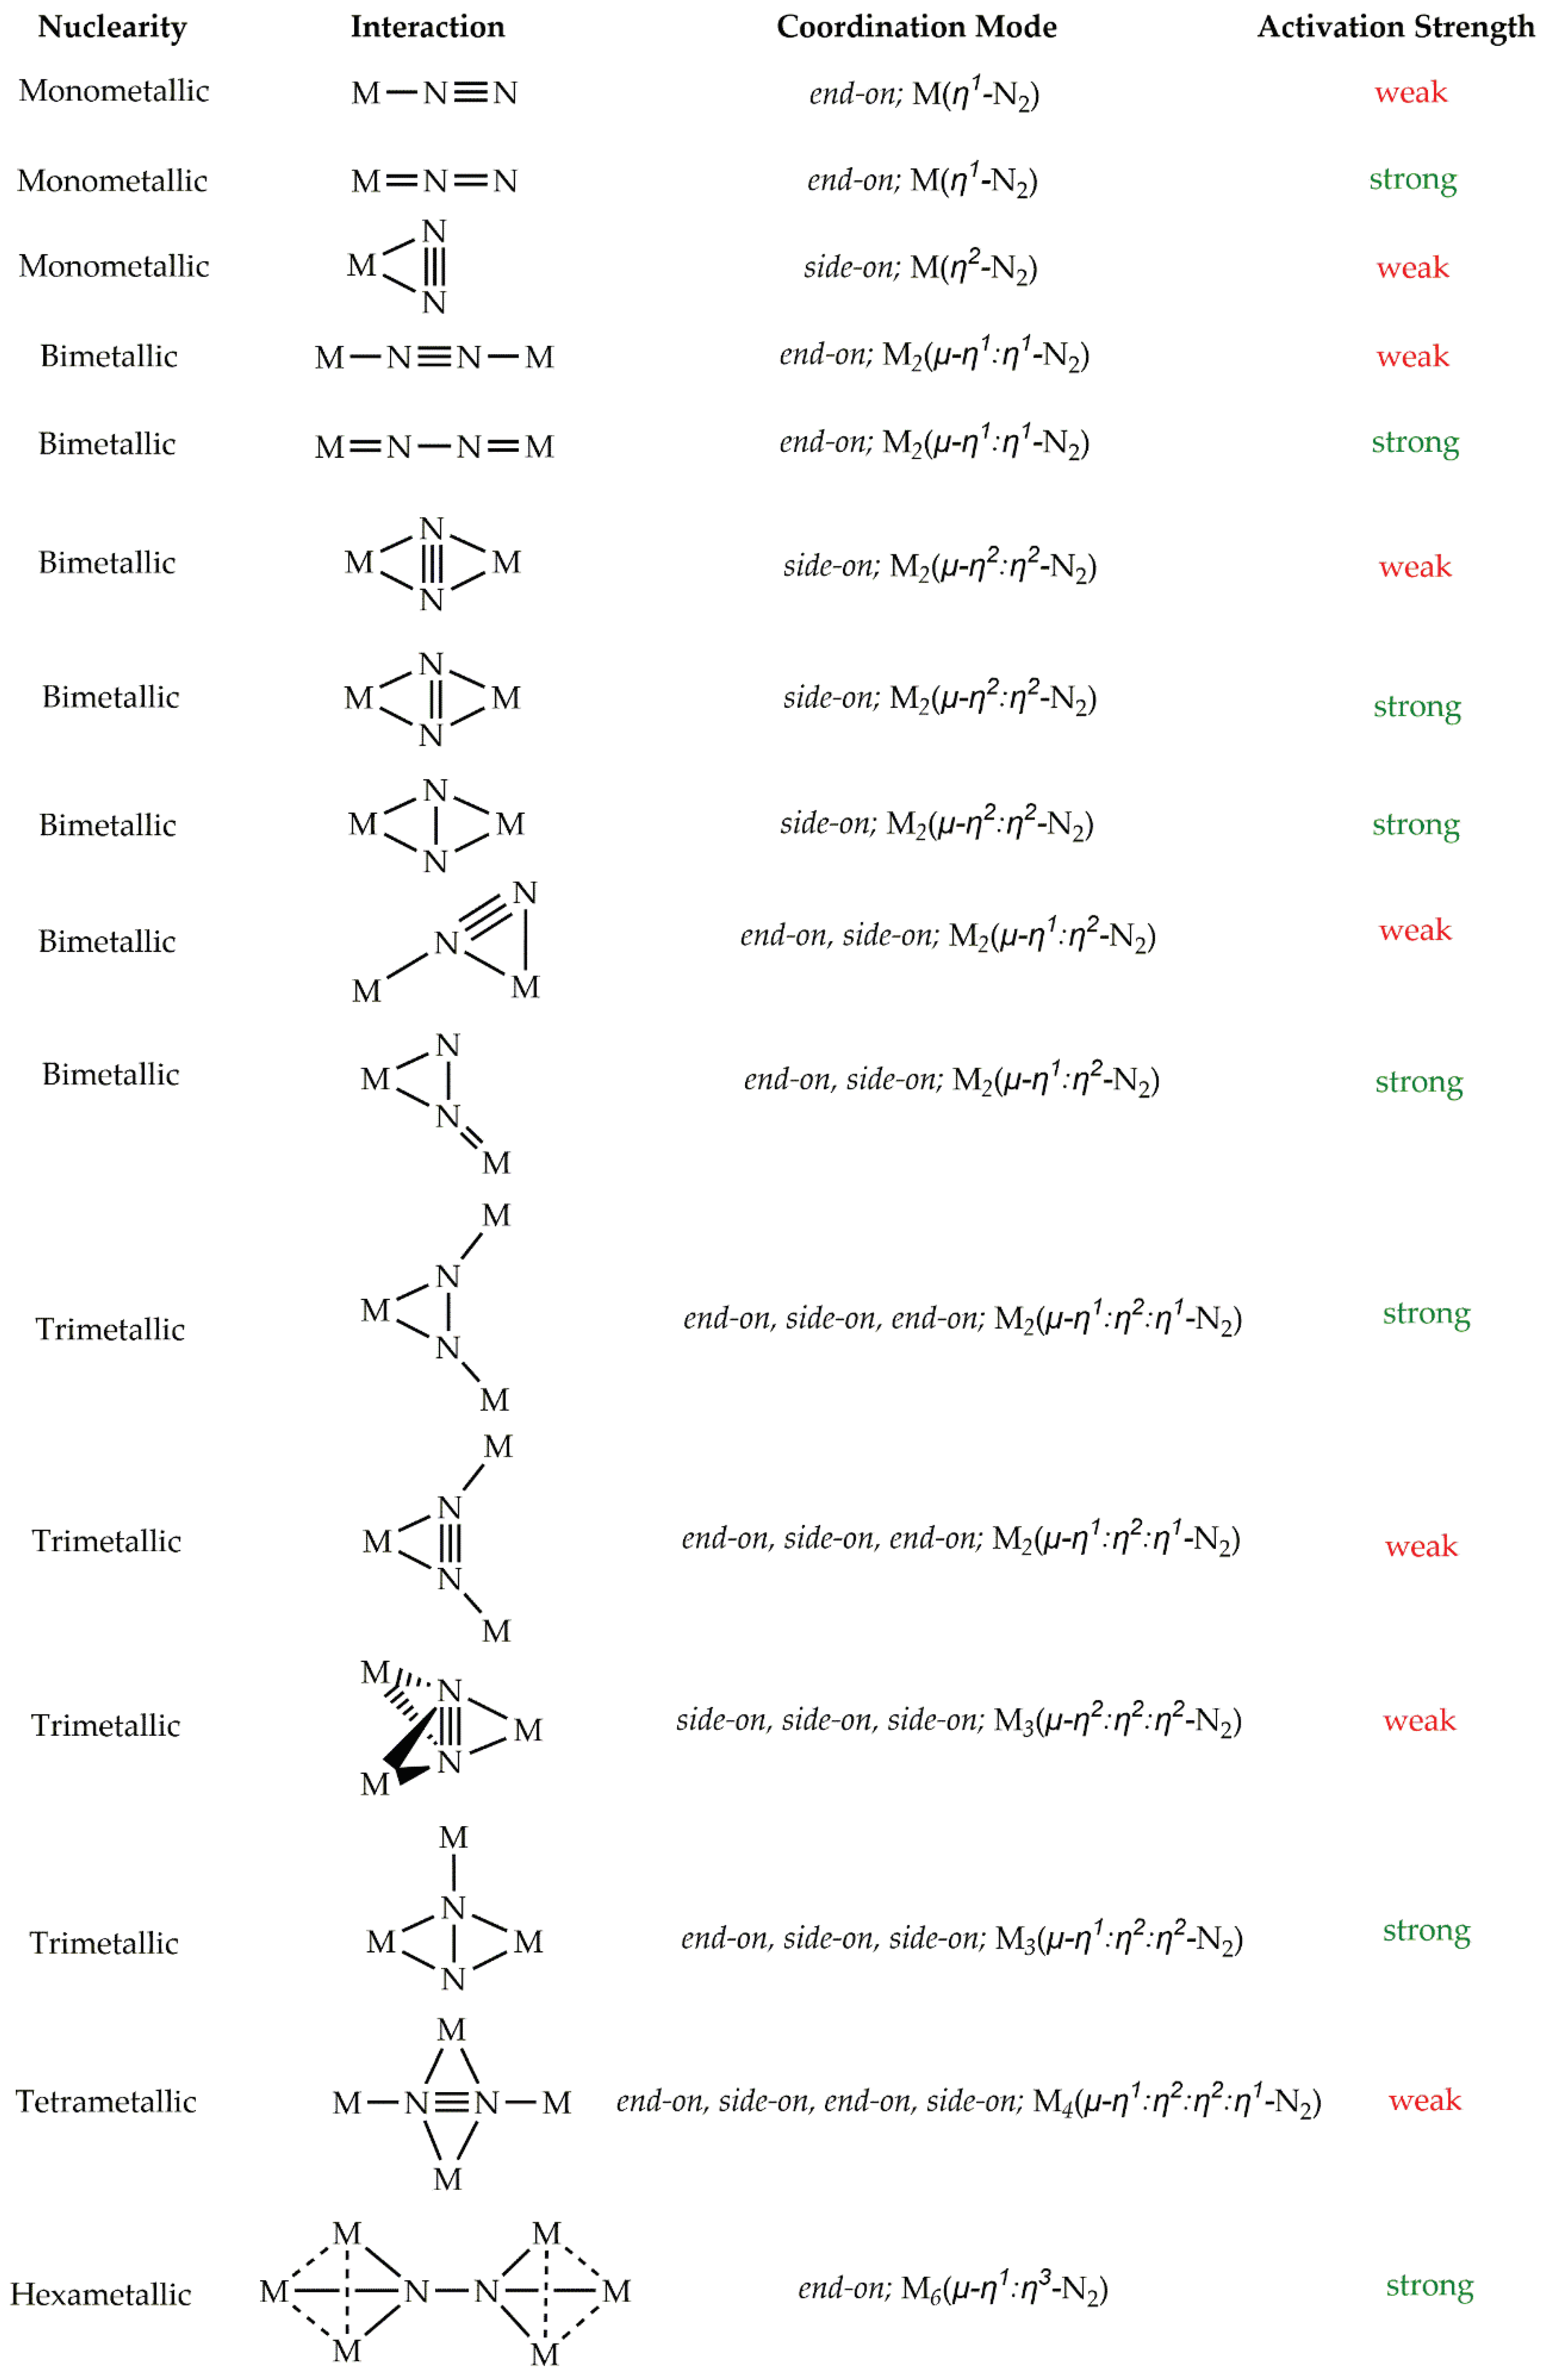
Numerous bonding modes of dinitrogen to the metal center(s) of transition metal complexes have been observed so far (
Scheme 1) [4,25,26]. Perusal of
Scheme 1 reveals that N
2 fixation occurs via 16 different bonding modes have been recognized as of today. Amongst them, 3 refer to monometallic complexes, 7 to bimetallic complexes, 4 to trimetallic complexes while one dinitrogen bonding mode has been observed for tetrametallic and hexametallic systems. In all cases, dinitrogen is coordinated to the transition metal center(s) either end-on or side-on. On the other hand, the N
2 activation which is the extend of its reduction, measured by either the N-N bond length elongation or the decrease of the respective
νs(N-N) symmetric stretching frequency [4], is found to be in the half cases weak ant the half strong (
Scheme 1). Electronic structure calculations have been often employed in order to give insight on N
2 bonding situation in dinitrogen complexes [27]. However, to the best of our knowledge, there is no theoretical study concerning the N
2 fixation and activation by hexametallic systems (
Scheme 1). Notice that, this bonding mode has been observed by Sharp et. al., [28] for [(LAu)
6(N
2)]
2+ gold(I) hexanuclear complexes where dinitrogen bridges the two trinuclear gold(I) rings. This bonding mode results in one of the largest N
2 elongation observed so far i.e. the N-N bond length is found to be 1.475 Å indicative of conversion to hydrazido, N
24- unit.
The remarkable N2 activation in these dinitrogen bridged gold clusters which also mimic the six Fe metal cluster in nitrogenase instigated us to thoroughly investigate, by means of DFT calculations, the bonding properties of hexametallic complexes of the general formula {[(μ2-L)M)]6(μ-η1:η3-Ν2)}0/+6 (L = CH2-, NH2-, PH2-, OH-, SH-, BH2- and NH2-, M = Ru or Os). In order to further delineate the bonding properties in the {[(μ2-L)M)]6(μ-η1:η3-Ν2)}0/+6 we studied also the [(μ2-L)M]30/+3 clusters as well as their interactions with dinitrogen in the {[(μ2-L)M]3(μ3-N2)}0/+3 complexes. Notice that, Ru and Os compounds have been employed and studied quite often for N2 fixation/activation and ammonia synthesis [29].
2. Results and Discussion
2.1. Geometries
2.1.1. ‘Free’ Clusters
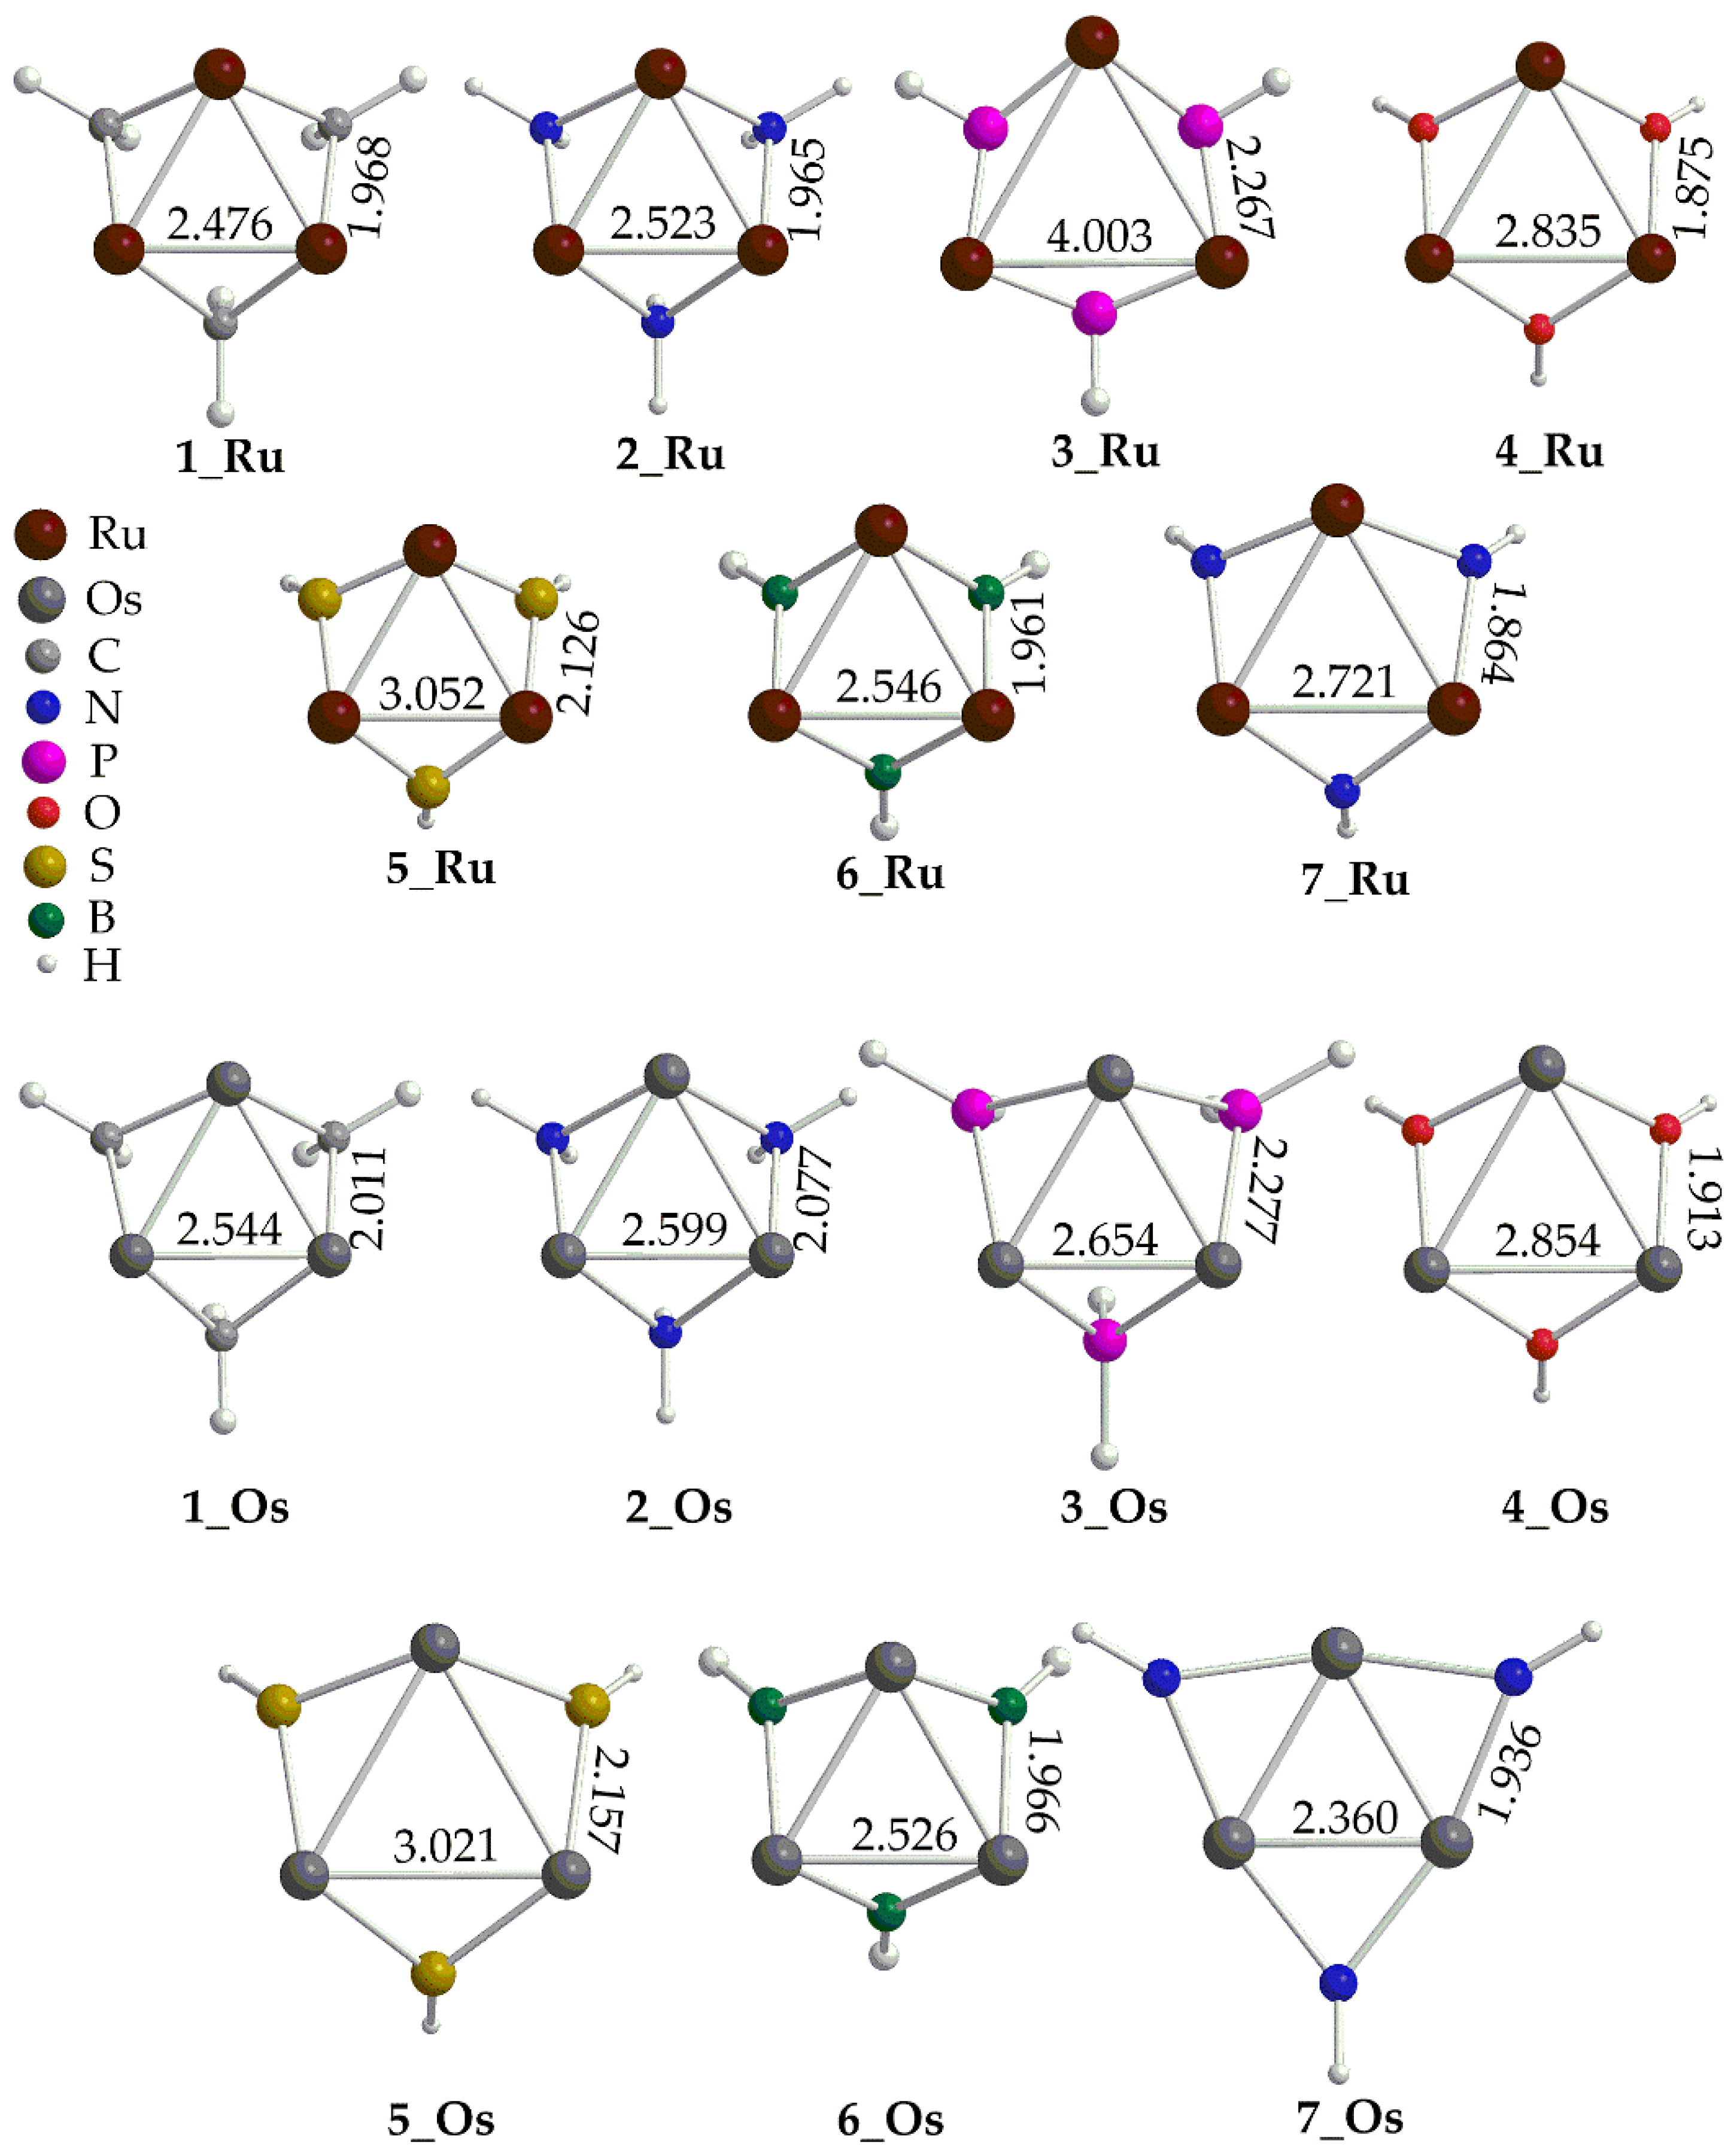
Let us first examine the [(
μ2-L)M]
30/+3 clusters, which henceforth we shall call them ‛free’ clusters, considered as the precursors for the fixation/activation of dinitrogen upon formation of the {[(
μ2-L)M)]
6(
μ-
η1:
η3-Ν
2)} complexes. The optimized geometries of the ‛free’ clusters [(
μ2-L)M]
30/+3 are given in
Figure 1.
Inspection of
Figure 1 reveals that the calculated M-M bond distances, with a few exceptions, are indicative of intermetallic interactions. Thus, in [(
μ2-L)Ru]
30/+3 complexes the Ru-Ru distances are within the range 2.476 – 3.050 Å which are smaller the sum of the Ru van der Waals (2.05 Å [30]). Exception is the [(
μ2-PH
2)Ru]
3+3 complex where the Ru-Ru distance is quite long, equal to 4.003 Å. On the other hand, the Os-Os distances lie in the range 2.360 – 3.021 Å, also indicative of intermetallic interactions (Os van der Waals radius is 2.02 Å [30]. Finally, all complexes form equilateral trigonal metallic rings with the bridging ligands L located out of the ring plane (
Figure 1).
2.1.2. ‘Open Face’ Clusters
Next, we examined the {[(
μ2-L)M]
3(
μ3-N
2)}
0/+3 complexes, which from now on, we shall call them ‛open face’ clusters. The optimized geometries of the ‛open face’ clusters [(
μ2-L)M]
30/+3 are given in
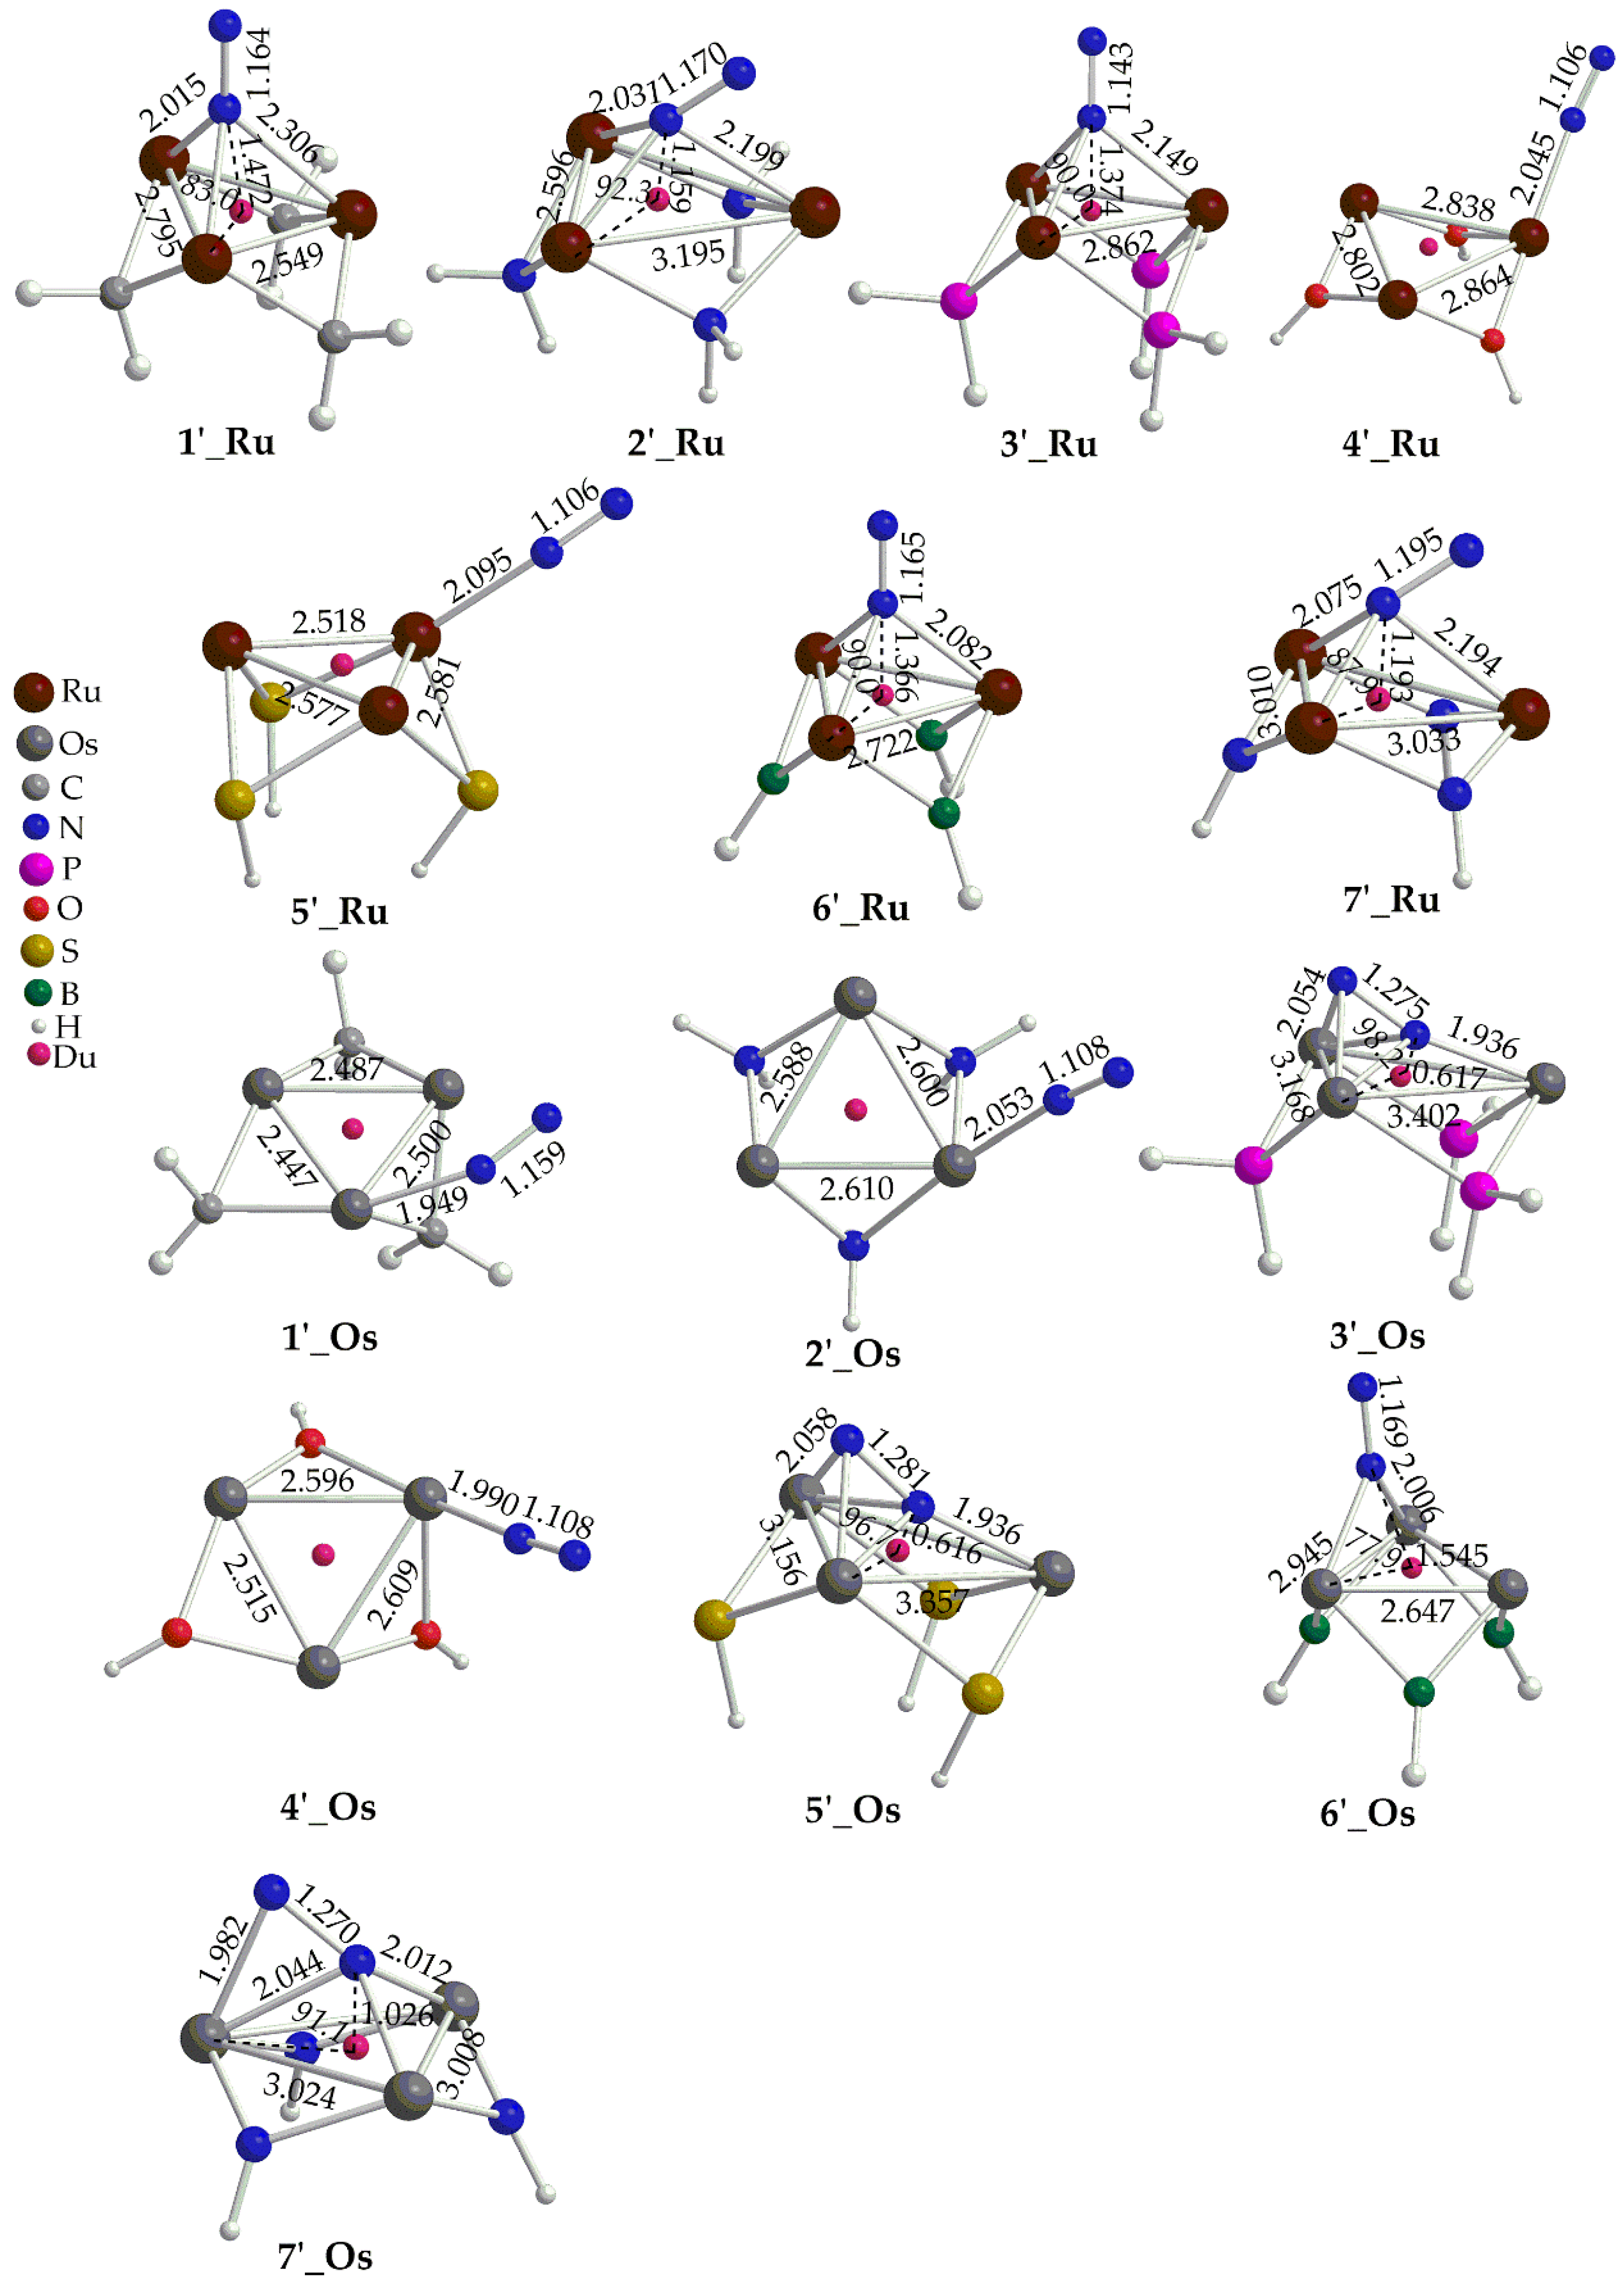
Figure 2. Perusal of
Figure 2 reveals that the ‛open face’ clusters adopt different binding modes of dinitrogen to the metallic ring, depending upon the nature of the metal and the bridging ligands, L. Accordingly, the Ru ‛open face’ clusters adopt three different binding modes of N
2 to the metallic ring core i.e.
μ3-
η1 in
1’_Ru,
3’_Ru,
6’_Ru,
μ2-
η1 in
2’_Ru,
7’_Ru, and
η1 in
4’_Ru, and
5’_Ru. On the other hand, for Os ‛open face’ clusters we observe also three different binding modes of N
2 to the metallic ring core i.e.
μ2-
η1 in
6’_Os,
μ2-
η2 in
3’_Os, and
5’_Os, and
η1 in
1’_Os,
2’_Os and
4’_Os. The calculated N-N bond length of dinitrogen ligand in the ‛open face’ clusters is found in the range 1.106 – 1.281 Å. For most of the ‛open face’ clusters under study this corresponds to a very small to small activation taking into account that the N-N bond length of the ‘free’ N
2 molecule is 1.098 Å. Exceptions are complexes
7’_Ru,
3’_Os,
5’_Os and
7’_Os where dinitrogen, upon fixation to the metallic ring, is being transformed to diazenido like group, N
22- corresponding to a double N=N bond. Dinitrogen coordination results in significant changes of the metallic ring structure. Thus, the M-M bond distances are elongated with the exception of
3’_Ru where they are significantly shortened upon N
2 fixation to
3_Ru cluster. In addition, dinitrogen fixation causes a distortion of the metallic rings which form either isosceles triangles (
1’_Ru,
3’_Ru,
7’_Ru,
3’_Os,
5’_Os,
6’_Os and
7’_Os) or scalene triangles ((
4’_Ru,
5’_Ru, 1
’_Os,
2’_Os,
4’_Os) (
Figure 2). Exceptions are the ‛open face’ complexes
3’_Ru, and
6’_Ru where the metallic rings retain their equilateral triangle shape observed for the respective ‘free’ clusters. Finally, the distances of the N
2 from either the centroid of the metallic ring or from the metal centers indicate the onset of bonding interactions upon coordination (
Figure 2).
2.1.3. ‛Full Face’ Clusters
Let’s now examine the {[(
μ2-L)M)]
6(
μ-
η1:
η3-Ν
2)}
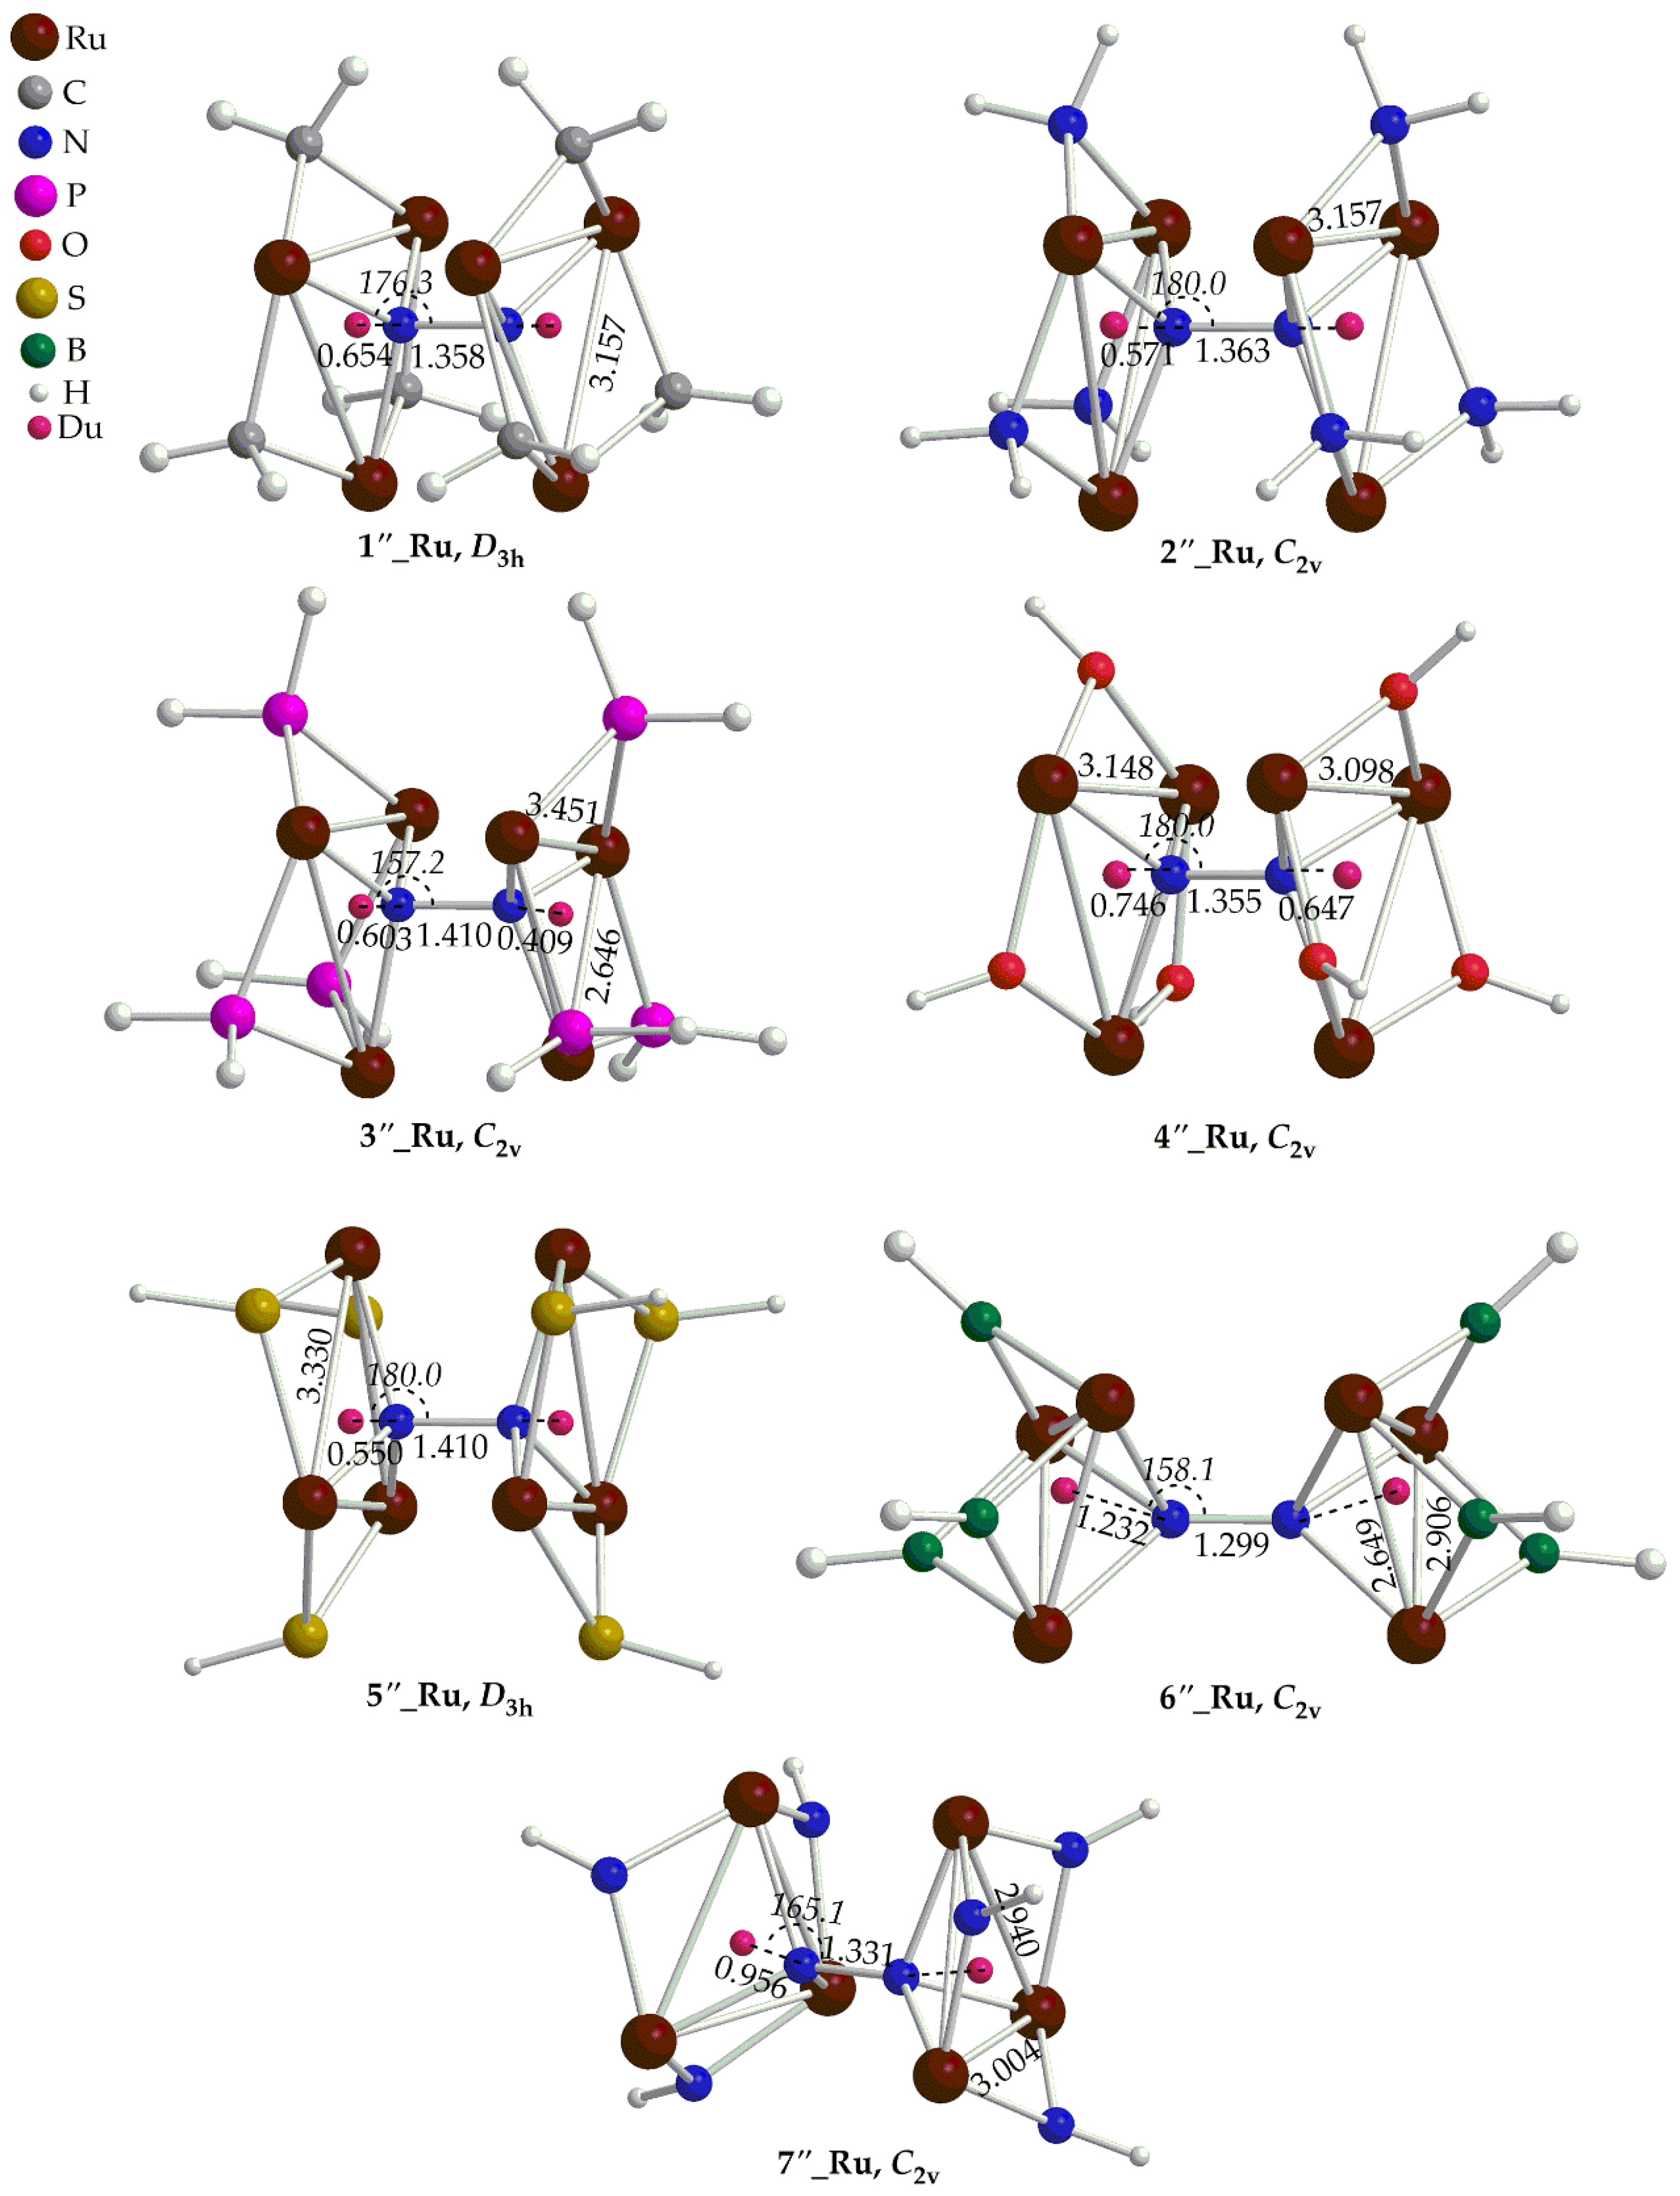
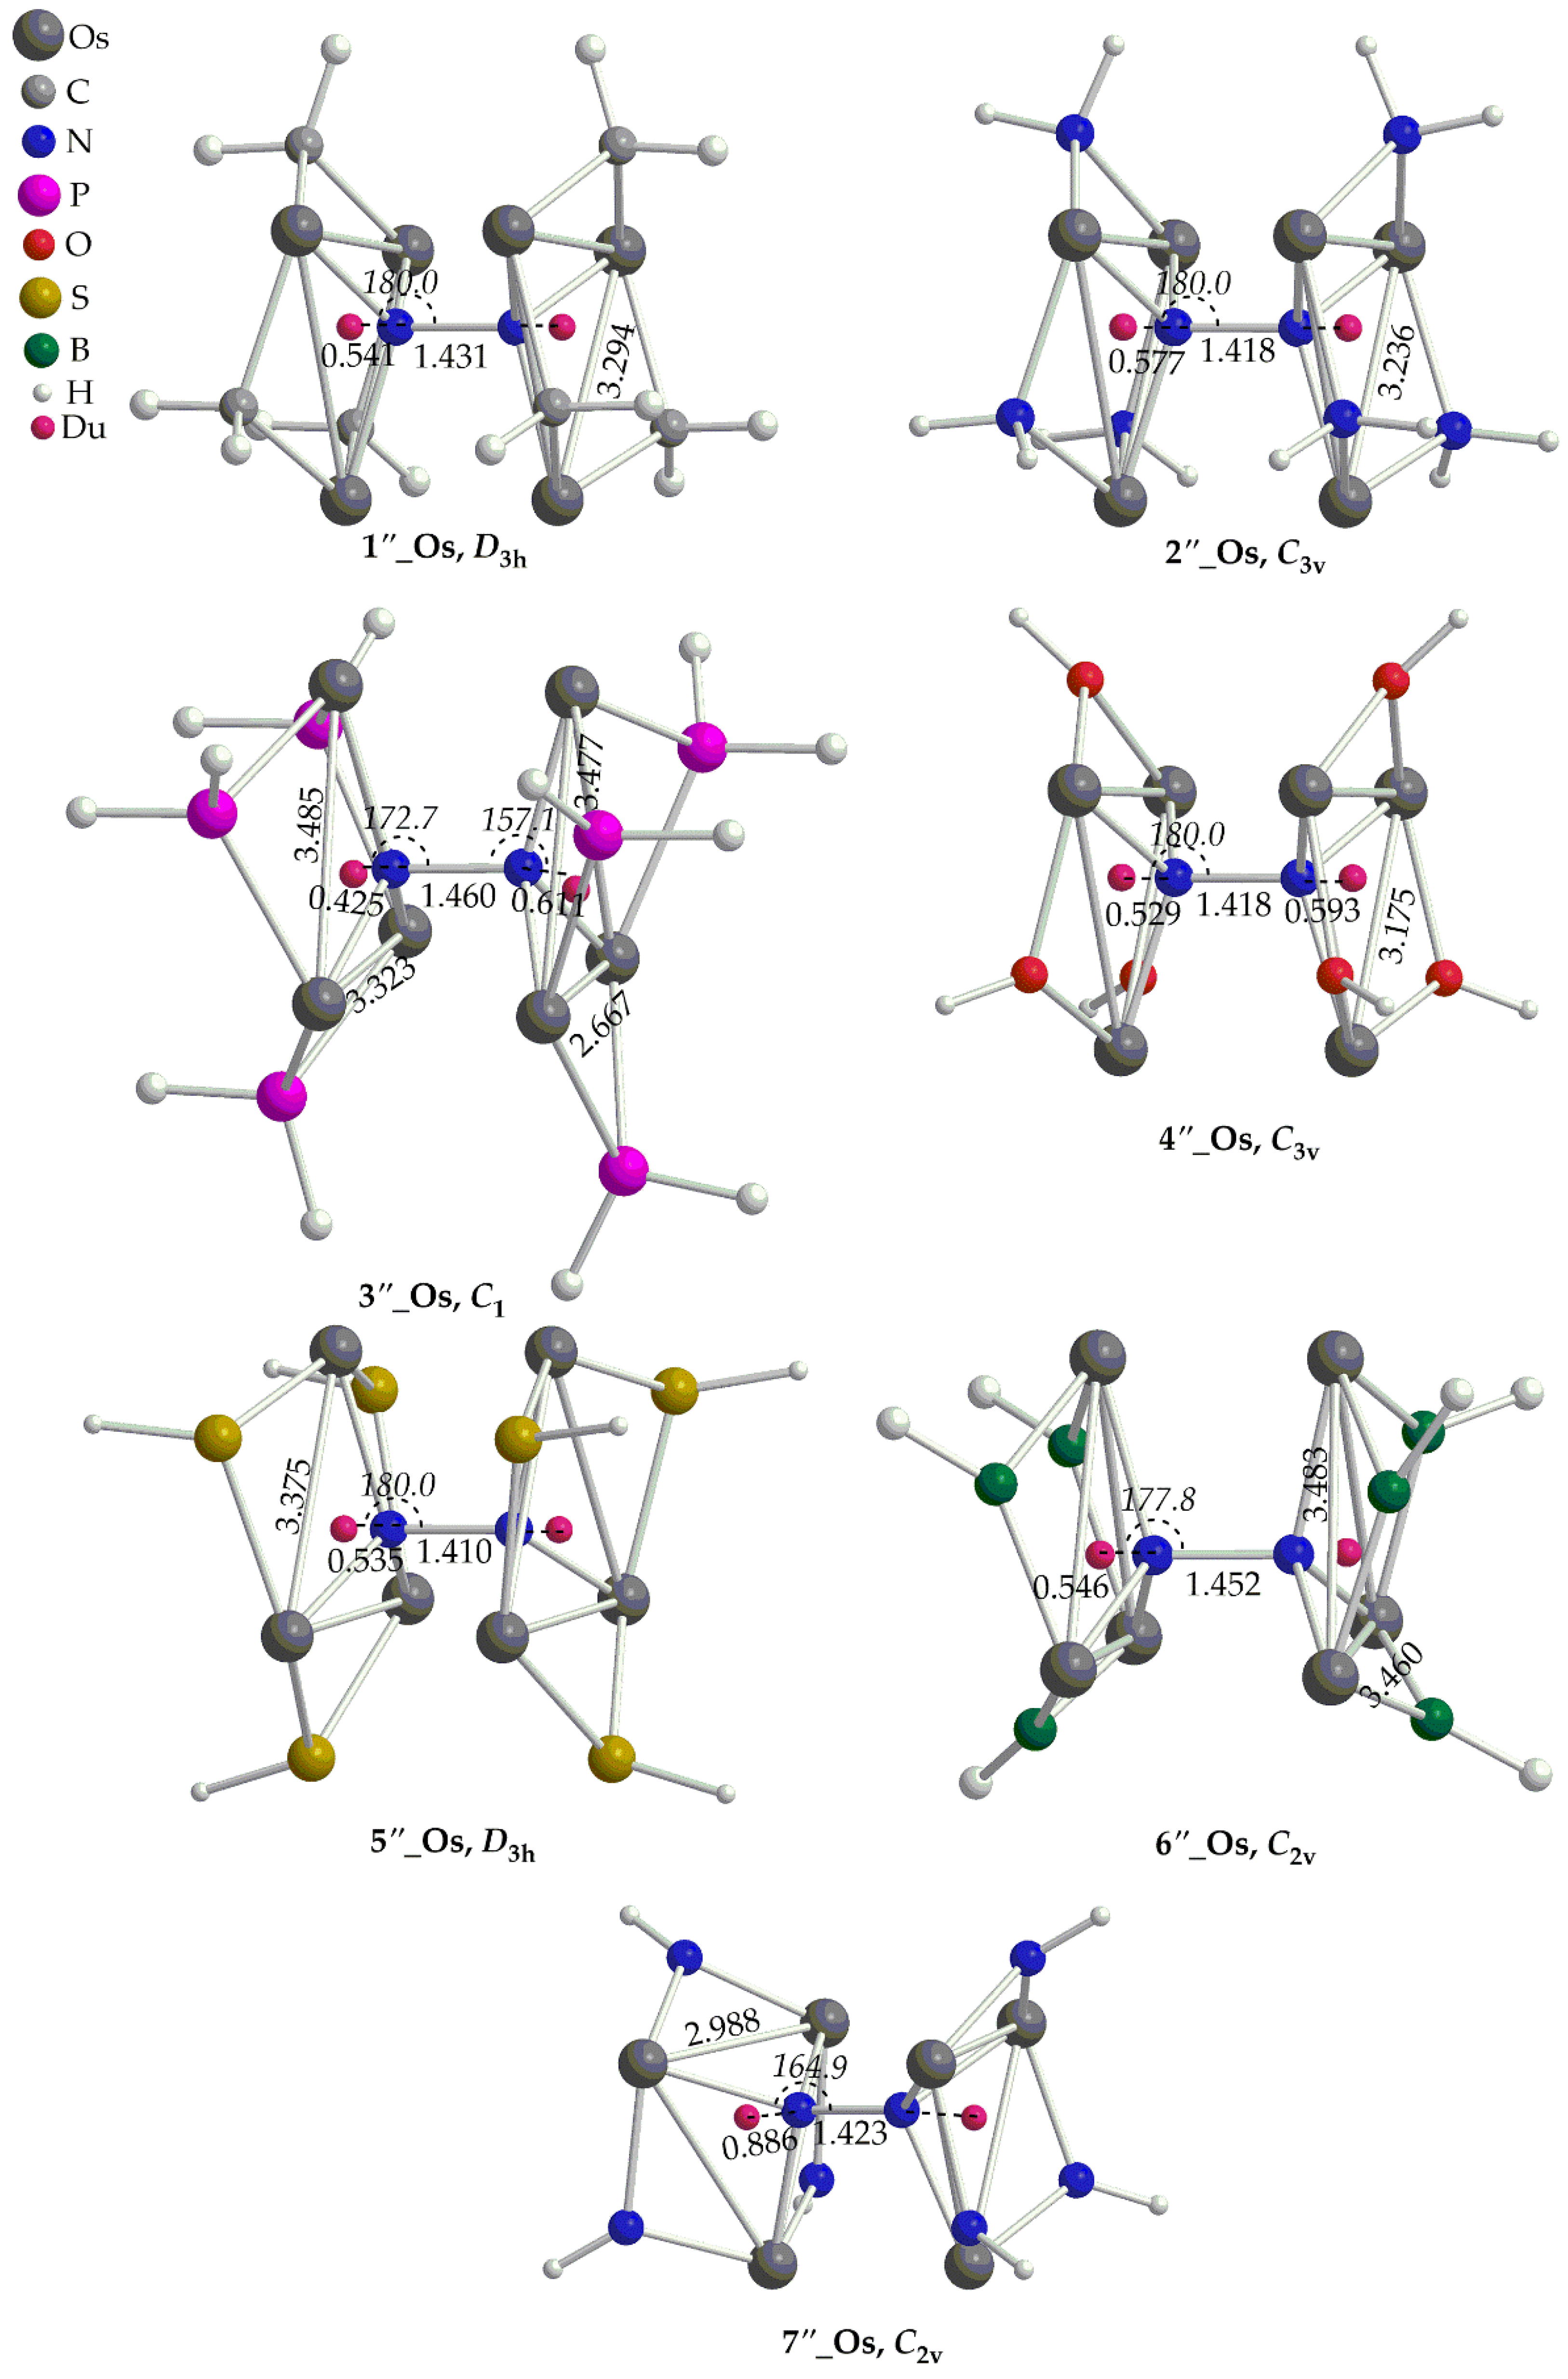
0/+6 complexes, which from now on, we shall call them ‛full face’ clusters. The optimized geometries of the ‛full face’ clusters are given in
Figure 3 and
Figure 4. In contrast to the ‘open face’ clusters, dinitrogen in ‘full face’ clusters is coordinated to the metal centers via only one type of binding mode i.e.
μ-
η1:
η3, bridging the two rings. The ‘full face’ clusters adopt structures of higher symmetry (mainly
D3h or
C2v) as compared to their ‘open face’ counterparts. The N-N bond length of the dinitrogen bridging ligand is found in the ranges 1.299 – 1.410 Å and 1.410 – 1.460 Å for the Ru and Os complexes respectively. Obviously, upon fixation between the two metallic rings of the ‘full face’ clusters, dinitrogen activation is much stronger than that observed in their respective ‘open face’ counterparts. Based upon the bond lengths, dinitrogen is transformed to a hydrazido like group, N
24- which corresponds to a single N-N bond similar to that observed for analogous Au(I) hexametallic compounds [28]. The distances of the N
2 bridging ligand from the centroids,
cd (denoted with dummy atoms in
Figure 3 and
Figure 4) are within the ranges 0.550 – 1.232 Å and 0.425 – 0.886 Å. In general, there is a trend between the N
2-
cd and N-N bond distances according to which, when the former decreases the latter increases. In other words, dinitrogen activation becomes stronger when the N atoms come closer to the center of the metallic rings. Nevertheless, the short N
2-
cd observed in the ‘full face’ clusters are indicative of bonding interactions between the N atoms of the N
2 ligand and the rings of the metallic clusters. In most cases, the dinitrogen bridging ligand of the ‘full face’ complexes is linearly or almost linearly aligned with the centroids,
cd of the two metallic rings (
Figure 3 and
Figure 4). Exceptions are the complexes
3’’_Ru,
6’’_Ru,
7’’_Ru,
3’’_Os,
6’’_Os,
7’’_Os, for which the <N-N-
cd bond angles deviate from linearity by about 15 - 23º found in the range 157 - 165º. Coordination of N
2 results also in a significant elongation of the M-M bond distances of the two metal rings in the ‘full face’ clusters. Thus, the M-M bond distances in the ‘full face’ clusters are found to be almost equal or even much longer than 3 Å, in the ranges 3.004 -3.451 Å for Ru complexes and 2.998 Å for Os complexes. Exceptions are the
6’’_Ru and
6’’_Os where shorter than 3 Å M-M bond distances could be observed. Finally, in most cases the metallic rings of the ‘full face’ complexes retain an equilateral or isosceles triangular shape.
2.2. Spectroscopy
2.2.1. Infrared Spectra
Taking into account that the extend of dinitrogen activation is estimated based upon the ν
s(N-N) symmetric stretching frequencies we have calculated the infrared (IR) spectra of the ‘full face’ clusters. This would permit a further assesment of the extend N
2 activation by the ‘full face’ clusters as well as assist a possible future experimental study. The IR spectra of
1’’_Ru and
1’’_Os are given in
Figure 5 while those of the rest ‘full face’ clusters under study are given in
Figures S1–S6 of the Supplementary Information.
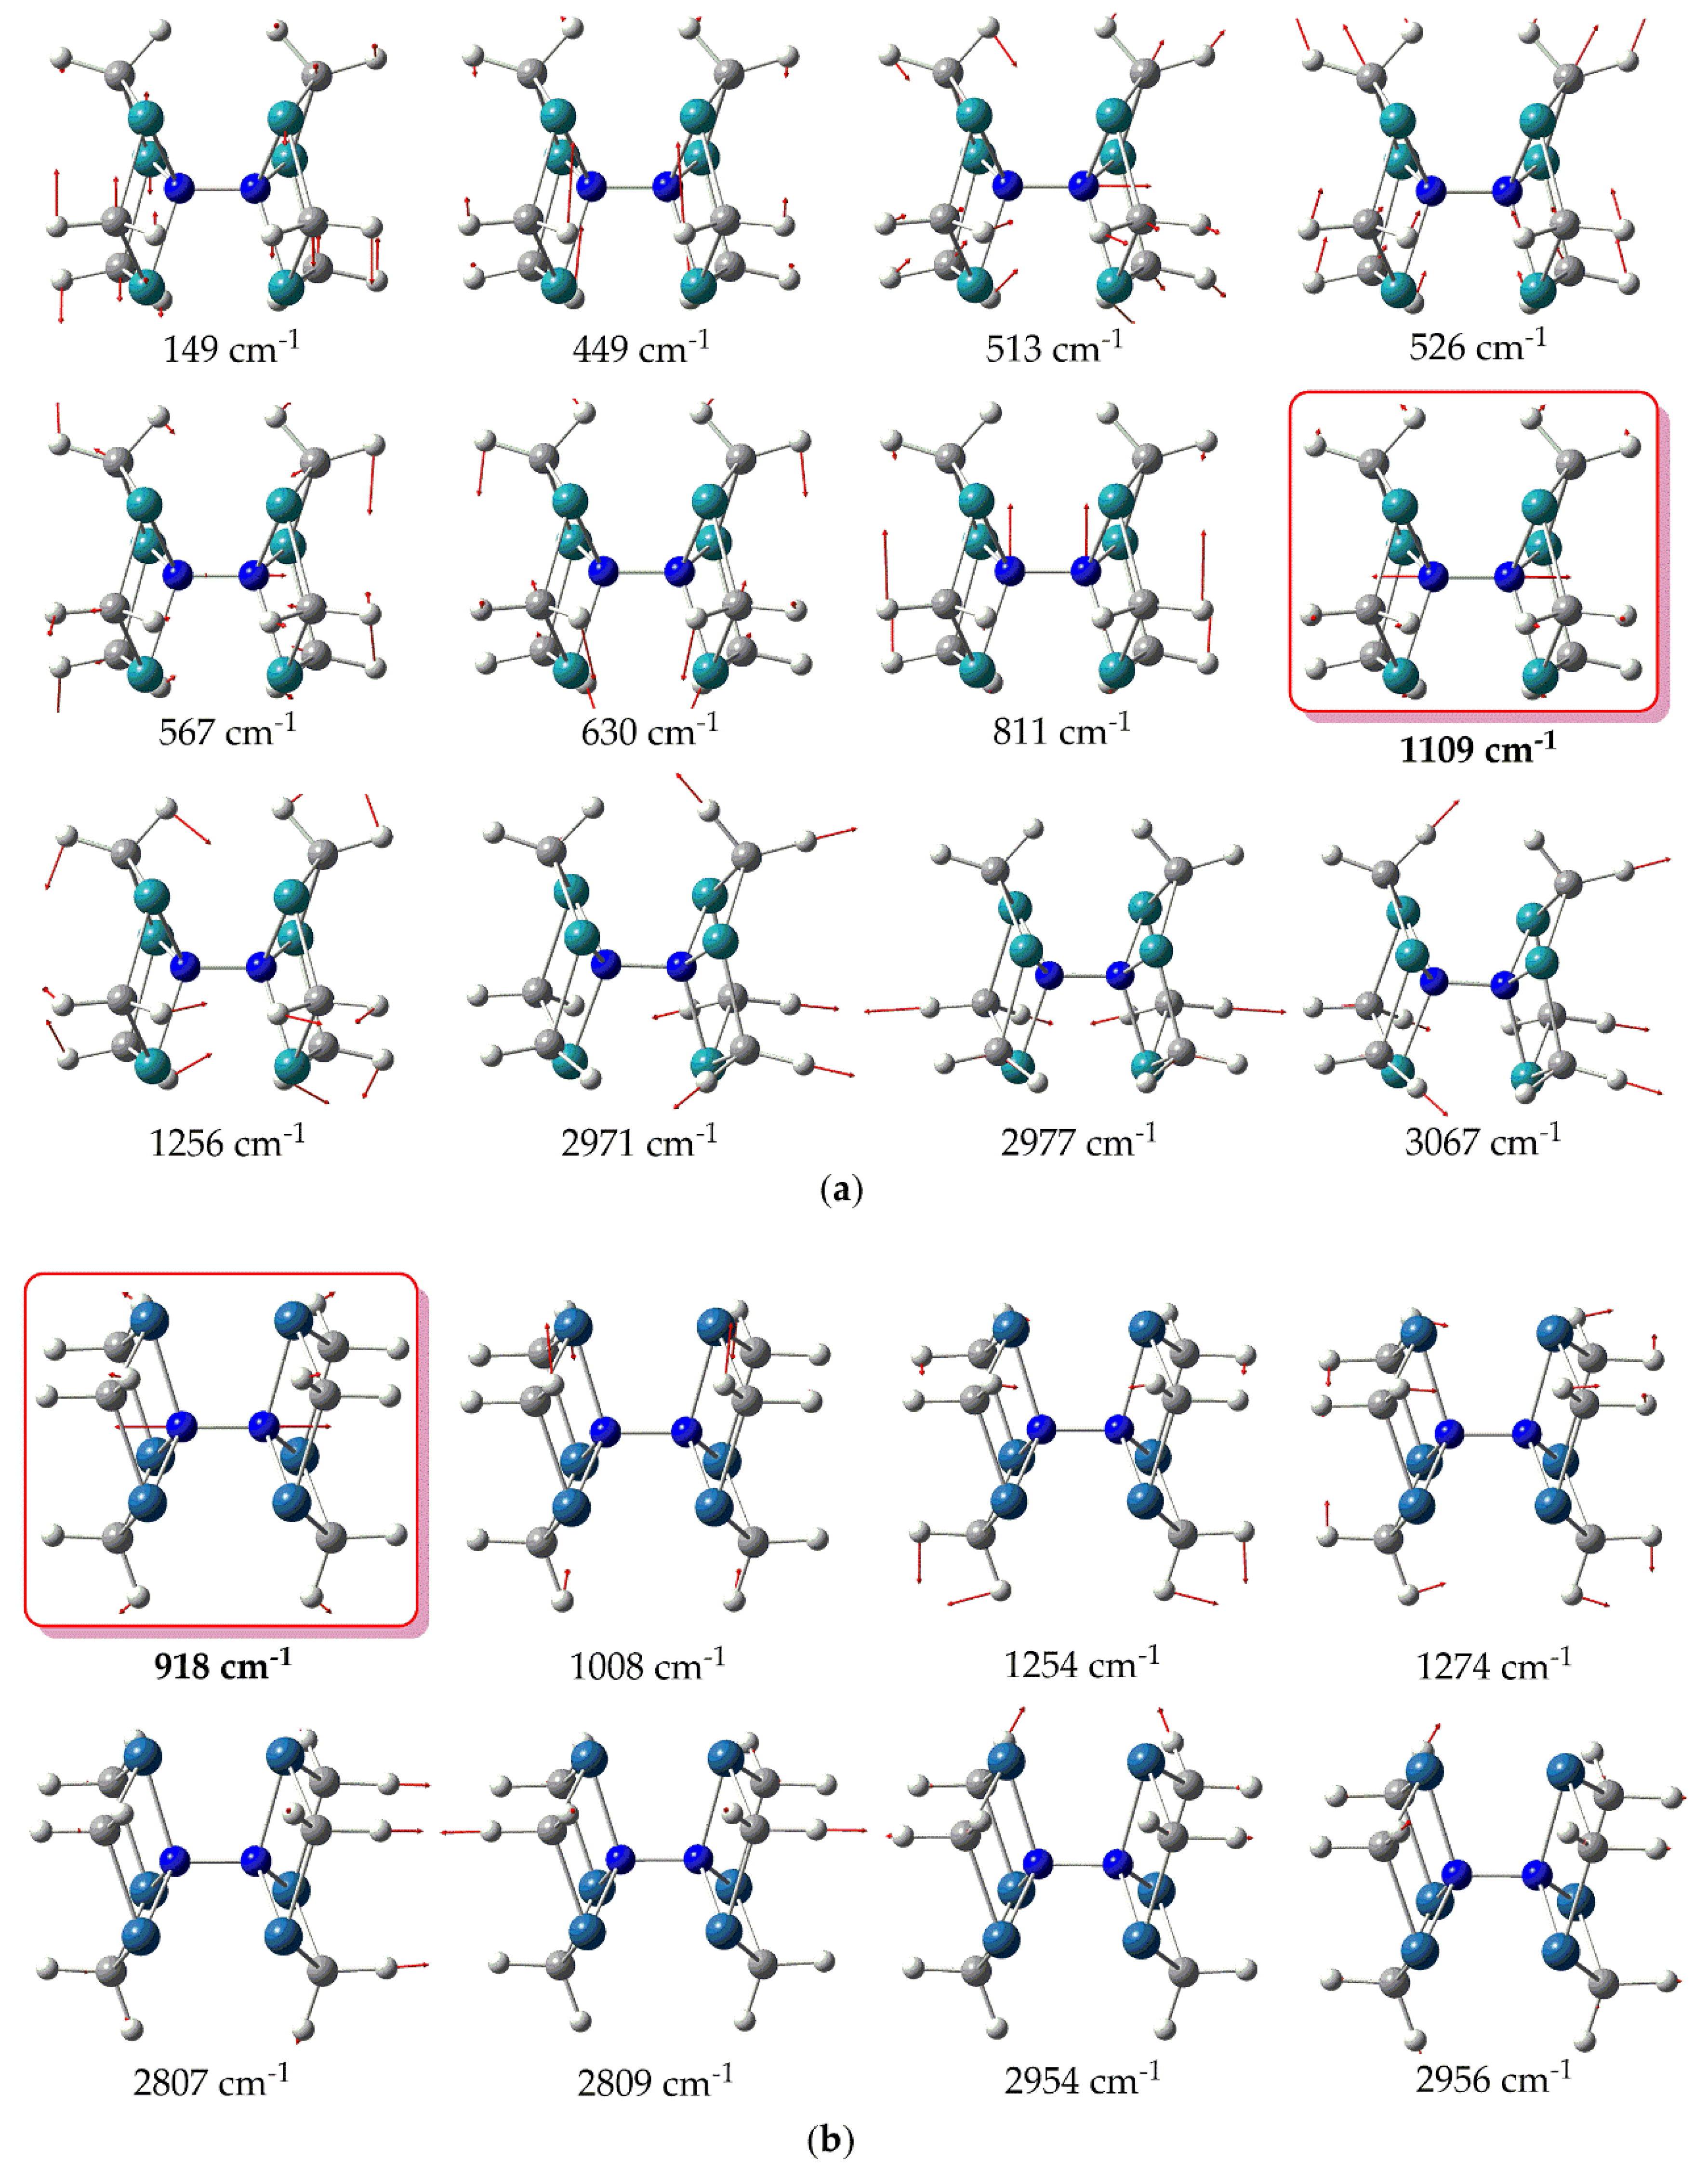
Also, in
Figure 6 are depicted the vibrational normal modes for the most relevant peaks appearing in the simulated IR spectra of the hexanuclear metallic complexes under study.
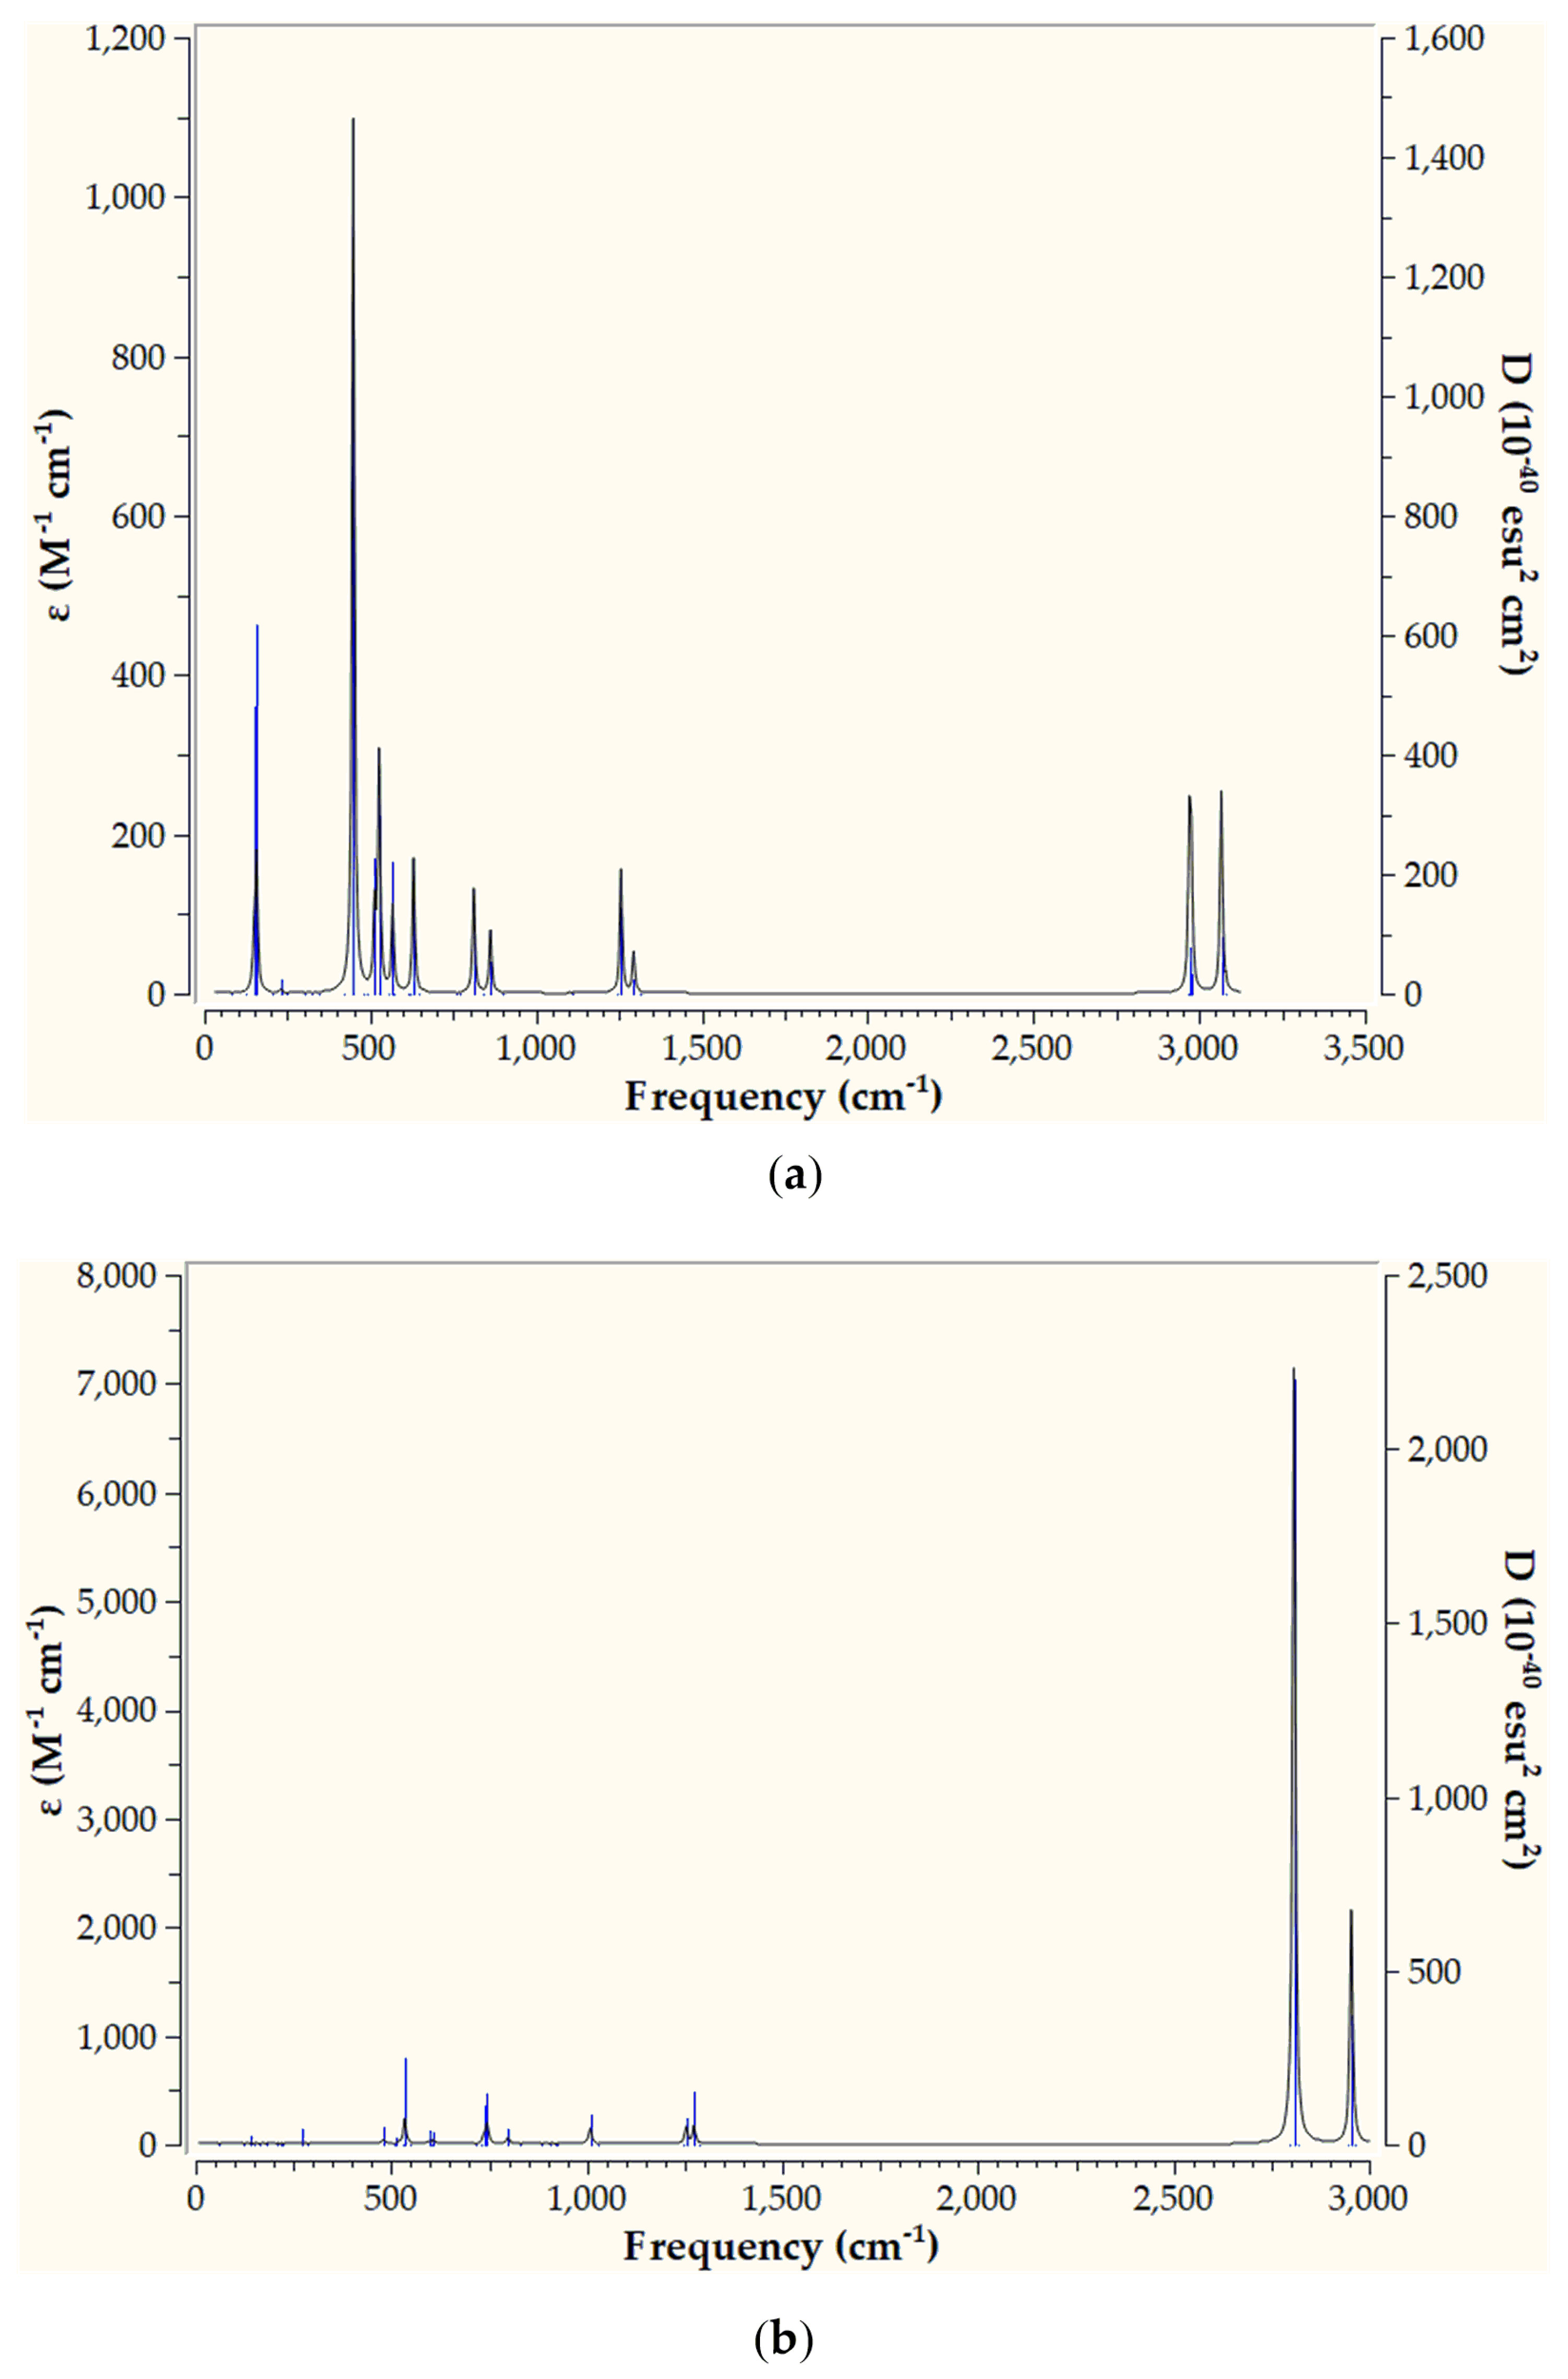
Inspection of
Figure 5 reveals that the simulated IR spectrum of
1’’_Ru exhibits a variety of bands with the most intense appearing at 449 cm
-1. The latter corresponds to bending of H atoms (
Figure 6a). The same holds true also for the rest of the peaks appearing in the IR spectrum of
1’’_Ru. Notice however, that the
vs(N-N) symmetric stretching frequency, indicative of the extent of N
2 activation, is IR silent for
1’’_Ru, appearing at 1109 cm
-1 (
Figure 6a). Thus, the value of the
vs(N-N) symmetric stretching frequency are in support of a strong N
2 activation by
1’’_Ru, where the triple N≡N is being transformed to a, hydrazine like, single N-N bond [31]. On the other hand, the simulated IR spectrum of
1’’_Os is rather different from that of
1’’_Ru, exhibiting basically two strong peaks at 2809 and 2954 cm
-1. Both of these peaks correspond to H atoms bending vibrations (
Figure 6b). The rest of the peaks are weak, appearing in the region 500 – 1500 cm
-1 and correspond also to H atoms bending vibrations. Finally, the
vs(N-N) symmetric stretching frequency is silent, similar to
1’’_Ru, appearing however to a lower wavelength at 918 cm
-1 (
Figure 6b). The lower
vs(N-N) symmetric stretching frequency as well as the longer N-N bond length observed for
1’’_Os as compared to
1’’_Ru (
Figure 3 and
Figure 4), indicates that the Os complex causes a stronger N
2 activation than that of Ru complex.
The simulated IR spectra of the rest of the ‘full face’ complexes under study are given in
Figures S1–S6 of the Supplementary Information. Similar to
1’’_Ru for
1’’_Os, the most intense peaks correspond to H atoms bending while in all cases the
vs(N-N) symmetric stretching frequency is IR silent or very weak. In
Table 1 are given the equilibrium N-N bond length along with the
vs(N-N) symmetric stretching frequency found for the ‘full face’ complexes.
Inspection of
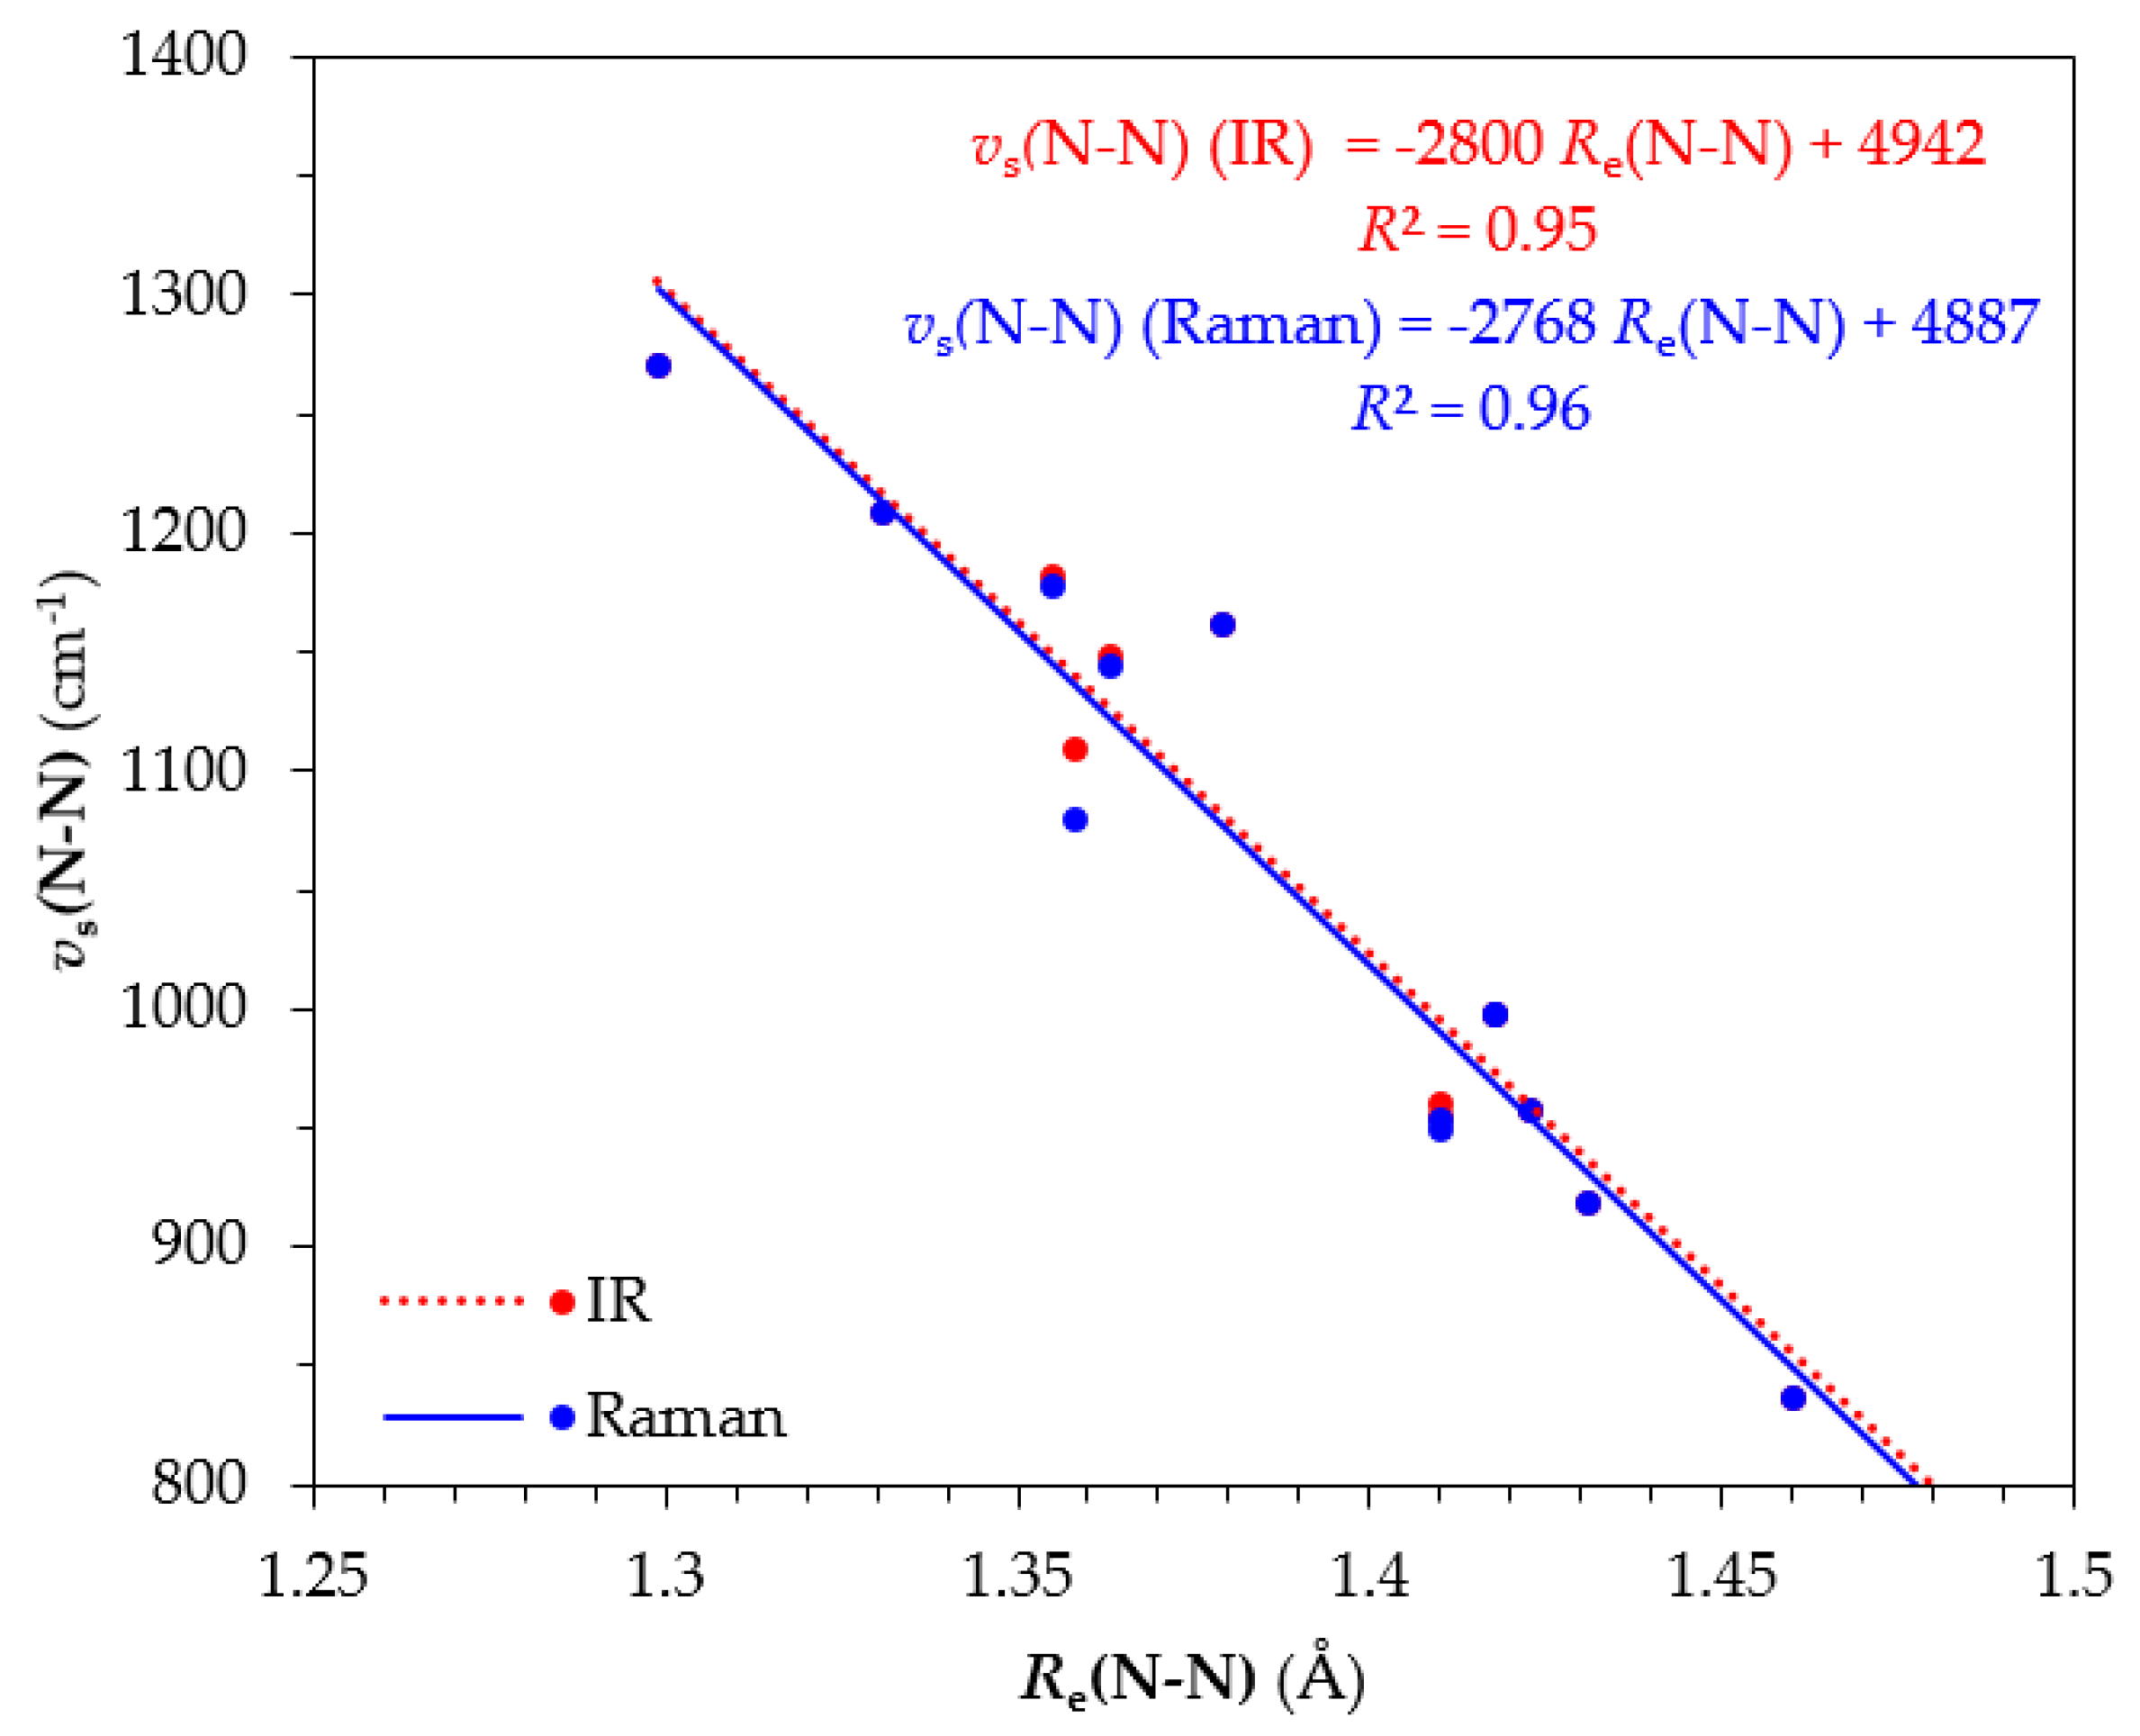
Table 1 reveals that the longer the
Re(N-N) bond length the lower the
vs(N-N) stretching frequency and this is reflected by the excellent linear correlation of these two parameters given in
Figure 7. In general, the N-N bond lengths of the dinitrogen bridging ligand are longer in the Os ‘full face’ clusters as compared to their respective Ru counterparts. In addition, the
vs(N-N) symmetric stretching frequencies of Ru ‘full face’ clusters higher than those for their Os counterparts. Based upon these structural and spectroscopic parameters, the extent of dinitrogen activation in the ‘full face’ clusters under study follows the trend
6’’_Ru < 7’’_Ru < 4’’_Ru < 1’’_Ru < 2’’_Ru < 6’’_Os < 3’’_Ru < 5’’_Ru < 5’’_Os < 2’’_Os < 4’’_Os < 7’’_Os < 1’’_Os < 3’’_Os. The strongest and weakest activation, based on this trend is expected for the
3’’_Os and
6’’_Ru complexes and in general, the Os complexes tend to activate more strongly the dinitrogen molecule compared to the Ru complexes under investigation.
2.2.2. Raman Spectra
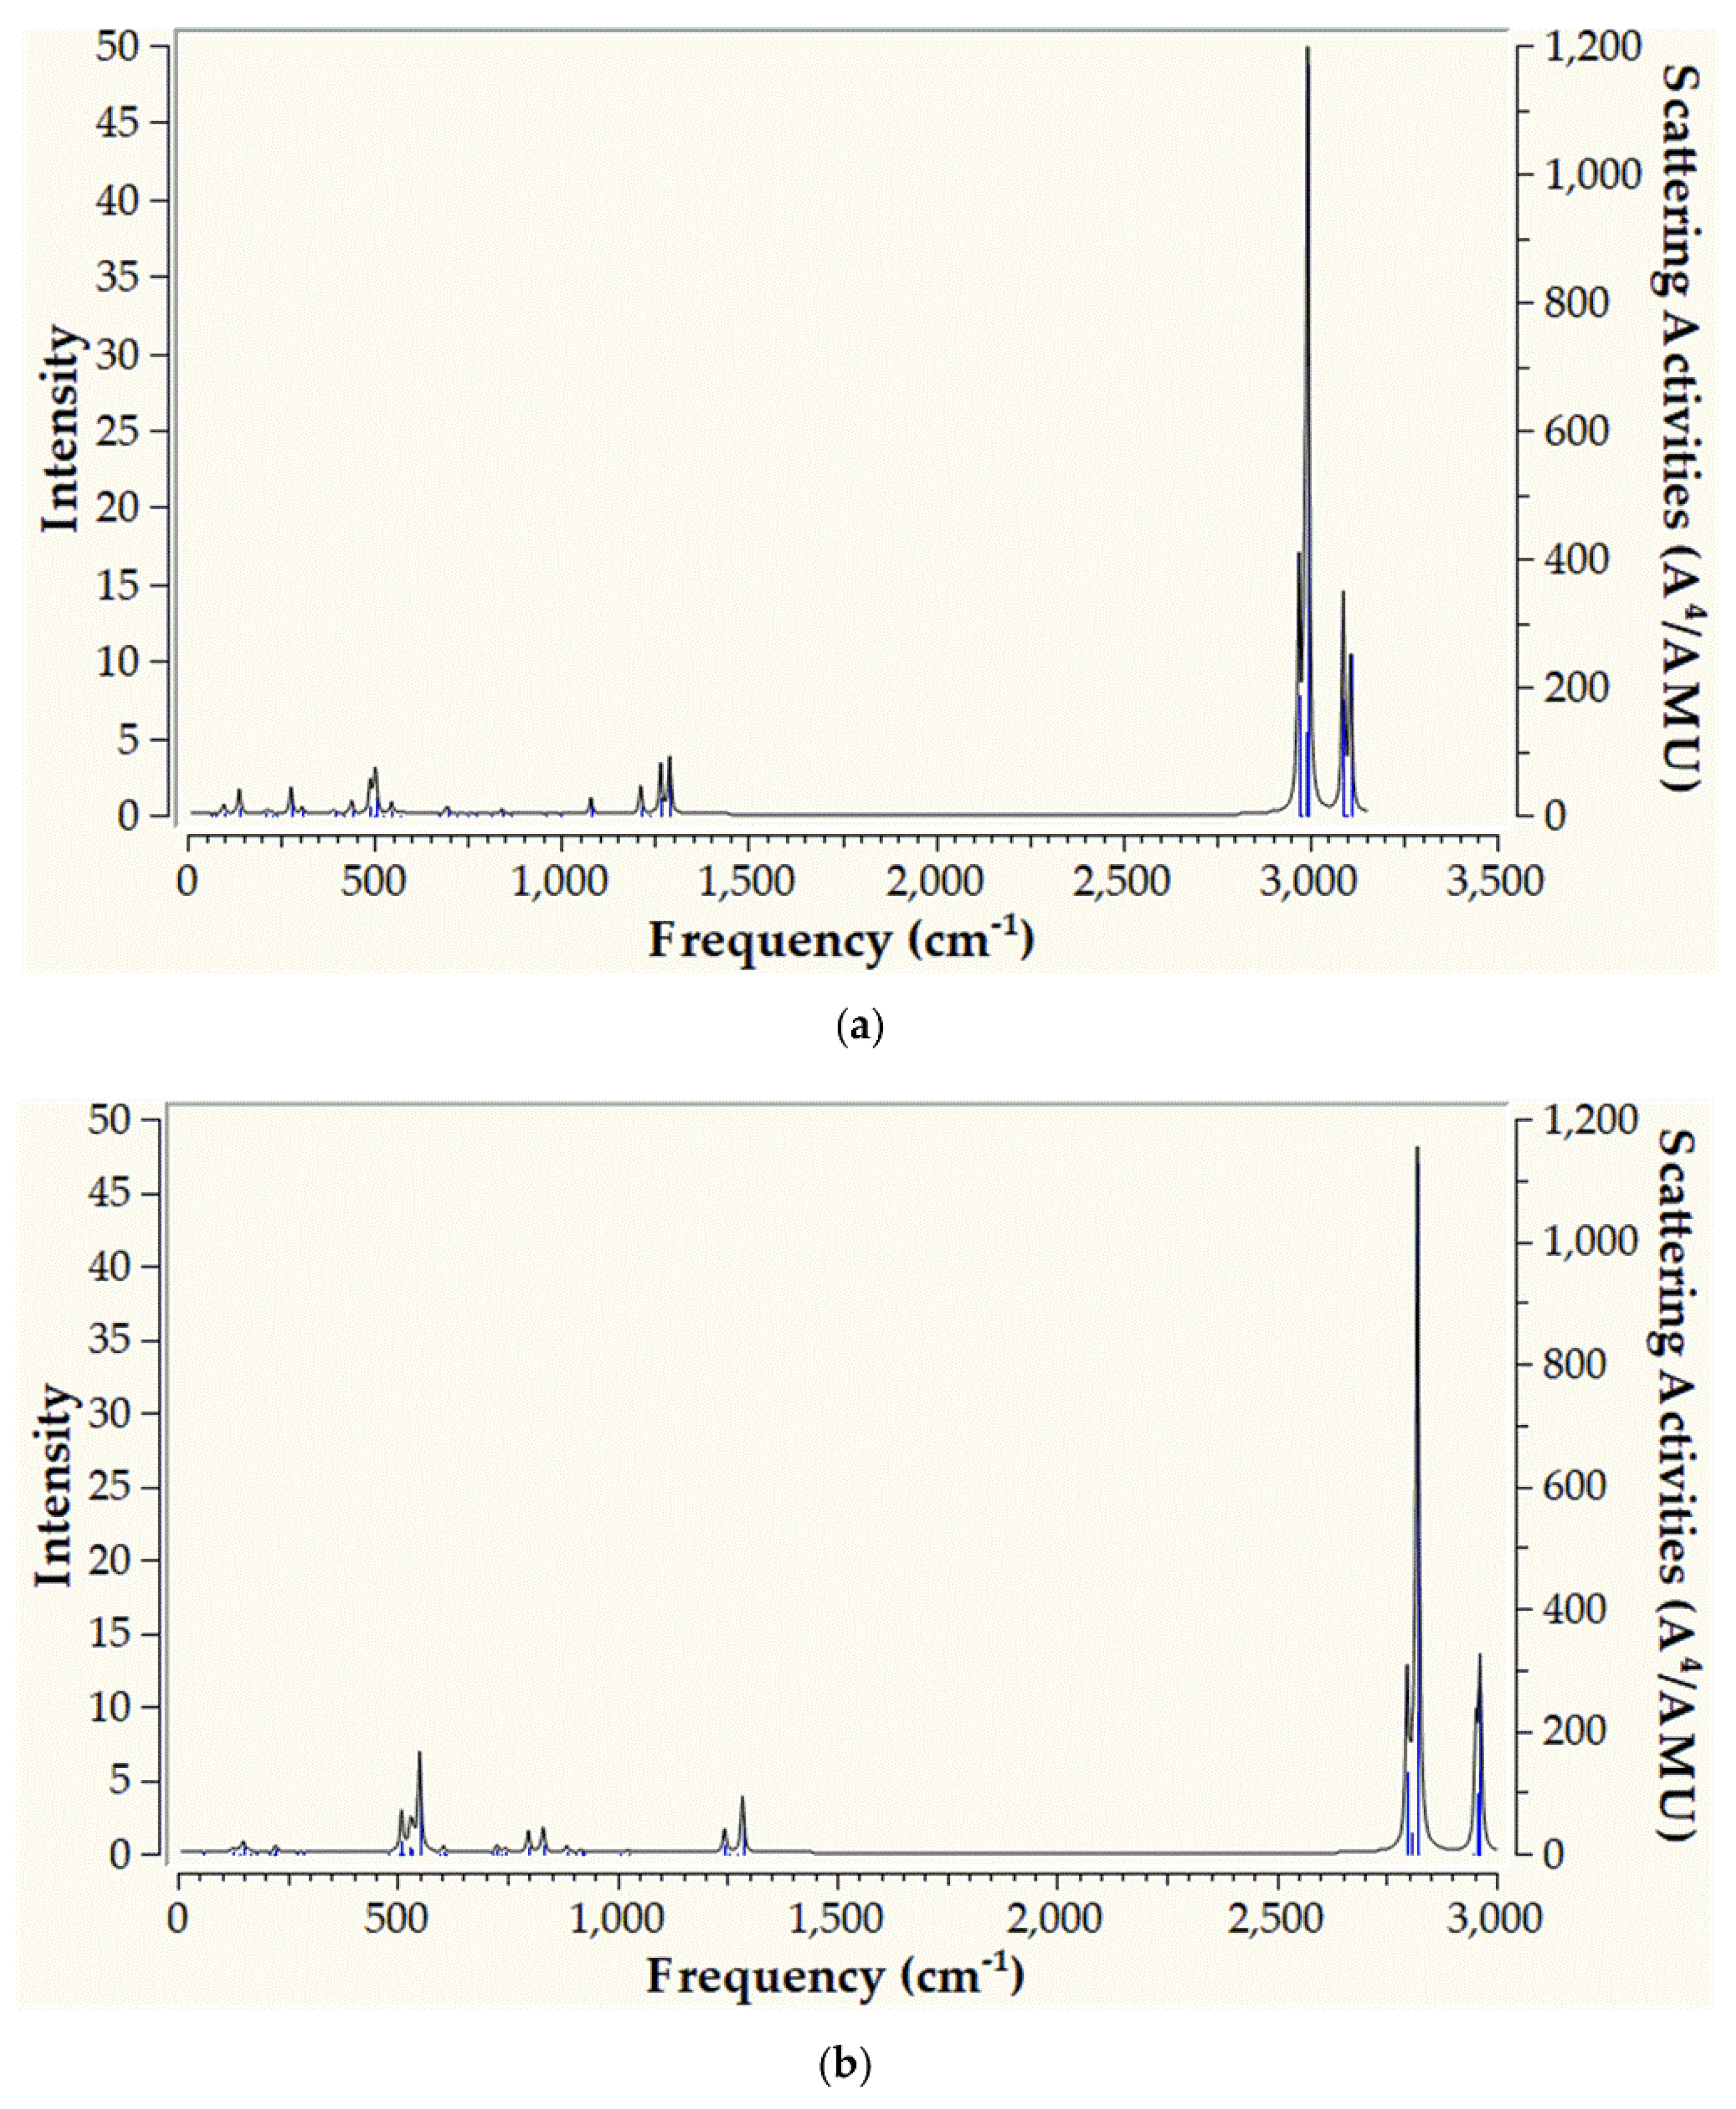
Raman spectroscopy is another useful method to estimate dinitrogen activation by metal complexes, being in certain cases, more reliable even than X-ray spectroscopy [32]. Therefore, we set out to calculated the Raman spectra of the ‘full face’ complexes under investigation. In
Figure 8 are depicted the simulated Raman spectra for the
1’’_Ru and
1’’_Os ‘full face’ clusters. The calculated Raman spectra of the rest of the ‘full face’ clusters are given in
Figures S7–S12 of the Supplementary Material. The simulated Raman spectra of both
1’’_Ru and
1’’_Os clusters are similar, exhibiting basically a very strong absorption at 3000 and 2800 cm
-1 respectively. In addition, there is a higher frequency absorption around 3100 and 2950 cm
-1 in the simulated spectra of
1’’_Ru and
1’’_Os clusters respectively while all the rest of the bands, appearing below 1500 cm
-1, are very weak (
Figure 8). These frequencies correspond to H atoms bending. The simulated Raman spectra of the rest of the ‘full face’ clusters are qualitatively very similar to those of
1’’_Ru and
1’’_Os. Therefore, they exhibit high frequency, very strong peaks above 2000 cm
-1 and a group of weak, lower frequencies, below 1500 cm
-1 all corresponding to H atoms bending.
In the Raman spectra, the
vs(N-N) symmetric stretching frequency is in general stronger than the respective frequency appearing in the IR spectra. For
1’’_Ru and
1’’_Os clusters
vs(N-N) appears at 1080 and 918 cm
-1 respectively but they are very weak. In
Table 1 are given the
vs(N-N) symmetric frequencies of the ‘full face’ clusters under study. An excellent linear correlation is observed between
Re(N-N) and the
vs(N-N) (
Figure 7). Based on this correlation we conclude that the lower the
vs(N-N) Raman stretching frequency the stronger the dinitrogen activation by the ‘full face’ clusters.
2.2.3. NMR Spectra
NMR spectroscopy has been routinely applied in the study of transition metal complexes [33]. In particular, Nitrogen-15 NMR has proven to be a powerful technique for studying dinitrogen fixation and activation by transition metal complexes [34-37]. Accordingly we simulated NMR spectra of the ‘full face’ complexes to assist a possible future experimental study. The Nitrogen-15 NMR isotropic chemical shielding tensors,
σiso(
15N) calculated for the N nuclei of the N
2 bridging ligand of the ‘full face’ clusters are tabulated in
Table 2. Also, in
Table 2 are included the Ruthenium-99,
σiso(
99Ru) and Osmium-187,
σiso(
187Os) NMR isotropic chemical shielding tensors calculated for the ‘full face’ clusters.
Perusal of
Table 2 reveals that the isotropic chemical shielding tensors of either dinitrogen or metal nuclei vary significantly upon the nature of the ‘full face’ cluster. Notice that, the
σiso(
15N) of the N nuclei of the free dinitrogen molecule, calculated at the PBE0/LANL2DZ(M)U6-31G(d,p)(E) level of theory, are equal to -318.4 ppm. Thus, upon coordination of N
2 to the metal centers of the ‘full face’ clusters, there is a shielding (upfield) of its constituent nuclei. Possibly, this is due to electron density being transferred from the metal centers towards the dinitrogen bridging ligand. The
σiso(
99Ru) and
σiso(
187Os) are in line with various experimental results [33].
2.3. Bonding Analysis
2.3.1. Natural Bond Orbitals
In order to get a deeper insight into the bonding of dinitrogen to the metal rings of the ‘full face’ clusters we employed the Natural Bond Orbital, NBO analysis method. In
Table 3 are given the most relevant results derived from the NBO analysis.
Inspection of
Table 3 reveals that the natural charges,
QM of the metal centers in the ‘full face’ clusters are positive in all cases with the exception of
6’’_Ru and
6’’_Os clusters where the metal centers acquire negative
QM. This signifies that upon formation of the ‘full face’ clusters, the metal centers should accept electron density basically from the bridging ligands L taking into account their formal oxidation state being equal to +2. On the other hand, N atoms of the N
2 bridging ligand acquire, in all cases, negative natural charges. The negative
QN of each N atom of dinitrogen is in the range -0.076 - -0.434|e| (
Table 3). In other words, the neutral ‘free’ dinitrogen accepts electron density upon fixation between the two metallic rings of the ‘full face’ clusters. Accordingly, the total natural charge of the bridging dinitrogen ligand in the ‘full face’ clusters is within the range -0.152 – -0.868|e|. Based on the
nec(M) and
nec(N) values given in
Table 3, the formation of the ‘full face’ clusters results in an electron density rearrangement. Therefore, the
nec(M) indicate that the Ru(II) and Os(II) metal centers depart from their formal valence electron configurations being 4d
6 and 5d
6 respectively, accepting electron density in these AOs in the range of 0.24 - 1.67 |e|. Also, the valence s and p AOs of the Ru(II) and Os(II) metal centers become populated accepting 0.22 – 0.63 and 0.14 – 0.45 |e|. Based on the
nec and
Q values of M and N, tabulated in
Table 3, it is obvious that dinitrogen accepts electron density from the metallic rings. Finally, the WBI(
μ3-N-M
3) values are around 2, indicating a strong covalent interaction between the N atoms of dinitrogen with the metal centers while the WBI(N-N) are around 1, reflecting the transformation of the triple N≡N bond of dinitrogen to N-N single bond upon fixation between the metallic rings of the ‘full face’ clusters. In
Figure 9 and
Figure 10 are depicted the relevant NBOs participating in donor-acceptor hyperconjugative interactions in
1’’_Ru.
According to the NBO analysis [38], charge transfer (CT) interactions between relevant donor-acceptor orbitals result in energy lowering of the system departing from the strictly localized natural Lewis structure that constitute the primary ‘noncovalent’ interactions. The energy lowering of this process is described in terms of the second order perturbation stabilization energy ΔE(2) associated with the specific donor-acceptor interactions.
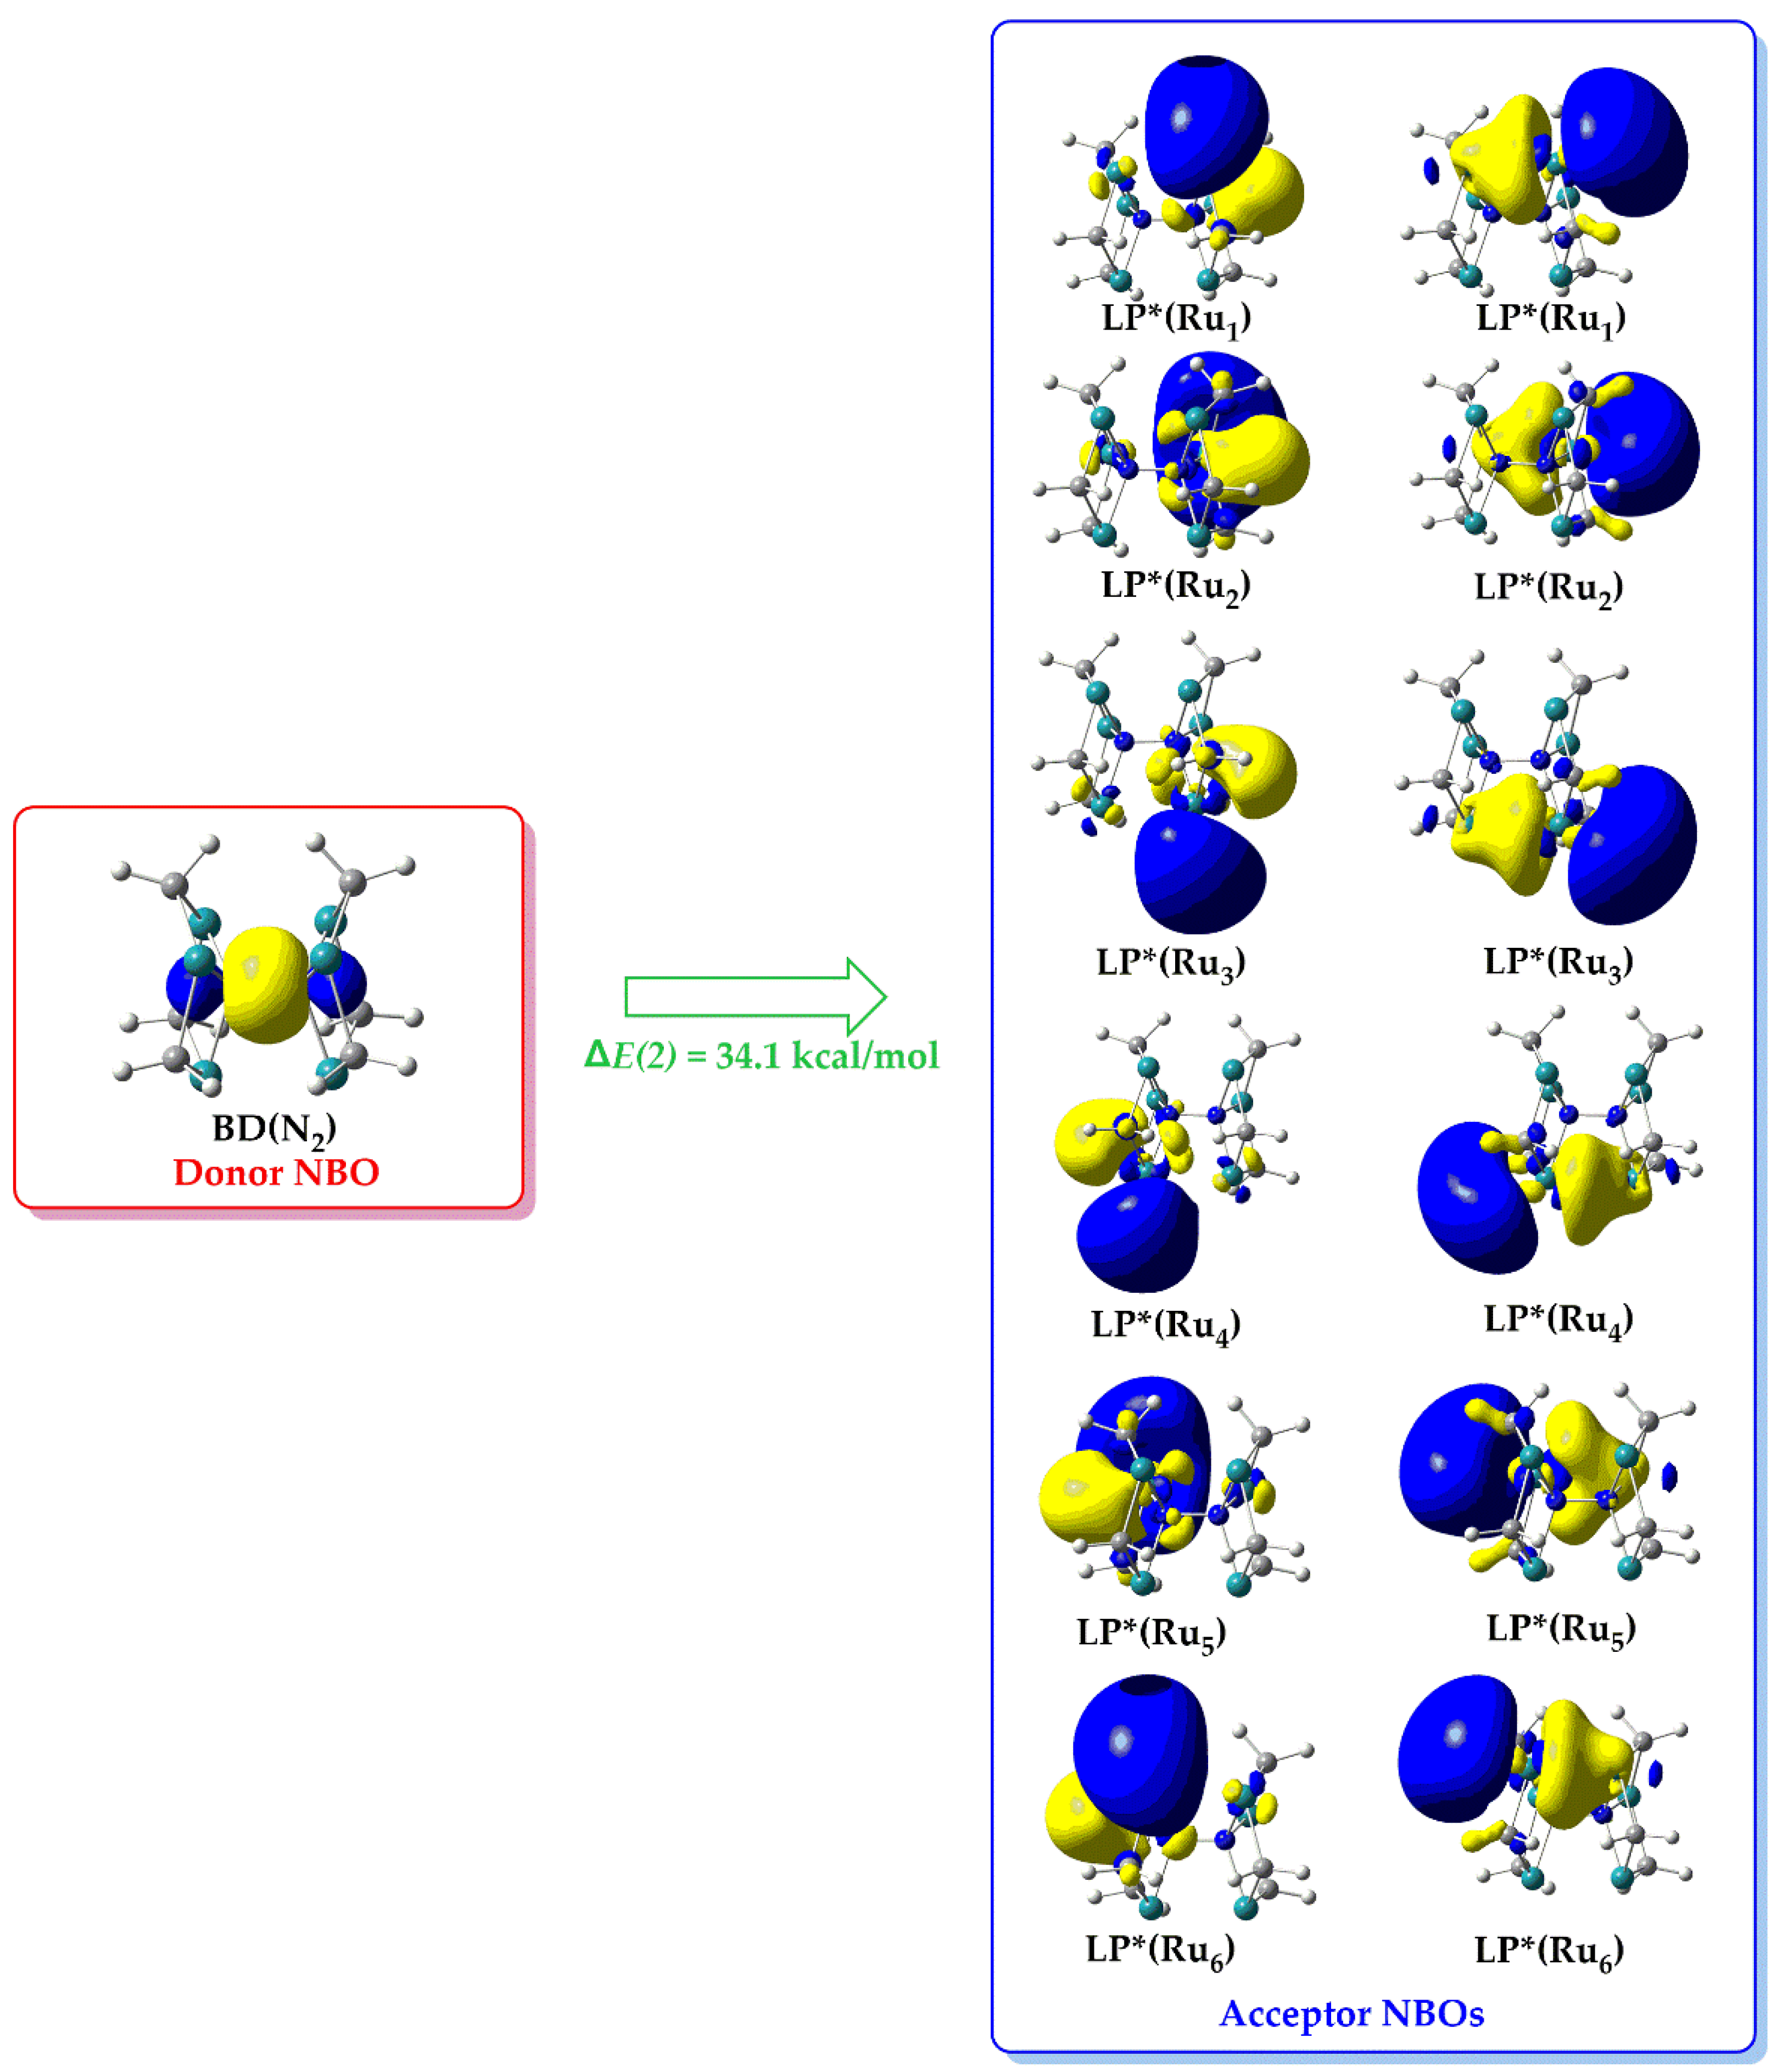
Inspection of
Figure 9 reveals that in
1’’_Ru there are twelve such donor-acceptor interactions where charge is transferred from the bonding NBO, BD(N
2) located on the dinitrogen ligand, towards the twelve lone-pair type antibonding NBOs, LP*(M) each located on one Ru metal center. The Δ
E(2) associated with the BD(N
2) → LP*(Ru) hyperconjugative donor-acceptor interaction is equal to 34.1 kcal/mol Notice that, the BD(N
2) is a bonding orbital located on the dinitrogen N-N bond while the LP*(Ru) NBOs are basically p – type AOs of the Ru metal centers. The BD(N
2) → LP*(Ru) hyperconjugative donor-acceptor interaction reflects the classical concept of the ligand to metal donation interaction observed for transition metal complexes. Analogous hyperconjugative donor-acceptor interactions were found also for the rest of the ‘full face’ clusters under investigation.
In
Table 4 are given the Δ
E(2)
don. values associated with donor-acceptor ‘
donation’ interactions, calculated for the ‘full face’ clusters under study. Perusal of
Table 4 reveals that Δ
E(2)
don. values are within the range 12 – 38 kcal/mol.
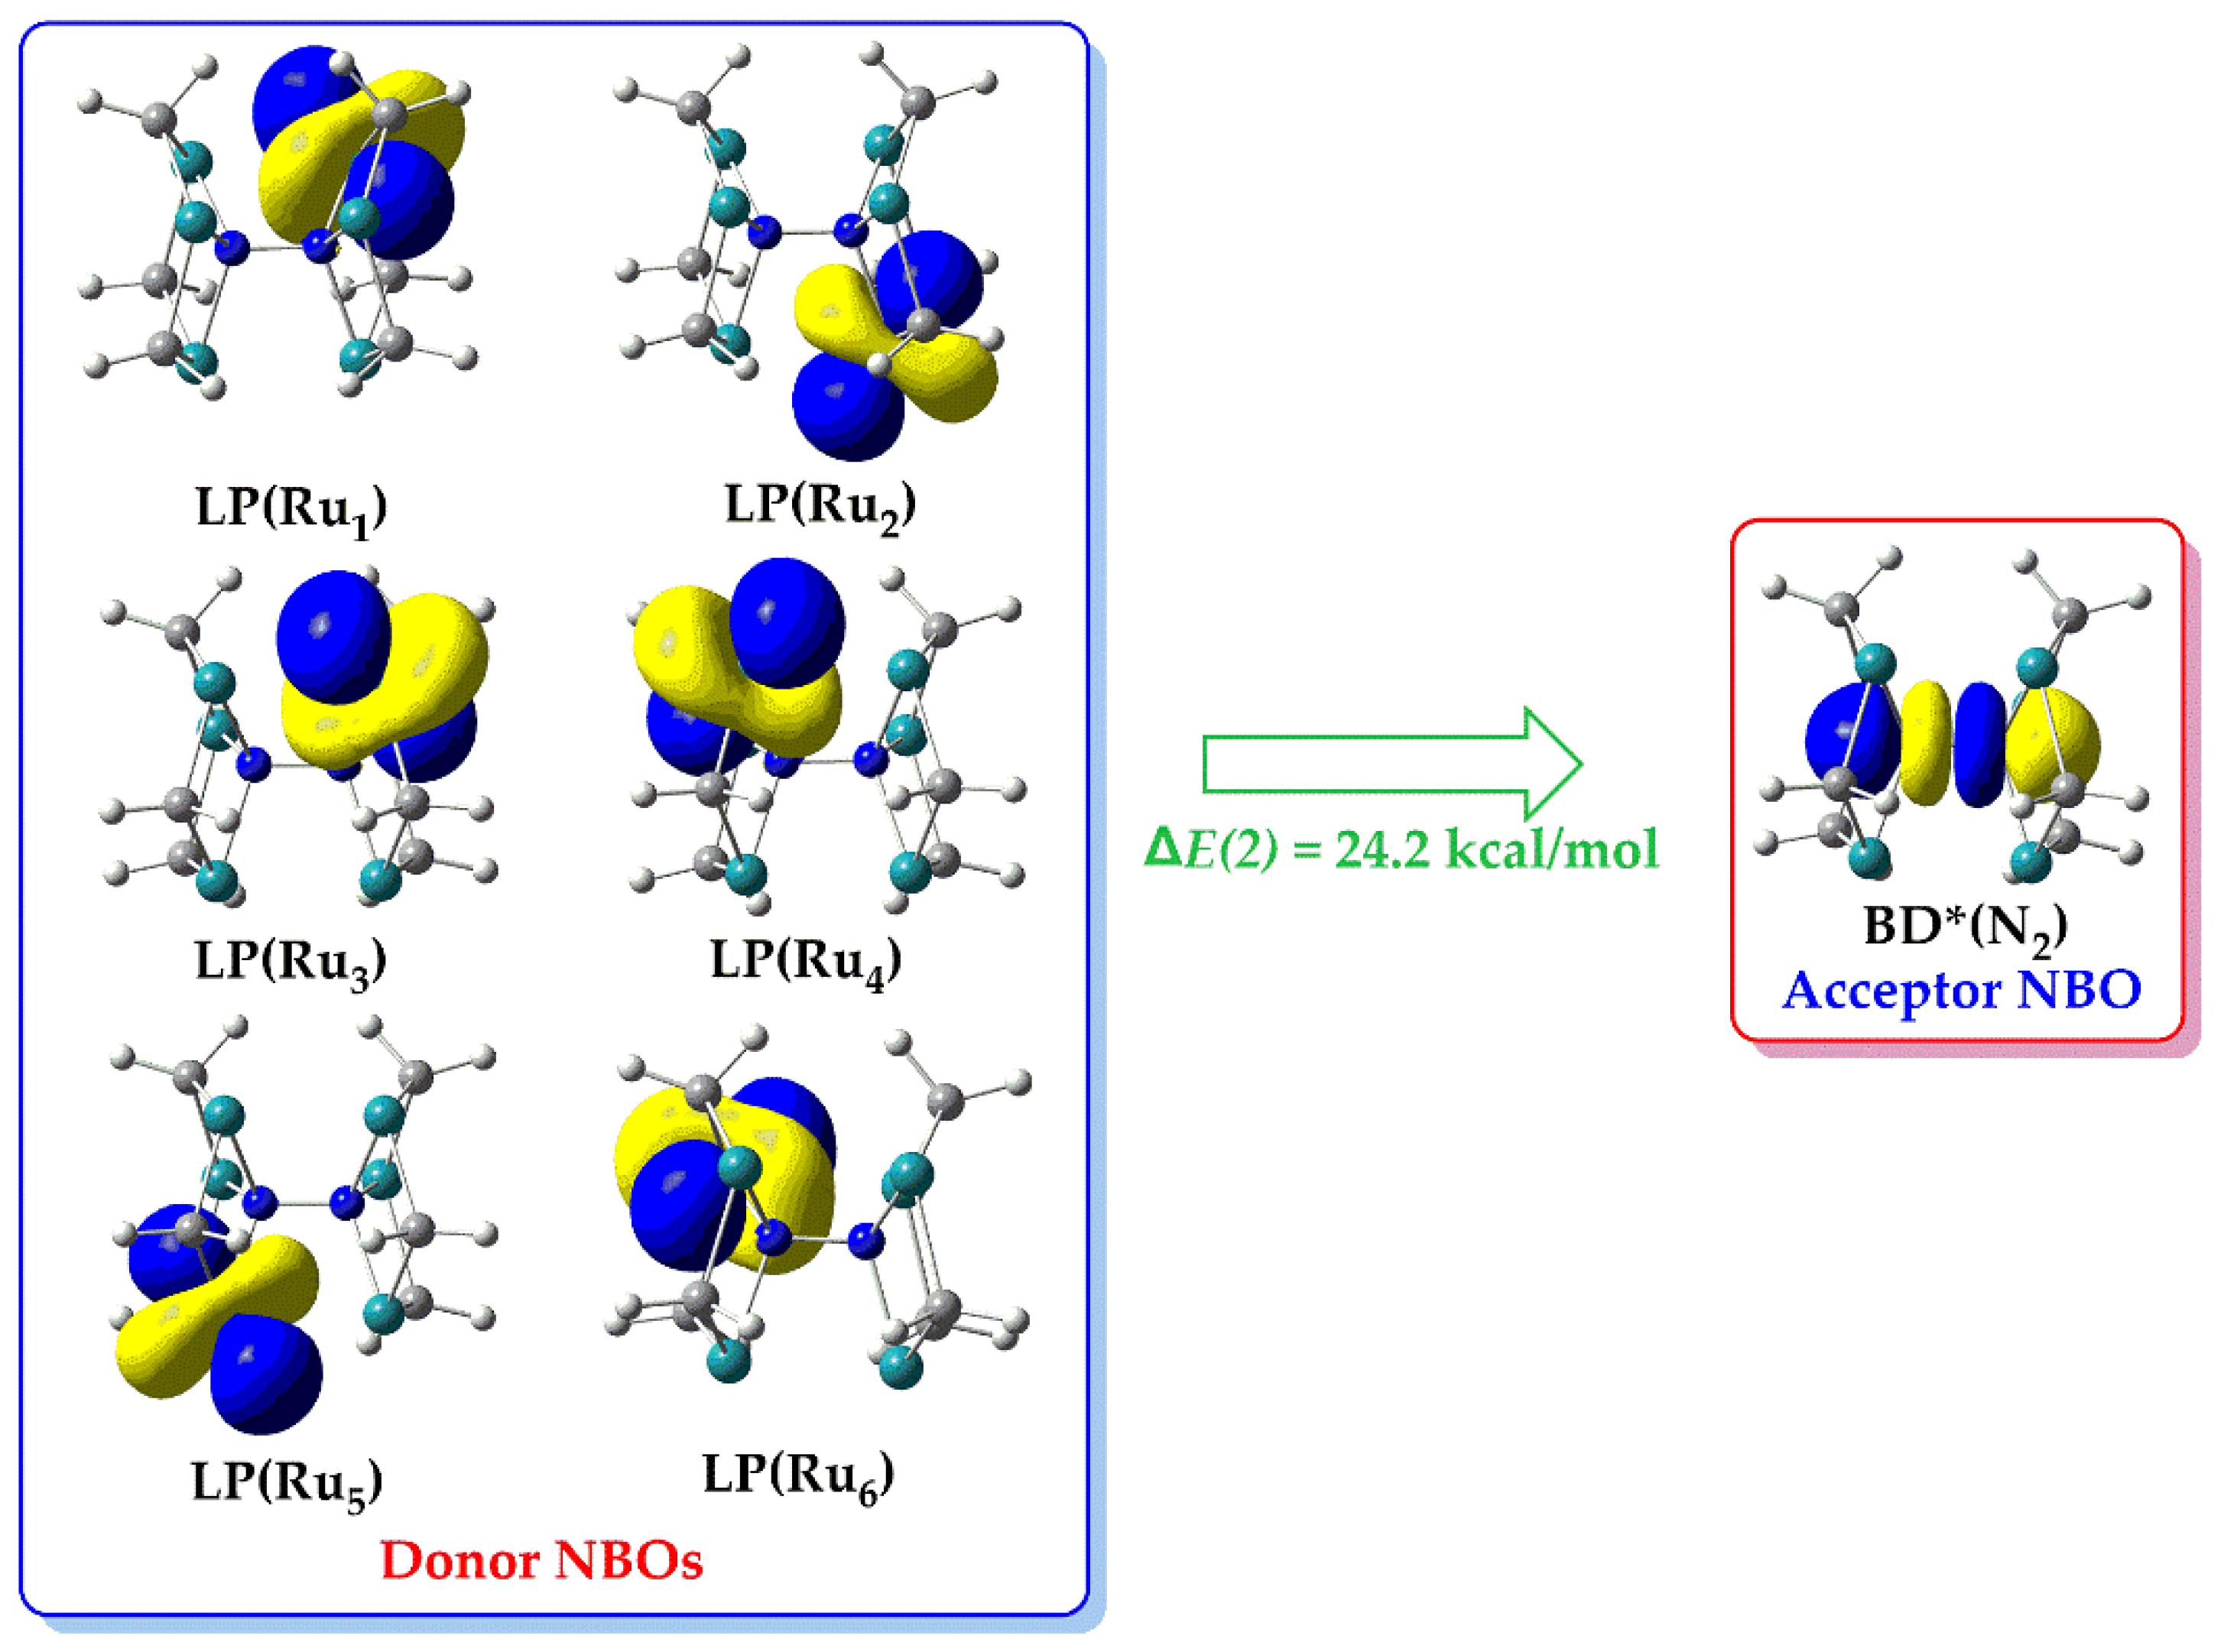
In
Figure 10 are depicted six donor-acceptor interactions where charge is transferred from the six lone-pair type bonding NBOs, LP(M), each located on one Ru metal center of
1’’_Ru, towards to an antibonding NBO, BD*(N
2) located on the dinitrogen ligand. The LP(M), NBOs are basically d
z2 – type AOs located on each Ru metal center while the BD*(N
2) is an antibonding orbital located on the N-N bond of the bridging dinitrogen ligand. The Δ
E(2) associated with LP(Ru) → BD*(N
2) hyperconjugative donor-acceptor interaction is equal to 24.2 kcal/mol, reflecting the so called metal to ligand backdonation interaction commonly observed for various transition metal complexes. Similar hyperconjugative donor-acceptor interactions are observed for the rest of the ‘full face’ clusters under study.
In
Table 4 are given the Δ
E(2)
back. values associated with donor-acceptor ‘
backdonation’ interactions, calculated for the ‘full face’ clusters under study. Inspection of
Table 4 reveals that Δ
E(2)
back. values are within the range 6 – 38 kcal/mol.
The overall stabilization of the ‘full face’ clusters due to the ‘
donation’ - ‘
backdonation’ hyperconjugative interactions is reflected by the sum Δ
E(2)
tot. equal to Δ
E(2)
don. + Δ
E(2)
back (
Table 4) found within the range 24 – 62 kcal/mol.
2.3.2. Atoms In Molecules
To further delineate the bonding properties of the ‘full face’ clusters we applied the Atoms In Molecules method, AIM of Bader [39,40]. The basic concept of the AIM method are the so called Critical Points, CPs. Accordingly, the presence of a Bond CP, BCP between two atoms indicates the existence of a bond. Macchi et al., [41] pointed out that for transition metal complexes the BCP representing a covalent bond should exhibit small 2ρBCP and ρBCP values, negative total energy density, HBCP < 0 and GBCP/ρBCP ratio lower than 1. The bonding interactions could be classified into three categories based upon the values of a set of parameters exhibited by a BCP namely the |VBCP|/GBCP ratio where VBCP is the potential energy density, GBCP is the kinetic energy density, the 2ρBCP as well the energy density HBCP [42]. Therefore, an interaction is characterized (a) as pure closed-shell (e.g. ionic, H-bond or van der Waals) if |VBCP|/GBCP < 1, 2ρBCP > 0 and HBCP > 0, (b) pure open-shell (covalent) if |VBCP|/GBCP > 2, 2ρBCP < 0 and HBCP < 0 and (c) intermediate with 1 < |VBCP|/GBCP < 2, 2ρBCP > 0 and HBCP < 0.
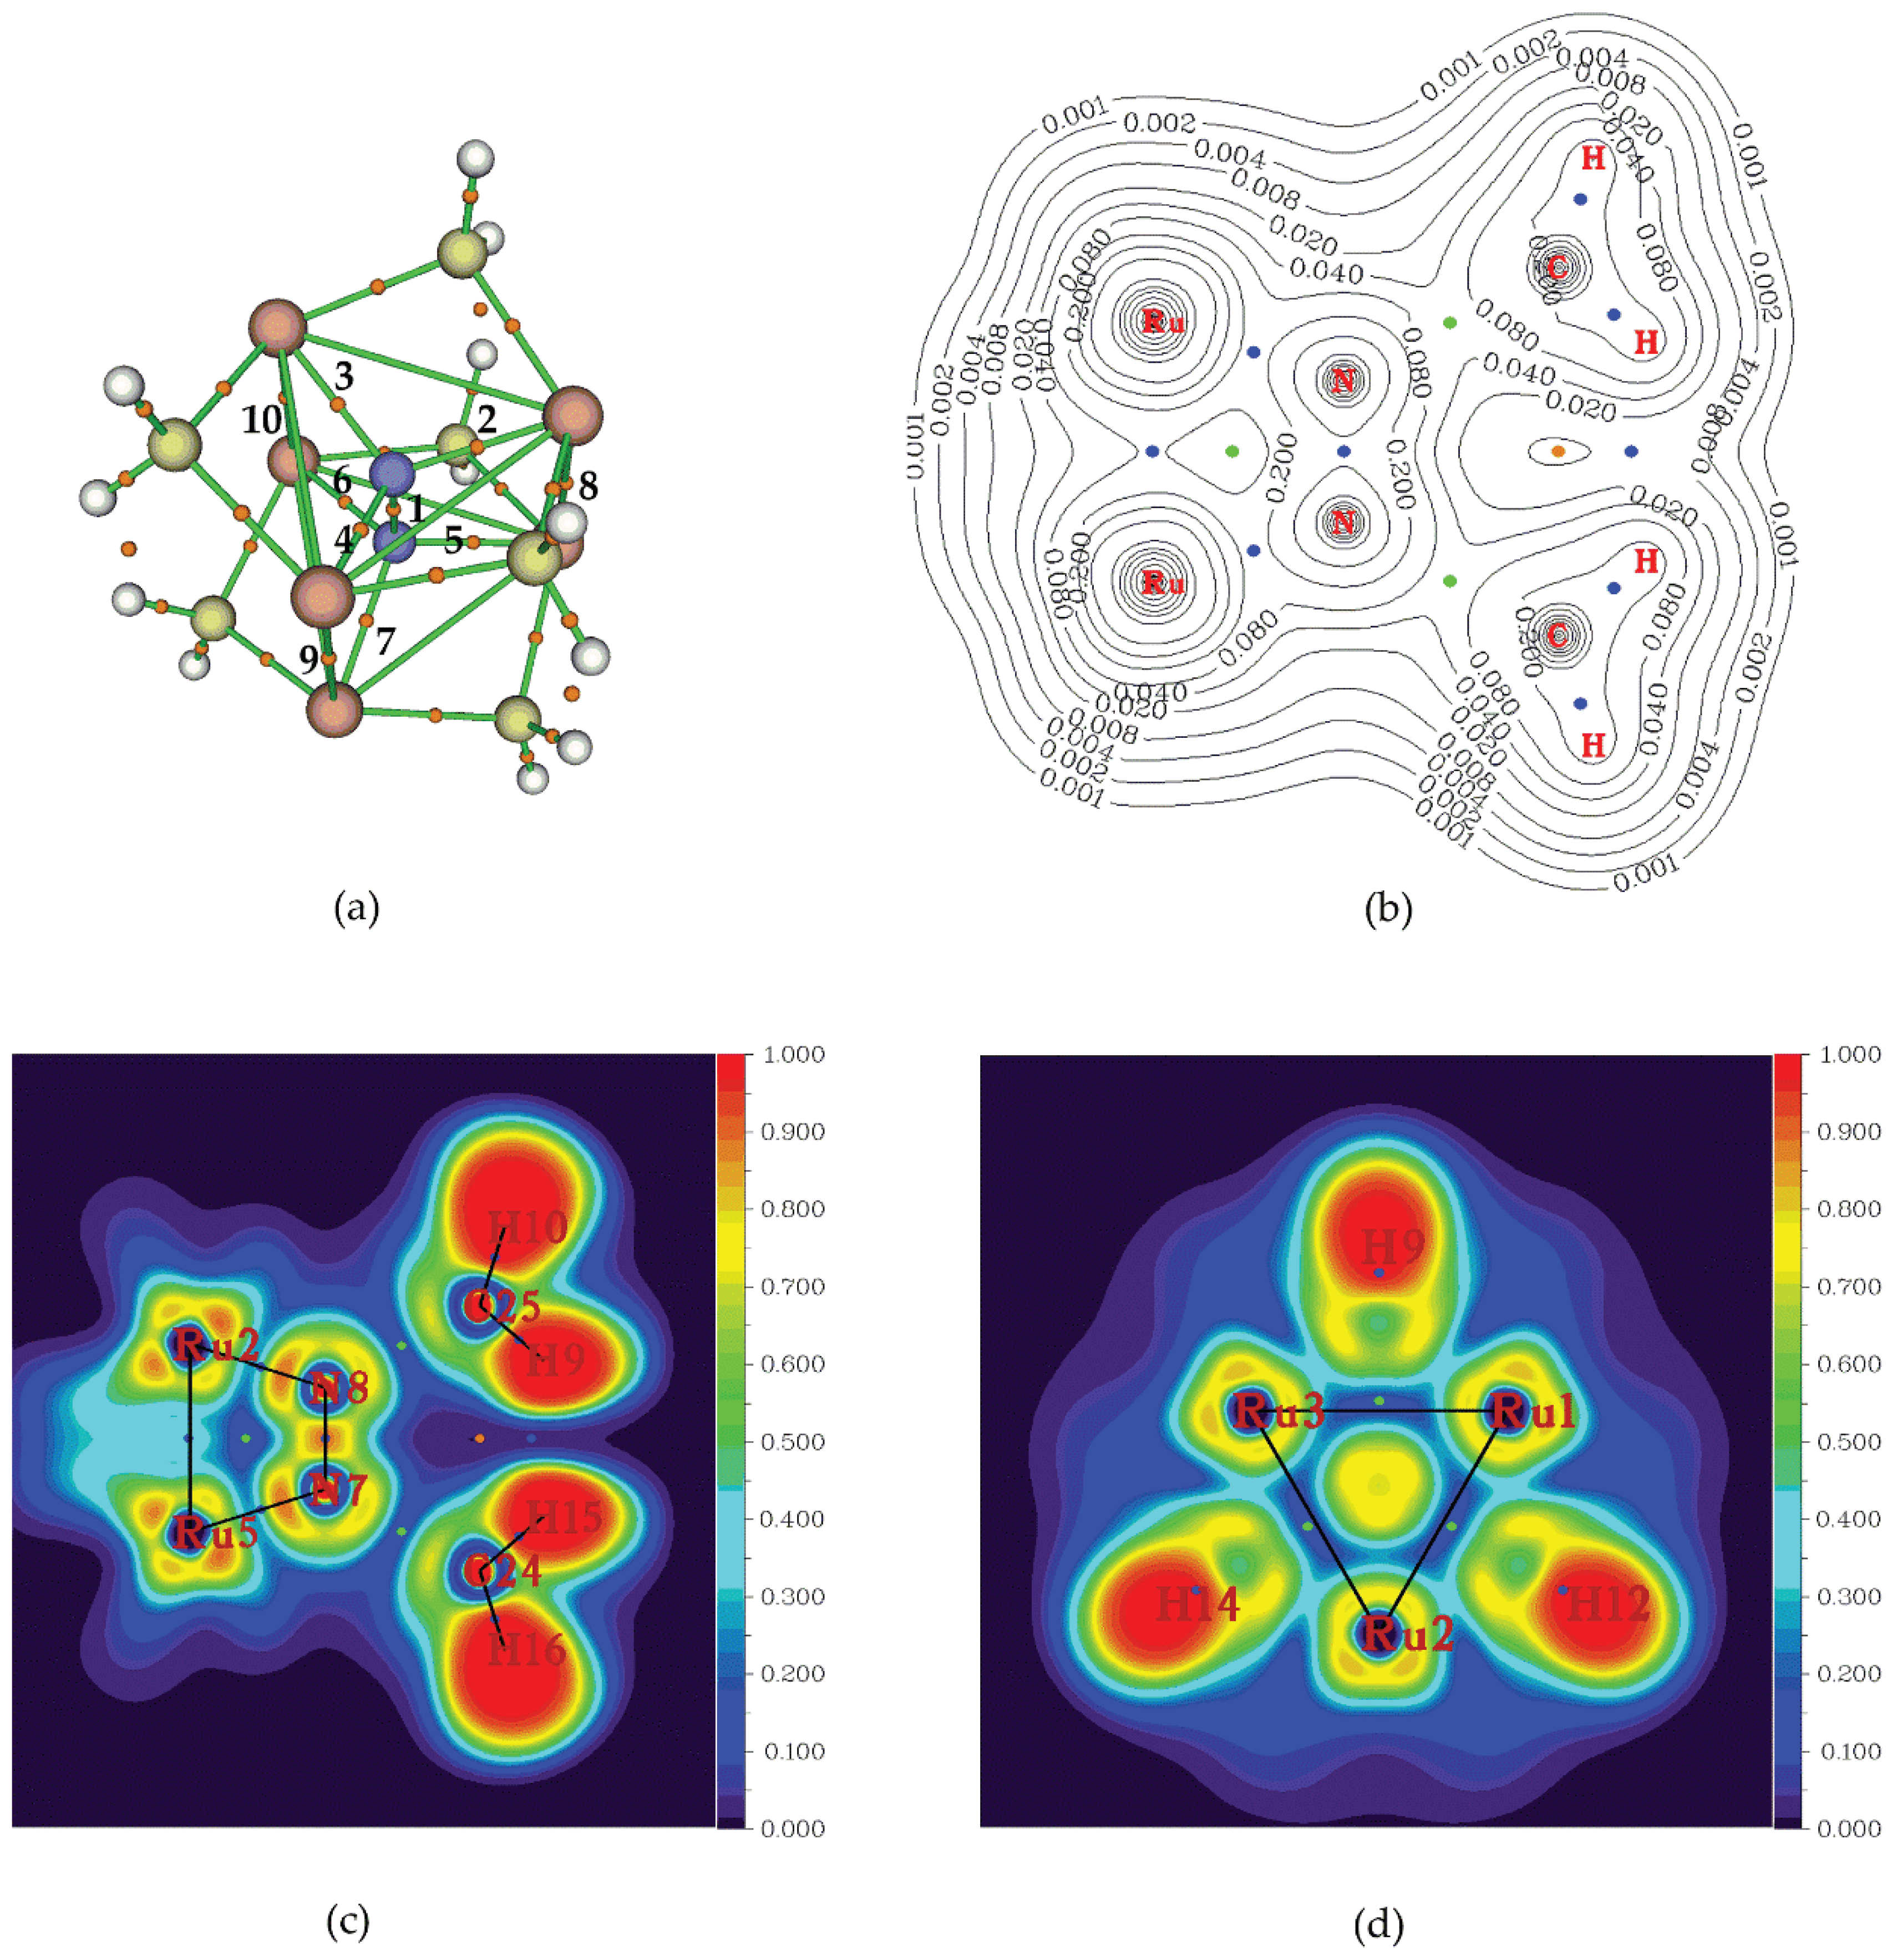
In
Figure 11a are the depicted the BCPs found for
1”_Ru ‘full face’ cluster upon employing the AIM method. As expected, there is a BCP (denoted as 1) in the middle between the two N atoms of the bridging dinitrogen ligand. Also, between each N atom and each of the three metal centres comprising the metal rings there are three BCPs and in total there are six such BCPs (denoted as 2 – 7). The existence of the latter, indicates formation of six bonds the bridging dinitrogen ligand with the six metal centres of
1”_Ru ‘full face’ cluster. Finally, it is worth noting that, there are also three BCPs (denoted as 8, 9, 10) in the middle between Ru atoms belonging to different metal ring and facing each other.
This implies that there is an onset of intermetallic interactions between the metal centres of the two triangular metallic rings upon ‘sandwiching’ the dinitrogen molecule. In
Table 5 and
Table 6 are given the values of certain parameters (vide supra) of chosen relevant BCPs found for Ru and Os ‘full face’ clusters respectively. Thus, for BCP(1) we observe that |
VBCP|/
GBCP > 2,
2ρBCP < 0 and
HBCP < 0 is valid in all cases, as expected, reflecting the covalent nature of the N-N bond of the bridging dinitrogen ligand. In most of the ‘full face’ clusters the BCP(2) found in the middle of the Ru-N distances (
Figure 11a) exhibits 1 < |
VBCP|/
GBCP < 2,
2ρBCP > 0 and
HBCP < 0 and therefore could be characterized as of intermediate nature. Exceptions are the
1”_Ru and
6”_Ru clusters for which the parameters on BCP(2) are found as |
VBCP|/
GBCP > 2,
2ρBCP < 0 and
HBCP < 0 and thus the Ru-N bonds are expected to be of pure covalent nature. Finally, the parameters found on BCP(3), between the metal centres, are 1 < |
VBCP|/
GBCP < 2,
2ρBCP > 0 and
HBCP < 0 and therefore these intermetallic interactions could be characterized as of intermediate nature. Again, exception is the
6”_Ru cluster where the parameters on BCP(3) are |
VBCP|/
GBCP > 2,
2ρBCP < 0 and
HBCP < 0 and the nature of the Ru-Ru intermetallic interactions is expected to be covalent.
The existence of the M-M intermetallic interactions could also be verified by the presence of the BCPs found in the contour line map of the electron density depicted in
Figure 11b (blue spheres). In addition, there are BCPs between the metal centres and the N atoms of the dinitrogen ligand reflecting the bond formation. Finally, there are also a few Ring Critical Points, RCPs (green spheres) reflecting steric effects.
In
Figure 11c,d are depicted the colour filled contour line plot of the Electron Localization Function, ELF. Inspection of these plots, clearly indicates the bonds formed (black lines) between dinitrogen and the metal centres as well as between the metal centres. Remarkably, the ELF is quite high (~ 0.7) at the centre of the metallic triangular ring (
Figure 11d), indicating metaloaromaticity. In addition, ELF signifies bond formation between the three metal centres of the metallic ring.
3. Methods
The geometries of all species under study were fully optimized in the gas phase, without symmetry constraints employing the PBE0 functional as implemented in the Gaussian16W software [43]. The PBE0 is a 1997 hybrid functional of Perdew, Burke and Ernzerhof which uses 25% exchange and 75% weighting correlation [44-49]. The LANL2DZ basis set was used for the metal atoms, M while the 6-31G(d,p) basis set was employed for the non-metal atoms, E. The computational protocol used is denoted as PBE0/LANL2DZ(M)U6-31G(d,p)(E). All stationary points have been identified as minima based on the absence of imaginary frequencies (NImag = 0). The Natural Bond Orbital Analysis (NBO) developed by Weinhold et al., [50] was employed as implemented in the G16W software. The Atoms In Molecules, AIM [39,40] and the Electron Localization Function, ELF [51] methods used as well as the respective plots were done as implemented in the Multiwfn3.8 software [52].
4. Conclusions
In this work, it has been demonstrated that in the {[(μ2-L)M)]6(μ-η1:η3-Ν2)}0/+6 hexametallic Ru(II) and Os(II) clusters, dinitrogen is strongly activated upon fixation between the two trinuclear metallic triangular rings. The extent of the N2 activation by the systems under study, is reflected in the calculated N-N bond lengths found in the range 1.299 – 1.487 Å as well as in the respective the vs(N-N) symmetric stretching frequencies being in the range 780 – 1270 cm-1. Both of these parameters i.e. Re(N-N) and vs(N-N) are common measures of the dinitrogen activation and for the systems under study indicate that transform N2 to hydrazido, N24- like species. Accordingly, Os(II) clusters activate more strongly the dinitrogen molecule than the Ru(II) clusters. The nature of the ligand L also affects the N2 activation which follows the orders BH2- < NH2- < OH- < CH2- < NH2- < PH2-, SH- and BH2- < NH2- < OH- < NH2- < CH2- < PH2- < SH- for the Ru(II) and Os(II) clusters respectively. The strongest N2 activation is observed for the 5”_Os cluster while the weakest for the 6”_Ru cluster. In addition, The calculated σiso(15N), NMR chemical shielding tensors, signify that, upon N2 fixation, there is a shielding (upfield) of its constituent nuclei possibly as a result of electron density being transferred from the metal centers towards the N nuclei. A multitude of bonding analysis methods i.e. NBO, AIM and ELF applied to study the interactions in the {[(μ2-L)M)]6(μ-η1:η3-Ν2)}0/+6 ‘full face’ clusters, reveal that there is a donation/back-donation charge transfer between the N2 ligand and the trinuclear metallic rings while the nature of this interaction is of mixed covalent/electrostatic character. Finally, there are intermetallic interactions between the metal centers located either in the same ring or to the two opposing rings of the ‘full face’ clusters. The current study delineated the so far unspecified nature of the bonding interaction of dinitrogen with hexametallic clusters and could serve also as a test bed to model the interactions occurring during N2 fixation/activation at the six Fe metal cluster of nitrogenase.
Supplementary Materials
The following supporting information can be downloaded at:
www.mdpi.com/xxx/s1, Figure S1: Simulated IR spectra of
2”_Ru (a) and
3”_Ru (b) calculated at the PBE0/LANL2DZ(M)U6-31G(d,p)(E) level of theory in the gas phase, Figure S2: Simulated IR spectra of
4”_Ru (a) and
5”_Ru (b) calculated at the PBE0/LANL2DZ(M)U6-31G(d,p)(E) level of theory in the gas phase, Figure S3: Simulated IR spectra of
6”_Ru (a) and
7”_Ru (b) calculated at the PBE0/LANL2DZ(M)U6-31G(d,p)(E) level of theory in the gas phase, Figure S4: Simulated IR spectra of
2”_Os (a) and
3”_Os (b) calculated at the PBE0/LANL2DZ(M)U6-31G(d,p)(E) level of theory in the gas phase, Figure S5: Simulated IR spectra of
4”_Os (a) and
5”_Os (b) calculated at the PBE0/LANL2DZ(M)U6-31G(d,p)(E) level of theory in the gas phase, Figure S6: Simulated IR spectra of
6”_Os (a) and
7”_Os (b) calculated at the PBE0/LANL2DZ(M)U6-31G(d,p)(E) level of theory in the gas phase, Figure S7: Simulated Raman spectra of
2”_Ru (a) and
3”_Ru (b) calculated at the PBE0/LANL2DZ(M)U6-31G(d,p)(E) level of theory in the gas phase, Figure S8: Simulated Raman spectra of
4”_Ru (a) and
5”_Ru (b) calculated at the PBE0/LANL2DZ(M)U6-31G(d,p)(E) level of theory in the gas phase, Figure S9: Simulated Raman spectra of
6”_Ru (a) and
7”_Ru (b) calculated at the PBE0/LANL2DZ(M)U6-31G(d,p)(E) level of theory in the gas phase, Figure S10: Simulated Raman spectra of
2”_Os (a) and
3”_Os (a) calculated at the PBE0/LANL2DZ(M)U6-31G(d,p)(E) level of theory in the gas phase, Figure S11: Simulated Raman spectra of
4”_Os (a) and
5”_Os (b) calculated at the PBE0/LANL2DZ(M)U6-31G(d,p)(E) level of theory in the gas phase, Figure S12: Simulated Raman spectra of
6”_Os (a) and
7”_Os (b) calculated at the PBE0/LANL2DZ(M)U6-31G(d,p)(E) level of theory in the gas phase, Table S1: Cartesian Coordinates and Energetic Data of the optimized geometries of all species calculated at the PBE0/LANL2DZ(M)U6-31G(d,p)(E) level of theory in the gas phase.
Author Contributions
Conceptualization, A.T.; methodology, A.T.; software, A.T. and S.S.; validation, A.T. and S.S.; formal analysis, A.T. and S.S.; investigation, S.S.; resources, A.T and S.S.; data curation, A.T. and S.S.; writing—original draft preparation, A.T.; writing—review and editing, A.T.; visualization, A.T. and S.S.; supervision, A.T.; project administration, A.T. All authors have read and agreed to the published version of the manuscript.
Funding
This research received no external funding.
Data Availability Statement
Conflicts of Interest
The authors declare no conflicts of interest.
References
- Stirbet, A.; Lazár, D.; Guo, Y.; Govindjee, G. Photosynthesis: basics, history and modelling. Annals of Botany 2020, 126, 511–537. [Google Scholar] [CrossRef]
- Eaton-Rye, J. J.; Tripathy, B. C.; Sharkey, T. D. Photosynthesis: plastid biology, energy conversion and carbon assimilation. Springer: Dordrecht, Netherlands, 2012.
- Blankenship, R. E. Molecular Mechanisms of Photosynthesis, 2nd ed. Wiley-Blackwell: Oxford, U. K., 2014.
- Walter, M. D. Recent Advances in Transition Metal-Catalyzed Dinitrogen Activation. In Advances in Organometallic Chemistry; Pérez, P. J., Ed.; Elsevier: Amsterdam, Netherlands, 2016; Volume 3, pp. 261–377. [Google Scholar] [CrossRef]
- Burgess, B. K.; Lowe, D. J. Mechanism of Molybdenum Nitrogenase. Chem. Rev. 1996, 96, 2983–3011. [Google Scholar] [CrossRef]
- Stavrev, K. K.; Zerner, M. C. A Theoretical Model for the Active Site of Nitrogenase. Chem. Eur. J. 1996, 2, 83–87. [Google Scholar] [CrossRef]
- Smil V. Enriching the earth: Fritz Haber, Carl Bosch, and the transformation of world food production. Cambridge (MA), USA, 2004.
- Rouwenhorst, K. H. R.; Elishav, O.; Mosevitzky Lis, B.; Grader, G. S.; Mounaïm-Rousselle, C.; Roldan, A.; Valera-Medina, A. Future Trends. In Techno-Economic Challenges of Green Ammonia as an Energy Vector; Valera-Medina, A., Banares-Alcantara, R., Eds.; Academic Press, Elsevier: Amsterdam, Netherlands, 2021; pp. 303–319. [Google Scholar] [CrossRef]
- Masero, F.; Perrin, M. A.; Dey, S.; Mougel, V. Dinitrogen Fixation: Rationalizing Strategies Utilizing Molecular Complexes. Chem. Eur. J. 2021, 27, 3892–3928. [Google Scholar] [CrossRef] [PubMed]
- Akter, R.; Shah, S. S.; Ehsan, M. A.; Nasiruzzaman Shaikh, M. Md.; Zahir, H.; Md. Aziz, A.; Saleh Ahammad, A. J. Transition-metal-based Catalysts for Electrochemical Synthesis of Ammonia by Nitrogen Reduction Reaction: Advancing the Green Ammonia Economy. Chem Asian J. 2023, e202300797. [Google Scholar] [CrossRef]
- Liu, H.; Wei, L.; Liu, F.; Pei, Z.; Shi, J.; Wang, Z.; He, D.; Chen, Y. Homogeneous, Heterogeneous, and Biological Catalysts for Electrochemical N2 Reduction toward NH3 under Ambient Conditions. ACS Catal. 2019, 9, 5245–5267. [Google Scholar] [CrossRef]
- Lee, C.; Yan, Q. Electrochemical reduction of nitrogen to ammonia: Progress, challenges and future outlook. Curr. Opin. in Electrochem. 2021, 29, 100808–100814. [Google Scholar] [CrossRef]
- Huang, Z.; Rafiq, M.; Woldu, A.R.; Tong, Q.-X.; Astruc, D.; Hu, L. Recent progress in electrocatalytic nitrogen reduction to ammonia (NRR). Coord. Chem. Rev. 2023, 478, 214981. [Google Scholar] [CrossRef]
- Ojelade, O. A.; Zaman, S. F.; Ni, B.-J. Green ammonia production technologies: A review of practical progress. J. Environ. Manag. 2023, 342, 118348. [Google Scholar] [CrossRef] [PubMed]
- Cui. X.; Tang, C.; Zhang, Q. A Review of Electrocatalytic Reduction of Dinitrogen to Ammonia under Ambient Conditions. Adv. Energy Mater. 2018, 8, 1800369. [Google Scholar] [CrossRef]
- Xue, X.; Chen, R.; Yan, C.; Zhao, P.; Hu, Y.; Zhang, W.; Yang, S.; Jin, Z. Review on photocatalytic and electrocatalytic artificial nitrogen fixation for ammonia synthesis at mild conditions: Advances, challenges and perspectives. Nano Res. 2019, 12, 1229–1249. [Google Scholar] [CrossRef]
- Lundquist, P. O.; Hussdanell, K. Nitrogenase Activity and Amounts of Nitrogenase Proteins in a Frankia-alnus Incana Symbiosis Subjected to Darkness. Plant Physiol. 1991, 95, 808–813. [Google Scholar] [CrossRef]
- Kuriyama<monospace>, S.; </monospace> Nishibayashi, Y. Development of catalytic nitrogen fixation using transition metal complexes not relevant to nitrogenases. Tetrahedron 2021, 83, 131986. [Google Scholar]
- Stucke, N.; Floser, B. M.; Weyrich, T.; Tuczek, F. Nitrogen Fixation Catalyzed by Transition Metal Complexes: Recent Developments. Eur. J. Inorg. Chem. 2018, 1337–1355. [Google Scholar] [CrossRef]
- Tanabe, Y.; Nishibayashi, Y. Recent advances in catalytic nitrogen fixation using transition metal–dinitrogen complexes under mild reaction conditions. Coord. Chem. Rev. 2022, 472, 214783. [Google Scholar] [CrossRef]
- Tanaka, H.; Yoshiaki Nishibayashi, Y.; Yoshizawa, K. Interplay between Theory and Experiment for Ammonia Synthesis Catalyzed by Transition Metal Complexes. Acc. Chem. Res. 2016, 49, 987–995. [Google Scholar] [CrossRef] [PubMed]
- Allen, A. D.; Senoff, C. V. Nitrogenopentammineruthenium(II) complexes. Chem. Commun. 1965, 621–622. [Google Scholar] [CrossRef]
- Tavella, F.; Giusi, D.; Ampelli, C. Nitrogen reduction reaction to ammonia at ambient conditions: A short review analysis of the critical factors limiting electrocatalytic performance. Curr. Opin. Green and Sustain. Chem. 2022, 35, 100604. [Google Scholar] [CrossRef]
- Stucke, N.; Floser, B. M.; Weyrich, T.; Tuczek, F. Nitrogen Fixation Catalyzed by Transition Metal Complexes: Recent Developments. Eur. J. Inorg. Chem. 2018, 1337–1355. [Google Scholar] [CrossRef]
- Singh, D.; Buratto, W. R.; Torres, J. F.; Murray, L. J. Activation of Dinitrogen by Polynuclear Metal Complexes. Chem. Rev. 2020, 120, 5517–5581. [Google Scholar] [CrossRef]
- Kim, S.; Loose, F.; Chirik, P. J. Beyond Ammonia: Nitrogen−Element Bond Forming Reactions with Coordinated Dinitrogen. Chem. Rev. 2020, 120, 5637–5681. [Google Scholar] [CrossRef]
- Tanaka, H.; Nishibayashi, Y.; Yoshizawa, K. Interplay between Theory and Experiment for Ammonia Synthesis Catalyzed by Transition Metal Complexes. Acc. Chem. Res. 2016, 49, 987–995. [Google Scholar] [CrossRef] [PubMed]
- Shan, H.; Yang, Y.; James, A. J.; Sharp, P. R. Dinitrogen Bridged Gold Clusters. Science, 1997, 275, 1460–1462. [Google Scholar] [CrossRef]
- Fajardo, Jr. J.; Peters, J. C. Catalytic Nitrogen-to-Ammonia Conversion by Osmium and Ruthenium Complexes. J. Am. Chem. Soc. 2017, 139, 16105–16108. [Google Scholar] [CrossRef] [PubMed]
- Batsanov, S.S. , Intramolecular Contact Radii Close to the van der Waals Radii. Zh. Neorg. Khim., 2000, 45, 992–996. [Google Scholar]
- Fryzuk, M. D.; Johnson S., A. The continuing story of dinitrogen activation. Coord. Chem. Rev. 2000, 200–202, 379–409. [Google Scholar] [CrossRef]
- Fieser, M. E.; Woen, D. H.; Corbey, J. F.; Mueller, T. J.; Ziller, J. W.; Evans, W. J. Raman spectroscopy of the N–N bond in rare earth dinitrogen complexes, Dalton Trans. 2016, 45, 14634-14644. [CrossRef]
- Xue, Z.-L.; Cook, T. M. Solution NMR of transition metal complexes. In Comprehensive Inorganic Chemistry III; Reedijk, J., Poeppelmeier, K. R., Eds.; 3rd ed. Elsevier: Amsterdam, Netherlands, 2023; Volume 9, pp. 660–744. [Google Scholar] [CrossRef]
- Donovan-Mtunzi, S.; Richards, R. L. Spectroscopy of Terminal Dinitrogen Complexes: Nitrogen-15 and Phosphorus-31 Nuclear Magnetic Resonance. J. Chem. Soc. Dalton Trans. 1984, 469–474. [Google Scholar] [CrossRef]
- Evans, W. J.; Ulibarri, T. A.; Ziller, J. W. Isolation and X-ray Crystal Structure of the First Dinitrogen Complex of an f-Element Metal, [(C5Me5)2Sm]2N2. J. Am. Chem. Soc. 1988, 110, 6879–6880. [Google Scholar] [CrossRef]
- Shima, T.; Hu, S.; Luo, G.; Kang, X.; Luo, Y.; Hou, Z. Dinitrogen Cleavage and Hydrogenation by a Trinuclear Titanium Polyhydride Complex. Science 2013, 340, 1549–1552. [Google Scholar] [CrossRef]
- Bruch, Q. J.; Lindley, B. M.; Askevold, B.; Sven Schneider, S.; Miller, A. J. M. Inorg. Chem. 2018, 57, 1964–1975. [CrossRef]
- Reed, A. E.; Curtiss, L. A.; Weinhold, F. Chem. Rev. 1988, 88, 899–926. [CrossRef]
- Bader, R.F.W. Atoms in Molecules—A Quantum Theory; Oxford University Press: Oxford, UK, 1990. [Google Scholar]
- Bader, R.F.W. A Bond Path: A Universal Indicator of Bonded Interactions. J. Phys. Chem. A 1998, 102, 7314–7323. [Google Scholar] [CrossRef]
- Macchi, P.; Sironi, A. Chemical bonding in transition metal carbonyl clusters: Complementary analysis of theoretical and experimental electron densities. Coord. Chem. Rev. 2003, 383, 238–239. [Google Scholar] [CrossRef]
- Espinosa, E.; Alkorta, I.; Elguero, J.; Molins, E. From weak to strong interactions: A comprehensive analysis of the topological and energetic properties of the electron density distribution involving X–H⋯F–Y systems. J. Chem. Phys. 2002, 117, 5529–5542. [Google Scholar] [CrossRef]
- Gaussian 16, Revision C.01, Frisch, M. J.; Trucks, G. W.; Schlegel, H. B.; Scuseria, G. E.; Robb, M. A.; Cheeseman, J. R.; Scalmani, G.; Barone, V.; Petersson, G. A.; Nakatsuji, H.; Li, X.; Caricato, M.; Marenich, A. V.; Bloino, J.; Janesko, B. G.; Gomperts, R.; Mennucci, B.; Hratchian, H. P.; Ortiz, J. V.; Izmaylov, A. F.; Sonnenberg, J. L.; Williams-Young, D.; Ding, F.; Lipparini, F.; Egidi, F.; Goings, J.; Peng, B.; Petrone, A.; Henderson, T.; Ranasinghe, D.; Zakrzewski, V. G.; Gao, J.; Rega, N.; Zheng, G.; Liang, W.; Hada, M.; Ehara, M.; Toyota, K.; Fukuda, R.; Hasegawa, J.; Ishida, M.; Nakajima, T.; Honda, Y.; Kitao, O.; Nakai, H.; Vreven, T.; Throssell, K.; Montgomery, J. A., Jr.; Peralta, J. E.; Ogliaro, F.; Bearpark, M. J.; Heyd, J. J.; Brothers, E. N.; Kudin, K. N.; Staroverov, V. N.; Keith, T. A.; Kobayashi, R.; Normand, J.; Raghavachari, K.; Rendell, A. P.; Burant, J. C.; Iyengar, S. S.; Tomasi, J.; Cossi, M.; Millam, J. M.; Klene, M.; Adamo, C.; Cammi, R.; Ochterski, J. W.; Martin, R. L.; Morokuma, K.; Farkas, O.; Foresman, J. B.; Fox, D. J. Gaussian, Inc., Wallingford CT, 2016.
- Vetere, V.; Adamo, C.; Maldivi, P. Performance of the ‘parameter free’ PBE0 functional for the modeling of molecular properties of heavy metals. Chem. Phys. Lett. 2000, 325, 99–105. [Google Scholar] [CrossRef]
- Adamo, C.; Barone, V. Inexpensive and accurate predictions of optical excitations in transition-metal complexes: The TDDFT/PBE0 route. Theor. Chem. Acc. 2000, 105, 169–172. [Google Scholar] [CrossRef]
- Adamo, C.; Barone, V. Toward reliable density functional methods without adjustable parameters: The PBE0 model. J. Chem. Phys. 1999, 110, 6158–6170. [Google Scholar] [CrossRef]
- Ernzerhof, M.; Scuseria, G.E. Assessment of the Perdew–Burke–Ernzerhof exchange-correlation functional. J. Chem. Phys. 1999, 110, 5029–5036. [Google Scholar] [CrossRef]
- Adamo, C.; Scuseria, G.E.; Barone, V. Accurate excitation energies from time-dependent density functional theory: Assessing the PBE0 model. J. Chem. Phys. 1999, 111, 2889–2899. [Google Scholar] [CrossRef]
- Adamo, C.; Barone, V. Toward reliable adiabatic connection models free from adjustable parameters. Chem. Phys. Lett. 1997, 274, 242–250. [Google Scholar] [CrossRef]
- Reed, A.E.; Curtiss, L.A.; Weinhold, F. Intermolecular Interactions from a Natural Bond Orbital, Donor-Acceptor Viewpoint. Chem. Rev. 1988, 88, 899–926. [Google Scholar] [CrossRef]
- Becke, A. D.; Edgecombe, K. E. A simple measure of electron localization in atomic and molecular systems. J. Chem. Phys. 1990, 92, 5397–5403. [Google Scholar] [CrossRef]
- Lu, T.; Chen, F. Multiwfn: A multifunctional wavefunction analyser. J. Comp. Chem. 2012, 33, 580–592. [Google Scholar] [CrossRef] [PubMed]
Scheme 1.
Dinitrogen bonding modes to metal center(s) of transition metal complexes.
Scheme 1.
Dinitrogen bonding modes to metal center(s) of transition metal complexes.
Figure 1.
Geometries of the [(μ2-L)M]30/+3 complexes along with selected structural parameters calculated at the PBE0/LANL2DZ(M)U6-31G(d,p)(E) level of theory.
Figure 1.
Geometries of the [(μ2-L)M]30/+3 complexes along with selected structural parameters calculated at the PBE0/LANL2DZ(M)U6-31G(d,p)(E) level of theory.
Figure 2.
Geometries of the ‘open face’ clusters along with selected structural parameters calculated at the PBE0/LANL2DZ(M)U6-31G(d,p)(E) level of theory.
Figure 2.
Geometries of the ‘open face’ clusters along with selected structural parameters calculated at the PBE0/LANL2DZ(M)U6-31G(d,p)(E) level of theory.
Figure 3.
Geometries of the ‘full face’ Ru clusters along with selected structural parameters calculated at the PBE0/LANL2DZ(M)U6-31G(d,p)(E) level of theory.
Figure 3.
Geometries of the ‘full face’ Ru clusters along with selected structural parameters calculated at the PBE0/LANL2DZ(M)U6-31G(d,p)(E) level of theory.
Figure 4.
Geometries of the ‘full face’ Os clusters along with selected structural parameters calculated at the PBE0/LANL2DZ(M)U6-31G(d,p)(E) level of theory.
Figure 4.
Geometries of the ‘full face’ Os clusters along with selected structural parameters calculated at the PBE0/LANL2DZ(M)U6-31G(d,p)(E) level of theory.
Figure 5.
IR spectra of 1’’_Ru (a) and 1’’_Os (b) calculated at the PBE0/LANL2DZ(M)U6-31G(d,p)(E) level of theory.
Figure 5.
IR spectra of 1’’_Ru (a) and 1’’_Os (b) calculated at the PBE0/LANL2DZ(M)U6-31G(d,p)(E) level of theory.
Figure 6.
Vibrational normal modes for relevant peaks in the simulated IR spectra of 1’’_Ru (a) and 1’’_Os (b) calculated at the PBE0/LANL2DZ(M)U6-31G(d,p)(E) level of theory.
Figure 6.
Vibrational normal modes for relevant peaks in the simulated IR spectra of 1’’_Ru (a) and 1’’_Os (b) calculated at the PBE0/LANL2DZ(M)U6-31G(d,p)(E) level of theory.
Figure 7.
Linear correlation of vs(N-N) stretching frequency versus Re(N-N) of dinitrogen bridging ligand in ‘full face’ clusters.
Figure 7.
Linear correlation of vs(N-N) stretching frequency versus Re(N-N) of dinitrogen bridging ligand in ‘full face’ clusters.
Figure 8.
Simulated Raman spectra of 1’’_Ru (a) and 1’’_Os (b) calculated at the PBE0/LANL2DZ(M)U6-31G(d,p)(E) level of theory.
Figure 8.
Simulated Raman spectra of 1’’_Ru (a) and 1’’_Os (b) calculated at the PBE0/LANL2DZ(M)U6-31G(d,p)(E) level of theory.
Figure 9.
3D isosurface plots of donor/acceptor NBOs participating in the bridging dinitrogen, (μ-η1:η3-Ν2) to metallic rings, cyclo-Ru3 ‘donation’ hyperconjugative interactions in 1’’_Ru.
Figure 9.
3D isosurface plots of donor/acceptor NBOs participating in the bridging dinitrogen, (μ-η1:η3-Ν2) to metallic rings, cyclo-Ru3 ‘donation’ hyperconjugative interactions in 1’’_Ru.
Figure 10.
3D isosurface plots of donor/acceptor NBOs participating in the metallic rings, cyclo-Ru3 to bridging dinitrogen, (μ-η1:η3-Ν2) ‘backdonation’ hyperconjugative interactions in 1’’_Ru.
Figure 10.
3D isosurface plots of donor/acceptor NBOs participating in the metallic rings, cyclo-Ru3 to bridging dinitrogen, (μ-η1:η3-Ν2) ‘backdonation’ hyperconjugative interactions in 1’’_Ru.
Figure 11.
(a) Relevant BCPs (orange spheres) of 1”_Ru, (b) Contour lines plot of electron density of 1”_Ru, (blue and green spheres represent BCPs and RCPs respectively) (c) Colour contour plot of ELF cutting through yz plane (side view of 1’’_Ru cluster) and (d) Colour contour plot of ELF cutting through xy plane (above view of 1’’_Ru cluster). Blue, green and orange spheres on ELF plots, represent BCPs, RCPs and CCPs respectively.
Table 1.
Re(N-N) bond length (in Å) and vs(N-N) (in cm-1) IR and Raman symmetric stretching frequencies of the ‘full face’ complexes calculated at the PBE0/LANL2DZ(M)U6-31G(d,p)(E) level of theory.
Table 1.
Re(N-N) bond length (in Å) and vs(N-N) (in cm-1) IR and Raman symmetric stretching frequencies of the ‘full face’ complexes calculated at the PBE0/LANL2DZ(M)U6-31G(d,p)(E) level of theory.
| Complex |
Re |
vs(N-N) (IR) |
vs(N-N) (Raman) |
| 1’’_Ru |
1.358 |
1109 |
1080 |
| 2’’_Ru |
1.363 |
1148 |
1144 |
| 3’’_Ru |
1.410 |
955 |
949 |
| 4’’_Ru |
1.355 |
1181 |
1177 |
| 5’’_Ru |
1.410 |
960 |
954 |
| 6’’_Ru |
1.299 |
1270 |
1270 |
| 7’’_Ru |
1.331 |
1208 |
1208 |
| 1’’_Os |
1.431 |
918 |
918 |
| 2’’_Os |
1.418 |
997 |
998 |
| 3’’_Os |
1.460 |
837 |
837 |
| 4’’_Os |
1.418 |
998 |
998 |
| 5’’_Os |
1.410 |
779 |
760 |
| 6’’_Os |
1.452 |
876 |
832 |
| 7’’_Os |
1.423 |
957 |
957 |
Table 2.
15N, 99Ru and 187Os isotropic chemical shielding tensors (in ppm) calculated for the ‘full face’ clusters at the PBE0/LANL2DZ(M)U6-31G(d,p)(E) level of theory.
Table 2.
15N, 99Ru and 187Os isotropic chemical shielding tensors (in ppm) calculated for the ‘full face’ clusters at the PBE0/LANL2DZ(M)U6-31G(d,p)(E) level of theory.
| Complex |
σiso(15N) |
σiso(99Ru) |
σiso(187Os) |
| 1’’_Ru |
141.8 |
1293.7 |
|
| 2’’_Ru |
168.5 |
2331.3/2137.3 |
|
| 3’’_Ru |
305.7/-100.9 |
1522.1/1534.3 |
|
| 4’’_Ru |
68.0 |
3487.7 |
|
| 5’’_Ru |
182.8 |
1983.6 |
|
| 6’’_Ru |
-24.2 |
-993.4/-662.1 |
|
| 7’’_Ru |
14.0 |
-1574.1/-1553.7 |
|
| 1’’_Os |
111.4 |
|
-828.8 |
| 2’’_Os |
147.5 |
|
-1169.7 |
| 3’’_Os |
117.3/166.8 |
|
-923.4/-843.0 |
| 4’’_Os |
124.0 |
|
-1586.8 |
| 5’’_Os |
131.1 |
|
-1146.0 |
| 6’’_Os |
227.6 |
|
-702.2/-692.9/-491.1 |
| 7’’_Os |
40.7 |
|
-1480.1/-962.8 |
Table 3.
Natural charge, Q, natural electron configuration, nec, Wiberg Bond Index, WBI, derived from NBO analysis of the ‘full face’ complexes at the PBE0/LANL2DZ(M)U6-31G(d,p)(E) level of theory.
Table 3.
Natural charge, Q, natural electron configuration, nec, Wiberg Bond Index, WBI, derived from NBO analysis of the ‘full face’ complexes at the PBE0/LANL2DZ(M)U6-31G(d,p)(E) level of theory.
| Complex |
QM
|
QN1
|
nec(M) |
nec(N)1
|
WBI(μ3-N-M3) |
WBI(N-N) |
| 1’’_Ru |
0.243 |
-0.076 |
5s0.334d7.205p0.275d0.01
|
2s1.292p3.773p0.01
|
2.183 |
1.038 |
| 2’’_Ru |
0.820 |
-0.239 |
5s0.224d6.765p0.225d0.02
|
2s1.512p4.393p0.01
|
2.037 |
1.097 |
| 0.987 |
5s0.244d6.655p0.145d0.02
|
2.032 |
| 3’’_Ru |
0.325 |
-0.317 |
5s0.364d7.165p0.155d0.01
|
2s1.432p3.873p0.01
|
1.986 |
0.988 |
| 0.309 |
5s0.344d7.125p0.245d0.02
|
| 0.118 |
-0.249 |
5s0.314d7.215p0.385d0.02
|
2s1.382p3.853p0.01
|
2.077 |
| 0.340 |
5s0.354d7.165p0.155d0.01
|
| 4’’_Ru |
0.320 |
-0.155 |
5s0.284d6.975p0.285d0.02
|
2s1.322p3.813p0.01
|
2.255 |
1.081 |
| 0.465 |
-0.224 |
5s0.314d7.085p0.295d0.02
|
2s1.362p3.843p0.01
|
2.159 |
| 5’’_Ru |
0.419 |
-0.266 |
5s0.294d7.025p0.265d0.02
|
2s1.382p3.873p0.01
|
2.049 |
1.047 |
| 6’’_Ru |
-0.148 |
-0.207 |
5s0.294d7.675p0.245d0.01
|
2s1.302p3.883p0.01
|
1.829 |
1.280 |
| -0.382 |
5s0.334d7.665p0.455d0.02
|
| 7’’_Ru |
0.380 |
-0.174 |
5s0.334d6.935p0.385d0.02
|
2s1.322p3.833p0.01
|
2.119 |
1.157 |
| 0.445 |
5s0.334d7.005p0.385d0.02
|
| 1’’_Os |
1.017 |
-0.350 |
6s0.395d6.436p0.206d0.02
|
2s1.382p3.953p0.01
|
2.106 |
0.927 |
| 0.977 |
6s0.385d6.486p0.206d0.02
|
| 2’’_Os |
0.400 |
-0.259 |
6s0.435d6.846p0.356d0.02
|
2s1.332p3.913p0.01
|
2.313 |
0.939 |
| 0.203 |
6s0.465d6.936p0.436d0.02
|
| 3’’_Os |
0.389
0.362 |
-0.347
-0.311 |
6s0.535d6.926p0.186d0.01
|
2s1.372p3.923p0.01
2s1.412p3.923p0.01
|
2.210
2.171 |
0.921 |
| 6s0.485d6.906p0.266d0.01
|
| 6s0.445d6.956p0.356d0.01
|
| 4’’_Os |
1.264 |
-0.434 |
6s0.325d6.246p0.206d0.02
|
2s1.382p4.033p0.01
|
2.173 |
0.929 |
| 5’’_Os |
0.521 |
-0.394 |
6s0.415d6.806p0.296d0.02
|
2s1.412p3.973p0.01
|
2.173 |
0.921 |
| 6’’_Os |
-0.135 |
-0.266 |
6s0.585d7.246p0.316d0.01
|
2s1.402p3.843p0.01
|
2.011 |
0.946 |
| -0.112 |
6s0.525d7.306p0.366d0.01
|
| -0.070 |
6s0.635d7.226p0.326d0.01
|
| 7’’_Os |
0.501 |
-0.277 |
6s0.615d6.666p0.256d0.02
|
2s1.332p3.923p0.01
|
2.348 |
0.945 |
| 0.492 |
6s0.485d6.636p0.426d0.02
|
Table 4.
Hyperconjugative interaction stabilization energy ΔE(2) (in kcal/mol).
Table 4.
Hyperconjugative interaction stabilization energy ΔE(2) (in kcal/mol).
| Complex |
ΔE(2)don.1
|
ΔE(2)back2
|
ΔE(2)tot.3
|
| 1’’_Ru |
34.1 |
24.2 |
58.3 |
| 2’’_Ru |
38.3 |
17.9 |
56.2 |
| 3’’_Ru |
16.5 |
19.0 |
35.5 |
| 4’’_Ru |
28.3 |
22.6 |
50.9 |
| 5’’_Ru |
16.0 |
18.6 |
34.6 |
| 6’’_Ru |
19.0 |
6.1 |
25.1 |
| 7’’_Ru |
25.8 |
19.2 |
45 |
| 1’’_Os |
15.7 |
19.7 |
35.4 |
| 2’’_Os |
29.4 |
32.7 |
62.1 |
| 3’’_Os |
12.5 |
26.4 |
38.9 |
| 4’’_Os |
15.5 |
38.0 |
53.5 |
| 5’’_Os |
16.0 |
30.4 |
46.4 |
| 6’’_Os |
12.7 |
11.5 |
24.2 |
| 7’’_Os |
21.8 |
38.3 |
60.1 |
Table 5.
Topological and energetic properties of ρ(r) calculated at relevant (3,–1) bond critical points (BCPs) of the Ru ‘full face’ clusters.
Table 5.
Topological and energetic properties of ρ(r) calculated at relevant (3,–1) bond critical points (BCPs) of the Ru ‘full face’ clusters.
| Complex |
BCP |
ρBCPa
|
ρBCPb
|
GBCPc
|
VBCPc
|
|VBCP|/GBCP
|
HBCPc
|
GBCP/ρBCP
|
| 1’’_Ru |
1 |
0.367 |
-0.709 |
0.197 |
-0.572 |
2.904 |
-0.347 |
0.537 |
| 2 |
0.262 |
-0.842 |
0.049 |
-0.308 |
6.286 |
-0.259 |
0.187 |
| 8 |
0.082 |
0.108 |
0.053 |
-0.079 |
1.491 |
-0.026 |
0.646 |
| 2’’_Ru |
1 |
0.372 |
-0.743 |
0.196 |
-0.578 |
2.949 |
-0.382 |
0.527 |
| 2 |
0.142 |
0.327 |
0.139 |
-0.197 |
1.417 |
-0.057 |
0.979 |
| 8 |
0.052 |
0.030 |
0.020 |
-0.033 |
1.650 |
-0.013 |
0.385 |
| 3’’_Ru |
1 |
0.297 |
-0.438 |
0.154 |
-0.417 |
2.708 |
-0.263 |
0.519 |
| 2 |
0.122 |
0.328 |
0.121 |
-0.160 |
1.322 |
-0.039 |
0.992 |
| 8 |
0.100 |
0.140 |
0.070 |
-0.104 |
1.486 |
-0.345 |
0.700 |
| 4’’_Ru |
1 |
0.371 |
-0.739 |
0.196 |
-0.577 |
2.944 |
-0.381 |
0.528 |
| 2 |
0.143 |
0.386 |
0.154 |
-0.211 |
1.370 |
-0.058 |
1.077 |
| 8 |
0.052 |
0.087 |
0.035 |
-0.048 |
1.371 |
-0.013 |
0.673 |
| 5’’_Ru |
1 |
0.331 |
-0.576 |
0.172 |
-0.488 |
2.837 |
-0.316 |
0.520 |
| 2 |
0.135 |
0.353 |
0.138 |
-0.189 |
1.370 |
-0.050 |
1.022 |
| 8 |
0.083 |
0.093 |
0.049 |
-0.074 |
1.510 |
-0.025 |
0.590 |
| 6’’_Ru |
1 |
0.205 |
-0.870 |
0.234 |
-0.685 |
2.927 |
-0.451 |
1.141 |
| 2 |
0.173 |
-0.279 |
0.112 |
-0.293 |
2.616 |
-0.181 |
0.647 |
| 8 |
0.127 |
-0.073 |
0.065 |
-0.149 |
2.292 |
-0.084 |
0.512 |
| 7’’_Ru |
1 |
0.389 |
-0.810 |
0.208 |
-0.618 |
2.971 |
-0.410 |
0.535 |
| 2 |
0.134 |
0.562 |
0.176 |
-0.212 |
1.205 |
-0.036 |
1.313 |
| 8 |
0.048 |
0.061 |
0.028 |
-0.041 |
1.464 |
-0.013 |
0.583 |
Table 6.
Topological and energetic properties of ρ(r) calculated at relevant (3,–1) bond critical points (BCPs) of the Os ‘full face’ clusters.
Table 6.
Topological and energetic properties of ρ(r) calculated at relevant (3,–1) bond critical points (BCPs) of the Os ‘full face’ clusters.
| Complex |
BCP |
ρBCPa
|
|
GBCPc
|
VBCPc
|
|VBCP|/GBCP
|
HBCPc
|
GBCP/ρBCP
|
| 1’’_Os |
1 |
0.318 |
-0.504 |
0.167 |
-0.460 |
2.754 |
-0.293 |
0.525 |
| 2 |
0.148 |
0.445 |
0.160 |
-0.216 |
1.350 |
-0.056 |
1.081 |
| 8 |
0.099 |
0.060 |
0.057 |
-0.101 |
1.772 |
-0.044 |
0.576 |
| 2’’_Os |
1 |
0.325 |
-0.550 |
0.168 |
-0.473 |
2.815 |
-0.305 |
0.517 |
| 2 |
0.151 |
0.519 |
0.178 |
-0.235 |
1.320 |
-0.057 |
1.179 |
| 8 |
0.085 |
0.120 |
0.064 |
-0.098 |
1.531 |
-0.035 |
0.753 |
| 3’’_Os |
1 |
0.299 |
-0.450 |
0.155 |
-0.422 |
2.723 |
-0.267 |
0.518 |
| 2 |
0.135 |
0.320 |
0.133 |
-0.191 |
1.436 |
-0.058 |
0.985 |
| 8 |
0.093 |
0.015 |
0.041 |
-0.080 |
1.951 |
-0.038 |
0.441 |
| 4’’_Os |
1 |
0.327 |
-0.556 |
0.169 |
-0.476 |
2.817 |
-0.308 |
0.517 |
| 2 |
0.165 |
0.529 |
0.193 |
-0.265 |
1.373 |
-0.071 |
1.170 |
| 8 |
0.086 |
0.034 |
0.042 |
-0.077 |
1.833 |
-0.035 |
0.488 |
| 5’’_Os |
1 |
0.281 |
-0.388 |
0.142 |
-0.380 |
2.676 |
-0.239 |
0.505 |
| 2 |
0.133 |
0.436 |
0.146 |
-0.189 |
1.295 |
-0.043 |
1.098 |
| 8 |
0.091 |
0.042 |
0.048 |
-0.086 |
1.792 |
-0.038 |
0.527 |
| 6’’_Os |
1 |
0.302 |
-0.461 |
0.154 |
-0.423 |
2.747 |
-0.269 |
0.510 |
| 2 |
0.115 |
0.373 |
0.119 |
-0.150 |
1.261 |
-0.031 |
1.035 |
| 8 |
0.075 |
0.001 |
0.030 |
-0.058 |
1.933 |
-0.028 |
0.400 |
| 7’’_Os |
1 |
0.318 |
-0.523 |
0.163 |
-0.456 |
2.798 |
-0.294 |
0.513 |
| 2 |
0.163 |
0.385 |
0.175 |
-0.261 |
1.491 |
-0.086 |
1.074 |
| 8 |
0.075 |
0.046 |
0.036 |
-0.062 |
1.722 |
-0.025 |
0.480 |
|
Disclaimer/Publisher’s Note: The statements, opinions and data contained in all publications are solely those of the individual author(s) and contributor(s) and not of MDPI and/or the editor(s). MDPI and/or the editor(s) disclaim responsibility for any injury to people or property resulting from any ideas, methods, instructions or products referred to in the content. |
© 2024 by the authors. Licensee MDPI, Basel, Switzerland. This article is an open access article distributed under the terms and conditions of the Creative Commons Attribution (CC BY) license (https://creativecommons.org/licenses/by/4.0/).


