Submitted:
27 February 2024
Posted:
27 February 2024
You are already at the latest version
Abstract
Keywords:
MSC: 60J28; 60K25; 90B05; 90B22
1. Introduction
- Exact and approximate methods to study QIS model with finite waiting room are developed.
- High-accurate closed-form approximate formulas for calculating the steady-state probabilities, as well as performance measures of the investigated QIS in the case of rare catastrophes are developed.
- The developed approximate formulas make it possible to calculate the performance measures of large-scale QISs using closed-form formulas and minimize the expected total cost (ETC) by choosing the optimal value of reorder point.
2. The Model
3. Steady-State Analysis
3.1. An Exact Approach
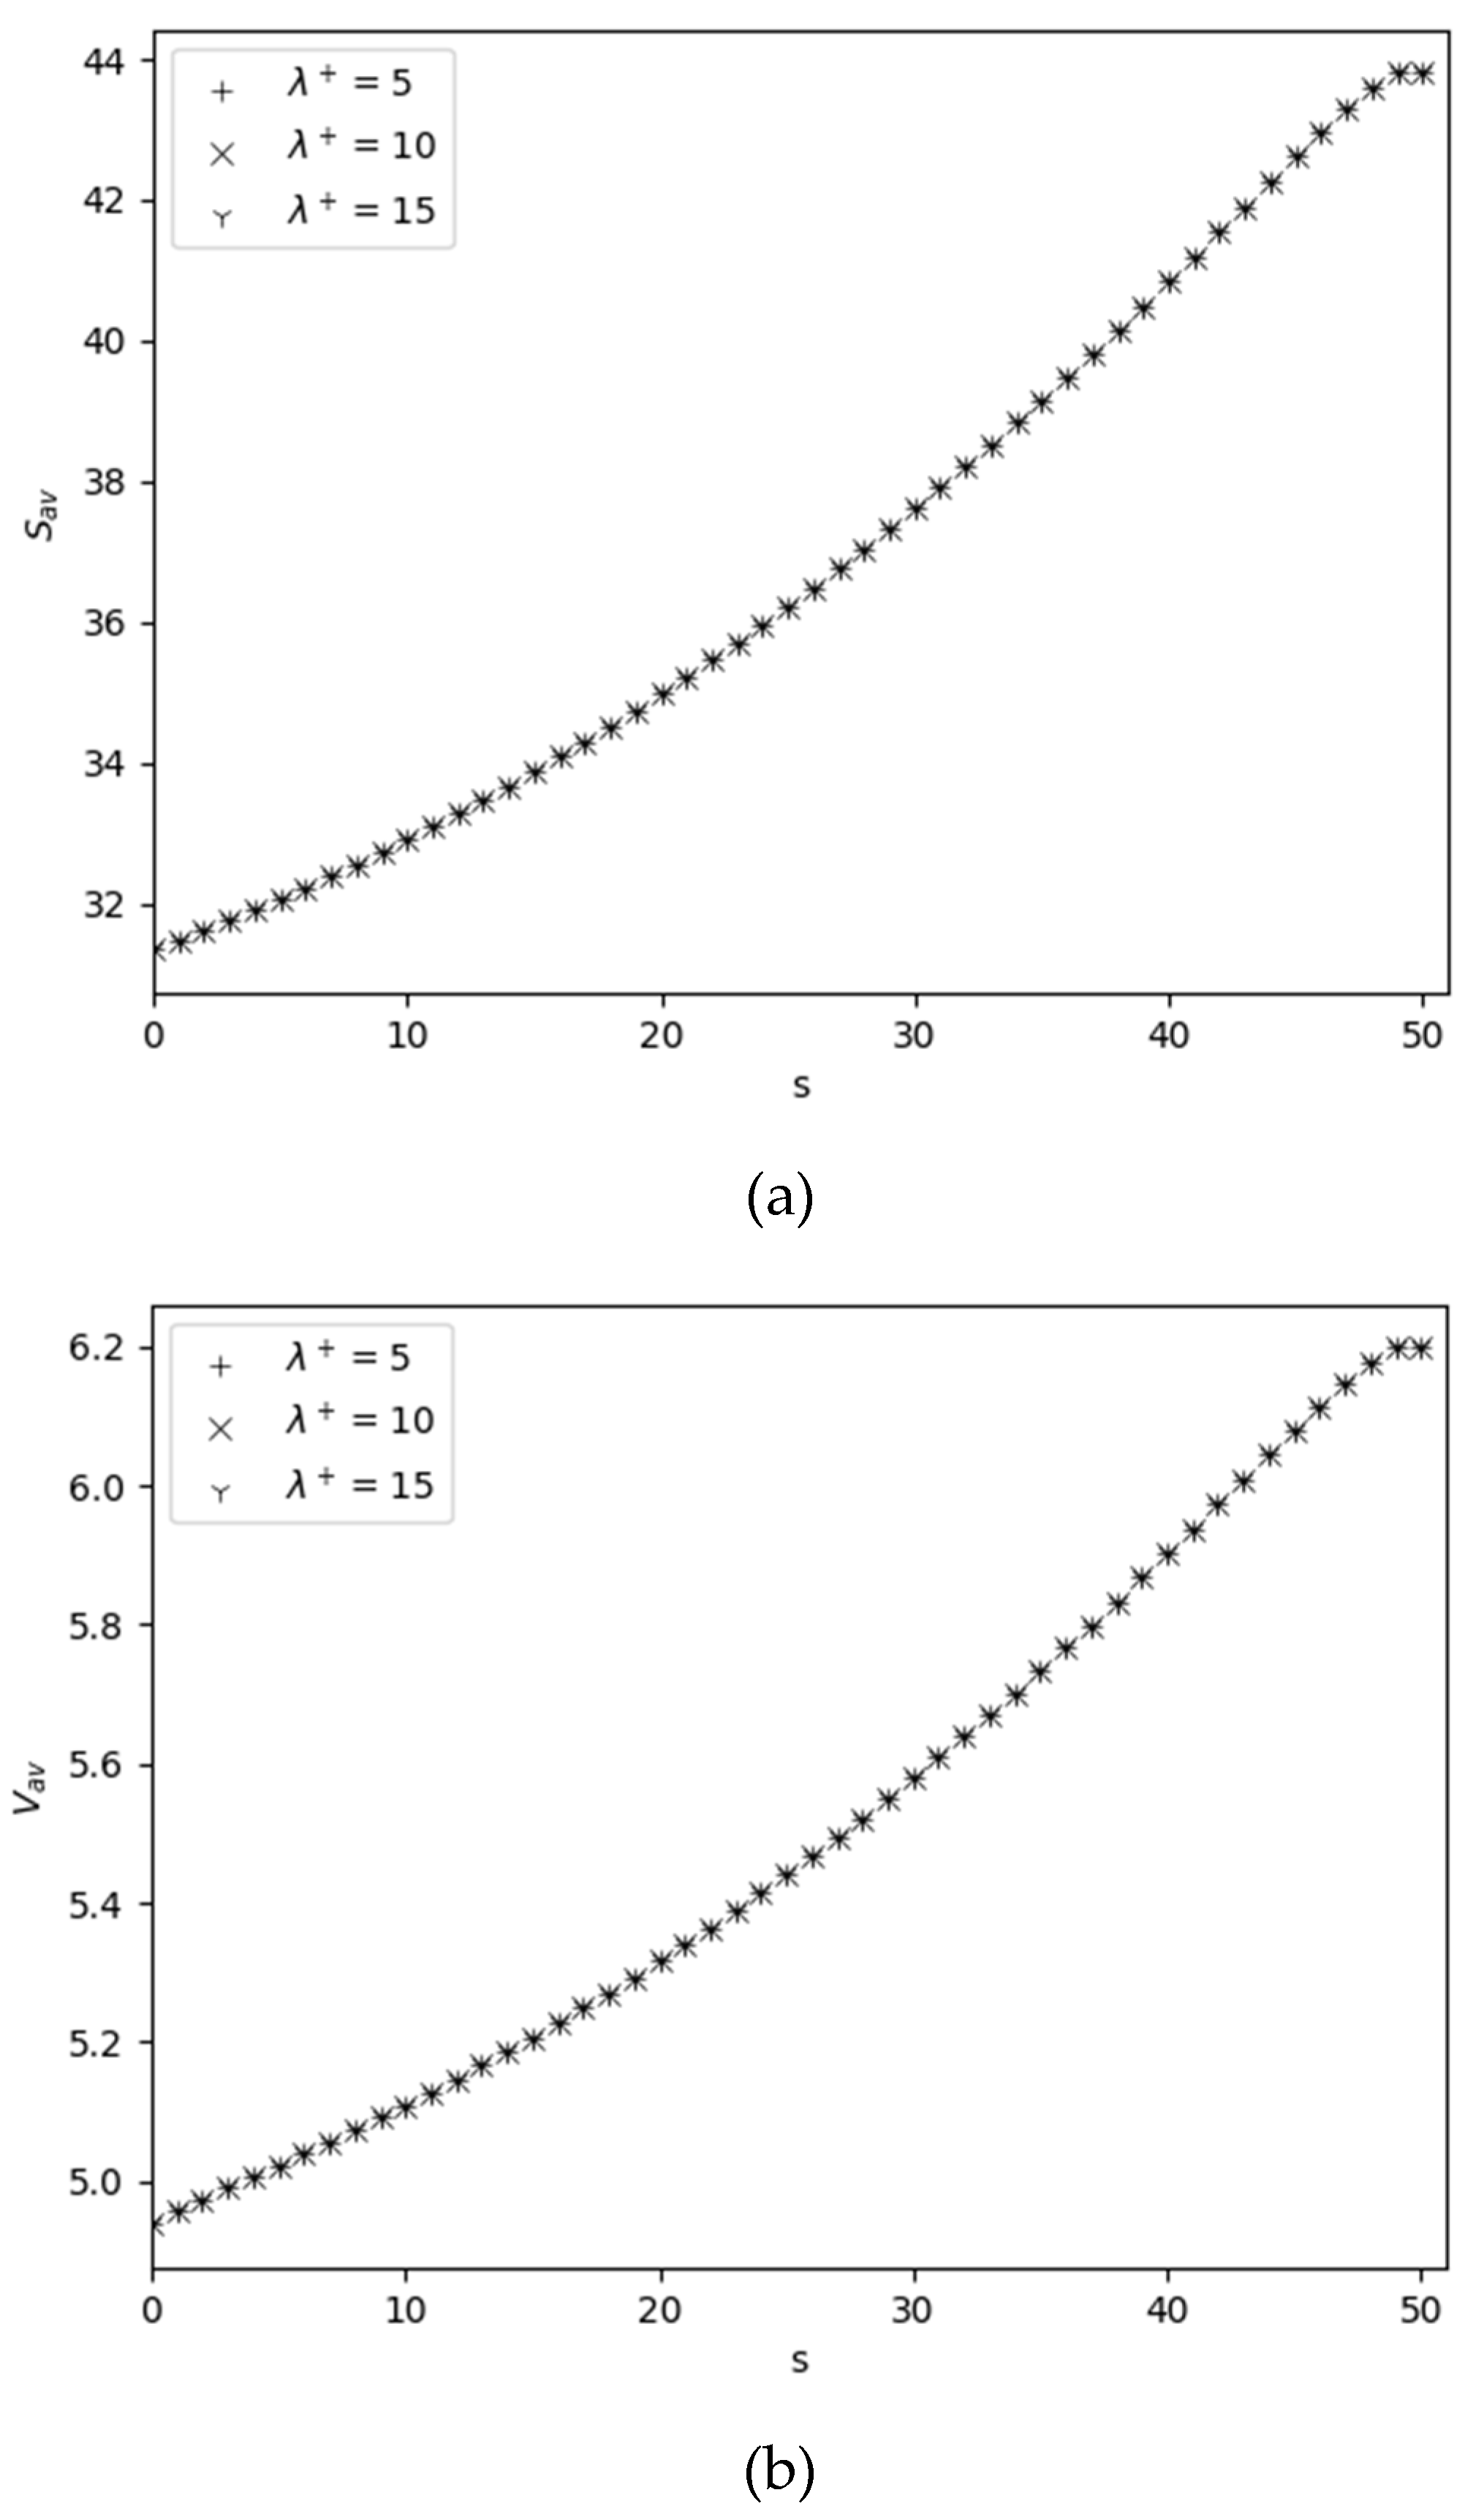
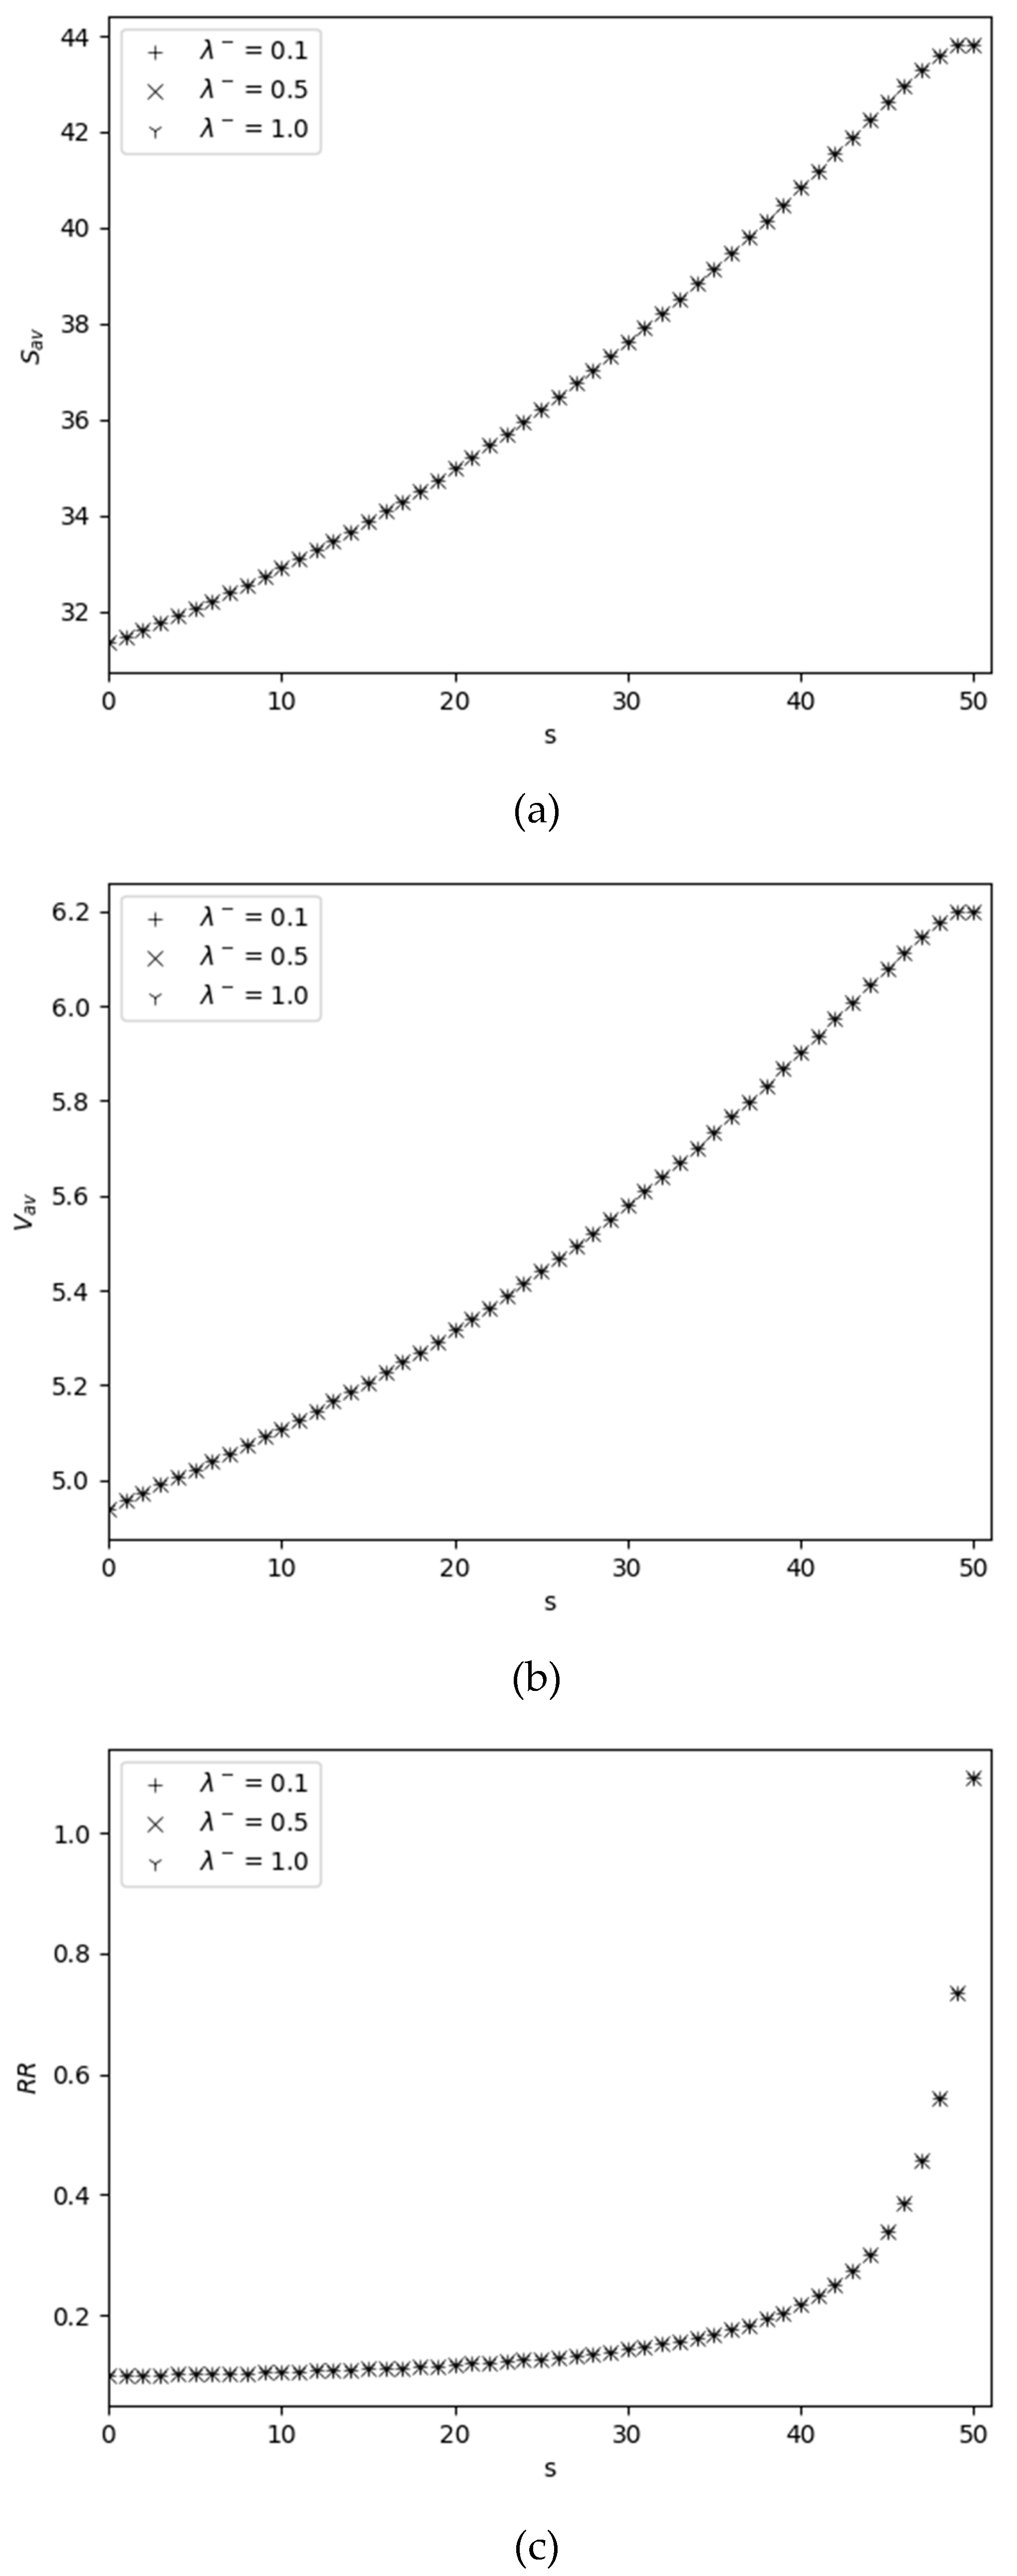
- The average number of items in warehouse (i.e. the average inventory level) is calculated as mathematical expectation of the appropriate random variable and is given by
- Similar to (8), the average order size (i.e. the average size of replenished items from external source) is calculated as mathematical expectation of the appropriate random variable and is calculates as follows
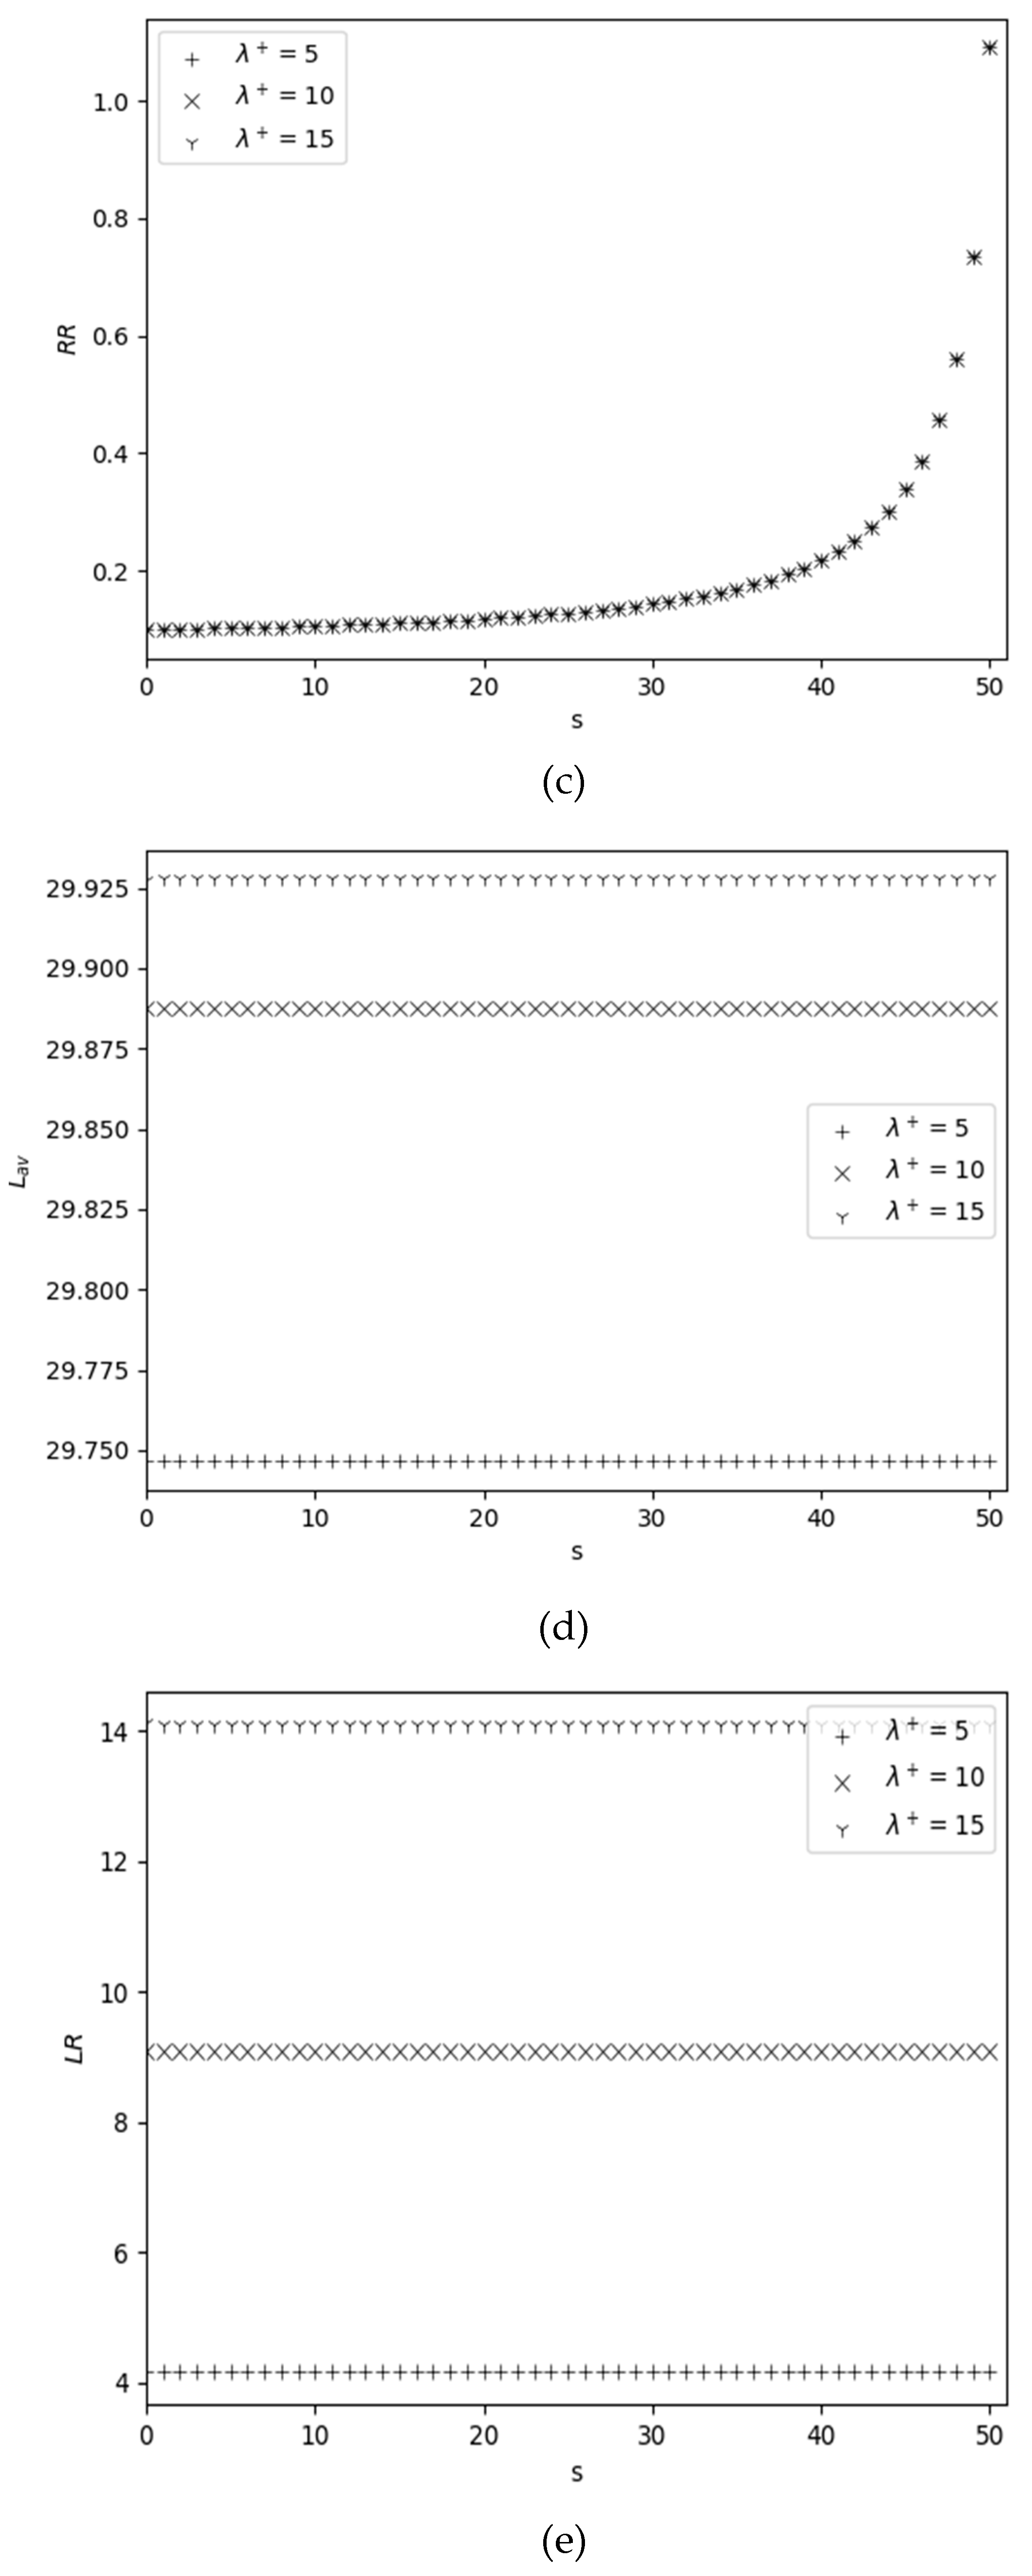
- An inventory order is placed in two cases: (1) when the inventory level drops to the reorder point after completing customer service in states , and (2) when catastrophes occur the in states Therefore, the average reorder rate is calculated as follows
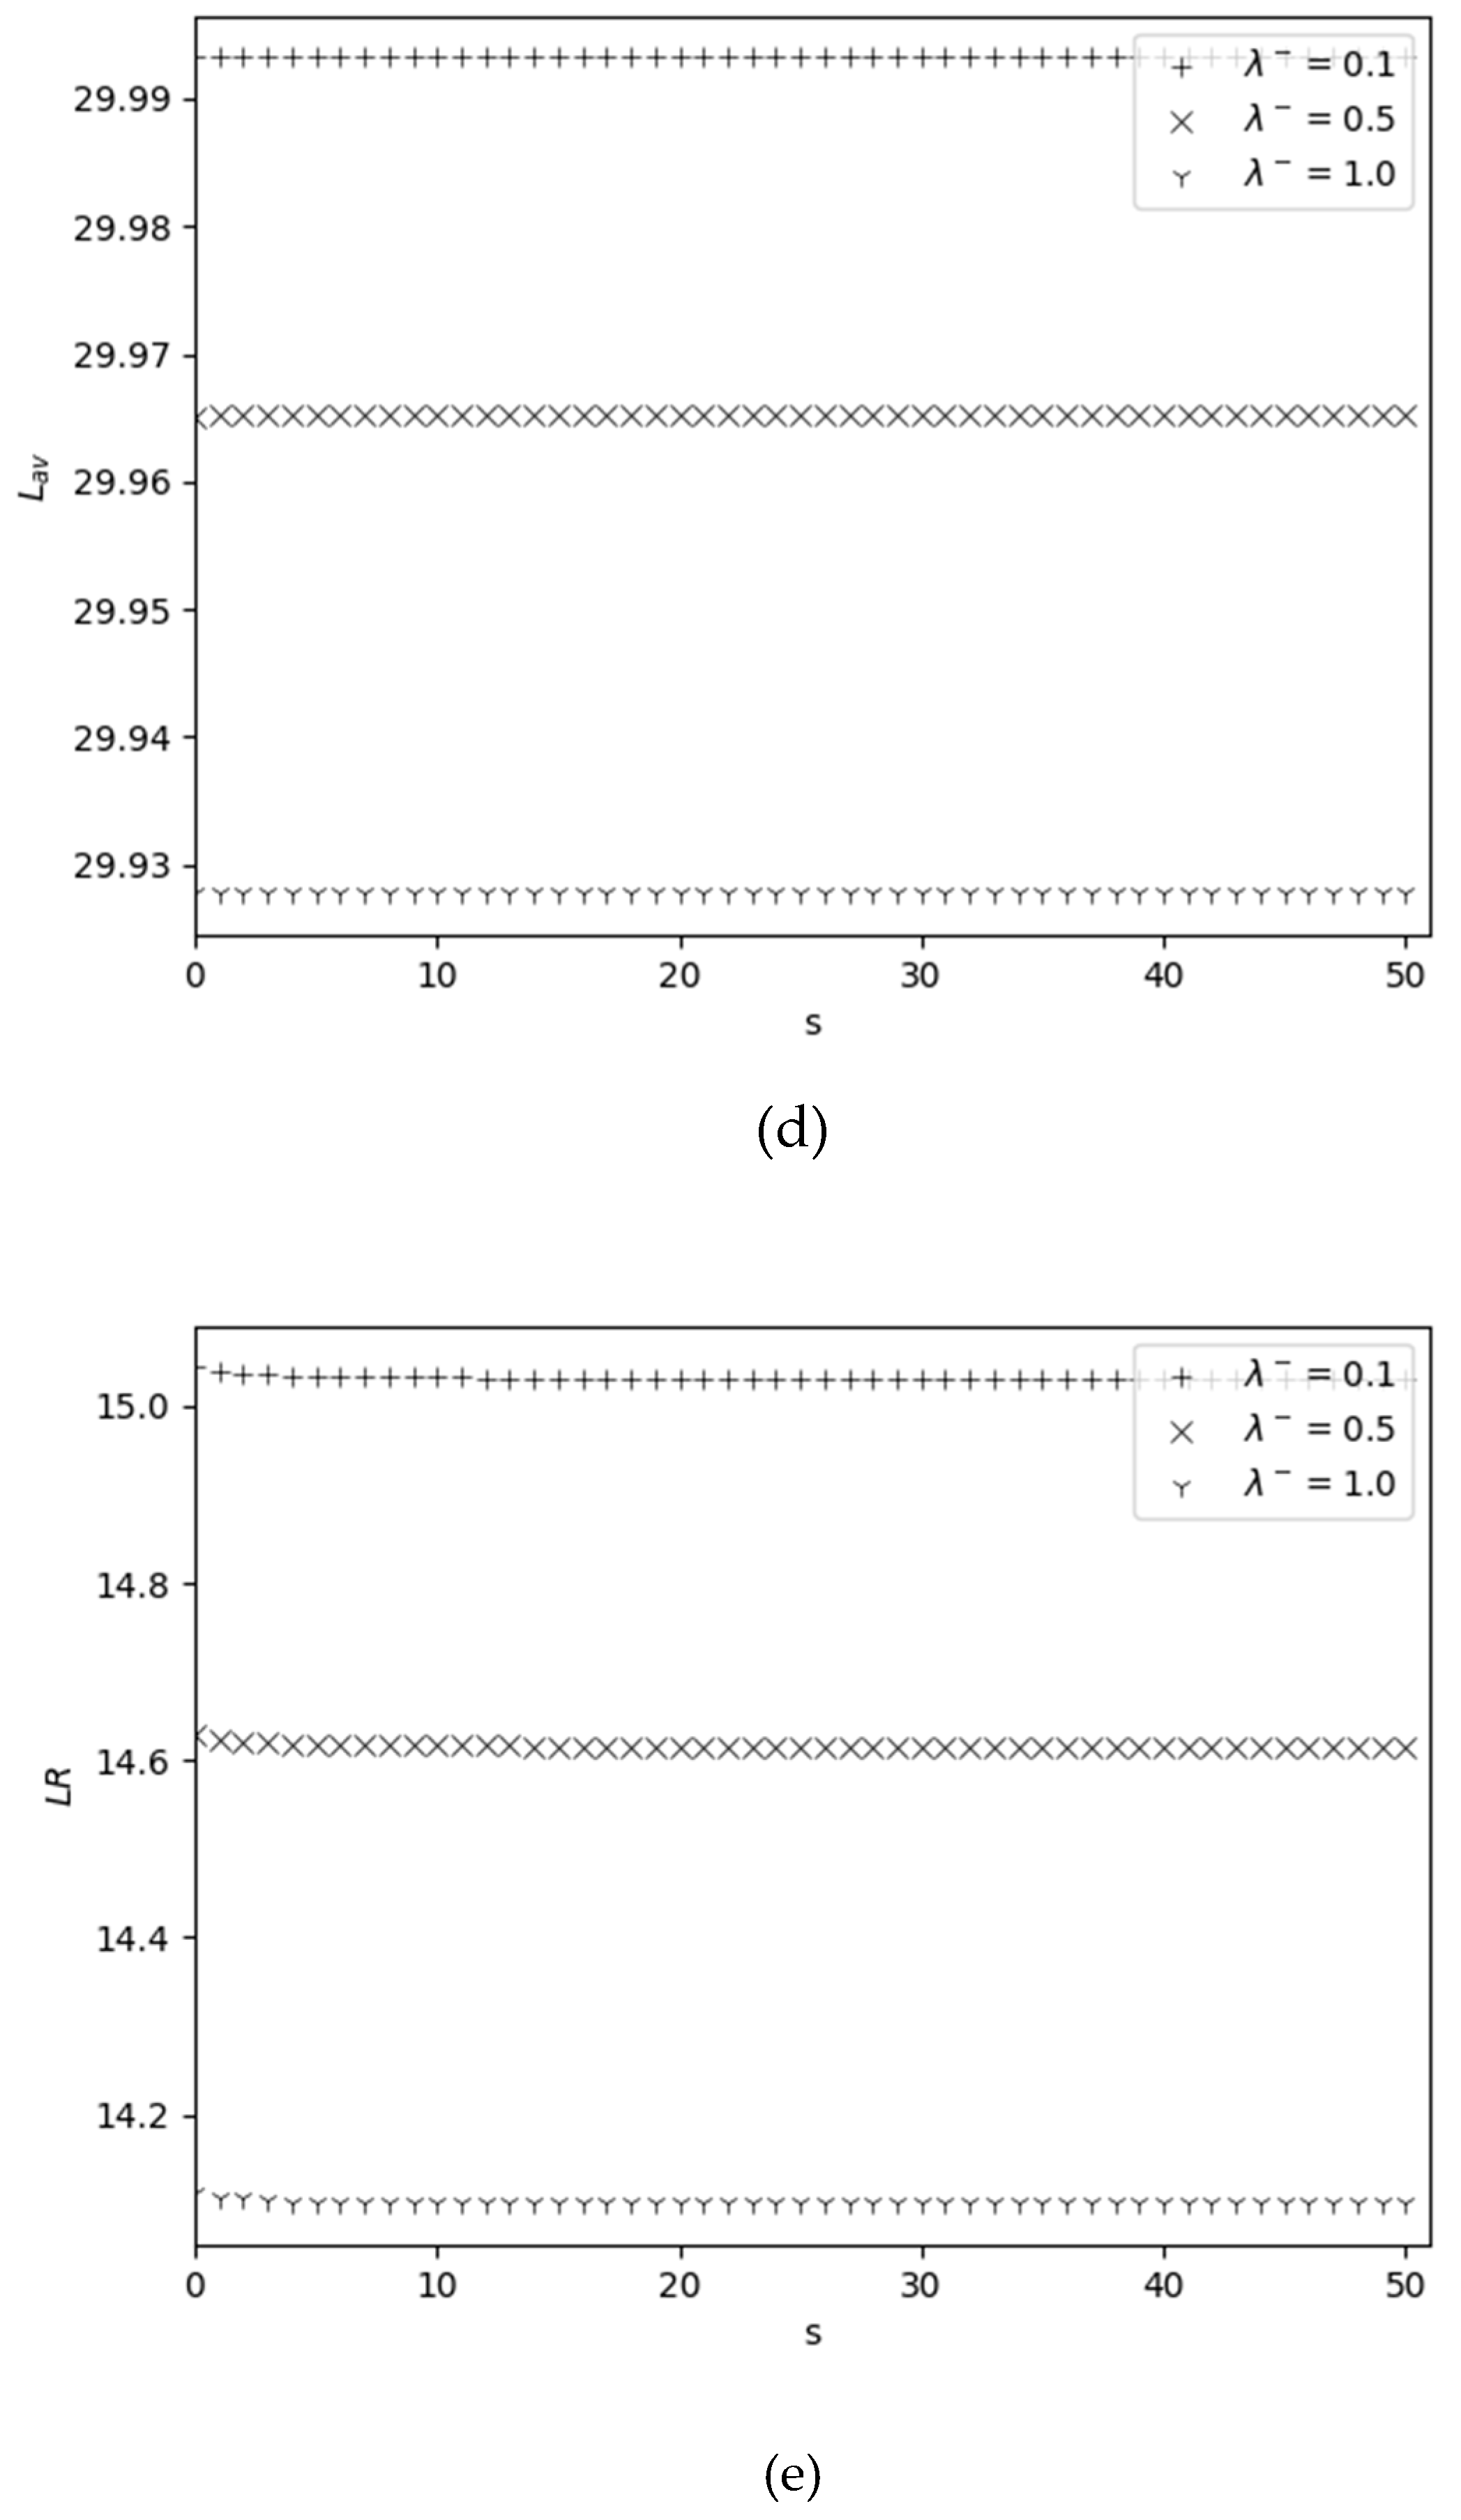
- The average length of the queue is calculated as mathematical expectation of the appropriate random variable and is given by
- Losing c-customers occurs in three cases: (1) if at the time the c-customer arrives the waiting room is full (with probability 1), i.e. when the system are in one of the states , (2) if at the time the c-customer arrives, the inventory level is zero and waiting room is not full (with probability ), i.e, when system are in one of the states ,(3) when n-customer arrived, it displaced one c-customer. Therefore, the loss rate of c-customers is calculated as follows
3.2. An Approximate Approach
4. Numerical Experiments
4.1. Accuracy of the Developed Approximate Formulas
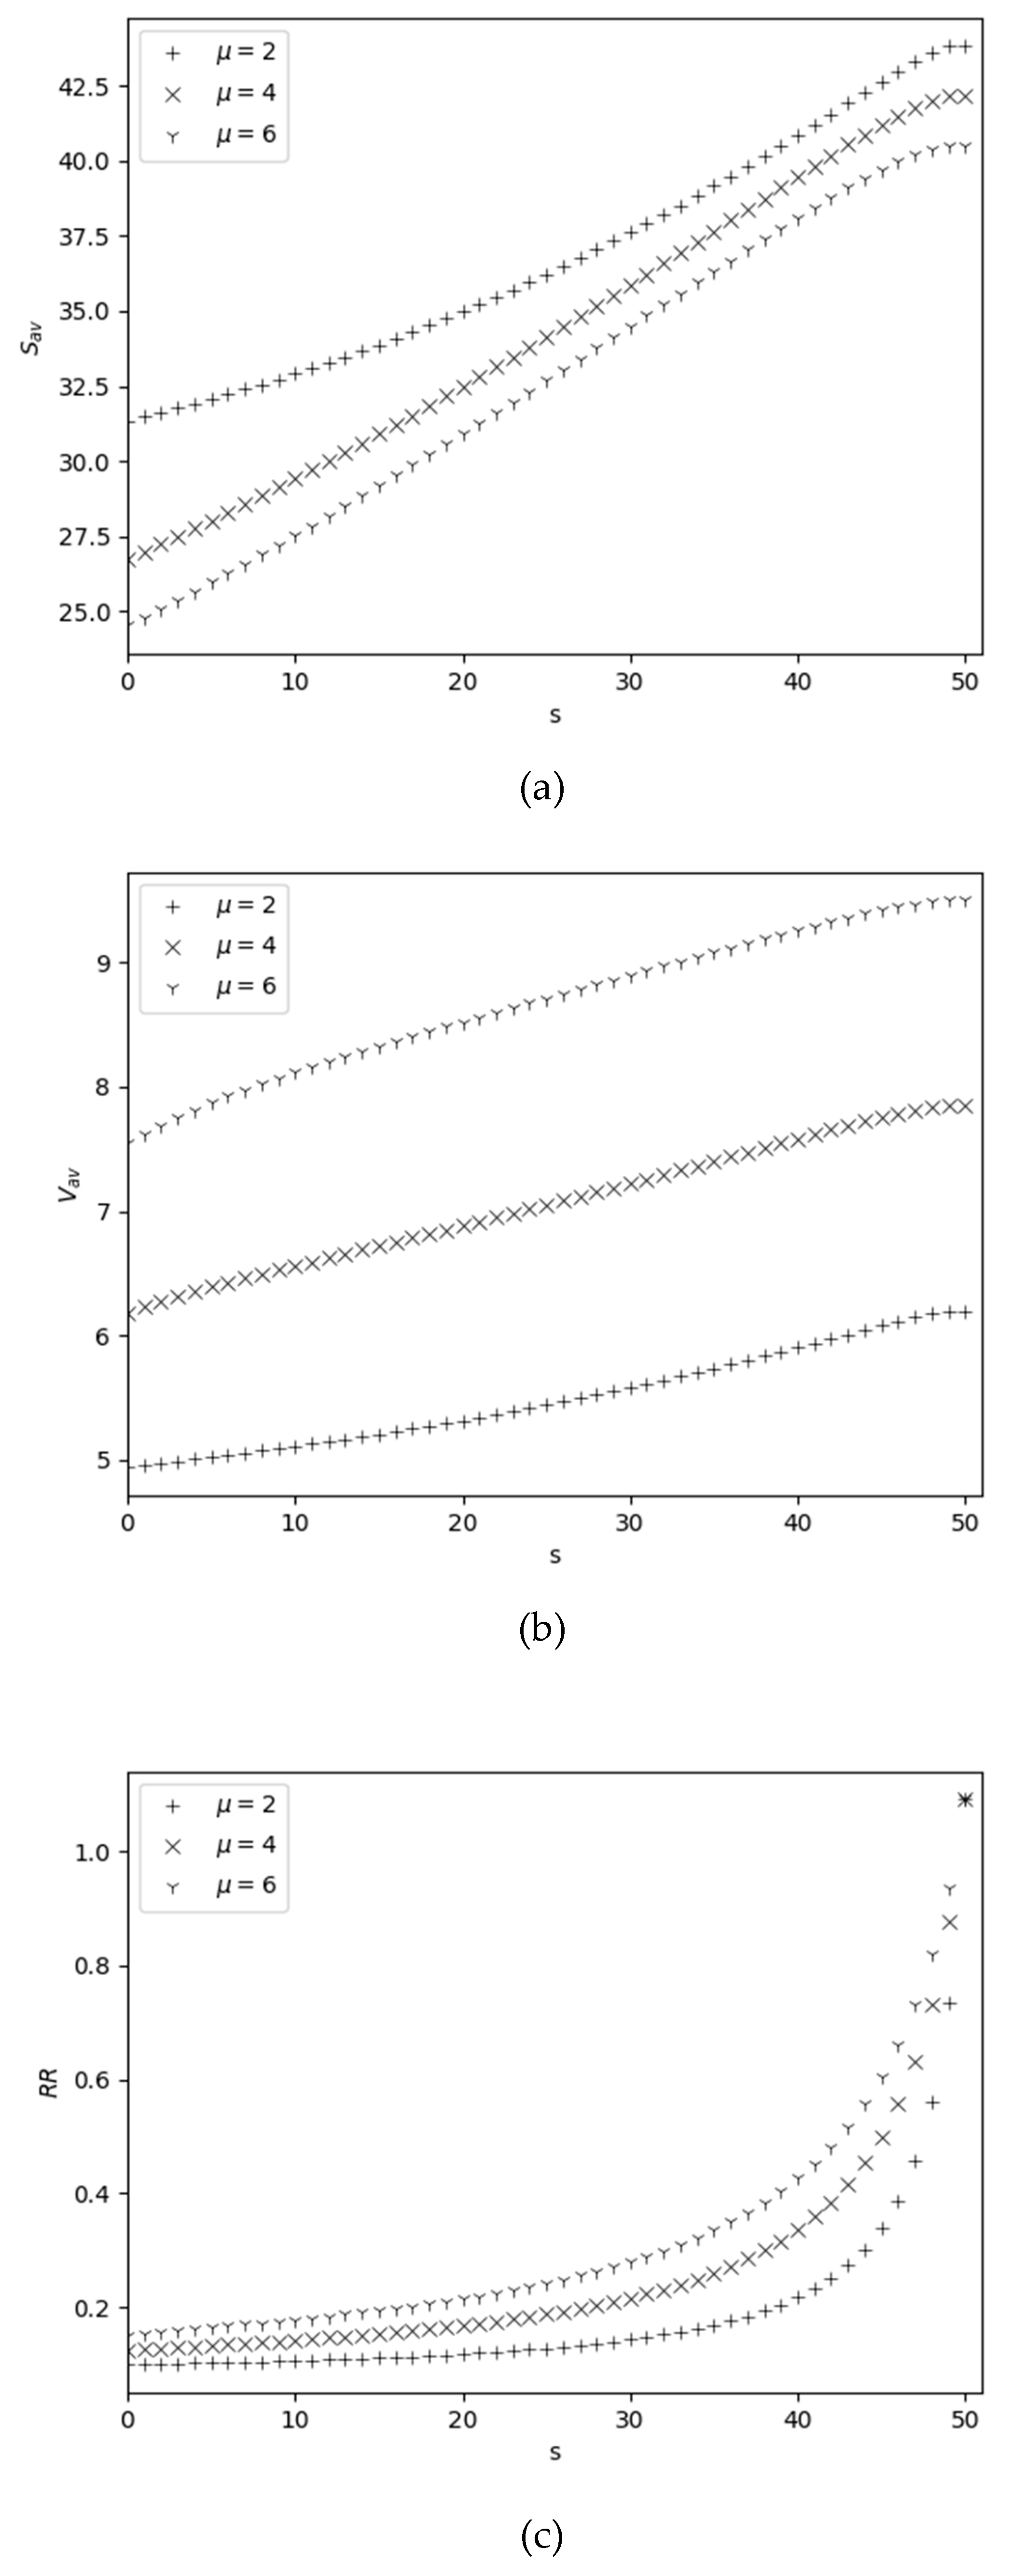
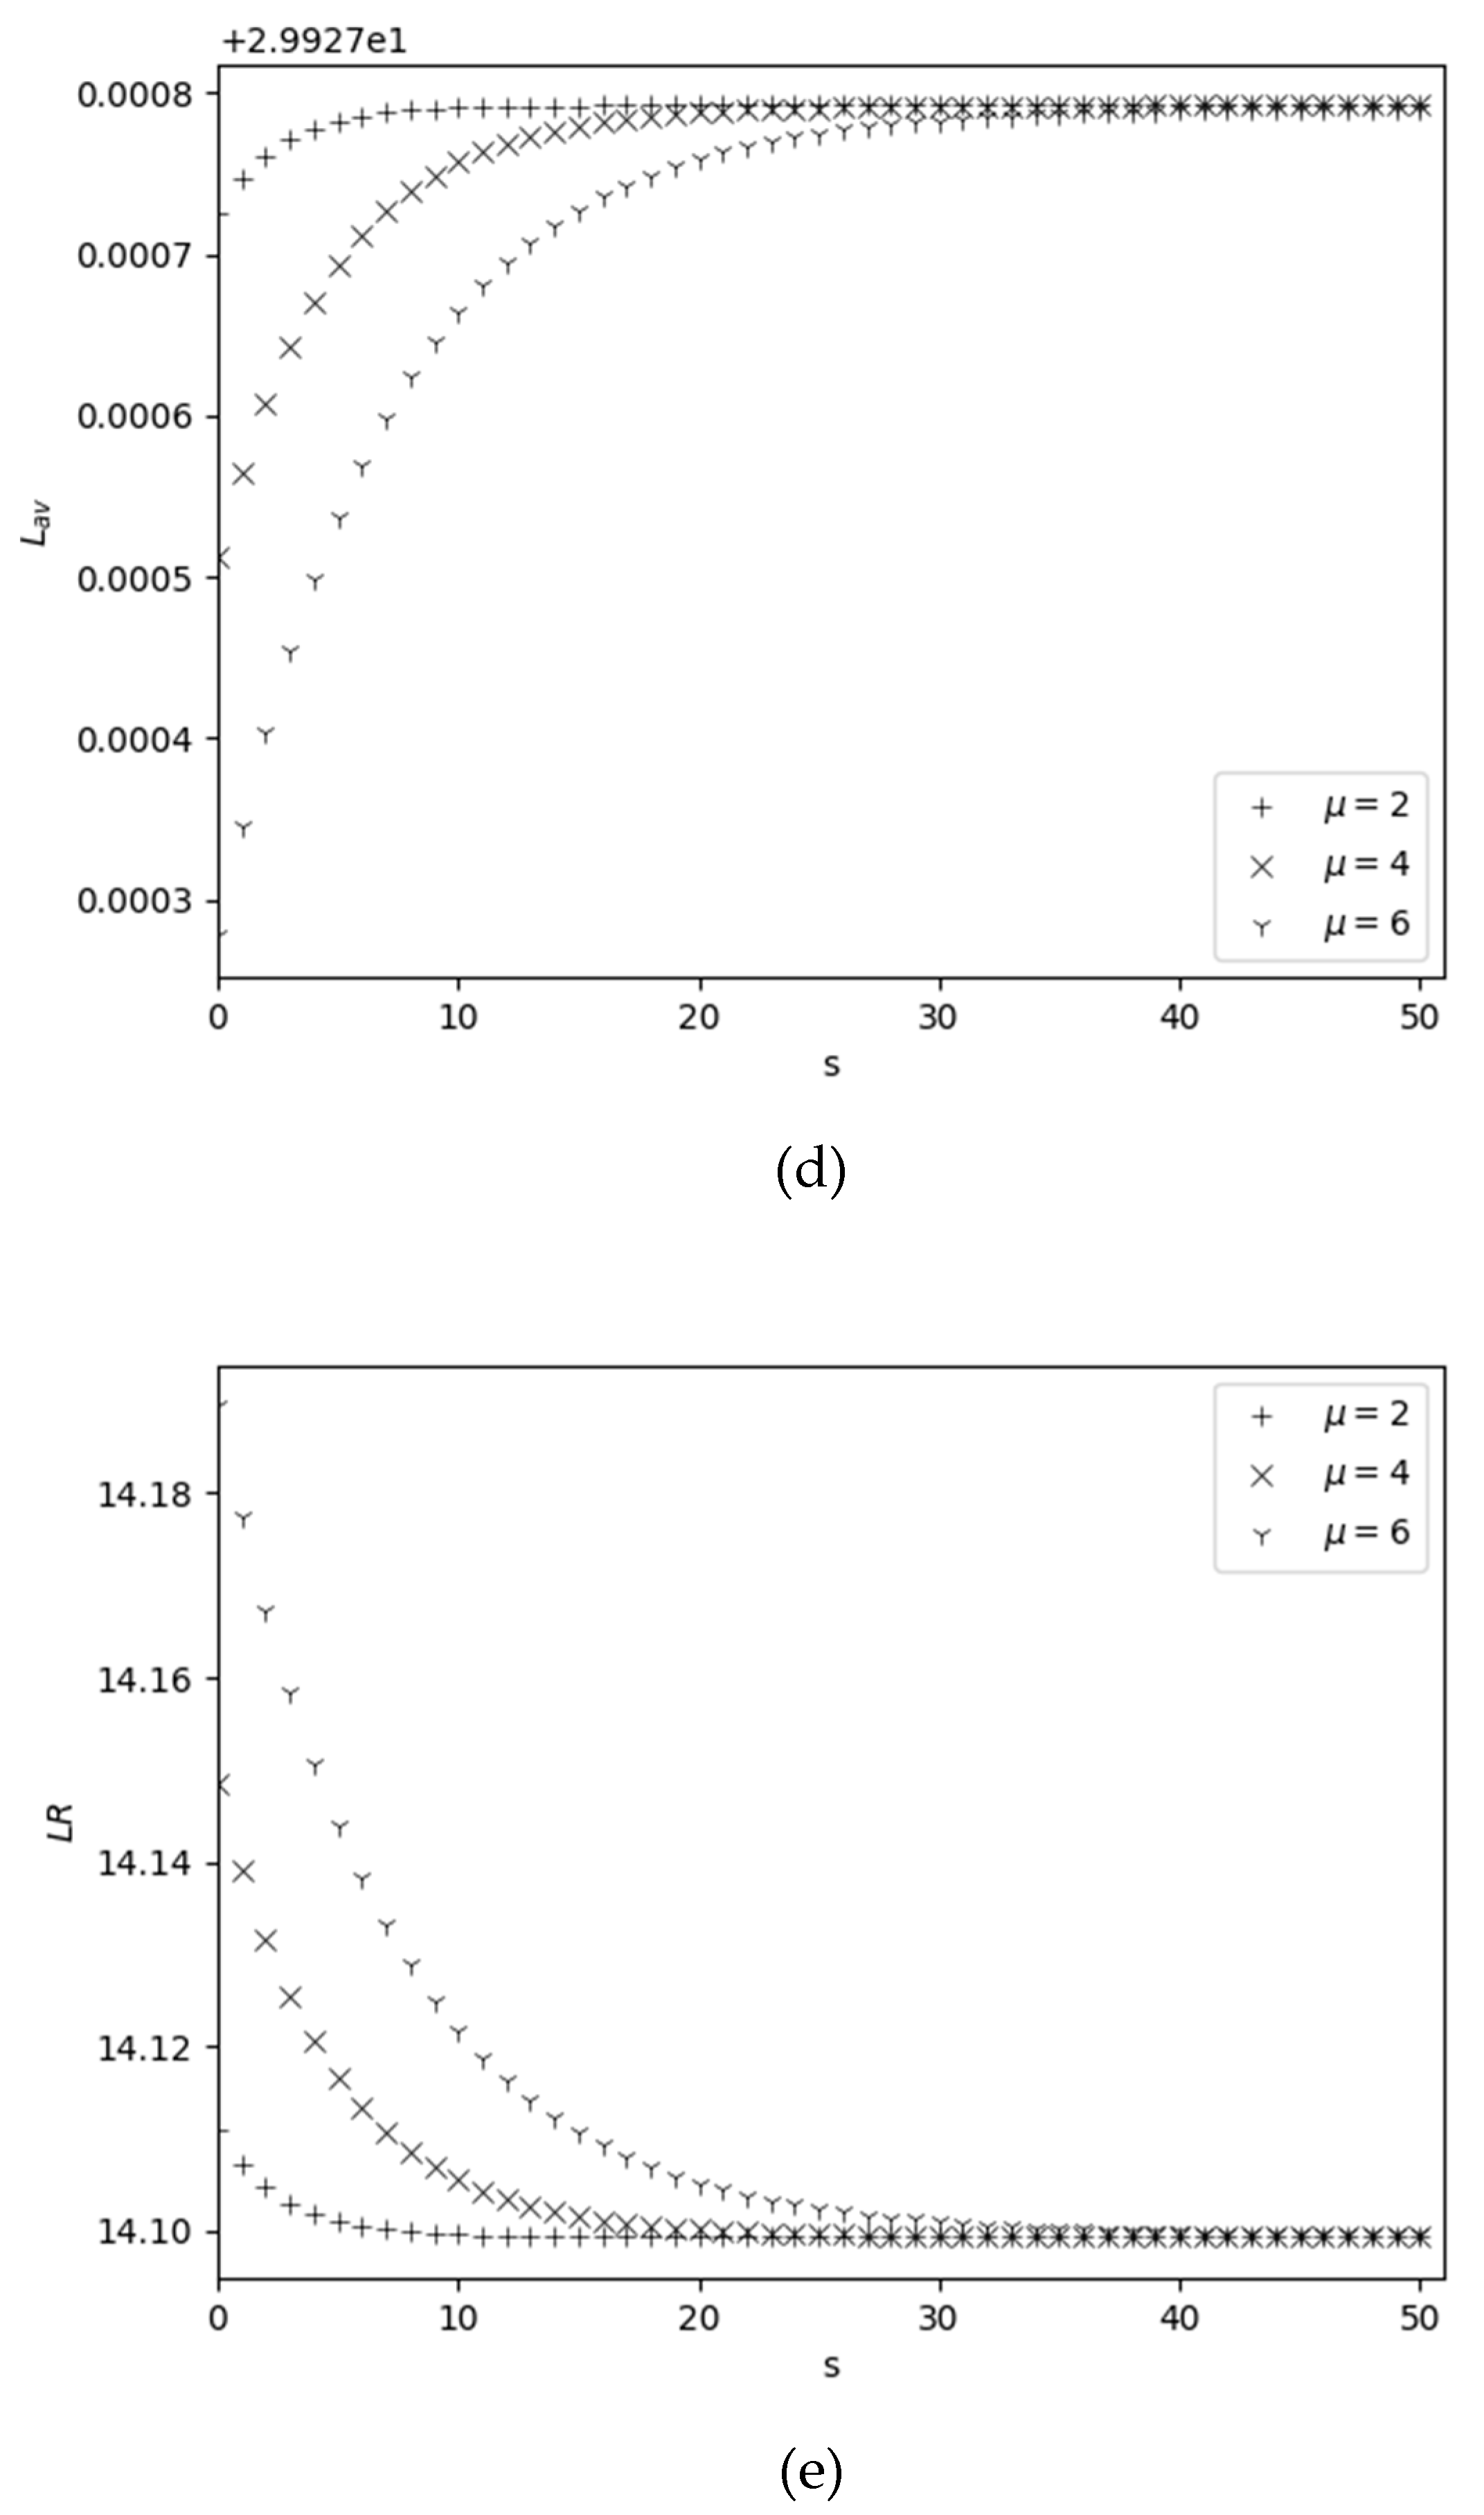
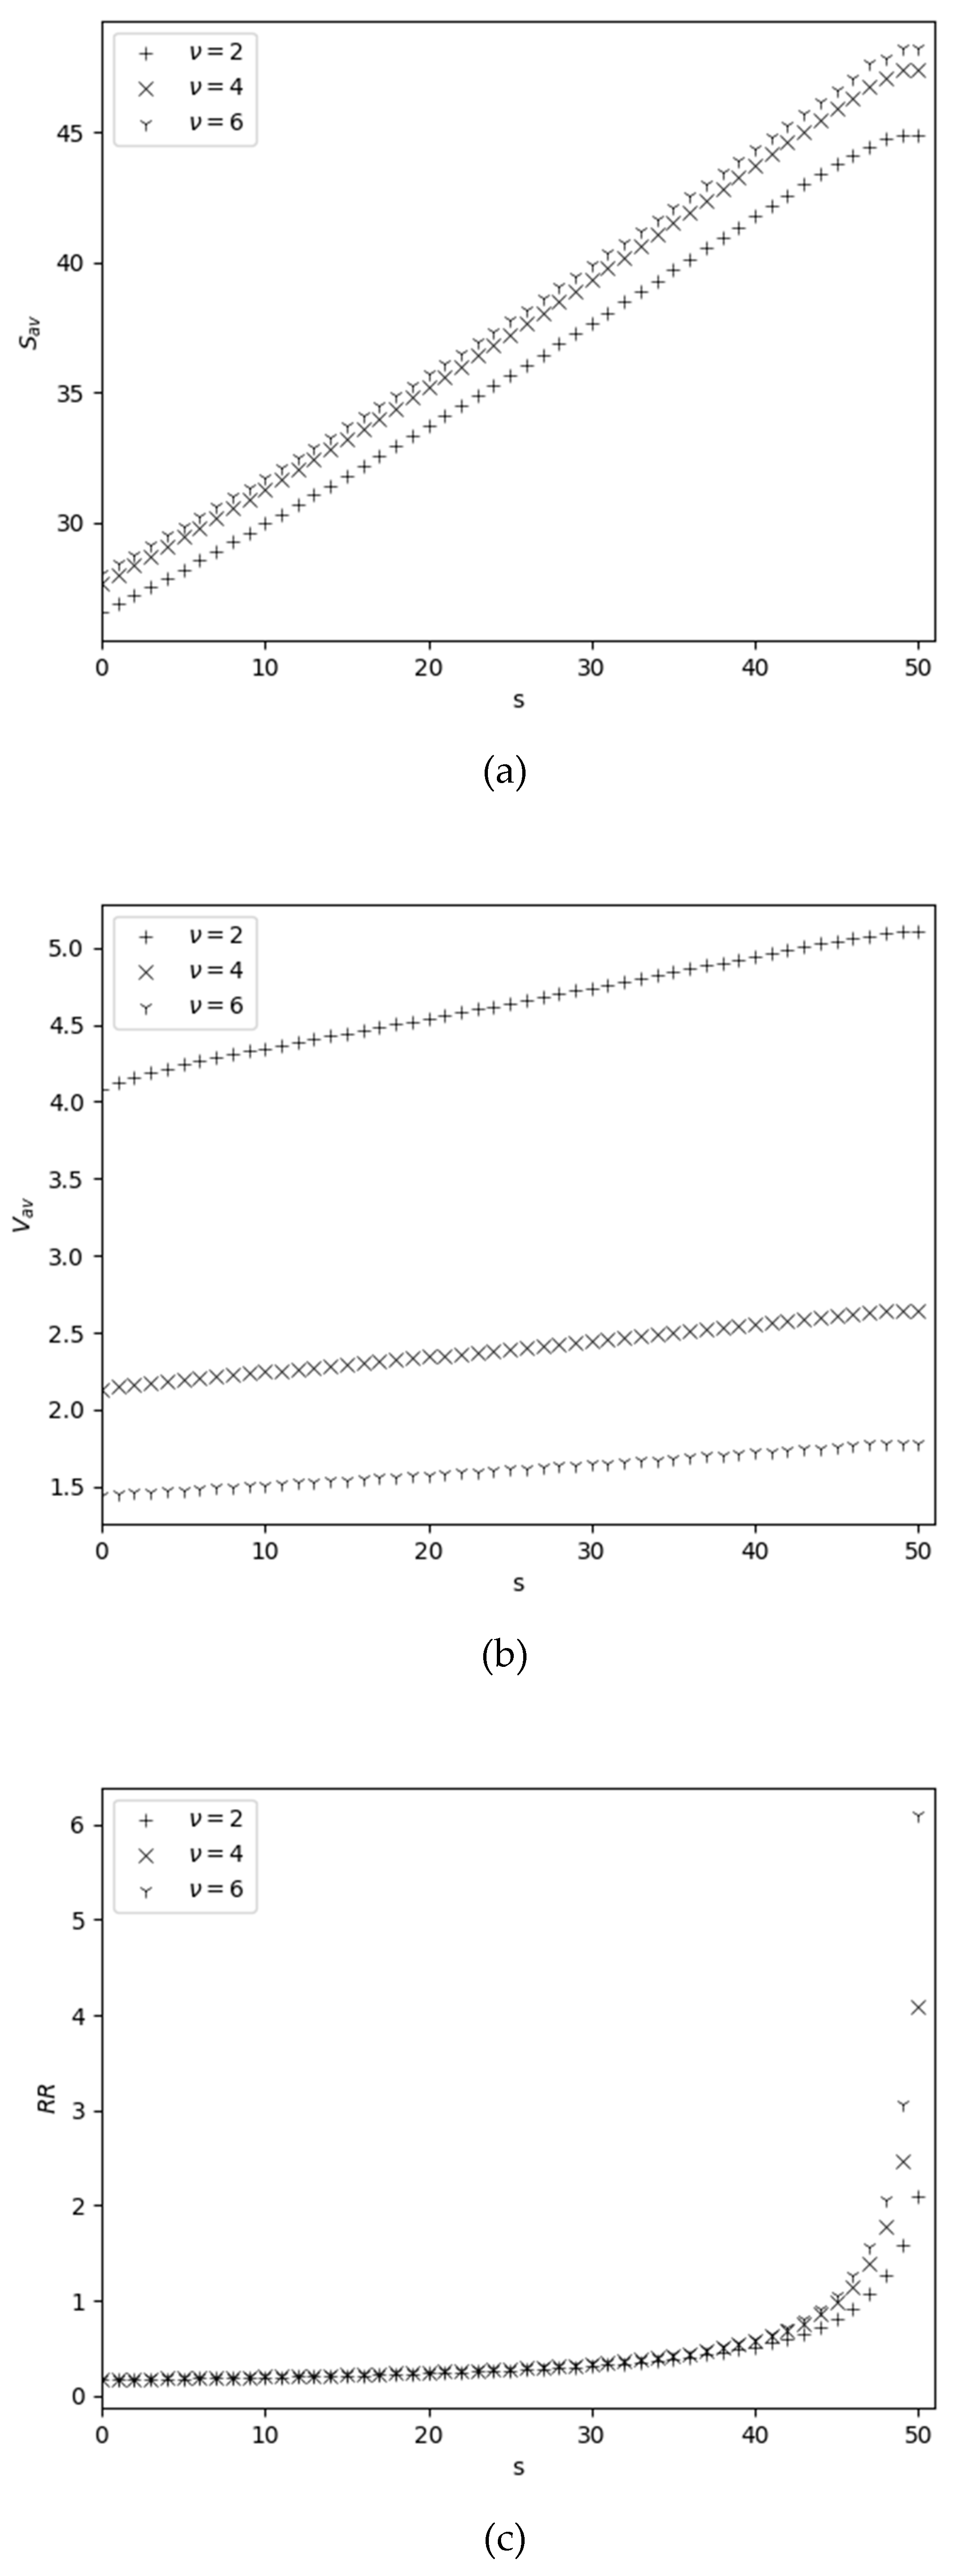
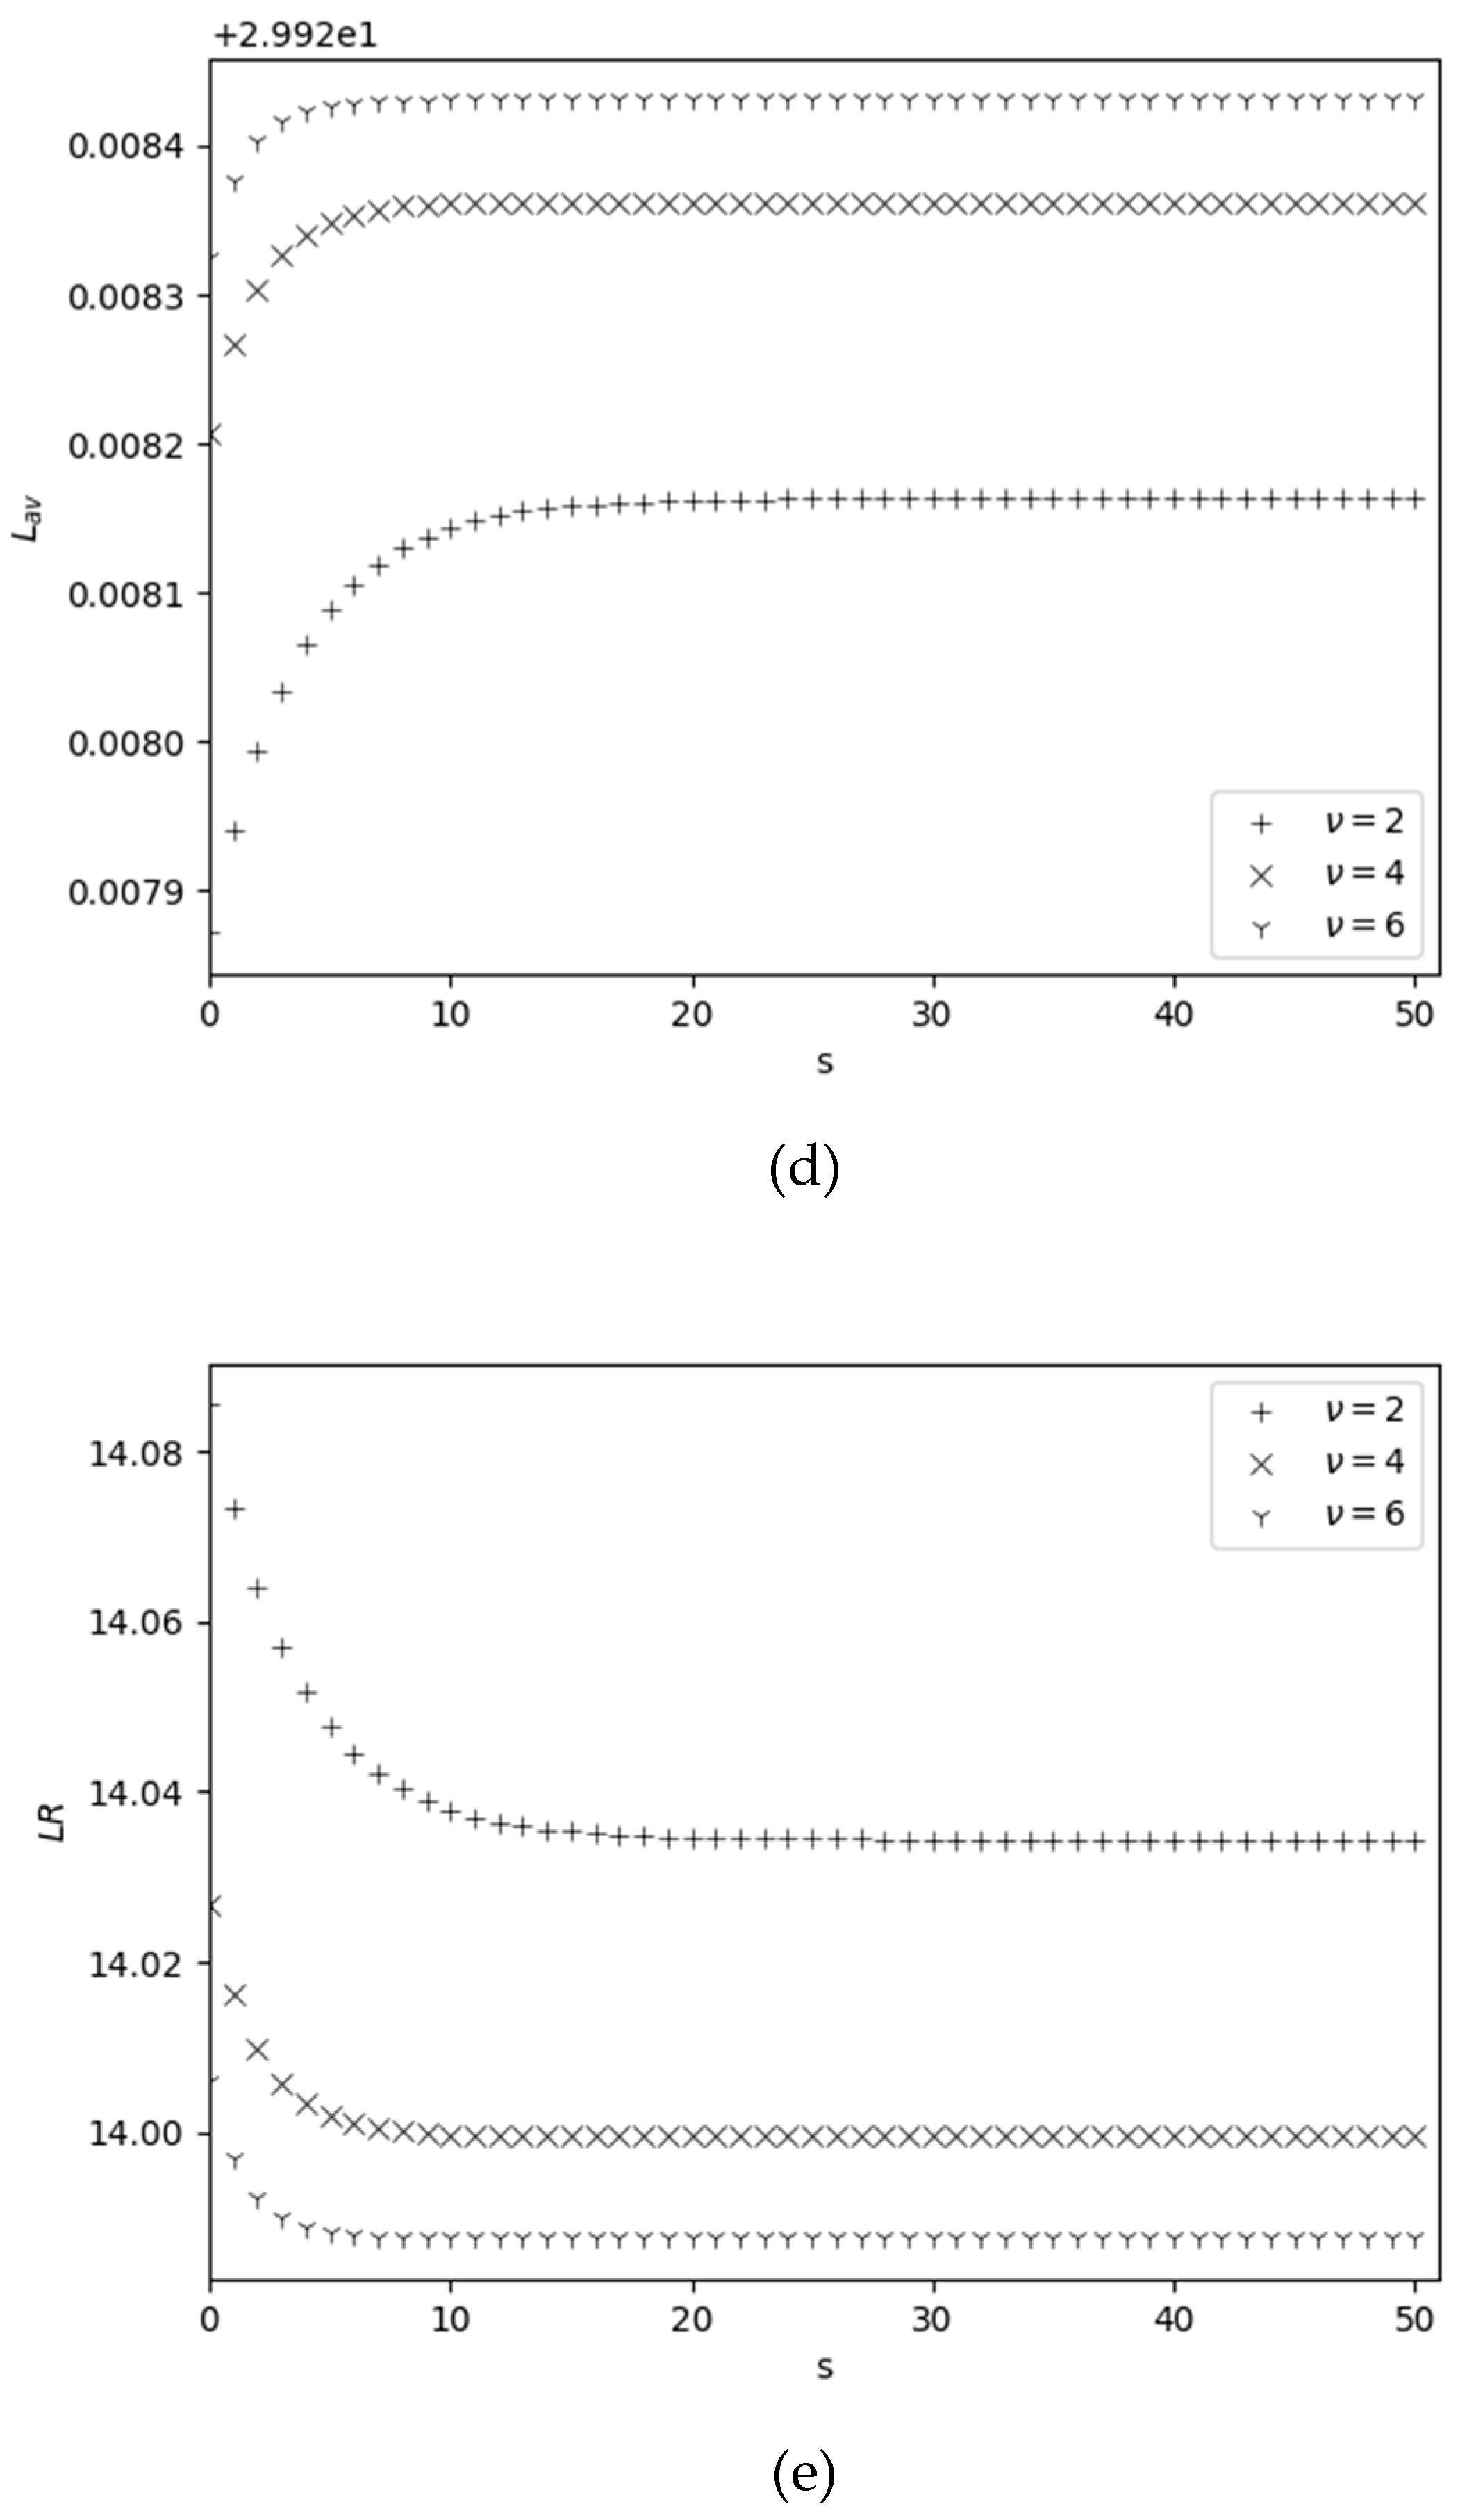
4.2. Behavior of Performance Measures Versus Reorder Point
4.5. Optimization Problem
5. Conclusions
Author Contributions
Funding
Institutional Review Board Statement
Informed Consent Statement
Conflicts of Interest
References
- Chakravarthy, S.R. A catastrophic queueing model with delayed action. Appl. Math. Model. 2017, 46, 631–649. [Google Scholar] [CrossRef]
- Kumar, D.; Singh, B.G. Transient Solution of a Two Homogeneous Servers Markovian Queueing System with Environmental, Catastrophic and Restoration Effects, Int. J. Math. & Statistics Studies, 2024, 12, 45–53. [Google Scholar]
- Demircioglu, M.; Bruneel, H.; Wittevrongel, S. Analysis of a Discrete-Time Queueing Model with Disasters. Mathematics 2021, 9, 3283. [Google Scholar] [CrossRef]
- Kumar, B.K.; Arivudainambi, D. Transient solution of an M/M/1 queue with catastrophes. Comp. and Math. with Appl. 2000, 40, 1233–1240. [Google Scholar] [CrossRef]
- Jain, N.K.; Rakesh, K. Transient solution of a catastrophic-cum-restorative queuing problem with correlated arrivals and variable service capacity. Int. J. of Inform. & Manag. Sci. 2007, 18, 461–465. [Google Scholar]
- Jain, N.K.; Singh, B.G. A queue with varying catastrophic intensity. Int. J. Comput. & Appl. Math 2010, 5, 41–46. [Google Scholar]
- Singh, B.G.; Niwas, B.R. Time dependent analysis of a queueing system incorporating the effect of environment, catastrophe and restoration. J. Reliability and Statistical Studies 2015, 8, 29–40. [Google Scholar]
- Krishnamoorthy, A.; Joshua, A.N.; Mathew, A.P. The k-out-of-n: G System Viewed as a Multi-Server Queue. Mathematics 2024, 12, 210. [Google Scholar] [CrossRef]
- Rykov, V.; Kochueva, O.; Farkhadov, M. Preventive Maintenance of a k-out-of-n System with Applications in Subsea Pipeline Monitoring. J. Mar. Sci. Eng. 2021, 9, 85. [Google Scholar] [CrossRef]
- Melikov, A.; Mirzayev, R.R.; Nair, S.S. Numerical investigation of double source queuing-inventory systems with destructive customers. J. Comput. Syst. Sci. Int. 2022a, 61, 581–598. [Google Scholar] [CrossRef]
- Melikov, A.; Mirzayev, R.R.; Nair, S.S. Double Sources Queuing-Inventory System with Hybrid Replenishment Policy. Mathematics 2022b, 10, 2423. [Google Scholar] [CrossRef]
- Melikov, A.; Poladova, L.; Edayapurath, S.; Sztrik, J. Single-Server Queuing-Inventory Systems with Negative Customers and Catastrophes in the Warehouse. Mathematics 2023, 11, 2380. [Google Scholar] [CrossRef]
- Neuts, M.F. Matrix-Geometric Solutions in Stochastic Models: An Algorithmic Approach; The Johns Hopkins University Press: Baltimore, MD, USA, 1981. [Google Scholar]
- Chakravarthy, S.R. Introduction to Matrix-Analytic Methods in Queues; John Wiley & Sons, Inc.: London, UK, 2022; Volume 1. [Google Scholar]
- Chakravarthy, S.R. Introduction to Matrix-Analytic Methods in Queues; John Wiley & Sons, Inc.: London, UK, 2022; Volume 2. [Google Scholar]
- Dudin, A.N.; Klimenok, V.I.; Vishnevsky, V.M. The Theory of Queueing Systems with Correlated Flows; Springer Nature Switzerland AG: Basel, Switzerland, 2020. [Google Scholar]
- Amirthakodi, M.; & Sivakumar, B. (2019). An inventory system with service facility and feedback customers. Int. J. Ind. & Syst. Eng. 2019, 33, 374–411.
- Amirthakodi, M.; Sivakumar, B. An inventory system with service facility and finite orbit size for feedback customers. OPSEARCH. 2015, 52, 225–255. [Google Scholar] [CrossRef]
- Amirthakodi, M.; Radhamani, V.; Sivakumar, B. (2015) A perishable inventory system with service facility and feedback customers. Ann Oper Res. 2015, 233, 25–55. [Google Scholar] [CrossRef]
- Sivakumar, B.; Elango, C.; & Arivarignan, G. A Perishable Inventory System with Service Facilities and Batch Markovian Demands. Int. J Pure & Appl. Math. 2006, 32, 33–49. [Google Scholar]
- Devi, P.C.; Sivakumar, B.; Krishnamoorthy,A. Optimal Control Policy of an Inventory System with Postponed Demand. RAIRO-Oper. Res. 2016, 50, 145–155. [Google Scholar] [CrossRef]
- Varghese, D.T.; Shajin, D. State Dependent Admission of Demands in a Finite Storage System. Int. J. Pure & Appl. Math. 2018, 118(20), 917–922. [Google Scholar]
- Jenifer, J.S.A.; Sangeetha, N.; Sivakumar, B. Optimal Control of Service Parameter for a Perishable Inventory System with Service Facility, Postponed Demands and Finite Waiting Hall. Int. J. Inform. & Manag. Sci. 2014, 25, 349–370. [Google Scholar]
- Melikov, A.; Mirzayev, R.R.; Sztrik, J. Double Sources QIS with Finite Waiting Room and Destructible Stocks. Mathematics 2023, 11, 226. [Google Scholar] [CrossRef]
| Max of error for SSPs |
Error for | |||||
|---|---|---|---|---|---|---|
| 0 | ||||||
| 5 | ||||||
| 10 | ||||||
| 15 | ||||||
| 20 | ||||||
| 25 | ||||||
| 30 | ||||||
| 35 | ||||||
| 40 | ||||||
| 45 | ||||||
| 50 | 28.07176 | 1.439081 | 0.172690 | 29.92832 | 13.98755 | 18981.34 |
| 55 | 31.23721 | 1.493466 | 0.162924 | 29.92834 | 13.98755 | 19059.21 |
| 60 | 34.46487 | 1.548604 | 0.154860 | 29.92835 | 13.98755 | 19138.86 |
| 65 | 37.75379 | 1.604545 | 0.148112 | 29.92836 | 13.98755 | 19220.23 |
| 70 | 41.10292 | 1.661316 | 0.142398 | 29.92837 | 13.98755 | 19303.25 |
Disclaimer/Publisher’s Note: The statements, opinions and data contained in all publications are solely those of the individual author(s) and contributor(s) and not of MDPI and/or the editor(s). MDPI and/or the editor(s) disclaim responsibility for any injury to people or property resulting from any ideas, methods, instructions or products referred to in the content. |
© 2024 by the authors. Licensee MDPI, Basel, Switzerland. This article is an open access article distributed under the terms and conditions of the Creative Commons Attribution (CC BY) license (http://creativecommons.org/licenses/by/4.0/).


