Submitted:
27 February 2024
Posted:
28 February 2024
You are already at the latest version
Abstract
Keywords:
1. Introduction
2. Materials and Methods
2.1. Patient Selection
2.2. Surgical Procedures
2.3. Prosthetic Protocol
2.4. Radiographic Evaluations
2.5. Clinical Evaluations
2.6. Sample Size and Randomization
2.7. Statistical Analysis
3. Results
4. Discussion
5. Conclusions
Author Contributions
Funding
Institutional Review Board Statement
Informed Consent Statement
Data Availability Statement
Acknowledgments
Conflicts of Interest
References
- Buser, D.; Mericske-Stern, R.; Dula, K.; Lang, N.P. Clinical Experience with One-Stage, Non-Submerged Dental Implants. Adv Dent Res 1999, 13, 153–161. [Google Scholar] [CrossRef]
- Palacios-Garzón, N.; Velasco-Ortega, E.; López-López, J. Bone Loss in Implants Placed at Subcrestal and Crestal Level: A Systematic Review and Meta-Analysis. Materials 2019, 12. [Google Scholar] [CrossRef]
- Liu, M.; He, L.; Wang, H. Clinical and Radiographic Performance of One-Piece and Two-Piece Implant: A Systematic Review and Meta-Analysis. J Prosthodont Res 2021, 65, 56–66. [Google Scholar] [CrossRef] [PubMed]
- Candotto, V.; Gabrione, F.; Oberti, L.; Lento, D.; Severino, M. The Role of Implant-Abutment Connection in preventing Bacterial Leakage: A Review. J Biol Regul Homeost Agents. 2019, 3, 129–134. [Google Scholar]
- Annibali, S.; Bignozzi, I.; Cristalli, M.P.; Graziani, F.; La Monaca, G.; Polimeni, A. Peri-Implant Marginal Bone Level: A Systematic Review and Meta-Analysis of Studies Comparing Platform Switching versus Conventionally Restored Implants. J Clin Periodontol 2012, 39, 1097–1113. [Google Scholar] [CrossRef]
- Cochran, D.L.; Mau, L.P.; Higginbottom, F.L.; Wilson, T.G.; Bosshardt, D.D.; Schoolfield, J.; Jones, A.A. Soft and Hard Tissue Histologic Dimensions Around Dental Implants in the Canine Restored with Smaller-Diameter Abutments: A Paradigm Shift in Peri-Implant Biology. Int J Oral Maxillofac Implants 2013, 28, 494–502. [Google Scholar] [CrossRef] [PubMed]
- Windael, S.; Collaert, B.; De Buyser, S.; De Bruyn, H.; Vervaeke, S. Early Peri-Implant Bone Loss as a Predictor for Peri-Implantitis: A 10-Year Prospective Cohort Study. Clin Implant Dent Relat Res 2021, 23, 298–308. [Google Scholar] [CrossRef] [PubMed]
- Hermann, J.S.; Buser, D.; Schenk, R.K.; Cochran, D.L. Crestal Bone Changes Around Titanium Implants. A Histometric Evaluation of Unloaded Non-Submerged and Submerged Implants in the Canine Mandible. 2000, 71. [Google Scholar] [CrossRef] [PubMed]
- Oh, T.; Yoon, J.; Misch, C.E.; Wang, H. The Causes of Early Implant Bone Loss: Myth or Science? J Periodontol 2002, 73, 322–333. [Google Scholar] [CrossRef] [PubMed]
- Tatarakis, N.; Bashutski, J.; Wang, H.L.; Oh, T.J. Early Implant Bone Loss: Preventable or Inevitable? Implant Dent 2012, 21, 379–386. [Google Scholar] [CrossRef]
- Smith, D.E.; Zarb, G.A. Criteria for Success of Osseointegrated Endosseous Implants. J Prosthet Dent 1989, 62, 567–572. [Google Scholar] [CrossRef] [PubMed]
- Albrektsson, T.; Chrcanovic, B.; Östman, P.O.; Sennerby, L. Initial and Long-Term Crestal Bone Responses to Modern Dental Implants. Periodontol 2000 2017, 73, 41–50. [Google Scholar] [CrossRef] [PubMed]
- Vervaeke, S.; Matthys, C.; Nassar, R.; Christiaens, V.; Cosyn, J.; De Bruyn, H. Adapting the Vertical Position of Implants with a Conical Connection in Relation to Soft Tissue Thickness Prevents Early Implant Surface Exposure: A 2-Year Prospective Intra-Subject Comparison. J Clin Periodontol 2018, 45, 605–612. [Google Scholar] [CrossRef] [PubMed]
- Stacchi, C.; Lamazza, L.; Rapani, A.; Troiano, G.; Messina, M.; Antonelli, A.; Giudice, A.; Lombardi, T. Marginal Bone Changes around Platform-Switched Conical Connection Implants Placed 1 or 2 Mm Subcrestally: A Multicenter Crossover Randomized Controlled Trial. Clin Implant Dent Relat Res 2023, 25, 398–408. [Google Scholar] [CrossRef] [PubMed]
- Spinato, S.; Bernardello, F.; Lombardi, T.; Soardi, C.M.; Messina, M.; Zaffe, D.; Stacchi, C. Influence of Apico-Coronal Positioning of Tissue-Level Implants on Marginal Bone Stability during Supracrestal Tissue Height Establishment: A Multi-Center Prospective Study. Clin Implant Dent Relat Res 2022, 24, 611–620. [Google Scholar] [CrossRef] [PubMed]
- Vervaeke, S.; Dierens, M.; Besseler, J.; De Bruyn, H. The Influence of Initial Soft Tissue Thickness on Peri-Implant Bone Remodeling. Clin Implant Dent Relat Res 2014, 16, 238–247. [Google Scholar] [CrossRef]
- Al Amri, M.D. Crestal Bone Loss around Submerged and Nonsubmerged Dental Implants: A Systematic Review. [CrossRef]
- Romanos, G.E.; Aydin, E.; Gaertner, K.; Nentwig, G.H. Long-Term Results after Subcrestal or Crestal Placement of Delayed Loaded Implants. Clin Implant Dent Relat Res 2015, 17, 133–141. [Google Scholar] [CrossRef]
- Linkevicius, T.; Puisys, A.; Linkevicius, R.; Alkimavicius, J.; Gineviciute, E.; Linkeviciene, L. The Influence of Submerged Healing Abutment or Subcrestal Implant Placement on Soft Tissue Thickness and Crestal Bone Stability. A 2-Year Randomized Clinical Trial. Clin Implant Dent Relat Res 2020, 22, 497–506. [Google Scholar] [CrossRef] [PubMed]
- Wang, Q. qing; Dai, R.; Cao, C.Y.; Fang, H.; Han, M.; Li, Q.L. One-Time versus Repeated Abutment Connection for Platform-Switched Implant: A Systematic Review and Meta-Analysis. PLoS One 2017, 12. [Google Scholar] [CrossRef] [PubMed]
- Vatėnas, I.; Linkevičius, T. One Abutment One Time vs. Repeatable Abutment Disconnections in Implants, Restored with Cemented/Screw Retained Fi Xed Partial Dentures: Marginal Bone Level Changes. A Systematic Review and Meta-Analysis. 2021, 23. [Google Scholar]
- Grandi, T.; Guazzi, P.; Samarani, R.; Garuti, G. Immediate Positioning of Definitive Abutments versus Repeated Abutment Replacements in Immediately Loaded Implants: Effects on Bone Healing at the 1-Year Follow-up of a Multicentre Controlled Trial. Eur J Oral Implantol 2012, 5, 9–16. [Google Scholar] [PubMed]
- Ríos-Santos, J.V.; Tello-González, G.; Lázaro-Calvo, P.; Mur, F.J.G.; Ríos-Carrasco, B.; Fernández-Palacín, A.; Herrero-Climent, M. One Abutment One Time: A Multicenter, Prospective, Controlled, Randomized Study. Int J Environ Res Public Health 2020, 17, 1–17. [Google Scholar] [CrossRef] [PubMed]
- Calcaterra, R.; Di Girolamo, M.; Mirisola, C.; Baggi, L. Effects of Repeated Screw Tightening on Implant Abutment Interfaces in Terms of Bacterial and Yeast Leakage in Vitro: One-Time Abutment Versus the Multiscrewing Technique. Int J Periodontics Restorative Dent 2016, 36, 275–280. [Google Scholar] [CrossRef]
- Chan, D.; Pelekos, G.; Ho, D.; Cortellini, P.; Tonetti, M.S. The Depth of the Implant Mucosal Tunnel Modifies the Development and Resolution of Experimental Peri-Implant Mucositis: A Case–Control Study. J Clin Periodontol 2019, 46, 248–255. [Google Scholar] [CrossRef] [PubMed]
- Canullo, L.; Penarrocha-Oltra, D.; Soldini, C.; Mazzocco, F.; Penarrocha, M.; Covani, U. Microbiological Assessment of the Implant-Abutment Interface in Different Connections: Cross-Sectional Study after 5 Years of Functional Loading. Clin Oral Implants Res 2015, 26, 426–434. [Google Scholar] [CrossRef] [PubMed]
- Schmitt, C.M.; Nogueira-Filho, G.; Tenenbaum, H.C.; Lai, J.Y.; Brito, C.; Döring, H.; Nonhoff, J. Performance of Conical Abutment (Morse Taper) Connection Implants: A Systematic Review. J Biomed Mater Res A 2014, 102, 552–574. [Google Scholar] [CrossRef]
- Vetromilla, B.M.; Brondani, L.P.; Pereira-Cenci, T.; Bergoli, C.D. Influence of Different Implant-Abutment Connection Designs on the Mechanical and Biological Behavior of Single-Tooth Implants in the Maxillary Esthetic Zone: A Systematic Review. [CrossRef]
- Weng, D.; Nagata, M.J.H.; Bosco, A.F.; de Melo, L.G.N. Influence of Microgap Location and Configuration on Radiographic Bone Loss Around Submerged Implants: An Experimental Study in Dogs. Int J Oral Maxillofac Implants 2011, 26, 941–946. [Google Scholar]
- Weng, D.; Nagata, M.J.H.; Leite, C.M.; de Melo, L.G.N.; Bosco, A.F. Influence of Microgap Location and Configuration on Radiographic Bone Loss in Nonsubmerged Implants: An Experimental Study in Dogs. Int J Prosthodont 2011, 24, 445–452. [Google Scholar]
- Lazzara, R.J.; Porter, S.S. Platform Switching: A New Concept in Implant for Controlling Postrestorative Crestal Bone. Int J Periodontics Restorative Dent 2006, 26, 9–17. [Google Scholar] [CrossRef]
- Hermann, J.S.; Schenk, R.K.; Schoolfield, J.D. Biologic Width around One- and Two-Piece Titanium Implants A Histometric Evaluation of Unloaded Nonsubmerged and Submerged Implants in Tbe. Clin Oral Implants Res 2001, Dec;12, 559–71. [Google Scholar] [CrossRef]
- Sailer, I.; Mühlemann, S.; Zwahlen, M.; Hämmerle, C.H.F.; Schneider, D. Cemented and Screw-Retained Implant Reconstructions: A Systematic Review of the Survival and Complication Rates. Clin Oral Implants Res 2012, 23, 163–201. [Google Scholar] [CrossRef]
- Wilson Jr., T. G. The Positive Relationship Between Excess Cement and Peri-Implant Disease: A Prospective Clinical Endoscopic Study. J Periodontol 2009, 80, 1388–1392. [Google Scholar] [CrossRef]
- Linkevicius, T.; Vindasiute, E.; Puisys, A.; Peciuliene, V. The Influence of Margin Location on the Amount of Undetected Cement Excess after Delivery of Cement-Retained Implant Restorations. Clin Oral Implants Res 2011, 22, 1379–1384. [Google Scholar] [CrossRef] [PubMed]
- Heitz-Mayfield, L.J.A.; Salvi, G.E.; Botticelli, D.; Mombelli, A.; Faddy, M.; Lang, N.P. Anti-Infective Treatment of Peri-Implant Mucositis: A Randomised Controlled Clinical Trial. Clin Oral Implants Res 2011, 22, 237–241. [Google Scholar] [CrossRef] [PubMed]
- Schätzle, M.; Lang, N.P.; Ånerud, Å.; Boysen, H.; Bürgin, W.; Löe, H. The Influence of Margins of Restorations on the Periodontal Tissues over 26 Years. J Clin Periodontol 2001, 28, 57–64. [Google Scholar] [CrossRef] [PubMed]
- Galindo-Moreno, P.; León-Cano, A.; Ortega-Oller, I.; Monje, A.; Suárez, F.; O’Valle, F.; Spinato, S.; Catena, A. Prosthetic Abutment Height Is a Key Factor in Peri-Implant Marginal Bone Loss. J Dent Res 2014, 93, 80S–85S. [Google Scholar] [CrossRef] [PubMed]
- Mombelli, A.; Lang, N.P. Clinical Parameters for the Evaluation of Dental Implants. Periodontol 2000 1994, 4, 81–86. [Google Scholar] [CrossRef]
- Trombelli, L.; Farina, R.; Silva, C.O.; Tatakis, D.N. Plaque-Induced Gingivitis: Case Definition and Diagnostic Considerations. J Clin Periodontol 2018, 45, S44–S67. [Google Scholar] [CrossRef]
- O’Leary, T.J.; Drake, R.B.; Naylor, J.E. The Plaque Control Record. J Periodontol 1972, 43, 38–38. [Google Scholar] [CrossRef]
- Bolle, C.; Gustin, M.P.; Fau, D.; Exbrayat, P.; Boivin, G.; Grosgogeat, B. Early Periimplant Tissue Healing on 1-Piece Implants with a Concave Transmucosal Design: A Histomorphometric Study in Dogs. In Proceedings of the Implant Dentistry; Lippincott Williams and Wilkins, 1 October 2015; Volume 24, pp. 598–606. [Google Scholar]
- Tomasi, C.; Tessarolo, F.; Caola, I.; Wennström, J.; Nollo, G.; Berglundh, T. Morphogenesis of Peri-Implant Mucosa Revisited: An Experimental Study in Humans. Clin Oral Implants Res 2014, 25, 997–1003. [Google Scholar] [CrossRef] [PubMed]
- Nevins, M.; Kim, D.M.; Jun, S.-H.; Guze, K.; Schupbach, P.; Nevins, M.L. Histologic Evidence of a Connective Tissue Attachment to Laser Microgrooved Abutments: A Canine Study. Int J Periodontics Restorative Dent 2012, 30, 245–255. [Google Scholar] [CrossRef]
- Linkevicius, T.; Puisys, A.; Steigmann, M.; Vindasiute, E.; Linkeviciene, L. Influence of Vertical Soft Tissue Thickness on Crestal Bone Changes Around Implants with Platform Switching: A Comparative Clinical Study. Clin Implant Dent Relat Res 2015, 17, 1228–1236. [Google Scholar] [CrossRef]
- Linkevicius, T.; Apse, P.; Grybauskas, S.; Puisys, A. Reaction of Crestal Bone around Implants Depending on Mucosal Tissue Thickness. A 1-Year Prospective Clinical Study. 2009, Vol. 11. [Google Scholar]
- Heitz-Mayfield, L.J.A.; Salvi, G.E. Peri-Implant Mucositis. J Clin Periodontol 2018, 45, S237–S245. [Google Scholar] [CrossRef] [PubMed]
- Heitz-Mayfield, L.J.A.; Heitz, F.; Lang, N.P. Implant Disease Risk Assessment IDRA–a Tool for Preventing Peri-Implant Disease. Clin Oral Implants Res 2020, 31, 397–403. [Google Scholar] [CrossRef] [PubMed]
- Koutouzis, T.; Gholami, F.; Reynolds, J.; Lundgren, T.; Kotsakis, G. Abutment Disconnection/Reconnection Affects Peri-Implant Marginal Bone Levels: A Meta-Analysis. Int J Oral Maxillofac Implants 2017, 32, 575–581. [Google Scholar] [CrossRef]
- Molina, A.; Sanz-Sánchez, I.; Martín, C.; Blanco, J.; Sanz, M. The Effect of One-Time Abutment Placement on Interproximal Bone Levels and Peri-Implant Soft Tissues: A Prospective Randomized Clinical Trial. Clin Oral Implants Res 2017, 28, 443–452. [Google Scholar] [CrossRef]
- Gabriel De Carvalho Barbara, J.; Luz, D.; Vianna, K.; Porto Barboza, E. The Influence of Abutment Disconnections on Peri-Implant Marginal Bone: A Systematic Review. 2019, Vol. 12. [Google Scholar]
- Praça, L. de F.G.; Teixeira, R.C.; Rego, R.O. Influence of Abutment Disconnection on Peri-Implant Marginal Bone Loss: A Randomized Clinical Trial. Clin Oral Implants Res 2020, 31, 341–351. [Google Scholar] [CrossRef] [PubMed]
- Koutouzis, T.; Koutouzis, G.; Gadella, H.; Neiva, R. The Effect of Healing Abutment Reconnection and Disconnection on Soft and Hard Peri-Implant Tissues: A Short-Term Randomized Controlled Clinical Trial. Int J Oral Maxillofac Implants 2013, 28, 807–814. [Google Scholar] [CrossRef] [PubMed]
- Linkevicius, T.; Linkevicius, R.; Gineviciute, E.; Alkimavicius, J.; Mazeikiene, A.; Linkeviciene, L. The Influence of New Immediate Tissue Level Abutment on Crestal Bone Stability of Subcrestally Placed Implants: A 1-Year Randomized Controlled Clinical Trial. Clin Implant Dent Relat Res 2021, 23, 259–269. [Google Scholar] [CrossRef] [PubMed]
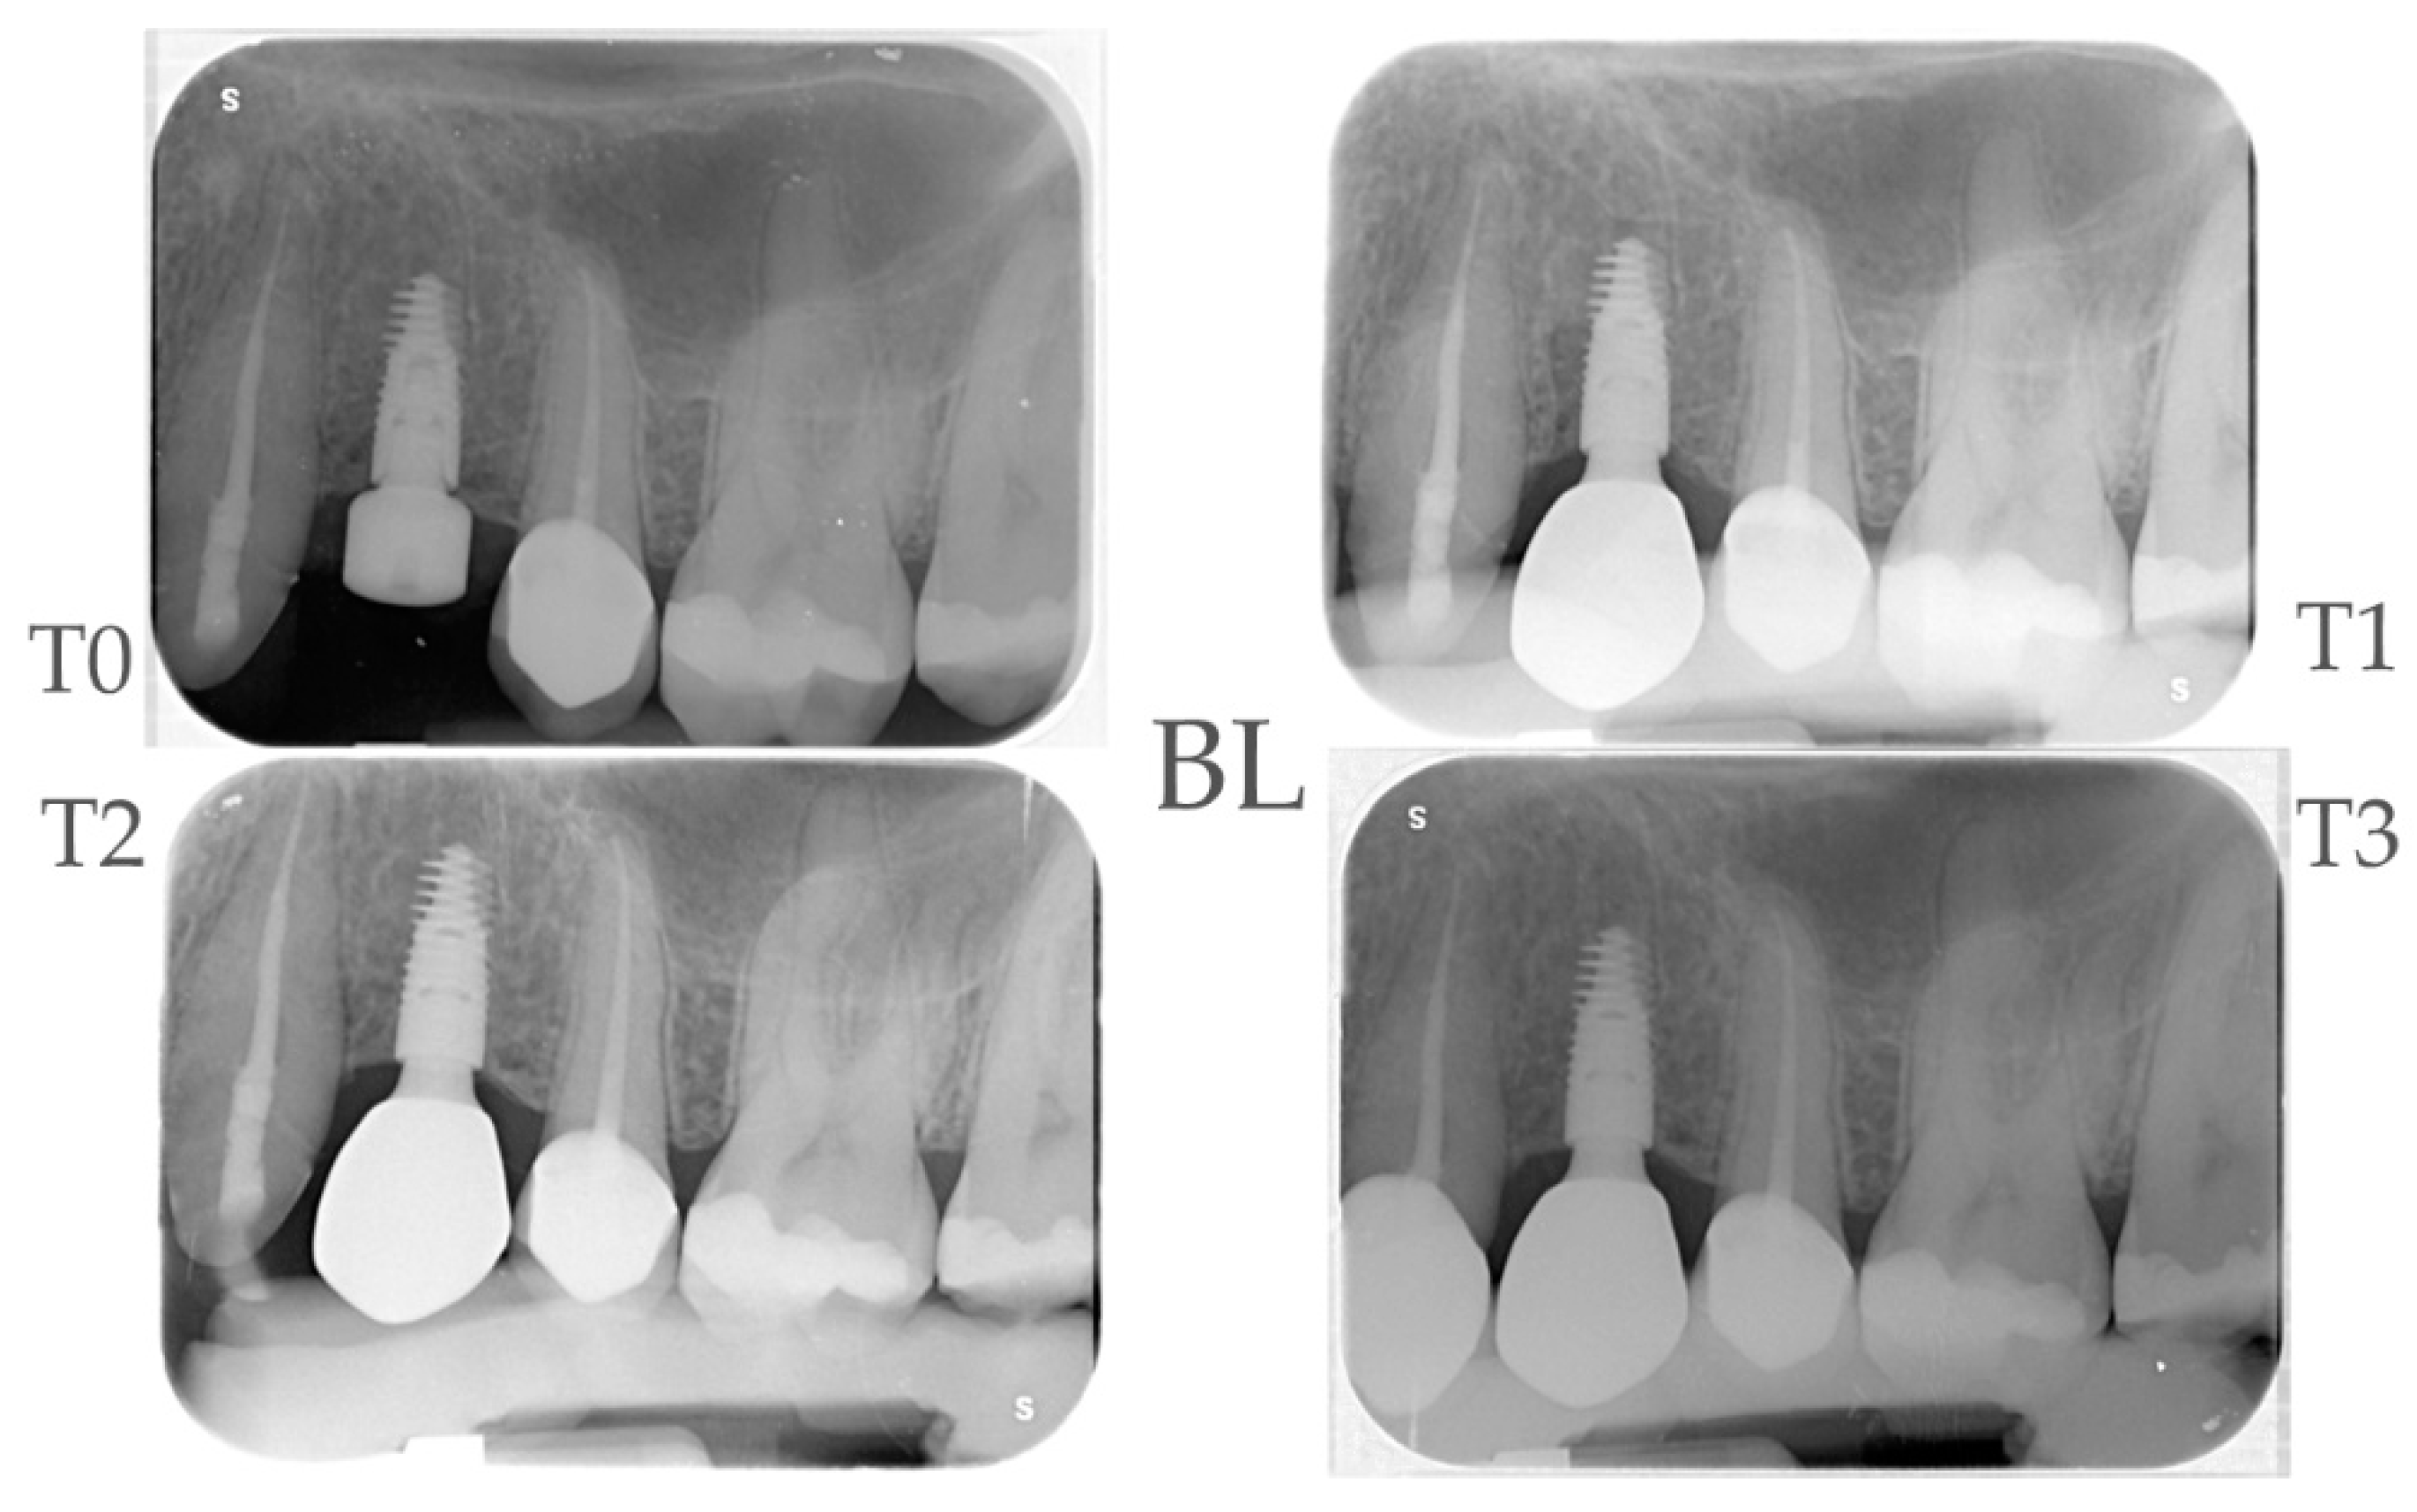
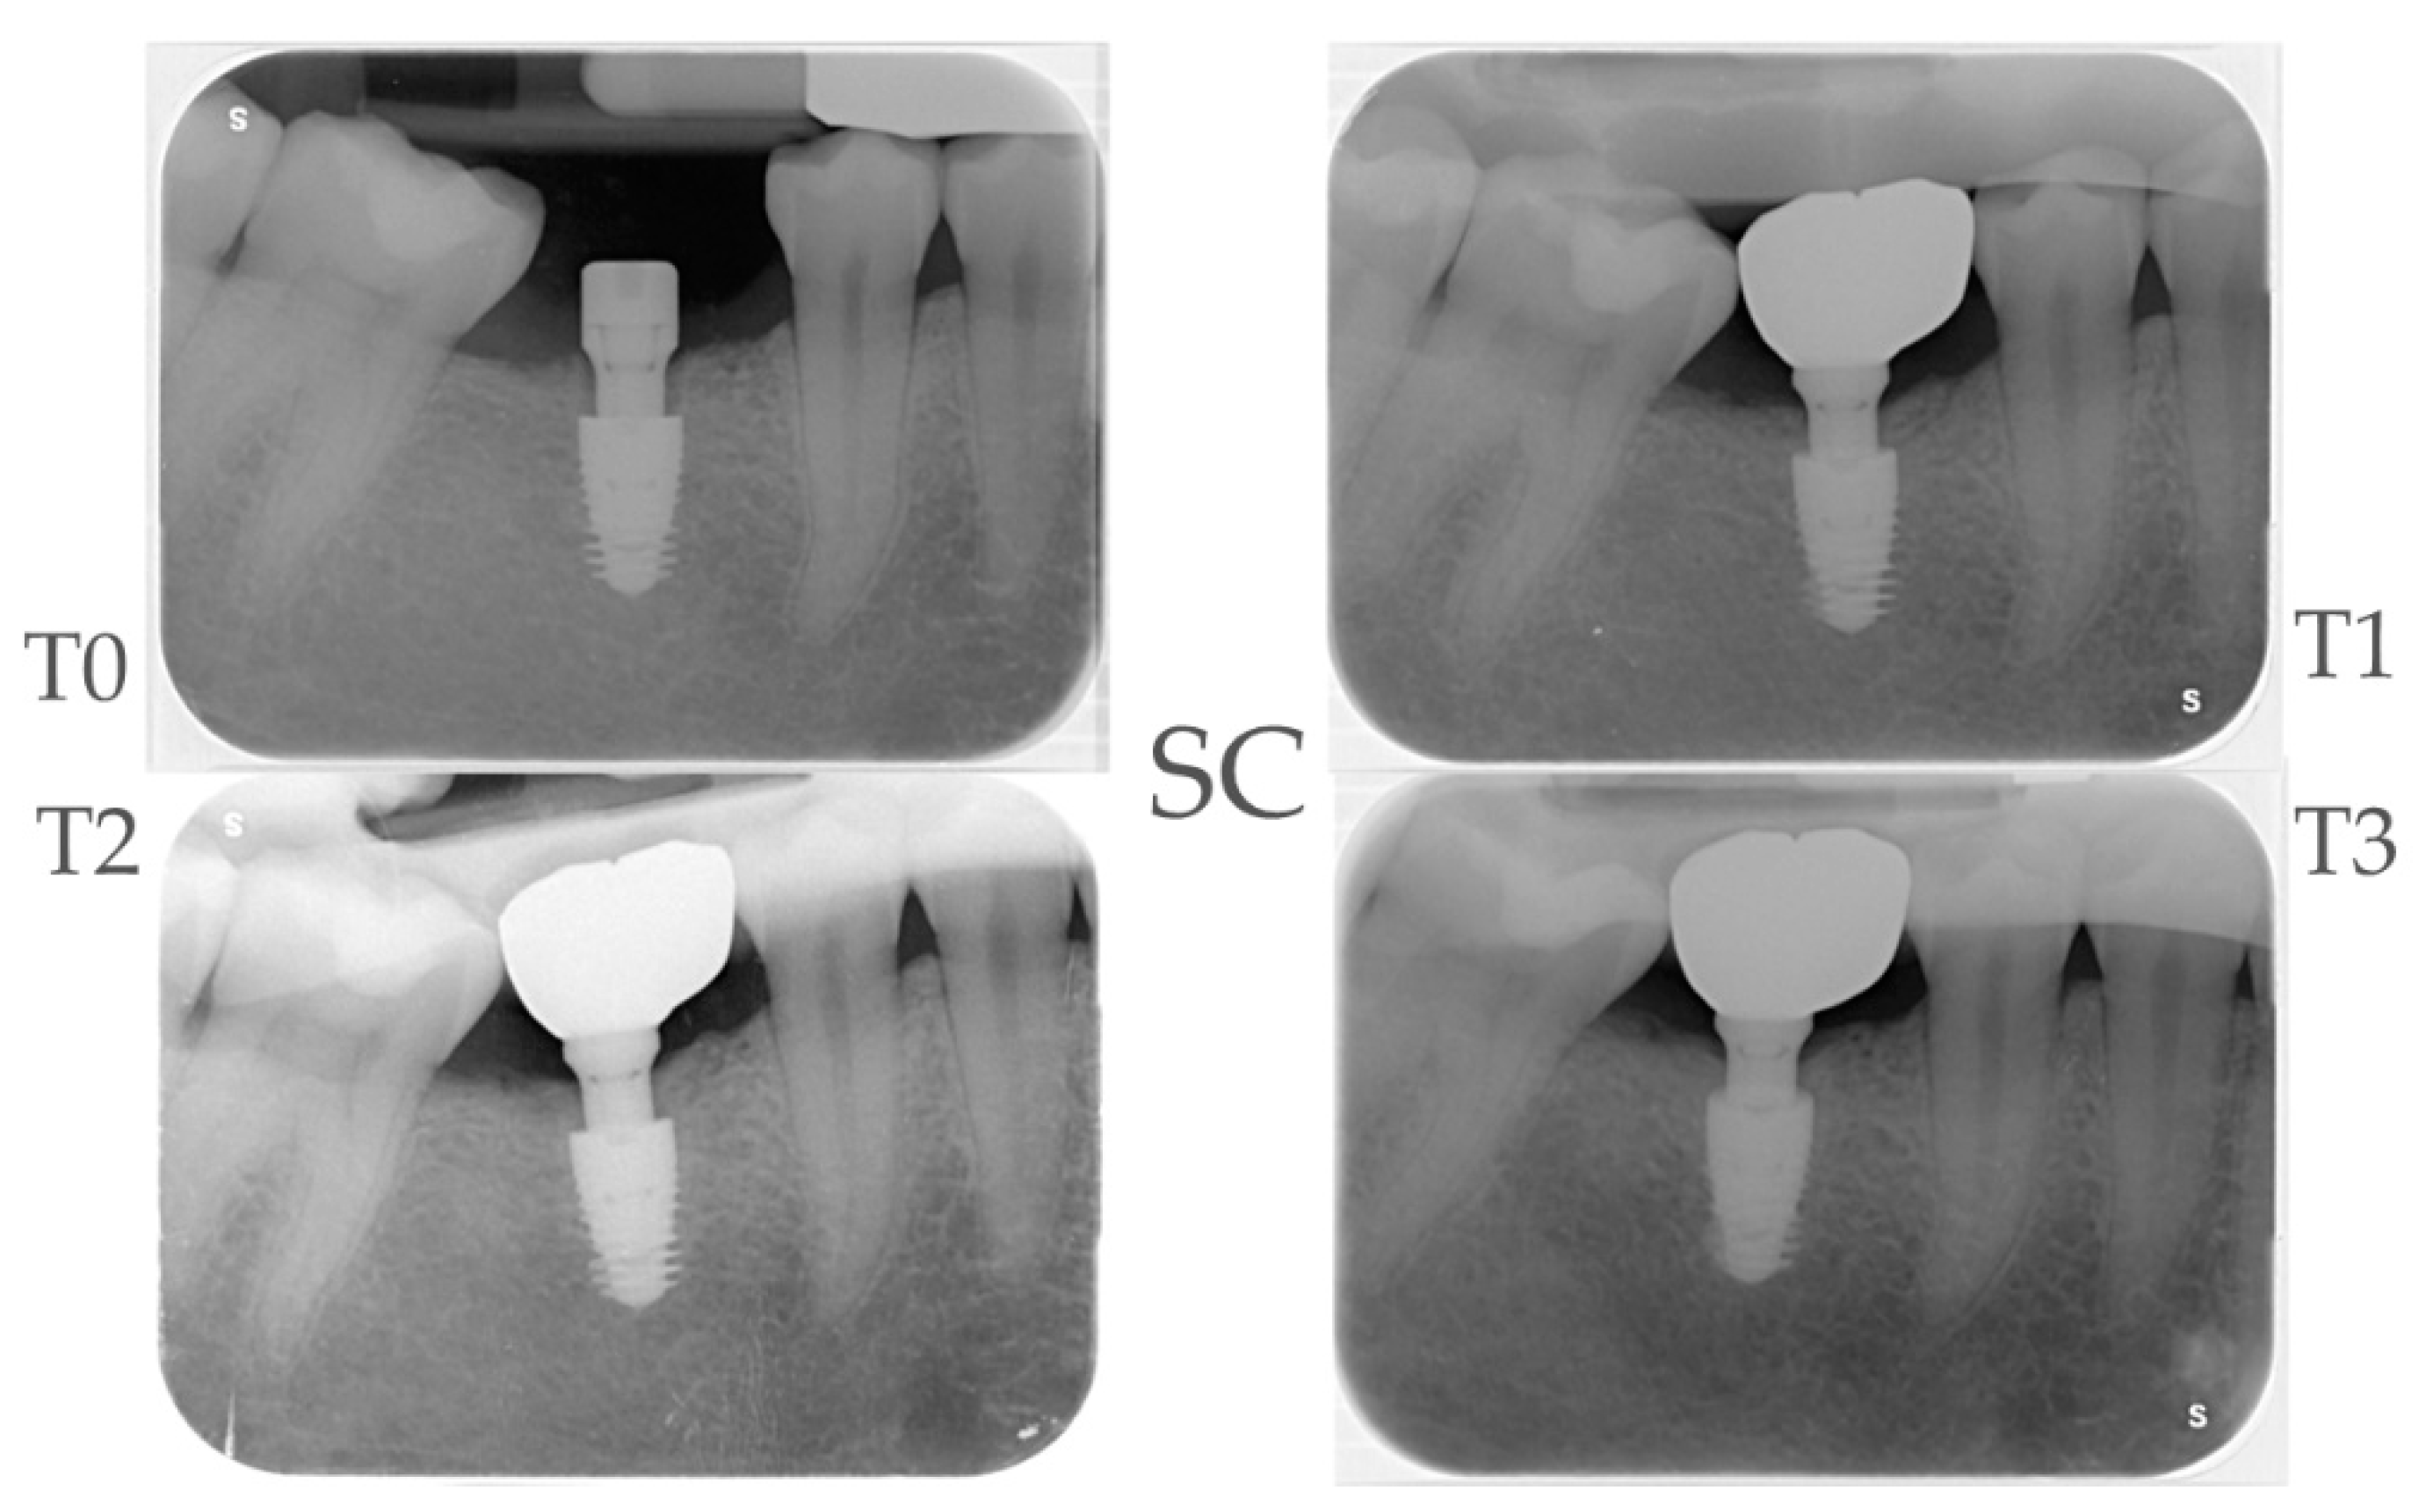
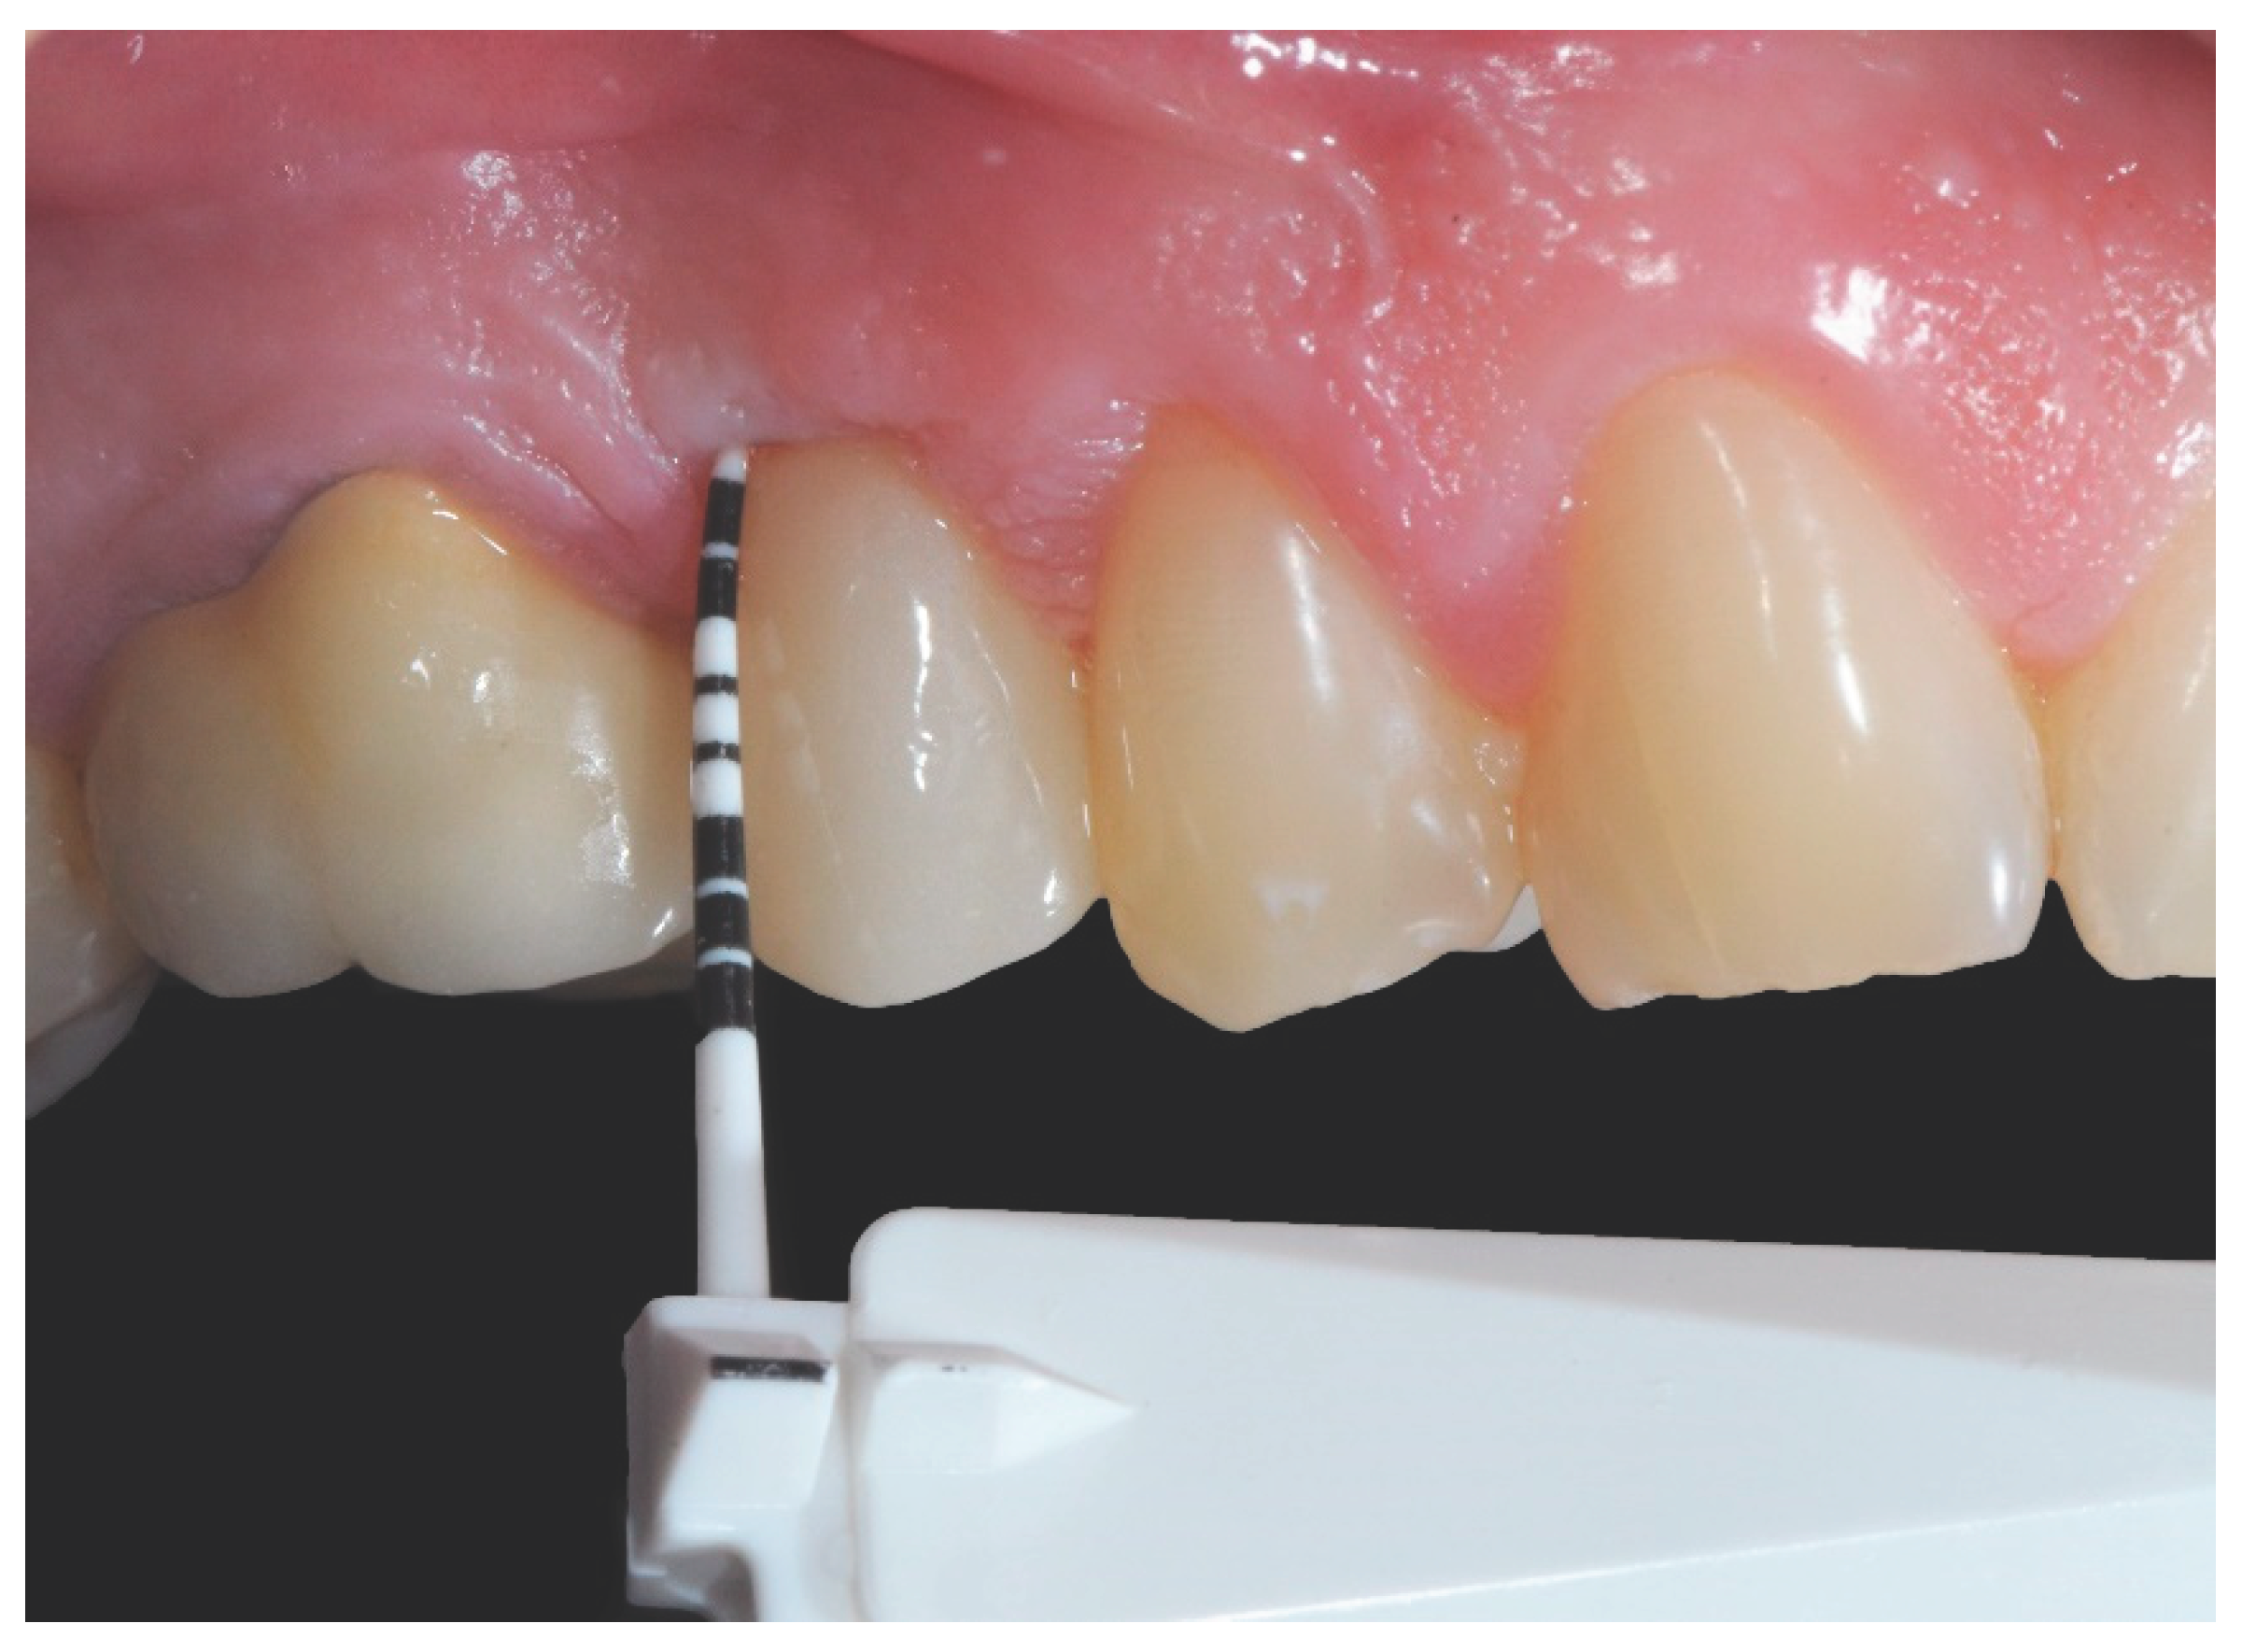
| Demographic characteristics |
Total N (%) |
Control Group BL N (%)** |
Test Group SC N (%)* |
|---|---|---|---|
| Subjects enrolled | 38 (100%) | 19 (50%) | 19 (50%) |
| Drop Out | 2 (5,3%) | 1 (50%) | 1 (50%) |
| Age (mean) | 49,4 (23-72) | 47,3 (23-69) | 51,5 (33-72) |
| Sex | F: 22 (62%) M: 14 (38,9%) |
F: 13 (72,2%) M: 5 (27,8%) |
F: 9 (50%) M: 9 (50%) |
| Smokers | 6 (16,7%) | 4 ( 22,2%) | 2 (11,1%) |
| Sites | Total N (%) |
Control Group BL N (%)** |
Test Group SC N (%)* |
|---|---|---|---|
| Dental arch | Upper: 12 (33,3%) Lower: 24 (66,7%) |
Upper: 7 (38,9%) Lower: 11 (61%) |
Upper: 5 (33,3%) Lower: 13 (66,7%) |
| Site | Premolar: 15 (41,7%) Molar: 21 (53,8%) |
Premolar: 9 (50%) Molar: 9 (50%) |
Premolar: 15 (41,7%) Molar: 21 (53,8%) |
| STH§ (mm) | 1: 0 (0%) 2: 12 (33,3%) 3: 21 (58,4%) 4: 3 (8,3%) |
1: 0 (0%) 2: 4 (22,2%) 3: 13 (72,2%) 4: 1 (5,6%)) |
1: 0 (0%) 2: 8 (44,4%) 3: 8 (44,4%) 4: 2 (11,2%) |
| Implant (Diametre x Length) |
3,6x 9: 23 (63,9%) 4,3x 7,5: 13 (36,1%) |
3,6x 9: 15 (83,3%) 4,3x 7,5: 3 (16,7%) |
3,6x 9: 8 (44,4%) 4,3x 7,5: 10 (55,6%) |
| Bone Density (Misch Classification) |
D1: 0 (0%) D2: 4 (11%) D3: 25 (69,4%) D4: 7 (19,4%) |
D1: 0 (0%) D2: 3 (16,7%) D3: 14 (77,8%) D4: 1 (5,6%) |
D1: 0 (0%) D2: 1 (5,6%) D3: 11 (61,1%) D4: 6 (33,3%) |
| Healing Abutment (mm) Control Group |
3,5: 6 (33,3%) 4,5: 12 (66,7%) |
||
| GFA§§ (mm) Test Group |
3,5: 7 (38,9%) 4,5: 9 (50%) 5,5 2 (11,1%) |
| Time Points | MBM Control Group Δ (CI 95%)** |
P-value | Bone Loss Control Group Δ (CI 95%)** | MBM Test Group Δ (CI 95%)* |
P-value | Bone Loss Test Group Δ (CI 95%)** | MBM Test VS Control Δ (CI 95%) |
P-value |
|---|---|---|---|---|---|---|---|---|
| T1 – T0 | -0.44 (-0.67; -0.21) |
<0.01 | -0.44 (-0.67; -0.21) |
-0.65 (-0.89; -0.42) |
<0.01 | 0 | -0.21 (-0.54; 0.11) |
0.195 |
| T2 – T0 | -0.49 (-0.72; -0.26) |
<0.01 | -0.49 (-0.72; -0.26) |
-0.72 (-0.95; -0.49) |
<0.01 | 0 | -0,23 (-0,55; 0,10) |
0.168 |
| T3 – T0 | -0.52 (-0.75; -0.29) |
<0.01 | -0.52 (-0.75; -0.29) |
-0.60 (-0.83; -0.36) |
<0.01 | 0 | -0.07 (-0.40; 0.25) |
0.657 |
| Clinical Parameter |
Control Group** | Test Group* | TEST VS Control | |||||
|---|---|---|---|---|---|---|---|---|
| 6 months | 1 year | 1 year VS 6 months |
6 months | 1 year | 1 year VS 6 months |
6 months | 1 year | |
| PPD (mm) (CI 95%) |
3.18 (2.76; 3.60) |
3.04 (2.64; 3.45) |
0.04 (-0.72; 0.45) p=0.641 |
2.33 (2.03; 2.63) |
2.38 (2.13; 2.62) |
0.04 (-0.35; 0.43) p=0.834 |
-0.85 (-1.36; -0.33) p=0.001 |
-0.67 (-1.14; -0.19) p=0.006 |
| BOP (%) (CI 95%) |
55.56 (43.90; 70.31) |
43.06 (33.54; 55.27) |
0.78 (0.56; 1.08) [p=0.134] |
36.11 (24.51; 53.21) |
50.00 (36.40; 68.68) |
1.38 (0.86; 2.23) [p=0.180] |
0.65 (0.41; 1.02) [p=0.0627] |
1.16 (0.78; 1.74) [p=0.4681] |
| PI(%) (CI 95%) |
12.50 (4.90; 31.89) |
19.44 ( 10.54; 35.86) |
1.56 (0.49; 4.89) [p=0.44979] |
11.11 (5.03; 24.53) |
33.33 (21.00; 52.91) |
3.00 (1.33; 6.79) [p=0.00837] |
0.89 (0.26; 3.03) [p=0.851] |
1.71 (0.80; 3.69) [p=0.168] |
Disclaimer/Publisher’s Note: The statements, opinions and data contained in all publications are solely those of the individual author(s) and contributor(s) and not of MDPI and/or the editor(s). MDPI and/or the editor(s) disclaim responsibility for any injury to people or property resulting from any ideas, methods, instructions or products referred to in the content. |
© 2024 by the authors. Licensee MDPI, Basel, Switzerland. This article is an open access article distributed under the terms and conditions of the Creative Commons Attribution (CC BY) license (http://creativecommons.org/licenses/by/4.0/).


