Submitted:
27 February 2024
Posted:
28 February 2024
You are already at the latest version
Abstract
Keywords:
1. Introduction
2. Materials and Methods
2.1. Cell Culture
2.2. Cytotoxicity Studies
2.3. Cystine Uptake Assay via XC- Antiporter
2.4. Flow Cytometric Analysis of Mitochondrial ROS
2.5. Lipid Peroxidation Assay
2.6. Flow Cytometric Analysis of Annexin-V Binding
2.7. Real Time RT-PCR
2.8. Western Blot Assay
2.9. Statistical Analysis
3. Results
3.1. Cytotoxicity Studies with Erastin
3.2. Effects of Ferrostatin-1 and RSL3 on Erastin Cytotoxicity
3.3. Cytotoxicity of RSL3 in OVCAR-8 and NIH/ADR-RES Cells
3.4. Effects of ER on Xc- Transporter
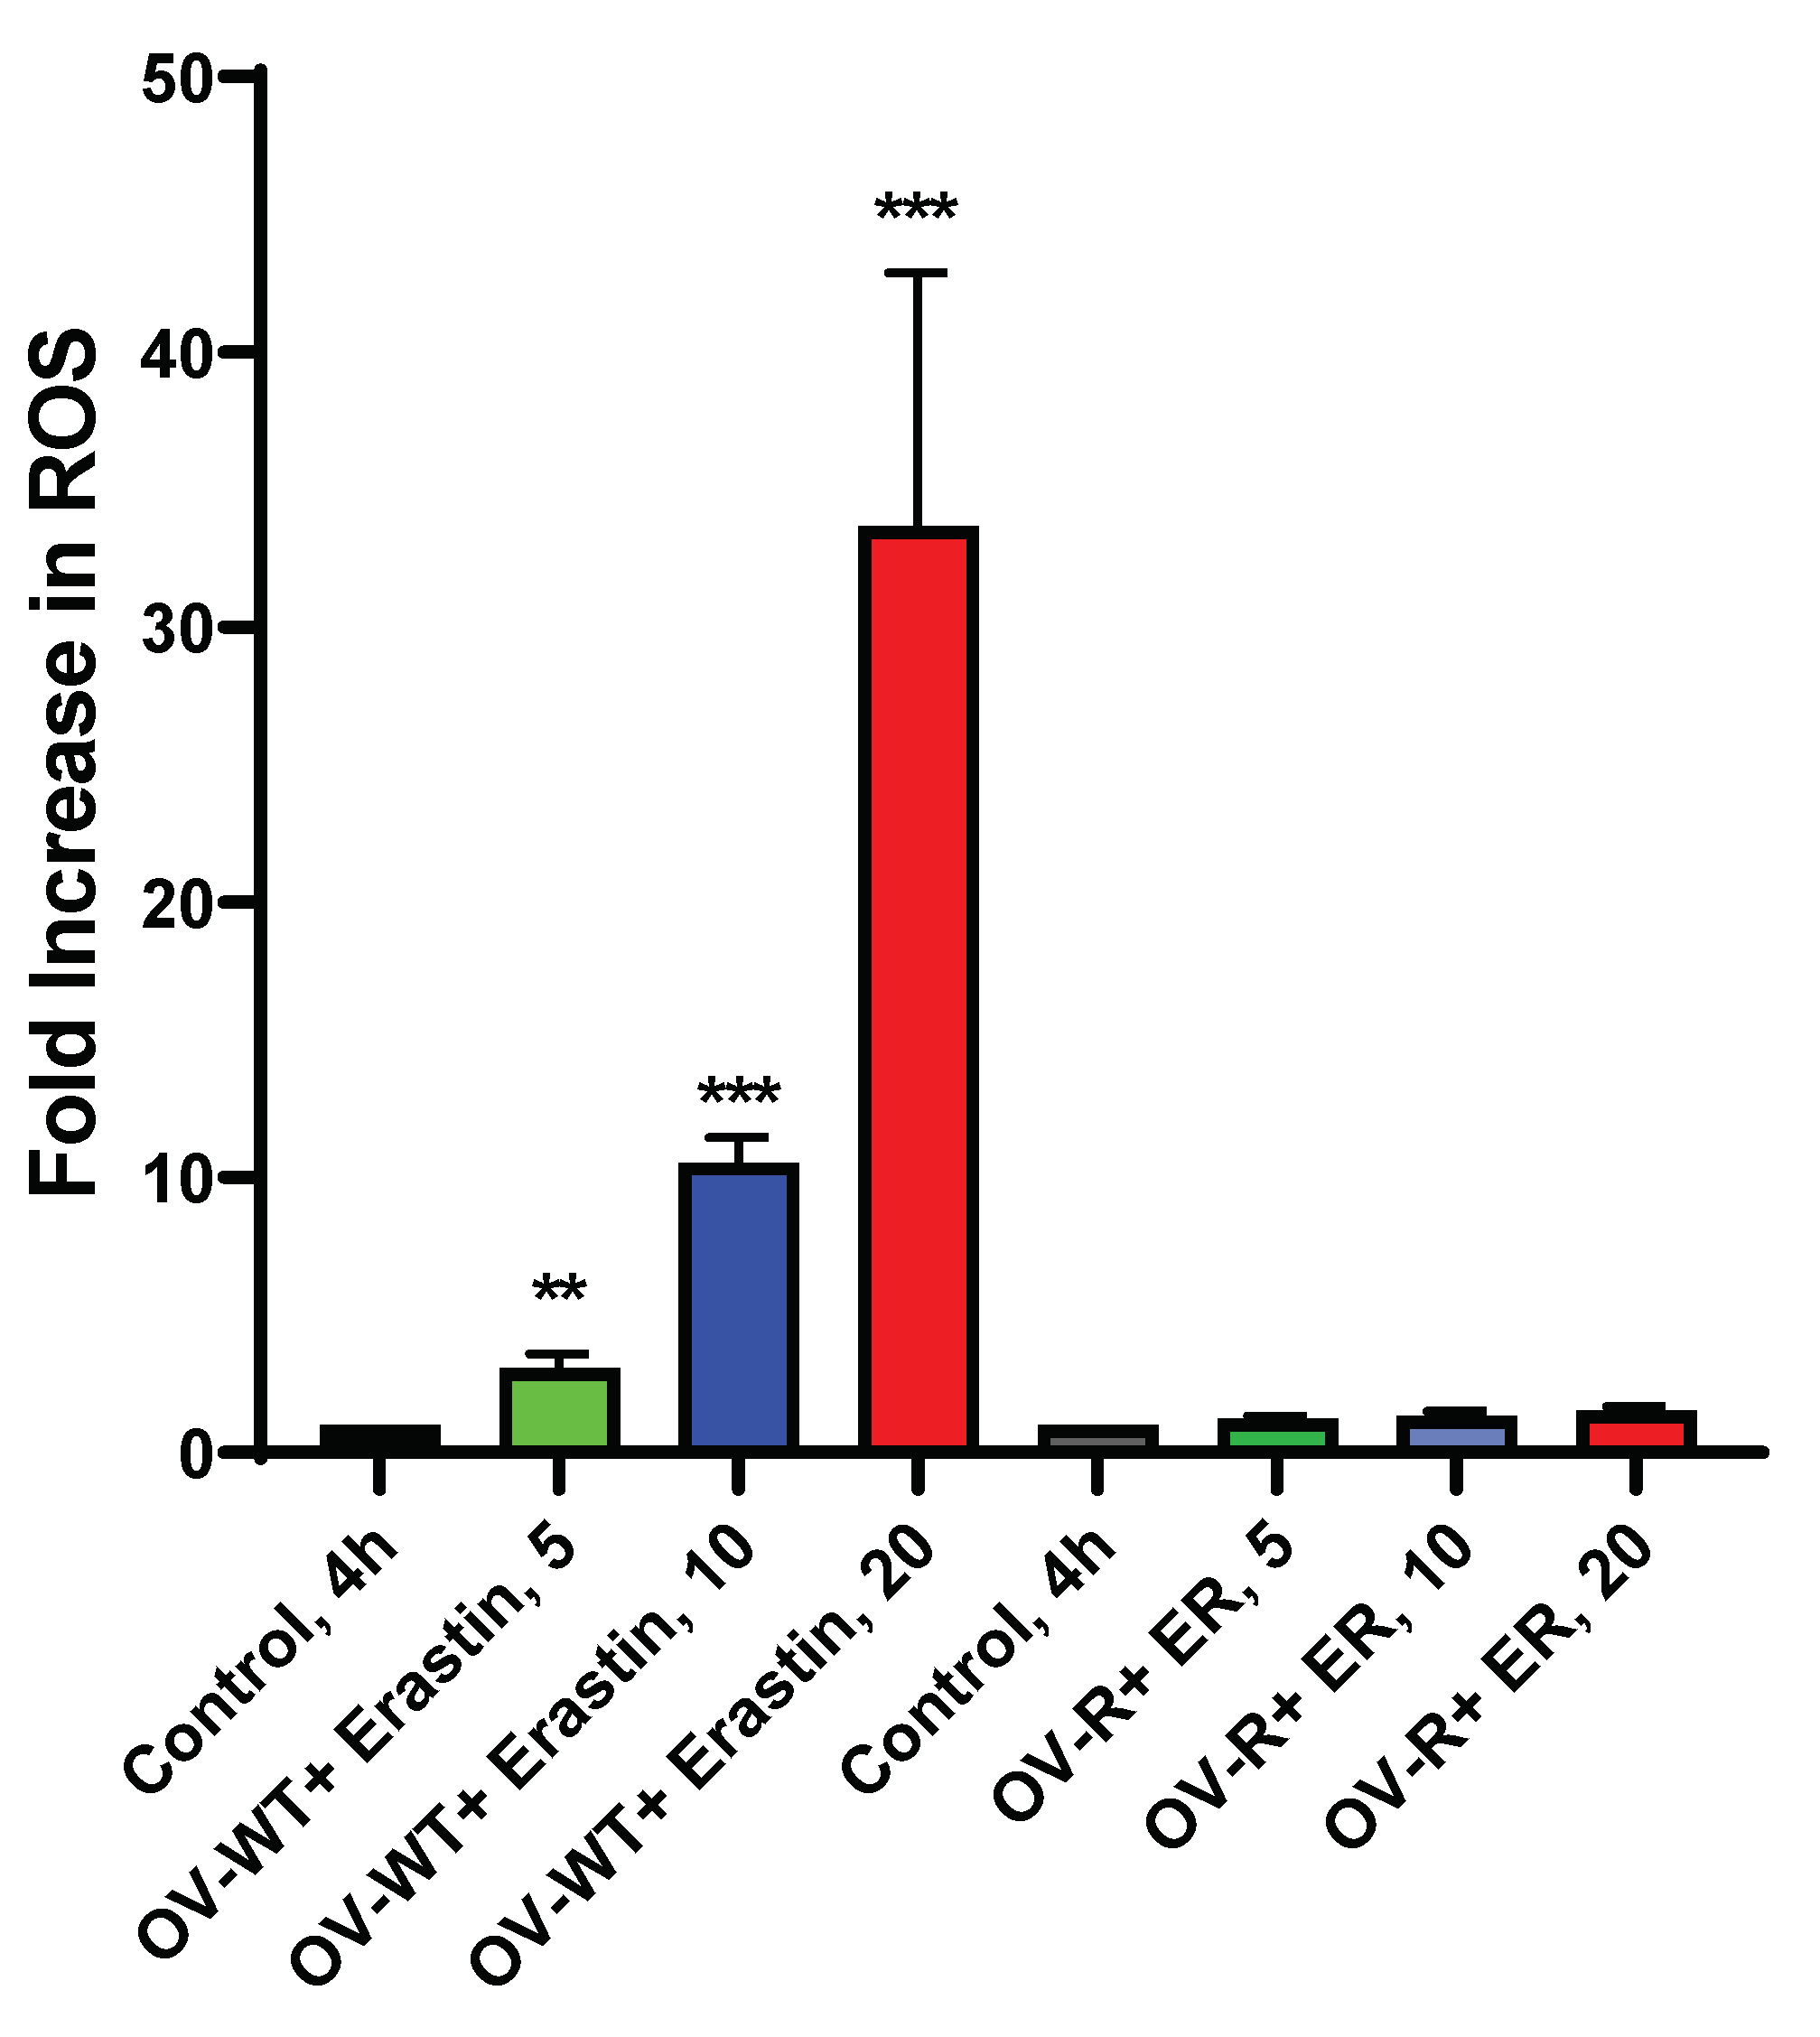
3.5. ROS Formation by ER in OVCAR-8 and NIH/ADR-RES Cells
3.6. ER Induces Lipid Peroxidation in OVCAR-8 and NCI/ADR-RES Ovarian Cells
3.7. RSL3 Enhances ER-Induced Lipid Peroxidation in OVCAR-8 and NIH/ADR-RES Cells
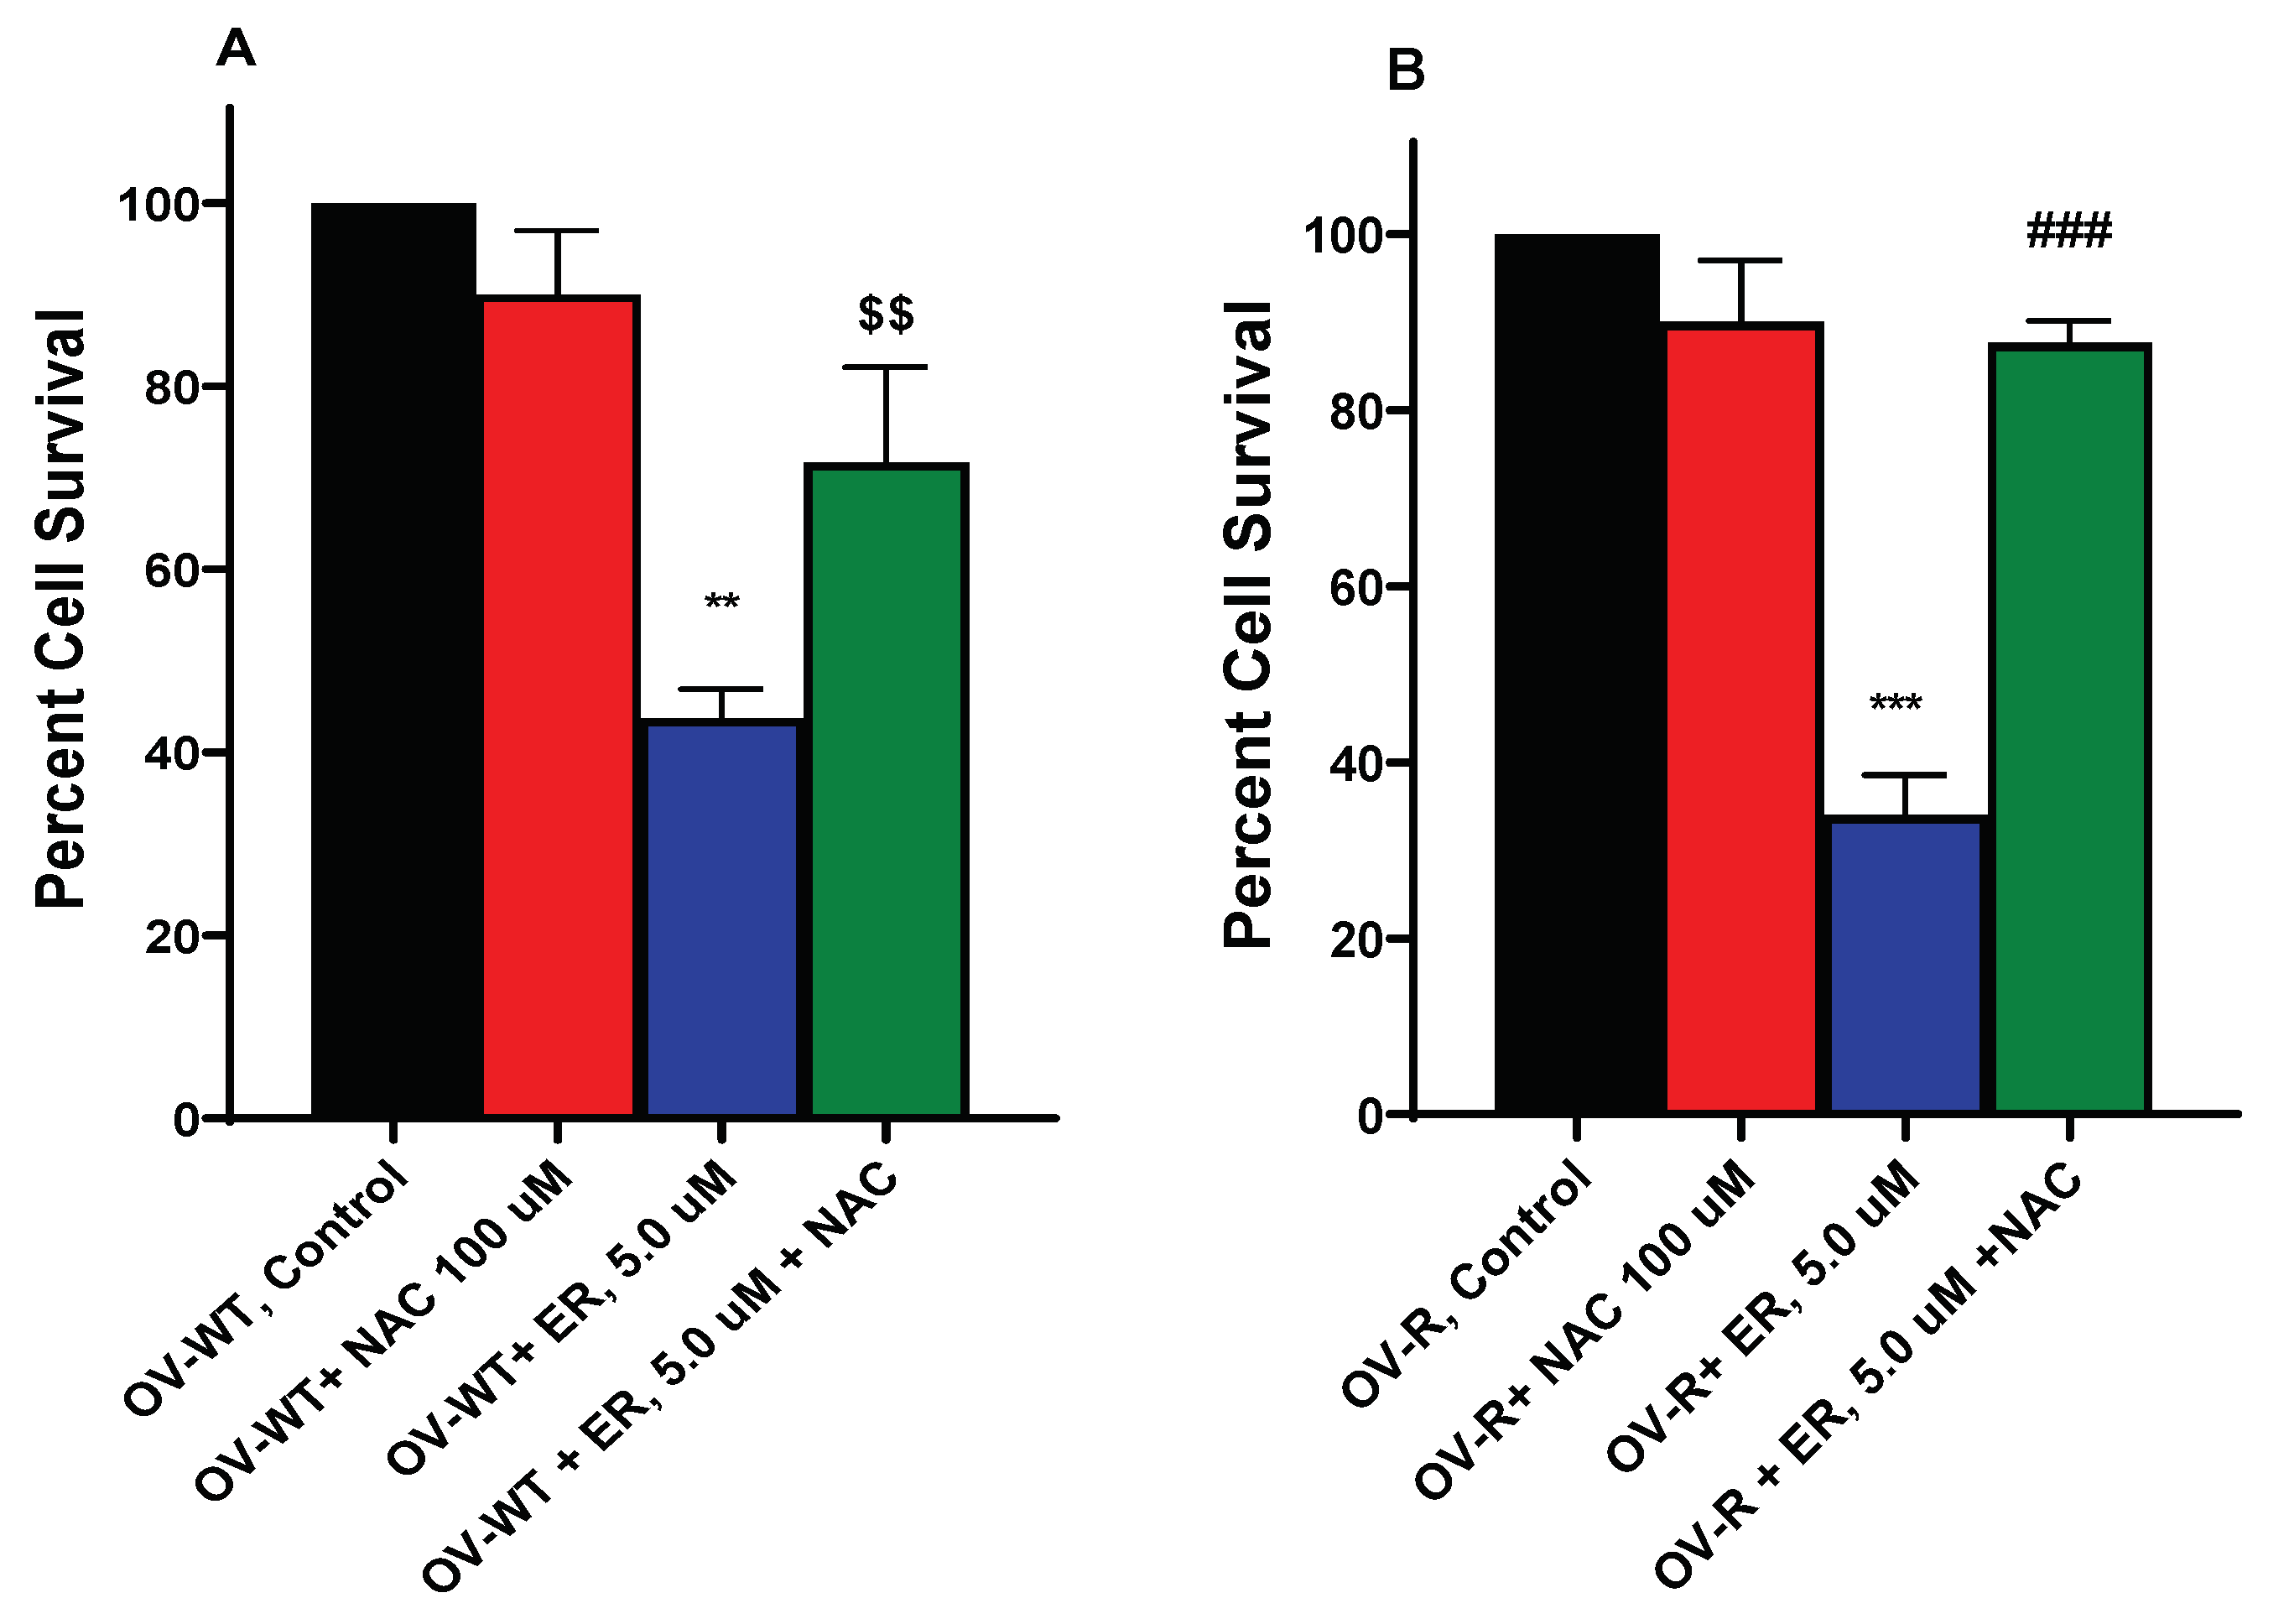
3.8. N-Acetyl Cysteine (NAC) Attenuates ER Cytotoxicity
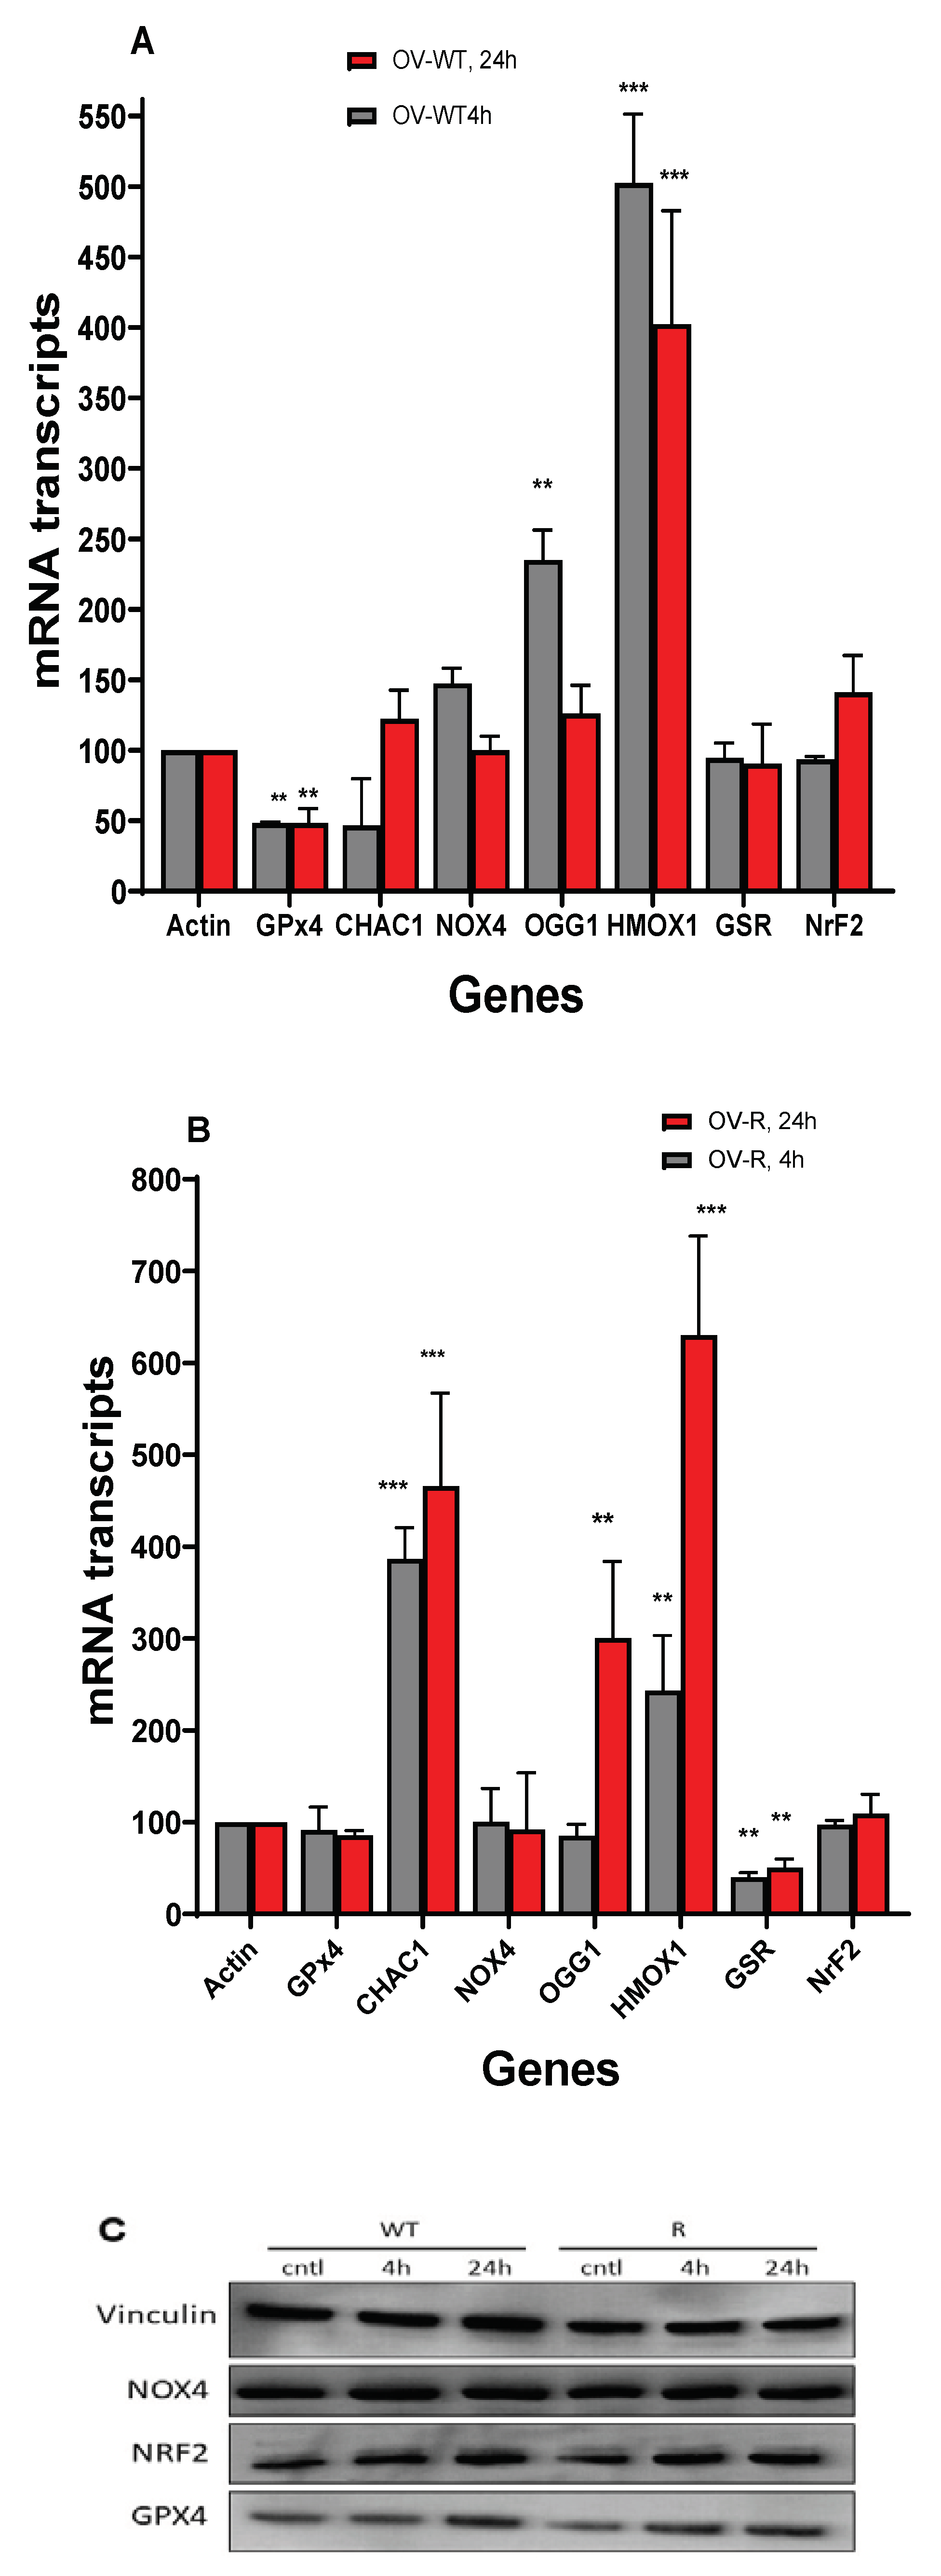
3.9. RT-PCR Studies in OVCAR-8 and NCI/ADR-RES Cells
3.10. Western Blot in OVCAR-8 and NCI/ADR-RES Cells
4. Discussion
5. Conclusions
Author Contributions
Funding
Acknowledgments
Conflicts of Interest
References
- Kossai, M.; Leary, A.; Scoazec, J.Y.; Genestie, C. Ovarian Cancer: A Heterogeneous Disease. Pathobiology 2018, 85, 41–49. [Google Scholar] [CrossRef] [PubMed]
- Parmar, M.K.; Ledermann, J.A.; Colombo, N.; du Bois, A.; Delaloye, J.F.; Kristensen, G.B.; Wheeler, S.; Swart, A.M.; Qian, W.; Torri, V.; et al. Paclitaxel plus platinum-based chemotherapy versus conventional platinum-based chemotherapy in women with relapsed ovarian cancer: the ICON4/AGO-OVAR-2.2 trial. Lancet 2003, 361, 2099–2106. [Google Scholar] [CrossRef]
- Zou, Y.; Palte, M.J.; Deik, A.A.; Li, H.; Eaton, J.K.; Wang, W.; Tseng, Y.Y.; Deasy, R.; Kost-Alimova, M.; Dancik, V.; et al. A GPX4-dependent cancer cell state underlies the clear-cell morphology and confers sensitivity to ferroptosis. Nat Commun 2019, 10, 1617. [Google Scholar] [CrossRef] [PubMed]
- Zhao, Y.; Li, Y.; Zhang, R.; Wang, F.; Wang, T.; Jiao, Y. The Role of Erastin in Ferroptosis and Its Prospects in Cancer Therapy. Onco Targets Ther 2020, 13, 5429–5441. [Google Scholar] [CrossRef]
- Dixon, S.J.; Lemberg, K.M.; Lamprecht, M.R.; Skouta, R.; Zaitsev, E.M.; Gleason, C.E.; Patel, D.N.; Bauer, A.J.; Cantley, A.M.; Yang, W.S.; et al. Ferroptosis: an iron-dependent form of nonapoptotic cell death. Cell 2012, 149, 1060–1072. [Google Scholar] [CrossRef] [PubMed]
- Dixon, S.J.; Patel, D.N.; Welsch, M.; Skouta, R.; Lee, E.D.; Hayano, M.; Thomas, A.G.; Gleason, C.E.; Tatonetti, N.P.; Slusher, B.S.; et al. Pharmacological inhibition of cystine-glutamate exchange induces endoplasmic reticulum stress and ferroptosis. Elife 2014, 3, e02523. [Google Scholar] [CrossRef]
- Yang, W.S.; Stockwell, B.R. Ferroptosis: Death by Lipid Peroxidation. Trends Cell Biol 2016, 26, 165–176. [Google Scholar] [CrossRef]
- Gaschler, M.M.; Stockwell, B.R. Lipid peroxidation in cell death. Biochem Biophys Res Commun 2017, 482, 419–425. [Google Scholar] [CrossRef]
- Yagoda, N.; von Rechenberg, M.; Zaganjor, E.; Bauer, A.J.; Yang, W.S.; Fridman, D.J.; Wolpaw, A.J.; Smukste, I.; Peltier, J.M.; Boniface, J.J.; et al. RAS-RAF-MEK-dependent oxidative cell death involving voltage-dependent anion channels. Nature 2007, 447, 864–868. [Google Scholar] [CrossRef]
- Jiang, L.; Kon, N.; Li, T.; Wang, S.J.; Su, T.; Hibshoosh, H.; Baer, R.; Gu, W. Ferroptosis as a p53-mediated activity during tumour suppression. Nature 2015, 520, 57–62. [Google Scholar] [CrossRef]
- Kang, R.; Kroemer, G.; Tang, D. The tumor suppressor protein p53 and the ferroptosis network. Free Radic Biol Med 2019, 133, 162–168. [Google Scholar] [CrossRef] [PubMed]
- Shoshan-Barmatz, V.; Krelin, Y.; Shteinfer-Kuzmine, A.; Arif, T. Voltage-Dependent Anion Channel 1 As an Emerging Drug Target for Novel Anti-Cancer Therapeutics. Front Oncol 2017, 7, 154. [Google Scholar] [CrossRef] [PubMed]
- Yu, Y.; Xie, Y.; Cao, L.; Yang, L.; Yang, M.; Lotze, M.T.; Zeh, H.J.; Kang, R.; Tang, D. The ferroptosis inducer erastin enhances sensitivity of acute myeloid leukemia cells to chemotherapeutic agents. Mol Cell Oncol 2015, 2, e1054549. [Google Scholar] [CrossRef]
- Cheng, Q.; Bao, L.; Li, M.; Chang, K.; Yi, X. Erastin synergizes with cisplatin via ferroptosis to inhibit ovarian cancer growth in vitro and in vivo. J Obstet Gynaecol Res 2021, 47, 2481–2491. [Google Scholar] [CrossRef]
- Batist, G.; Tulpule, A.; Sinha, B.K.; Katki, A.G.; Myers, C.E.; Cowan, K.H. Overexpression of a novel anionic glutathione transferase in multidrug-resistant human breast cancer cells. J Biol Chem 1986, 261, 15544–15549. [Google Scholar] [CrossRef] [PubMed]
- Cowan, K.H.; Batist, G.; Tulpule, A.; Sinha, B.K.; Myers, C.E. Similar biochemical changes associated with multidrug resistance in human breast cancer cells and carcinogen-induced resistance to xenobiotics in rats. Proc Natl Acad Sci U S A 1986, 83, 9328–9332. [Google Scholar] [CrossRef]
- Sinha, B.K. Free radicals in anticancer drug pharmacology. Chemico-biological interactions 1989, 69, 293–317. [Google Scholar] [CrossRef] [PubMed]
- Sinha, B.K.; Mimnaugh, E.G.; Rajagopalan, S.; Myers, C.E. Adriamycin activation and oxygen free radical formation in human breast tumor cells: protective role of glutathione peroxidase in adriamycin resistance. Cancer research 1989, 49, 3844–3848. [Google Scholar]
- Sinha, B.K.; Tokar, E.J.; Bortner, C.D. Molecular Mechanisms of Cytotoxicity of NCX4040, the Non-Steroidal Anti-Inflammatory NO-Donor, in Human Ovarian Cancer Cells. Int J Mol Sci 2022, 23. [Google Scholar] [CrossRef]
- Mimnaugh, E.G.; Trush, M.A.; Gram, T.E. Stimulation by adriamycin of rat heart and liver microsomal NADPH-dependent lipid peroxidation. Biochemical pharmacology 1981, 30, 2797–2804. [Google Scholar] [CrossRef]
- Mimnaugh, E.G.; Kennedy, K.A.; Trush, M.A.; Sinha, B.K. Adriamycin-enhanced membrane lipid peroxidation in isolated rat nuclei. Cancer research 1985, 45, 3296–3304. [Google Scholar]
- Zhou, H.H.; Chen, X.; Cai, L.Y.; Nan, X.W.; Chen, J.H.; Chen, X.X.; Yang, Y.; Xing, Z.H.; Wei, M.N.; Li, Y.; et al. Erastin Reverses ABCB1-Mediated Docetaxel Resistance in Ovarian Cancer. Front Oncol 2019, 9, 1398. [Google Scholar] [CrossRef]
- Miotto, G.; Rossetto, M.; Di Paolo, M.L.; Orian, L.; Venerando, R.; Roveri, A.; Vuckovic, A.M.; Bosello Travain, V.; Zaccarin, M.; Zennaro, L.; et al. Insight into the mechanism of ferroptosis inhibition by ferrostatin-1. Redox Biol 2020, 28, 101328. [Google Scholar] [CrossRef]
- Liu, P.; Feng, Y.; Li, H.; Chen, X.; Wang, G.; Xu, S.; Li, Y.; Zhao, L. Ferrostatin-1 alleviates lipopolysaccharide-induced acute lung injury via inhibiting ferroptosis. Cell Mol Biol Lett 2020, 25, 10. [Google Scholar] [CrossRef] [PubMed]
- Chu, J.; Liu, C.X.; Song, R.; Li, Q.L. Ferrostatin-1 protects HT-22 cells from oxidative toxicity. Neural Regen Res 2020, 15, 528–536. [Google Scholar] [CrossRef] [PubMed]
- Sui, X.; Zhang, R.; Liu, S.; Duan, T.; Zhai, L.; Zhang, M.; Han, X.; Xiang, Y.; Huang, X.; Lin, H.; et al. RSL3 Drives Ferroptosis Through GPX4 Inactivation and ROS Production in Colorectal Cancer. Front Pharmacol 2018, 9, 1371. [Google Scholar] [CrossRef] [PubMed]
- Shintoku, R.; Takigawa, Y.; Yamada, K.; Kubota, C.; Yoshimoto, Y.; Takeuchi, T.; Koshiishi, I.; Torii, S. Lipoxygenase-mediated generation of lipid peroxides enhances ferroptosis induced by erastin and RSL3. Cancer Sci 2017, 108, 2187–2194. [Google Scholar] [CrossRef] [PubMed]
- Vermes, I.; Haanen, C.; Steffens-Nakken, H.; Reutelingsperger, C. A novel assay for apoptosis. Flow cytometric detection of phosphatidylserine expression on early apoptotic cells using fluorescein labelled Annexin V. J Immunol Methods 1995, 184, 39–51. [Google Scholar] [CrossRef] [PubMed]
- Sekiya, M.; Funahashi, H.; Tsukamura, K.; Imai, T.; Hayakawa, A.; Kiuchi, T.; Nakao, A. Intracellular signaling in the induction of apoptosis in a human breast cancer cell line by water extract of Mekabu. Int J Clin Oncol 2005, 10, 122–126. [Google Scholar] [CrossRef]
- Halasi, M.; Wang, M.; Chavan, T.S.; Gaponenko, V.; Hay, N.; Gartel, A.L. ROS inhibitor N-acetyl-L-cysteine antagonizes the activity of proteasome inhibitors. The Biochemical journal 2013, 454, 201–208. [Google Scholar] [CrossRef]
- Zhang, Q.; Yi, H.; Yao, H.; Lu, L.; He, G.; Wu, M.; Zheng, C.; Li, Y.; Chen, S.; Li, L.; et al. Artemisinin Derivatives Inhibit Non-small Cell Lung Cancer Cells Through Induction of ROS-dependent Apoptosis/Ferroptosis. J Cancer 2021, 12, 4075–4085. [Google Scholar] [CrossRef]
- Liu, Y.; Liang, Y.; Zheng, T.; Yang, G.; Zhang, X.; Sun, Z.; Shi, C.; Zhao, S. Inhibition of heme oxygenase-1 enhances anti-cancer effects of arsenic trioxide on glioma cells. J Neurooncol 2011, 104, 449–458. [Google Scholar] [CrossRef] [PubMed]
- Xie, J.; He, X.; Fang, H.; Liao, S.; Liu, Y.; Tian, L.; Niu, J. Identification of heme oxygenase-1 from golden pompano (Trachinotus ovatus) and response of Nrf2/HO-1 signaling pathway to copper-induced oxidative stress. Chemosphere 2020, 253, 126654. [Google Scholar] [CrossRef] [PubMed]
- Chen, M.S.; Wang, S.F.; Hsu, C.Y.; Yin, P.H.; Yeh, T.S.; Lee, H.C.; Tseng, L.M. CHAC1 degradation of glutathione enhances cystine-starvation-induced necroptosis and ferroptosis in human triple negative breast cancer cells via the GCN2-eIF2alpha-ATF4 pathway. Oncotarget 2017, 8, 114588–114602. [Google Scholar] [CrossRef] [PubMed]
- Wang, N.; Zeng, G.Z.; Yin, J.L.; Bian, Z.X. Artesunate activates the ATF4-CHOP-CHAC1 pathway and affects ferroptosis in Burkitt's Lymphoma. Biochem Biophys Res Commun 2019, 519, 533–539. [Google Scholar] [CrossRef] [PubMed]
- Xiao, R.; Wang, S.; Guo, J.; Liu, S.; Ding, A.; Wang, G.; Li, W.; Zhang, Y.; Bian, X.; Zhao, S.; et al. Ferroptosis-related gene NOX4, CHAC1 and HIF1A are valid biomarkers for stomach adenocarcinoma. J Cell Mol Med 2022, 26, 1183–1193. [Google Scholar] [CrossRef]
- Yang, W.S.; SriRamaratnam, R.; Welsch, M.E.; Shimada, K.; Skouta, R.; Viswanathan, V.S.; Cheah, J.H.; Clemons, P.A.; Shamji, A.F.; Clish, C.B.; et al. Regulation of ferroptotic cancer cell death by GPX4. Cell 2014, 156, 317–331. [Google Scholar] [CrossRef] [PubMed]
- Ma, Q. Role of nrf2 in oxidative stress and toxicity. Annu Rev Pharmacol Toxicol 2013, 53, 401–426. [Google Scholar] [CrossRef]
- Tonelli, C.; Chio, I.I.C.; Tuveson, D.A. Transcriptional Regulation by Nrf2. Antioxid Redox Signal 2018, 29, 1727–1745. [Google Scholar] [CrossRef]
- Sinha, B.K.; Bortner, C.D.; Jarmusch, A.K.; Tokar, E.J.; Murphy, C.; Wu, X.; Winter, H.; Cannon, R.E. Ferroptosis-Mediated Cell Death Induced by NCX4040, The Non-Steroidal Nitric Oxide Donor, in Human Colorectal Cancer Cells: Implications in Therapy. Cells 2023, 12. [Google Scholar] [CrossRef]
- Barretina, J.; Caponigro, G.; Stransky, N.; Venkatesan, K.; Margolin, A.A.; Kim, S.; Wilson, C.J.; Lehar, J.; Kryukov, G.V.; Sonkin, D.; et al. The Cancer Cell Line Encyclopedia enables predictive modelling of anticancer drug sensitivity. Nature 2012, 483, 603–607. [Google Scholar] [CrossRef]
- Stewart, M.L.; Tamayo, P.; Wilson, A.J.; Wang, S.; Chang, Y.M.; Kim, J.W.; Khabele, D.; Shamji, A.F.; Schreiber, S.L. KRAS Genomic Status Predicts the Sensitivity of Ovarian Cancer Cells to Decitabine. Cancer research 2015, 75, 2897–2906. [Google Scholar] [CrossRef]
- De Feudis, P.; Debernardis, D.; Beccaglia, P.; Valenti, M.; Graniela Sire, E.; Arzani, D.; Stanzione, S.; Parodi, S.; D'Incalci, M.; Russo, P.; et al. DDP-induced cytotoxicity is not influenced by p53 in nine human ovarian cancer cell lines with different p53 status. Br J Cancer 1997, 76, 474–479. [Google Scholar] [CrossRef]
- Ogretmen, B.; Safa, A.R. Expression of the mutated p53 tumor suppressor protein and its molecular and biochemical characterization in multidrug resistant MCF-7/Adr human breast cancer cells. Oncogene 1997, 14, 499–506. [Google Scholar] [CrossRef]
- Frye, W.J.E.; Huff, L.M.; Gonzalez Dalmasy, J.M.; Salazar, P.; Carter, R.M.; Gensler, R.T.; Esposito, D.; Robey, R.W.; Ambudkar, S.V.; Gottesman, M.M. The multidrug resistance transporter P-glycoprotein confers resistance to ferroptosis inducers. Cancer Drug Resist 2023, 6, 468–480. [Google Scholar] [CrossRef] [PubMed]
- Wang, H.; Wang, P.; Zhu, B.T. Mechanism of Erastin-Induced Ferroptosis in MDA-MB-231 Human Breast Cancer Cells: Evidence for a Critical Role of Protein Disulfide Isomerase. Mol Cell Biol 2022, 42, e0052221. [Google Scholar] [CrossRef]
- Hou, M.J.; Wang, P.; Zhu, B.T. Biochemical mechanism of erastin-induced ferroptotic cell death in neuronal cells. Acta Biochim Biophys Sin (Shanghai) 2023, 55, 853–865. [Google Scholar] [CrossRef]
- Kumar, A.; Ehrenshaft, M.; Tokar, E.J.; Mason, R.P.; Sinha, B.K. Nitric oxide inhibits topoisomerase II activity and induces resistance to topoisomerase II-poisons in human tumor cells. Biochimica et biophysica acta 2016, 1860, 1519–1527. [Google Scholar] [CrossRef] [PubMed]
- Sinha, B.K.; Bortner, C.D.; Mason, R.P.; Cannon, R.E. Nitric oxide reverses drug resistance by inhibiting ATPase activity of p-glycoprotein in human multi-drug resistant cancer cells. Biochimica et biophysica acta. General subjects 2018, 1862, 2806–2814. [Google Scholar] [CrossRef]
- Sinha, B.K.; Perera, L.; Cannon, R.E. NCX-4040, a Unique Nitric Oxide Donor, Induces Reversal of Drug-Resistance in Both ABCB1- and ABCG2-Expressing Multidrug Human Cancer Cells. Cancers (Basel) 2021, 13. [Google Scholar] [CrossRef] [PubMed]
- Crawford, R.R.; Prescott, E.T.; Sylvester, C.F.; Higdon, A.N.; Shan, J.; Kilberg, M.S.; Mungrue, I.N. Human CHAC1 Protein Degrades Glutathione, and mRNA Induction Is Regulated by the Transcription Factors ATF4 and ATF3 and a Bipartite ATF/CRE Regulatory Element. J Biol Chem 2015, 290, 15878–15891. [Google Scholar] [CrossRef] [PubMed]

Disclaimer/Publisher’s Note: The statements, opinions and data contained in all publications are solely those of the individual author(s) and contributor(s) and not of MDPI and/or the editor(s). MDPI and/or the editor(s) disclaim responsibility for any injury to people or property resulting from any ideas, methods, instructions or products referred to in the content. |
© 2024 by the authors. Licensee MDPI, Basel, Switzerland. This article is an open access article distributed under the terms and conditions of the Creative Commons Attribution (CC BY) license (http://creativecommons.org/licenses/by/4.0/).


