Submitted:
28 February 2024
Posted:
29 February 2024
You are already at the latest version
Abstract
Keywords:
1. Introduction
2. Materials and Methods
2.1. Location and Geologic Setting
2.2. Standardized, Integrated Mapping Approach and Data Collection
2.3. Data Analysis
2.4. Definition of Variable Site Factors
3. Results
3.1. Presence/Absence Data of RWA Nests
3.2. Interconnection of Forest Factors and RWA Nests
3.2.1. Tree Species and Age
3.2.2. Herbaceaous Layer
3.2.3. Dead Wood
3.3. Woodpecker Cavities in RWA nests
3.4. GeoBio-Intercations
4. Discussion
4.1. Presence/Absence Data of RWA Nests
4.2. Interconnection of Forest Factors and RWA Nests
4.2.1. Tree Species and Age
4.2.2. Herbaceous Layer
4.2.3. Dead Wood
4.3. Woodpeckers
4.4. GeoBio-Interactions
4.5. Time Intervals for Re-Inventories
5. Conclusions
Author Contributions
Funding
Data Availability Statement
Acknowledgments
Conflicts of Interest
References
- Descombes, P.; Leprieur, F.; Albouy, C.; Heine, C.; Pellissier, L. Spatial imprints of plate tectonics on extant richness of terrestrial vertebrates. J. Biogeography 2017, 44, 1185–1197. [Google Scholar] [CrossRef]
- Valentine J.W., Moores E.M. Plate-tectonic regulation of faunal diversity and seal level: a model. Nature, 1970, 228, 657–659.
- Orazio, C.; Kies, U.; Edwards, D. Handbook for wood mobilization in Europe. Measures for increasing wood supply from sustainably managed forests. Europ Forest Inst 2017, pp. 116, ISBN 978-2-9519296-4-9.
- Bolte, A.; Mansourian, S.; Madsen, P.; Derkyi, M.; Kleine, M.; Stanturf, J. Forest adaptation and restoration under global change. Ann For Sci 2023, 80, 7. [Google Scholar] [CrossRef]
- Waldbericht der Bundesregierung 2021. Bundesministerium für Ernährung und Landwirtschaft (BMEL). Available online: BMEL - Wald in Deutschland - Waldbericht der Bundesregierung 2021.
- Forest ownership, counselling and forest policy. Bayerische Landesanstalt für Wald und Forstwirtschaft. (LWF). Available online: www.lwf.bayern.de/en/221952/index.php (accessed on 31 January 2024).
- Berberich, G.M.; Berberich, M.B.; Gibhardt, M. Red wood Ants (Formica rufa-group) prefer mature pine forests in Variscan granite environments (Hymenoptera: Formicidae). Fragm Entomo 2022, 54, 1–18. [Google Scholar] [CrossRef]
- Ibáñez, I.; Acharya, K.; Juno, E.; Karounos, C.; Lee, B.R.; McCollum, C.; Samuel Schaffer-Morrison, S.; Tourville, J. Forest resilience under global environmental change: Do we have the information we need? A systematic review. PLoS ONE 2019, 14, e0222207. [Google Scholar] [CrossRef]
- Zintl, N.; Reichert, A.; Kölbel, M. Naturschutzkonzept für den Forstbetrieb Waldsassen. Bayerische Staatsforsten AöR, Regensburg, 2020 Naturschutzkonzept. Available online: www.baysf.de (accessed on 26 January 2024).
- Kölbel, M. Naturschutzkonzept der Bayerischen Staatsforsten 2023. Bayerische Staatsforsten AöR, Regensburg, 2023. Available online: www.baysf.de (accessed on 19 January 2024).
- Bauhus, J.; Baber, K.; Müller, J. Dead Wood in Forest Ecosystems. Oxford Bibliographies 2018. [Google Scholar] [CrossRef]
- Frouz, J.; Jilkova, V. The effect of ants on soil properties and processes (Hymenoptera: Formicidae). Myrm. News 2008, 11, 191–199. [Google Scholar]
- Frouz, J.; Rybnicek, M.; Cudlin, P.; Chmelikova, E. Influence of the wood ant Formica polyctena on soil nutrient and the spruce tree growth. J. Appl. Entom. 2008, 132, 281–284. [Google Scholar] [CrossRef]
- Robinson, E.J.H.; Stockan, J.A.; Iason, G.R. Wood Ants and their Interaction with Other Organisms. In Wood Ant Ecology and Conservation; Stockan, J.A., Robinson, E.J.H., Eds.; Cambridge University Press: Cambridge, UK, 2016; pp. 177–206. [Google Scholar]
- Berberich, G.M.; Klimetzek, D.; Paraschiv, M.; Stancioiu, P.T.; Grumpe, A. Biogeostatistics confirm: Even a low total number of red wood ant nests provide new information on tectonics in the East Carpathian Orogen (Romania). Ecol. Indic. 2019, 101, 486–500. [Google Scholar] [CrossRef]
- Berberich, G.M; Grumpe, A.; Berberich, M.B.; Klimetzek, D.; Wöhler, C. Are red wood ants (Formica rufa-group) tectonic indicators? A statistical approach. Ecol. Indic. 2016, 6, 968–979. [Google Scholar] [CrossRef]
- Berberich, G.; Klimetzek, D.; Wöhler, C.; Grumpe, A. Statistical Correlation between Red Wood Ant Sites and Tectonically Active Fault Structures. Mitt. Dtsch. Ges. allg. angew. Ent. 2014, 19. [Google Scholar]
- Berberich, G. Identifikation junger gasführender Störungszonen in der West- und Hocheifel mit Hilfe von Bioindikatoren. Ph.D. Thesis, University of Duisburg-Essen, Essen, Germany, 2010. [Google Scholar]
- Del Toro, I.; Berberich, G.M.; Ribbons, R.R.; Berberich, M.B.; Sanders, N.J.; Ellison, A.M. Nests of red wood ants (Formica rufa-group) are positively associated with tectonic faults: a double-blind test. PeerJ 2017, 5, e3903. [Google Scholar] [CrossRef]
- Berberich, G.M.; Berberich, M.B. Comparison of Geogases in Two Cenozoic Sedimentary Basins. Geosciences 2022, 12, 388. [Google Scholar] [CrossRef]
- Berberich, G.M.; Berberich, M.B.; Ellison, A.M.; Wöhler, C. Degassing Rhythms and Fluctuations of Geogenic Gases in A Red Wood-Ant Nest and in Soil in The Neuwied Basin (East Eifel Volcanic Field, Germany). Insects 2018, 9, 135. [Google Scholar] [CrossRef]
- Berberich, G.M.; Ellison, A.M.; Berberich, M.B.; Grumpe, A.; Becker, A.; Wöhler, C. Can a red wood-ant nest be a trap for fault-related CH4 micro-seepage? A case study from continuous short-term in-situ sampling. Animals 2018, 8, 46. [Google Scholar] [CrossRef]
- Berberich, G.M.; Sattler, T.; Klimetzek, D.; Benk, S.A.; Berberich, M.B.; Polag, D.; Schöler, H.F.; Atlas, E. Halogenation processes linked to red wood ant nests (Formica spp.) and tectonics. J. Atm. Chem. 2016. [Google Scholar] [CrossRef]
- Hallmann, C.A.; Sorg, M.; Jongejans, E.; Siepel, H.; Hofland, N.; Schwan, H.; Stenmans, W.; Müller, A.; Sumser, H.; Hörren, T.; et al. More than 75 percent decline over 27 years in total flying insect biomass in protected areas. PLoS ONE 2017, 12, e0185809. [Google Scholar] [CrossRef]
- Wagner, D.L.; Grames, E.M.; Forister, M.R.; Berenbaum, M.R.; Stopakd, D. Insect decline in the Anthropocene: Death by a thousand cuts. Proc. Natn. Acad. Sci. U.S.A. 2021, 118, e2023989118. [Google Scholar] [CrossRef]
- Crist, T.O. Biodiversity, species interactions and functional role of ants (Hymenoptera: Formicidae) in fragmented landscapes: a review. Myrmec. News 2009, 12, 3–13. [Google Scholar]
- Çamlitepe, Y.; Aksoy, V. Distribution and conservation status of the European red wood ant species Formica pratensis. J. Entomol. Res. Soc. 2019, 21, 199–211. [Google Scholar]
- Stoschek, N.; Roch, T. Zentrale Erfassung von Waldameisen im Freistaat Sachsen. AFZ-Der Wald 2006, 61, 186–188. [Google Scholar]
- Wilson, P. Wood Ants of Wyre. Wyre Forest Study Group Review 2011, 2011, 17–22. [Google Scholar]
- BNatSchG. Gesetz über Naturschutz und Landschaftspflege (Bundesnaturschutzgesetz - BNatSchG) vom 29. Juli 2009 (BGBl. I S.2542 / FNA 791- 9).
- BArtSchV. Verordnung zum Schutz wild lebender Tier- und Pflanzenarten. Bundesartenschutzverordnung (BArtSchV) vom 16. Februar 2005 (BGBl. I S. 258, 896), die zuletzt durch Artikel 10 des Gesetzes vom 21. Januar 2013 (BGBl. I S. 95) geändert worden ist.
- Berberich, G.M.; Berberich, M.B. A Re-Inventory after 12 Years—Increase in Red Wood Ant Nests and Woodpecker Cavities in Nests in the West Eifel Volcanic Field despite Climatic Changes. Forests 2023, 14, 985. [Google Scholar] [CrossRef]
- Berberich, G.M.; Dormann, C.F.; Klimetzek, D.; Berberich, M.B.; Sanders, N.J.; Ellison, A.M. Detection probabilities for sessile organisms. Ecosphere 2016, 7, e01546. [Google Scholar] [CrossRef]
- AP Insektenschutz, 2019. Aktionsprogramm Insektenschutz der Bundesregierung – Gemeinsam wirksam gegen das Insektensterben. Drucksache 19/13031. 09.09.2019.
- Emmert, U. Emmert U., Horstig G.V., Stettner G. Geologische 0bersichtskarte 1:200 000 (GÜK 200). CC6334 Bayreuth. 1981. Hrsg. Bundesanstalt für Geowissenschaften und Rohstoffe (BGR) in Zusammenarbeit mit den Geologischen Landesämtern der Bundesrepublik Deutschland und benachbarter Staaten. Digitale Version.
- Galadí, E.; Kroemer, E.; Loth, G.: Pürner, T.: Raum, G.; Teipel, U.; Rohrmüller, J. Geological history of the Upper Palatinate Forest – geological setting, rocks, points of interest. 2009. ISBN (Print-Version): 978-3-936385-55-7.
- Glaser, S.; Keim, G.; Loth, G.; Veit, A.; Bassler-Veit, B.; Lagally, U. Geotope in der Oberpfalz. Bayerisches Landesamt für Umwelt (LfU), Augsburg, 2007. ISSN 0945-1765.
- LfU. Geologische Karte 1:25.000 (GK25), Nr. 6039. Mitterteich. Bayerisches Landesamt für Umwelt (LfU), Augsburg, 2013.
- LfU 2015. GeoFachdatenAtlas (BIS-BY). Bayerisches Landesamt für Umwelt (LfU), Augsburg. 2015. Available online: www.bis.bayern.de/bis/initParams.do?role=bis (accessed on 2 March 2015).
- Peterek, A.; Schunk, R. Zitternde Erde – Die Schwarmbeben in Nordwestböhmen. Sonderveröffentlichung Bayerisch-Böhmischer Geopark 2008, 1/2008, Parkstein.
- Peterek, A.; Schunk, R. Geologische Geschichte des Egerrifts. Nachdruck aus Maldaque, Span und Durchkriechstein, Landkreis-Schriftenreihe, 2009, 21, 105–117.
- Lokalbeben in Bayern und angrenzenden Gebieten. Erdbebendienst Bayern. Ludwig-Maximilians-Universität (LMU), München und Bayerisches Landesamt für Umwelt (LfU). Available online: Lokalbeben — Erdbeben in Bayern (erdbeben-in-bayern.de) (accessed on 01.11.2023).
- Local seismic network WEBNET. Institute of Geophysics of the Czech Academy of Science. Available online: Local seismic network WEBNET - Geofyzikální ústav Akademie věd ČR, v.v.i. (cas.cz) (accessed on 01.11.2023).
- Changyong He. 2019. densityplot(x,y,varargin). www.mathworks.com/matlabcentral/fileexchange/65166-densityplot-x-y-varargin), MATLAB Central File Exchange. Retrieved July 16, 2019.
- Mäder, P.; Boho, D.; Rzanny, M.; Seeland, M.; Wittich, H. C.; Deggelmann, A.; Wäldchen, J. The flora incognita app–interactive plant species identification. Methods in Ecology and Evolution. 2021, 12, 1335–1342. [Google Scholar] [CrossRef]
- 10-year forest inventory and management plan. Bayerische Staatsforsten (BSF) A.ö.R., Regensburg, 2019. Database. As of: July 2019. 20 July.
- Heidbach, O.; Rajabi, M.; Reiter, K.; Ziegler, M. W.S.M. Team World Stress Map Database. Release 2016. GFZ Data Services 2016. [CrossRef]
- Keil, P.; Storch, D.; Jetz, W. On the decline of biodiversity due to area loss. Nat. Com. 2015, 6, 8837. [Google Scholar] [CrossRef] [PubMed]
- Keenan, R.J. Climate change impacts and adaptation in forest management: a review. Ann For Scie, 2015, 72, 145–167. [Google Scholar] [CrossRef]
- Balzani, P.; Dekoninck, W.; Feldhaar, H.; Freitag, A.; Frizzi, F.; Frouz, J.; Masoni, A.; Robinson, E.; Sorvari, J.; Santini, G. Challenges and a call to action for protecting European red wood ants. Conserv. Biol. 2022, e13959. [Google Scholar] [CrossRef]
- Die Krabbler sind vom Aussterben bedroht! Ameisenschutzwarte, Landesverband Bayern (ASW Bayern). Available online: https://ameisenfreunde.de (accessed on 24 August 2023).
- Bär, R. Ameisenschutzwarte NRW (ASW NRW), Personal communication, 2022.
- Reimann, H. Zustand eines Waldameisenvorkommens 2010 und 2021. Ameisenschutz aktuell 2021, 35, 4/21, pp.74-78. ISSN 0941-7958.
- Ameisen (Hymenoptera: Formicidae). Rote Liste Zentrum. Available online: www.rote-liste-zentrum.de/de/Ameisen-Hymenoptera-Formicidae-1702.html (accessed on 2 February 2024).
- Social Insects Specialist Group. Formica polyctena. The IUCN Red List of Threatened Species 1996, e.T8644A12924699. [CrossRef]
- Der Wald in Deutschland. Ausgewählte Ergebnisse der dritten Bundeswaldinventur. Bundesministerium für Ernährung und Landwirtschaft (BMEL) 2023. Available online: www.bundeswaldinventur.de. (accessed on 10 February 2023).
- Sondeij, I.; Domisch, T.; Finér, L; Czechowski, W. Wood ants in the Białowieża Forest and factors affecting their distribution. Ann. Zool. Fennici 2018, 55, 103–114. [Google Scholar] [CrossRef]
- Domisch, T.; Finér, L.; Jurgensen, M.F. Red wood ant mound densities in managed boreal forests. Ann. Zool. Fennici 2005, 42, 277–282. [Google Scholar]
- Bauhus, J. Die Anpassung der Wälder an den Klimawandel – eine waldwirtschaftliche Perspektive. Natur und Landschaft 2022, 97, 7. [Google Scholar] [CrossRef]
- Bellassen, V.; Luyssaert, S. Managing forests in uncertain times. Nature 2014, 506, 155. [Google Scholar] [CrossRef]
- Übersichtsbodenkarte von Bayern 1:500.000. EPSG: 31468. Bayerisches Landesamt für Umwelt (LfU). Available online: www.lfu.bayern.de (accessed on 15 May 2019).
- Gibhardt, M. Forester, Forest District Falkenberg, Forest Division Waldsassen, Personal communication, 2023.
- Pröls, M. Forester, Forest District Mitterteich I, Forest Division Waldsassen, Personal communication, 2023.
- The Habitats Directive. EU measures to conserve Europe’s wild flora and fauna European Commission. Council Directive 92 / 43 / EEC of 21 May 1992 on the conservation of natural habitats and of wild fauna and flora. No L 206 / 7. Available online: https://environment.ec.europa.eu/topics/nature-and-biodiversity/habitats-directive_en.
- Ewald, J.; Ssymank, A.; Röhling, M.; Walentowski, H.; Hohnwald, S. Fauna-Flora-Habitat-Richtlinie und klimainduzierte Waldveränderung – ein Widerspruch? Natur und Landschaft, 2022, 97, 7. [Google Scholar] [CrossRef]
- Regierung der Oberpfalz. Managementplan für das FFH-Gebiet 6139-371 „Waldnaabtal zwischen Tirschenreuth und Windischeschenbach“. Fachgrundlagen. Bürgerversion. Regierung der Oberpfalz, Regensburg. 2021. pp 143.
- Zimmerer, V. Erfolgsmelder im Waldnaturschutz. Digitale Ausgabe Bayerisches Landwirtschaftliches Wochenblatt (BLW), 2021, 25-2021. Available online: www.digitalmagazin.de/marken/blw/hauptheft/2021-25/wald/026_erfolgsmelder-im-waldnaturschutz (accessed on 2 February 2024).
- Véle, A.; Frouz, J. Bark Beetle Attacks Reduce Survival of Wood Ant Nests. Forests 2023, 14, 199. [Google Scholar] [CrossRef]
- Hýsek, Š.; Löwe, R.; Turcáni, M. What Happens to Wood after a Tree Is Attacked by a Bark Beetle? Forests 2021, 12, 1163. [Google Scholar] [CrossRef]
- Adlung, K.G. A Critical Evaluation of the European Research on Use of Red Wood Ants (Formica rufa Group) for the Protection of Forests against Harmful Insects. Z f Angew. Entom. 1966, 57, 167–189. [Google Scholar] [CrossRef]
- Sturm, P.; Distler, H. Rote Liste gefährdeter Ameisen (Hymenoptera: Formicidae) Bayerns. BayLfU 2003, 166, 208–212. [Google Scholar]
- Seifert, B. Formica nigricans Emery 1909 - an ecomorph of Formica pratensis Retzius, 1783 (Hymenoptera, Formicidae). Entomol. Fennica, 1992, 2, 217–226. [Google Scholar] [CrossRef]
- Gilliam, F.S. The Ecological Significance of the Herbaceous Layer in Temperate Forest Ecosystems. BioScience 2007, 57, 10. [Google Scholar] [CrossRef]
- Montràs-Janer, T.; Suggitt, A.J.; Fox, R.; Jönsson, M.; Martay, B.; Roy, D.B.; Walker, K.J.; Auffret, A.G. Anthropogenic climate and land-use change drive short- and long-term biodiversity shifts across taxa. nature ecology & evolution, 2024. [Google Scholar] [CrossRef]
- Wetter-Rückblick für Mitterteich und Falkenberg, Bayern, Deutschland. Time and date. Available online: www.timeanddate.de (accessed on 8 February 2024).
- Wang, S.; Knapp, B.O.; Ehlers, S.; Graham, B.; Gao, X.; Timm, S. Forest management effects on downed dead wood at stand and landscape scales in a temperate forest of the central United States. Forest Eco Managem 2021, 482. [Google Scholar] [CrossRef]
- Woodall, C.W.; Monleon, V.J.; Fraver, S.; Russell, M.B.; Hatfield, M.H.; Campbell, J.L.; Domke, G.M. Data Descriptor: The downed and dead wood inventory of forests in the United States. Scientific Data. 2018. www.nature.com/scientificdata.
- Totholzmengen im Wald. Bundesamt für Naturschutz (BfN). Available online: www.bfn.de/daten-und-fakten/totholzmengen-im-wald (accessed on 29 January 2024).
- Totholz: Mehr als nur totes Holz. Bayerische Staatsforsten (BaySF). Available online: www.baysf.de/de/medienraum/pressemitteilungen/nachricht/detail/totholz-mehr-als-nur-totes-holz.html (accessed on 31 January 2024).
- Baur, H.; Koch, J. Ökonomie ist Motor der Ökologie. LWF aktuell, 2006, 55, S. 34-35.
- Müller-Kroehling, S.; Blaschke, M.; Franz, C.; Müller, J.; Binner, V.; Pechacek, P. Biotopbäume und Totholz. Bayerische Landesanstalt für Wald und Forstwirtschaft (LWF), LWF Merkblatt 17, 2019, pp 4.
- Wübbenhorst, J.; Südbeck, P. Woodpeckers as Indicators for Sustainable Forestry? First Results of a study in the EU/LIFE – demonstration areas Lüneburger Heide und Solling. Demonstration of methods to monitor sustainable forestry. 2001. EU/LIFE project 1998 – 2001 (LIFE98ENV/S/000478).
- Froehlich-Schmitt, B. Spechte in der Hördter Rheinaue nach 40 Jahren. 28. Jahrestagung der Fachgruppe Spechte. Ornithol. Anz. 2018, 57.
- Scharfenberg, L.; De Wall, H. Natural gamma radiation of granites in the Oberpfalz (NE Bavaria, Germany) – comparison of aerogeophysical and in situ gammaspectrometric measurements. Geol Blätter Nordost-Bayern, 2016, 66, 205–227. [Google Scholar]
- Iakovlev, I.K.; Novgorodova, T.A.; Tiunov, A.V.; Reznikova, Z.I. Trophic position and seasonal changes in the diet of the red wood ant Formica aquilonia as indicated by stable isotope analysis. Ecol Entom 2017, 42, 263–272. [Google Scholar] [CrossRef]
- Weinlich, F.H.; Bräuer, K.; Kämpf, H.; Strauch, G.; Tesař, J.; Weise, S.M. Gas flux and tectonic structure in the western Eger Rift, Karlovy Vary - Oberpfalz and Oberfranken, Bavaria. Geolines 2003, 15, 181–187. [Google Scholar]
- Heinicke, J.; Woith, H.; Alexandrakis-Zieger, C.; Buske, S.; Käppler, R.; Krentz, O.; Menzel, P. Neogene and Quaternary dikes and related joints as conduits for recent juvenile degassing: case studies from the seismically active region of NW-Bohemia, Czech Republic. Bull Volcan 2023, 85, 38. [Google Scholar] [CrossRef]
- Kemski, J.; Klingel, R., Siehl, A., Neznal, M., Matolin, M. Erarbeitung fachlicher Grundlagen zum Beurteilung der Vergleichbarkeit unterschiedlicher Messmethoden zur Bestimmung der Radonbodenluftkonzentration. Vorhaben 3609S10003. Bd. 2 Sachstandsbericht „Radonmessungen in der Bodenluft. Einflussfaktoren, Messverfahren, Bewertung“. 2012. BfS-RESFOR-63/12-Bd.2. urn:nbn:de:0221-201203237830.
- Klimetzek, D.; Stancioiu, P.T.; Paraschiv, M.; Nita, M.D. Ecological Monitoring with Spy Satellite Images—The Case of Red Wood Ants in Romania. Remote Sens. 2021, 13, 520. [Google Scholar] [CrossRef]
- Robinson, N.A.; Robinson, E.J.H. The population of the red wood ant Formica rufa L. (Hymenoptera: Formicidae) at Gait Barrows National Nature Reserve, Lancashire, England over the 20 year period 1986–2006: nest longevity, reproduction and the effect of management. Br. J. Entomol. Nat. Hist. 2008, 21, 225–241. [Google Scholar]
- Van Buggenum, H.J.M. Presence after three decades of red wood ants (Formica rufa group; Hymenoptera: Formicidae) in forests in an agricultural landscape. Eur. J. Entomol 2022, 119, 85–91. [Google Scholar] [CrossRef]
- Dekoninck, W.; Hendrickx, F.; Grootaert, P.; Maelfait, J.-P. Present conservation status of red wood ants in northwestern Belgium: Worse than previously, but not a lost cause. Eur. J. Entomol. 2010, 107, 209–218. [Google Scholar] [CrossRef]
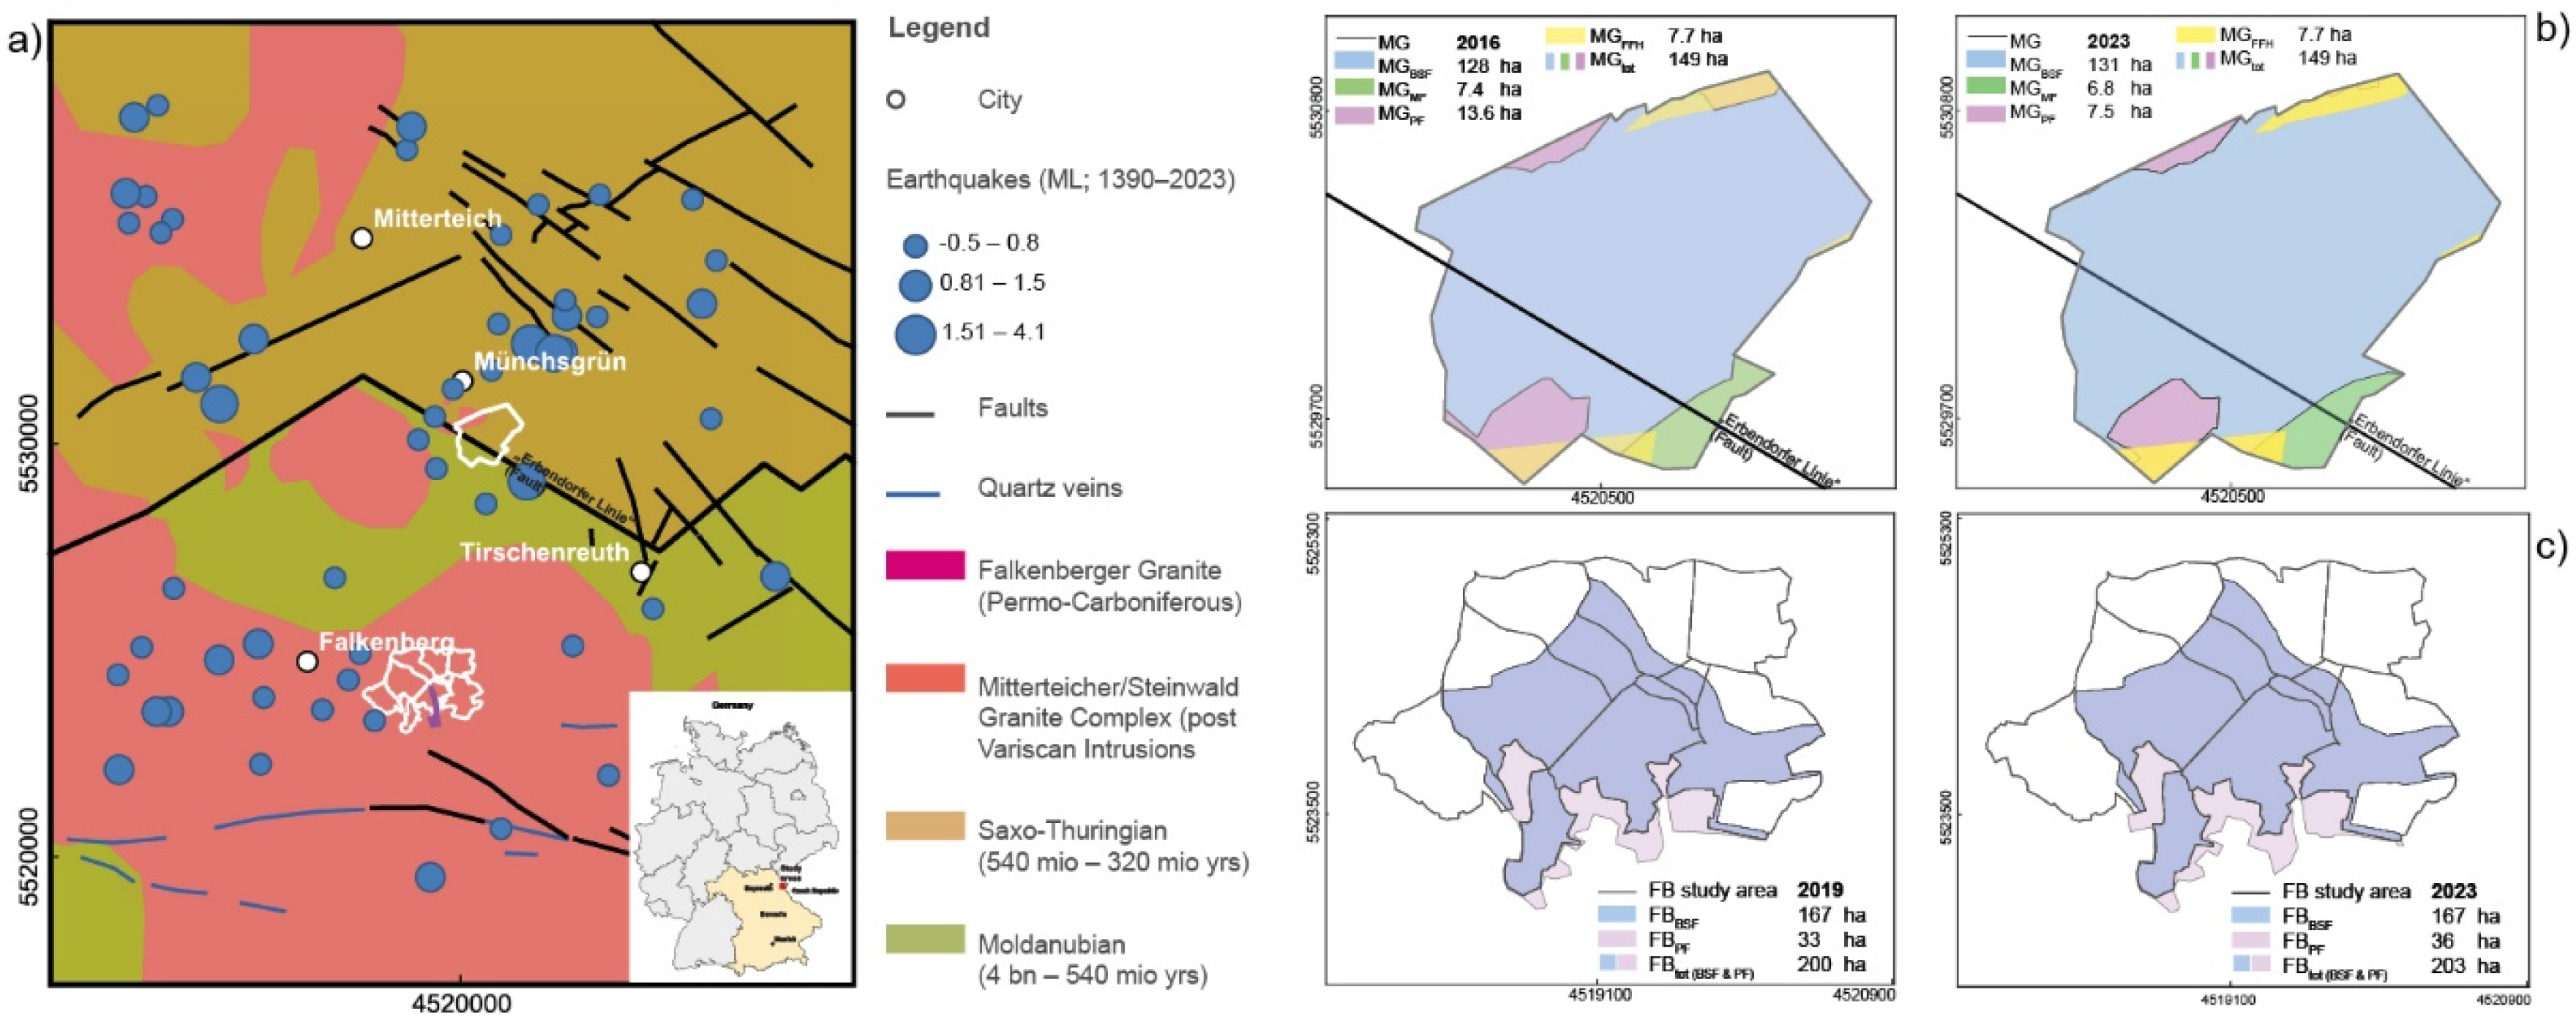

| Year | Study Area | Numbers |
Difference for MG (2016/2023)and FB (2019/2023) |
a) Nest Height (NH) Classes of Active Nests (nact) | b) Nest Diameter (ND) Classes of Active Nests (nact) | ||||||||||||||
|---|---|---|---|---|---|---|---|---|---|---|---|---|---|---|---|---|---|---|---|
| Start-Ups | Short | Medium | Tall | Very Tall | Small | Medium | Large | Very large | Extra-large | ||||||||||
| ntot | nact | nactR | Δ ntot | % | Δ nact | % | Δ nactR% | 0.01–0.10 | 0.11–0.50 | 0.51–1.00 | 1.01–1.50 | 1.51–2.00 | 0.01–0.50 | 0.51–1.00 | 1.01–1.50 | 1.51–2.00 | >2.01 | ||
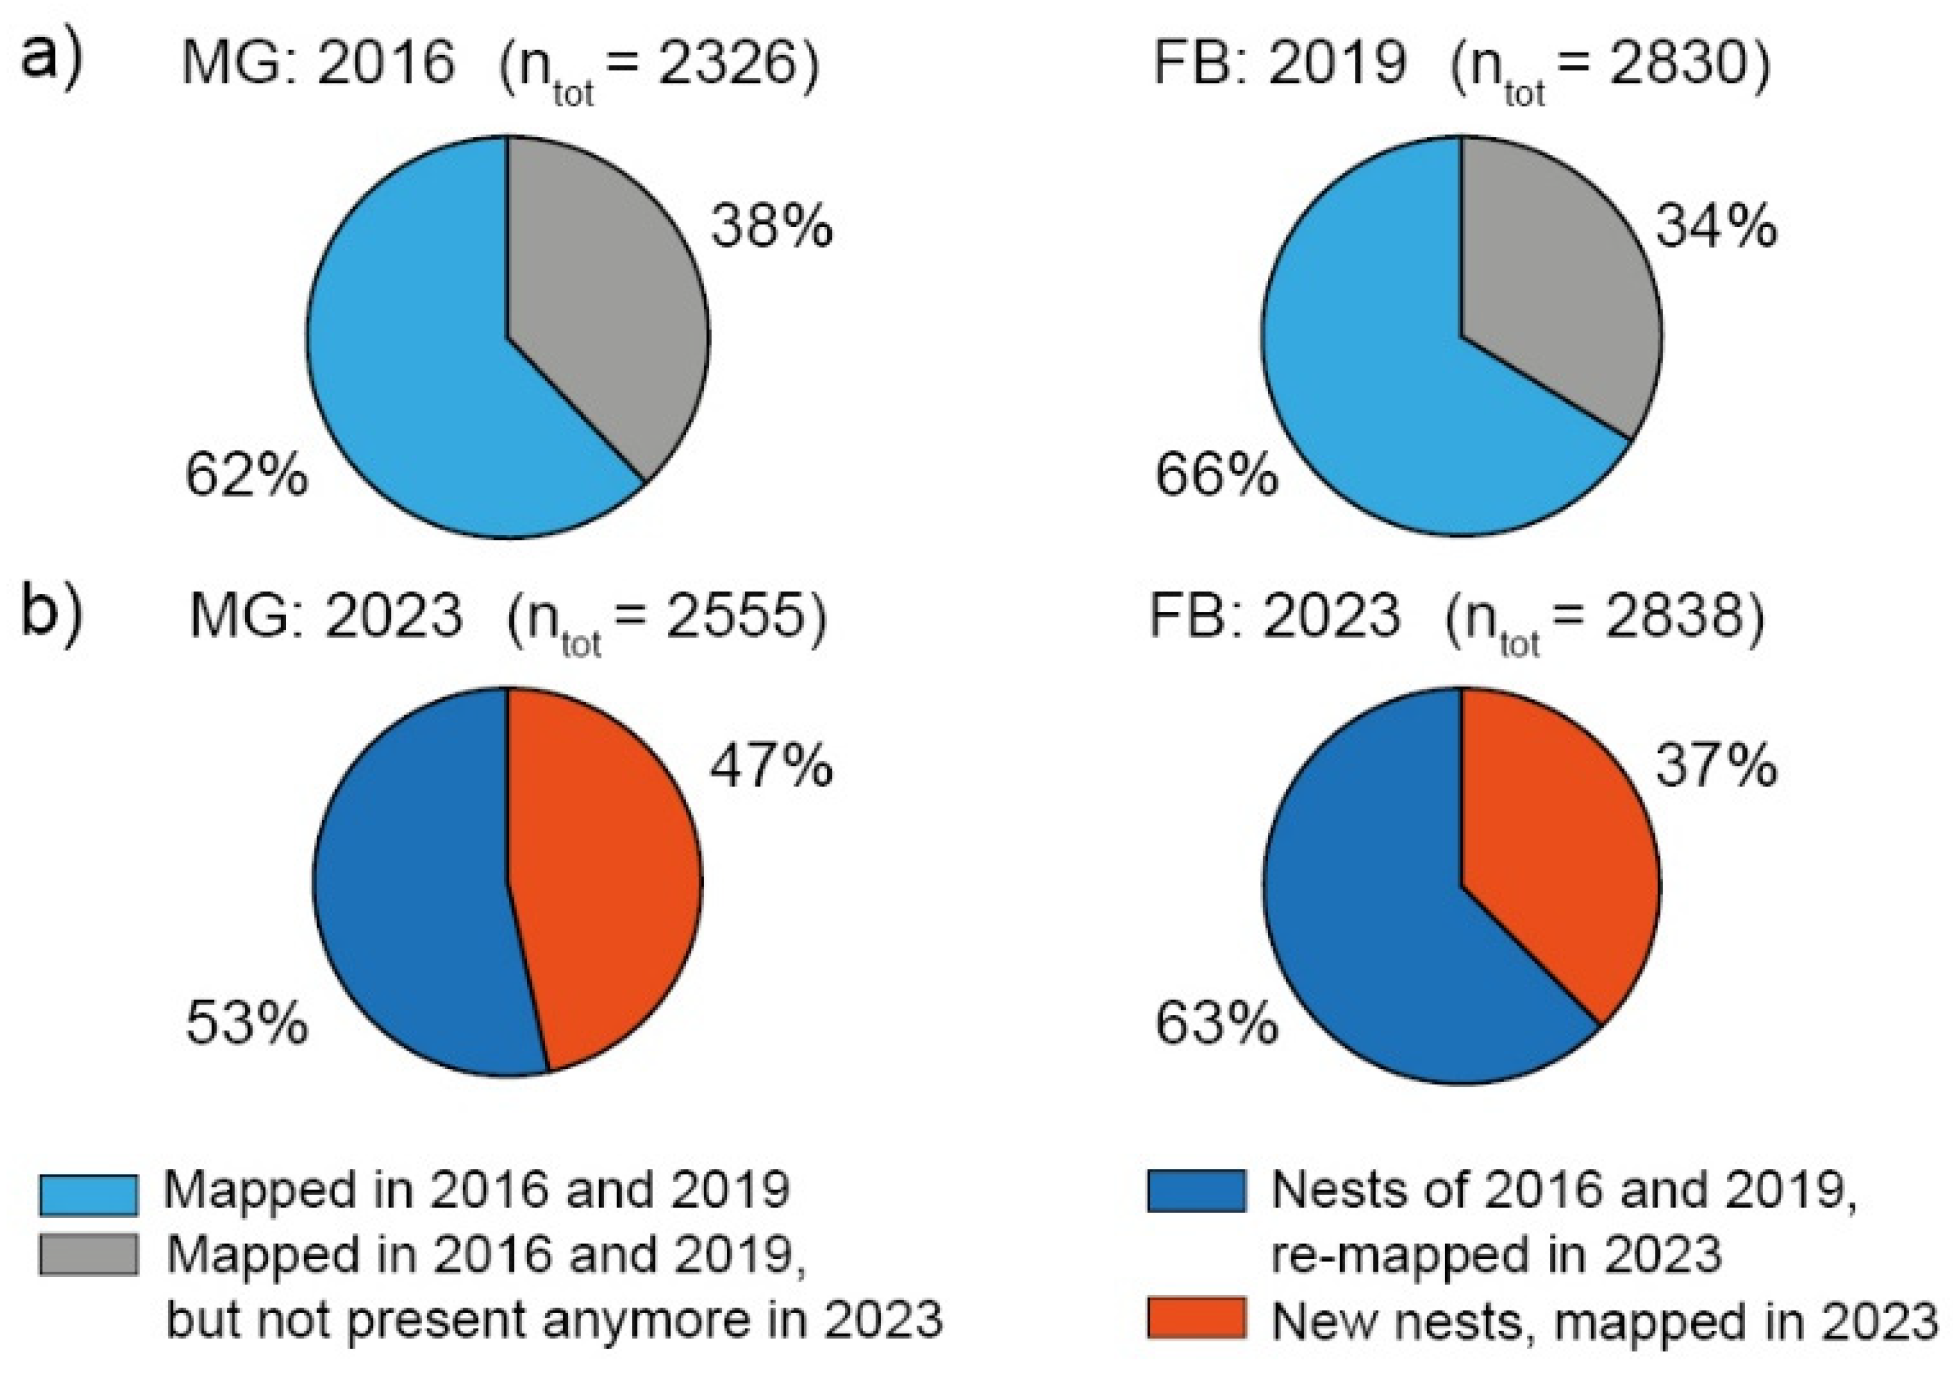
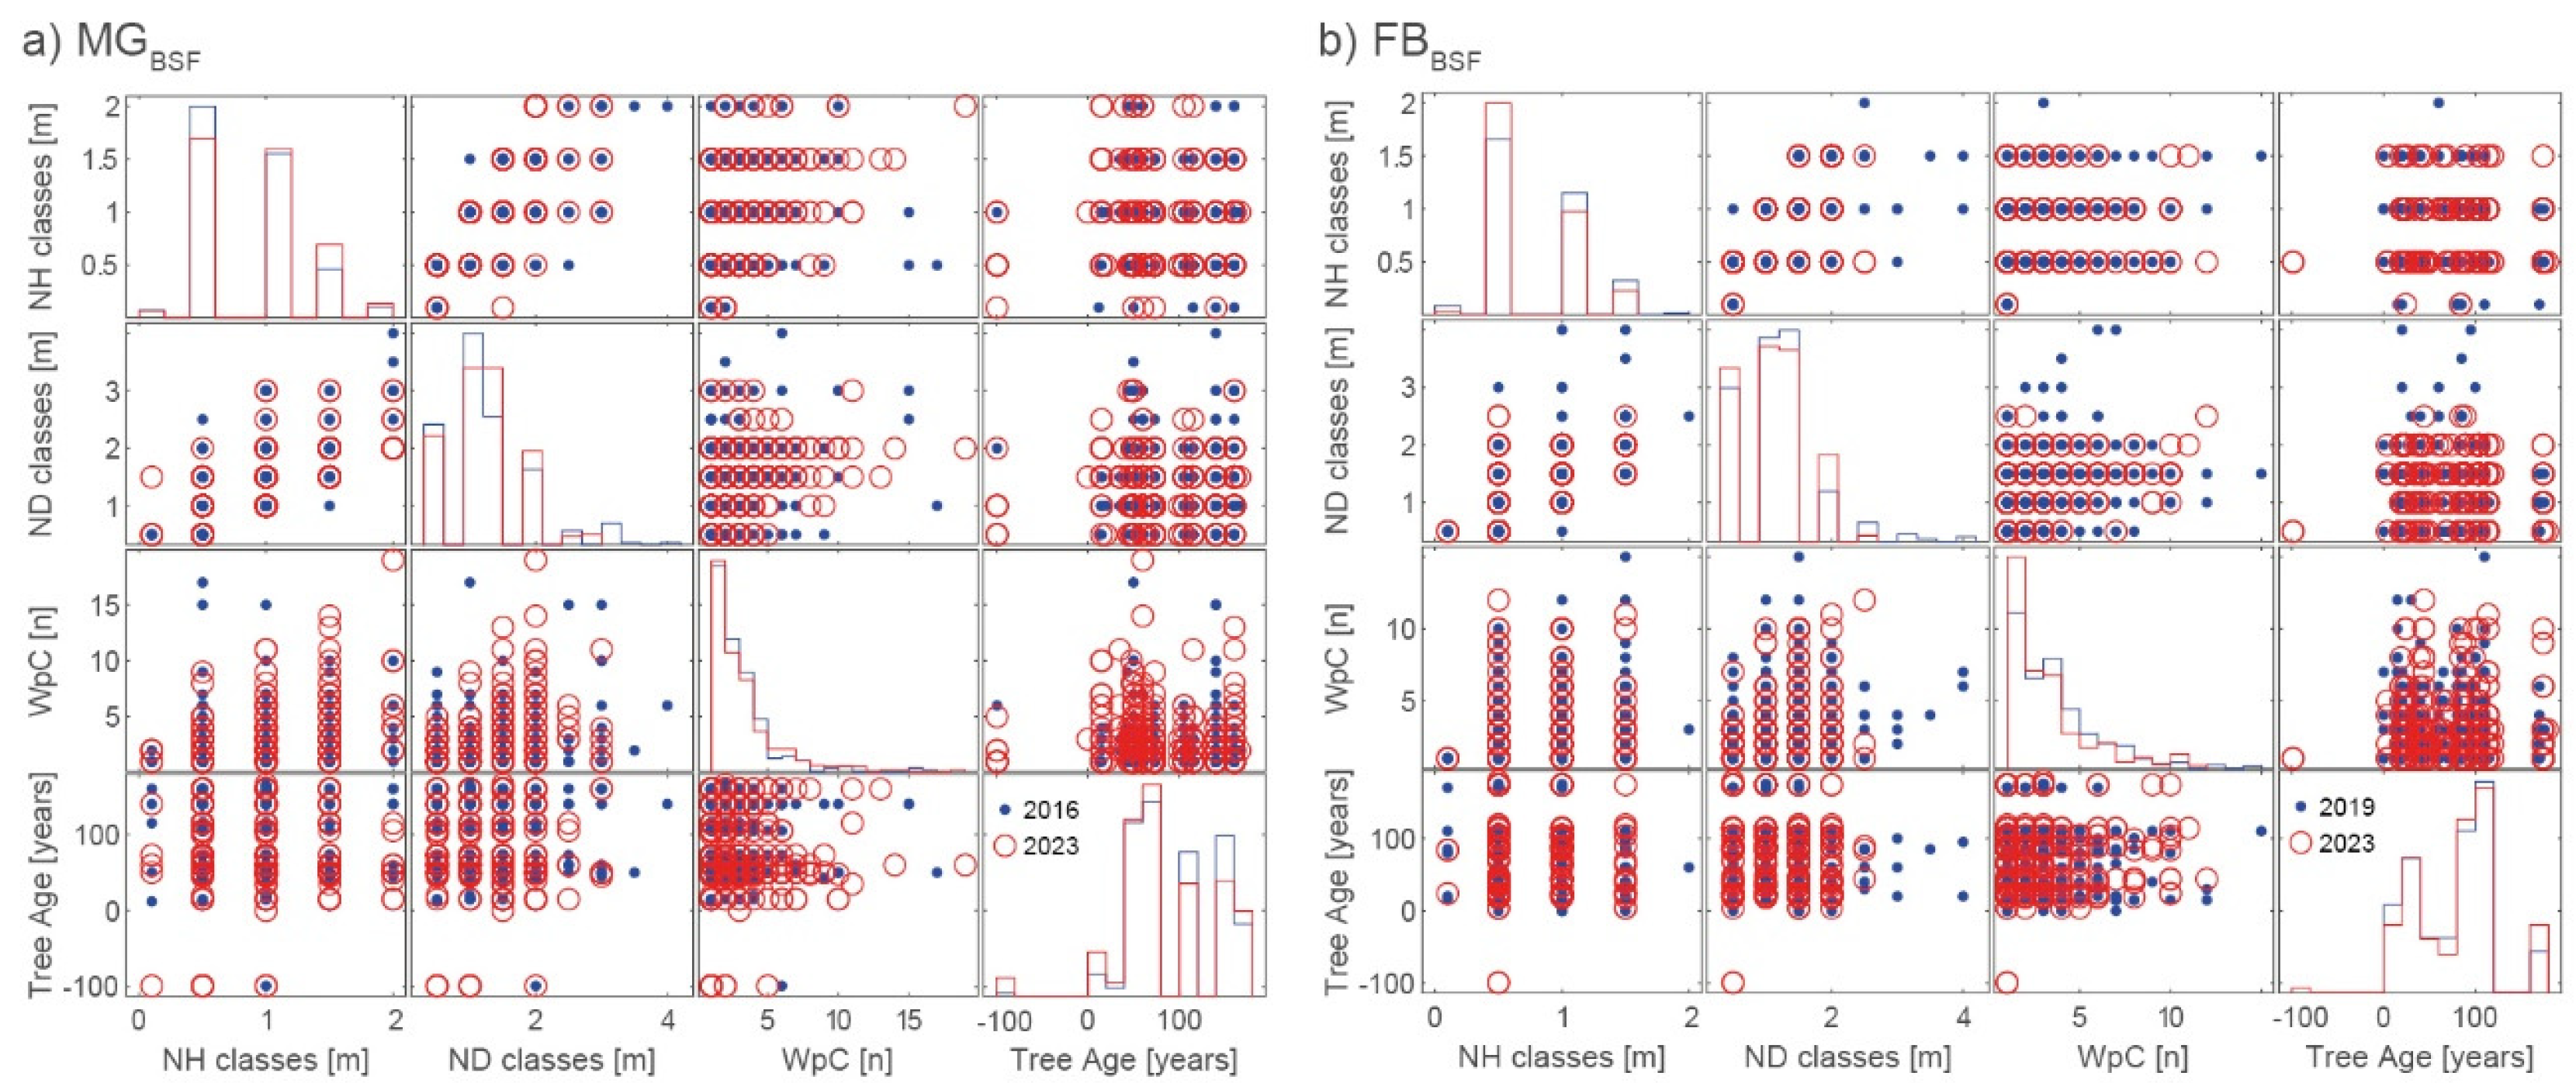
| 2016 | MG | 2326 | 2292 | – | – | – | – | – | – | 277 | 1208 | 632 | 153 | 22 | 947 | 696 | 393 | 173 | 83 |
| 2023 | MG | 2555 | 2513 | 1336 | 229 | 9.8 | 221 | 9.6 | 58.3 | 117 | 1496 | 706 | 165 | 29 | 836 | 829 | 594 | 199 | 55 |
| 2019 | FB | 2830 | 2607 | – | – | – | – | – | – | 406 | 1453 | 607 | 138 | 3 | 1175 | 738 | 493 | 129 | 72 |
| 2023 | FB | 2838 | 2763 | 1712 | 8 | 0.3 | 156 | 6.0 | 65.7 | 353 | 1683 | 622 | 96 | 9 | 1131 | 822 | 591 | 168 | 51 |
| Year | Mapped area | State forest (BSF) |
Municipal forest (MF) | Private forest (PF) |
FFH area* | Number of active nests (nact) | Number of nact in BSF, MF & PF for |
|||||||||
|---|---|---|---|---|---|---|---|---|---|---|---|---|---|---|---|---|
| hatot | ha | % | ha | % | ha | % | ha | % | ∑nact | BSF | MF | PF | FFH* | NR | CP | |
| a) MG | ||||||||||||||||
| 2016 | 149 | 128 | 85.9 | 7.4 | 5.0 | 13.6 | 9.1 | 7.7 | 5.2 | 2292 | 2110 | 89 | 93 | 89 | 44 | 120 |
| 2023 | 149 | 131 | 87.9 | 6.8 | 4.6 | 11.2 | 7.5 | 7.7 | 5.2 | 2513 | 2213 | 121 | 179 | 105 | 280 | 357 |
| b) FB | ||||||||||||||||
| 2019 | 200 | 167 | 83.5 | – | – | 33 | 16.5 | – | – | 2607 | 2221 | – | 386 | – | 331 | 57 |
| 2023 | 203 | 167 | 82.3 | – | – | 36 | 17.7 | – | – | 2763 | 2332 | – | 431 | – | 294 | 182 |
| Year | BSF | MF | PF | ||||||||||||||||||
|---|---|---|---|---|---|---|---|---|---|---|---|---|---|---|---|---|---|---|---|---|---|
| hatot | n | n/DW classes | Sum nactDW |
nactDW/ha | hatot | nactDW | n/DW classes | Sum nactDW |
nactDW/ha | hatot | n | n/DW classes | Sum nactDW |
nactDW /ha | |||||||
| 1 | 2 | 3 | 1 | 2 | 3 | 1 | 2 | 3 | |||||||||||||
| a) MG (nact) | |||||||||||||||||||||
| 2016 | 128 | 2110 | 57 | 495 | 410 | 962 | 8 | 7.4 | 89 | 0 | 9 | 14 | 23 | 3 | 13.6 | 93 | 1 | 29 | 15 | 45 | 3 |
| 2023 | 131 | 2213 | 63 | 436 | 454 | 953 | 7 | 6.8 | 121 | 2 | 12 | 17 | 31 | 5 | 11.2 | 179 | 4 | 64 | 27 | 95 | 8 |
| b) MG (nactR) | |||||||||||||||||||||
| 2023 | 131 | 1336 | 31 | 220 | 232 | 483 | 4 | 6.8 | 70 | 0 | 5 | 11 | 16 | 2 | 11.2 | 51 | 0 | 13 | 9 | 22 | 2 |
| c) FB (nact) | |||||||||||||||||||||
| 2019 | 167 | 2221 | 40 | 880 | 447 | 1367 | 8 | – | – | – | – | – | – | – | 33 | 386 | 5 | 181 | 15 | 201 | 6 |
| 2023 | 167 | 2332 | 55 | 653 | 426 | 1134 | 7 | – | – | – | – | – | – | – | 36 | 431 | 4 | 141 | 24 | 169 | 5 |
| d) FB (nactR) | |||||||||||||||||||||
| 2023 | 167 | 1446 | 34 | 412 | 268 | 714 | 4 | – | – | – | – | – | – | – | 36 | 266 | 3 | 96 | 10 | 109 | 3 |
| Year | Study site | Mapped nests (nact) | Nests (nact) with WpC (n) | Sum nact |
Numbers of WpC (n) in nact | Sum WpC (n) | ||||
|---|---|---|---|---|---|---|---|---|---|---|
| BSF | MF | PF | BSF | MF | PF | |||||
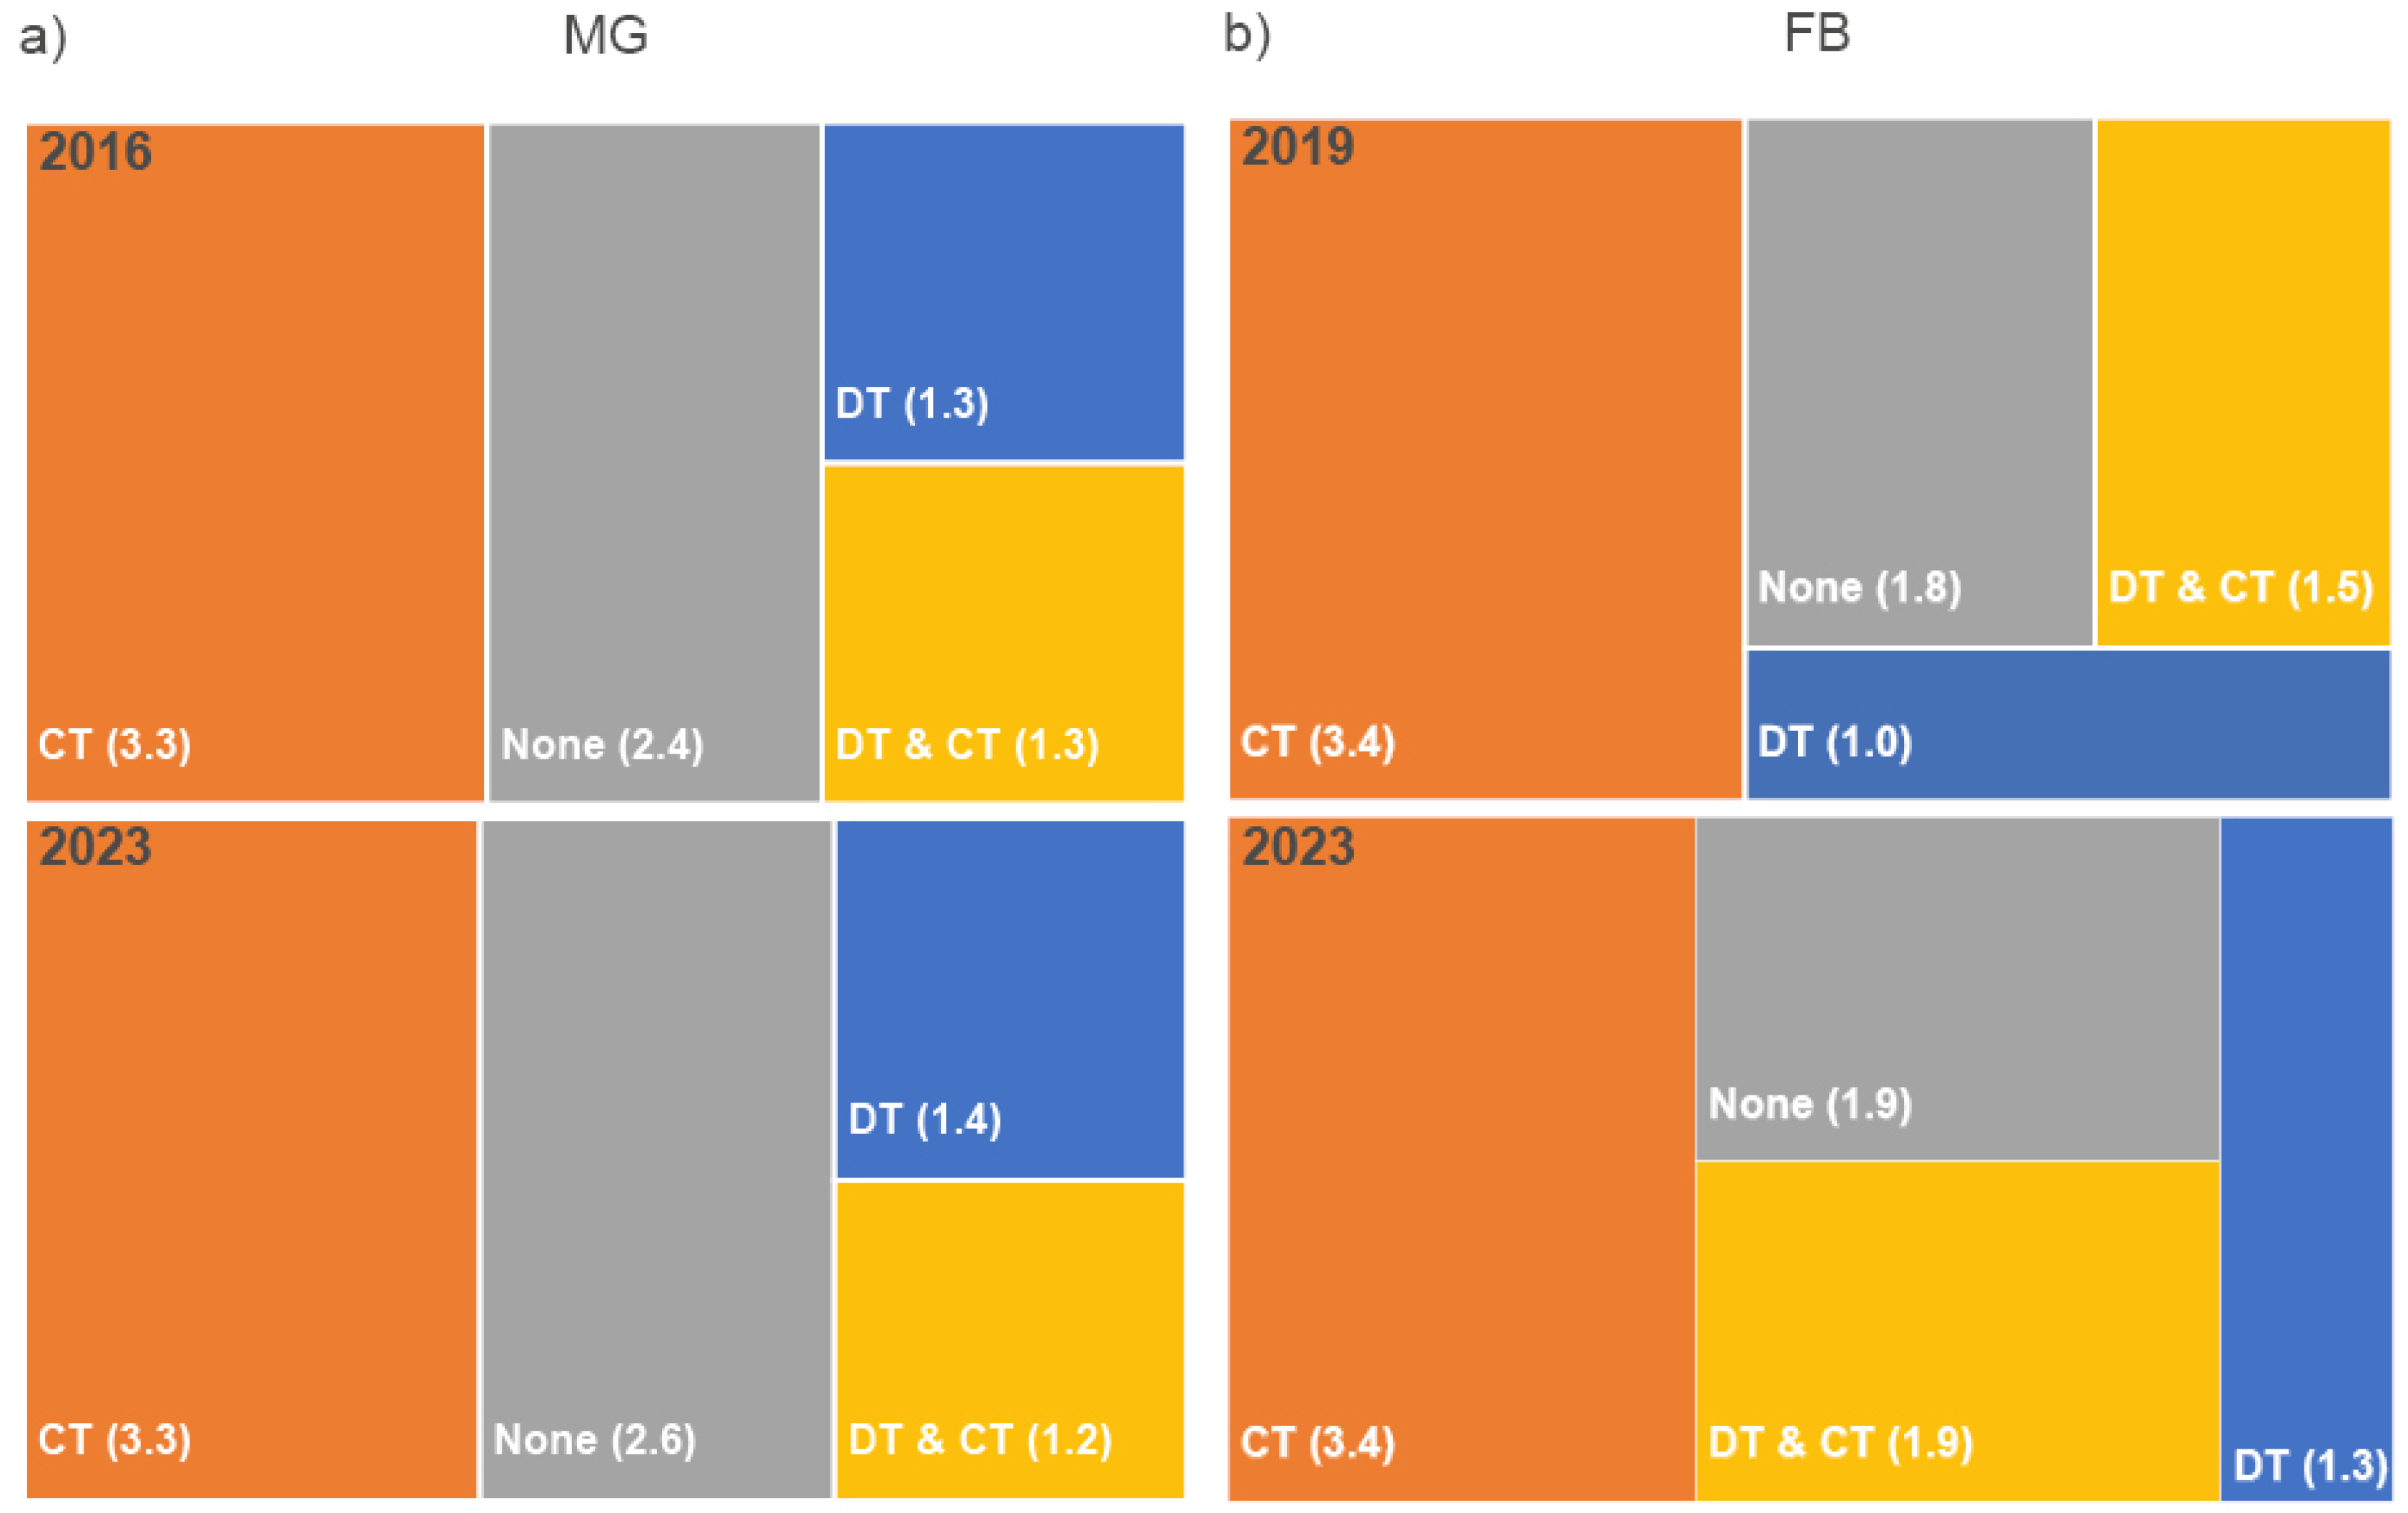
| 2016 | MG | 2292 | 291 | 16 | 14 | 321 | 743 | 32 | 36 | 811 |
| 2023 | MG | 2513 | 338 | 31 | 24 | 393 | 921 | 37 | 55 | 1049 |
| 2019 | FB | 2607 | 272 | – | 36 | 308 | 849 | – | 120 | 969 |
| 2023 | FB | 2763 | 331 | – | 68 | 399 | 908 | – | 246 | 1154 |
Disclaimer/Publisher’s Note: The statements, opinions and data contained in all publications are solely those of the individual author(s) and contributor(s) and not of MDPI and/or the editor(s). MDPI and/or the editor(s) disclaim responsibility for any injury to people or property resulting from any ideas, methods, instructions or products referred to in the content. |
© 2024 by the authors. Licensee MDPI, Basel, Switzerland. This article is an open access article distributed under the terms and conditions of the Creative Commons Attribution (CC BY) license (http://creativecommons.org/licenses/by/4.0/).


