1. Introduction
Reactive oxygen species (ROS) play a pivotal role in the normal functioning, protection, and survival of living cells, being regularly neutralized by enzymatic and non-enzymatic antioxidants [1–3]. However, an excessive generation of ROS during energy production can lead to oxidative stress, a condition produced by the imbalance between oxidants and antioxidants in a biological system, one of the key factors of aging process and the development of various diseases [3–6]. To counteract these problems the incorporation of antioxidant nutrients from water, food, and supplements into daily intake is one of the most recommended strategies [7,8].
Over the last two decades, there has been a notable increase in acknowledging the potential of regular water intake as a strategy to enhance the daily absorption of antioxidants. The increasing popularity of ‘functional water,’ enriched with health-beneficial additives, reflects the growing trend of health-conscious consumer choices. Scientific research strongly supports the antioxidant effects of vitamin-infused, herbal, and electrolyte-enhanced waters, as their antioxidant activity is derived from the inclusion of substances with well-established antioxidant properties [9,10].
However, the spotlight is increasingly turning towards emerging functional waters such as alkaline electrolyzed water, acidic electrolyzed water, electrolyzed hydrogen, hydrogen-enriched water, and tourmaline water. These waters are gaining attention not only for their potential health benefits but also because their distinctive properties arise from artificial treatments, not from the addition of substances with antioxidative properties [9,11–16] Despite the increasing production and effectiveness of these newer options, the intricate mechanisms underlying their antioxidant and other health effects continue to be the subject of ongoing and intensive scientific exploration [9,11–13,17]. Japan has emerged as a frontrunner in these initiatives; in 1993, the Japanese Society for Functional Water (JSFW) was established and serves as a national academic center dedicated to acquiring, accumulating, and disseminating accurate knowledge regarding functional water [18]. They were the first to provide a definition of “functional water” as an aqueous solution that incorporates reproducible useful functions through artificial treatment [18].
Extending the exploration into these functional waters, particular cases bring attention to their unique physico-chemical features and reported health-enhancing properties. For instance, Alkaline electrolyzed water (AlEW), also called electrolyzed-reduced water or electrochemically reduced water (ERW) is produced near cathode through electrolysis and has higher, alkaline pH (9.0 – 10.0), higher electrical conductivity (EC) and dissolved hydrogen (DH) values, while lower oxidation-reduction potential (ORP) and dissolved oxygen (DO) values [9,19–22]. While ERW itself does not display antioxidant activity [23], there are studies showing it may exhibit superoxide dismutase activity (SOD) helping in ROS scavenging [24] and also enhancing the SOD activity of other antioxidants when used as solvent [23]. ERW was shown to possess the ability to protect DNA, RNA and proteins from oxidative stress damage [25], to protect neural cells and pancreatic cells from oxidative damage [26,27] and regular intake was linked to improved gastrointestinal function, liver function and multiple other health benefits [20–22]. Hydrogen-enriched ERW (HW), produced by incorporating molecular hydrogen gas, was shown to delay skin aging [28]. Tourmaline water or also called tourmaline-modified water (TMW) is a functional water with electrochemical properties produced by water passing through stones made of tourmaline, a natural borosilicate mineral that releases negative ions and generates an electric field on its surfaces [9]. TMW was also shown to enhance antioxidant activity of well-known antioxidant, ascorbic acid [11,29].
The antioxidant effects attributed to the utilization of various functional waters can be rationalized by the heightened ionic product of water as a solvent [30]. In simpler terms, this phenomenon is linked to alterations in the molecular structure of water during the specific production processes involved in creating functional water. Although commonly reported parameters such as pH, ORP, DO, and DH do not elucidate the mechanism behind the intensified antioxidant effects, they serve as valuable indicators for assessing the energy of electrolysis, particularly when measured immediately after the electrolytic process [30]. Furthermore, these physical and chemical parameters offer insights into the changes occurring in the molecular structure of water as a solvent. On the other hand, there are also results pointing out to the effects of molecular hydrogen (H2) and the presence of platinum particles (when using platinum electrodes) in the functional water as possible agents providing antioxidative effects. Molecular hydrogen (H2) has indeed demonstrated various protective effects against oxidative stress and other health benefits [31–34]. It is thought that the ideal scavenger for active oxygen species is precisely “active hydrogen,” which is produced in reduced water near the cathode during electrolysis. With high values of DH, along with high pH, low DO, and an extremely negative ORP, it is believed that these characteristics contribute to the stability and antioxidative properties of ERW functional water, protecting biological macromolecules from oxidative damage [3]. Other proposed agents in this mechanism behind the antioxidant and SOD activity are silver ions [11] or platinum particles [19] , and generally greater difference in ionic mobility between cations and anions [30].
However, it was also found that the behavior of H2 in reduced water, which was activated by a platinum electrode, differed from that of H2 introduced by bubbling of hydrogen gas [23]. In a separate study, the SOD-like activity of ERW was demonstrated to remain stable at 4 °C for over a month, and this stability was preserved even after neutralization, repeated freezing and melting, deflation with sonication, vigorous mixing, boiling, repeated filtration, or closed autoclaving [21]. Conversely, another investigation indicated that ERW retained its ROS-scavenging activity after removal of dissolved hydrogen, but lost its activity when autoclaved [19]. As a result, the mechanisms underlying the reported health benefits and antioxidant effects of these functional waters are not yet fully understood, and this remains a focal point of numerous ongoing research studies
The objective of this research is to employ aquaphotomics [35–37] and near-infrared spectroscopy (NIRS) to investigate the molecular mechanisms behind the phenomena observed in previous studies that electrolyzed hydrogen water (EHW, Electrolyzed Hydrogen Water) possesses the property of deactivating oxygen radicals [19,24]. This study builds upon prior research, which observed a 40% reduction in the activity of deactivating reactive oxygen species in cells when hydrogen gas was removed by stirring, while autoclaving resulted in the complete elimination of ability to neutralize ROS [19]. The preceding study [19], guided by the hypothesis that intracellular reactive oxygen species (ROS) scavenging activity is attributed to H2 gas, employed degassing and autoclaving steps to explore whether H2 is the agent responsible for this activity. These steps, involving the removal and purification of gases, were chosen as treatments to validate that H2 indeed plays a pivotal role in ROS scavenging activity [26]. Since the study showed ERW retained its ROS-scavenging activity after the removal of dissolved hydrogen but lost its activity when autoclaved, indicating that ERW contains electrolysis-dependent hydrogen and an additional antioxidative factor predicted to be platinum nanoparticles.
Near-infrared spectroscopy (NIRS) was employed in prior research to classify various waters in the context of functional water exploration [11]. The research study used tap water, AlEW, and TMW as electrolytes to generate silver-ionized water (SIW) and mixtures AlEW-SIW, and TMW-SIW, respectively. The spectra of these aqueous solutions were acquired in the visible and near infrared (NIR) region spanning 400 – 1100 nm [11]. Within this range, the NIR segment encompasses the 3rd and 2nd overtones of water stretching vibrations [38], providing a valuable opportunity to observe the molecular structure of water. Discriminant analysis of the NIR spectral data showed the distribution of clusters of different samples in line with the referent results on their SOD activities, indicating that NIR spectra reflect well the information on the SOD activity and its connection to the molecular structure of these waters. However, a comprehensive explanation or understanding of the relationship between the NIR spectra, water molecular structure and observed functionality was not elucidated and warrants further investigation.
In this context, aquaphotomics, a scientific discipline dedicated to comprehending the distinctive spectral patterns of water molecular structures in various aqueous and biological systems, offers an excellent approach [35–37,39]. It has the potential to provide understanding and insights into the molecular mechanisms underpinning the functionality of functional waters. Numerous publications in this field provide the rationale for using aquaphotomics NIRS to connect the specifics of water molecular structure and how it changes under different perturbations, thereby linking the molecular structure with the exhibited functionality [37,40–46]. Moreover, numerous studies highlight the intricate and active role played by the molecular structure of water in various aspects, including antioxidant activity, radical scavenging, and the prevention of reactive oxygen species (ROS) generation [47–52]. These studies point out to novel mechanisms underlying these functionalities that are based on properties of water as an active molecular matrix, and especially putting emphasis on the key roles of specific water molecular conformations such as solvation shells and long-range layers of low-mobility, hydrogen-bonded water [47–52].
Therefore, the objective of the current research is to use aquaphotomics and NIRS to investigate and understand why EHW water has the property of deactivating oxygen radicals, by utilizing the information that the property of deactivating oxygen radicals is completely lost after the EHW is autoclaved and partially lost (40% decreased) after the removal of hydrogen gas by stirring. By utilization of multivariate analysis methods to explore the NIR spectra of these waters and applying aquaphotomics approach to understand and connect the water spectral patterns (WASPs)[35,53] with the exhibited functionality, the study aims to understand the mechanisms underlying the observed functionality and explain in it the terms of the specifics of water molecular conformations.
2. Materials and Methods
2.1. Water Samples
Having the research objective in mind, the experiment was designed using the water samples generated by TRIM device: TRIM ION GRACE (Nihon Trim Co. Ltd., Osaka, Japan). The apparatus has the similar structure as the previously reported apparatus [19], with the difference that this is the first apparatus equipped with a solid polymer membrane, and is highly specific type electrolytic hydrogen water conditioner. The brief description of the apparatus function is as follows. The apparatus is comprised of two units – a micro-carbon cartridge and electrolysis unit. The cartridge unit serves for initial filtration. Tap water from the city supply undergoes filtration through a nonwoven fabric, activated carbon, and polyethylene and polypropylene membranes to eliminate impurities (designated as FW – filtered water, in the following text). FW then enters the electrolysis unit, where it undergoes electrolysis between platinum coated electrodes. The apparatus can produce three types of water, already mentioned FW, electrolyzed hydrogen water (EHW, with 4 different levels of pH), and acidic water (2 different pH levels).
The functional water investigated in this study corresponds to the hydrogen model level 3 of EHW (designated as EHW3 in the paper), with nominal values of pH between 8.5 and 9.9; it is recommended to be used for drinking as a functional water. This water is equivalent to the water examined in the previous study, which reported functionality of ROS-scavenging activity, 40% of loss this activity after removal of dissolved hydrogen and complete loss of the activity after autoclaving [19].
In addition to EHW3 water, repeating the preparation steps from previous research [19], two more types of water samples were produced using EHW3, but following degassing (removal of H2, designated as EHW3-H2) and following autoclaving (EHW3+Autoclave). The removal of hydrogen gas was performed by filling a half of the sample container with an EHW3 water, shaking it vigorously and then opening of the lid. This procedure was repeated twice. Also, following the steps of the previous research, other types of water samples were prepared to simulate the EHW3 characteristics and better elucidate the nature of the antioxidant factors. First, one type was produced by adding HCl to EHW3 (1mol/L hydrochloric acid, FUJIFILM Wako Pure Chemical Corporation, Osaka, Japan). The purpose of this sample was to adjust the pH value of EHW3 to be the same as FW. Second, a sample of FW with added NaOH (1 mol/L sodium hydroxide solution, FUJIFILM Wako Pure Chemical Corporation, Osaka, Japan) was prepared to simulate a sample of FW with same pH value as an EHW3. The purpose of these two sample types was to explore if the pH is contributing to the observed effects.
Lastly, ultrapure water generated by Milli-Q system (Millipore, Molsheim, France) was used in the experiment, as a standard for pure water to which all other waters will be compared.
There were in total 6 types of samples, as represented in
Table 1, each sample prepared in two independent replicates. Experiment was repeated 3 times, each time samples were freshly prepared.
The dissolved hydrogen (DH) of the samples were measured immediately after the samples were prepared. DH was measured using DH- meter (DH-35A, DKK-TOA Corp., Tokyo, Japan).
2.2. Near Infrared Spectral Measurements
All the experimental samples were scanned using near infrared spectrometer XDS-RLA rapid liquid analyzer with VISION software (FOSS NIR Systems, Inc. Laurel, MD, USA). The absorbance spectra were acquired in the 400 – 2500 nm range, with 0.5 nm resolution. The quartz cuvette with 1 mm pathlength was used as a container. Each acquired spectrum was an average of 32 co-added scans. Each sample measurement was performed with 5 consecutive irradiations. The measurements of different sample types and sample replicates were performed in random order. The measurements were performed at controlled temperature, using an external water bath set to the temperature of 25°C connected with the cell holder. The temperature at the sample holder was monitored using thermocouple data logger USB-5104 (Measurement Computing, Norton, MA, USA). During the entire experiment the temperature, humidity and the pressure of the experimental room were monitored and logged using thermo-recorder RS-12P (ESPEC MIC Corporation, Osaka, Japan).
2.3. Data Analysis
Data analysis was performed following the standard protocol for aquaphotomics analysis [53] and included raw spectral inspection, spectral preprocessing using standard normal variate transformation (SNV)[54] and calculation of difference spectra, supervised classification analysis Soft Modeling of Class Analogies (SIMCA) [55], and Partial Least Squares Regression Analysis (PLSR)[56] for modelling dissolved hydrogen (DH).
Outputs from all the analyses were summarized to identify the wavelengths where the highest variations of light absorbance have been observed in response to the respective perturbations, i.e. Water Matrix Coordinates – WAMACs. Each water sample has been represented then by its water spectral pattern - WASPs on aquagrams [35,53], whose radial axes were defined by the identified WAMACs in order to interpret the molecular structure of each water in relation to the functionality as described in Table 1. The aquagrams were computed using the classical aquagram procedure [53], with a modification introduced in the final step. In this step, the calculated absorbance values were divided by the range of absorbance values in the resulting dataset, incorporating a scaling factor. This adjustment was implemented to effectively scale the data and ensure that it fills the plot window [57].
For this research, the SIMCA and PLSR analyses were executed using the Pirouette® version 4.5 (Infometrix Inc. Woodinville, WA, USA), difference spectra and aquagrams were calculated using Microsoft Excel 2019 (Microsoft, Redmond, WA, USA). Additionally, the graphs and peak picking were performed using Origin Pro 2018 (OriginLab Corporation, MA, USA).
3. Results
3.1. Inspection of the Raw Spectra
The raw NIR spectra were first trimmed to the region 1100 to 1850 nm to explore the two important broad, water absorbance bands located around 1190 nm (attributed to combination of the first overtone of the OH stretching and OH bending vibrations (2ν
1,3 + ν
2)) and around 1450 nm (attributed to the first overtone of the OH stretching vibrations (2ν
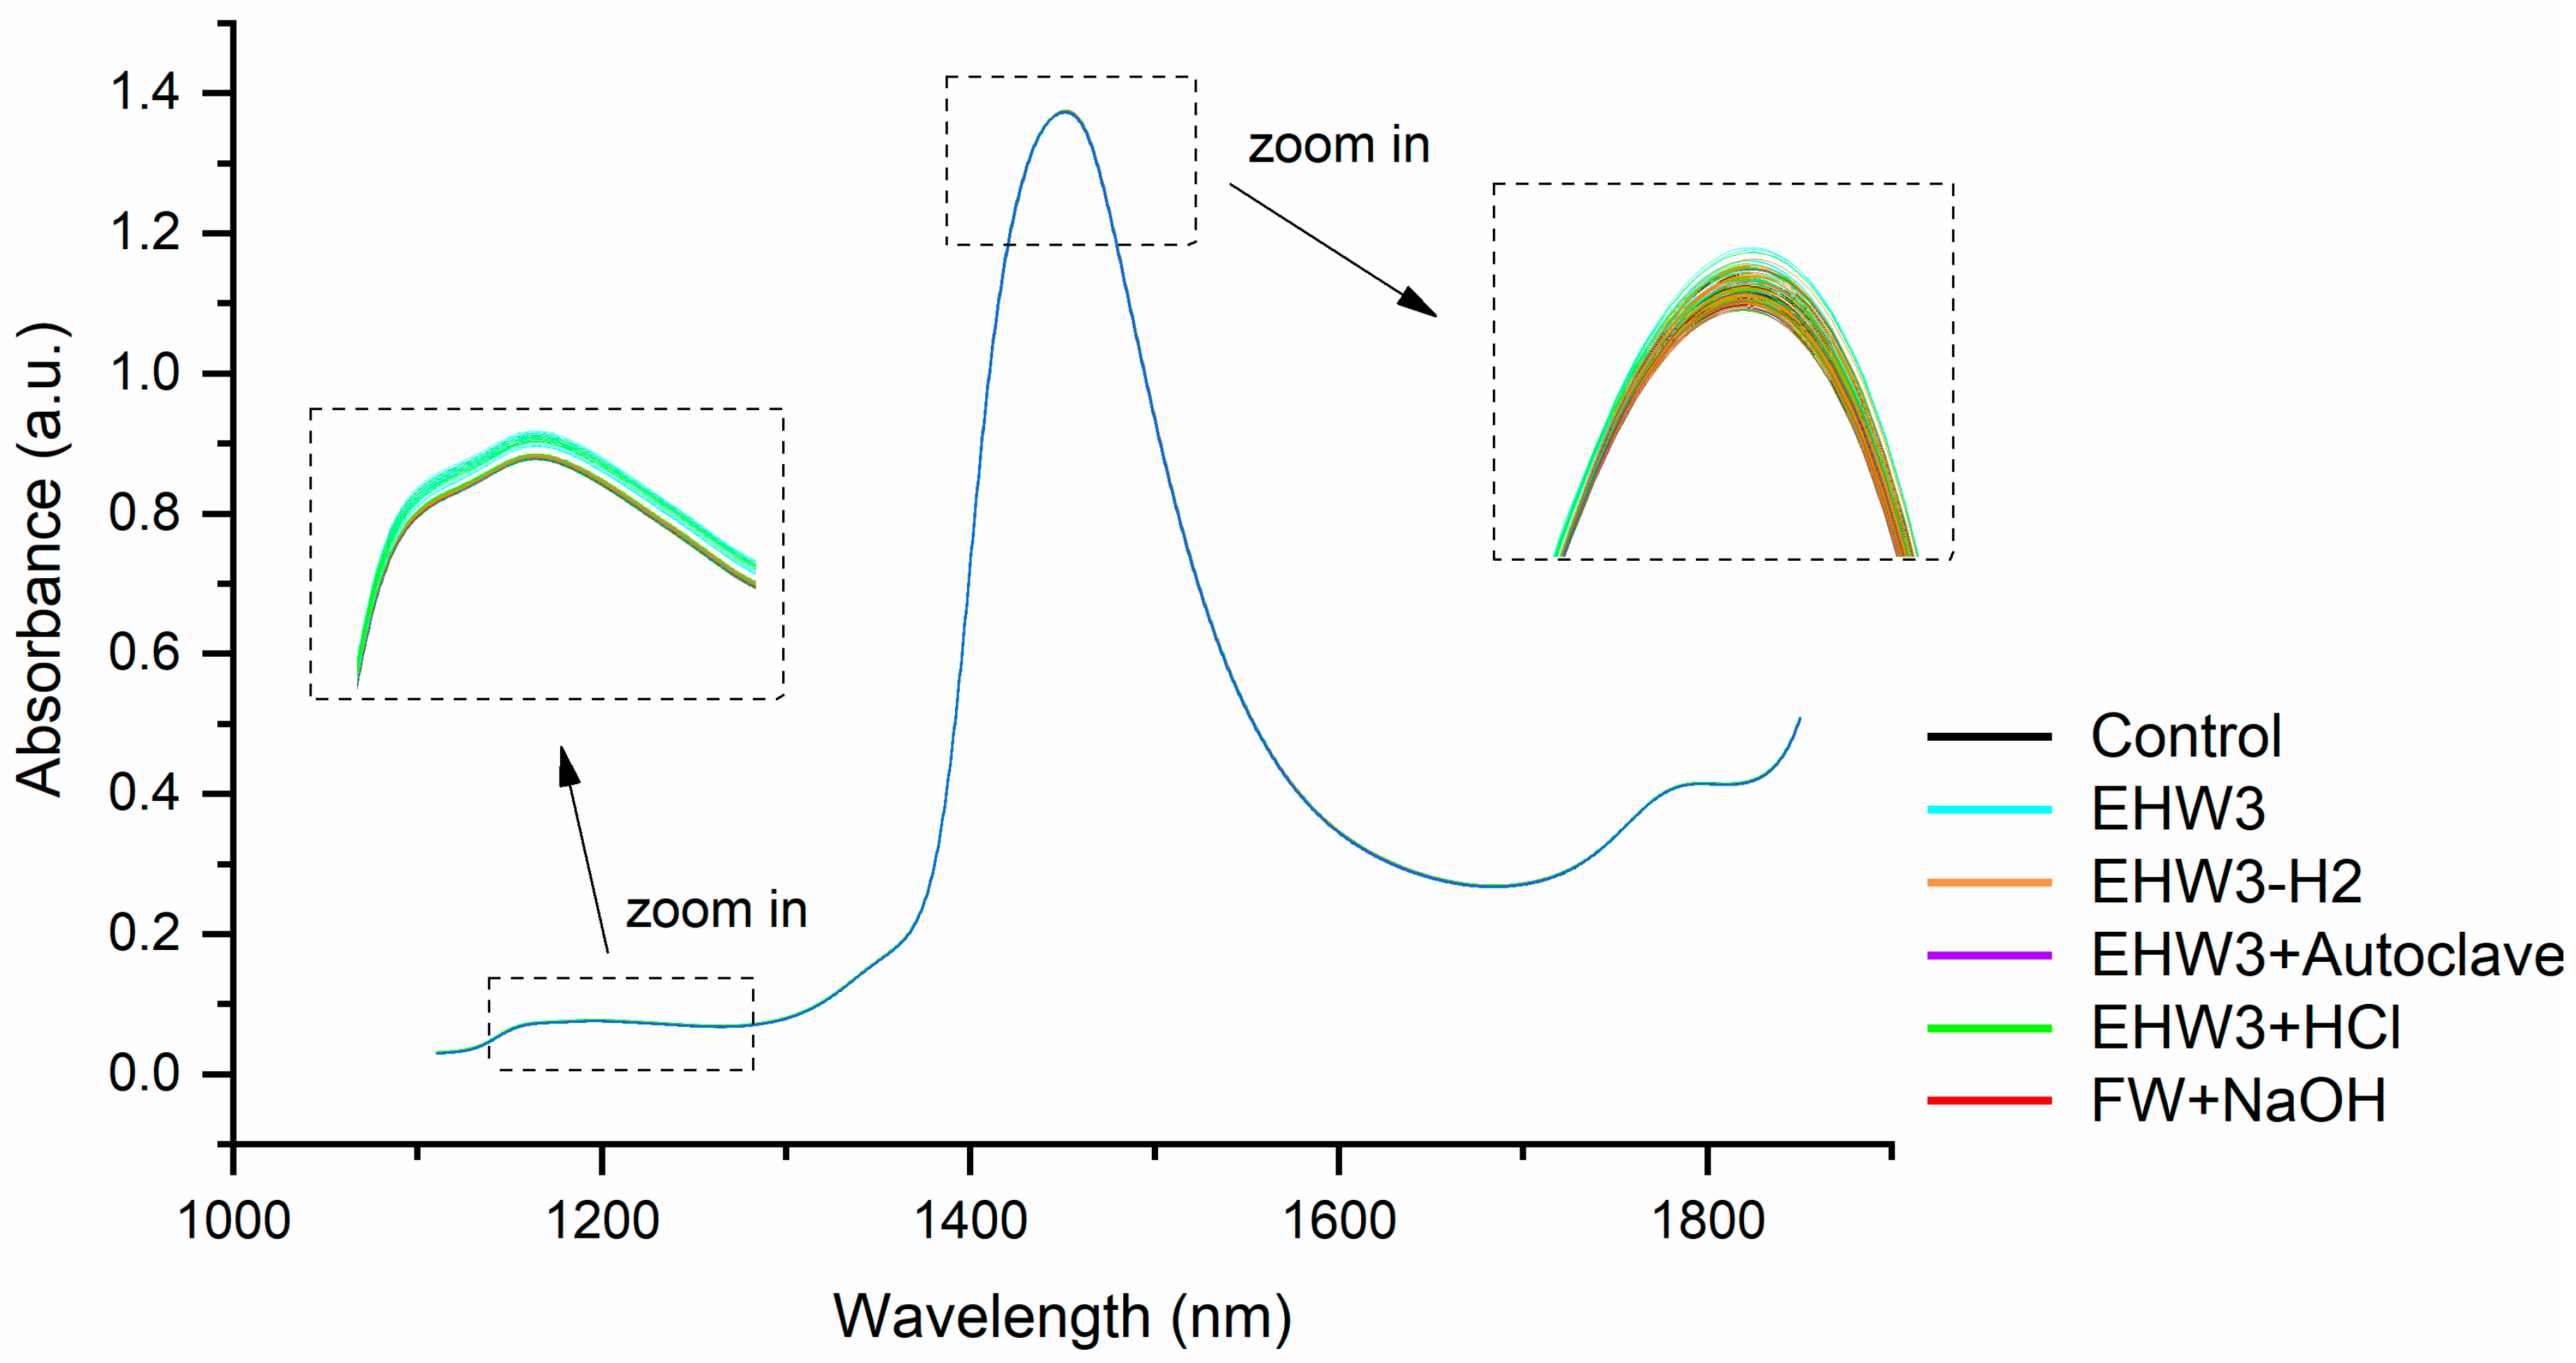
1,3)) [37]. The raw absorbance spectra within the NIR region exhibit a visual overlap, creating the impression of a unified spectrum (
Figure 1). The most distinctive features are a prominent water absorbance peak around 1450 nm and much less pronounced, broad spectral feature around 1200 nm. Upon closer examination of this region, as depicted in the zoomed-in areas of Figure 1, it becomes apparent that different water types manifest different spectral profiles. Variations in baseline offsets are evident, with the sample type influencing the observed distinctions. In particular, the sample EHW3 (cyan lines, as illustrated in the insets of Figure 1) exhibits the highest baseline among the samples.
The vertical shifts observed in the baseline of NIR spectra, characterized by multiplicative effects, are attributed to light scattering, a phenomenon resulting in elevated absorbance values [58]. However, this effect is physical in nature and suggests the presence of scattering elements, for example particles or bubbles i.e. structures that scatter light. It is not possible at this stage of the analysis to precisely identify what are those light-scattering structures, but based on the observed highest baseline of EHW3 spectral profiles, it can be assumed that there are some structures that scatter light, size of which is close to the wavelength of NIR light in this spectral region.
The recognition of baseline effects and subtle variations in the NIR spectra of different samples emphasizes the need to employ pre-processing techniques and multivariate analysis. These approaches are crucial for extracting meaningful insights into the chemical distinctions among various water types.
3.2. Difference Spectra
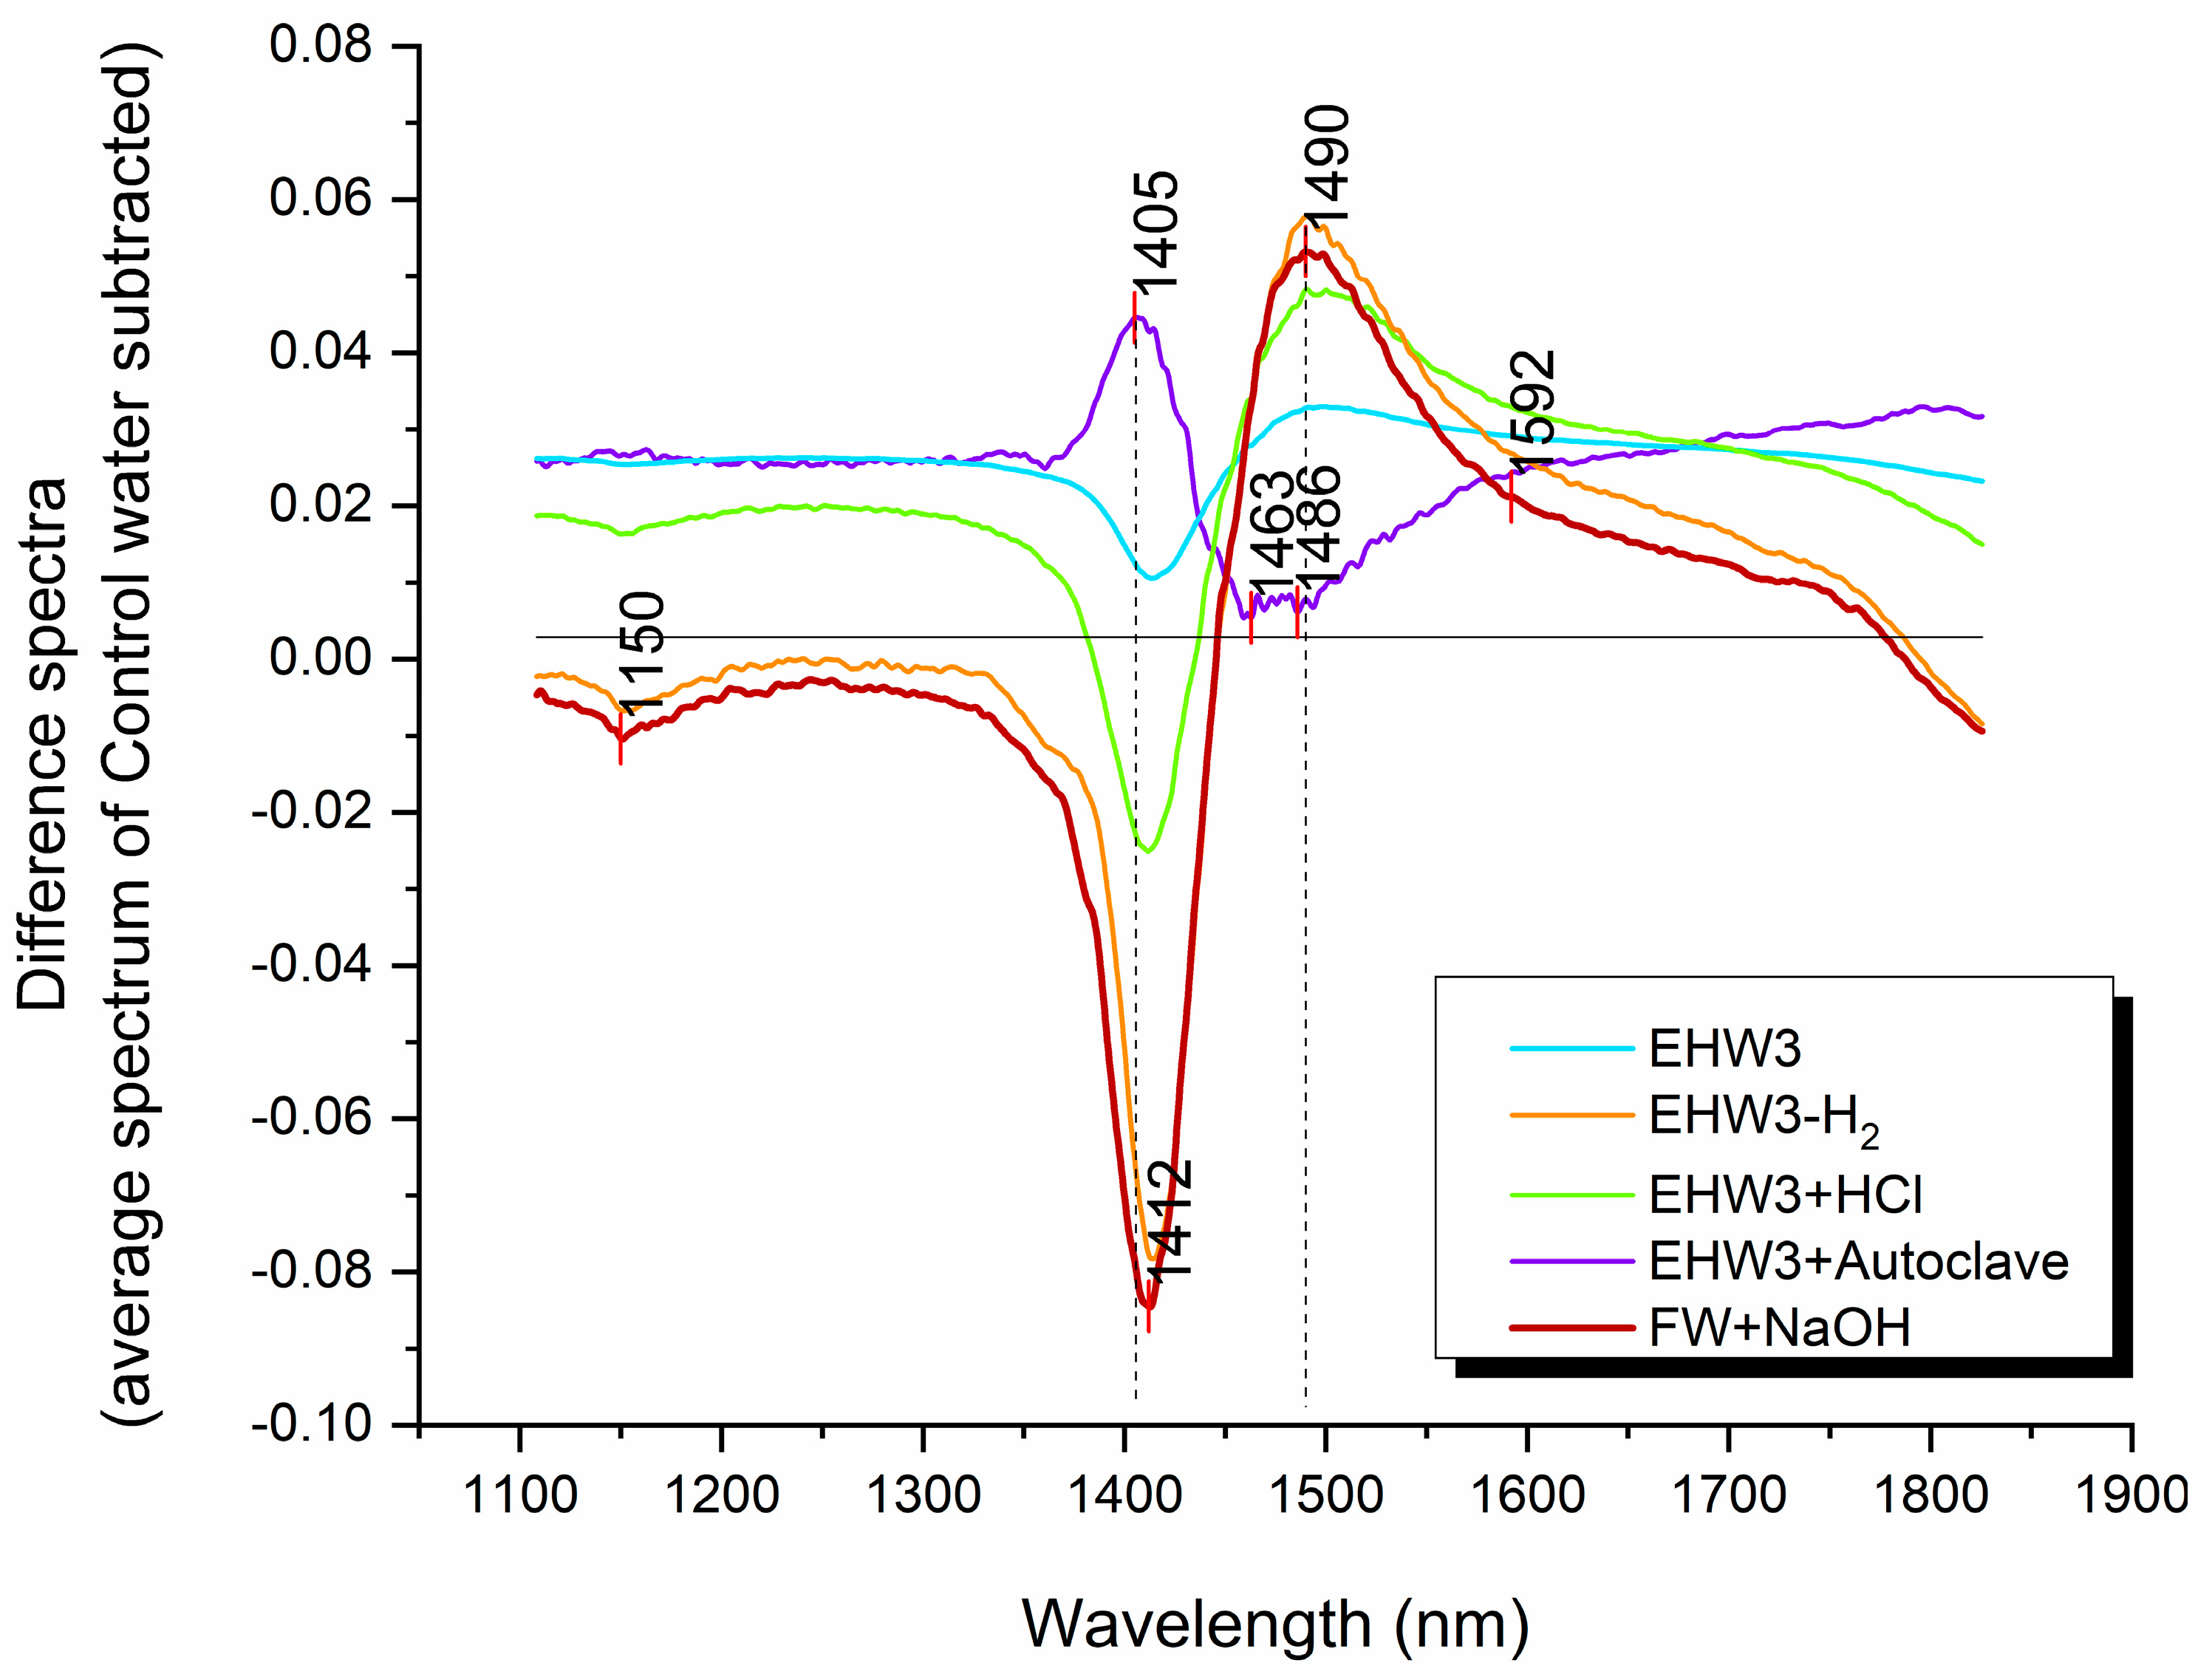
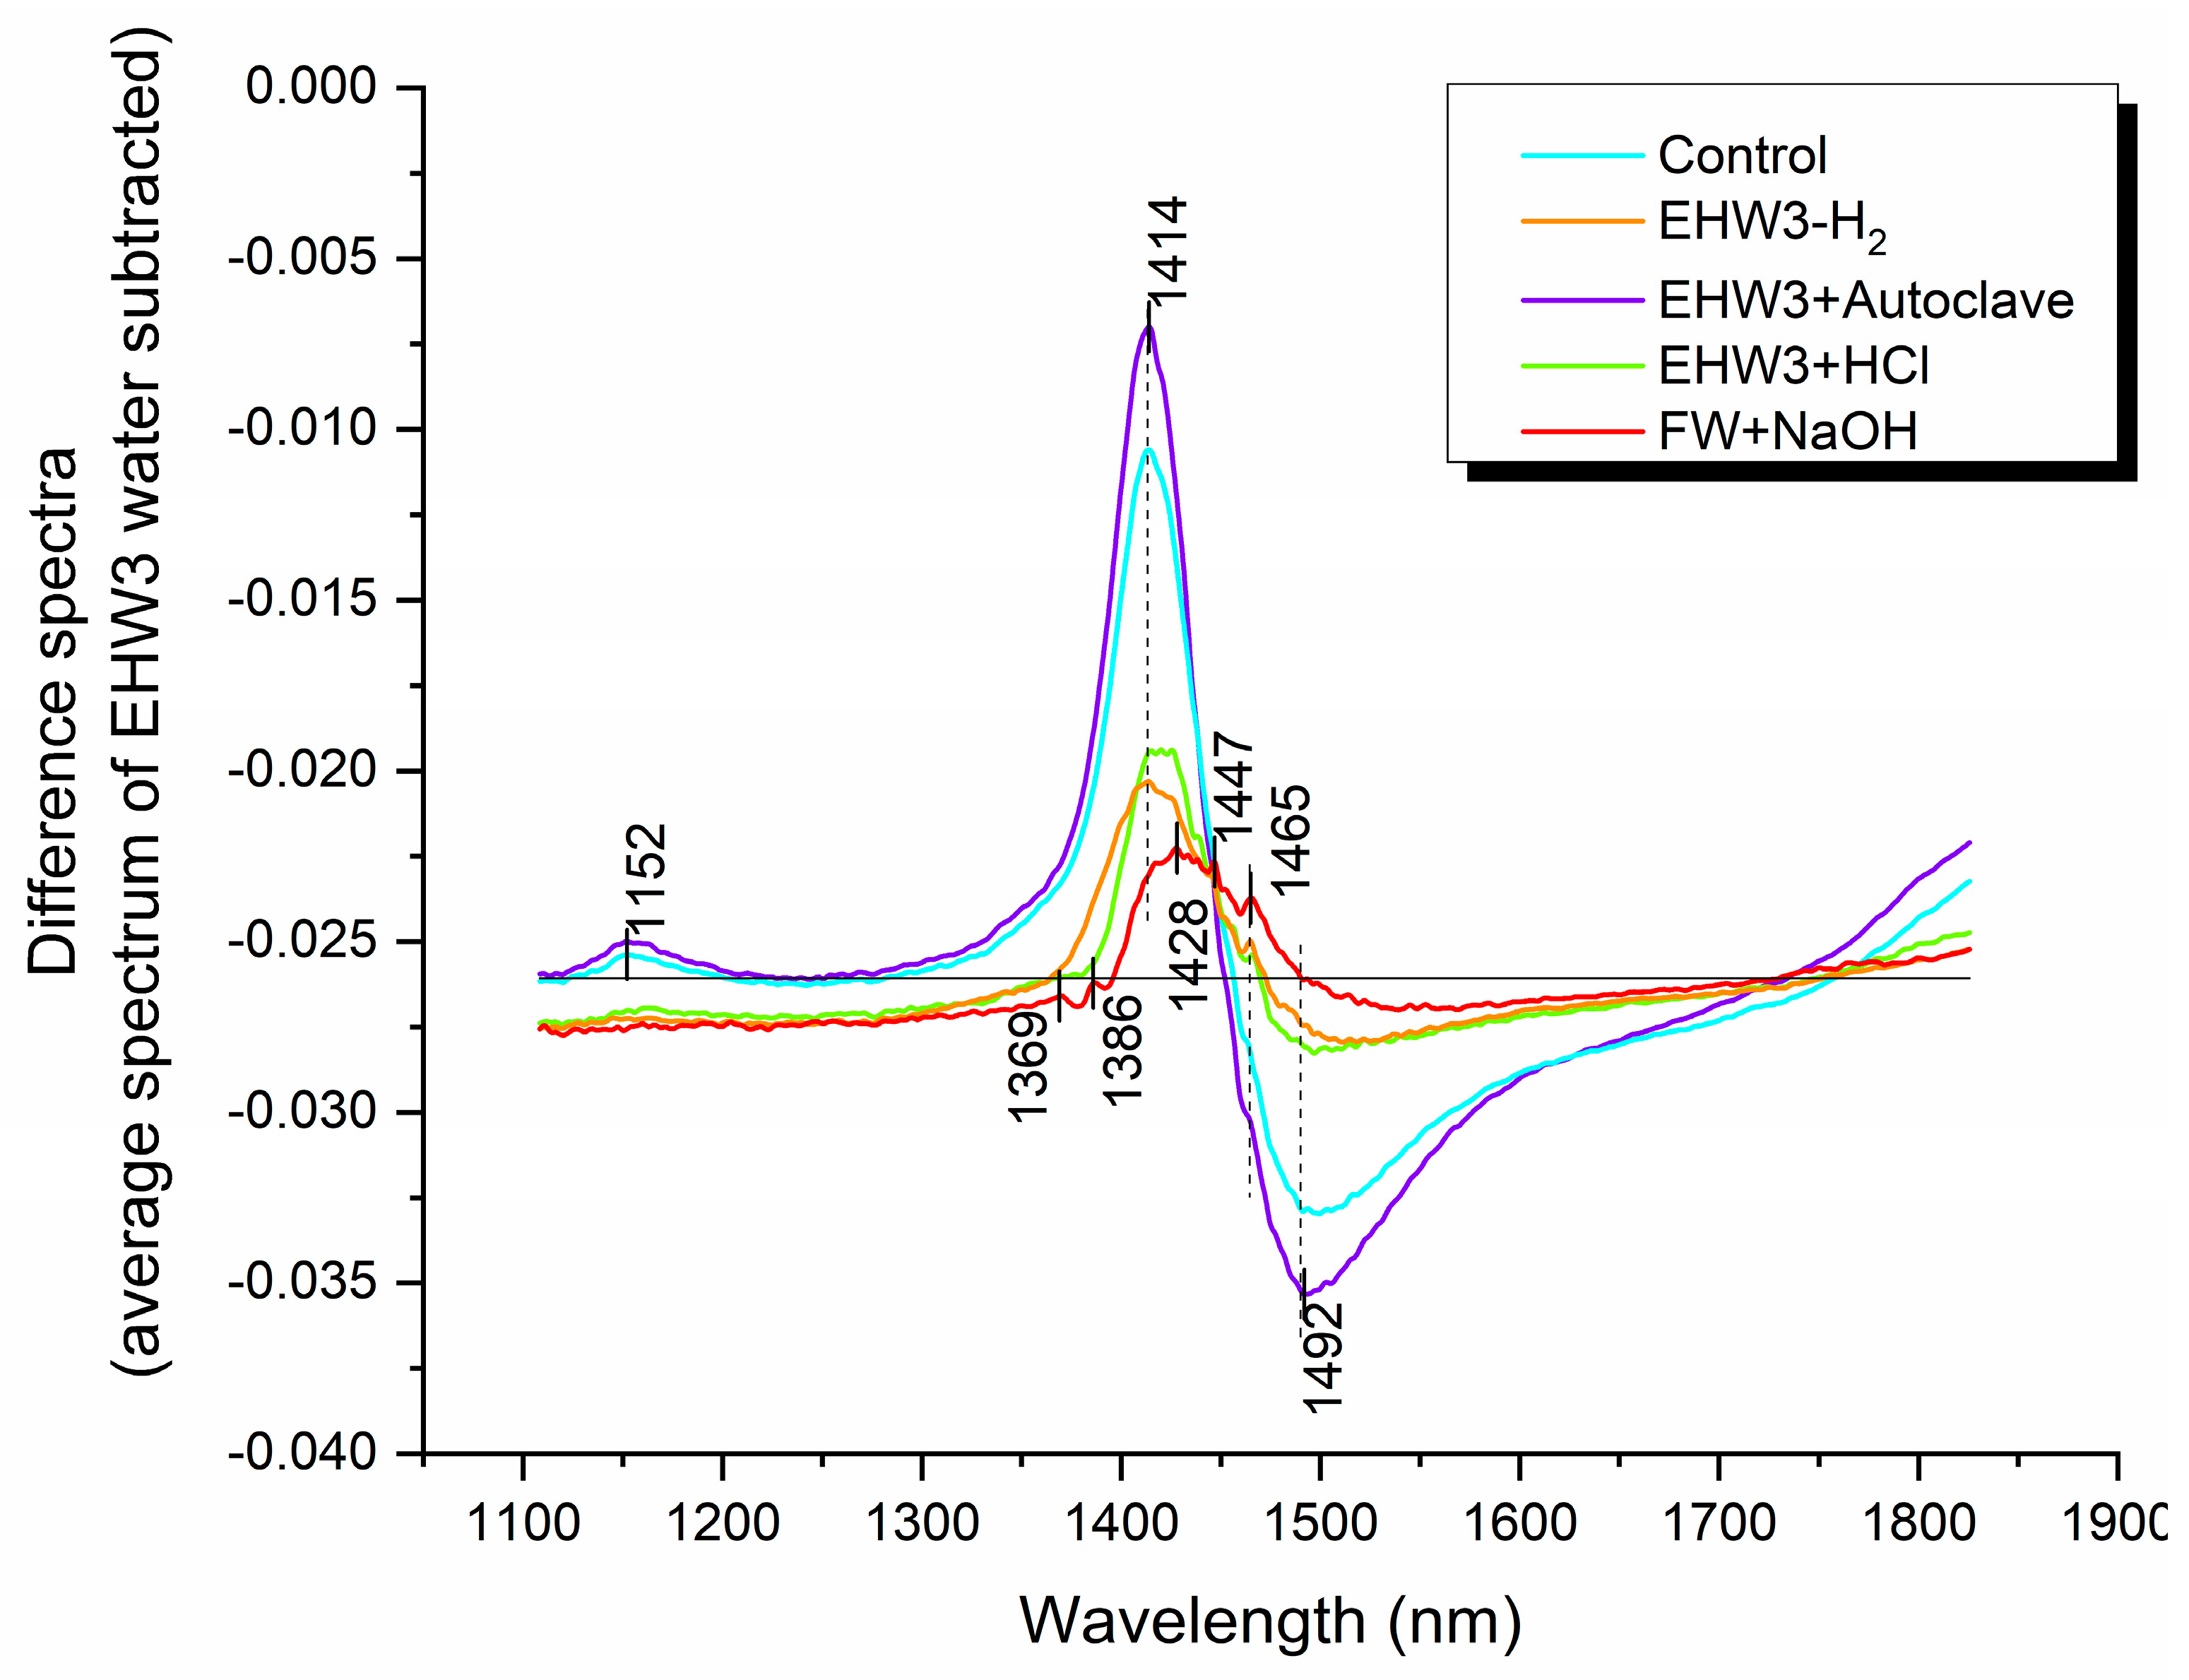
The difference spectra were calculated after averaging all the acquired spectral replicates and consecutives for each water sample and normalization to the range [0, 1]. The normalization was performed to enhance and emphasize even the subtle spectral differences. The subtraction was performed in two ways, first the average spectrum of the Control water (ultrapure water) was subtracted (
Figure 2), and second, an average spectrum of EHW3 was subtracted from the average spectra of all other water types (
Figure 3). In the first case it is possible to compare how each water is different compared to the pure water, while in the second case, how each treatment (autoclaving, degassing) is affecting the EHW3 water.
The difference spectra depicted in Figure 2 reveal variations in baseline offset, suggesting the presence of distinct scattering structures in the water samples compared to the Control water. Notably, the spectral profiles of EHW3 water and EHW3+Autoclave water are positioned on the positive side of the Y-axis, indicating that, on average, their baselines are higher than that of pure water. Additionally, the baselines of EHW3 water and EHW3+Autoclaving exhibit remarkable similarity. This observation implies that autoclaving may not exert a significant influence on the scattering elements present in EHW3 water.
The difference spectra presented in Figure 2 also provide some insights into the distinctive characteristics of each water type compared to pure water in terms of water molecular species. Prominent peaks are discernible at around 1405 and 1412 nm, as well as at 1463, 1486, and 1490 nm. These peaks are attributed to the absorbance of free water molecules (1405 nm, 1412 nm) and hydrogen-bonded water (1463 nm, 1486 nm, 1490 nm), respectively [35]. The shape of the spectral profiles in the difference spectra strongly resembles the “temperature effect,” characterized by peaks at 1412 nm and 1490 nm, indicating that a substantial portion of the differences stems from temperature-related factors [59]. Interestingly, only the EHW3+Autoclave water exhibits a spectral pattern that appears reversed, with an upward peak at 1405 nm, and downward peak around 1486 nm.
The difference spectra illustrated in Figure 3 provide a comprehensive comparison of all water samples to EHW3 (zero line). As expected, all difference spectra register below zero (negative), affirming that the spectral baseline for EHW3 was higher. This suggests that EHW3 water scatters light to a greater extent compared to the other water samples, indicative of the presence of scattering structures such as water nanoscale molecular conformations, particles, gas bubbles, or nanobubbles. The most significant differences in terms of water molecular structures among the waters manifest at absorbance bands corresponding to free water molecules (1414 nm), hydration water (1428 nm), water solvation shells (1369 nm, 1386 nm), and hydrogen-bonded water with different numbers of hydrogen bonds (1465 nm, 1492 nm) [35].
3.3. Soft Modeling of Class Analogies (SIMCA) – Discriminating Analysis
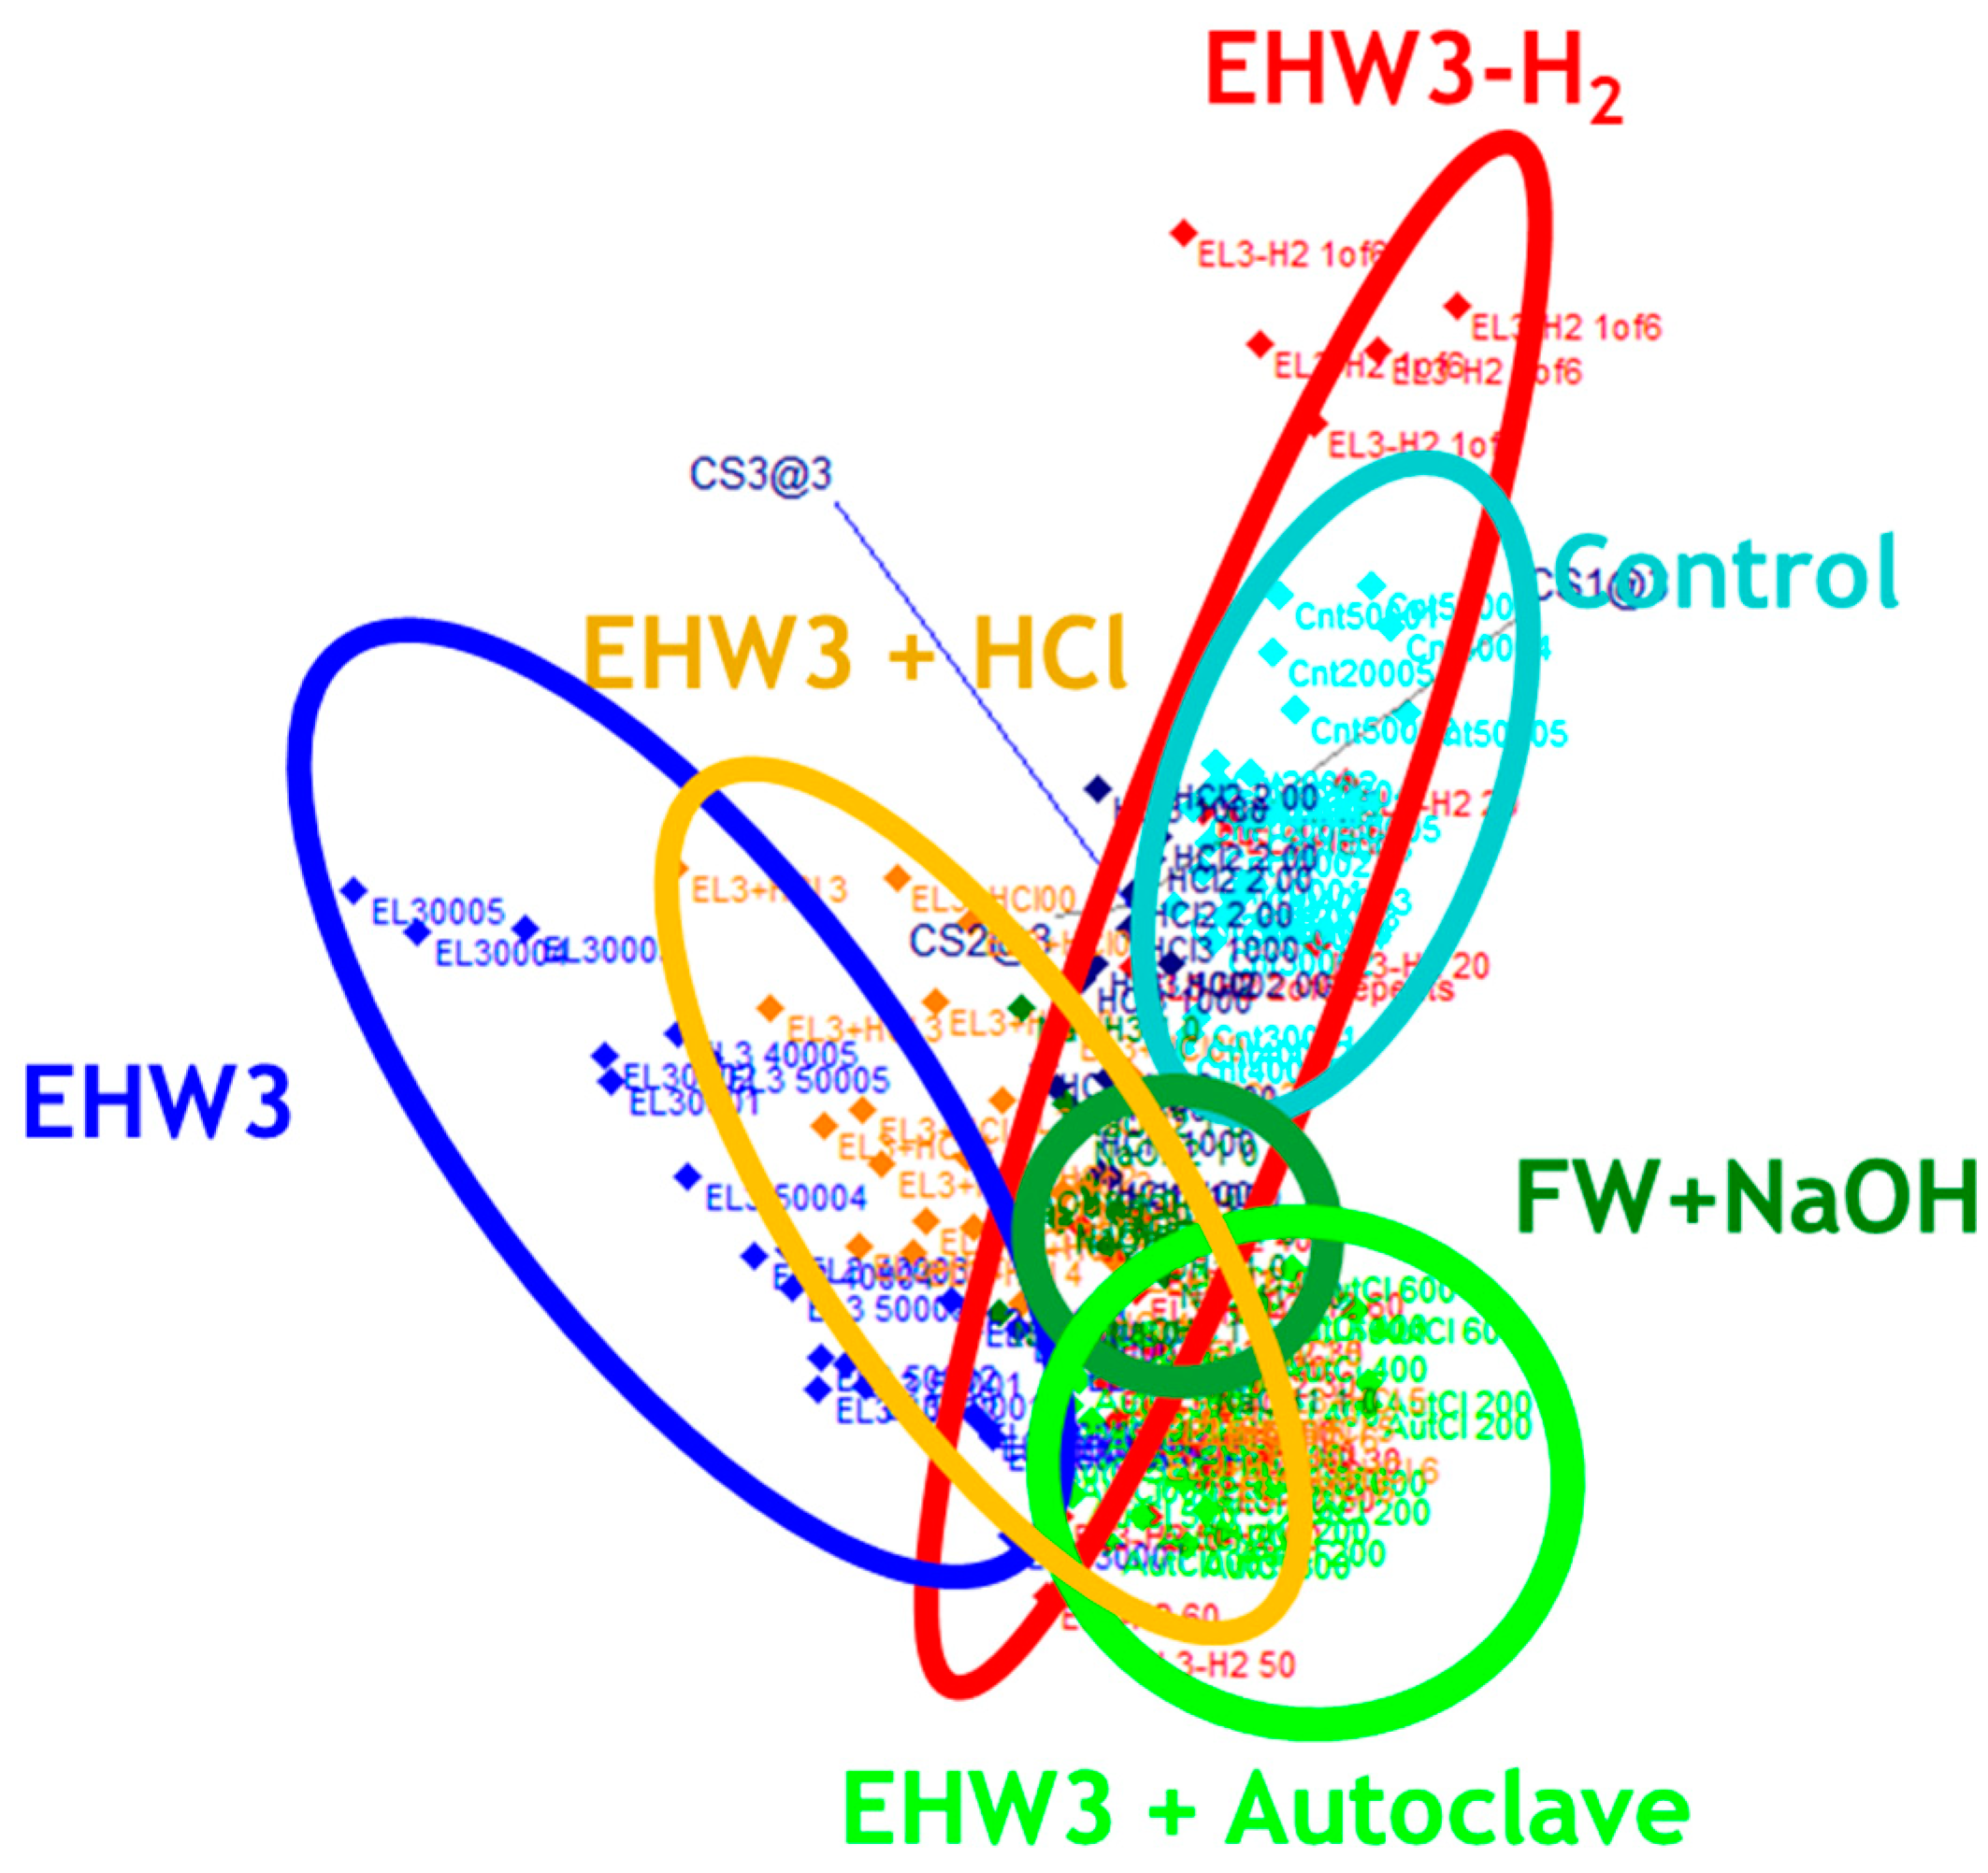
The objective of SIMCA analysis was to investigate if the raw spectra of different waters can be classified according to the type of the water. The results of SIMCA analysis (
Figure 4) showed that the spectra (represented by dots in Figure 4) are all grouped in distinctive clusters according to the type of the water sample and accuracy of discrimination was almost 80 %. The interclass distance between the water clusters was large in all cases, except between EHW3 water and autoclaved EHW3 water, as well as between EHW3 water and EHW3 water with added HCl (
Table 2). According to previous reports the interclass distance of less than 0.8 indicates a small difference between two groups while the distance of more than 3 supports a reliable separation [60,61].
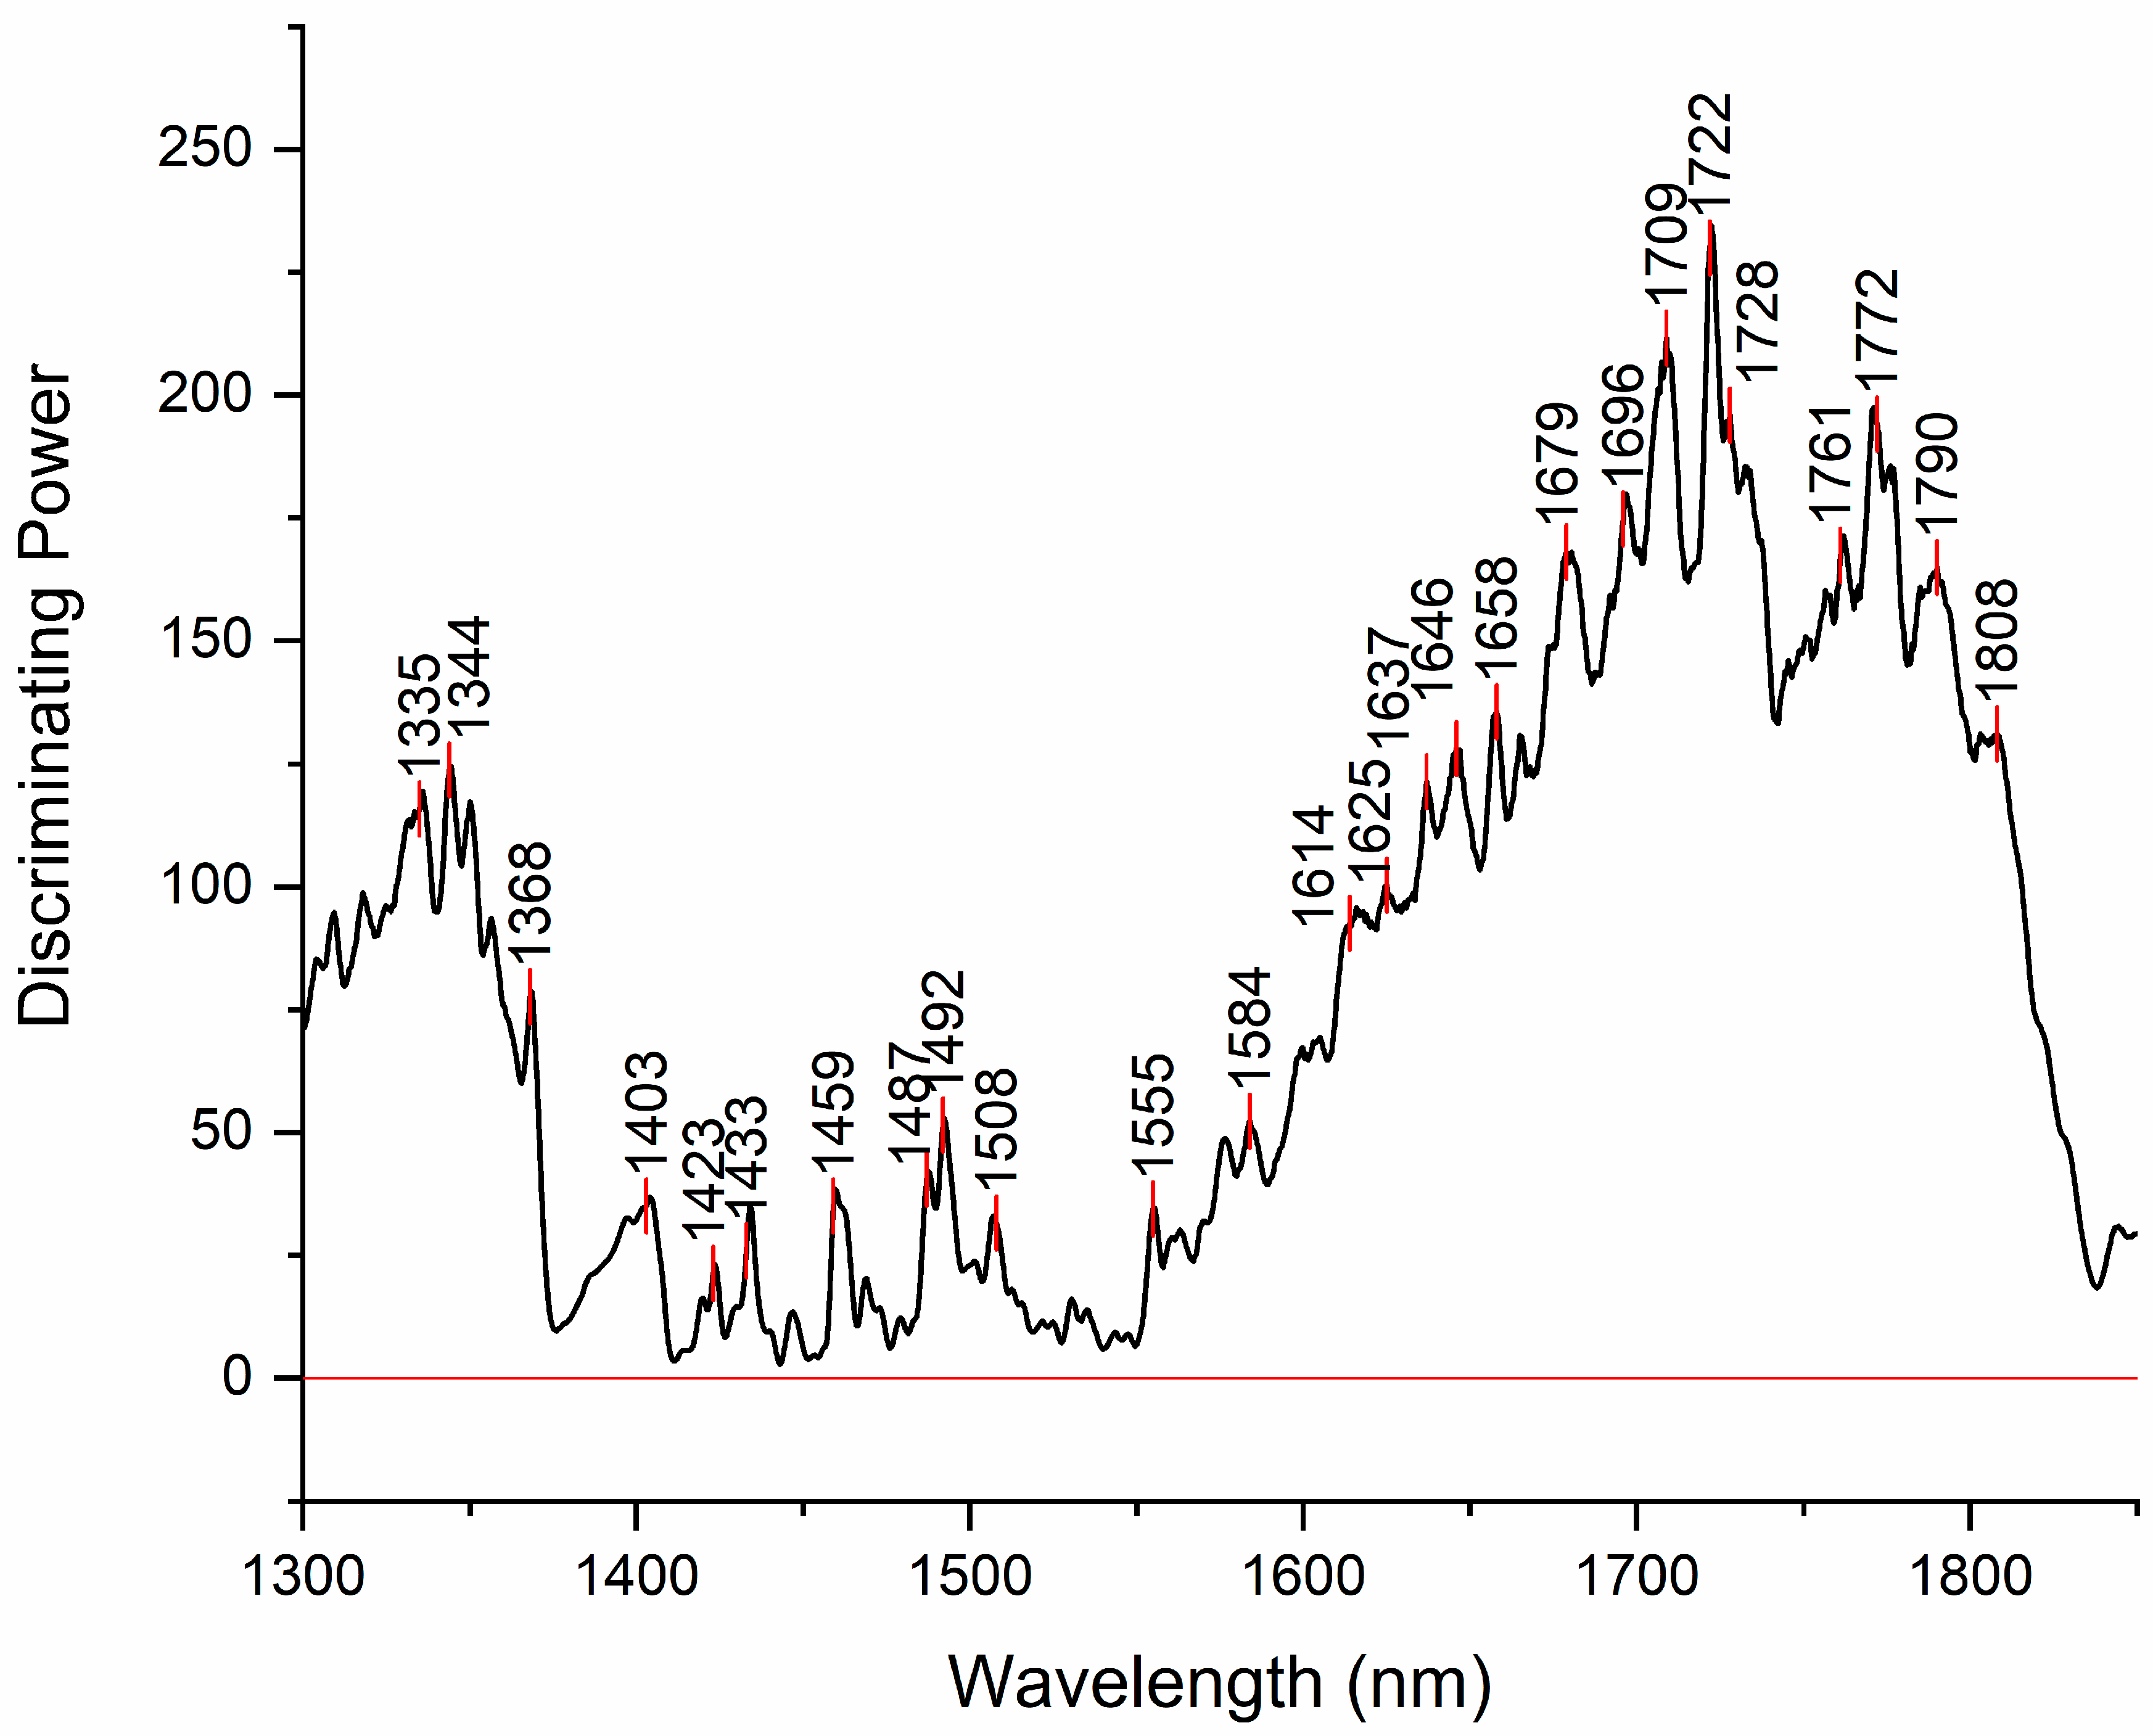
Discriminating power of SIMCA analysis shows which absorbance bands in the spectra have highest power to discriminate between the investigated water samples (
Figure 5). The band with the highest discriminative power was 1722 nm. This band is located close to the absorbance bands of hydrated proton H
3O
+ (hydronium ion) which absorb at 1724.0-1724.1 nm [62,63], or hydrated hydroxide ion clusters (such as OH
-(H
2O)
4) which absorb at 1724.15 nm [64]. This might indicate that the band can be assigned to the water molecules located in solvation shells around ions. Alternatively, the band can also be assigned to the CH stretching vibration of CH
2 [65,66].
The other region with high discriminating power is located around 1344 nm. In the vicinity of this band there are many absorbance bands that can be attributed to free OH stretch of water molecules in proton hydrates [67–74] or protonated clathrate cages enclosing neutral water molecules [75]. Another band located close is 1368 nm, already observed in the difference spectra, that can be assigned to solvation shells of ions. There are other bands already observed in the difference spectra, that appear to add to discriminating power, such as 1423 nm, 1459 nm, 1487 and 1492 nm that can be assigned to hydration water, physi-adsorbed water and water molecules with 4 hydrogen bonds respectively [35,37,46].
The first two bands are very close to the bands 1428 nm and 1455 nm, which are together found to indicate free and weakly H-bonded OH groups related to hydration of amorphous structures of CH containing compounds identified by the absorption band at 1722 nm [76]. The presence of all three bands in discriminating power indicates possibility of presence of hydrated CH containing structures. Additionally, the bands 1482 nm and 1772 nm, that can also be seen featured in discriminating power were found in another work related to presence of granules [77]. Granules in the case of examined water samples might be granulated nanoparticles and/or biochar granules. Both types can be produced during production of EH water – nanoparticles from electrodes, while biochar can be generated due to activated carbon filter use [78,79].
The band located at 1614 nm may be assigned to OH stretching vibration of first hydration layer of hydration water [80–82]. The band 1625 nm is close in location to bands that can be attributed to OH stretching vibration of interlayer water molecules bound to ions (1629 nm)[83] and OH stretching of hydration water (1628 nm)[84]. However, there are also reports that attribute bands in this area to aromatic C-H bands (around 1630, 1633 nm) [85–87]. The band at 1637 may be attributed to vibrations of the bridging bonds between carbonate ions and water in the interlayer region (1639 nm)[88] but also to CH symmetric stretch in aromatic compounds (1639 nm)[89,90]. Many bands in the region 1650 to 1700 nm can be attributed to vibration of water molecules in proton hydrates [68–70,91], as well as to CH stretching in aromatic [92–94].
Determining exact band assignments within the range of 1600 to 1800 nm poses a challenge due to the overlapping absorption of both OH and CH groups. Nevertheless, given that the samples under investigation are primarily composed of water, it is more probable that the observed spectral features stem rather from water or its interaction with other compounds, rather than trace amounts of compounds containing CH groups.
3.4. Partial Least Squares Regression (PLSR) Analysis
PLSR analysis was performed with the objective of development of regression model for prediction of values of dissolved hydrogen using NIR spectra of examined waters.
The spectra were trimmed to the 1300 – 1850 nm region and used for model development without any preprocessing, and with preprocessing (standard normal variate – SNV transformation [54]) to remove baseline effects.
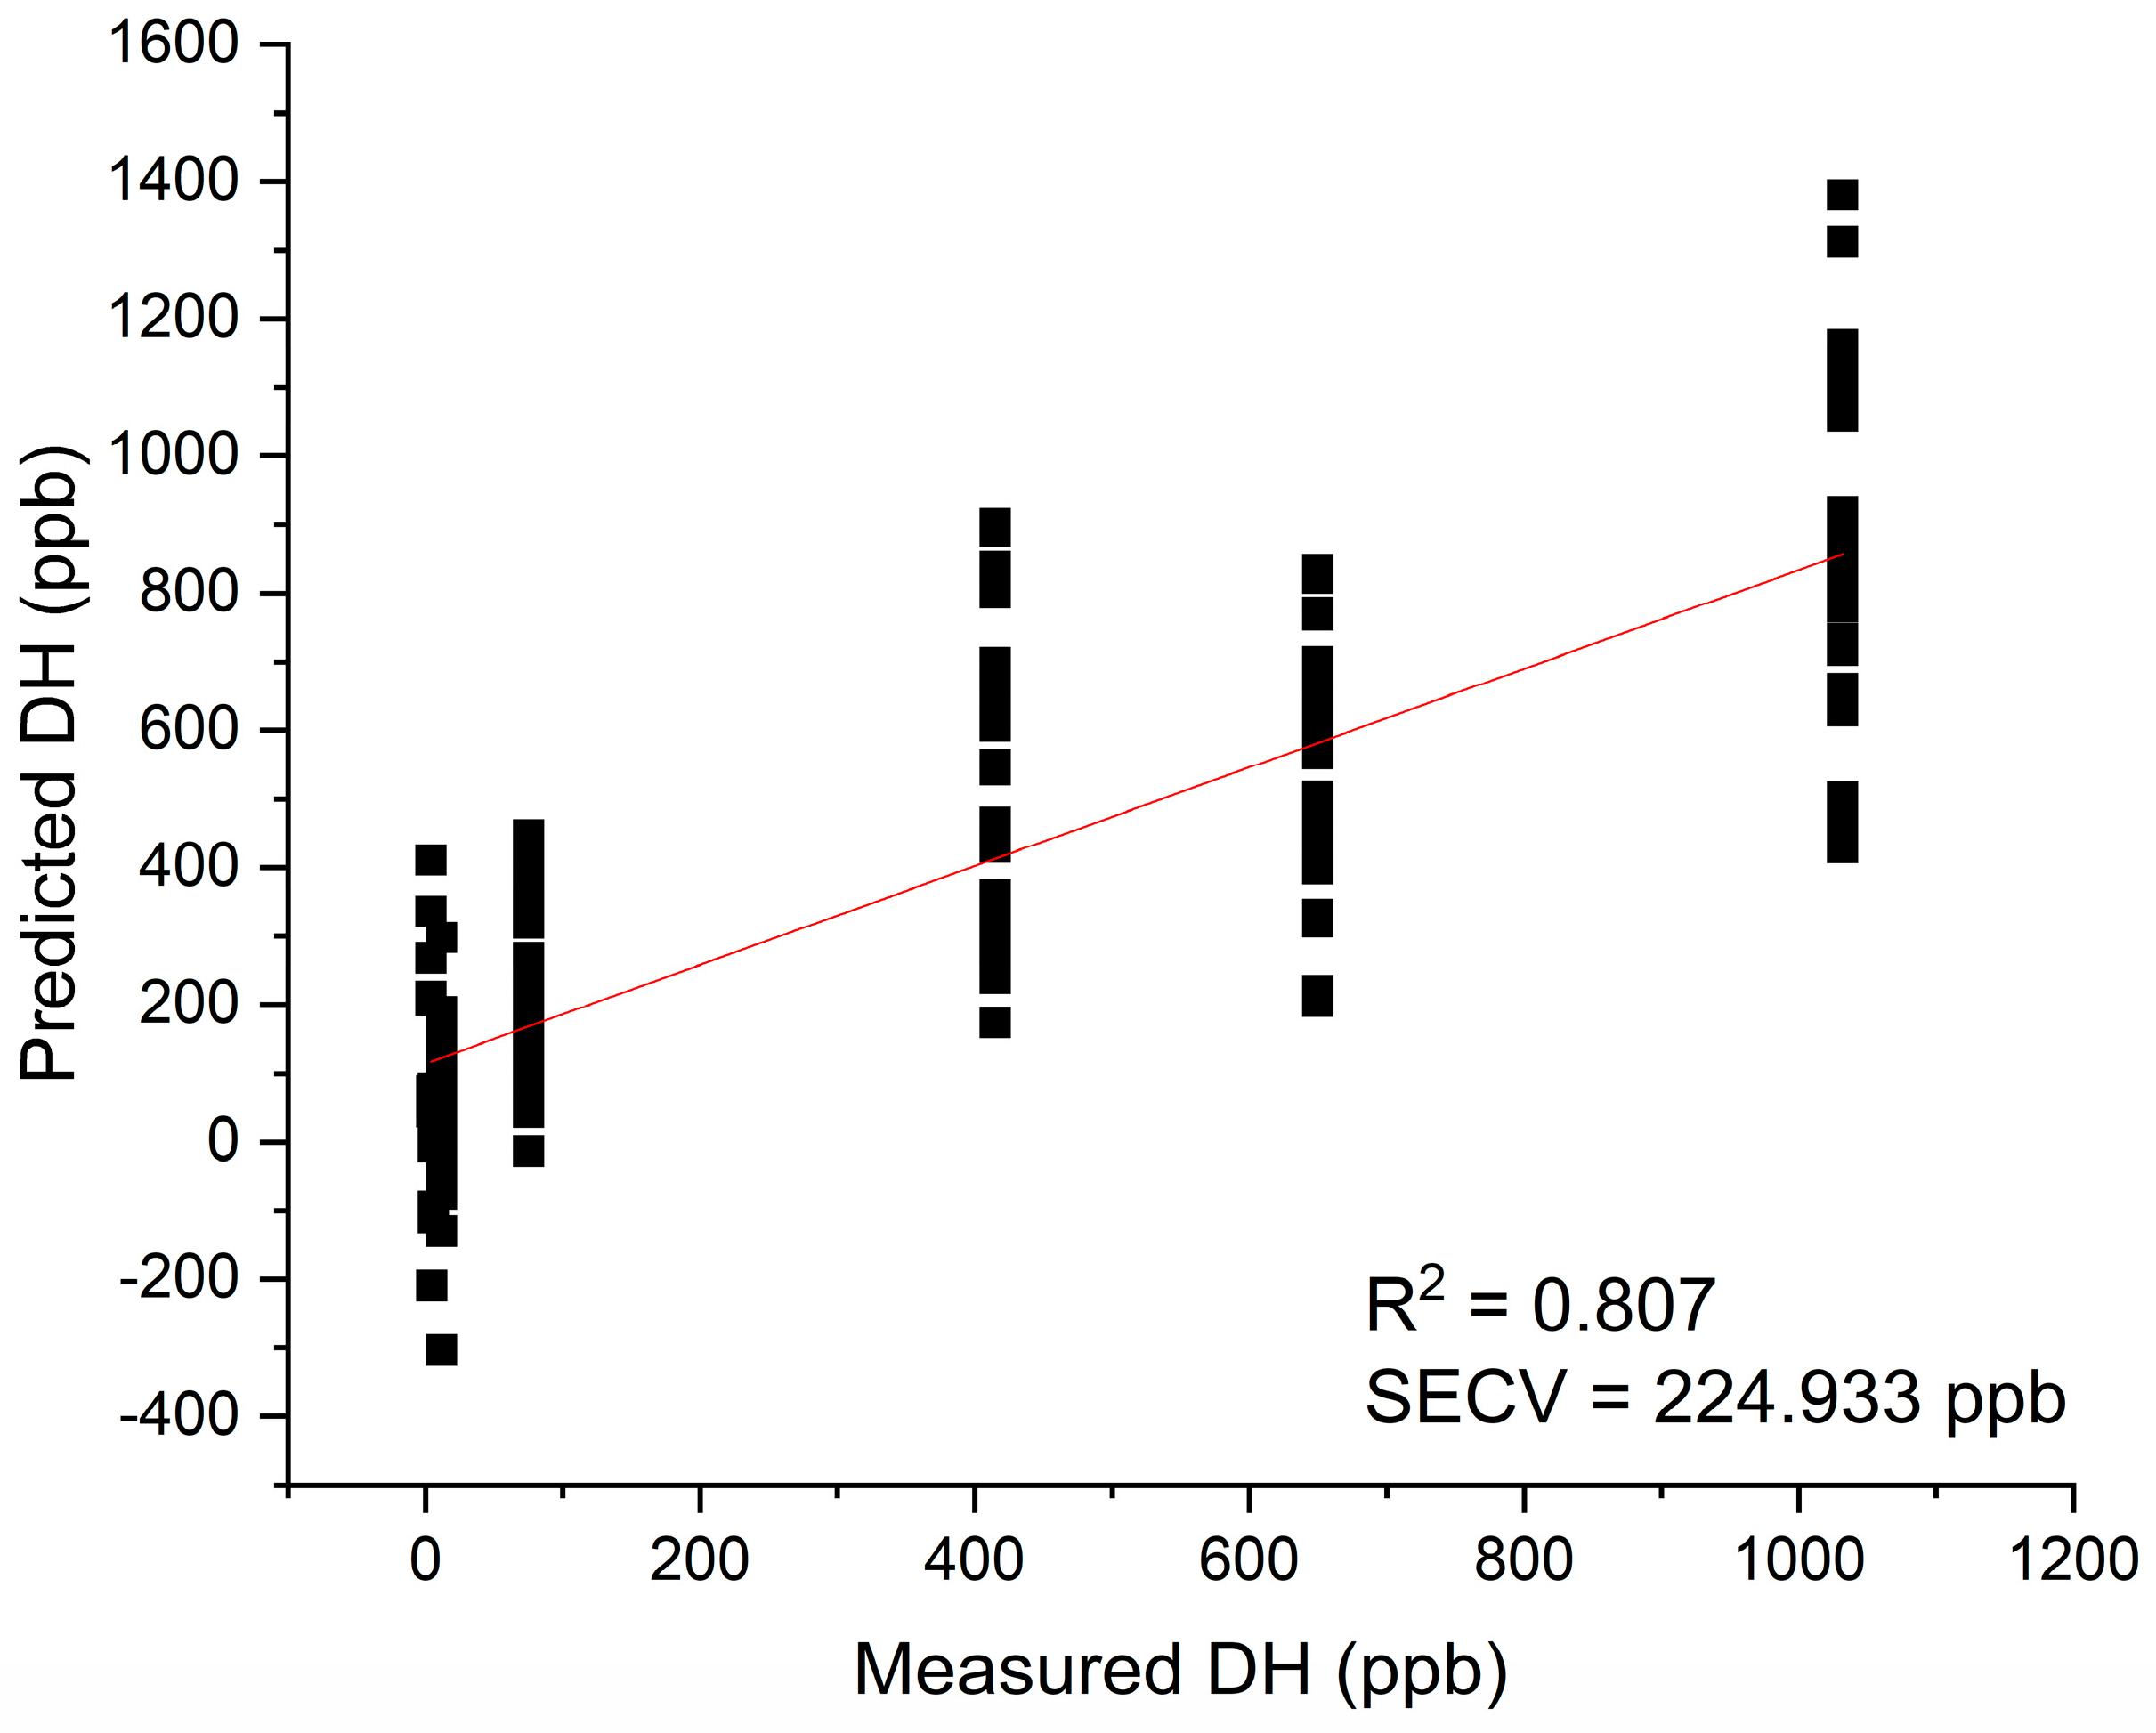
The model built using raw spectra (without any preprocessing) was successfully developed using 7 latent variables, and resulted in high coefficient of determination R
2= 0.807 and standard error of cross-validation SECV=224.933 ppb (
Figure 6).
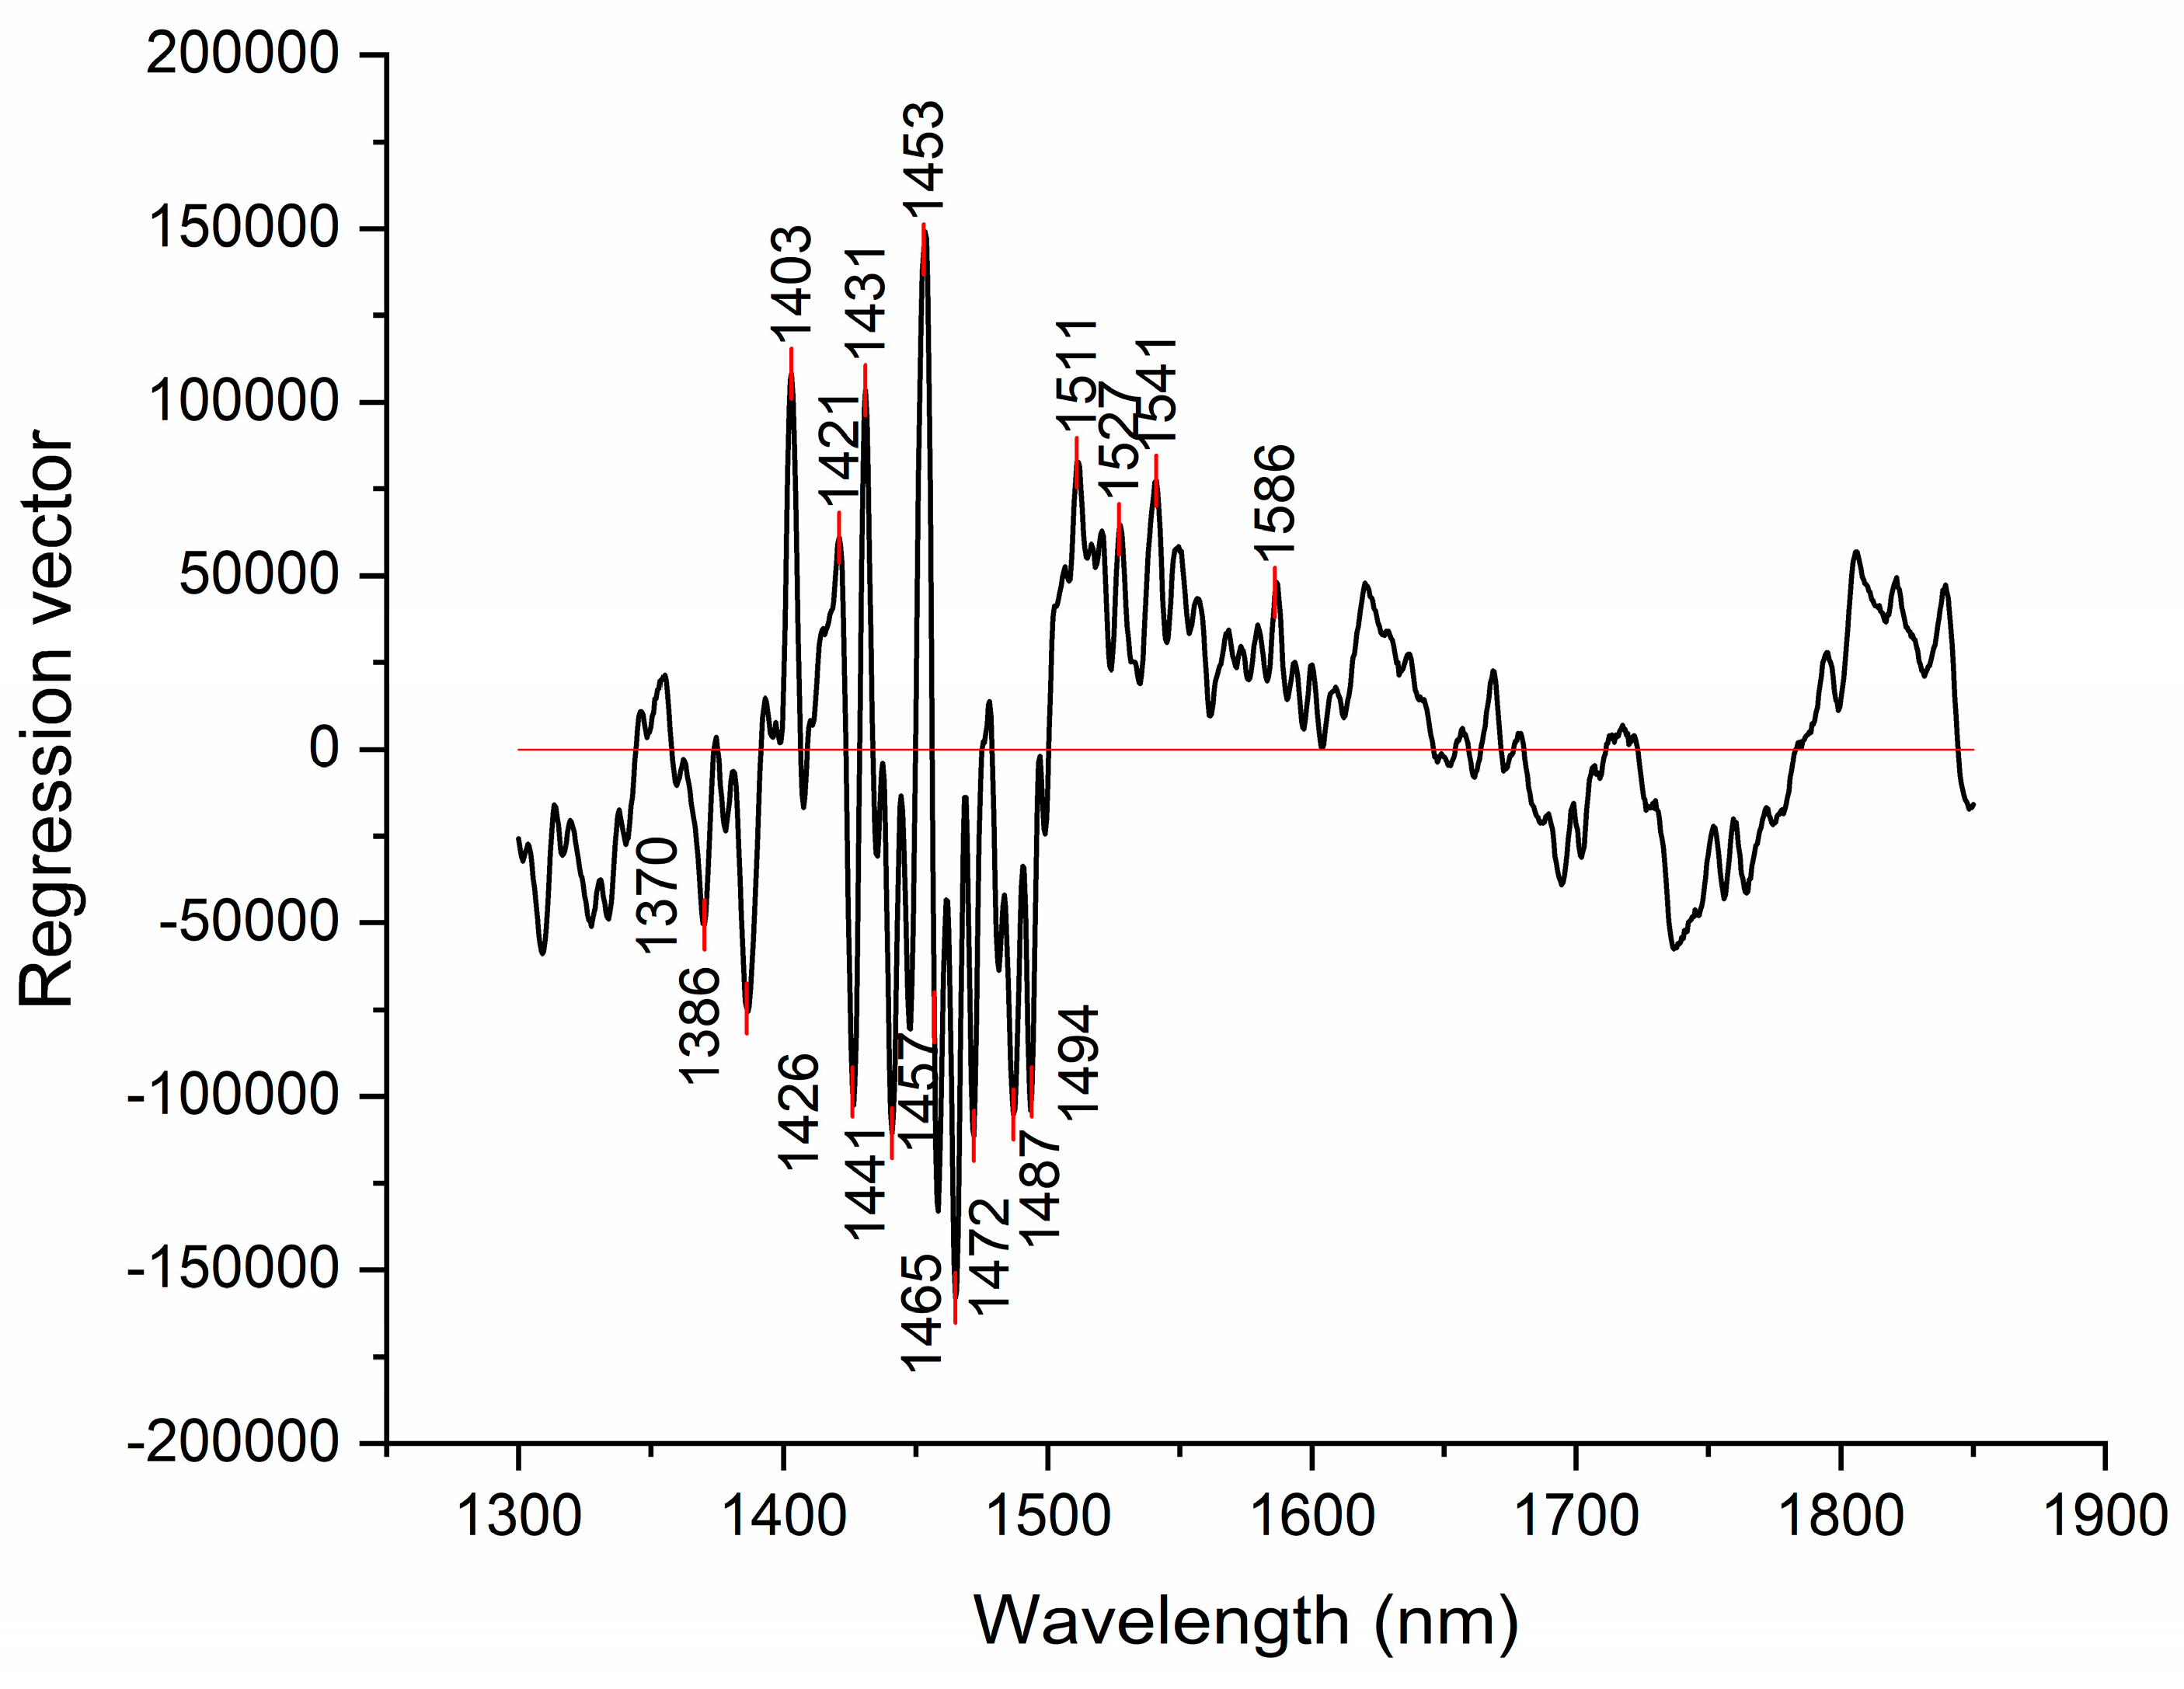
Similar to discriminating power of SIMCA analysis, regression vector of PLSR analysis can offer insights into which absorbance bands were most important for modeling the dissolved hydrogen values. The regression vector provided in
Figure 7, shows that the absorbance bands with highest regression coefficients are located at 1453 nm (physi-adsorbed water), followed by the absorbance bands 1441, 1465, 1472, 1487 and 1494 nm hydrogen bonded water with 1, 2, 3 and 4 hydrogen bonds respectively) [35,46].
The absorbance bands with also high regression coefficients in regression vector are also identified at 1403, 1421, 1426 and 1431 nm. These bands also appeared during previous analysis and can similarly be attributed to free water molecules and hydration water [35].
The interesting finding of this analysis was that model could not be built when SNV preprocessing was applied, suggesting that removal of baseline effects resulted in loss of information related to presence of dissolved hydrogen. This means that presence of dissolved hydrogen at least partially, contributes to the observed light scattering and baseline offset.
3.5. Aquagrams
During previous analysis all the absorbance bands of water that repeatedly appeared in the difference spectra, SIMCA discriminating power and regression vector of PLSR analysis have been systematized and chosen as WAMACs – Water Matrix Coordinates to represent the spectral pattern of each of the examined water on aquagram.
The aquagrams are calculated following the procedure for classic aquagram calculation [53], followed by normalization (divided by range) and represented in
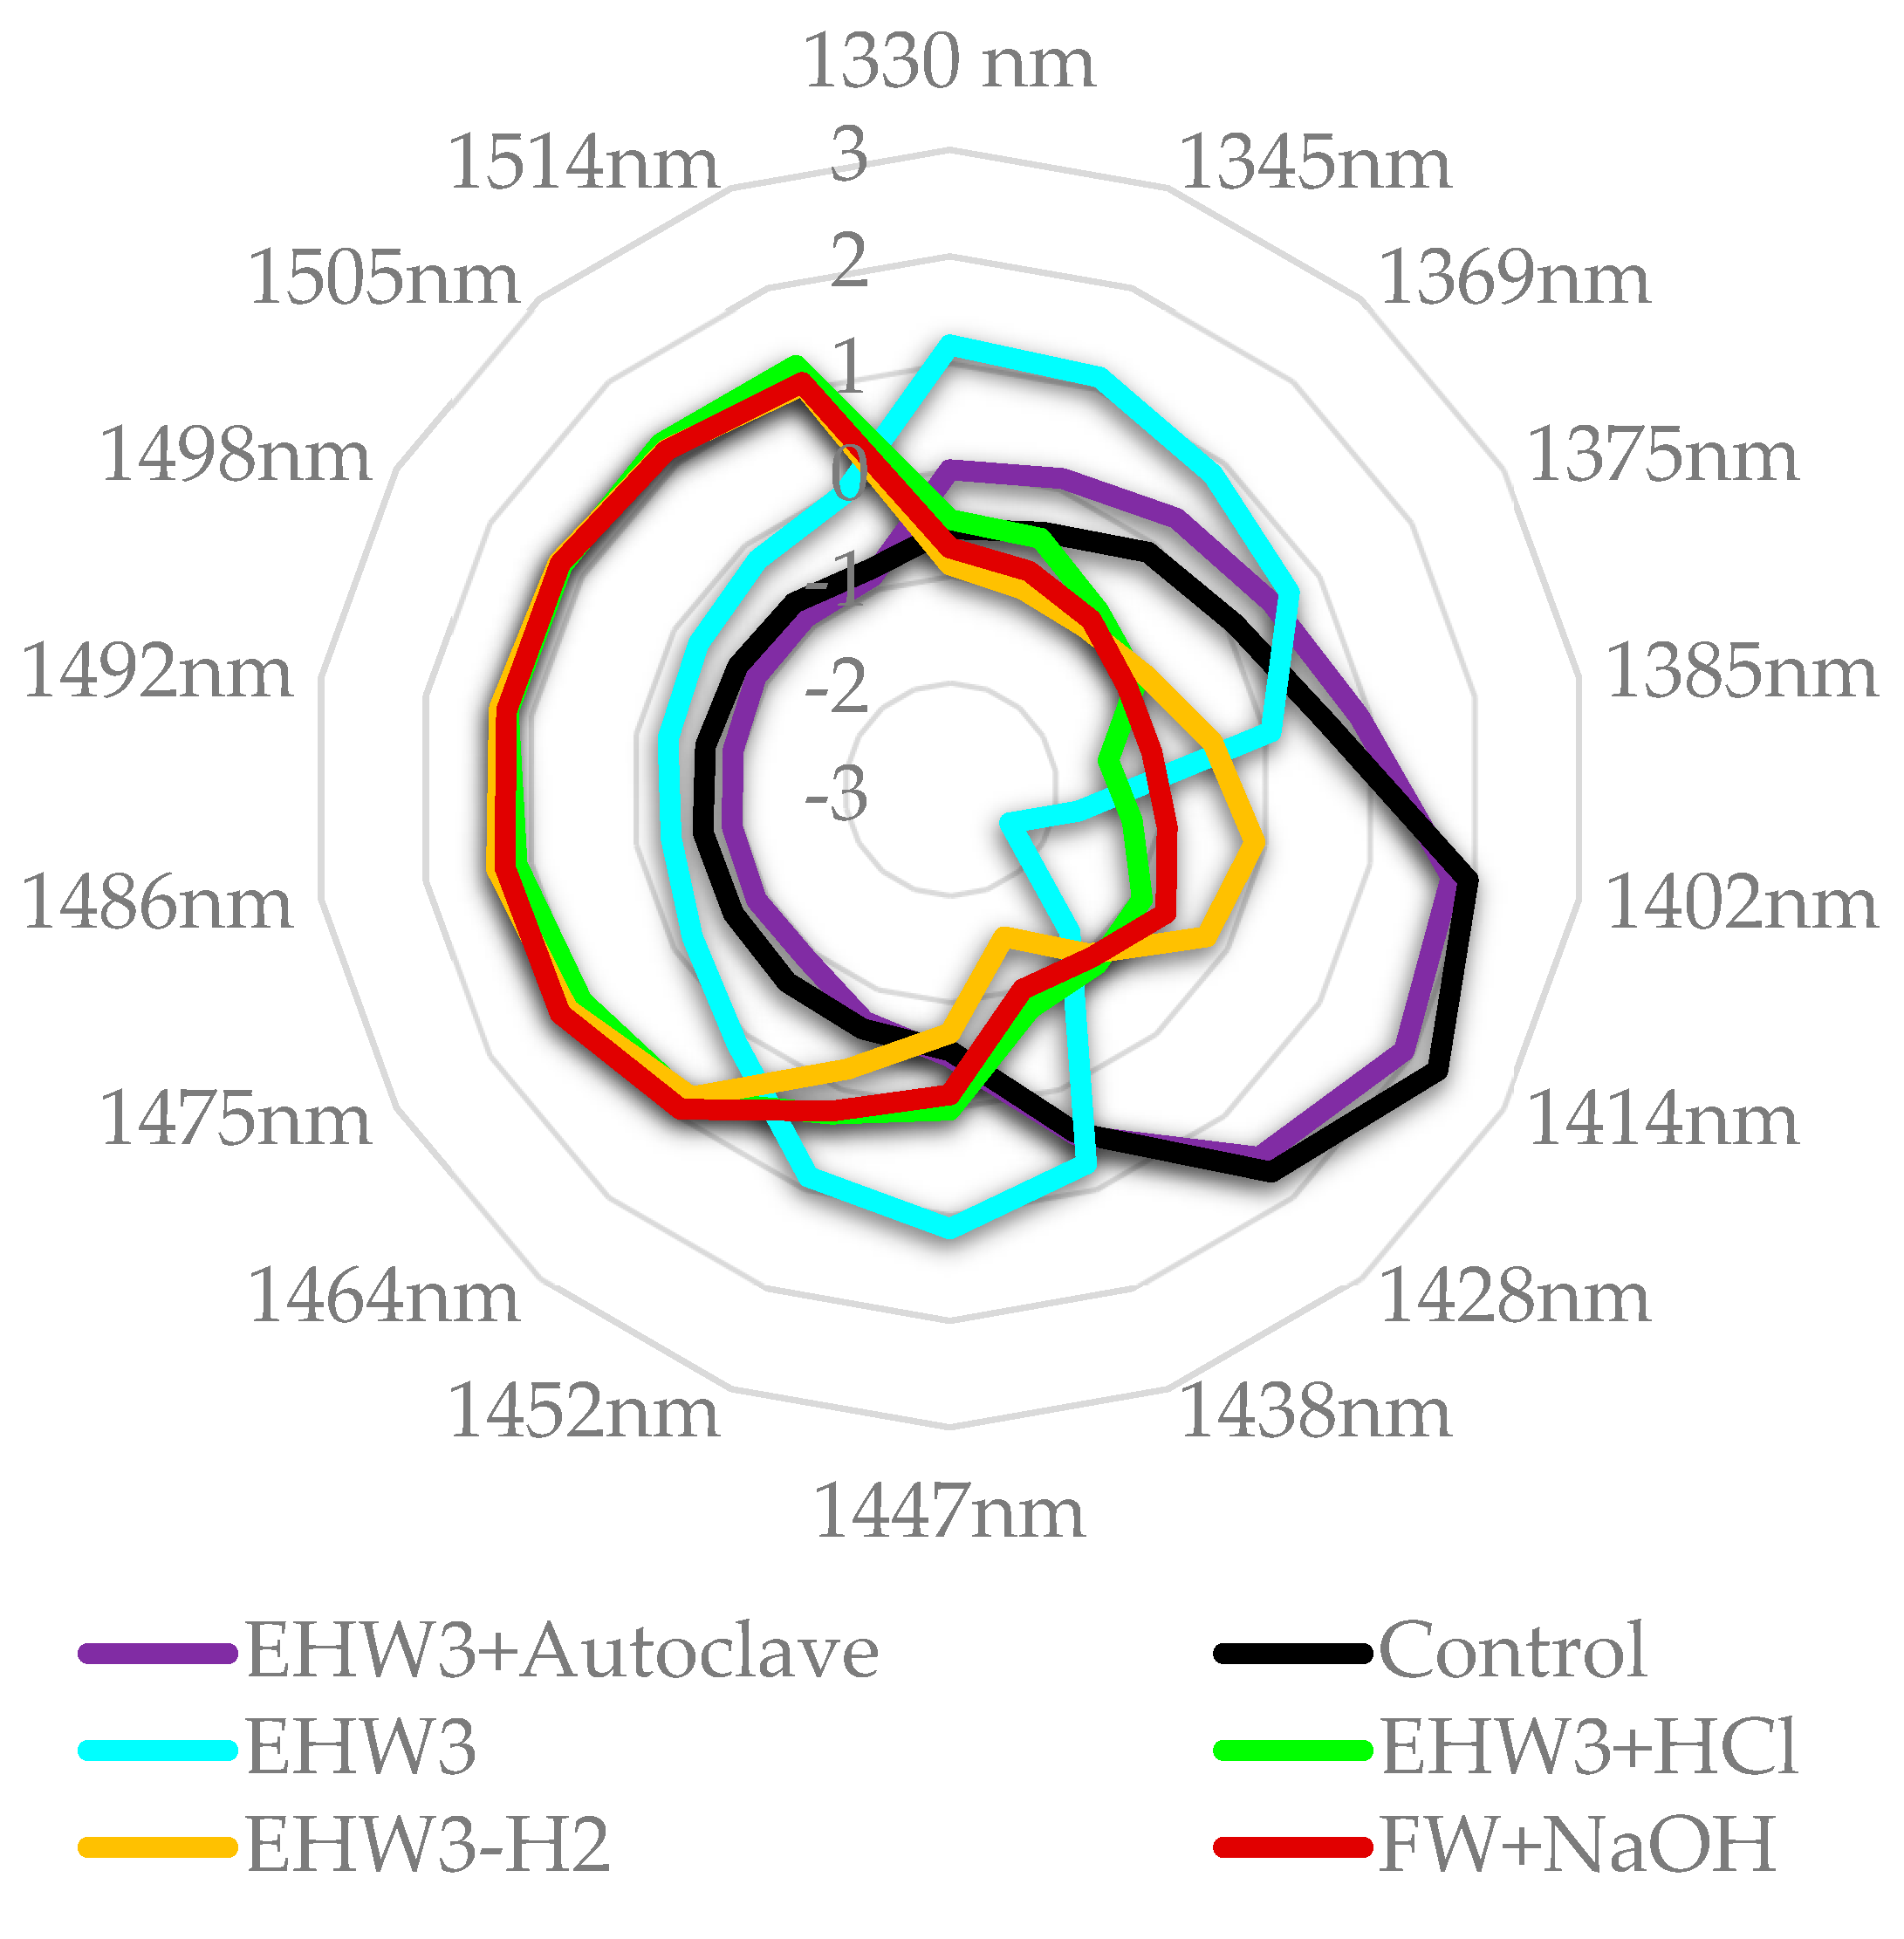
Figure 8 to understand how is the water molecular structure different between the investigated samples. The aquagram presented in
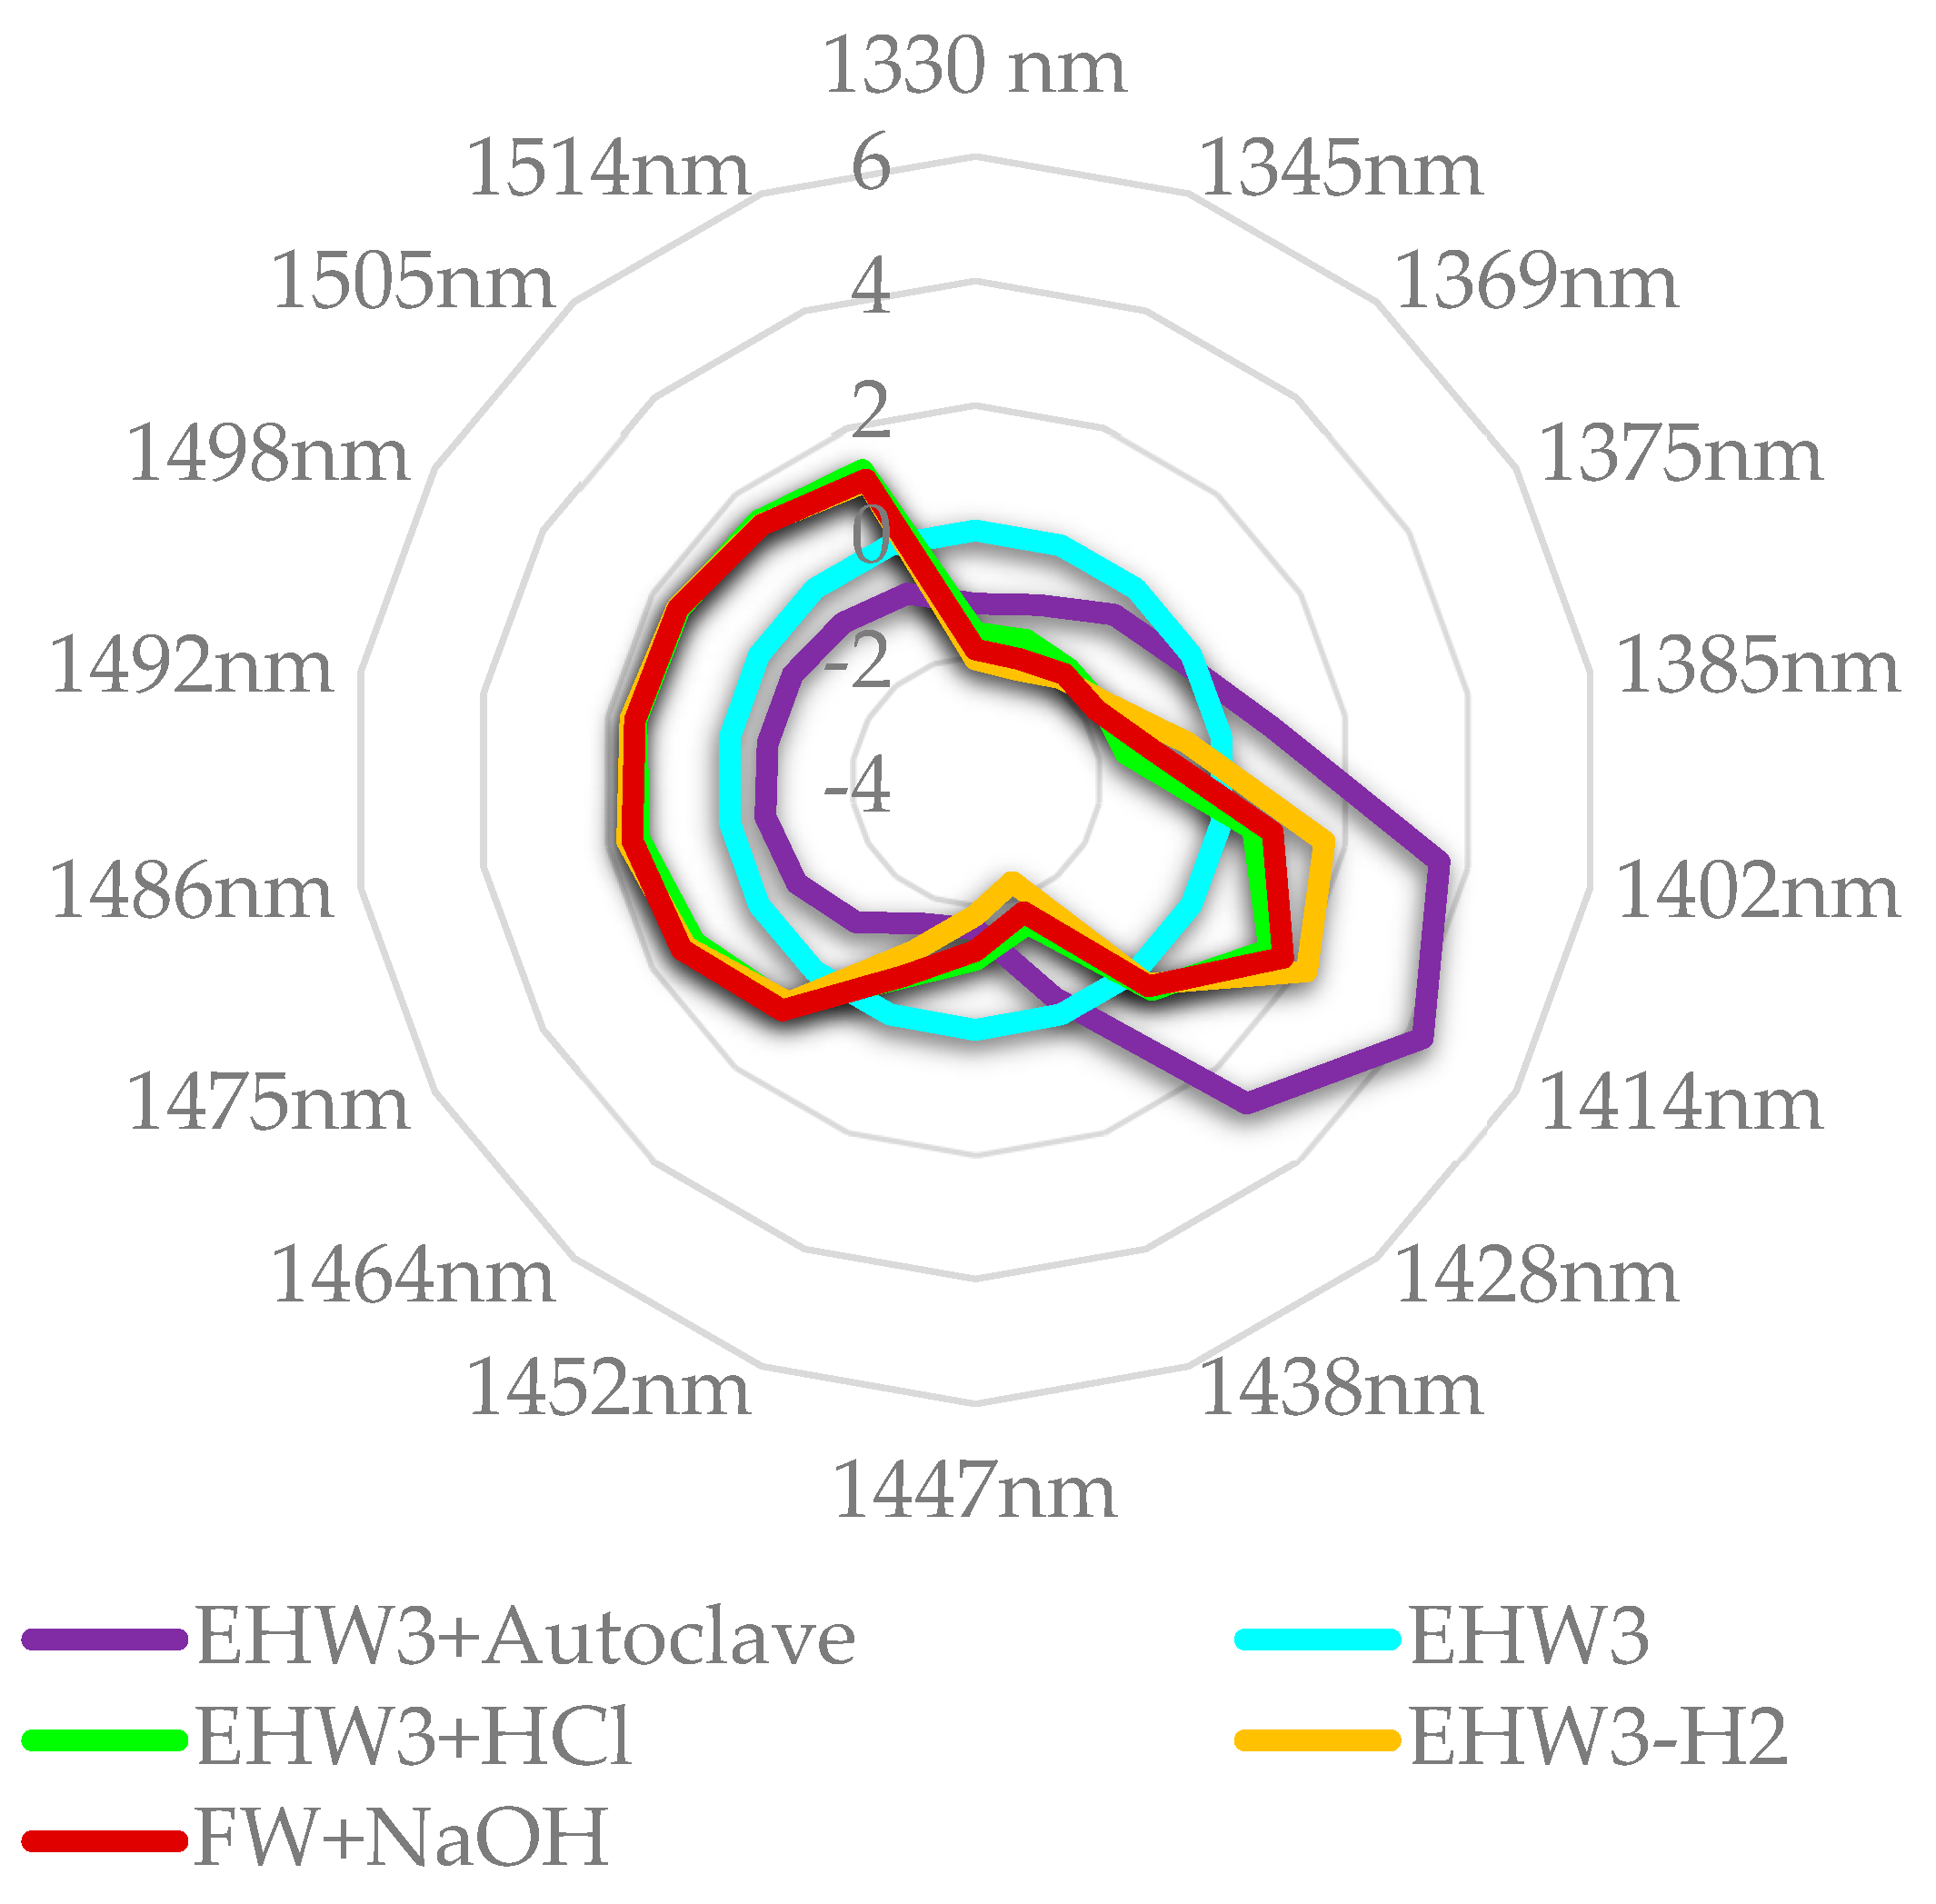
Figure 9, is calculated in the same way, but the average of EHW3 water was subtracted to highlight the changes induced by removal of H
2 and by autoclaving. This way of representation and comparison to EHW3 water shows how each treatment affects the molecular structure of water EHW3.
From the aquagram at Figure 8 it is evident that the spectral pattern of EHW3 water is very different compared to all the other samples, being characterized by the extremely low absorbance of free water molecules and high absorbance of water molecules arranged in the solvation shells around present charged solutes or ions (region 1345 – 1385 nm) [35,37,46]. The high absorbance at band 1447 nm can be related to the physi-adsorbed water, another type of water involved with hydration of the present structures (but not necessarily charged)[46]. Alternately, it can also be assigned to secondary, more bulk-like hydration layer [95], OH-metal vibration [96,97], dangling water molecules [98] or more or less ordered water at some interface [99]. The band at 1452 nm can similarly be assigned to physi-adsorbed water [46,100], or bulk water [101]. The band at 1438 nm can be assigned to so called “intermediate water”[102], and can be understood as an intermediate phase of water between liquid and solid, gel-like. There are also possible assignments linking this band to water interacting with metal [103,104].
From this, it can be understood that the treatment that produces EHW3 results in the arrangement of water molecules to participate in hydration of present solutes – ions, aggregates, bubbles of gas, charged particles, metal particles, resulting in drastically reduced amount of free water molecules.
When the waters are compared to EHW3 water, as presented in the Figure 9, it becomes very clear that both autoclaving and removal of H2 gas by stirring increases the amount of free water and decreases solvation water, adsorbed water and intermediate water. Both FW+NaOH and EHW3+HCl show the same feature, in addition to high absorbance of water molecules which are hydrogen bonded (1464 nm – 1514 nm). From these results it can be concluded that the waters differ very much in ratios of bound/free water and adsorbed/solvation water. It is interesting to note that Takeuchi et al. found that the large ratio of bound to free water is related to the property of surface tension [105]. There are also reports explaining the effects of electrolysis and the consequent properties of electrolyzed alkaline water in the terms of decreased surface tension [106,107]. But the important insight here is that behind these changed properties is the alteration of water molecular network and ratio of bound to free water.
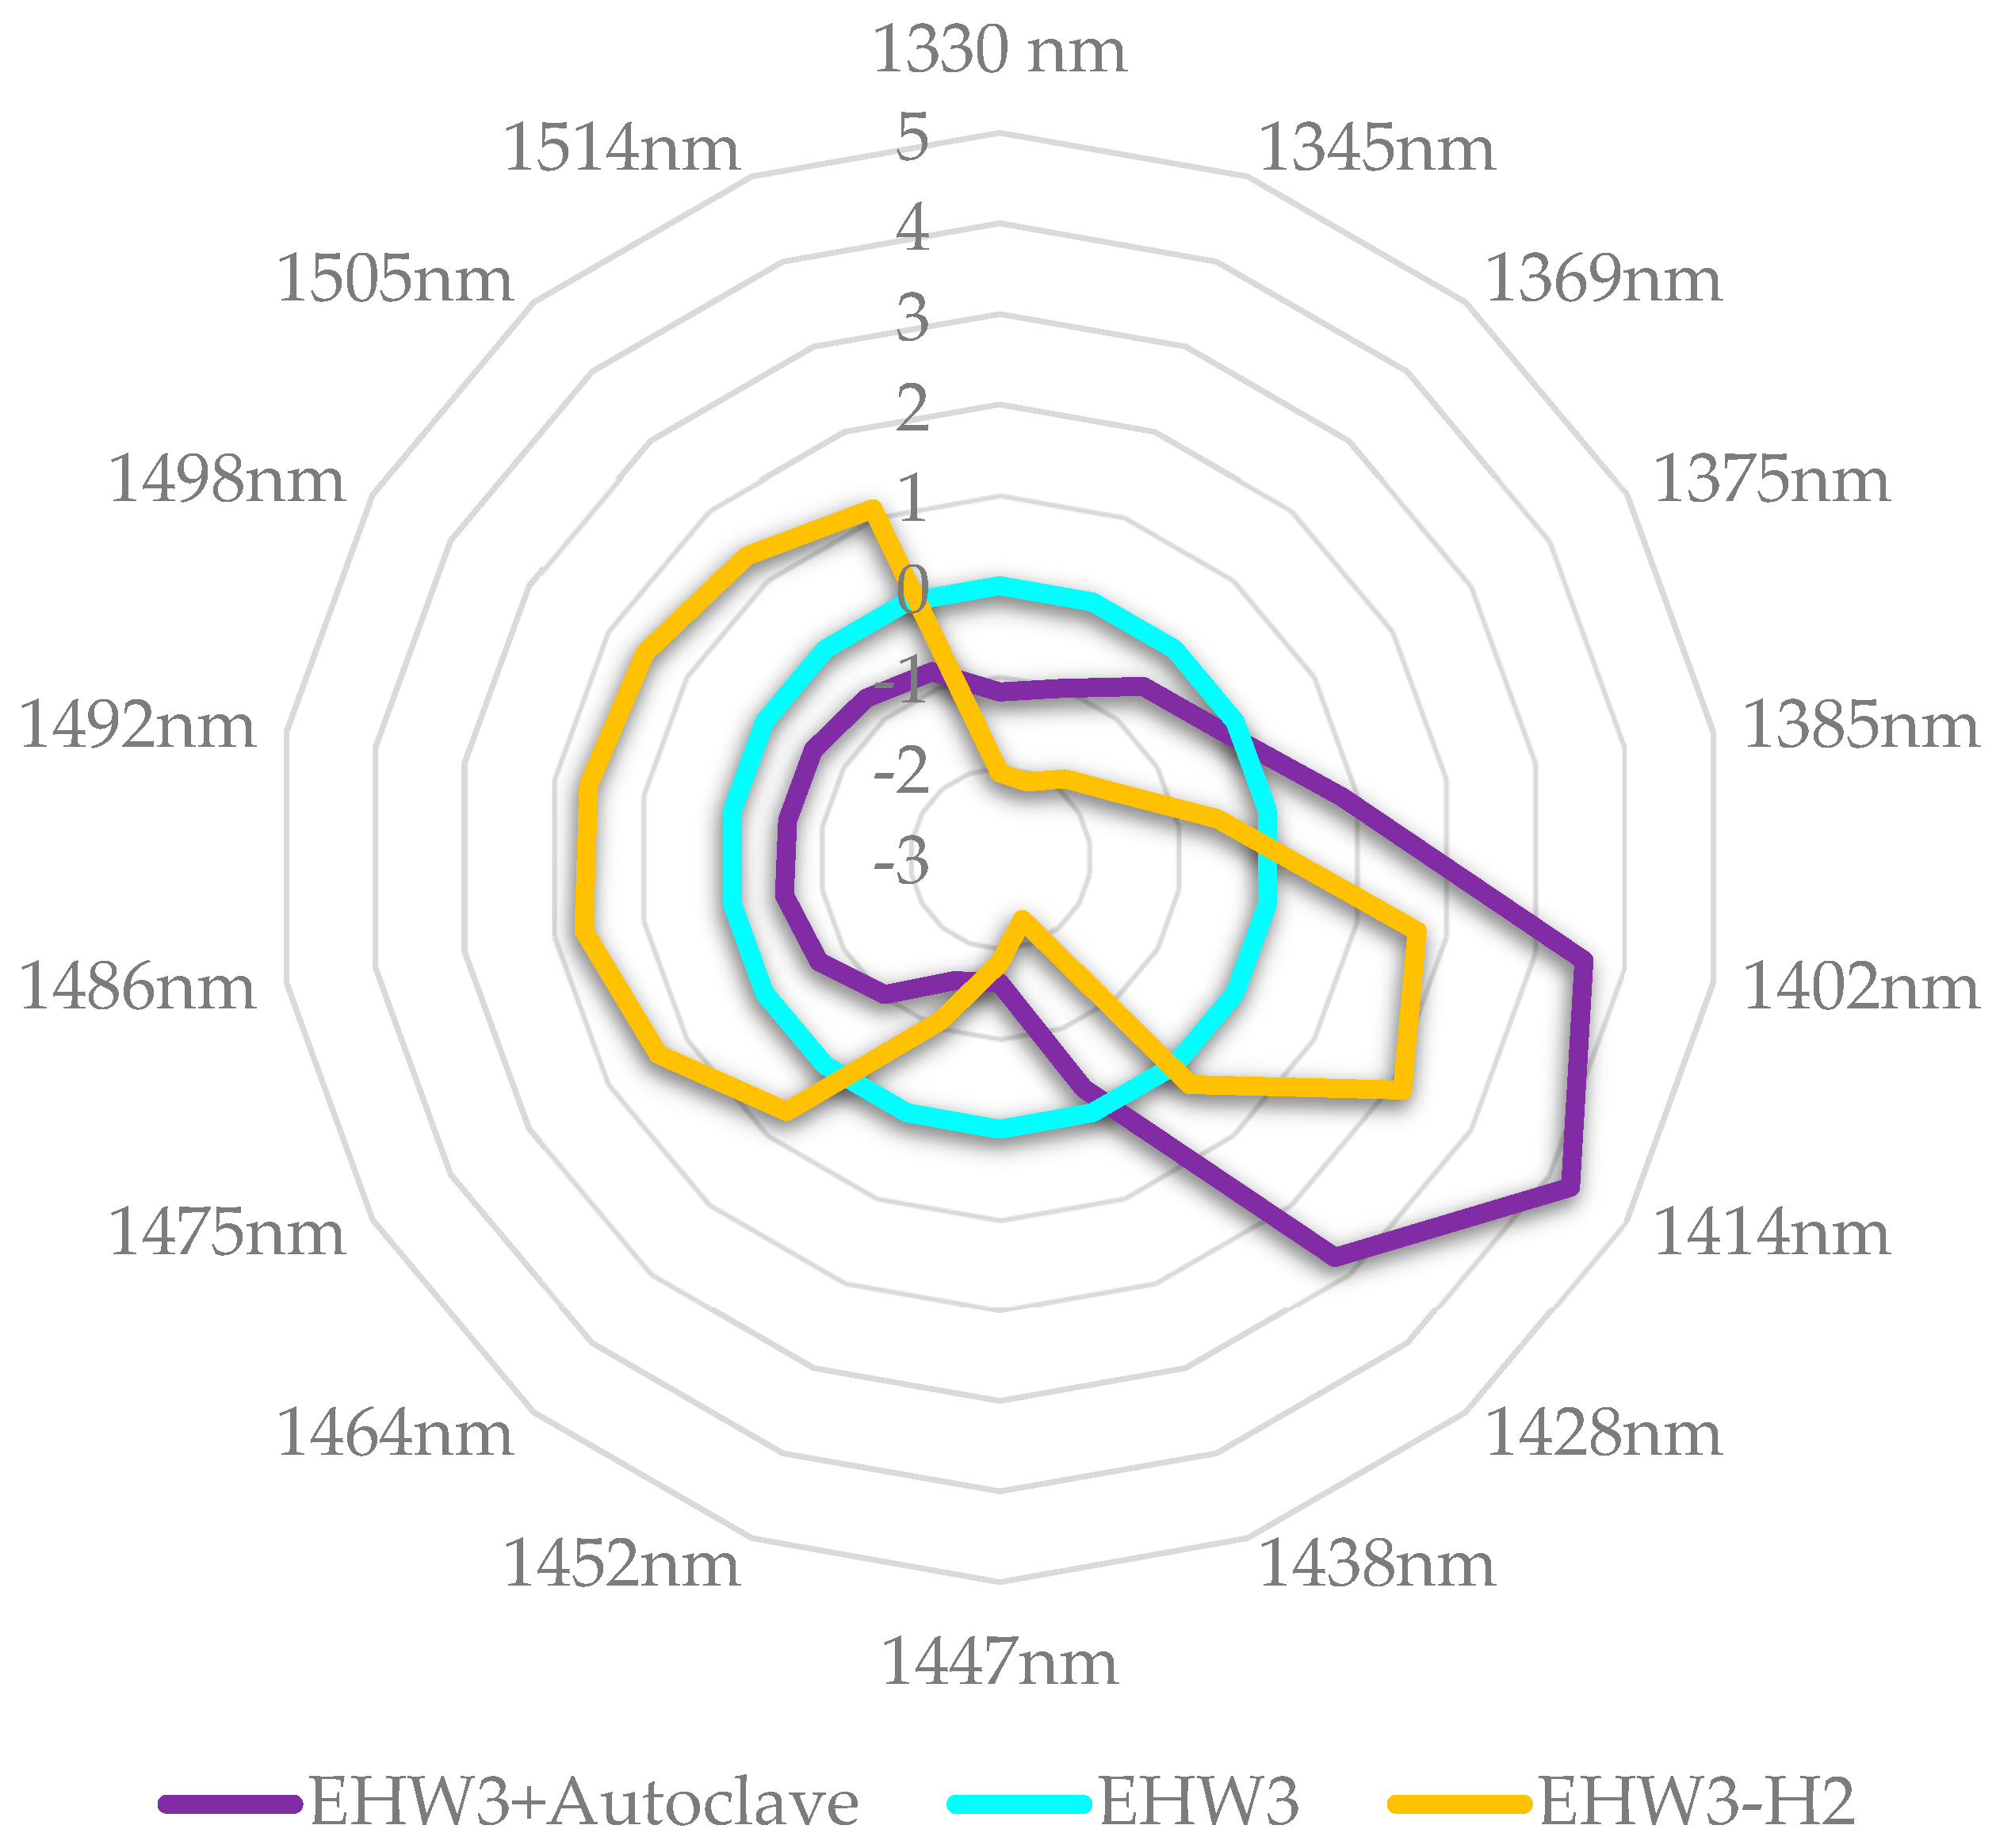
If the autoclaved EHW3 water and EHW3 water from which H
2 is removed partially by stirring and opening the lid of the bottle, are now examined in more detail (
Figure 10) it can be observed that autoclaving in fact decreases all water structures, it acts as a breaker of hydrogen bonds and other interactions, drastically increasing the number of free water molecules. Removal of H
2 by stirring on the other hand produces around 50% increase in the number of free water molecules compared to autoclaving.
If these findings are related to the experimental findings that autoclaving leads to 100% loss of EHW3 anti-radical activity, while H2 removal by stirring leads to 40% loss it can be concluded that increase in free water is what leads to loss of this function. Further, the loss of function is most probably related to the disturbed ratios of free/bound water and loss of solvation and adsorbed water on the structures in EHW3 water.
This indicates that water shells, or also it can be called water layers are the functional part of the EHW3 water that has a property to neutralize oxygen radicals.
4. Discussion
The research presented in this paper aimed to delve into the molecular mechanisms underlying the observed phenomena of electrolyzed hydrogen water (EHW) deactivating oxygen radicals, and the partial loss of this ability upon removal of hydrogen gas, and complete loss following the autoclaving. The existing literature sources pointed out to several possible mechanisms behind the functionality of similar electrolyzed hydrogen waters such as altered ionic product, presence of molecular hydrogen, and platinum or silver nanoparticles or ions originating from electrodes using during electrolysis, as well as generally greater difference in ionic mobility between cations and anions in the water as a solvent [11,19,30]. The common for all these proposed mechanisms is that they lead to changed properties of the produced water particularly water as a solvent. The reports about changed physical and chemical properties such as pH, electroconductivity, ORP and dissolved hydrogen testify to that. However, these water properties ultimately stem from the organization of water molecules within the water molecular network. Therefore, exploring the molecular structure of water became a crucial research direction.
In light of this, we employed Near-Infrared Spectroscopy (NIRS) and aquaphotomics to provide novel insights into the mechanisms related to functionality of electrolyzed hydrogen water.
The NIRS aquaphotomics analysis focused on a specific functional water, EHW3. Several analyses, including difference spectra, Soft Independent Modeling of Class Analogy (SIMCA), and aquagrams, revealed discernible differences among EHW3 water, autoclaved EHW3 water, and waters created by adding HCl and NaOH to EHW3 and FW (tap water), respectively.
The difference spectra highlighted that EHW3 water is distinct from the others due to the presence of light-scattering elements. These elements remained unaffected by autoclaving but were influenced and reduced upon the removal of hydrogen gas. Introducing HCl to EHW3 water or NaOH to FW also resulted in the creation of some scattering structures, albeit to a lesser extent than in EHW3. SIMCA analysis suggested that the differences in waters may arise from distinct water molecular conformations, particularly those associated with solvation. It also indicated the possible existence of hydrated CH-compounds, granulated nanoparticles, and/or biochar granules, which could be produced during the electrolyzed water production process. Since SIMCA was based on raw spectra, it was concluded that these structures contribute to the observed light-scattering effects in the difference spectra. Furthermore, Partial Least Squares Regression (PLSR) analysis, in addition to establishing a robust linear model for determining H2 based on its effects on the water molecular network, confirmed that the scattering of light is, indeed, partially a result of the presence of molecular hydrogen.
However, the most profound insights into the organization of water molecules in the investigated samples emerged through aquagrams. The aquagrams clearly revealed that the primary water molecular structures characterizing EHW3 water are water hydration shells and this also indicates that these structures are the elements that lead to observed light-scattering effects. Aquagrams also showed significant disparities in water composition between EHW3 water and autoclaved or degassed EHW3 water samples, underscoring the impact on bound/free water ratios and adsorbed/solvation water. Upon close examination of autoclaved and degassed EHW3 water, it became evident that autoclaving resulted in a profound disruption of hydrogen bonds and the complete destruction of all other interactions between water molecules and dissolved structures. This led to a drastic increase in free water molecules. Degassing produced similar results, although to a lesser extent compared to autoclaving.
These findings underscore the critical role of water solvation shells in EHW, serving as a pivotal factor in the neutralization of reactive oxygen species (ROS). Nevertheless, the specific ions, granules, or nanoparticles undergoing hydration within these solvation shells remain unidentified.
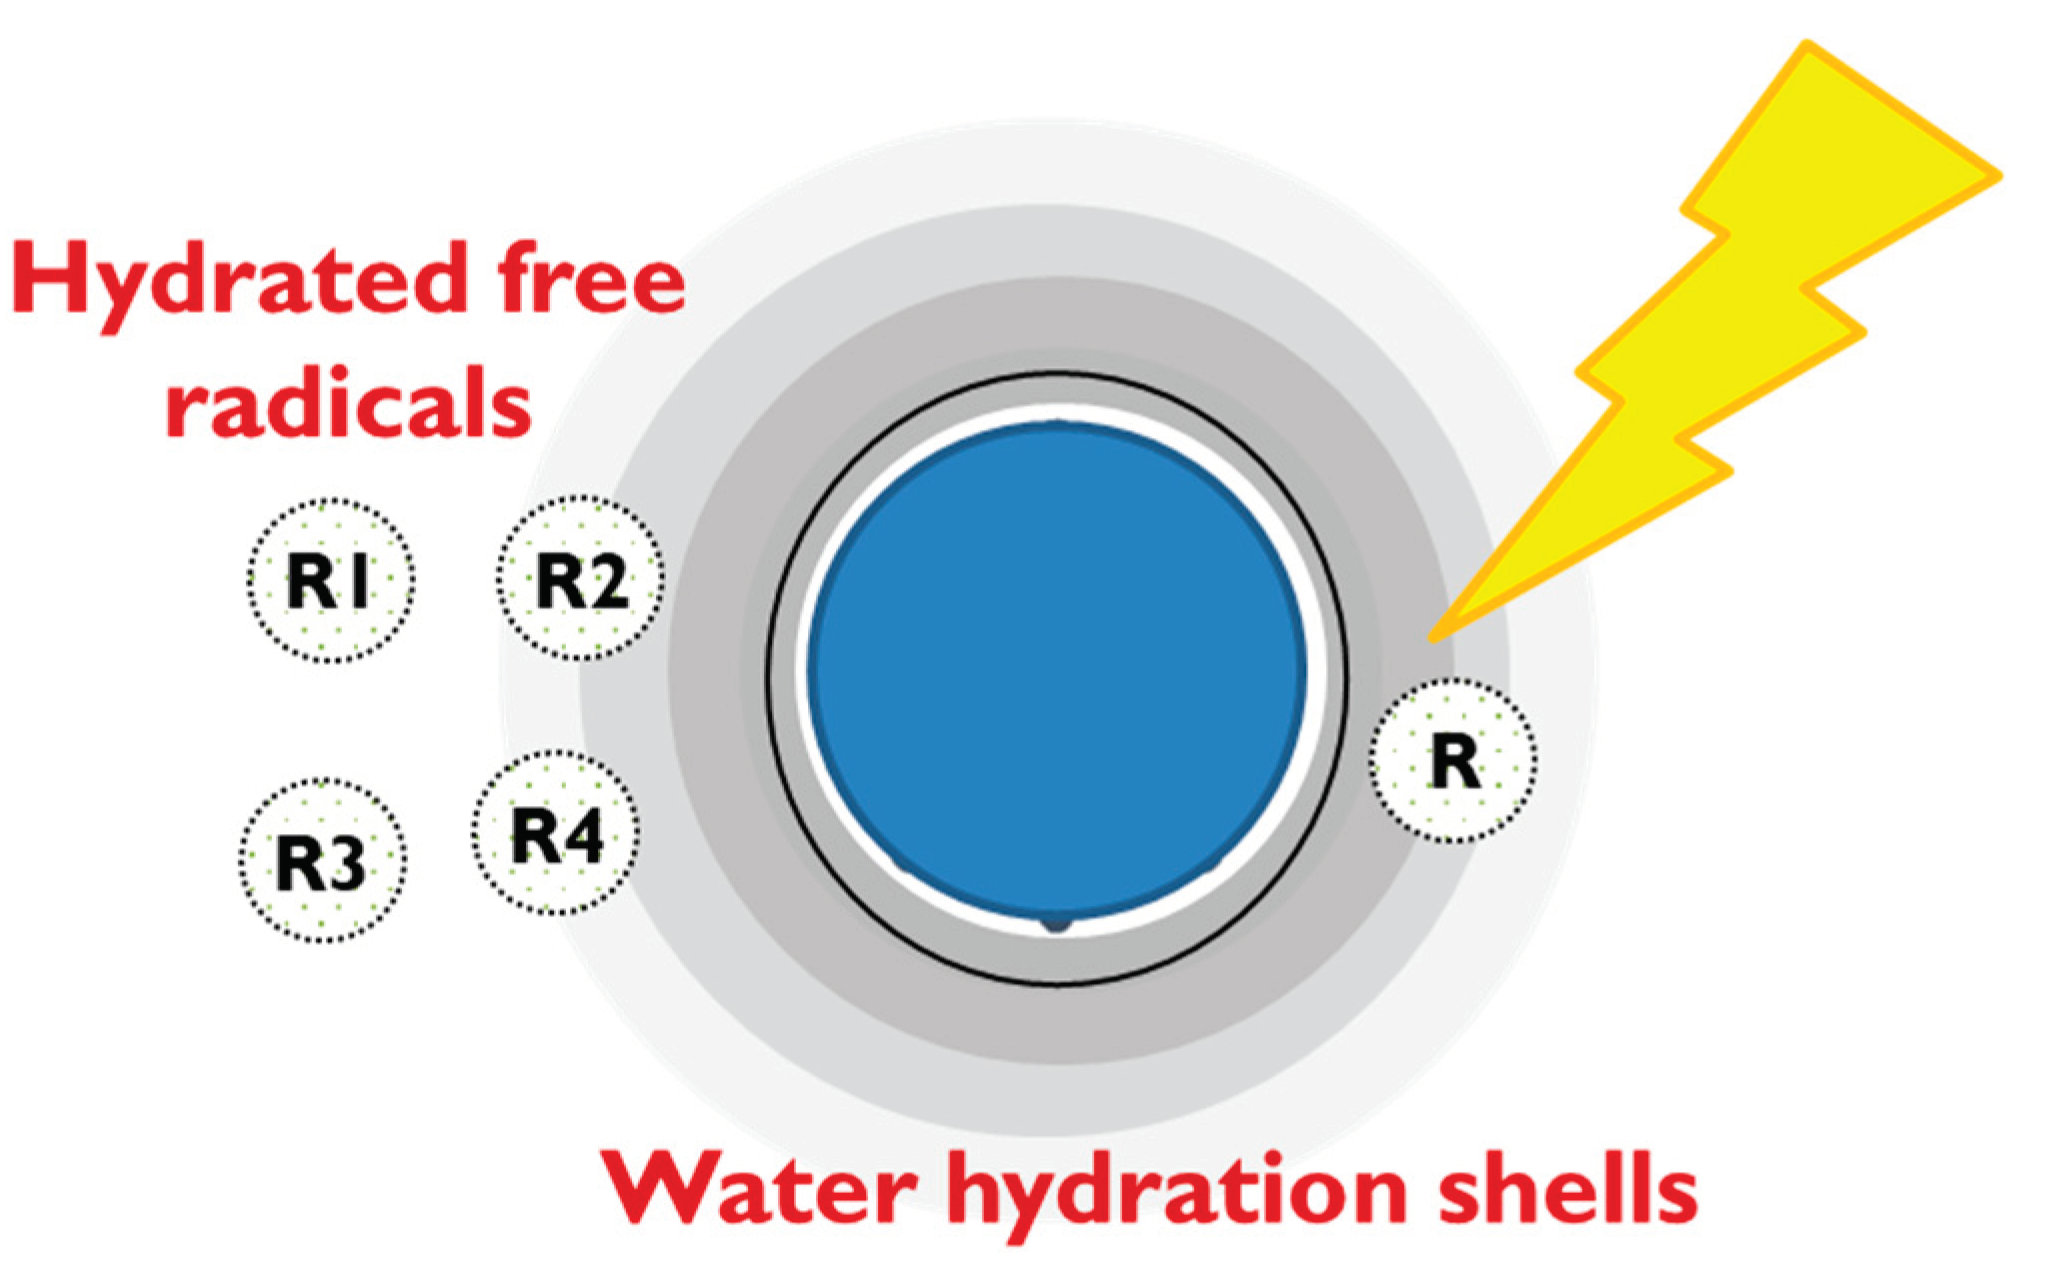
While the suggestion of water solvation shells playing a key role in ROS neutralization functionality may be a novel concept within the realm of functional water, it aligns with a previously proposed anti-radical action model, introduced several years ago by Andrievsky et al. to explain the mechanism of ROS neutralization by hydrated fullerene in very small concentrations [50] (
Figure 11).
Figure 11.
Proposed model of hydrated structures in EHW3 surrounded by long-range water hydration shells and proposed scheme of free radicals absorption, concentration and recombination governed by specifics of water molecular organization [50].
Figure 11.
Proposed model of hydrated structures in EHW3 surrounded by long-range water hydration shells and proposed scheme of free radicals absorption, concentration and recombination governed by specifics of water molecular organization [50].
In alignment with the proposed model, our research shows that solvation shells play a pivotal role in the mechanism behind the antioxidant activity of EHW3. These solvation shells are likely formed due to the presence of diverse structures such as ions, hydrogen gas bubbles or nanobubbles, platinum nanoparticles, and granules generated during the electrolysis process. Following Andrievsky’s proposed model, it can be assumed that these water shells have a critical function in concentrating hydrated free radicals within regions characterized by water structures complementary to their own. This heightened concentration enhances the likelihood of encounters and subsequent recombination, leading to the formation of stable, non-radical molecules. Furthermore, the restricted diffusion of newly generated reactive oxygen species (ROS) within these ordered, low-mobility water layers expedites their recombination into molecular products, thus reducing their lifespan.
In contrast to conventional antioxidants, the distinctive antiradical activity of EHW3 water is rooted in the unique organization of its water molecular network, allowing it to catalyze the accumulation and deactivation of free radicals. Various investigations into different antioxidants consistently underscored the significance of solvation shells, distinct from bulk water, which contributes to increased stability and decreased mobility of water molecules, influencing their antioxidant activity. This discovery was shown to be consistent across diverse antioxidants, emphasizing the pivotal role played by the presence of a solvation shell in determining their functionality [47,48,50–52,108,109].
While this study introduces a novel and promising perspective on the functional attributes originating directly from water, it is not without limitations, necessitating further research. Future investigations should aim to validate the presented results and explore additional avenues. This includes examining the correlation between water molecular structure and surface tension, oxidoreduction potential (ORP), and the molecular structure of electrochemically reduced water generated by the TRIM device through various electrolysis modes. Another intriguing area for exploration involves investigating whether tap water sourced from different locations, used in the preparation of electrochemically reduced water, influences the final water molecular structure and its functional properties.
In conclusion, unraveling the intricate interplay between water molecular structure and functional properties opens up new avenues for research, addressing existing limitations and paving the way for a deeper understanding of the potential applications of functional waters, and especially electrolyzed hydrogen water.
Author Contributions
Conceptualization, S.K., Y.W. and R.T.; methodology, J.M., S.K., Y.W. and R.T.; software, J.M.,M.I. and S.A.; validation, J.M. and R.T.; formal analysis, J.M.,M.I. and S.A.; investigation, J.M., M.I., S.A. and R.T.; resources, S.K., Y.W. and R.T.; data curation, J.M. and R.T; writing—original draft preparation, J.M.; writing—review and editing, J.M., S.K., Y.W., R.T.; visualization, J.M..; supervision, S.K., Y.W. and R.T.; funding acquisition, S.K., Y.W. and R.T. All authors have read and agreed to the published version of the manuscript.
Funding
This study was conducted as collaborative study among Kobe University, RIKEN and Nihon Trim Co., Ltd. funded by Nihon Trim Co., Ltd. (grant number 39-50, 40-20).
Institutional Review Board Statement
Not applicable.
Informed Consent Statement
Not applicable.
Data Availability Statement
The data presented in this study are available on request from the corresponding author, RT. The data are not publicly available in order to preserve the integrity of the investigation, as they are still a part of the ongoing research.
Acknowledgments
The authors wish to express their sincere gratitude to Dr. Satoshi WADA of RIKEN Center for Advanced Photonics for the invaluable expertise he provided and fruitful discussions that contributed to the quality of this manuscript.
Conflicts of Interest
The water samples investigated examined in this study are generated by a device produced by the Nihon Trim Co. Ltd., a company where SK is employed. All opinions presented in this manuscript belong to the authors alone, and not to any institution to which they are or were affiliated. The remaining authors declare that the research was conducted in the absence of any commercial or financial relationships that could be construed as a potential conflict of interest.
References
- Hajam, Y.A.; Rani, R.; Ganie, S.Y.; Sheikh, T.A.; Javaid, D.; Qadri, S.S.; Pramodh, S.; Alsulimani, A.; Alkhanani, M.F.; Harakeh, S.; et al. Oxidative Stress in Human Pathology and Aging: Molecular Mechanisms and Perspectives. Cells 2022, 11, 552. [Google Scholar] [CrossRef]
- Stańczyk, M.; Gromadzińska, J.; Wa̧sowicz, W. Roles of reactive oxygen species and selected antioxidants in regulation of cellular metabolism. Int. J. Occup. Med. Environ. Health 2005, 18, 15–26. [Google Scholar] [PubMed]
- Yang, S.; Lian, G. ROS and diseases: role in metabolism and energy supply. Mol. Cell. Biochem. 2019, 467, 1–12. [Google Scholar] [CrossRef] [PubMed]
- Rani, V.; Deep, G.; Singh, R.K.; Palle, K.; Yadav, U.C.S. Oxidative stress and metabolic disorders: Pathogenesis and therapeutic strategies. Life Sci. 2016, 148, 183–193. [Google Scholar] [CrossRef] [PubMed]
- Singh, A.; Kukreti, R.; Saso, L.; Kukreti, S. Oxidative Stress: A Key Modulator in Neurodegenerative Diseases. Molecules 2019, 24, 1583. [Google Scholar] [CrossRef] [PubMed]
- Newsholme, P.; Cruzat, V.F.; Keane, K.N.; Carlessi, R.; De Bittencourt, P.I.H. Molecular mechanisms of ROS production and oxidative stress in diabetes. Biochem. J. 2016, 473, 4527–4550. [Google Scholar] [CrossRef]
- Yadav, A.; Kumari, R.; Yadav, A.; Mishra, J.P.; Srivatva, S.; Prabha, S. Antioxidants and its functions in human body-A Review. Res. Environ. Life Sci. 2016, 11, 1328–1331. [Google Scholar]
- Vlaicu, P.A.; Untea, A.E.; Varzaru, I.; Saracila, M.; Oancea, A.G. Designing Nutrition for Health—Incorporating Dietary By-Products into Poultry Feeds to Create Functional Foods with Insights into Health Benefits, Risks, Bioactive Compounds, Food Component Functionality and Safety Regulations. Foods 2023, 12, 4001. [Google Scholar] [CrossRef]
- Wu, T.; Sakamoto, M.; Inoue, N.; Imahigashi, K.; Kamitani, Y. Effect of Functional Water on the Antioxidant Property of Concentrated Reconstituted Juice. Foods 2022, 11, 2531. [Google Scholar] [CrossRef]
- Bolshak, Y.; Kalenyk, O.; Marynin, A.; Svyatnenko, R. Research of regularities of formation of health-improving antioxidant electron-donor properties of functional drinking water modified with ascorbic and citric acids. Sci. Messenger LNU Vet. Med. Biotechnol. Ser. Food Technol. 2020, 22, 3–7. [Google Scholar] [CrossRef]
- Wu, T.; Phacharapan, S.; Inoue, N.; Kamitani, Y. Antioxidant Activity Enhancement Effect of Silver-Ionized Water: Silver Cation Prepared by Electrolysis. Antioxidants 2023, 12, 467. [Google Scholar] [CrossRef]
- Bajgai, J.; Kim, C.S.; Rahman, M.H.; Jeong, E.S.; Jang, H.Y.; Kim, K.E.; Choi, J.; Cho, I.Y.; Lee, K.J.; Lee, M. Effects of Alkaline-Reduced Water on Gastrointestinal Diseases. Processes 2022, 10, 87. [Google Scholar] [CrossRef]
- Jafta, N.; Magagula, S.; Lebelo, K.; Nkokha, D.; Mochane, M.J. The Production and Role of Hydrogen-Rich Water in Medical Applications. Appl. Water Sci. Vol. 1 Fundam. Appl. 2023, 273–298. [Google Scholar] [CrossRef]
- Nakayama, M.; Kabayama, S.; Miyazaki, M. Application of Electrolyzed Hydrogen Water for Management of Chronic Kidney Disease and Dialysis Treatment—Perspective View. Antioxidants 2024, 13, 90. [Google Scholar] [CrossRef] [PubMed]
- Moribe, R.; Minami, M.; Hirota, R.; J-P, N.A.; Kabayama, S.; Eitoku, M.; Yamasaki, K.; Kuroiwa, H.; Suganuma, N. Health Effects of Electrolyzed Hydrogen Water for the Metabolic Syndrome and Pre-Metabolic Syndrome: A 3-Month Randomized Controlled Trial and Subsequent Analyses. Antioxidants 2024, 13, 145. [Google Scholar] [CrossRef] [PubMed]
- Mizuno, K.; Watanabe, K.; Yamano, E.; Ebisu, K.; Tajima, K.; Nojima, J.; Ohsaki, Y.; Kabayama, S.; Watanabe, Y. Antioxidant effects of continuous intake of electrolyzed hydrogen water in healthy adults. Heliyon 2022, 8, e11853. [Google Scholar] [CrossRef] [PubMed]
- Shi, F.; He, P.; Li, Z.; Wei, W.; Meng, H.; Wang, D.; Wang, Y. Effect of cold water and cold electrolyzed functional water treatments on the postharvest quality of cold stored jujube fruit (Ziziphus jujuba Mill. “Hupingzao”). J. Food Process. Preserv. 2022, 46, e16580. [Google Scholar] [CrossRef]
- The Japanese Society for Functional Water Overview of the Japanese Society of Functional Water. Available online: http://www.fwf.or.jp/gakkai.html (accessed on 26 January 2024).
- Hamasaki, T.; Harada, G.; Nakamichi, N.; Kabayama, S.; Teruya, K.; Fugetsu, B.; Gong, W.; Sakata, I.; Shirahata, S. Electrochemically reduced water exerts superior reactive oxygen species scavenging activity in HT1080 cells than the equivalent level of hydrogen-dissolved water. PLoS ONE 2017, 12, e0171192. [Google Scholar] [CrossRef]
- Ye, J.; Li, Y.; Hamasaki, T.; Nakamichi, N.; Komatsu, T.; Kashiwagi, T.; Teruya, K.; Nishikawa, R.; Kawahara, T.; Osada, K.; et al. Inhibitory Effect of Electrolyzed Reduced Water on Tumor Angiogenesis. Biol. Pharm. Bull. 2008, 31, 19–26. [Google Scholar] [CrossRef]
- Tsai, C.F.; Hsu, Y.W.; Chen, W.K.; Chang, W.H.; Yen, C.C.; Ho, Y.C.; Lu, F.J. Hepatoprotective effect of electrolyzed reduced water against carbon tetrachloride-induced liver damage in mice. Food Chem. Toxicol. 2009, 47, 2031–2036. [Google Scholar] [CrossRef]
- Shin, D.W.; Yoon, H.; Kim, H.S.; Choi, Y.J.; Shin, C.M.; Park, Y.S.; Kim, N.; Lee, D.H. Effects of Alkaline-Reduced Drinking Water on Irritable Bowel Syndrome with Diarrhea: A Randomized Double-Blind, Placebo-Controlled Pilot Study. Evid. -Based Complement. Altern. Med. 2018, 2018. [Google Scholar] [CrossRef] [PubMed]
- Hanaoka, K. Antioxidant effects of reduced water produced by electrolysis of sodium chloride solutions. J. Appl. Electrochem. 2001, 31, 1307–1313. [Google Scholar] [CrossRef]
- Shirahata, S.; Kabayama, S.; Nakano, M.; Miura, T.; Kusumoto, K.; Gotoh, M.; Hayashi, H.; Otsubo, K.; Morisawa, S.; Katakura, Y. Electrolyzed-reduced water scavenges active oxygen species and protects DNA from oxidative damage. Biochem. Biophys. Res. Commun. 1997, 234, 269–274. [Google Scholar] [CrossRef] [PubMed]
- Lee, M.Y.; Kim, Y.K.; Ryoo, K.K.; Lee, Y.B.; Park, E.J. Electrolyzed-reduced water protects against oxidative damage to DNA, RNA, and protein. Appl. Biochem. Biotechnol. 2006, 135, 133–144. [Google Scholar] [CrossRef]
- Kashiwagi, T.; Yan, H.; Hamasaki, T.; Kinjo, T.; Nakamichi, N.; Teruya, K.; Kabayama, S.; Shirahata, S. Electrochemically reduced water protects neural cells from oxidative damage. Oxid. Med. Cell. Longev. 2014, 2014. [Google Scholar] [CrossRef]
- Li, Y.; Nishimura, T.; Teruya, K.; Maki, T.; Komatsu, T.; Hamasaki, T.; Kashiwagi, T.; Kabayama, S.; Shim, S.Y.; Katakura, Y.; et al. Protective mechanism of reduced water against alloxan-induced pancreatic β-cell damage: Scavenging effect against reactive oxygen species. Cytotechnology 2003, 40, 139–149. [Google Scholar] [CrossRef]
- Kato, S.; Saitoh, Y.; Iwai, K.; Miwa, N. Hydrogen-rich electrolyzed warm water represses wrinkle formation against UVA ray together with type-I collagen production and oxidative-stress diminishment in fibroblasts and cell-injury prevention in keratinocytes. J. Photochem. Photobiol. B Biol. 2012, 106, 24–33. [Google Scholar] [CrossRef]
- Takeuchi, M.; Sakamoto, K.; Martra, G.; Coluccia, S.; Anpo, M. Mechanism of photoinduced superhydrophilicity on the TiO2 photocatalyst surface. J. Phys. Chem. B 2005, 109, 15422–15428. [Google Scholar] [CrossRef]
- Hanaoka, K.; Sun, D.; Lawrence, R.; Kamitani, Y.; Fernandes, G. The mechanism of the enhanced antioxidant effects against superoxide anion radicals of reduced water produced by electrolysis. Biophys. Chem. 2004, 107, 71–82. [Google Scholar] [CrossRef] [PubMed]
- Yokota, T.; Kamimura, N.; Igarashi, T.; Takahashi, H.; Ohta, S.; Oharazawa, H. Protective effect of molecular hydrogen against oxidative stress caused by peroxynitrite derived from nitric oxide in rat retina. Clin. Experiment. Ophthalmol. 2015, 43, 568–577. [Google Scholar] [CrossRef] [PubMed]
- Yu, J.; Zhang, W.; Zhang, R.; Jiang, G.; Tang, H.; Ruan, X.; Ren, P.; Lu, B. Molecular hydrogen attenuates hypoxia/reoxygenation injury of intrahepatic cholangiocytes by activating Nrf2 expression. Toxicol. Lett. 2015, 238, 11–19. [Google Scholar] [CrossRef]
- Zhai, Y.; Zhou, X.; Dai, Q.; Fan, Y.; Huang, X. Hydrogen-rich saline ameliorates lung injury associated with cecal ligation and puncture-induced sepsis in rats. Exp. Mol. Pathol. 2015, 98, 268–276. [Google Scholar] [CrossRef] [PubMed]
- Song, G.; Zong, C.; Zhang, Z.; Yu, Y.; Yao, S.; Jiao, P.; Tian, H.; Zhai, L.; Zhao, H.; Tian, S.; et al. Molecular hydrogen stabilizes atherosclerotic plaque in low-density lipoprotein receptor-knockout mice. Free Radic. Biol. Med. 2015, 87, 58–68. [Google Scholar] [CrossRef] [PubMed]
- Tsenkova, R. Aquaphotomics: Dynamic spectroscopy of aqueous and biological systems describes peculiarities of water. J. Near Infrared Spectrosc. 2009, 17, 303–313. [Google Scholar] [CrossRef]
- Tsenkova, R.; Muncan, J.; Kovacs, Z. Aquaphotomics. In Handbook of Near-Infrared Analysis; Ciurczak, E.W., Igne, B., Jerome Workman, J.D.A.B., Ed.; 2022; p. 917; ISBN 9781138576483.
- Muncan, J.; Tsenkova, R. Aquaphotomics-From Innovative Knowledge to Integrative Platform in Science and Technology. Molecules 2019, 24, 2742. [Google Scholar] [CrossRef]
- Williams, P.; Antoniszyn, J.; Manley, M. Near Infrared Technology: Getting the Best out of Light; AFRICAN SUN MeDIA: Stellenbosch, South Africa, 2019; ISBN 978-1-928480-30-3. [Google Scholar]
- van de Kraats, E.B.; Munćan, J.; Tsenkova, R.N. Aquaphotomics—Origin, concept, applications and future perspectives. Substantia 2019, 13–28. [Google Scholar] [CrossRef]
- Stoilov, A.; Muncan, J.; Tsuchimoto, K.; Teruyaki, N.; Shigeoka, S.; Tsenkova, R. Pilot Aquaphotomic Study of the Effects of Audible Sound on Water Molecular Structure. Molecules 2022, 27, 6332. [Google Scholar] [CrossRef]
- Kovacs, Z.; Bázár, G.; Oshima, M.; Shigeoka, S.; Tanaka, M.; Furukawa, A.; Nagai, A.; Osawa, M.; Itakura, Y.; Tsenkova, R. Water spectral pattern as holistic marker for water quality monitoring. Talanta 2015, 147, 598–608. [Google Scholar] [CrossRef]
- Muncan, J.; Matovic, V.; Nikolic, S.; Askovic, J.; Tsenkova, R. Aquaphotomics approach for monitoring different steps of purification process in water treatment systems. Talanta 2020, 206, 120253. [Google Scholar] [CrossRef]
- Muncan, J.; Tamura, S.; Nakamura, Y.; Takigawa, M.; Tsunokake, H.; Tsenkova, R. Aquaphotomic Study of Effects of Different Mixing Waters on the Properties of Cement Mortar. Molecules 2022, 27, 7885. [Google Scholar] [CrossRef]
- Kato, Y.; Munćan, J.; Tsenkova, R.; Kojić, D.; Yasui, M.; Fan, J.Y.; Han, J.Y. Aquaphotomics reveals subtle differences between natural mineral, processed and aged water using temperature perturbation near-infrared spectroscopy. Appl. Sci. 2021, 11, 9337. [Google Scholar] [CrossRef]
- Slavchev, A.; Kovacs, Z.; Koshiba, H.; Nagai, A.; Bázár, G.; Krastanov, A.; Kubota, Y.; Tsenkova, R. Monitoring of water spectral pattern reveals differences in probiotics growth when used for rapid bacteria selection. PLoS ONE 2015, 10, e0130698. [Google Scholar] [CrossRef]
- Malegori, C.; Muncan, J.; Mustorgi, E.; Tsenkova, R.; Oliveri, P. Analysing the water spectral pattern by near-infrared spectroscopy and chemometrics as a dynamic multidimensional biomarker in preservation: rice germ storage monitoring. Spectrochim. Acta Part A Mol. Biomol. Spectrosc. 2022, 265, 120396. [Google Scholar] [CrossRef]
- Shaker, L.M.; Al-Amiery, A.A.; Abed, T.K.; Al-Azzawi, W.K.; Kadhum, A.A.H.; Sulaiman, G.M.; Mohammed, H.A.; Khan, M.; Khan, R.A. An overview of the density functional theory on antioxidant bioactivity predictive feasibilities: Insights from natural antioxidant products. J. Mol. Struct. 2024, 1301, 137393. [Google Scholar] [CrossRef]
- Filippov, S.K.; Domnina, N.; Vol’eva, V. Future and the past of polymeric antioxidants. Polym. Adv. Technol. 2021, 32, 2655–2668. [Google Scholar] [CrossRef]
- Vol’eva, V.B.; Domnina, N.S.; Sergeeva, O.Y.; Komarova, E.A.; Belostotskaya, I.S.; Komissarova, N.L. Structural factors responsible for the activity of macromolecular phenolic antioxidants. Russ. J. Org. Chem. 2011, 47, 480–485. [Google Scholar] [CrossRef]
- Andrievsky, G.V.; Bruskov, V.I.; Tykhomyrov, A.A.; Gudkov, S. V. Peculiarities of the antioxidant and radioprotective effects of hydrated C60 fullerene nanostuctures in vitro and in vivo. Free Radic. Biol. Med. 2009, 47, 786–793. [Google Scholar] [CrossRef]
- Barzegar, A. The role of intramolecular H-bonds predominant effects in myricetin higher antioxidant activity. Comput. Theor. Chem. 2017, 1115, 239–247. [Google Scholar] [CrossRef]
- Domnina, N.; Aref’ev, D.; Komarova, E.; Bilibin, A. Dextran as antioxidant’s activity carrier. Macromol. Symp. 1999, 144, 339–350. [Google Scholar] [CrossRef]
- Tsenkova, R.; Munćan, J.; Pollner, B.; Kovacs, Z. Essentials of Aquaphotomics and Its Chemometrics Approaches. Front. Chem. 2018, 6, 363. [Google Scholar] [CrossRef]
- Barnes, R.J.; Dhanoa, M.S.; Lister, S.J. Standard Normal Variate Transformation and De-trending of Near-Infrared Diffuse Reflectance Spectra. Appl. Spectrosc. 1989, 43, 772–777. [Google Scholar] [CrossRef]
- Wold, S.; Sjostrom, M. SIMCA: A Method for Analyzing Chemical Data in Terms of Similarity and Analogy. In; 1977; pp. 243–282.
- Martens, H.; Martens, M. (Magni) Multivariate Analysis of Quality : An Introduction; Wiley: Chichester, UK, 2001; ISBN 9780471974284. [Google Scholar]
- Infometrix Inc. Pirouette Multivariate Data Analysis Software; 2011. [Google Scholar]
- Roger, J.; Mallet, A.; Marini, F. Preprocessing NIR Spectra for Aquaphotomics. Molecules 2022, 27, 6795. [Google Scholar] [CrossRef]
- Segtnan, V.H.V.; Šašić, Š.; Isaksson, T.; Ozaki, Y.; Šašić, S.; Isaksson, T.; Ozaki, Y.; Sasic, S.; Isaksson, T.; Ozaki, Y. Studies on the structure of water using two-dimensional near-infrared correlation spectroscopy and principal component analysis. Anal. Chem. 2001, 73, 3153–3161. [Google Scholar] [CrossRef] [PubMed]
- Blomquist, G.; Johansson, E.; Söderström, B.; Wold, S. Data analysis of pyrolysis—chromatograms by means of simca pattern recognition. J. Anal. Appl. Pyrolysis 1979, 1, 53–65. [Google Scholar] [CrossRef]
- Kvalheim, O.M.; Karstang, T.V. SIMCA—Classification by means of disjoint cross validated principal components models. In Multivariate Pattern Recognition in Chemometrics: Illustrated by Case Studies; Brereton, R.G., Ed.; Elsevier: Amsterdam, The Netherlands, 1992; Volume 9, pp. 209–248. [Google Scholar]
- Rhine, P.; Williams, D.; Hale, M.; Querry, M.R. Infrared Optical Constants of Aqueous Solutions of Electrolytes. Acids and Bases. J. Phys. Chem. 1974, 78, 1405–1410. [Google Scholar] [CrossRef]
- Falk, M.; Ford, T.A. Infrared spectrum and structure of liquid water. 2011, 44, 1699–1707. [Google Scholar] [CrossRef]
- Robertson, W.H.; Diken, E.G.; Price, E.A.; Shin, J.-W.; Johnson, M.A. Spectroscopic determination of the OH− solvation shell in the OH−·(H2O) n clusters. Science 2003, 299, 1367–1372. [Google Scholar] [CrossRef]
- Wang, Y.; Tsenkova, R.; Amari, M.; Terada, F.; Hayashi, T.; Abe, A.; Ozaki, Y. Potential of two-dimensional correlation spectroscopy in analyses of NIR spectra of biological fluids. I. Two-dimensional correlation analysis of protein and fat concentration-dependent spectral variations of milk. Anal. Mag. 1998, 26, 64–69. [Google Scholar] [CrossRef]
- Yang, X.; Guang, P.; Xu, G.; Zhu, S.; Chen, Z.; Huang, F. Manuka honey adulteration detection based on near-infrared spectroscopy combined with aquaphotomics. Lwt 2020, 132, 109837. [Google Scholar] [CrossRef]
- Lin, C.K.; Wu, C.C.; Wang, Y.S.; Lee, Y.T.; Chang, H.C.; Kuo, J.L.; Klein, M.L. Vibrational predissociation spectra and hydrogen-bond topologies of H +(H2O)9-11. Phys. Chem. Chem. Phys. 2005, 7, 938–944. [Google Scholar] [CrossRef]
- Okumura, M.; Yeh, L.I.; Myers, J.D.; Lee, Y.T. Infrared spectra of the solvated hydronium ion: Vibrational predissociation spectroscopy of mass-selected H3O+·(H2O)n·(H 2)m. J. Phys. Chem. 1990, 94, 3416–3427. [Google Scholar] [CrossRef]
- Wei, D.; Salahub, D.R. Hydrated proton clusters: Ab initio molecular dynamics simulation and simulated annealing. J. Chem. Phys. 1997, 106, 6086–6094. [Google Scholar] [CrossRef]
- Mizuse, K.; Fujii, A. Tuning of the Internal Energy and Isomer Distribution in Small Protonated Water Clusters H + (H 2 O) 4–8 : An Application of the Inert Gas Messenger Technique. J. Phys. Chem. A 2012, 116, 4868–4877. [Google Scholar] [CrossRef]
- Schwarz, H.A. Gas phase infrared spectra of oxonium hydrate ions from 2 to 5 μ. J. Chem. Phys. 1977, 67, 5525–5534. [Google Scholar] [CrossRef]
- Headrick, J.M.; Diken, E.G.; Walters, R.S.; Hammer, N.I.; Christie, R.A.; Cui, J.; Myshakin, E.M.; Duncan, M. a; Johnson, M. a; Jordan, K.D. Spectral signatures of hydrated proton vibrations in water clusters. Science 2005, 308, 1765–1769. [Google Scholar] [CrossRef]
- Torralvo, M.J.; Sanz, J.; Sobrados, I.; Soria, J.; Garlisi, C.; Palmisano, G.; Çetinkaya, S.; Yurdakal, S.; Augugliaro, V. Anatase photocatalyst with supported low crystalline TiO2: The influence of amorphous phase on the activity. Appl. Catal. B Environ. 2018, 221, 140–151. [Google Scholar] [CrossRef]
- Muncan, J.; Kovacs, Z.; Pollner, B.; Ikuta, K.; Ohtani, Y.; Terada, F.; Tsenkova, R. Near infrared aquaphotomics study on common dietary fatty acids in cow’s liquid, thawed milk. Food Control 2020, 122, 107805. [Google Scholar] [CrossRef]
- Wu, C.C.; Lin, C.K.; Chang, H.C.; Jiang, J.C.; Kuo, J.L.; Klein, M.L. Protonated clathrate cages enclosing neutral water molecules: H +(H 2O) 21 and H +(H 2O) 28. J. Chem. Phys. 2005, 122, 074315. [Google Scholar] [CrossRef]
- Costa, R.; Lourenço, A.; Oliveira, V.; Pereira, H. Chemical characterization of cork, phloem and wood from different Quercus suber provenances and trees. Heliyon 2019, 5, e02910. [Google Scholar] [CrossRef]
- Suzuki, T.; Kikuchi, H.; Yonemochi, E.; Terada, K.; Yamamoto, K. Interaction of microcrystalline cellulose and water in granules prepared by a high-shear mixer. Chem. Pharm. Bull. 2001, 49, 373–378. [Google Scholar] [CrossRef] [PubMed]
- Hwang, B.J.; Chen, H.C.; Mai, F.D.; Tsai, H.Y.; Yang, C.P.; Rick, J.; Liu, Y.C. Innovative Strategy on Hydrogen Evolution Reaction Utilizing Activated Liquid Water. Sci. Rep. 2015, 5, 1–10. [Google Scholar] [CrossRef]
- Amikam, G.; Fridman-Bishop, N.; Gendel, Y. Biochar-Assisted Iron-Mediated Water Electrolysis Process for Hydrogen Production. ACS Omega 2020, 5, 31908–31917. [Google Scholar] [CrossRef] [PubMed]
- Guo, Y.C.; Li, X.H.; Zhao, L.J.; Zhang, Y.H. Drawing out the structural information about the first hydration layer of the isolated Cl- anion through the FTIR-ATR difference spectra. J. Solut. Chem. 2013, 42, 459–469. [Google Scholar] [CrossRef]
- Ritzhaupt, G.; Devlin, J.P. Infrared spectra of nitric and hydrochloric acid hydrate thin films. J. Phys. Chem. 1991, 95, 90–95. [Google Scholar] [CrossRef]
- Raghuvanshi, G.S.; Pal, M.; Patel, M.B.; Bist, H.D. Vibrational spectra and phase transitions in Ni(CH3COO)24X2O (X = H, D). J. Mol. Struct. 1983, 101, 7–21. [Google Scholar] [CrossRef]
- Mora, M.; López, M.I.; Jiménez-Sanchidrián, C.; Ruiz, J.R. Study of organo-hybrid layered double hydroxides by medium and near infrared spectroscopy. Spectrochim. Acta - Part A Mol. Biomol. Spectrosc. 2011, 78, 989–995. [Google Scholar] [CrossRef] [PubMed]
- Myneni, S.C.B.; Traina, S.J.; Waychunas, G.A.; Logan, T.J. Experimental and theoretical vibrational spectroscopic evaluation of arsenate coordination in aqueous solutions, solids, and at mineral-water interfaces. Geochim. Cosmochim. Acta 1998, 62, 3285–3300. [Google Scholar] [CrossRef]
- Wu, N.; Zhang, C.; Bai, X.; Du, X.; He, Y. Discrimination of Chrysanthemum Varieties Using Hyperspectral Imaging Combined with a Deep Convolutional Neural Network. Molecules 2018, 23, 2831. [Google Scholar] [CrossRef]
- Chung, H.; Choi, H.; Ku, M. Rapid Identification of Petroleum Products by Near-Infrared Spectroscopy. Bull. Korean Chem. Soc. 1999, 20, 1229–5949. [Google Scholar]
- Kelley, S.S.; Rials, T.G.; Snell, R.; Groom, L.H.; Sluiter, A. Use of near infrared spectroscopy to measure the chemical and mechanical properties of solid wood. Wood Sci. Technol. 2004, 38, 257–276. [Google Scholar] [CrossRef]
- Mora, M.; Jiménez-Sanchidrián, C.; Ruiz, J.R. Heterogeneous Suzuki cross-coupling reactions over palladium/hydrotalcite catalysts. J. Colloid Interface Sci. 2006, 302, 568–575. [Google Scholar] [CrossRef] [PubMed]
- Rossel, R.A.V.; Behrens, T. Using data mining to model and interpret soil diffuse reflectance spectra. Geoderma 2010, 158, 46–54. [Google Scholar] [CrossRef]
- Tümsavaş, Z.; Tekin, Y.; Ulusoy, Y.; Mouazen, A.M. Prediction and mapping of soil clay and sand contents using visible and near-infrared spectroscopy. Biosyst. Eng. 2019, 177, 90–100. [Google Scholar] [CrossRef]
- Jiang, J.-C.; Wang, Y.-S.; Chang, H.-C.; Lin, S.H.; Lee, Y.T.; Niedner-Schatteburg, G.; Chang, H.-C. Infrared spectra of H+(H2O)5-8 clusters: Evidence for symmetric proton hydration. J. Am. Chem. Soc. 2000, 122, 1398–1410. [Google Scholar] [CrossRef]
- Jones, P.D.; Schimleck, L.R.; Peter, G.F.; Daniels, R.F.; Clark, A. Nondestructive estimation of wood chemical composition of sections of radial wood strips by diffuse reflectance near infrared spectroscopy. Wood Sci. Technol. 2006, 40, 709–720. [Google Scholar] [CrossRef]
- Posom, J.; Shrestha, A.; Saechua, W.; Sirisomboon, P. Rapid non-destructive evaluation of moisture content and higher heating value of Leucaena leucocephala pellets using near infrared spectroscopy. Energy 2016, 107, 464–472. [Google Scholar] [CrossRef]
- Osborne, B.G.; Fearn, T. Near Infrared Spectroscopy in Food Analysis; Longman Scientific & Technical: Essex, UK, 1988. [Google Scholar]
- Sagawa, N.; Shikata, T. Hydration Behavior of Poly(ethylene oxide)s in Aqueous Solution As Studied by Near-Infrared Spectroscopic Techniques. J. Phys. Chem. B 2013, 117, 10883–10888. [Google Scholar] [CrossRef] [PubMed]
- Palmer, S.J.; Spratt, H.J.; Frost, R.L. Thermal decomposition of hydrotalcites with variable cationic ratios. J. Therm. Anal. Calorim. 2009, 95, 123–129. [Google Scholar] [CrossRef]
- Zhang, J.; Su, H.; Zhou, J.; Qian, G.; Xu, Z.; Xi, Y.; Xu, Y.; Theiss, F.L.; Frost, R. Mid- and near-infrared spectroscopic investigation of homogeneous cation distribution in MgxZnyAl(x+y)/2-layered double hydroxide (LDH). J. Colloid Interface Sci. 2013, 411, 240–246. [Google Scholar] [CrossRef]
- Sagawa, N.; Shikata, T. Dangling OH Vibrations of Water Molecules in Aqueous Solutions of Aprotic Polar Compounds Observed in the Near-Infrared Regime. 2015. [CrossRef]
- Du, Q.; Superfine, R.; Freysz, E.; Shen, Y.R. Vibrational spectroscopy of water at the vapor/water interface. Phys. Rev. Lett. 1993, 70, 2313–2316. [Google Scholar] [CrossRef]
- Xu, C.; Zeng, W.; Huang, J.; Wu, J.; Van Leeuwen, W.J.D. Prediction of soil moisture content and soil salt concentration from hyperspectral laboratory and field data. Remote Sens. 2016, 8, 42. [Google Scholar] [CrossRef]
- Heiman, A.; Licht, S. Fundamental baseline variations in aqueous near-infrared analysis. Anal. Chim. Acta 1999, 394, 135–147. [Google Scholar] [CrossRef]
- Gowen, A.A.; Amigo, J.M.; Tsenkova, R. Characterisation of hydrogen bond perturbations in aqueous systems using aquaphotomics and multivariate curve resolution-alternating least squares. Anal. Chim. Acta 2013, 759, 8–20. [Google Scholar] [CrossRef] [PubMed]
- Kondo, A.; Kurosawa, R.; Ryu, J.; Matsuoka, M.; Takeuchi, M. Investigation on the Mechanisms of Mg(OH)2Dehydration and MgO Hydration by Near-Infrared Spectroscopy. J. Phys. Chem. C 2021, 125, 10937–10947. [Google Scholar] [CrossRef]
- Le Caër, S.; Palmer, D.J.; Lima, M.; Renault, J.P.; Vigneron, G.; Righini, R.; Pommeret, S. Time-resolved studies of water dynamics and proton transfer at the alumina-air interface. J. Am. Chem. Soc. 2007, 129, 11720–11729. [Google Scholar] [CrossRef] [PubMed]
- Takeuchi, M.; Martra, G.; Coluccia, S.; Anpo, M. Evaluation of the adsorption states of H2O on oxide surfaces by vibrational absorption: Near- And mid-infrared spectroscopy. J. Near Infrared Spectrosc. 2009, 17, 373–384. [Google Scholar] [CrossRef]
- Yamazaki, A.; Nagasaka, Y. Surface Tension of Electrolyzed Alkaline Water : Dynamic Measurement of Surface Tension during Electrolysis Process by Surface Laser-Light Scattering Method. Proc. Therm. Eng. Conf. 2002, 2002, 87–88. [Google Scholar] [CrossRef]
- Yamazaki, A.; Nagasaka, Y. 電 解 ア ル カ リ 性 水 の 表 面 張 力 表 面 光 散 乱 法 に よ る 電 解 過 程 の 動 的測 定 ) Surface Tension of Electrolyzed Alkaline Water. Jpn. Soc. Mechnical Eng. 2002, 87–88. [Google Scholar]
- Arefiev, D.V.; Domnina, N.S.; Komarova, E.A.; Bilibin, A.Y. Sterically hindered phenol-dextran conjugates: radical scavenging activity in water and water-organic media. Eur. Polym. J. 2000, 36, 857–860. [Google Scholar] [CrossRef]
- Chakraborty, S.; Bhattacharya, I.; Mitra, R.K. Solvation Plays a Key Role in Antioxidant-Mediated Attenuation of Elevated Creatinine Level: An In Vitro Spectroscopic Investigation. J. Phys. Chem. B 2023, 127, 8576–8585. [Google Scholar] [CrossRef]
Figure 1.
Raw NIR spectra of all water types—the highest absorbance (highest baseline) was observed in the sample EHW3.
Figure 1.
Raw NIR spectra of all water types—the highest absorbance (highest baseline) was observed in the sample EHW3.
Figure 2.
The spectra of different water types compared to that of pure water (Control water, zero line). Difference spectra were computed by subtracting the average spectrum of Control water from the average spectra of all other water types. To enhance visual clarity, the difference spectra were then normalized to a 0-1 range using the formula: Difference Spectra = Normalize (0,1) [Water Type(avg) - Control(avg)].
Figure 3.
The spectra of different water types compared to that of EHW3 water (zero line). Difference spectra were computed by subtracting the average spectrum of EHW3 water from the average spectra of all other water types. To enhance visual clarity, the difference spectra were then normalized to a 0-1 range using the formula: Difference Spectra = Normalize (0,1) [Water Type(avg) – EHW3(avg)].
Figure 4.
SIMCA classification analysis. 3D view of class projections show well-defined clusters of scores for each of the water types. The accuracy of classification was 79.14%.
Figure 4.
SIMCA classification analysis. 3D view of class projections show well-defined clusters of scores for each of the water types. The accuracy of classification was 79.14%.
Figure 5.
Discriminating power of SIMCA analysis shows which absrobance bands in the spectra have highest power to discriminate between the investigated water samples.
Figure 5.
Discriminating power of SIMCA analysis shows which absrobance bands in the spectra have highest power to discriminate between the investigated water samples.
Figure 6.
Results of PLSR analysis for modeling dissolved hydrogen – the regression analysis showed excellent possibility of prediction of dissolved hydrogen in water using NIR spectra.
Figure 6.
Results of PLSR analysis for modeling dissolved hydrogen – the regression analysis showed excellent possibility of prediction of dissolved hydrogen in water using NIR spectra.
Figure 7.
Results of PLSR analysis for modeling dissolved hydrogen – the regression coefficient vector provides information about which variables (wavelengths) contributed with highest regression coefficient to modeling.
Figure 7.
Results of PLSR analysis for modeling dissolved hydrogen – the regression coefficient vector provides information about which variables (wavelengths) contributed with highest regression coefficient to modeling.
Figure 8.
Aquagrams of examined samples, showing normalized absorbance (divided by absorbance range).
Figure 8.
Aquagrams of examined samples, showing normalized absorbance (divided by absorbance range).
Figure 9.
Aquagrams of examined samples, showing normalized absorbance (divided by absorbance range) and EHW3 water subtracted.
Figure 9.
Aquagrams of examined samples, showing normalized absorbance (divided by absorbance range) and EHW3 water subtracted.
Figure 10.
Aquagrams of autoclaved EHW3 and EHW3 stirred to remove H2, showing normalized absorbance (divided by absorbance range) and EHW3 water subtracted.
Figure 10.
Aquagrams of autoclaved EHW3 and EHW3 stirred to remove H2, showing normalized absorbance (divided by absorbance range) and EHW3 water subtracted.
Table 1.
Experimental samples and related properties.
Table 1.
Experimental samples and related properties.
| No. |
Sample Label |
Preparation / Treatment |
Reported functionality |
| 1 |
Control |
MQ – ultrapure water |
- |
| 2 |
EHW3 |
Flowing tap water with Hydrogen mode level3 |
Activity deactivating reactive oxygen in cells [19] |
| 3 |
EHW3-H2
|
Removing H2 gas by stirring EHW3 and opening the lid twice |
40% decrease of activity deactivating reactive oxygen in cells [19] |
| 4 |
EHW3+Autoclave |
Autoclaving EHW3 |
Disappearance of activity deactivating reactive oxygen in cells. 40% decrease of activity of deactivating O2 radical in vitro. [19] |
| 5 |
EHW3+HCl |
Adding HCl to EHW3 to make pH the same as FW |
- |
| 6 |
FW+NaOH |
Adding NaOH to FW to make pH the same as EHW3 |
- |
Table 2.
Interclass (Mahalanobis) distance between the clusters of the water samples.
Table 2.
Interclass (Mahalanobis) distance between the clusters of the water samples.
| |
EHW3 |
EHW3-H2
|
EHW3+Autoclave |
EHW3+HCl |
Control |
FW+NaOH |
| EHW3 |
0.00 |
13.38 |
0.66 |
0.51 |
5.62 |
10.69 |
| EHW3-H2 |
|
0.00 |
3.65 |
6.48 |
1.37 |
0.77 |
| EHW3+Autoclave |
|
|
0.00 |
0.42 |
2.12 |
2.91 |
| EHW3+HCl |
|
|
|
0.00 |
2.68 |
5.05 |
| Control |
|
|
|
|
0.00 |
1.37 |
| NaOH |
|
|
|
|
|
0.00 |
|
Disclaimer/Publisher’s Note: The statements, opinions and data contained in all publications are solely those of the individual author(s) and contributor(s) and not of MDPI and/or the editor(s). MDPI and/or the editor(s) disclaim responsibility for any injury to people or property resulting from any ideas, methods, instructions or products referred to in the content. |
