1. Introduction
The high demand for clean energy in the modern energy power system (EPS) due to fuel prices, laws, and regulations emphasizes the need for alternative power generators [
1]. Evolution of the renewable energy use the fact that the hydro system evolution until 2050 is quite constant, because the water reserves and new specific implementations are not variating significantly, so the improvements are its optimization and/or use ameliorations. Renewable energy sources (RES), or called sustainable energy sources, like wind, solar, hydropower, geothermal, and biomass energy are now gradually starting to dominate the energy generation mix, re-placing traditional generation sources, such as coal and nuclear. The global installation of only wind and photovoltaic generation exceeded 400 GW and 200 GW, respectively, by the end of 2015 [
2].
In such a circumstance, the application of any technology, including energy management techniques, has an impact on how society views energy and energy-related issues. In terms of accepting or rejecting them, society is acting in a way that is consistent with the commitment made. In order to anticipate how society will interact with technology related to electrical energy management, various training and optimization simulation scenarios should be developed.
1.1. Demanding Functions Review
Developing countries from Central and Eastern Europe have significant energy potential from RES determined by mixed environmental conditions (relief and climate). In the 2018 report of Central Europe Energy Partners (CEEP) is presented that overall RES use for 2014 in Romania and Bulgaria (26% and 18% respectively) already exceeded their targets for 2020. According to this report, the power from RES in Romania have their biggest use in electricity production (44%), followed by heating & cooling (28%) and the lowest use in transportation (4.5% in 2014) [
2]. In this example, hydropower alone can meet 40% of the country’s instantaneous electricity demand, which is the highest among all the countries in the region.
It is well known that most of the modern RES are interfaced through inverters. Although this is advantageous from the point-of-view of harvesting RES, the inverter-based generation does not provide any mechanical inertial response, and hence compromises frequency stability [
3,
4,
5,
6].
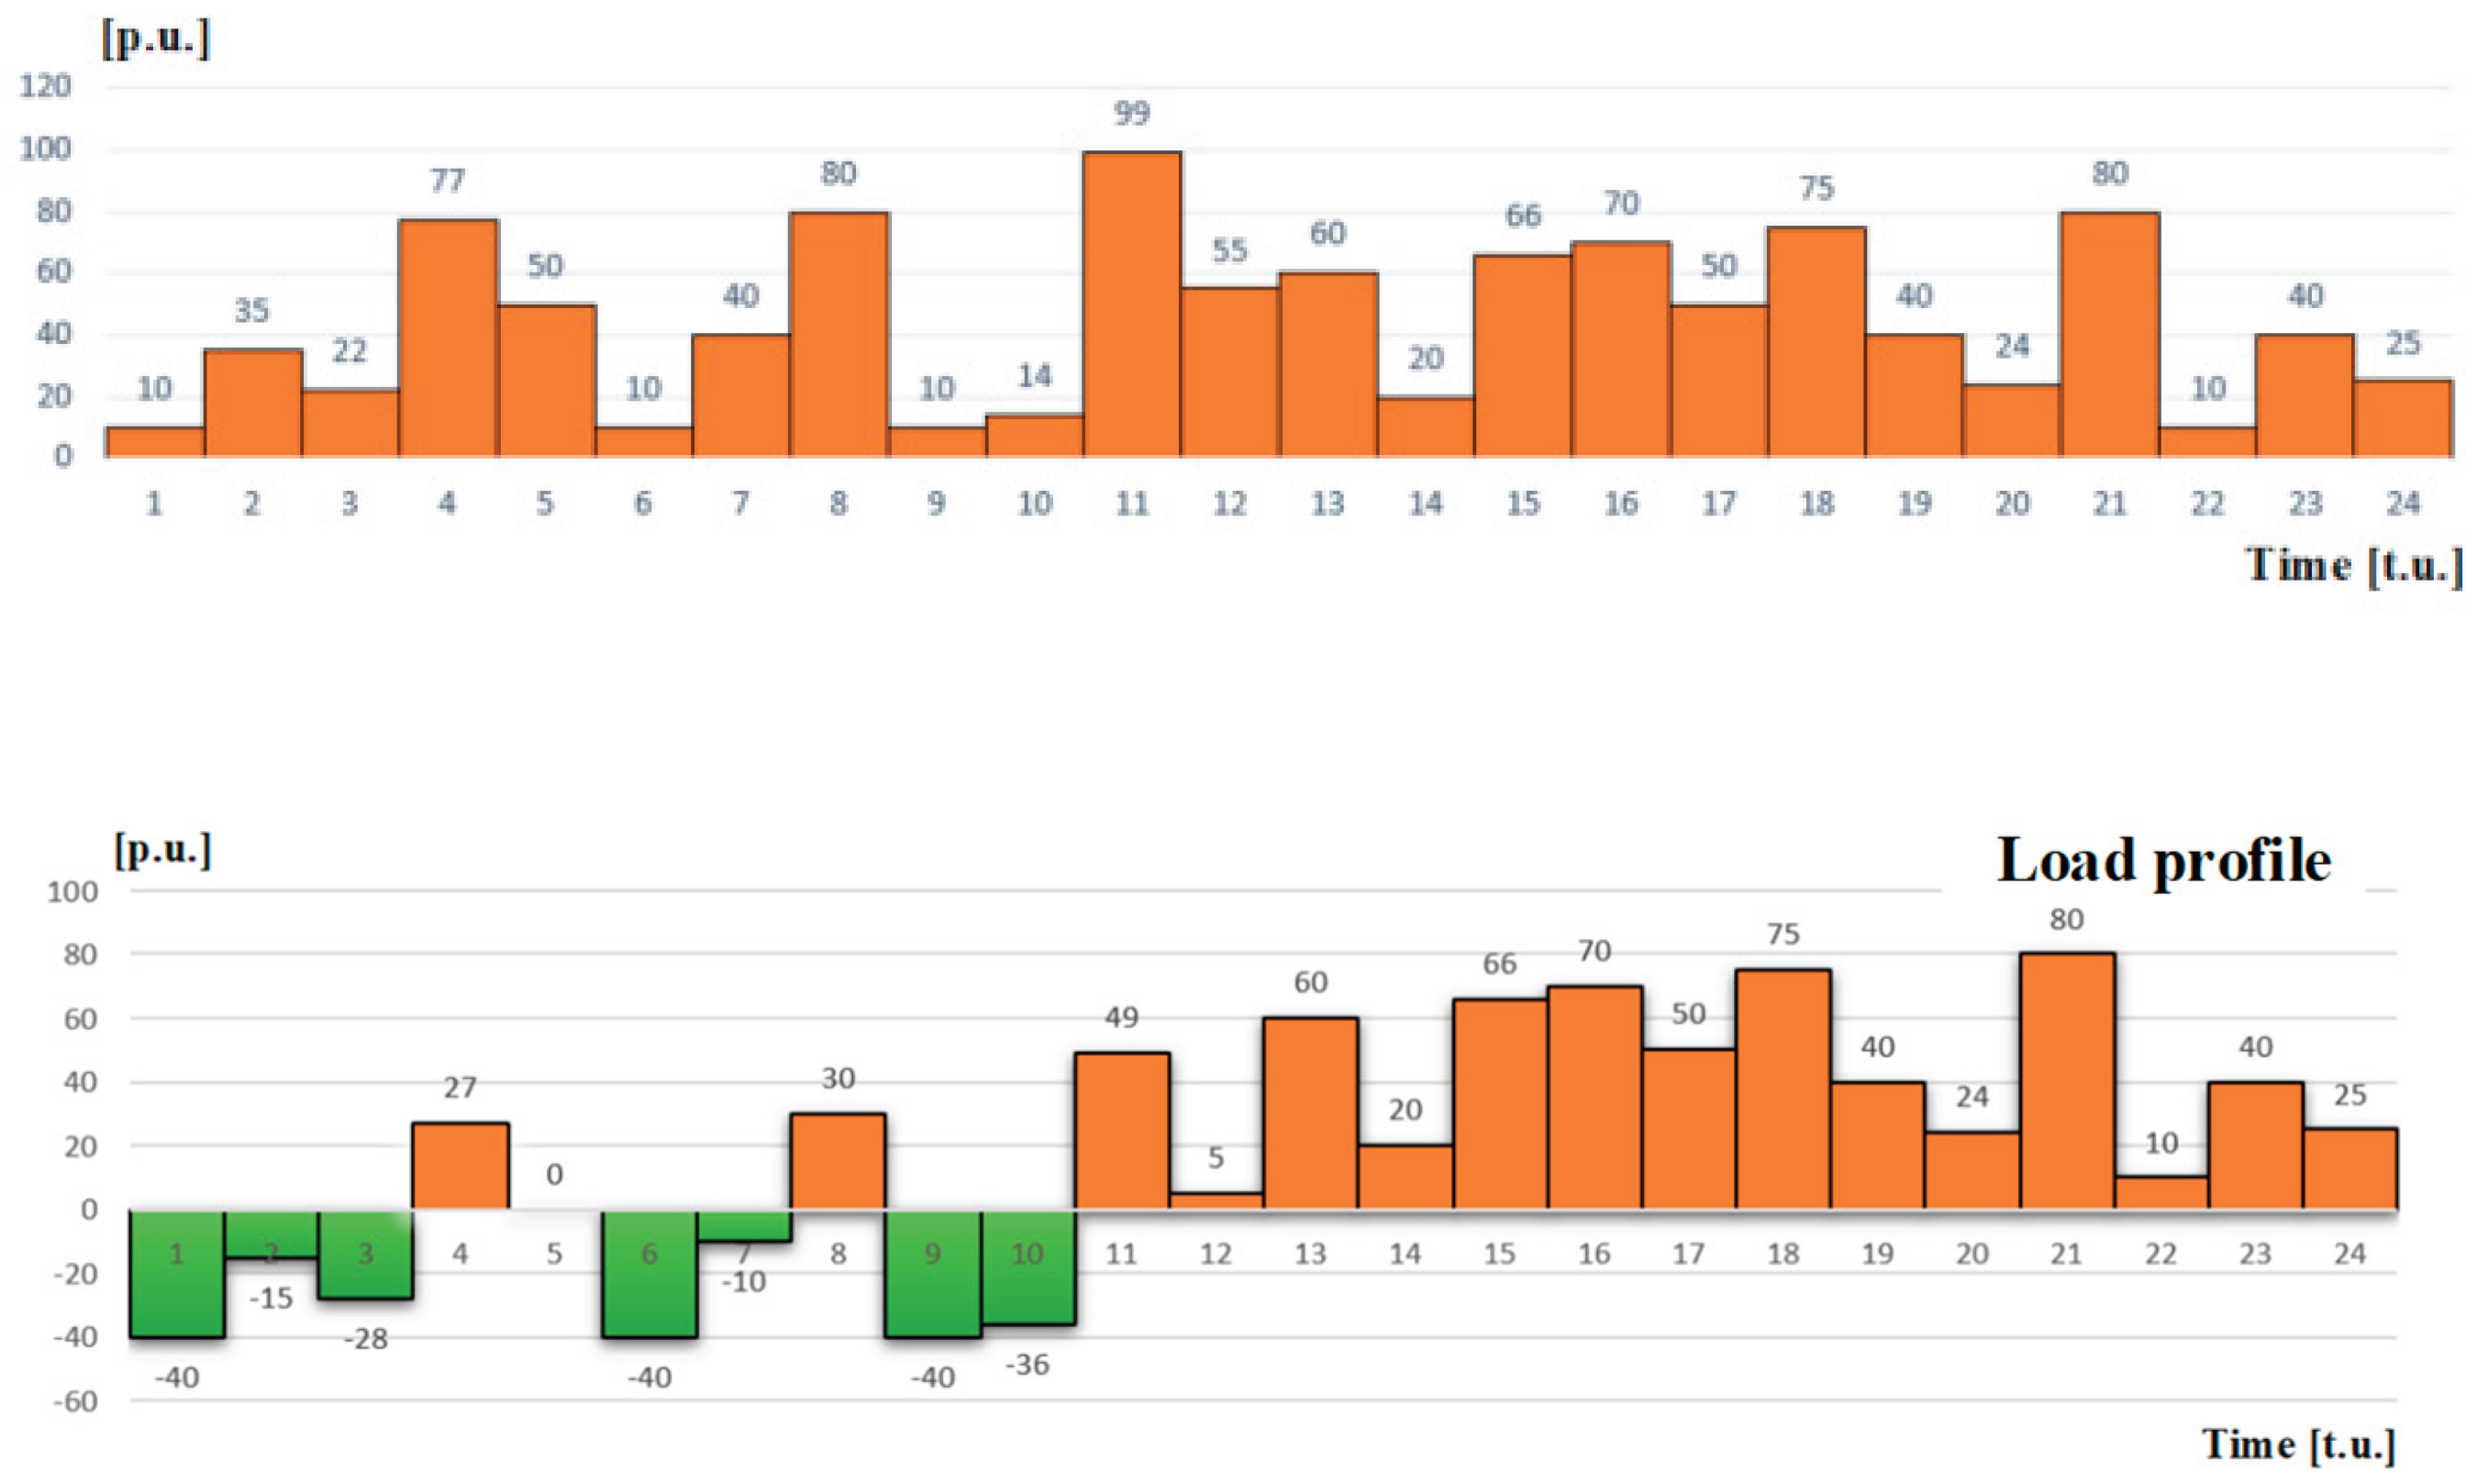
In a more detailed manner, a typical load profile can be figure out on a limited period of time, where t.u. represents the time unit (according with the process, time unit can be one hour), and p.u. is power unit according with the process.
Depending by the application, the load is connected to the energy power system, through a bus bar, where more power feeders could be interconnected and managed based on management algorithms.
The profile of load current (I
L) extracted from grid is described by the load demand. In such situation, without taking any corrective measures, the grid reacts with significant fall of the generator’s frequency (up to 2-5 Hz) [
7]. The literature describes methods to improve the frequency stability, one well known method being virtual inertia system. Whatever the case, using or not frequency corrective system, the falling event normally is expanded up to 10 seconds, then the stabilization process is done in two steps: the grid response, which should happen in 10÷30 seconds, and the automatic generation control response must expand in 10÷30 minutes. Therefore, not only the fall’s magnitude but also the timing of its various events is significant.
A comparable occurrence is depicted in simulation models for small-scale local generators, that are impacted by abrupt variations in load. In both cases (without/with dumped bars for improving the transient response) the frequency is variating for a significant period, inducing high number of oscillations of the generator’s rotor [
8].
The use of local power generator, for the same load profile requires similar “protective measures”. The authors of [
9] designed a model of small-scale generator (comparable with most local power generators used in microgrid systems). A simplified interconnected system (main electrical grid and local power generator) is represented in
Figure 1.
In [
7,
8] a rigorous analysis of the torque variation at the generator’s rotor is presented. The typical step response shows important transient variation of the torque - more than 100% of the step amplitude, with the time to stabilization more than 2.
According with IEEE 1547 all necessary measures for re-synchronization and reconnection for health work of the system must be taken. If we consider a power balance at bus bar level, according with load profile, the
Figure 2 shows the possible situations (if the local generator’s power is 50 p.u. [kW] continuously for 12 hours).
Above the horizontal axes there is demand from the grid in a variation profile like shown in previous situation (in first 12 hours there are four power peaks required from grid). Then there are hour’s moments when there is available power, that will be injected into the grid.
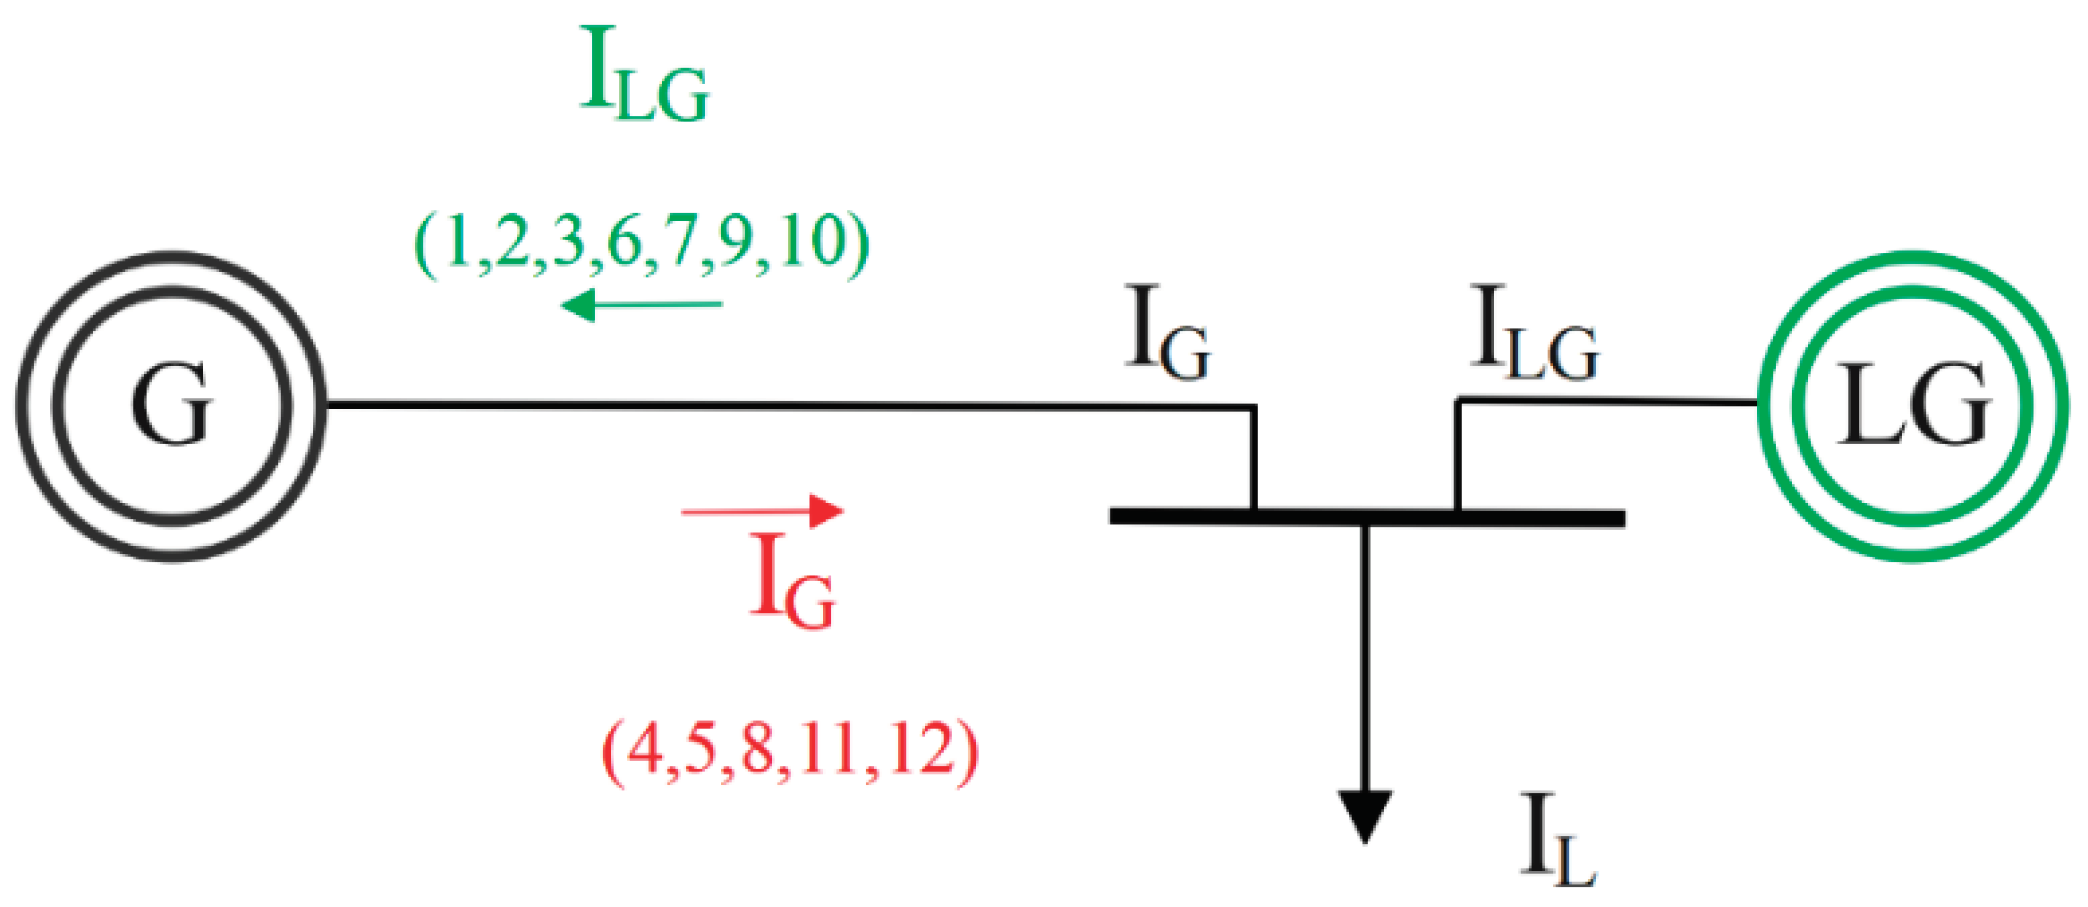
Figure 1 shows currents direction variation according with the load profile.
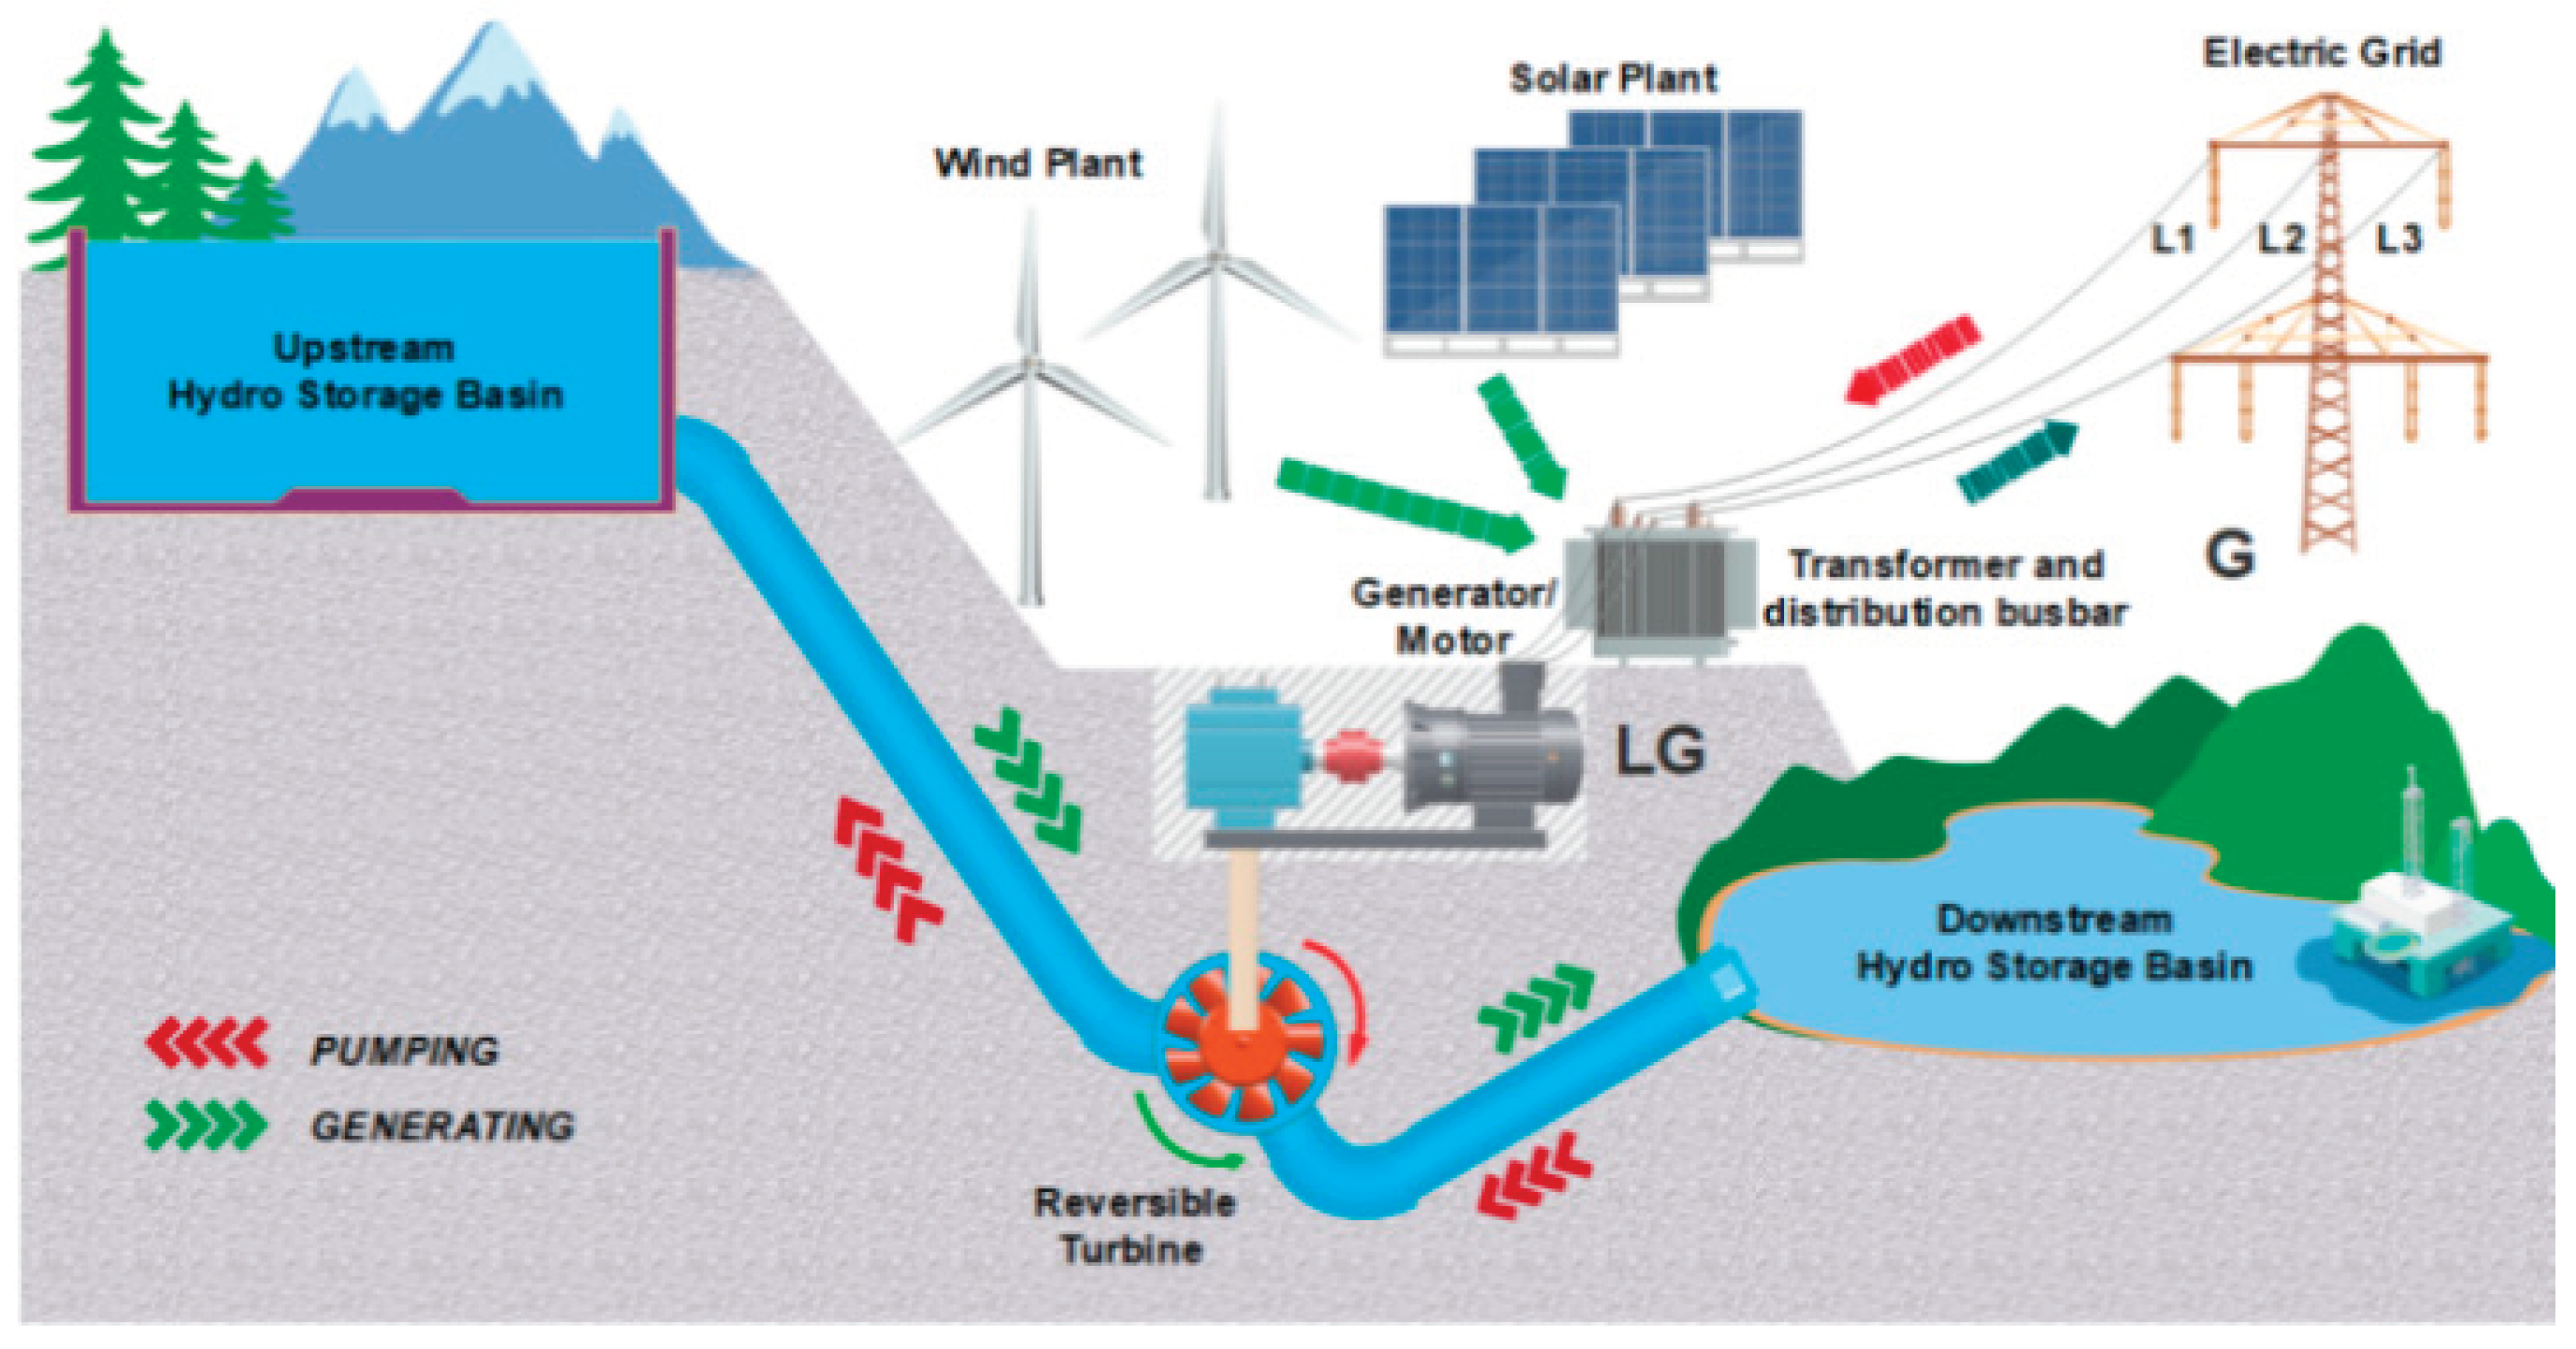
The standard structure of a pumped hydro storage (PHS) can be represented as in
Figure 3. The core point is the distribution busbar when main grid (G), local generator (LG) is connected for load supplying.
To simplify the representation, the figure does not show the load. In practice, the distribution busbar is insulated by the system/local generator with the use of insulation transformers (with step up/down functions).
Another important part of this structure is the reversible turbine, that is specially designed to be used as hydro plant turbine or pump turbine. This reversible turbine is mechanically connected to a synchronous machine via a proper gearbox. In this way, the obtained chain can use potential energy of the water from upstream hydro storage basin to produce electrical energy in local generator to be injected into the grid, or to be used by the load. If there is available energy from solar/wind systems or energy price is low, the working chain can be switched: the synchronous machine, now working as motor, drives the turbine in the way that pumps up the water from down-stream basin to be stored as potential energy, in upstream basin.
1.2. Research Contribution
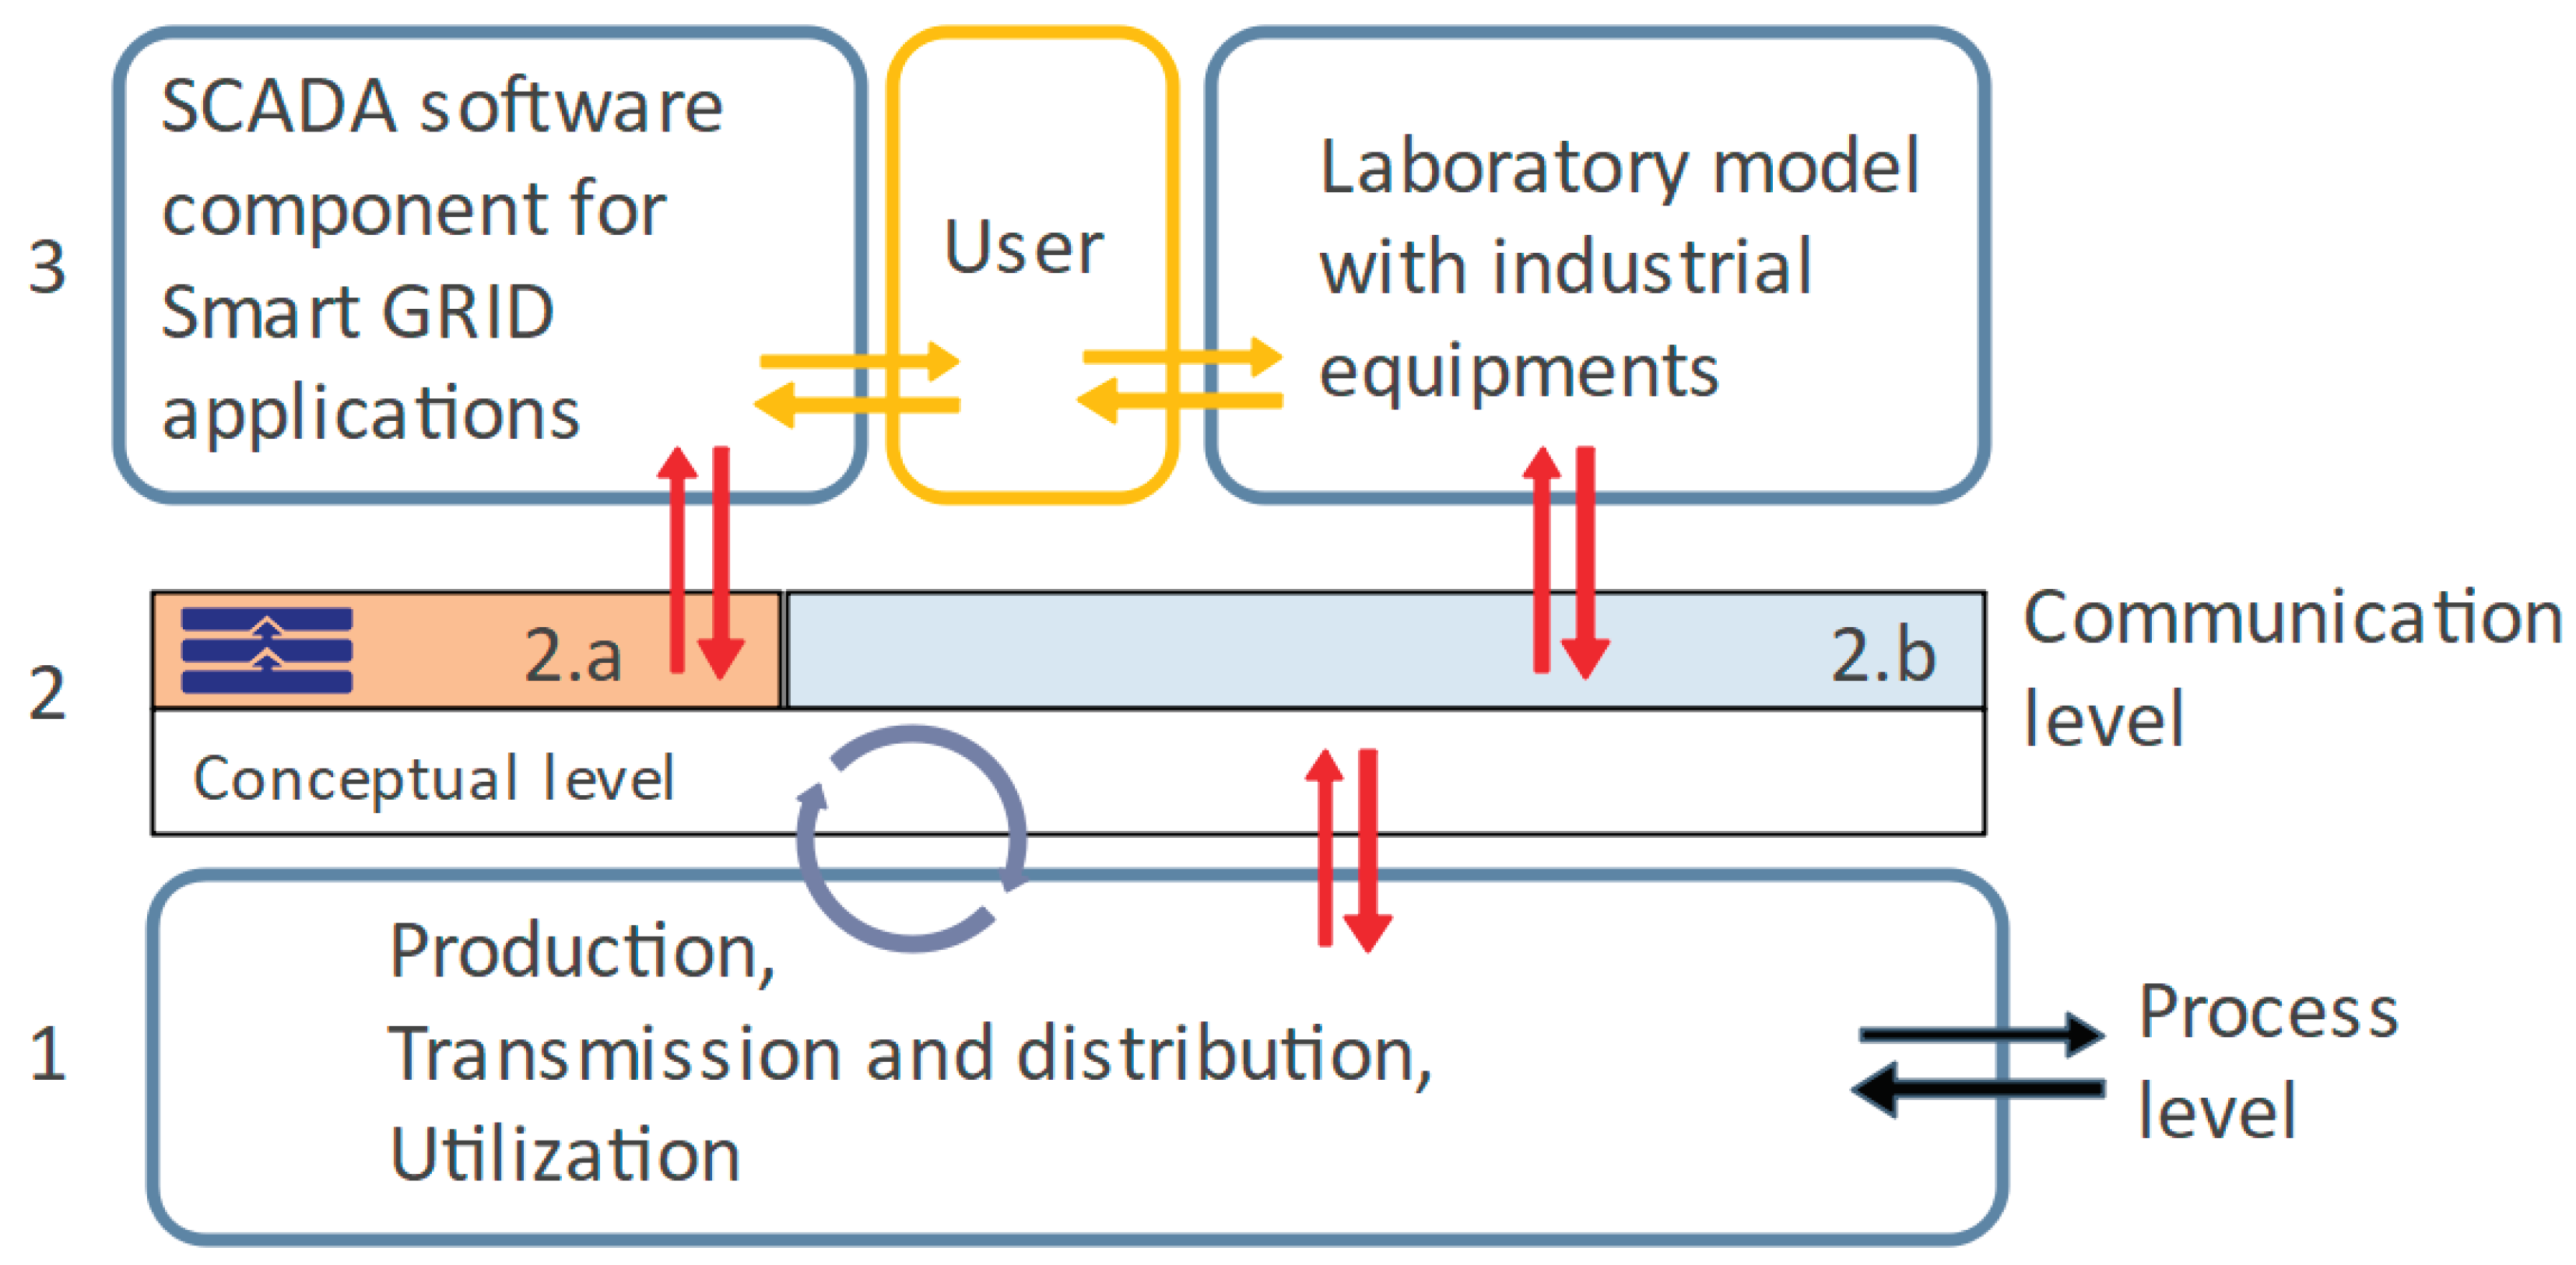
Taking into considerations the above listed functions requirement, the general approach of our research is represented in
Figure 4, where we will point out our contribution, as a main response to the interoperability demand formulated in IEEE 1457 [
10].
Because we are implied to different levels of the research, the above figure is explained as top-down modem of the involved components. We proposed this kind of architecture to add an educational value to the Smart Grid implementations when some up-dates are taken. The lowest level (1) is the process level, which is linked with hardware and SCADA software through communication (2) support layer, in our laboratory we are using Modbus (2.a) over RS 485 (2b) protocol. In the same time the two layers are linked each-other through concepts (example: we measure phase voltage; we validate the synchronization operation). The concept is “visible” up to the highest level, where the user must decide operations. At this level our contribution was to adapt the communication protocol to the above levels, and we have validated the designed response to the Smart Grid requirements, like in [
4,
5,
10].
Considering that we are adding to our research a new operational function by integrating a directional relay in PHS structure, our major concern was always interoperability. It was the reason why we checked the possibility for the user to interact with both, software (SCADA) and hardware (laboratory model); if fact we have replicated the real situations, where, for instance, the final decision is always taken by the user. At highest level of architecture representation (3).
The SCADA software has been designed entirely following typical SCADA functions, adapted to the lab model of a PHS implementation. In our implementation, we designed a laboratory model that is using industrial devices (synchronization and directional relays) working together with devices that are replicating major functions (grid component, power distribution breakers), as a response research focused hardware and software upgrade.
On the other hand, according with
Figure 1, not only momentary response problems appear, but also direction variations changes happen (time periods 3-4, 4-5, 5-6, 7-8, 8-9, there is a need to “prepare” the generators to react properly to the load profile and, if possible, to apply some load profiles optimization. In the revision process of the IEEE 1457 [
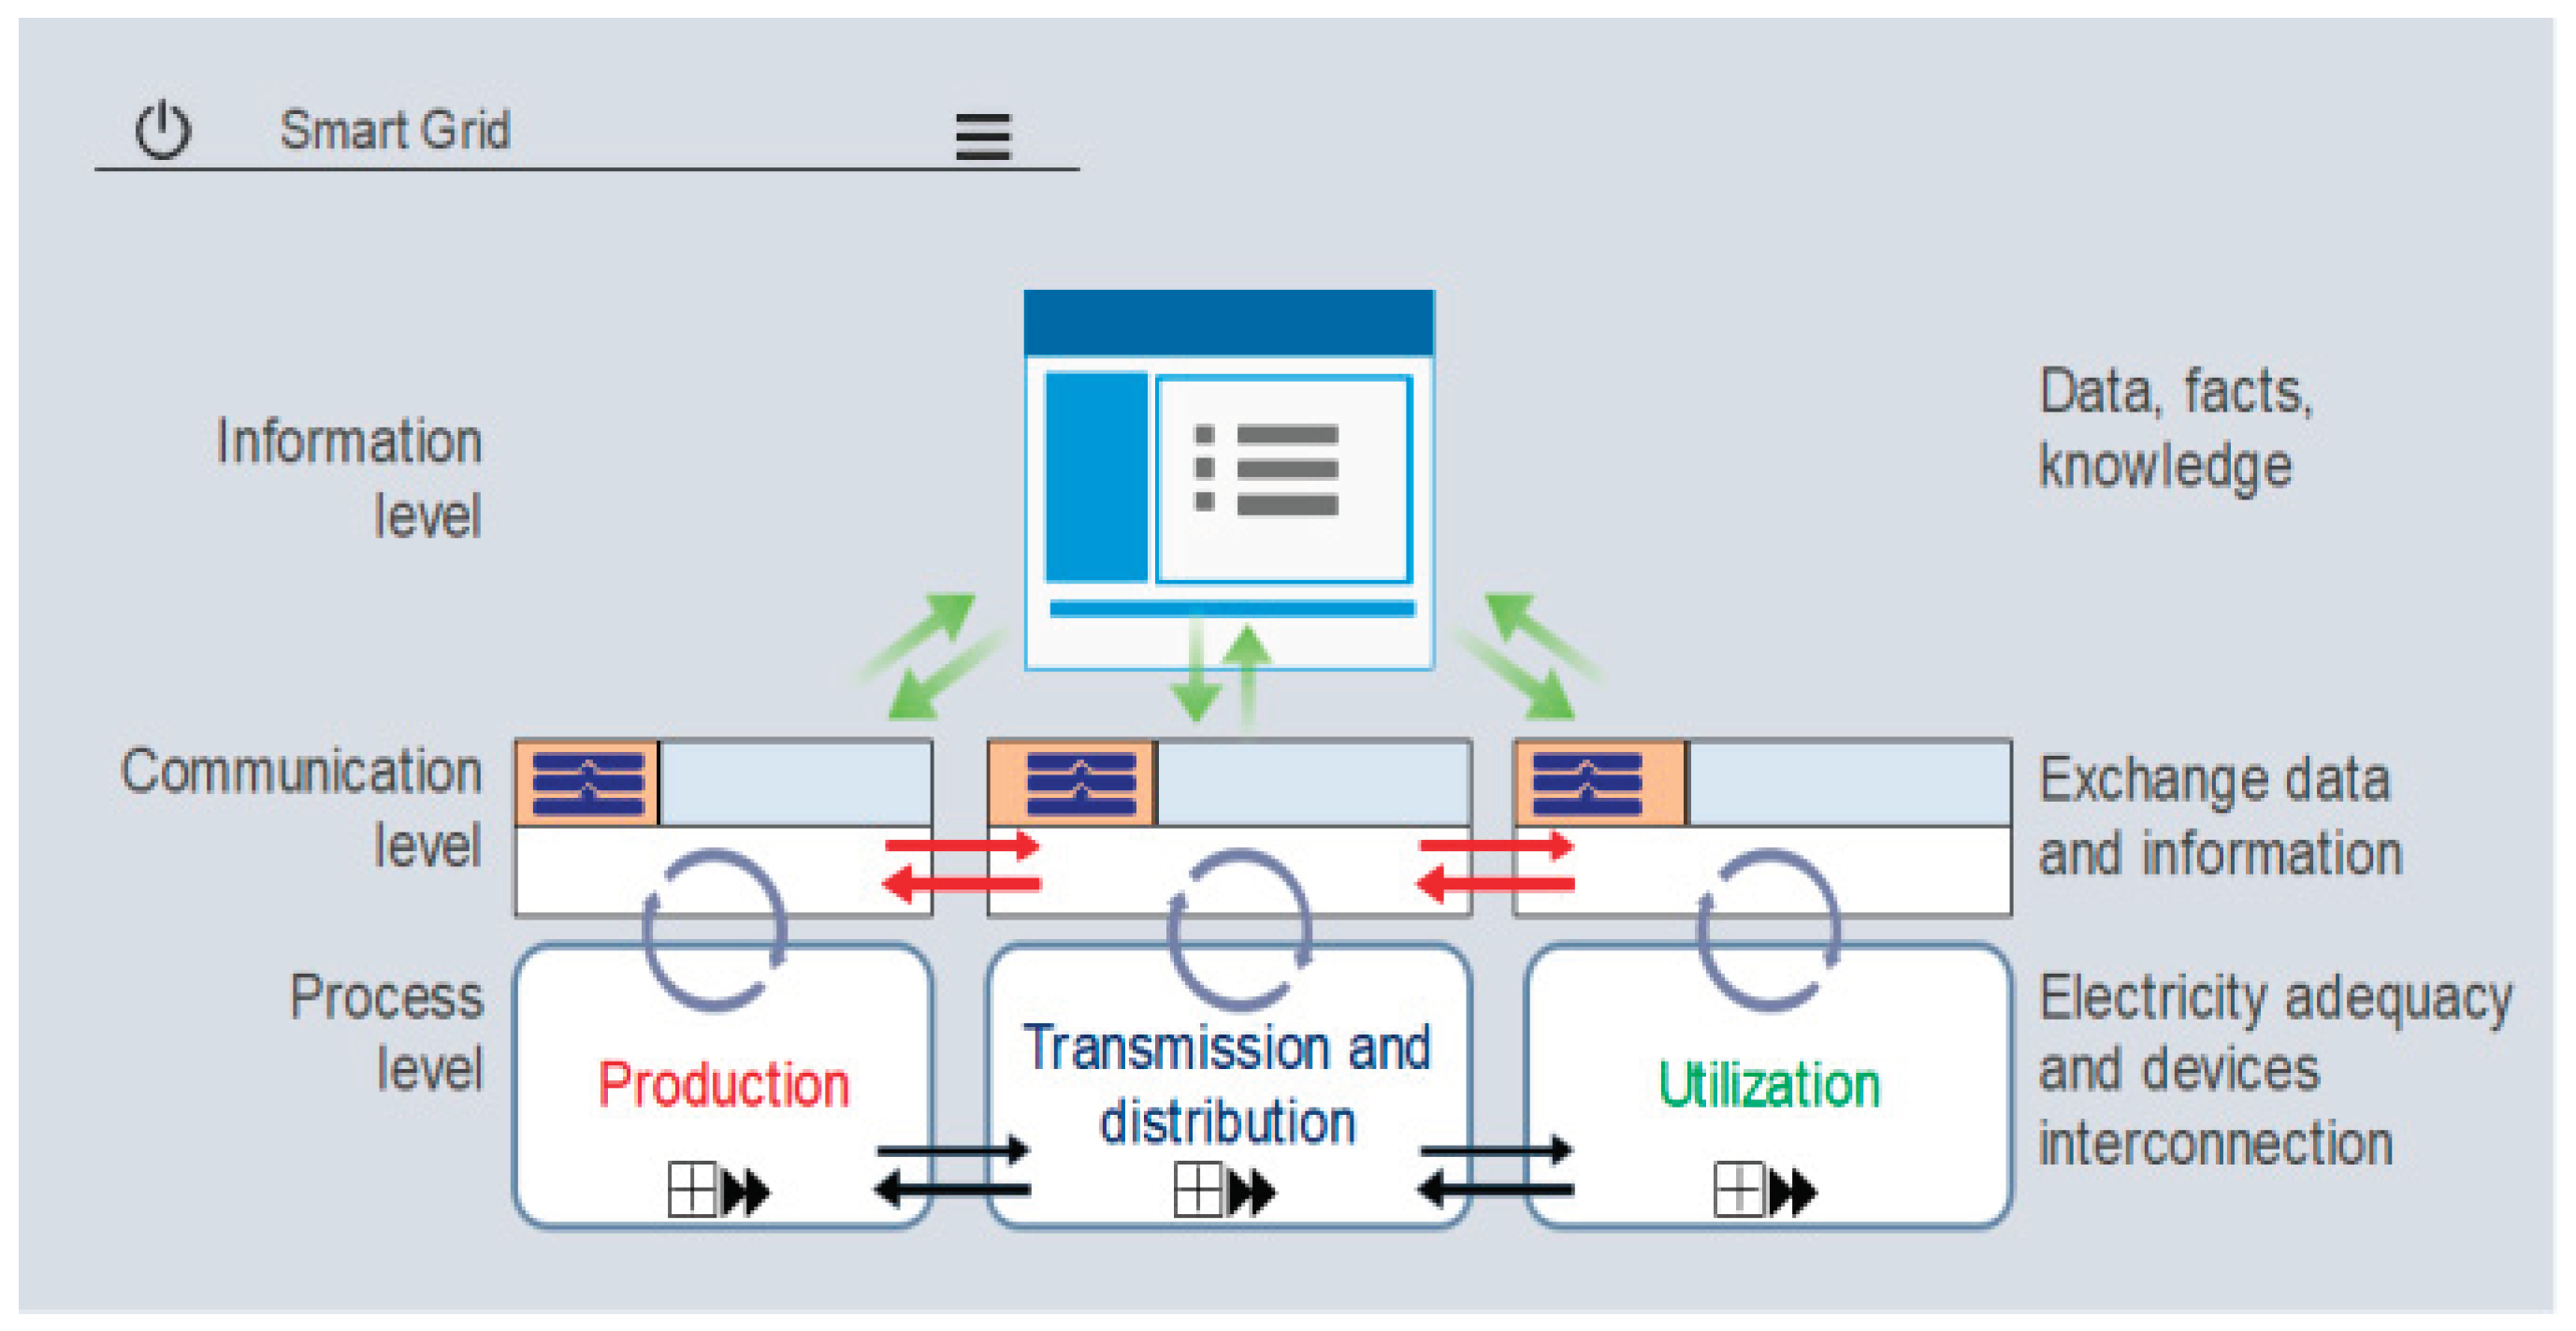
10] is formulated an improvement also in terms of process interfaces, as illustrated in
Figure 5.
We agree with the structure formulated in [
10], the only differences we propose are related to the structure: a top-down architecture defines more clearly in our opinion the relationships between entities. We agree with the electricity adequacy [
11] because it respond to the commitment of security and local constrains, and because of this reason, a part of our “interface optimization” work is dedicated to the way we interconnect devices, and how they are “visible” at the information level.
If we accept that protocols for communication also mean information, we also agree with the authors of [
10] structure. This level is responsible for exchanging information between all entities (horizontal and vertical directions).
A bit more complex level is the information level we are proposing, where we identify meanings (data, facts, knowledge [
10]), and where processing functions are implemented for fulfilling security constrained unit commitments to the formulated purpose, clearly described in the flowchart designed by the authors of [
12], called imperialist competitive algorithm. Our understanding from the algorithm question “is there a colony which has better objective function than that of imperialist” force us to always focus on “better objective function”- electricity price at load busbar is our laboratory criteria we should consider. Then we can add or not different constrains. We can only implement such algorithms in an information level integrated into a software, and eventually working as a part of smart grid, as [
10] also suggests.
Our approach intends to improve the “interface” between communication and information entity by using a directional relay (67 ANSI Code) controlled by a supervisory control and data acquisition (SCADA) designed software, which allows improvement of interoperability (the capability of two or more networks, systems, devices, applications, or components to externally exchange and readily use information securely & effectively [
10]).
Our approach responds also to the revision proposal for IEEE 2030.2-2015 (which should regulate the interoperability between storage systems with electric power grid) [
11] - chapter 3. It will contain two parts: directional supervision/protection, and coordinate (readily use information securely and effectively) the energy storage process into an interconnected system.
In summary, the goal of this study is to provide a visible improvement of a security constrained electrical energy management solution as an add-on to the operation of the Smart Grid Systems. The SCADA-Based update is modernized and applied to a pumped stored energy solution simulated by an industrial device-filled lab model.
2. Fundamentals of Directional Analysis
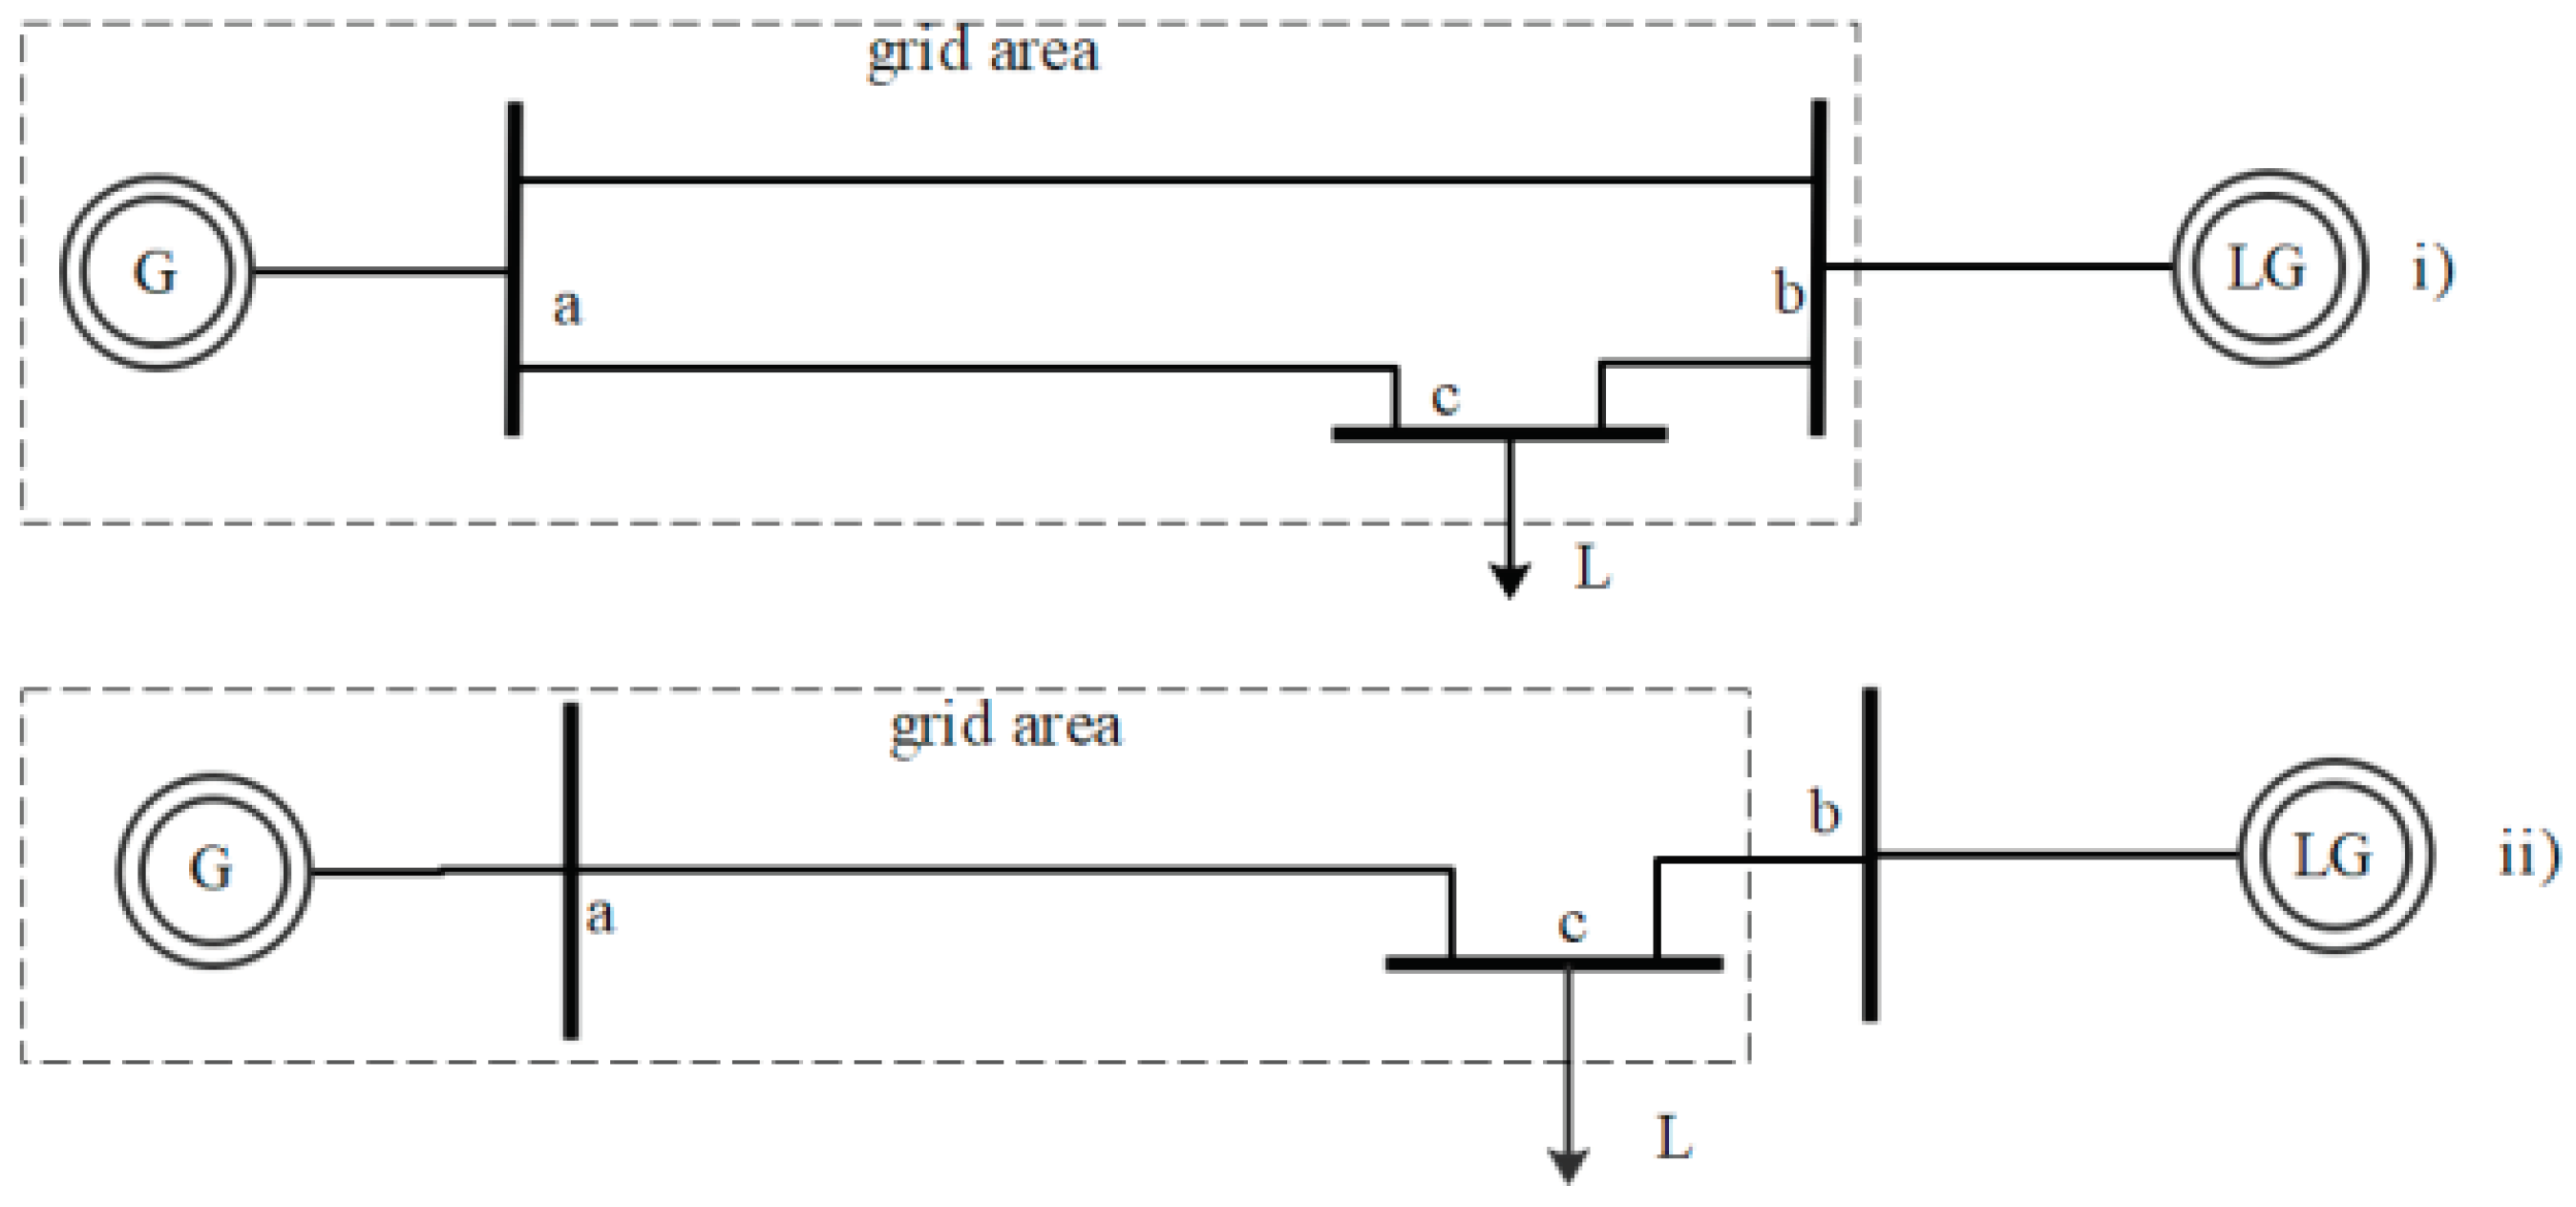
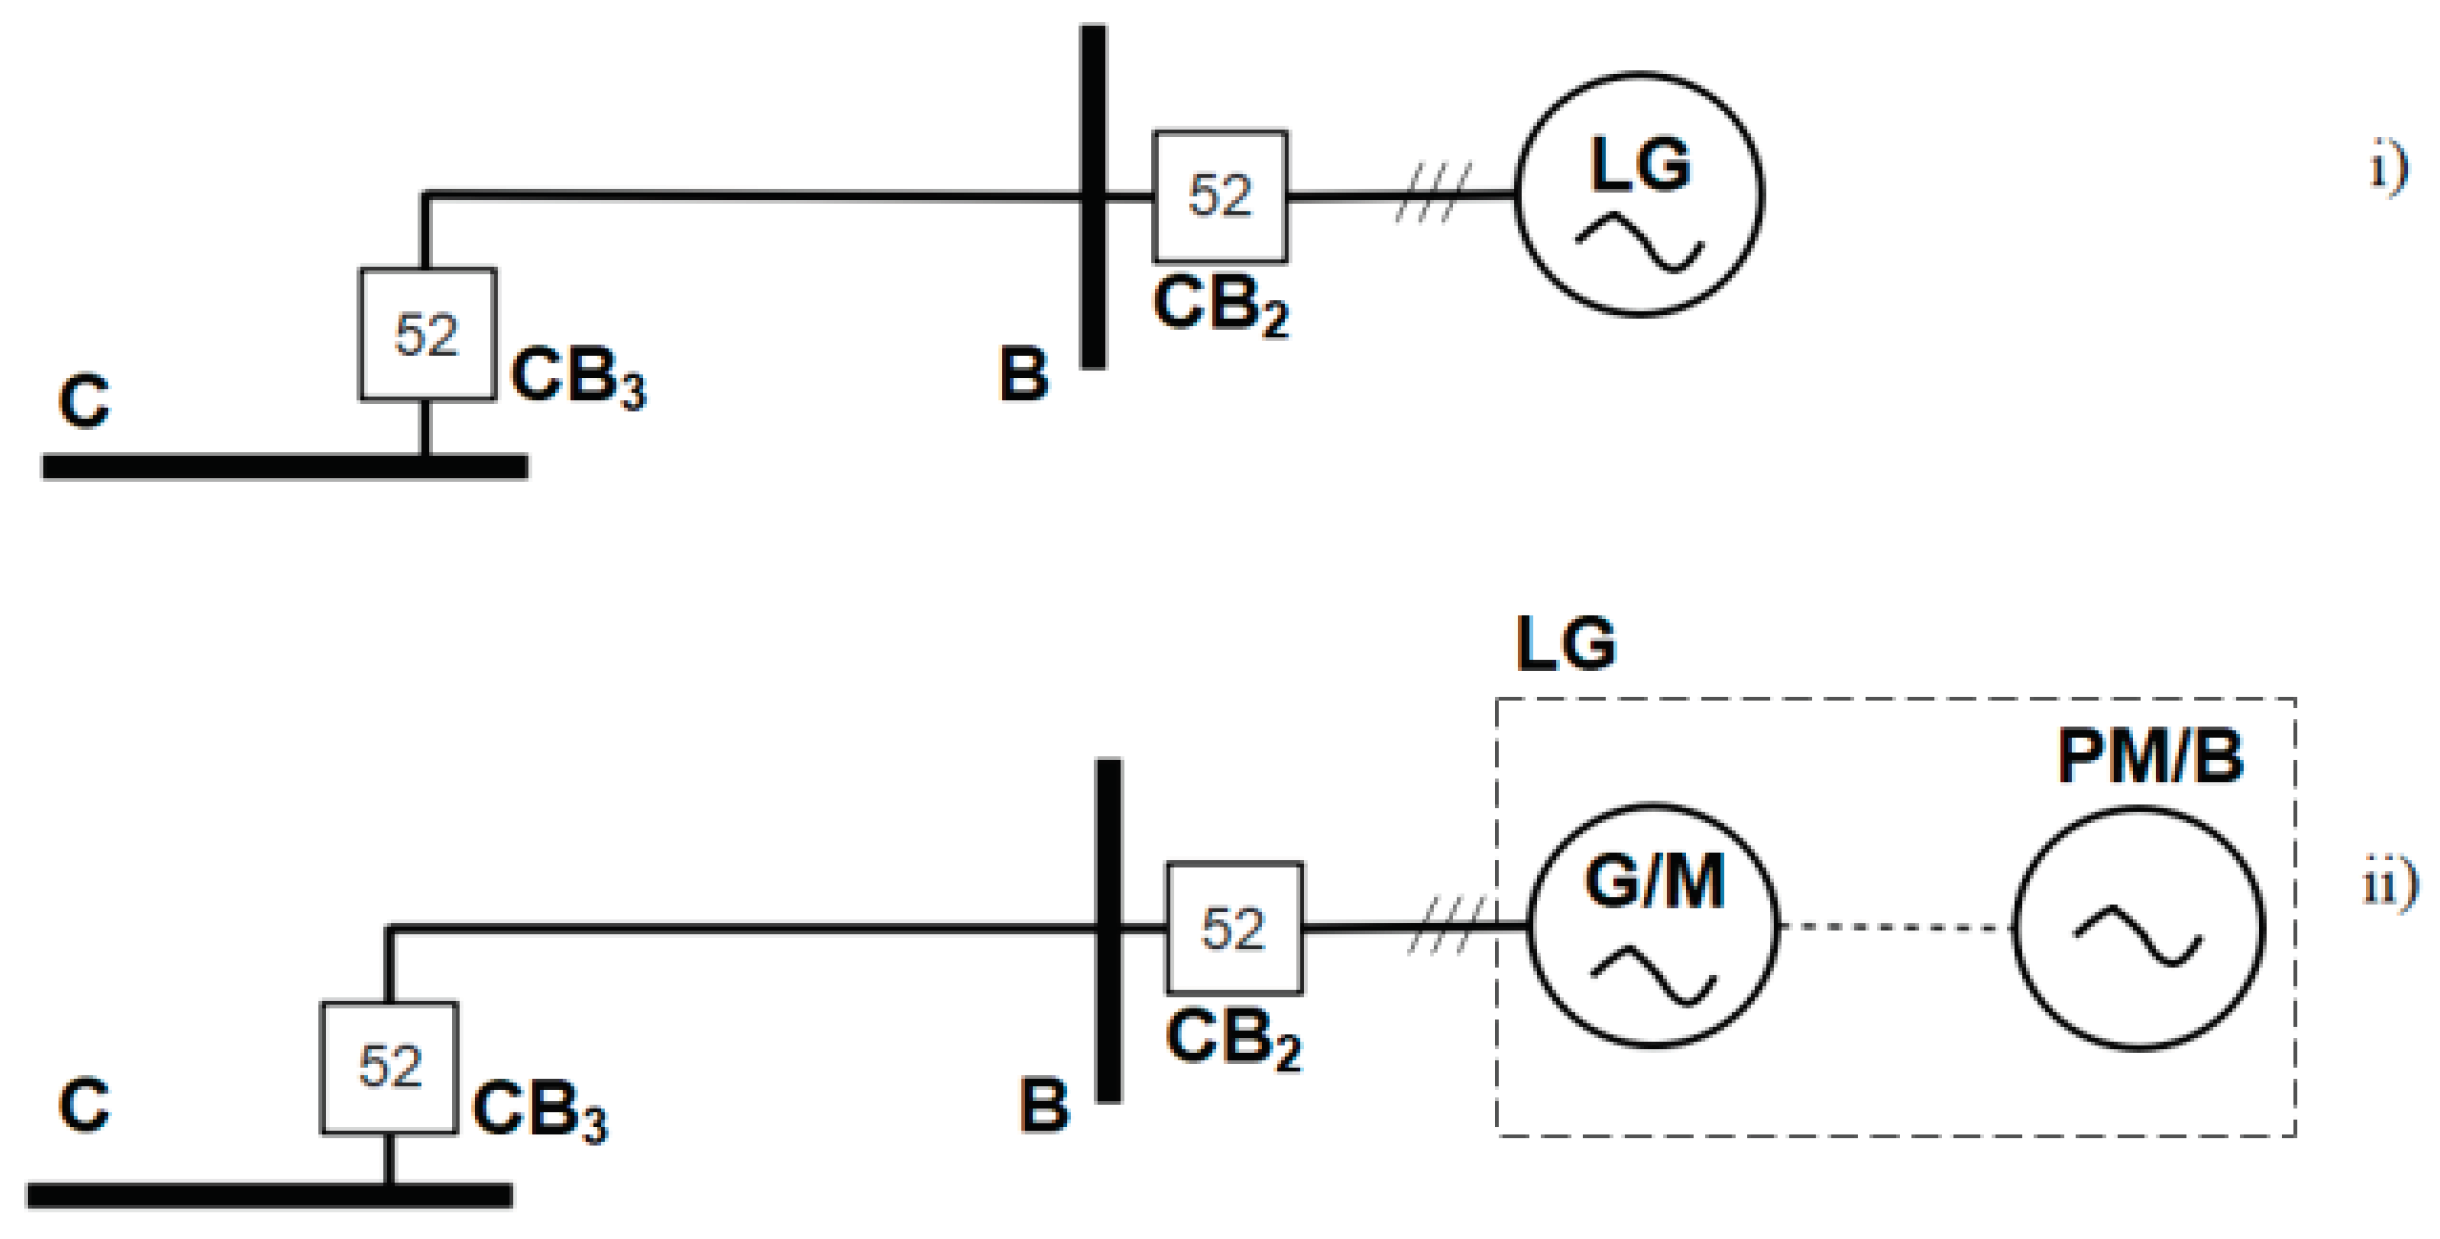
According with IEEE 315-1975 symbol library, the analysis has begun from a typical representation of an IEEE-3 bus electric power network configuration, as a basic configuration for integration of a local power supply to the main grid system (as in
Figure 6).
The load (L) is connected to the electric grid through the busbar c, which is then linked to the main grid source (G) and local generator (LG) through the busbars (a) and (b). The typical IEEE- three bus network configuration uses parallel lines (
Figure 6i), and for simplified analysis (when local generator is sensible les powerful that the grid capacity) we are using the second configuration (
Figure 6ii).
The basic operating characteristic of any protection relay (we include here the overcurrent protection, directional protection) depends on the energizing values of the currents, or voltage, or various combinations of these two quantities (especially the phase between two parameters).
To start protection or power flow analysis, it is usually necessary to know the mathematic representation of the current and voltage, in momentary values and phases. Then, according with networks configurations there is a requirement of system analysis, in fault conditions, with the reference to the various points within the analyzed system.
The analysis considers the power system as a network of circuit elements contained in branches (closed loops or meshes), described by impedance and admittance.
We resume here the well know mathematical parameters for currents- i(t) and voltage- v(t)- in a sinusoidal system. Thus, if the line is supplied by the voltage:
Then, if the line parameters are composed by resistances (R), capacitances (C), and inductances (L) connected serially, the current established in this circuit is:
where φ is the phasor between voltage and current.
In this context, for a three phases power system, there is a convention related to vector representation. In a system built by three phases, from the generator (G), the voltage phases (UU, UV, UW) supply the three phases load (L), being established three phase currents (IL1, IL2, IL3).
If the system is symmetrical the representation of the power network and associate vector representation is shown in
Figure 7.
However, the controlled parameter, where the technical literature gives it a particular name as zero-sequence variable as:
is very simple to evaluate by using three current transformers for measuring phases currents, or by a coil (ring CT) around the three phases.
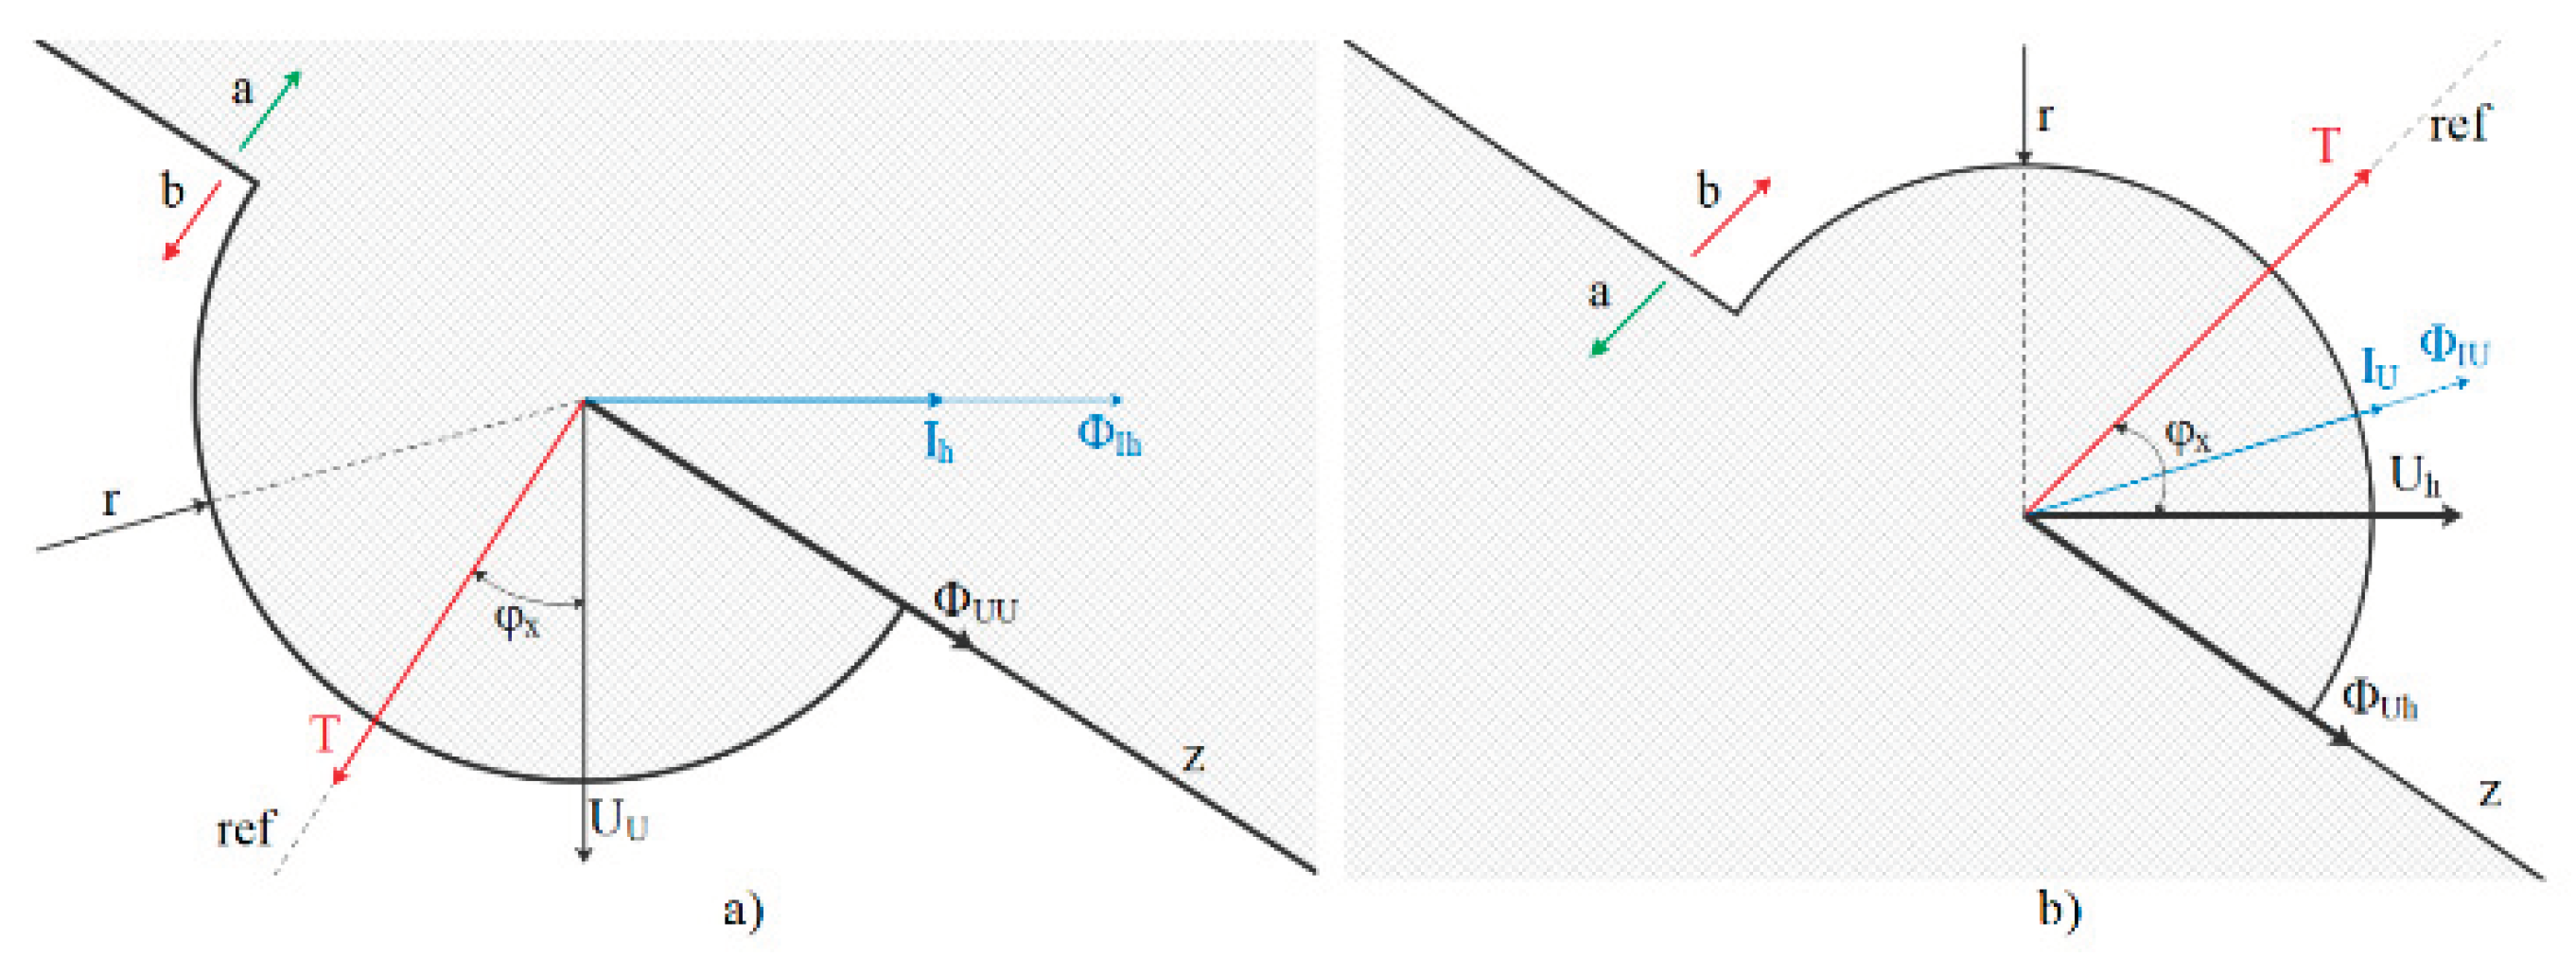
The estimation of the direction of the current (not only in fault situation but also in the situation of changing the direction of the power) requires also to consider the voltage vector (U
u). In both situations, by measuring the angle between the specific electrical parameters (the voltage flux ϕ
U and current flux ϕ
Ih, responsible for creating the torque T) allows to create a zone of protection (b), and non-sensitive area (a), like in
Figure 8-a. For practical reasons, the torque direction will be considered as reference (ref) while the angle between torque direction and the voltage vector is the directional protection angle (φ
x).
If is established a reference angle of the electrical parameters related to φ
x, and if we consider a threshold (r) of the parameter that must be controlled (in our case zero-sequence variable I
h), according with the phase angle of the controlled parameter, the z axes define not protected zone (a) and protected zone (b) [
13,
14].
The direction of the power flow is detected by establish the controlled parameter:
related to the phase voltage U
U, to avoid dead protection zone when earth fault occurs. Furthermore, the protection is adjusted according with the angle between U
h and I
U, and by setup the relay measuring the current I
U and the voltage U
h has a 90° relay connection [
15]. A possible situation of the protection can be represented as in
Figure 8-b (retaining the meanings of notations as in
Figure 8-a).
By checking the angle and amplitude of the controlled parameter with the help of an appropriate relay, it is possible to monitor both the direction of the power flow and the overcurrent fault.
Figure 8.
a) the vectorial representation of the I
h current; b) the vectorial representation of the U
h voltage- particularized from [
15].
Figure 8.
a) the vectorial representation of the I
h current; b) the vectorial representation of the U
h voltage- particularized from [
15].
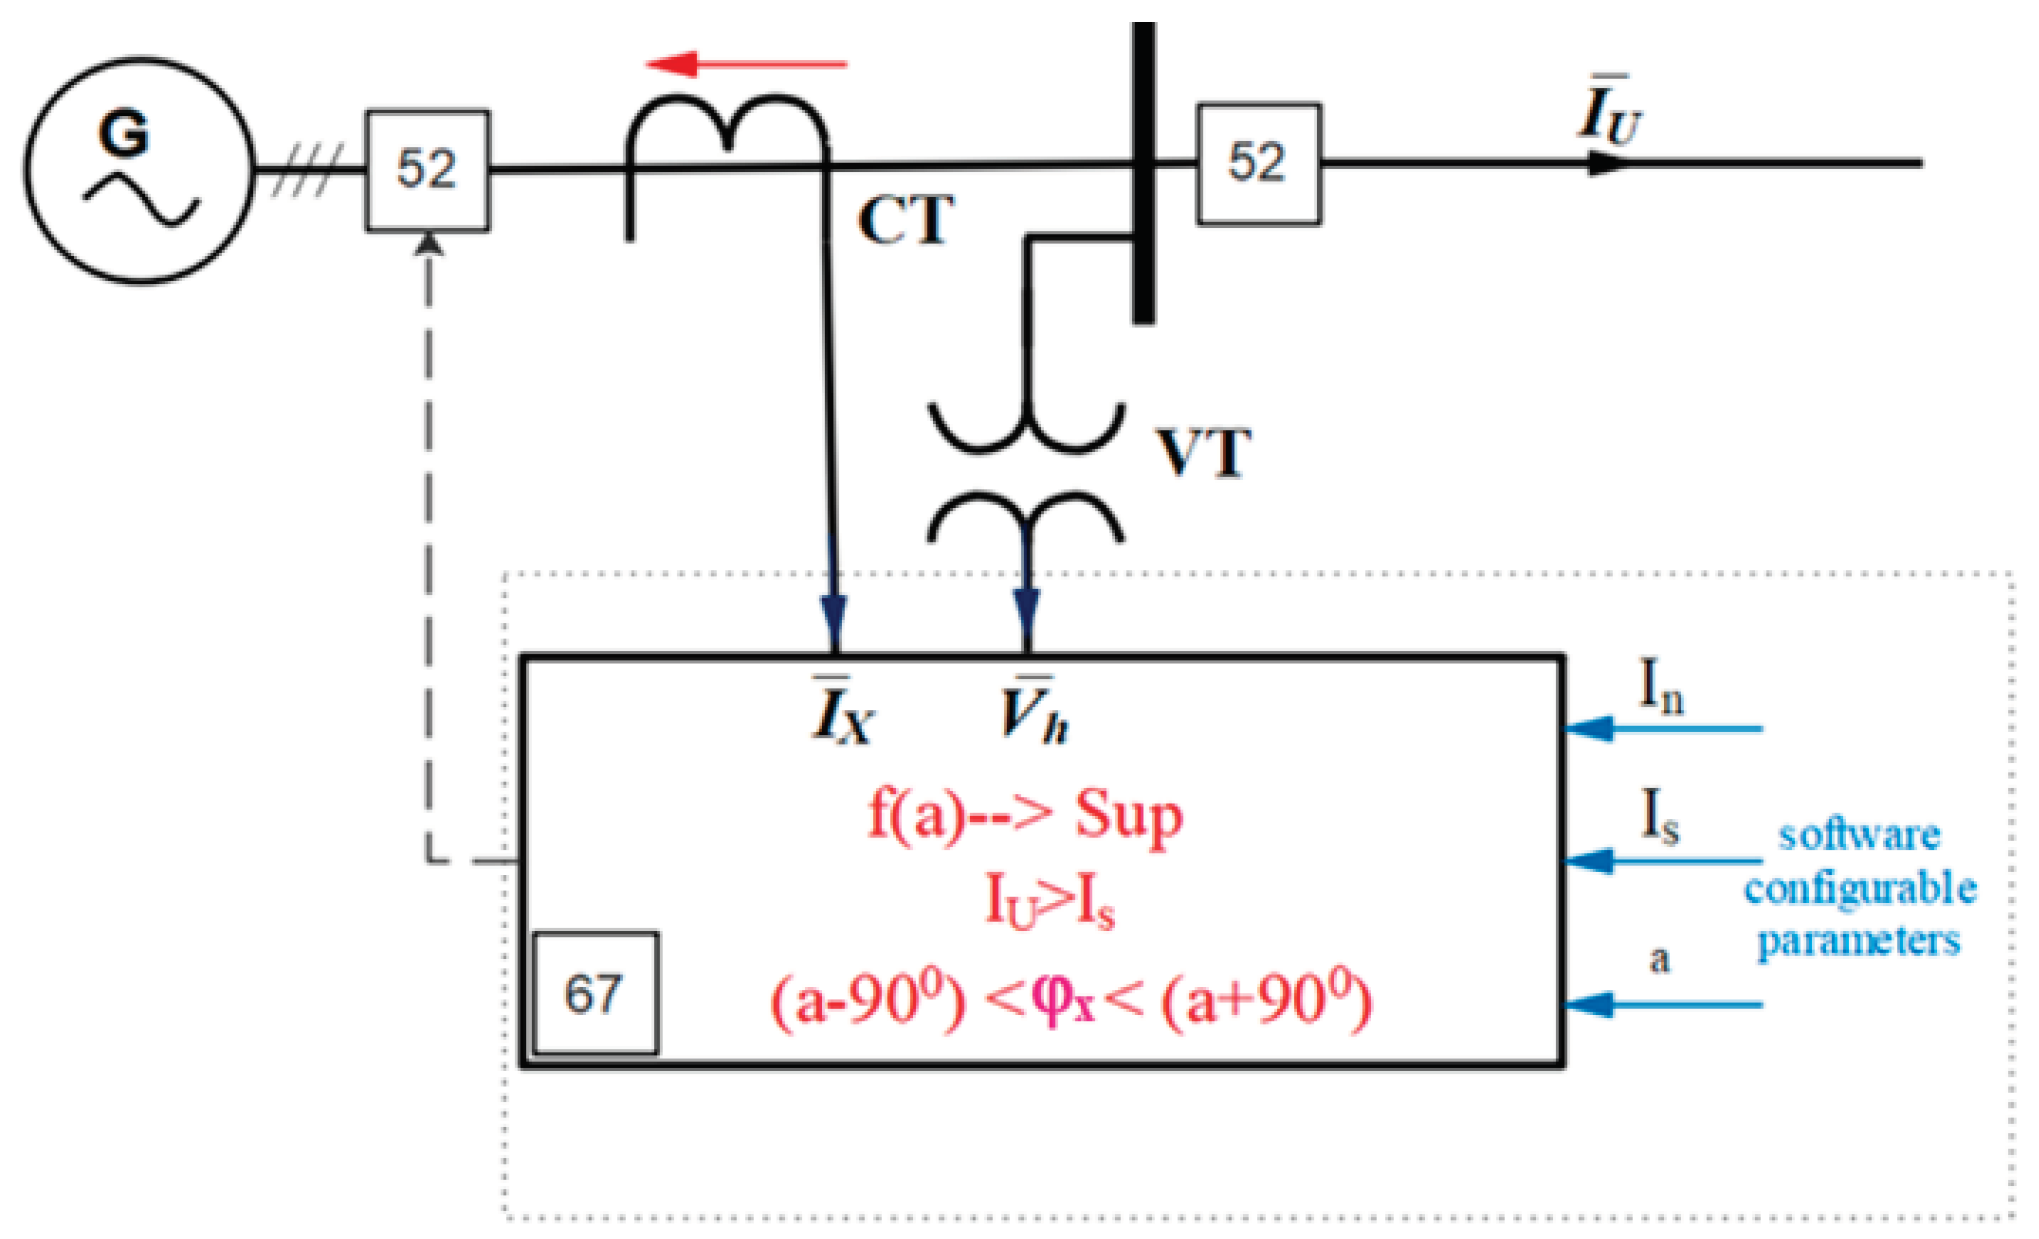
The directional relay (ANSI 67) in
Figure 9, is collecting information about the power line’s voltages (through the vector V
h), and the power line’s currents (through I
x) for estimating the amplitude and phase ϕ
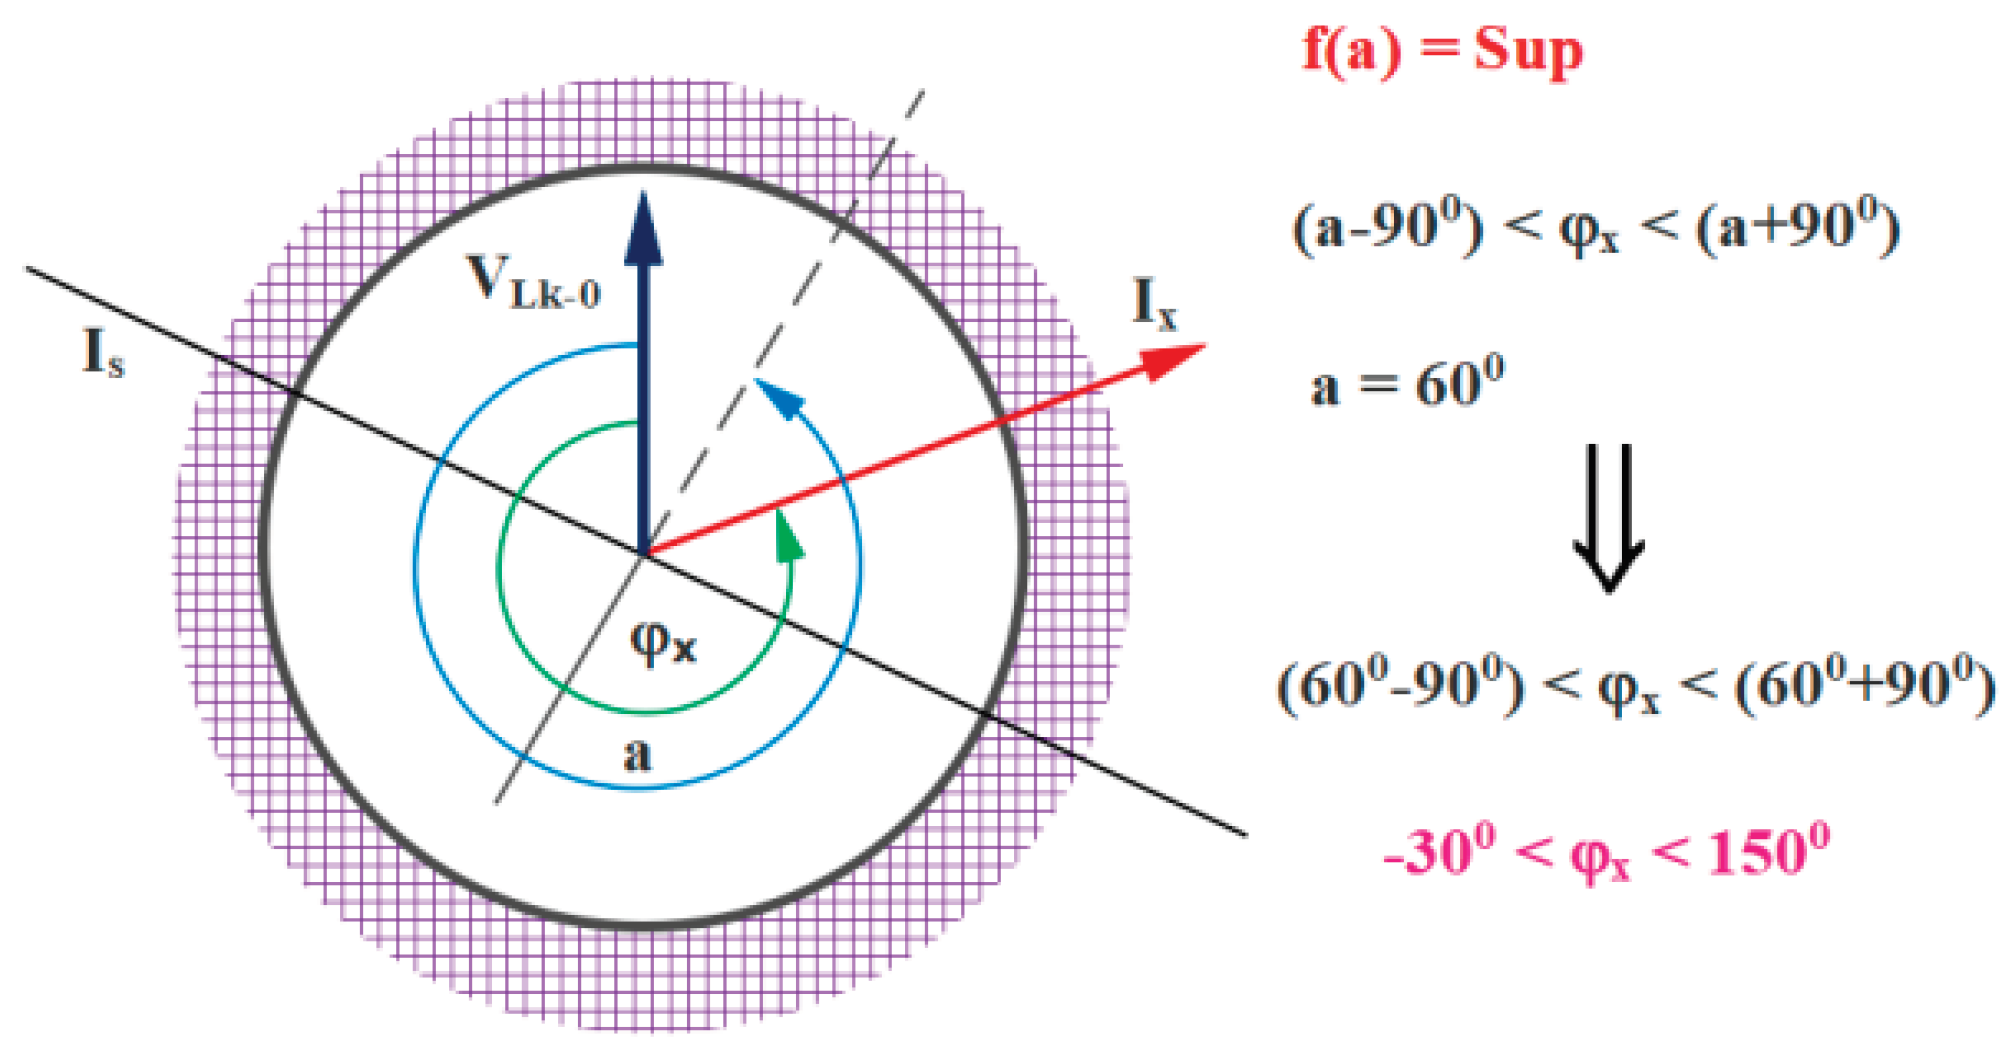
x which has been defined above. The user enters in this relay the working and supervising parameters: rated current (I
n), trip overcurrent (I
s), and protection angle (a) - notations are referring to relay’s technical documentation [
15].
According with implemented method (example: f(a)=supervision), the relay compares the amplitude of the current first, and then changes of angle ϕx. When both conditions are fulfilled, the relay sends command to the power breaker from the beginning of the power network (52), for disconnecting the segment of protected power network.
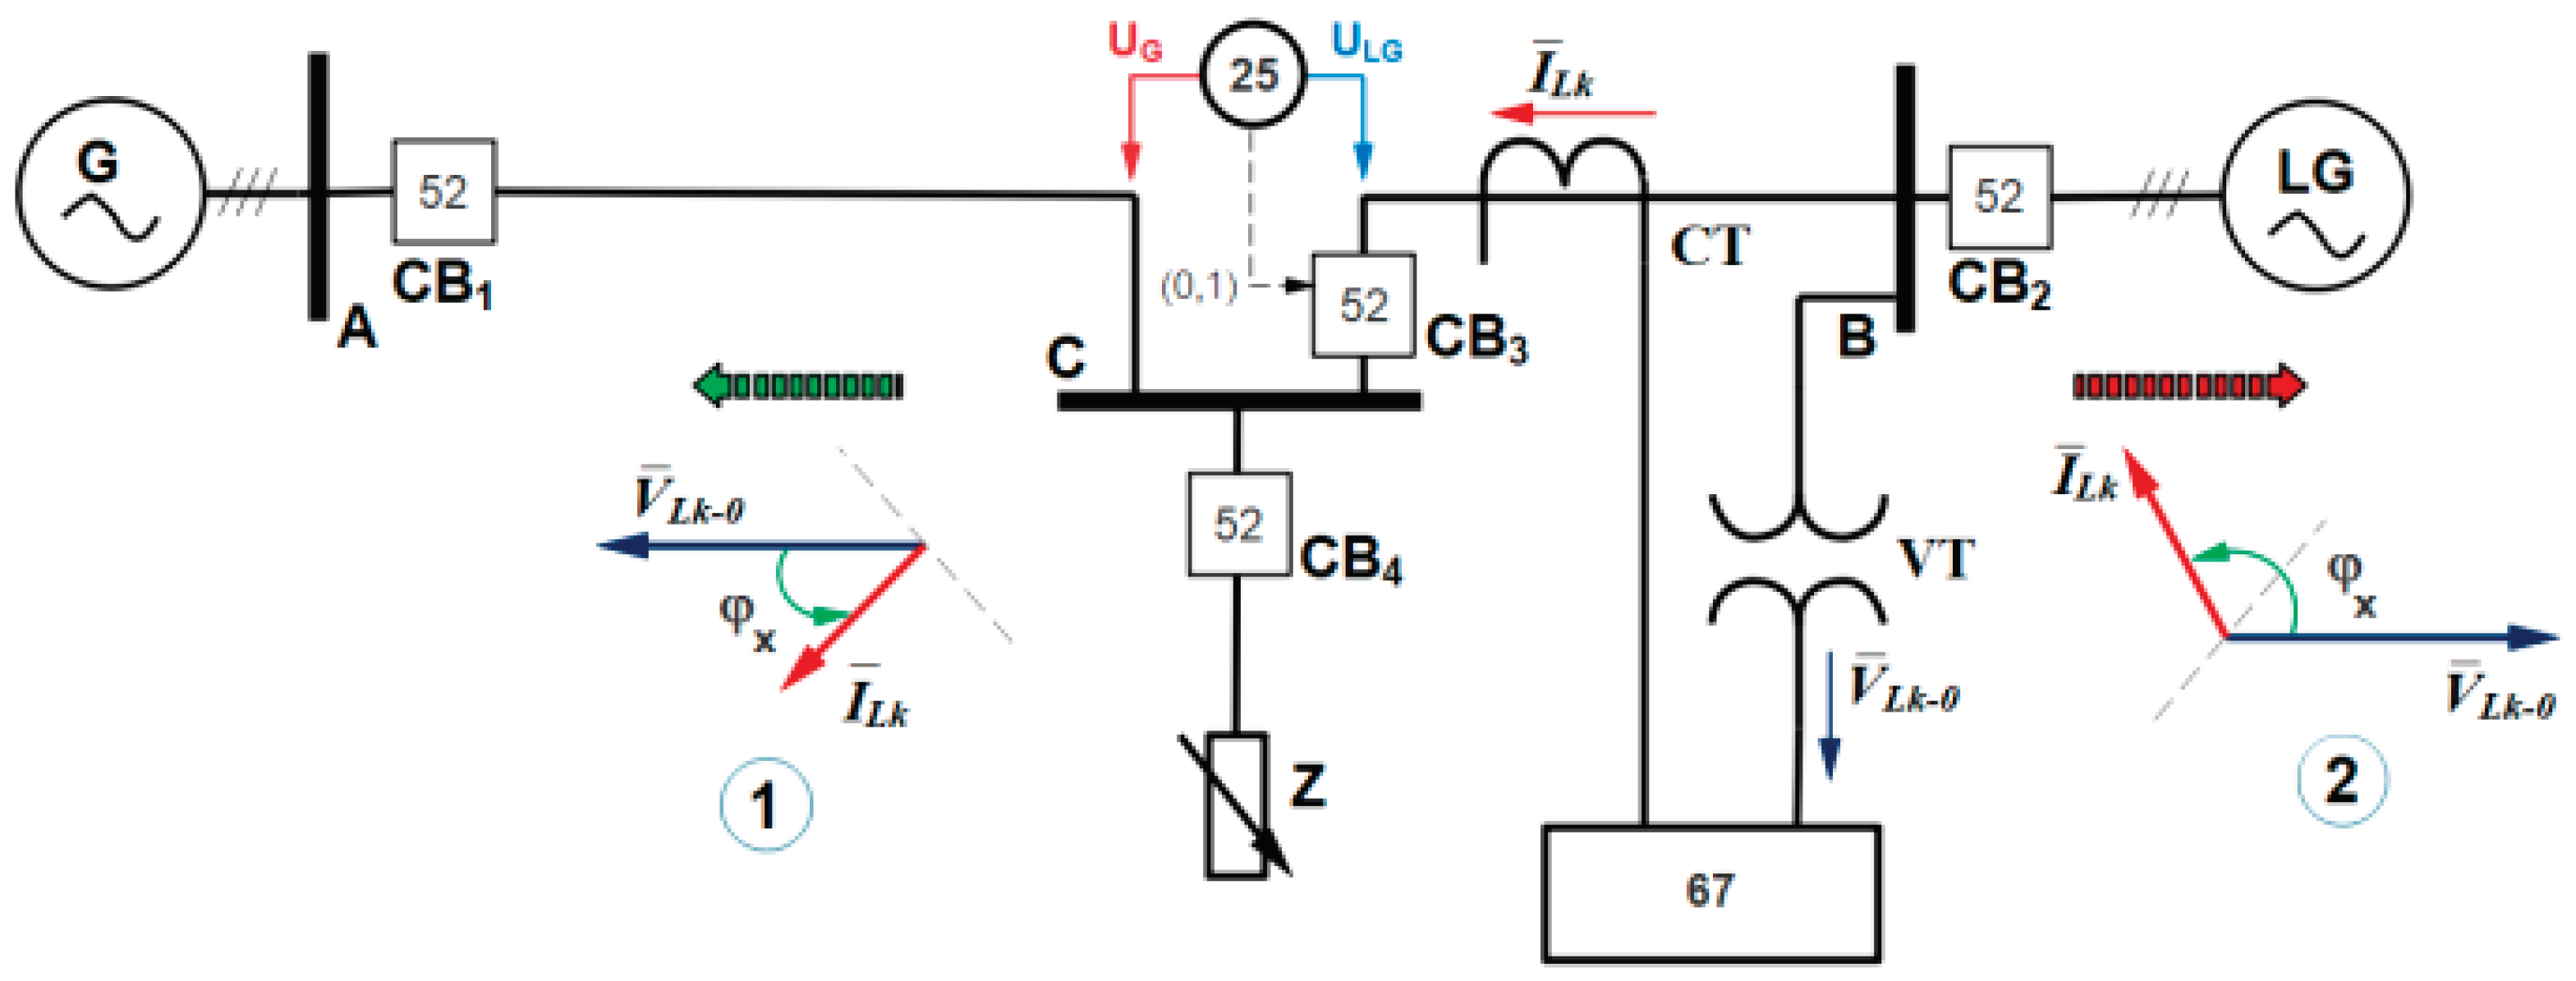
The typical integration of such relay in a network supplied by two sources, is shown in
Figure 6 configurations at the beginning of this section, and according with regulations stipulated by [
10], and based on quality requirements from [
11], we propose to integrate the directional relay into the protected network, as in
Figure 10.
Following the IEEE representation [
10], this analysis resumes the main algorithm of the energy management when a load (Z) is supplied by two sides power supplies (algorithm available also when a local generator is added). For operational reason, each feeder line is controlled by a power breaker (52) located at the beginning of the line (CB1 and CB2). They are required also for controlling the synchronization sequence executed by a specific relay (ANSI 25), when the synchronization conditions are fitted the relay [
16] commands the breaker CB3 (with the same role - 52) to add the second generator to contribute with its added energy.
The working principle of the used industrial directional relay (ANSI 67), preserve the stability and dependability of the electrical grid. The power system is continuously monitored, current directional faults are identified, the fault parameters are quantitatively assessed, and suitable protective measures are implemented. The relay supervises the direction of the current when the input voltage is above 1-2% of the rated input value, input currents are above the set level: Ix > [Is] and the phase displacement “ϕx” is within ±90° from the reference direction “a”.
It is important to use/push correctly the energy from the power system. The directional relay is protecting the network, by using two functions: by correctly allowing the power flow circulation and by controlling (signalling) the sequence of power transfer. Particularly, in above figure, the relay allows to send the power into the grid according with the agreement or commitment (case 1) or to protect against reverse power fault (case 2). The protection has the ability to detect the direction of a short-circuit current for a well-established range of angle φx.
3. Laboratory Model Design for the Concept Validation
3.1. The Laboratory Setup
The laboratory setup is shown in
Figure 11 and for the experimental purpose, the local generator is simulated, in
Figure 11 (i), by using a synchronous machine (G/M) driven by a prime mover implemented with a brushless machine (PM/B), controlled through an electronic driver, as in
Figure 11 (ii).
This implementation allows to create reversible chain (if the synchronous machine is generator, the brushless is prime mover; if the synchronous machine is running as motor, the brushless will become brake, simulating a process - like pumping system).
According with the three entities architecture proposed in [
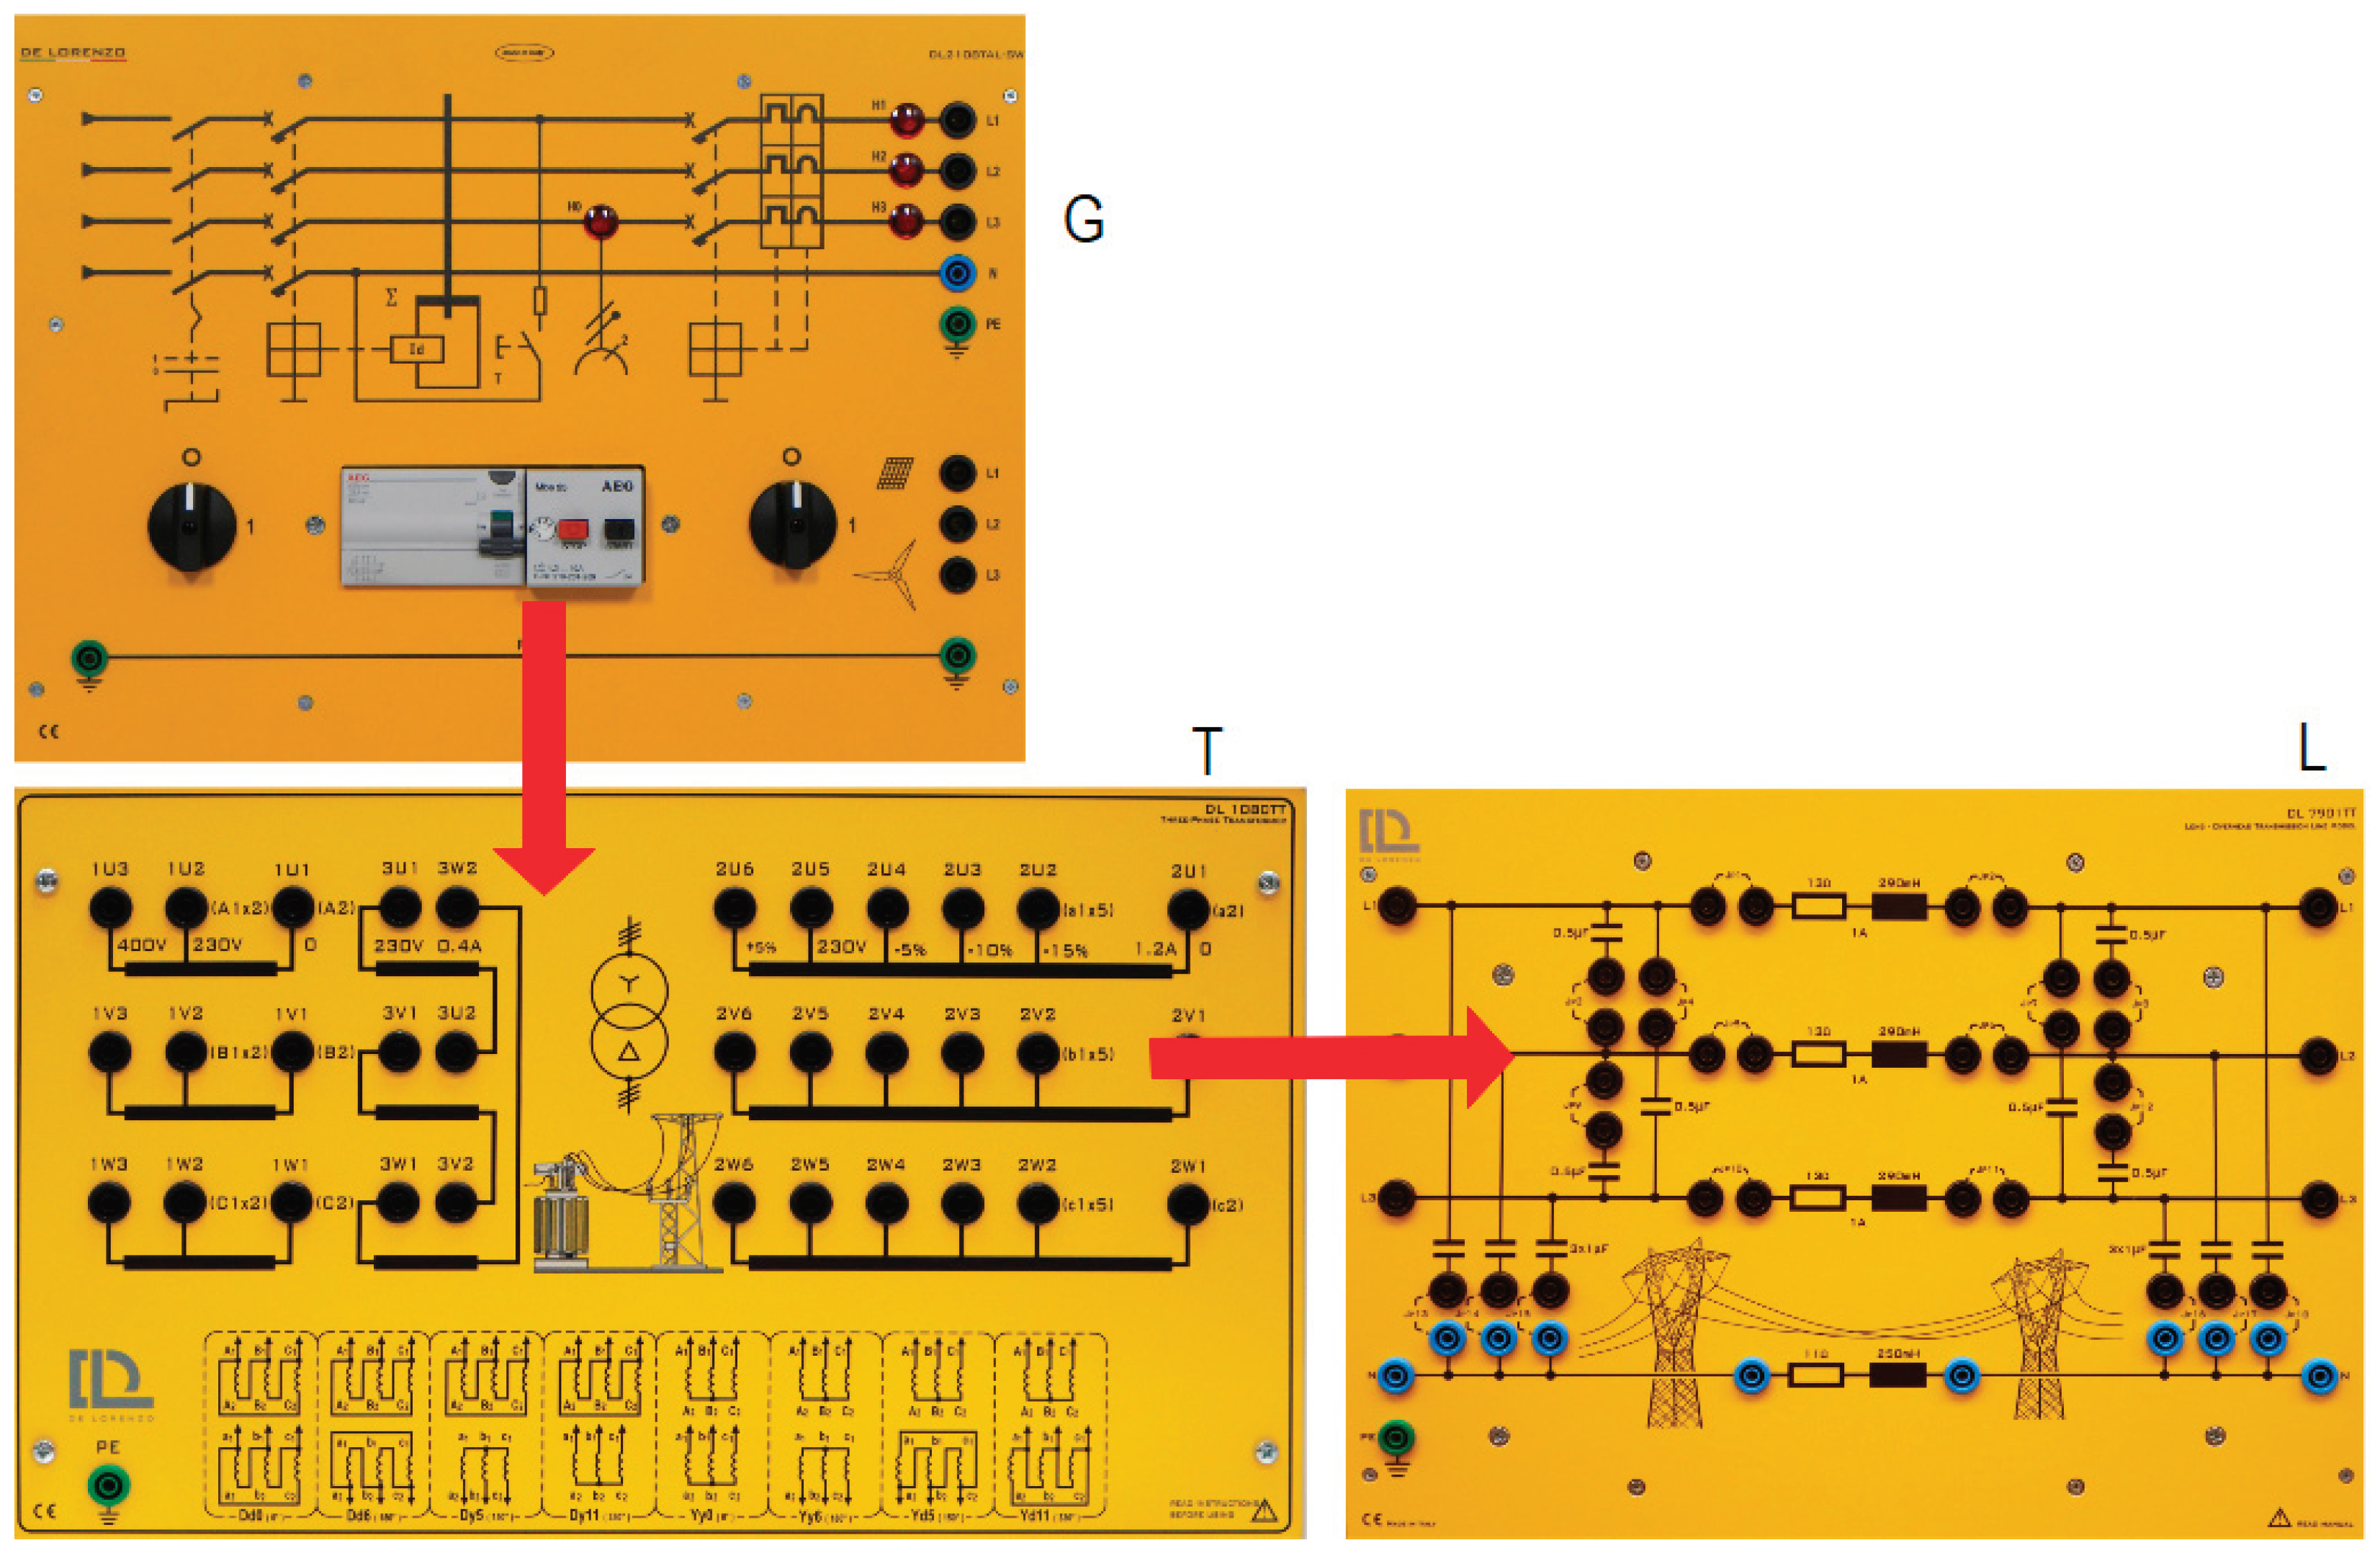
10], and following the designed simplified control wiring diagrams, the grid power supply is replicated consisting model components, as in
Figure 12 (for reasons of simplicity and clarity the components are represented in a symbolic way - for instance instead of showing wirings, arrows are used that indicate the concept of energy transmission.).
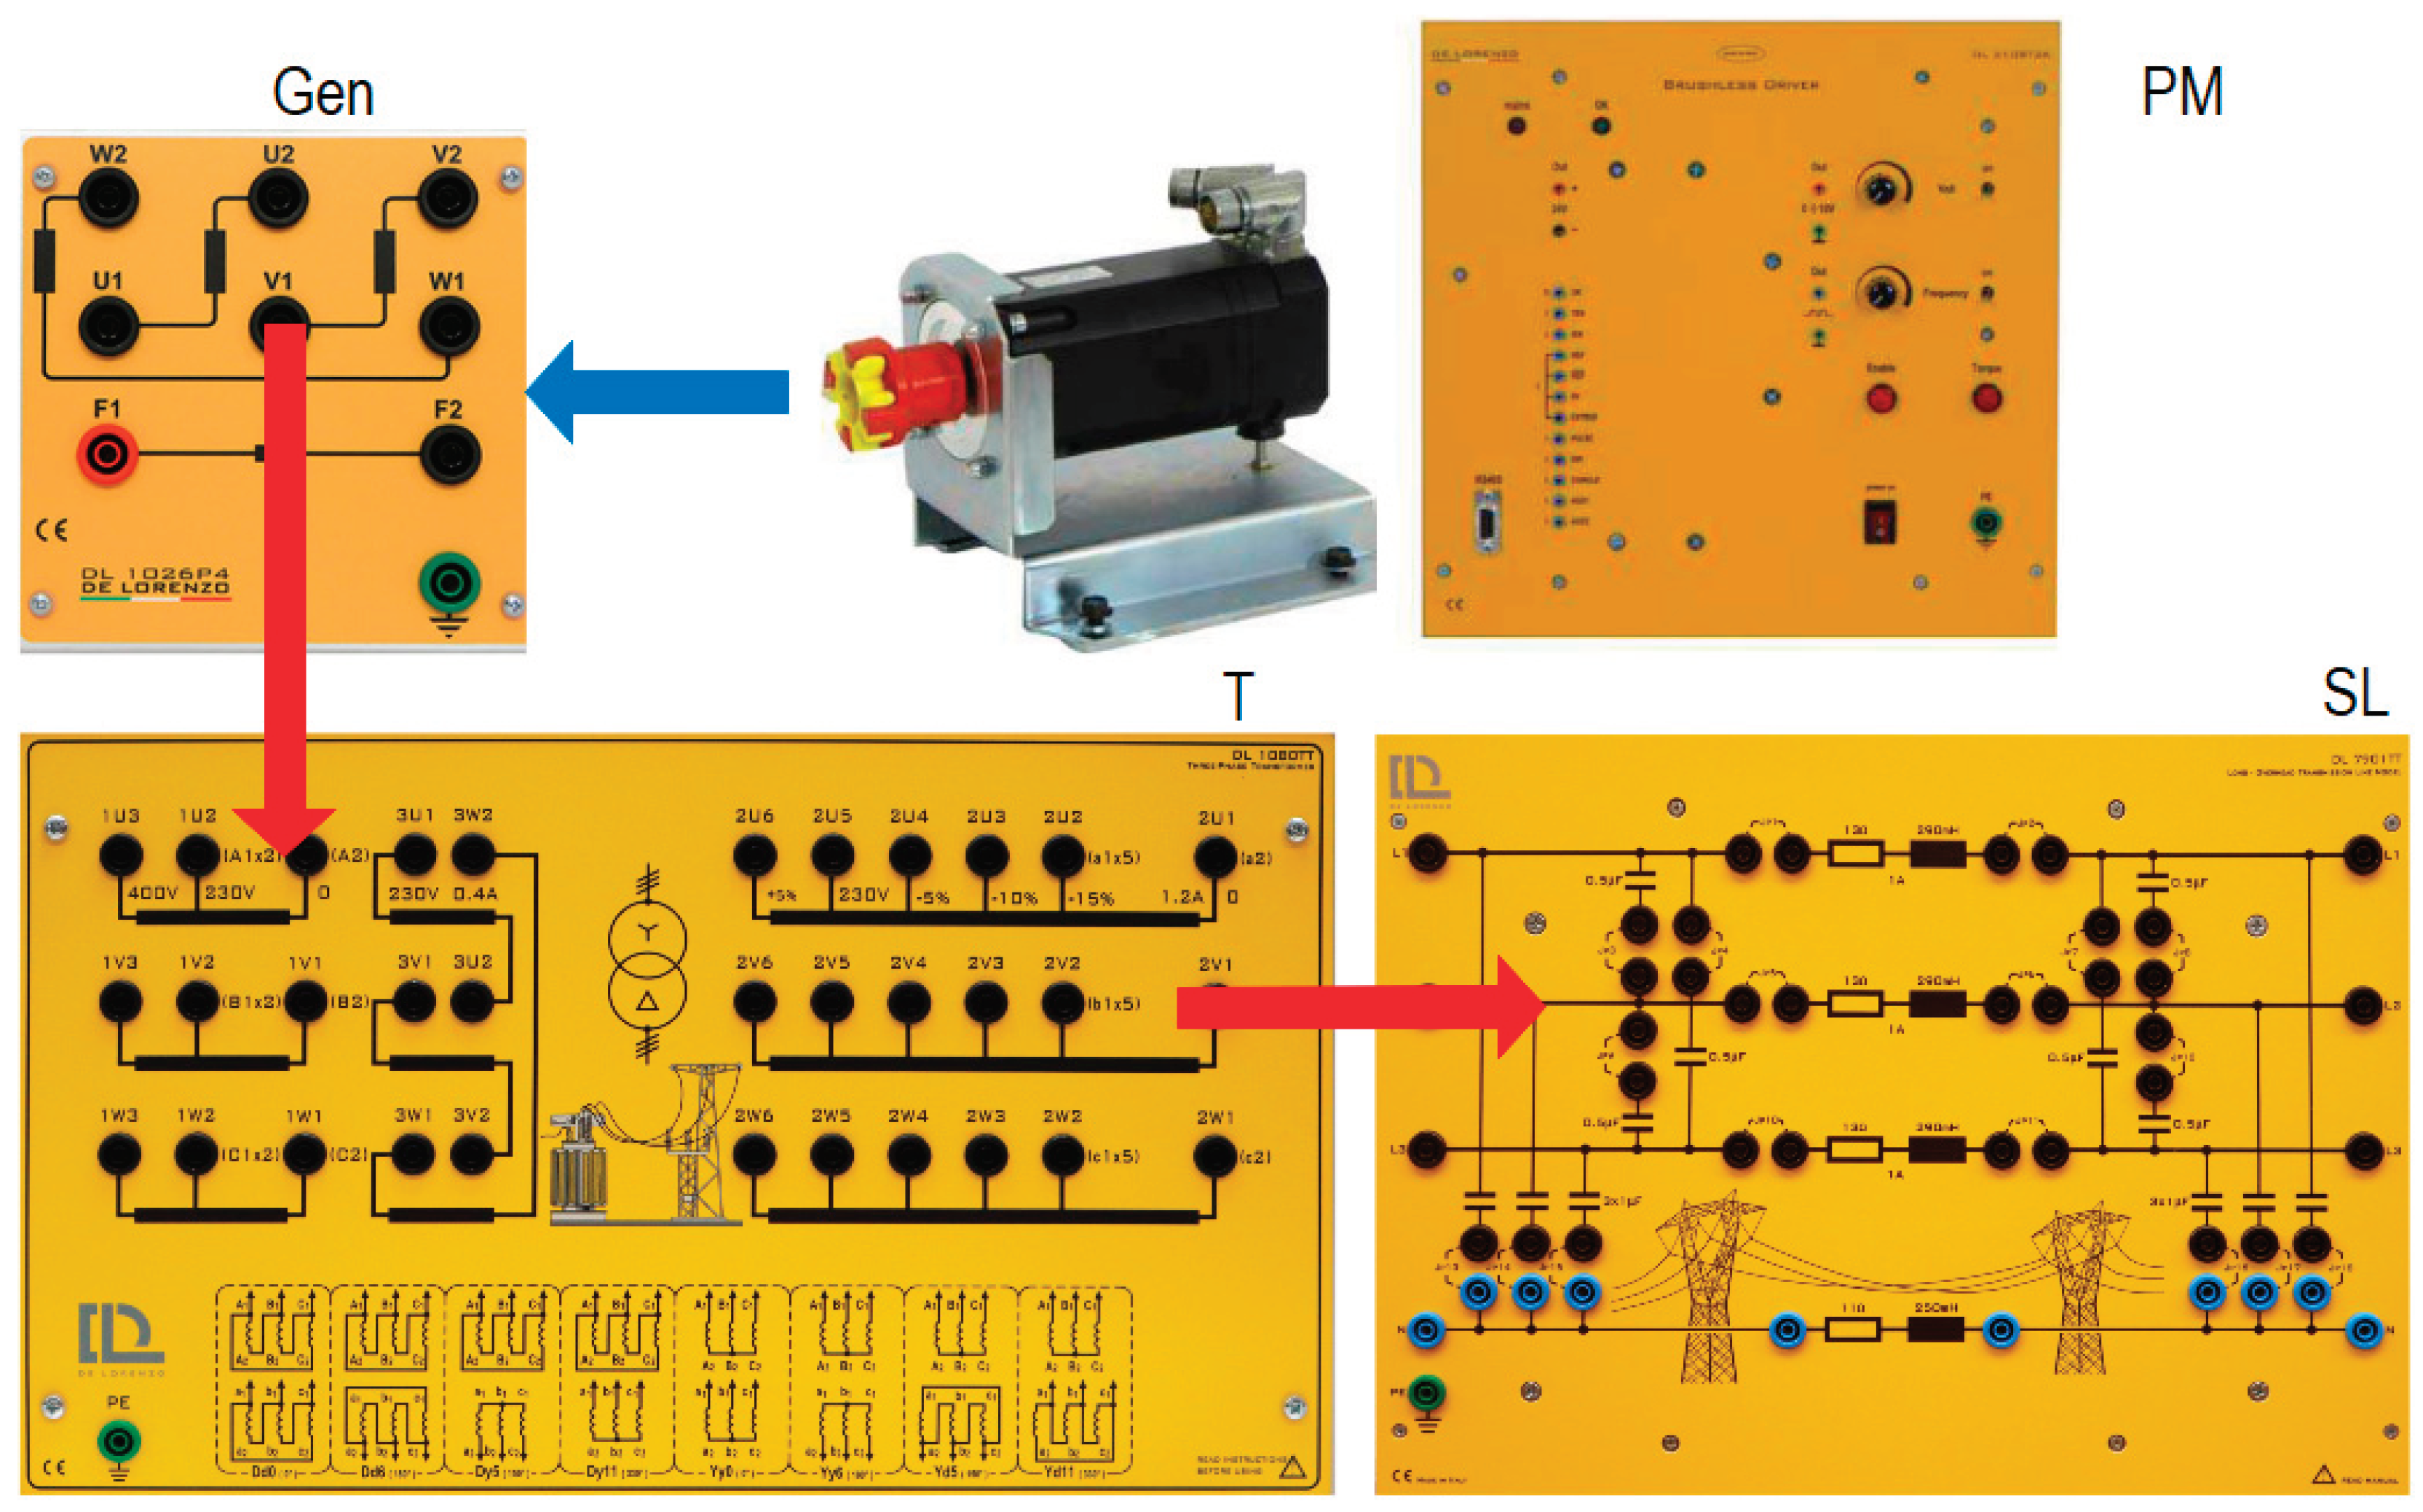
The three-phase power supply from the lab represents the main grid (G). It is supplying the distribution transformer which is also playing the role of insulation transformer. The output of the transformer is connected to a transmission line (we are using a distributed parameters model for a long line: 13 Ω/km, 290 mH/km, 0.5μF/km and phase) until the distribution busbar of the load.
The local generator (LG) has the structure presented in
Figure 13. It is consisting of a synchronous generator (SG) mechanically connected to a brushless motor (PM/B) controlled by its electronic driver (ED). According with proposed objective, when LG works as generator, the brushless motor is a prime mover (PM) simulating the developed energy at turbine level by the upstream water. From the ED we control the amount of produced mechanical energy, at the terminals of SG we obtain three phases electrical energy. When LG works as pump, from the main grid we supply the SG as motor, and the PM/B works as a brake (B) for the SG rotor, representing the mechanical resistant torque at the reversible turbine when it pumps water into upstream basin.
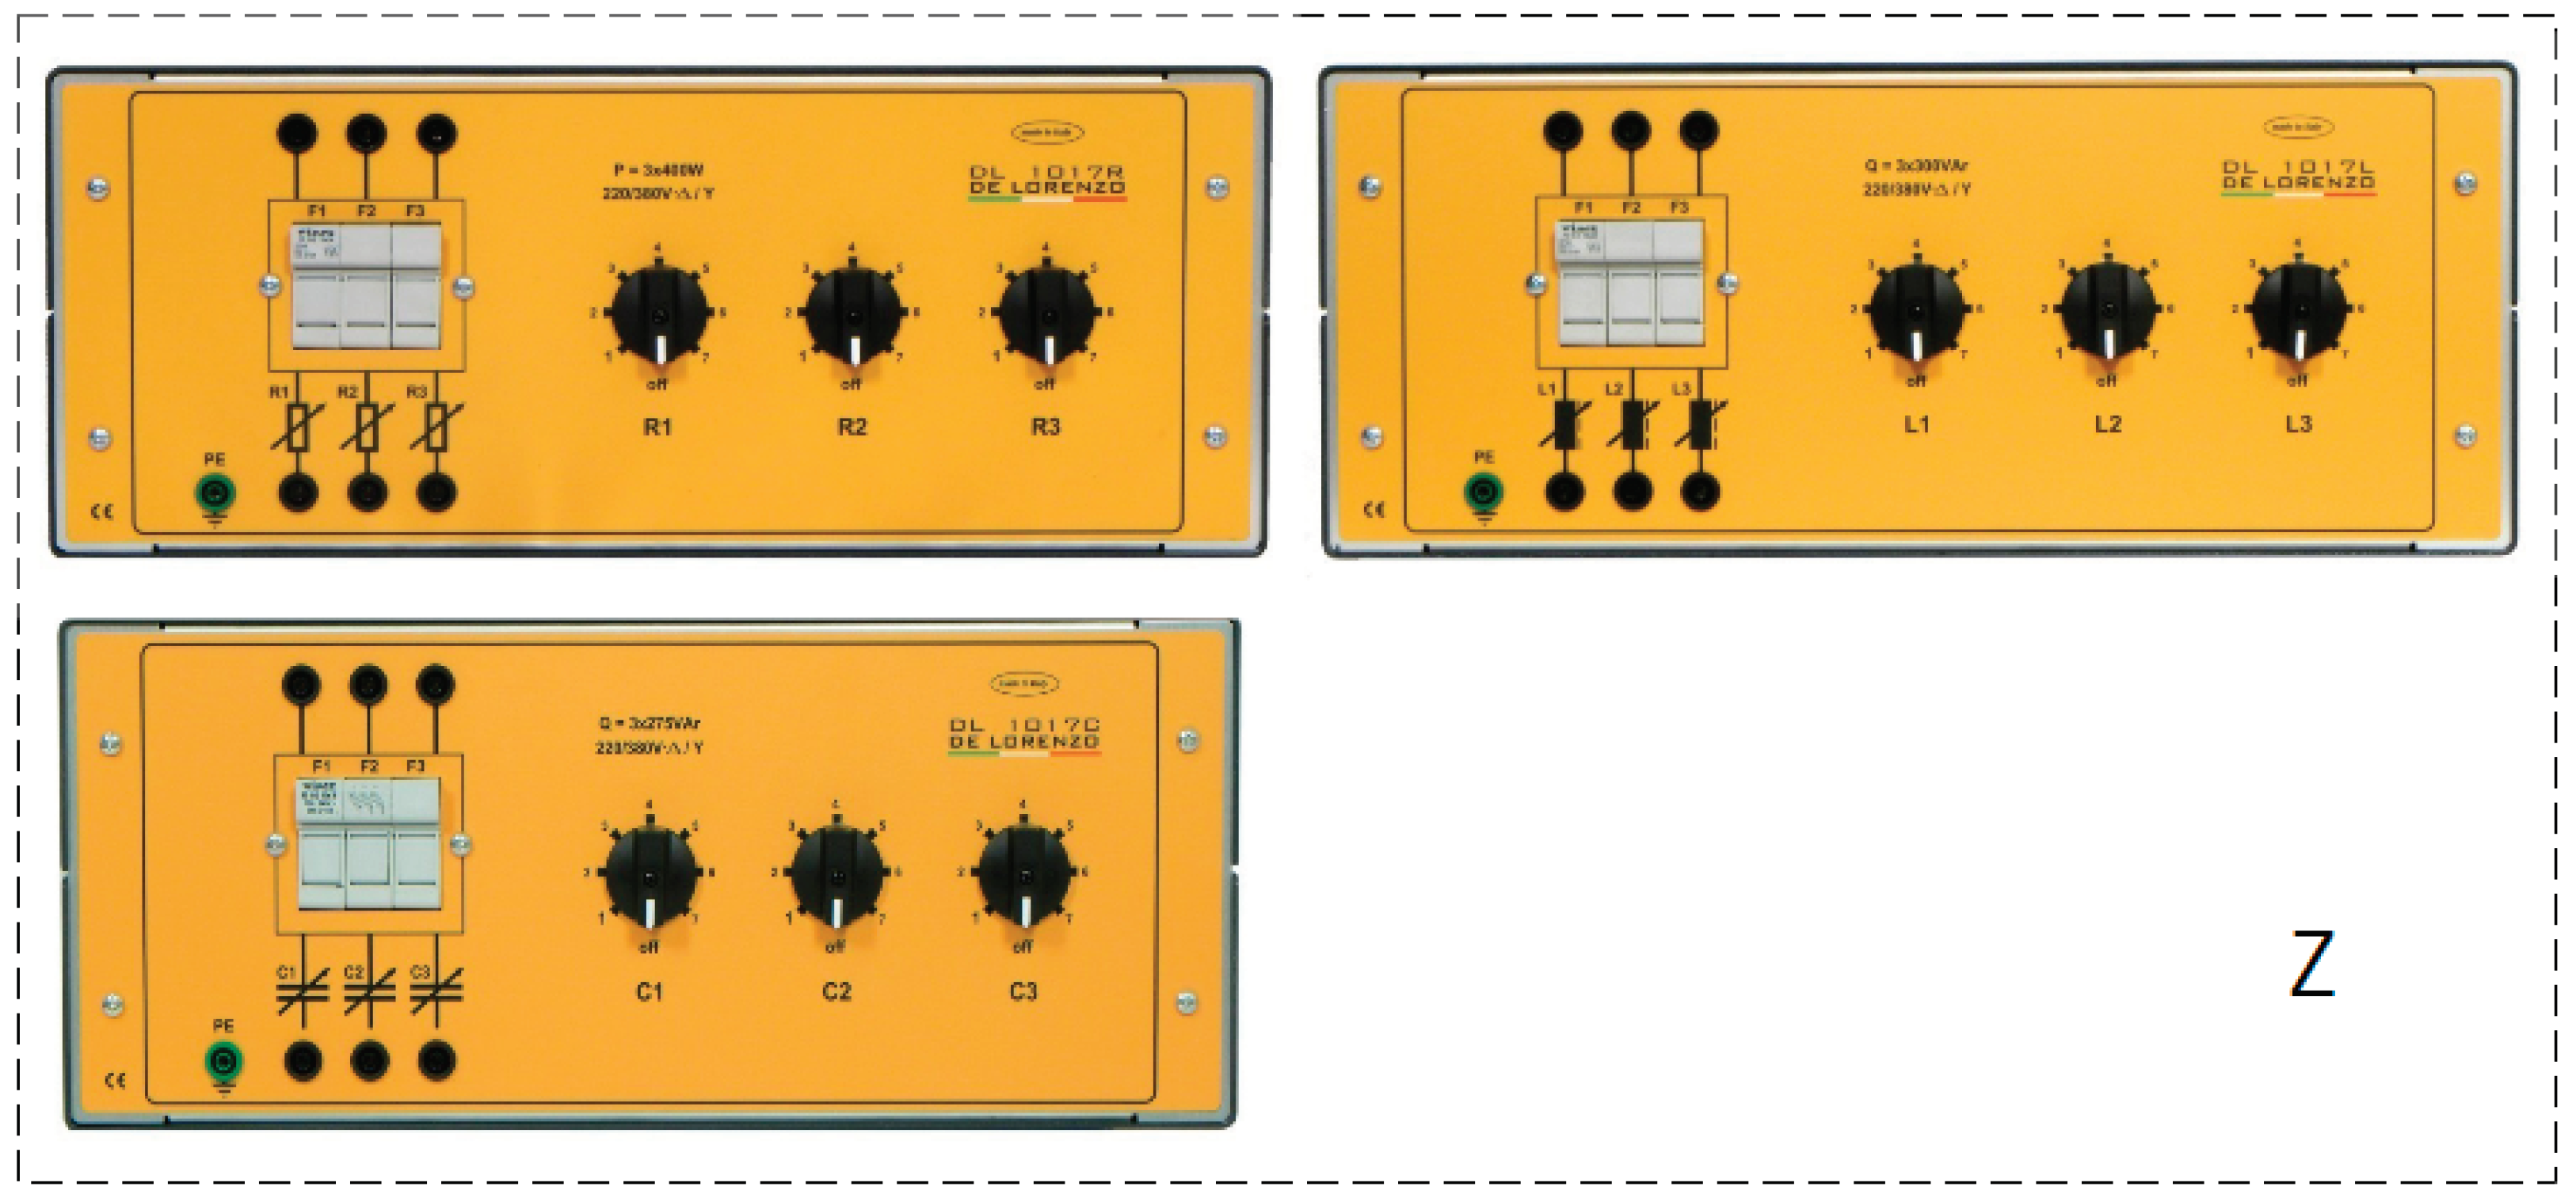
The three-phase load (Z) is represented by static variable resistance, inductance, and capacity, as in
Figure 14.
For running the laboratory model, a SCADA software is designed and implemented which will control the system through a RS485 Modbus protocol. The software supervises and control the different steps, like in real energetic system. First step will supervise the automatic synchronization of the local generator with the electric grid.
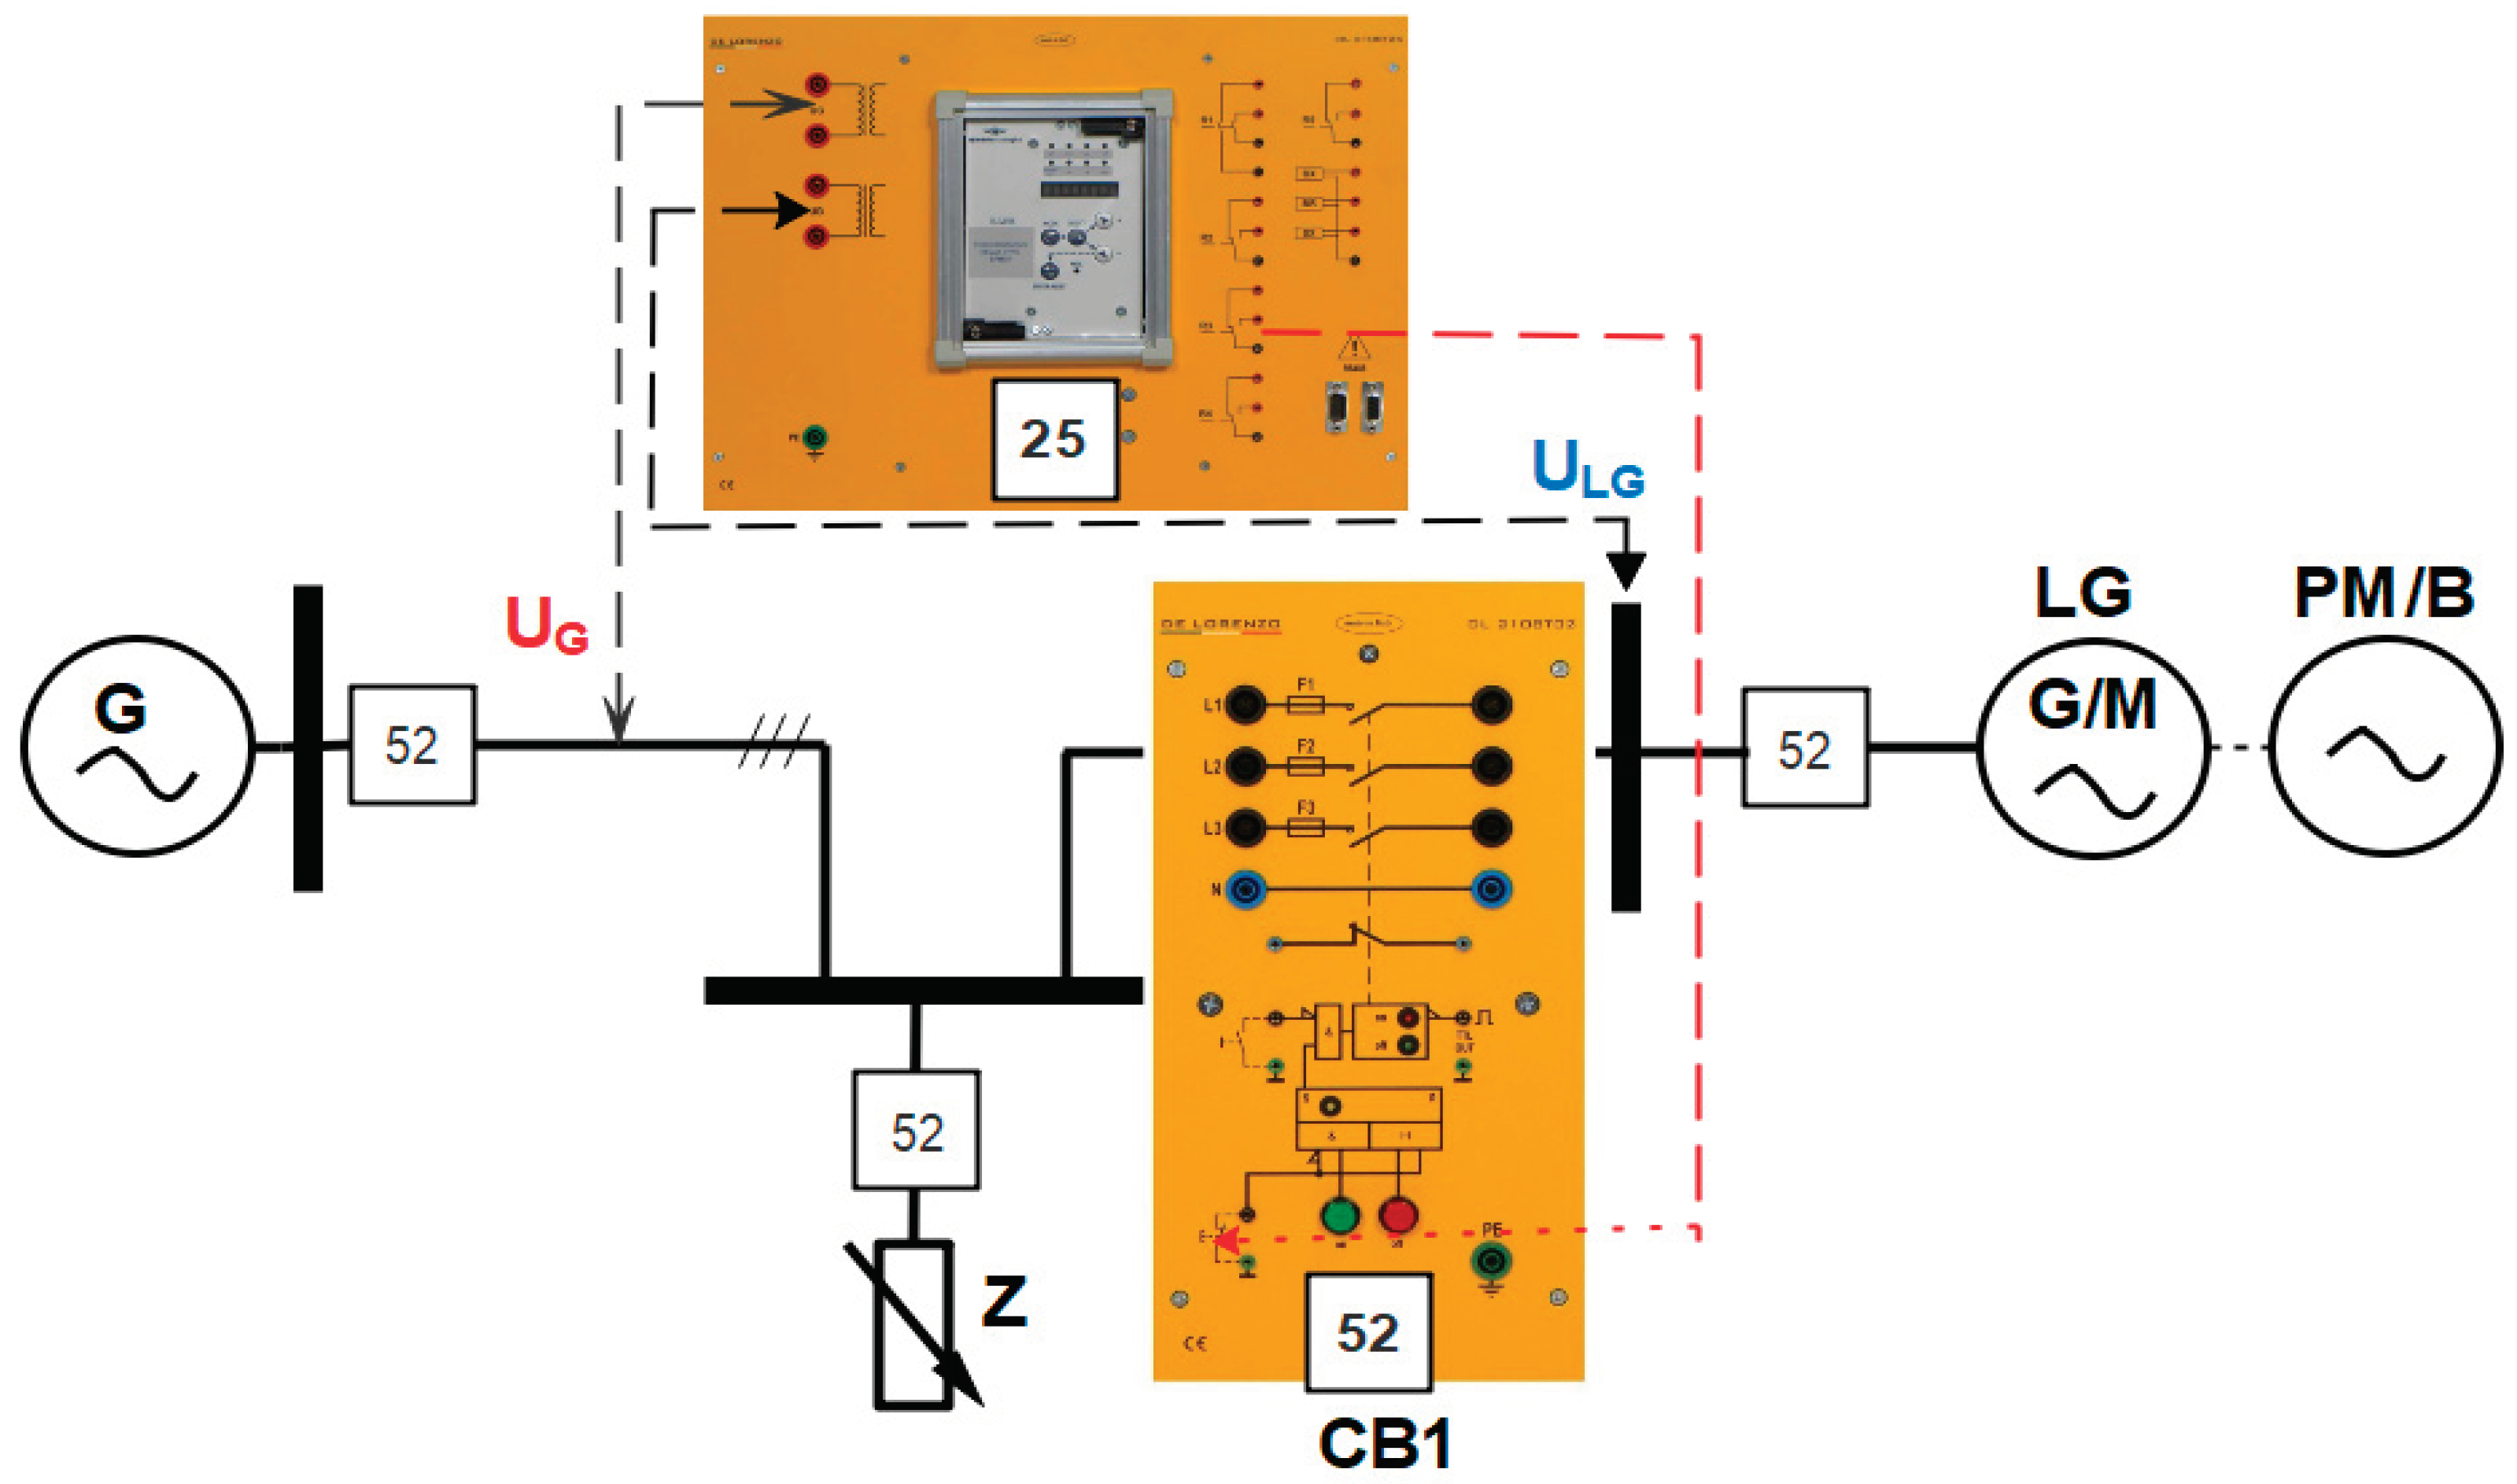
The synchronization relay [
16] (25 is the ANSII IEEE code for this specific function) will control the synchronization conditions regarding the voltages - from the main grid (U
G) and from the local generator (U
LG), and when they are fulfilled, the relay command the main breaker (CB1) to connect the local generator to the grid, as in
Figure 15.
The feeder relay (67), described in [
15], is supervising the phase between parameters I
LK and V
LK, and according with its setup, it will send command (a) to the SCADA when L
G works as generator, and command (b) when L
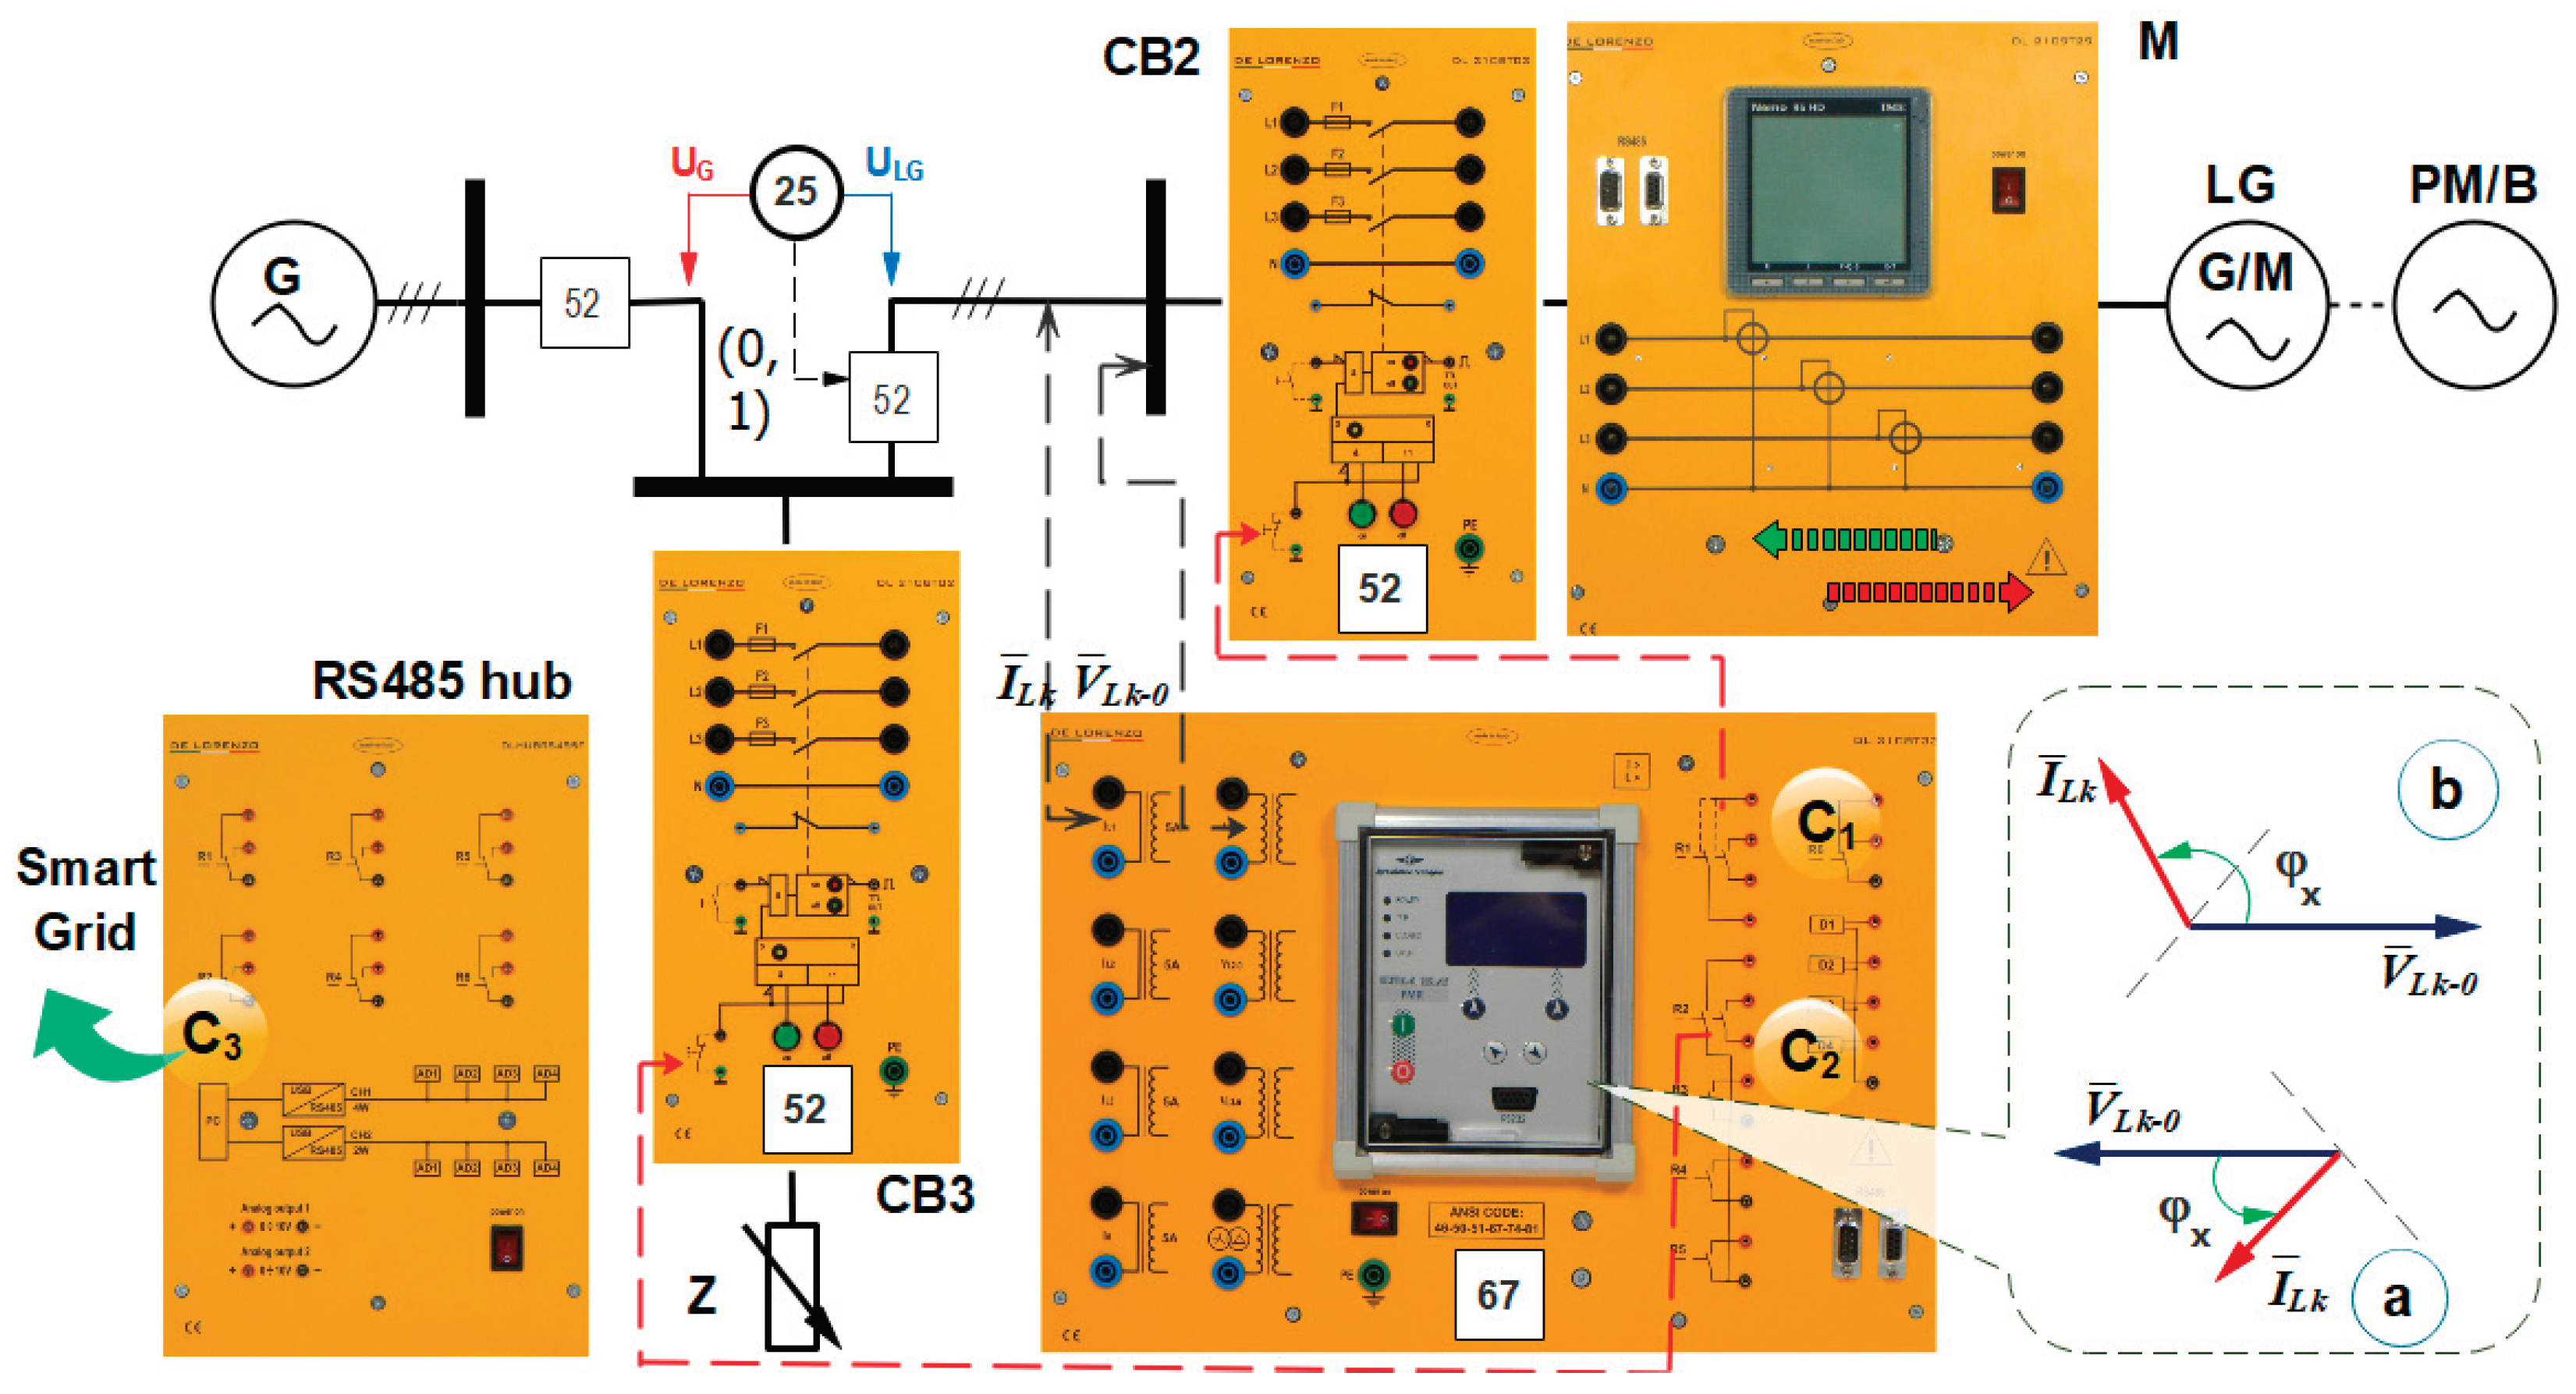
G works as motor. For security reason, the feeder relay is programmed, if case, to disconnect the local generator with the command C1 for the breaker CB2, of to disconnect the load Z with the command C2 for the breaker CB3.
On the other hand, the SCADA, which is recording the electrical parameter measured by the relay (67), and measuring device M, according with its implemented algorithms, will send command C3 to the higher-level processing software (integrated into the smart grid concept). For an easy understanding purpose, was integrated into the diagram a three-phases measuring device that displays the power transfer with sign.
The second step: working as a local generator by pumping the water to the upstream basin. In this step the main role has the feeder relay, with main function directional supervision and control (67). For this part of the experiment, as in
Figure 16, the main devices involved in the experimental setup, are: the circuit breakers involved in connecting the local power generator to the load (CB2, and CB3), the directional relay (67), one measuring device (M) for measuring the voltage/power, and the RS 485 hub required for local control and for integration in Smart grid.
3.2. SCADA Support for Laboratory Model Development
The laboratory software with the function associated to SCADA has been developed using Winlog as open-source development platform [
17,
18]. When using a dongle license [
18] it supports most popular communication protocols (Siemens, Omron, Allen Bradley, Modbus RTU/TCP, KNX, BACnet).
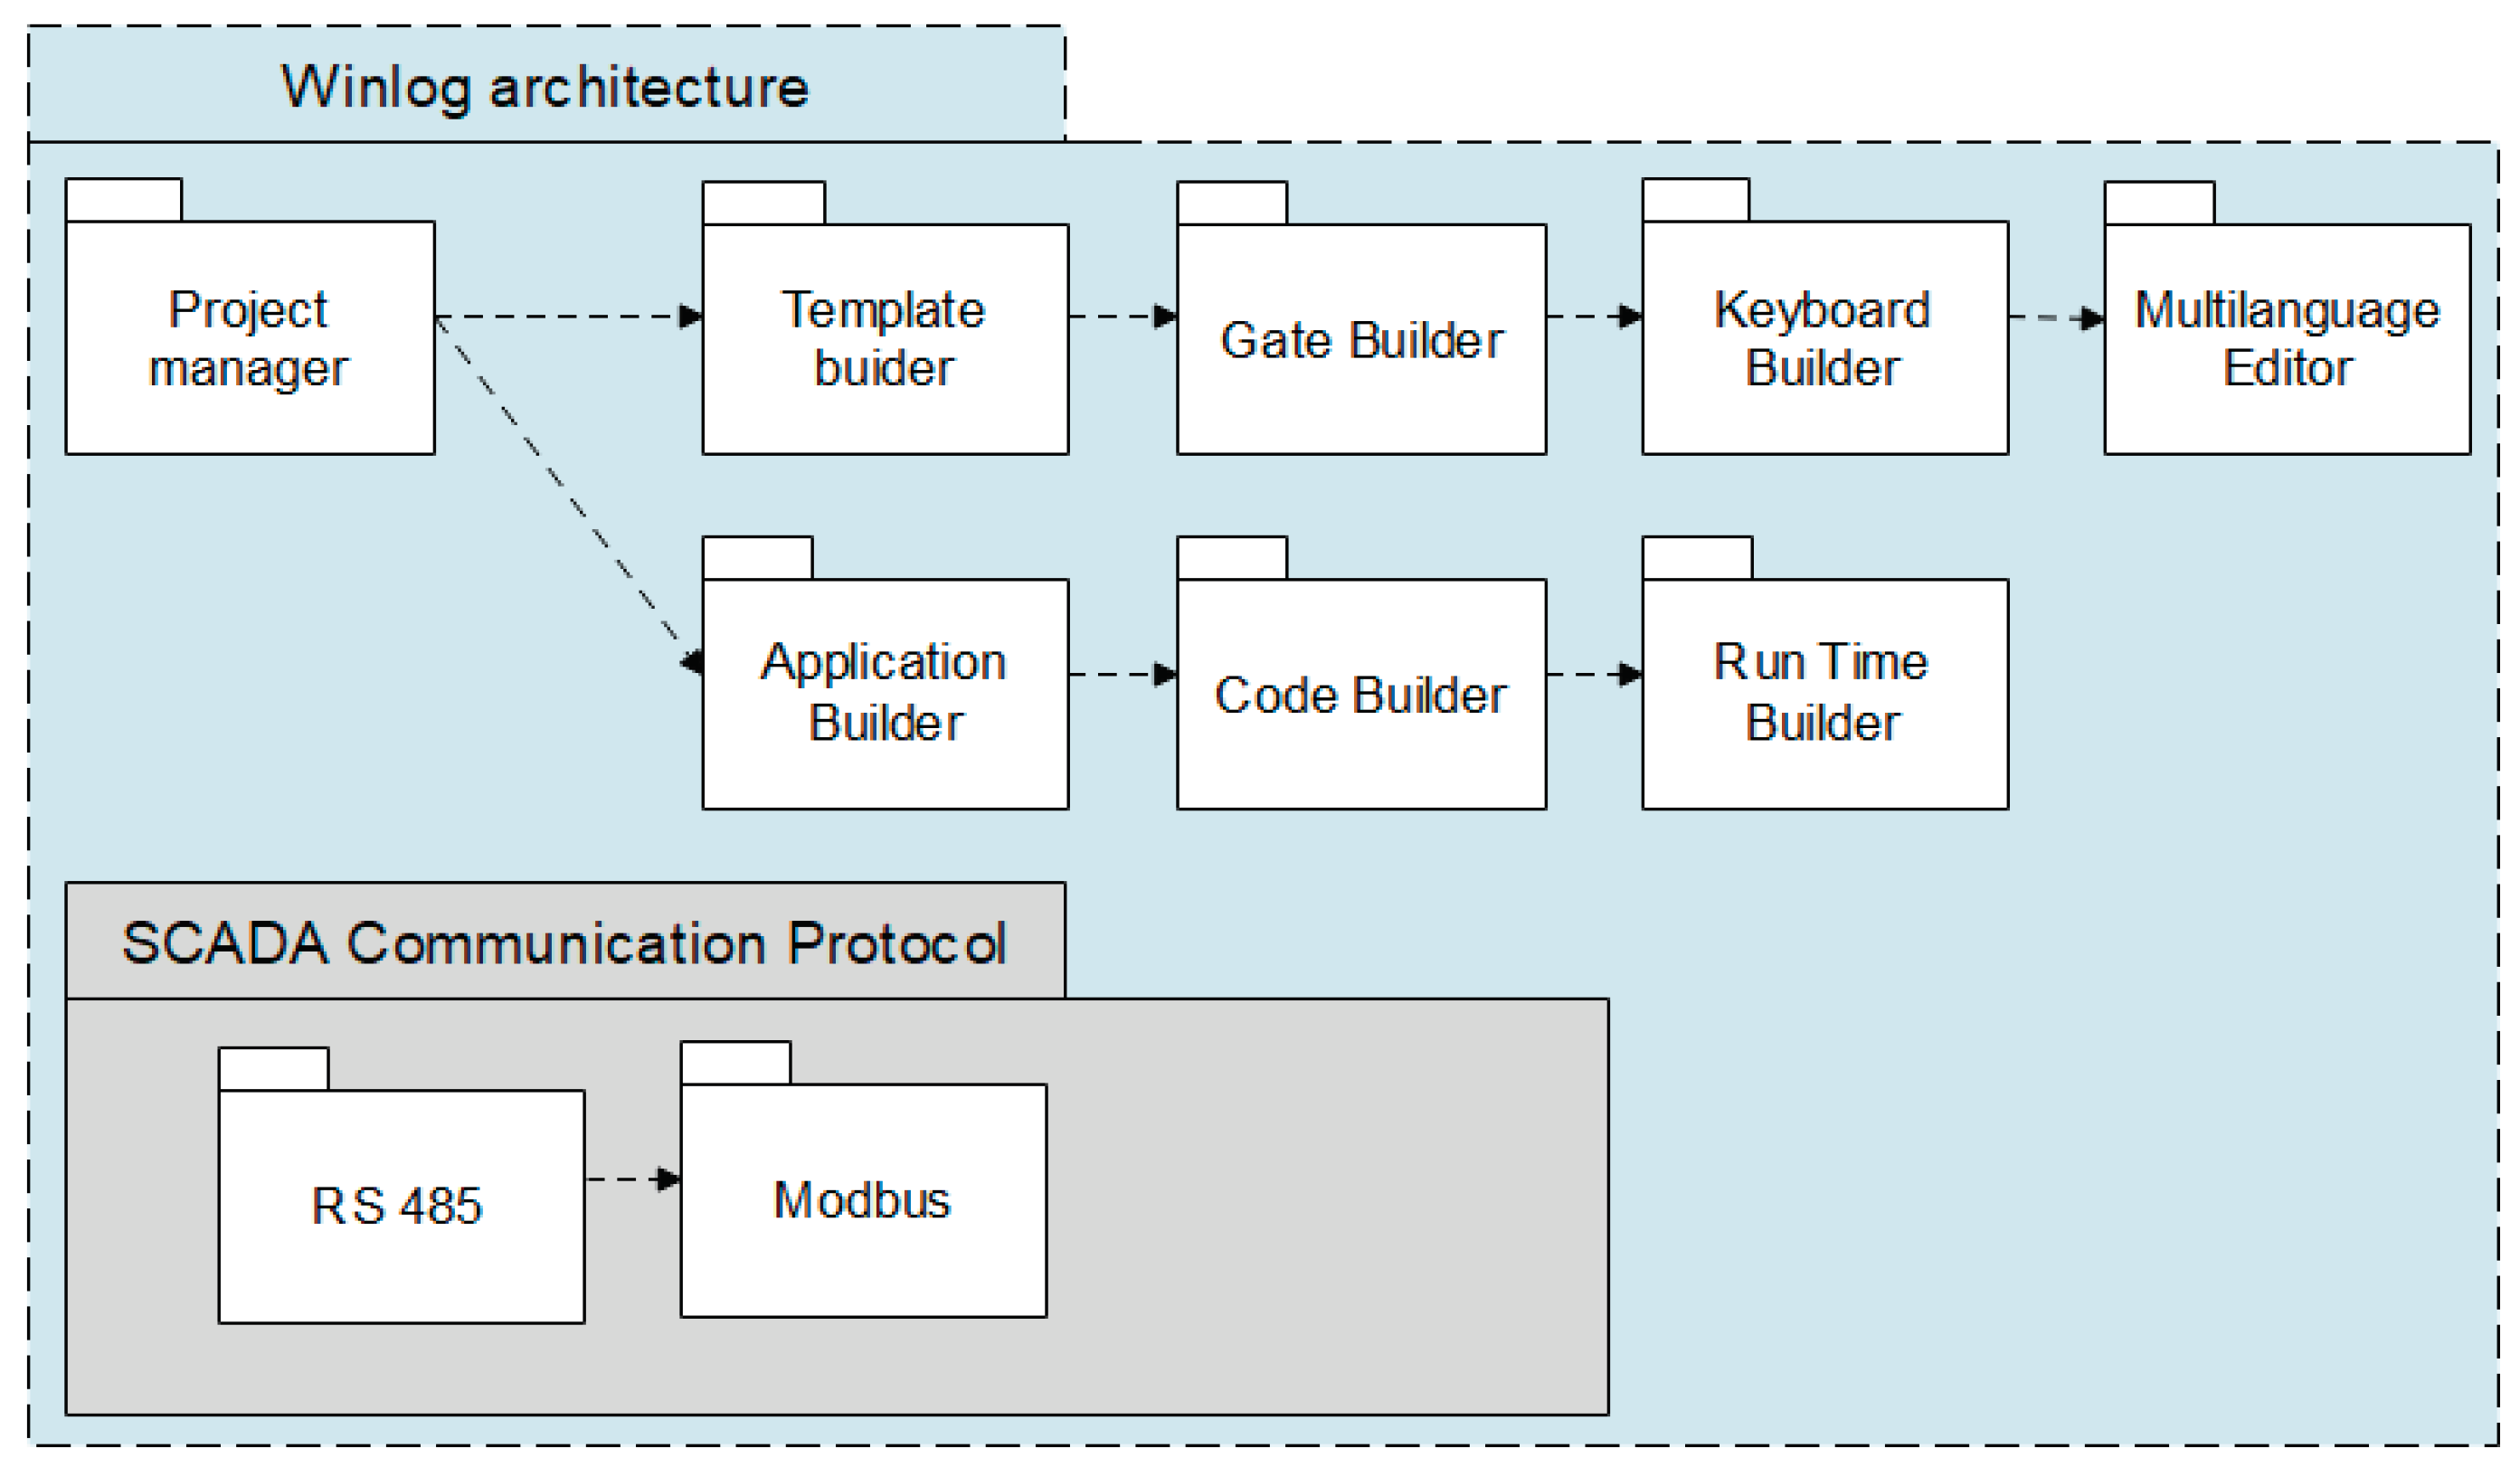
The main architecture of this software is shown as UML (Unified Modelling Language) diagram, in
Figure 17. The UML representation is used because, as a standardized modelling language, it contains rules, symbols and concepts comprised in best practice for developing dedicated software. According with the diagram, in
Figure 17, into a project manager, by using template builder (as fastest software development automation) the required gates were created (operator windows) together with the control interface. For interacting with external devices, though the RS 485 network interface, and Modbus protocol, the designed SCADA is interrogating our RS485 hub.
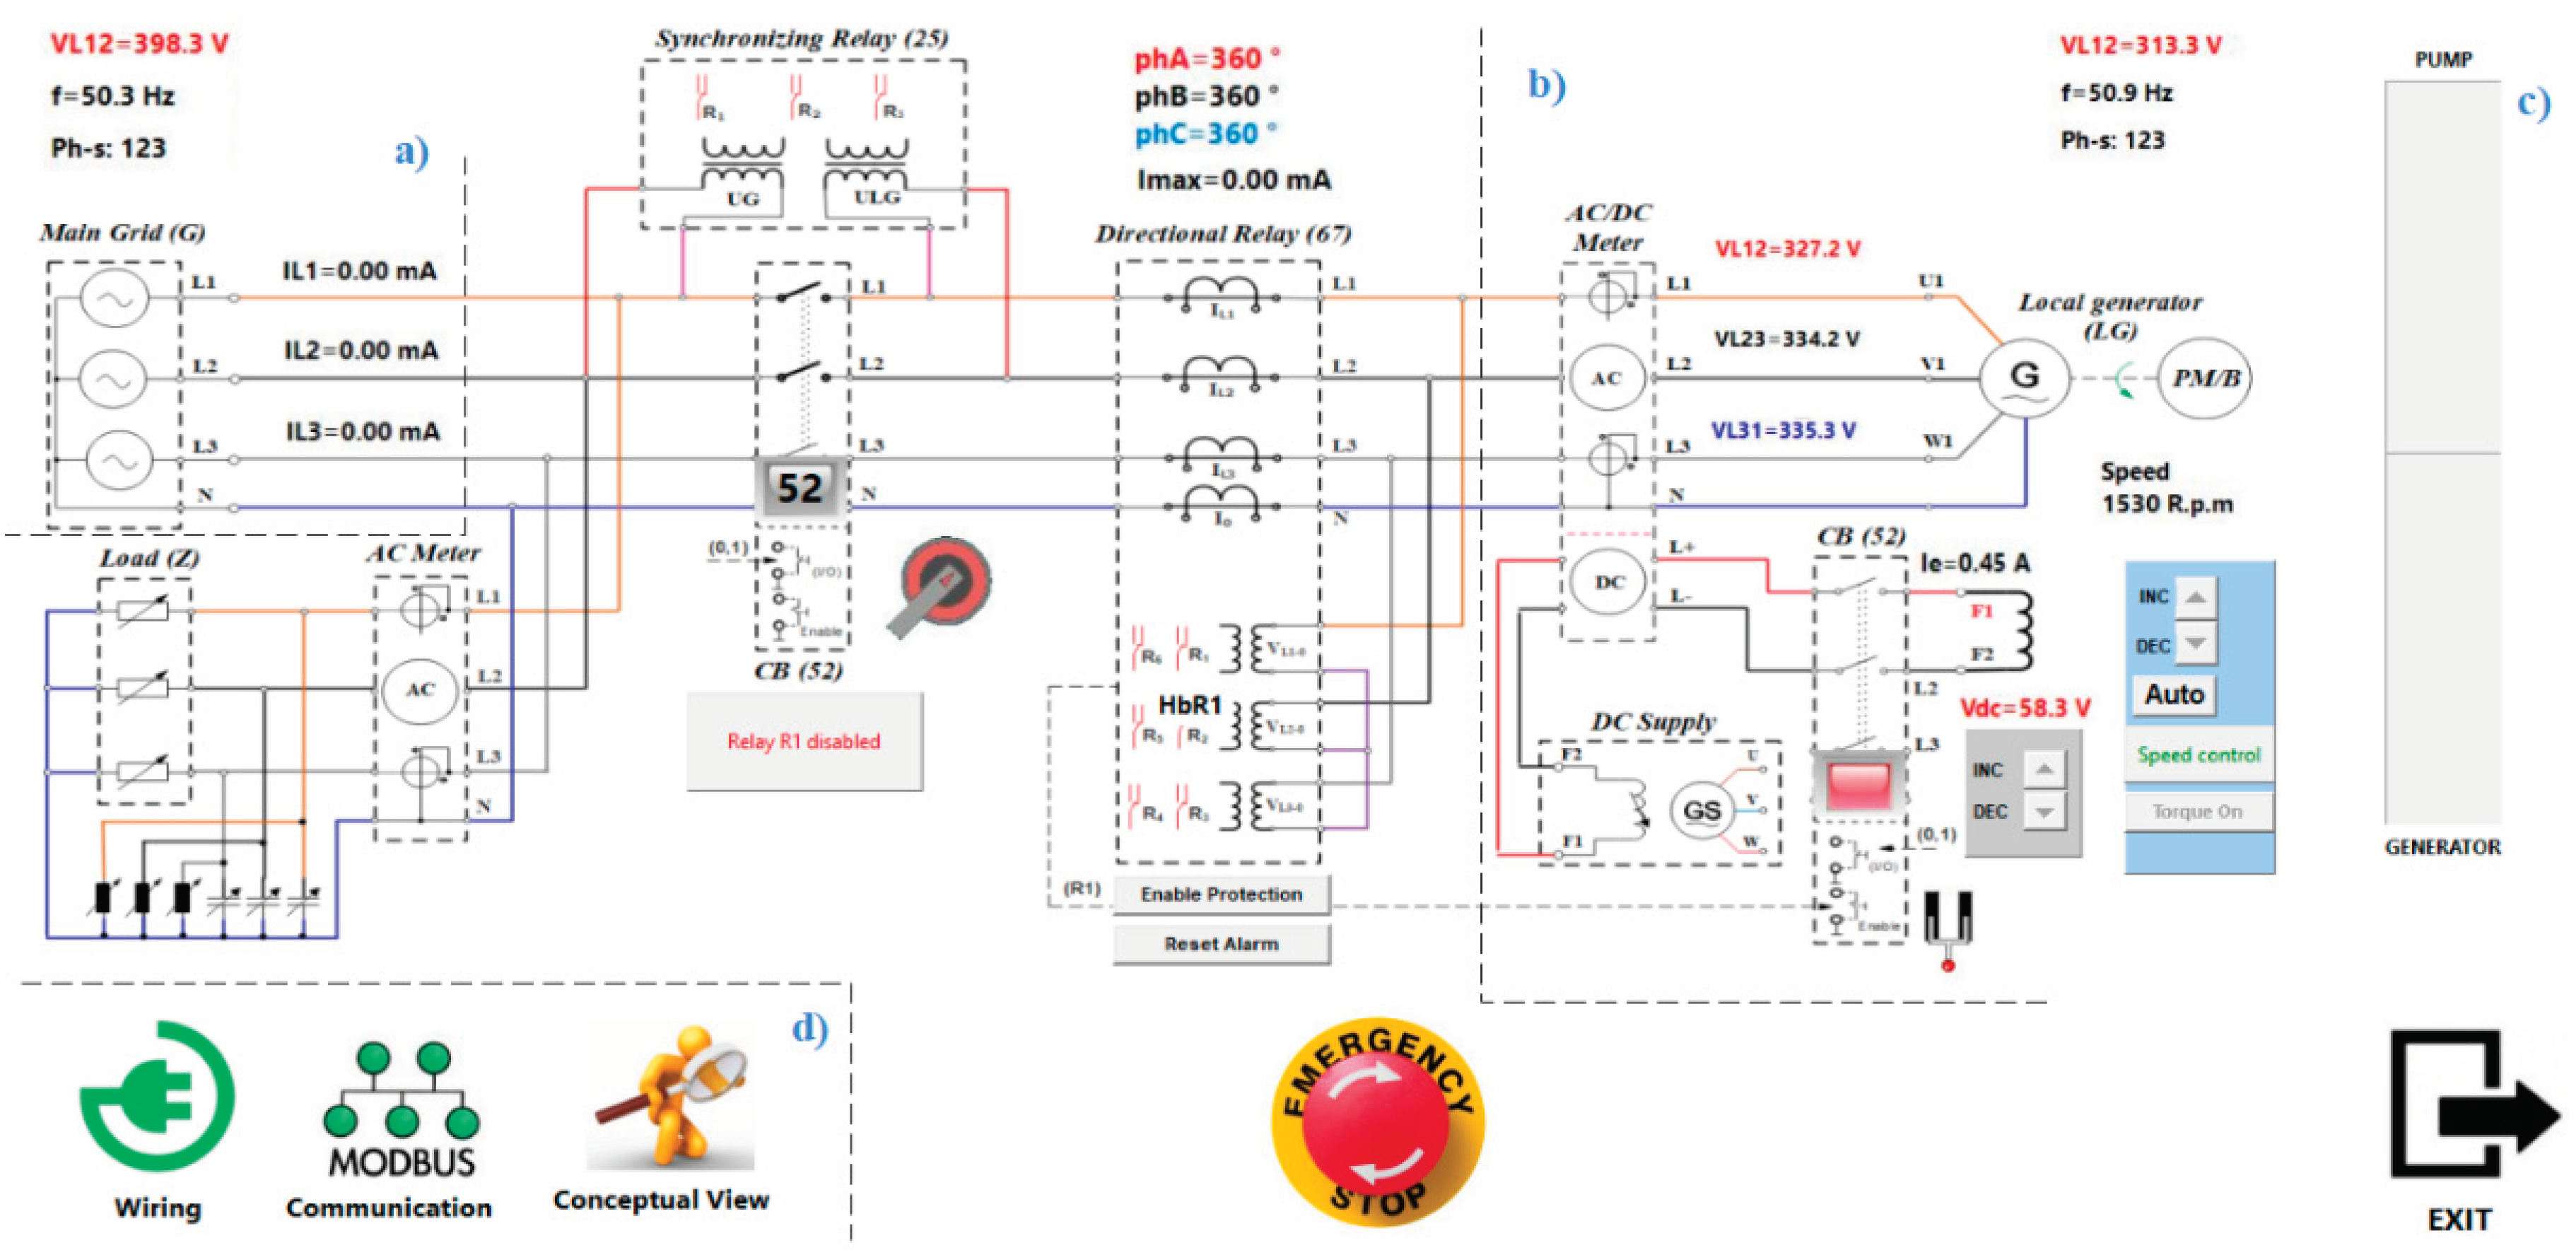
The main software interface is presented in
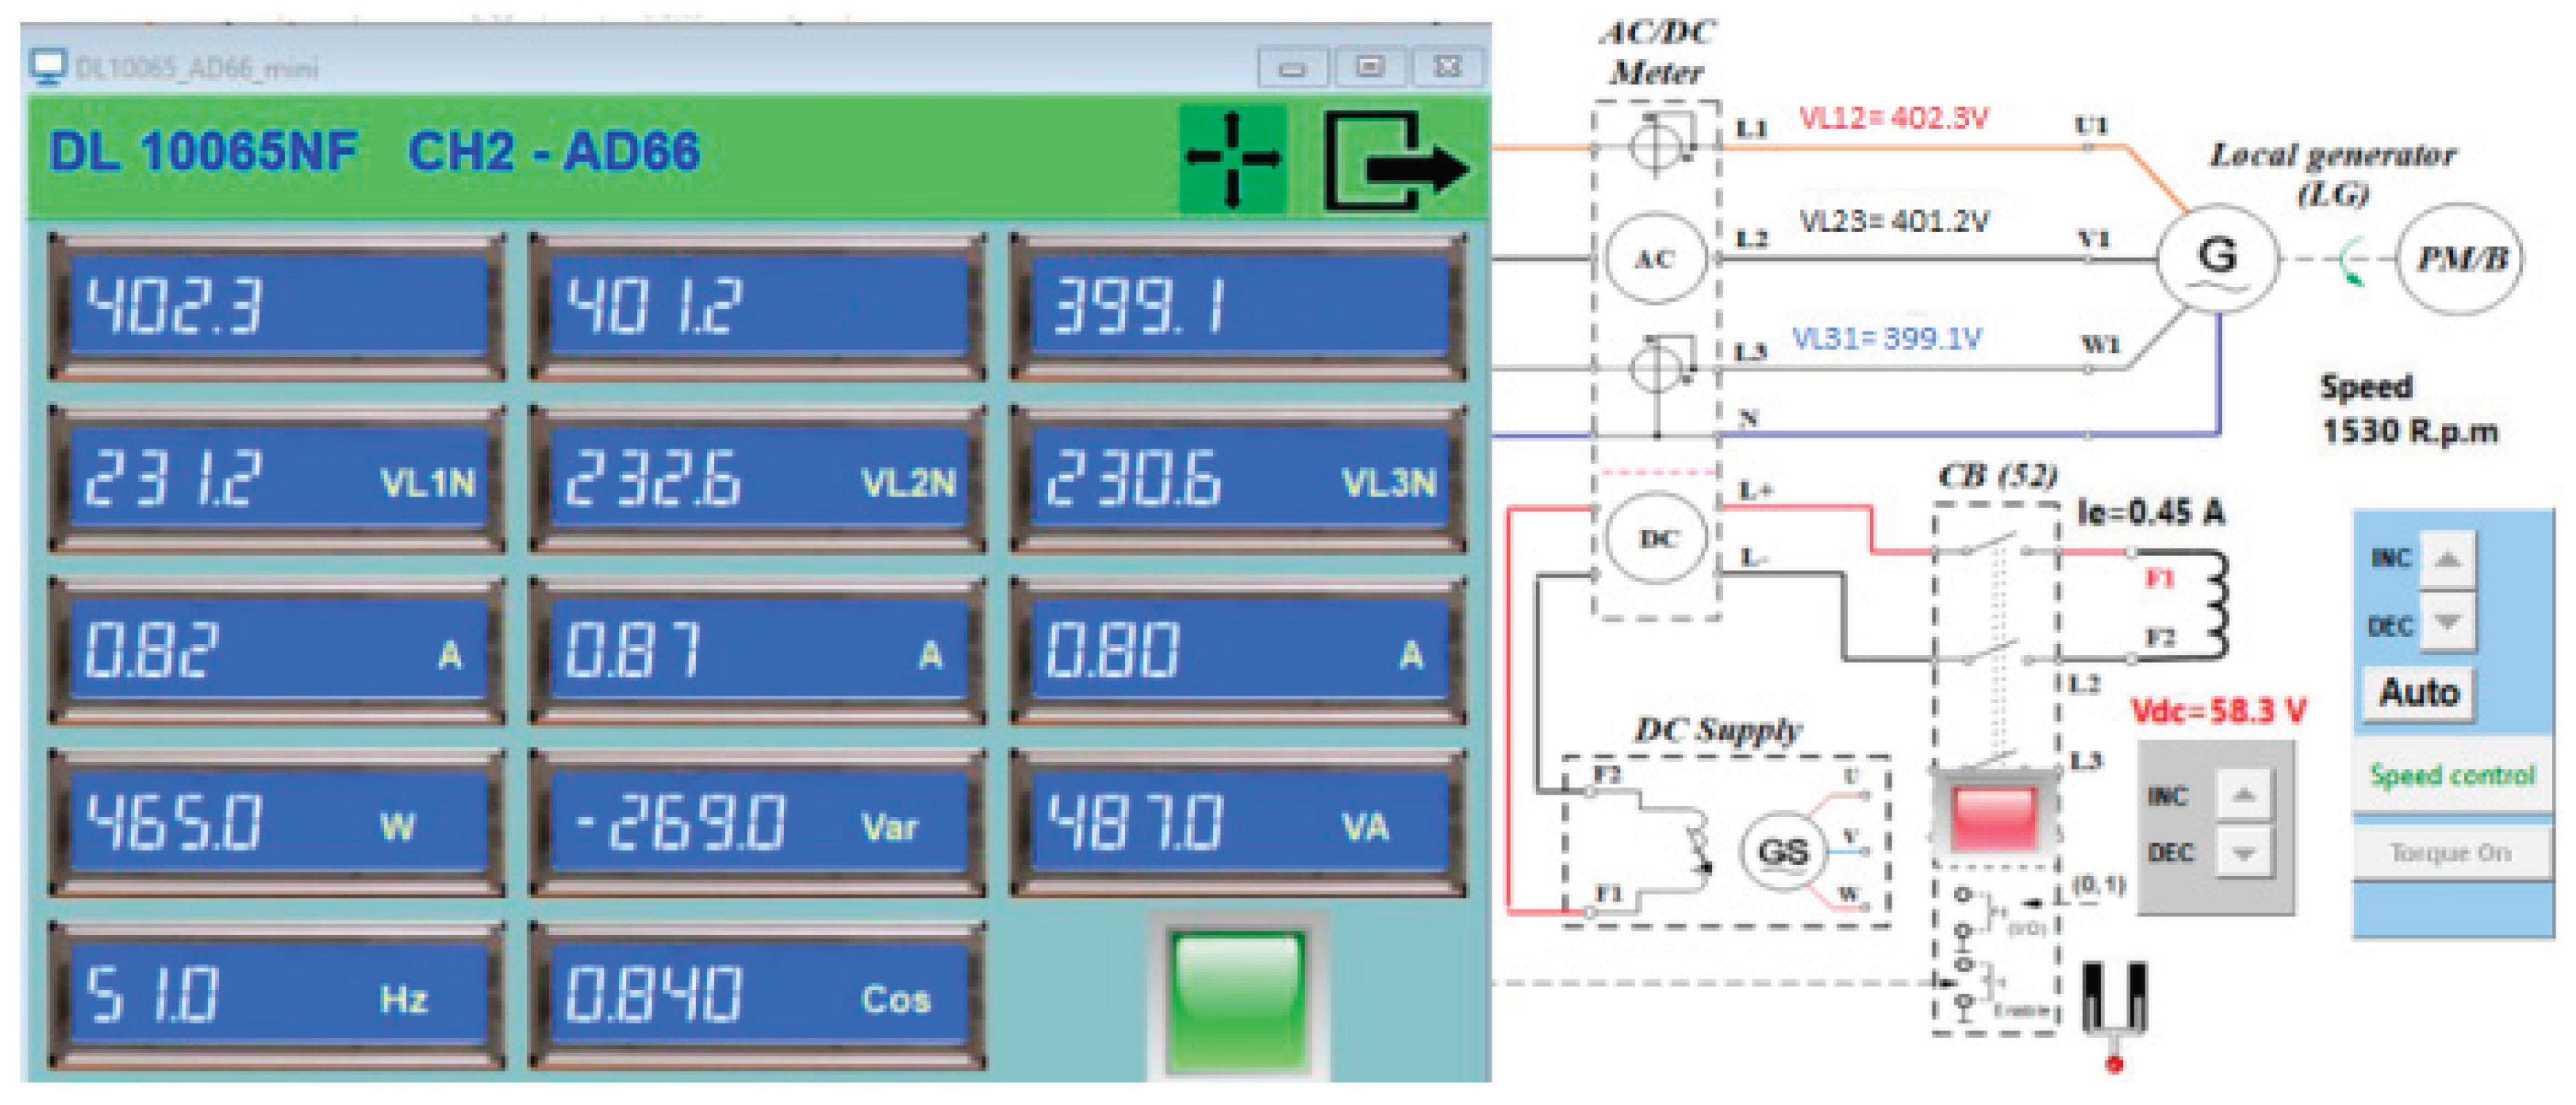
Figure 17, were the experimental operations are allowed to be controlled, with measurement details shown in
Figure 18 (for generator side) and
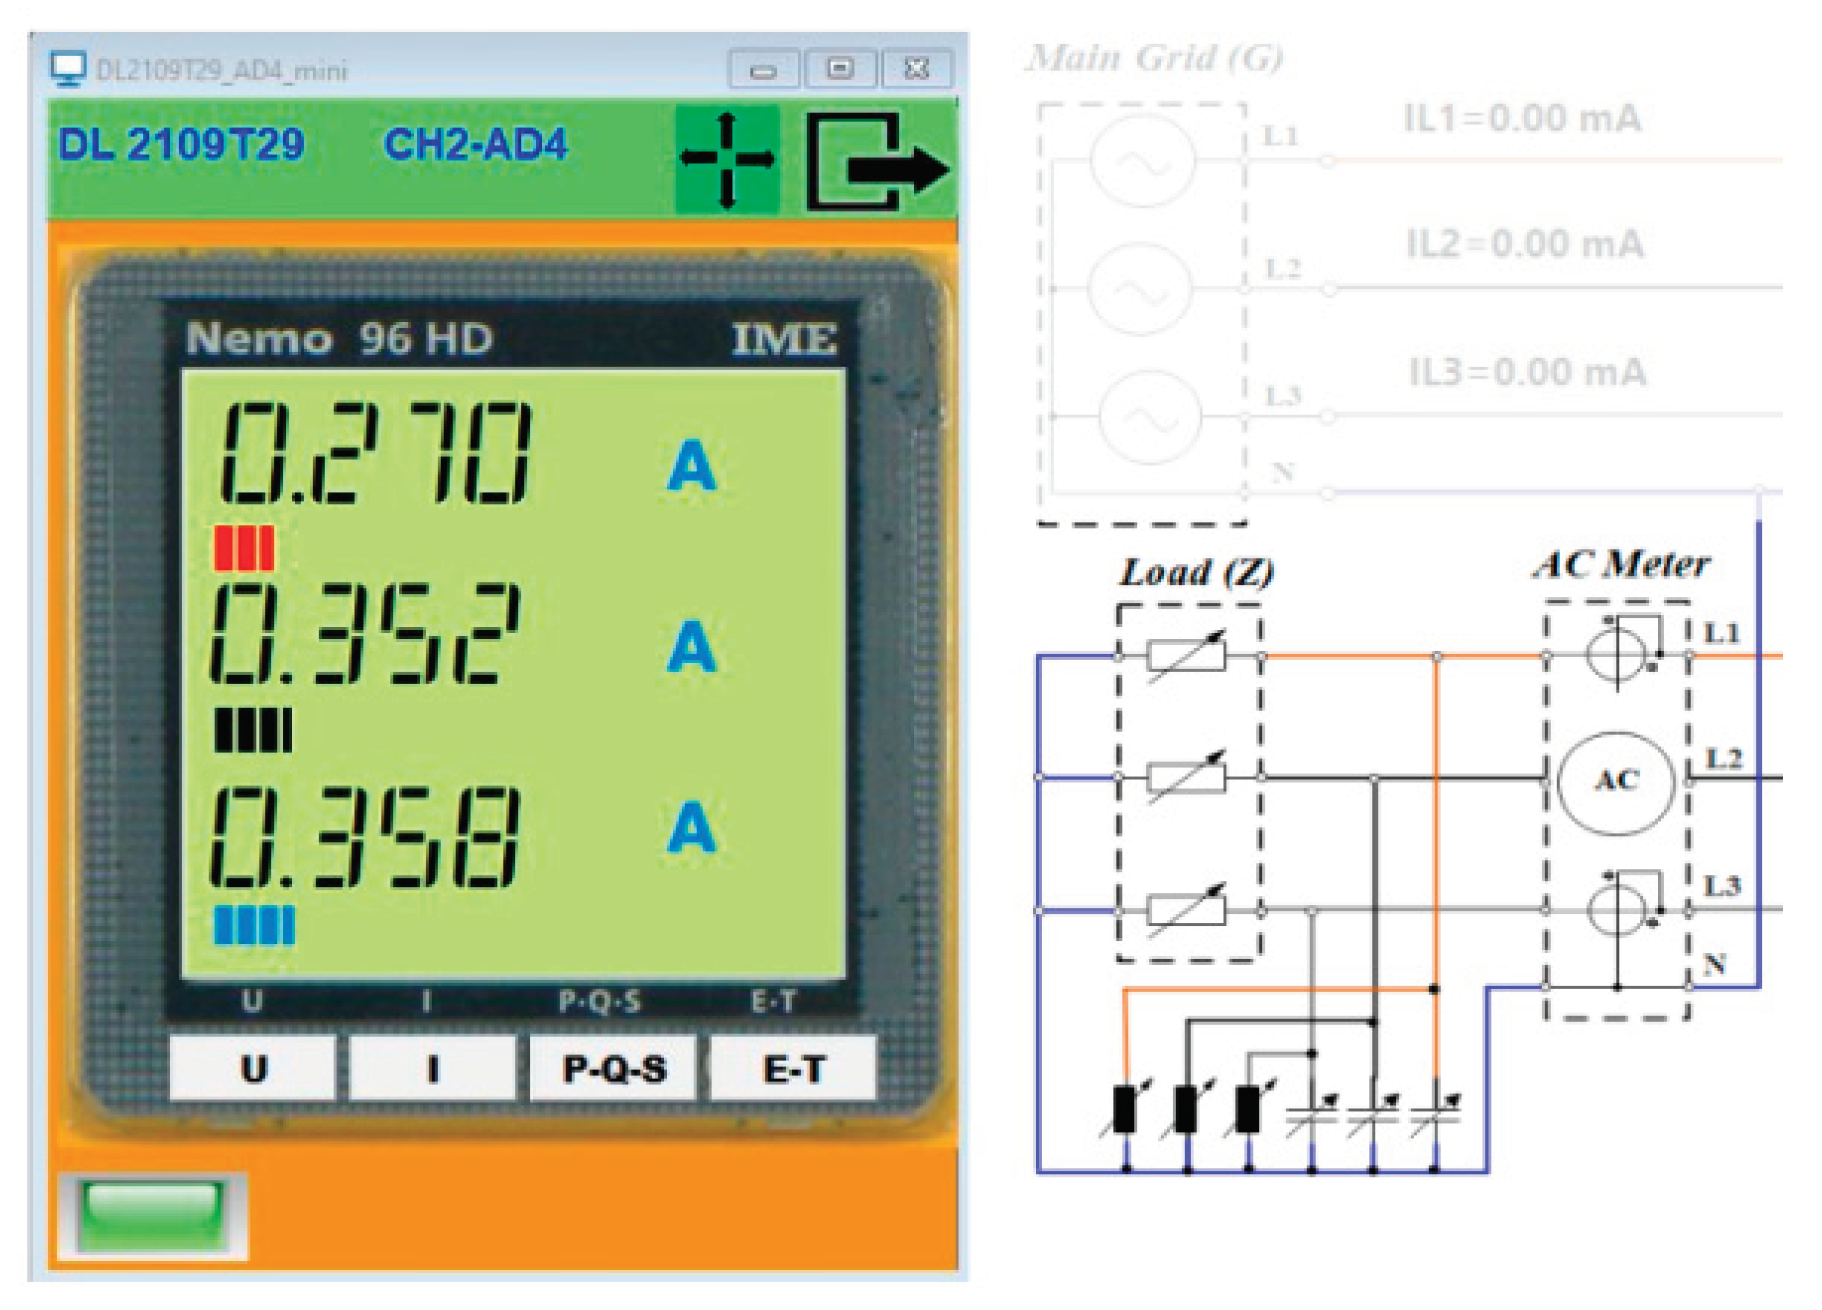
Figure 19 (for the load).
4. Tests and Experimental Setup Results
As in all double supplied electric power systems, the first step is the coupling in parallel of the generator with the main grid after fulfilling the synchronization conditions (equal voltages, equal frequencies, and phases of the voltages below a standard limit). They are controlled by the synchronization relay (ANSI 25). The laboratory model allows these actions by adjusting speed of the prime mover until it reaches 1450 rotation/min (50 Hz), and by adjusting the excitation of the synchronous generator.
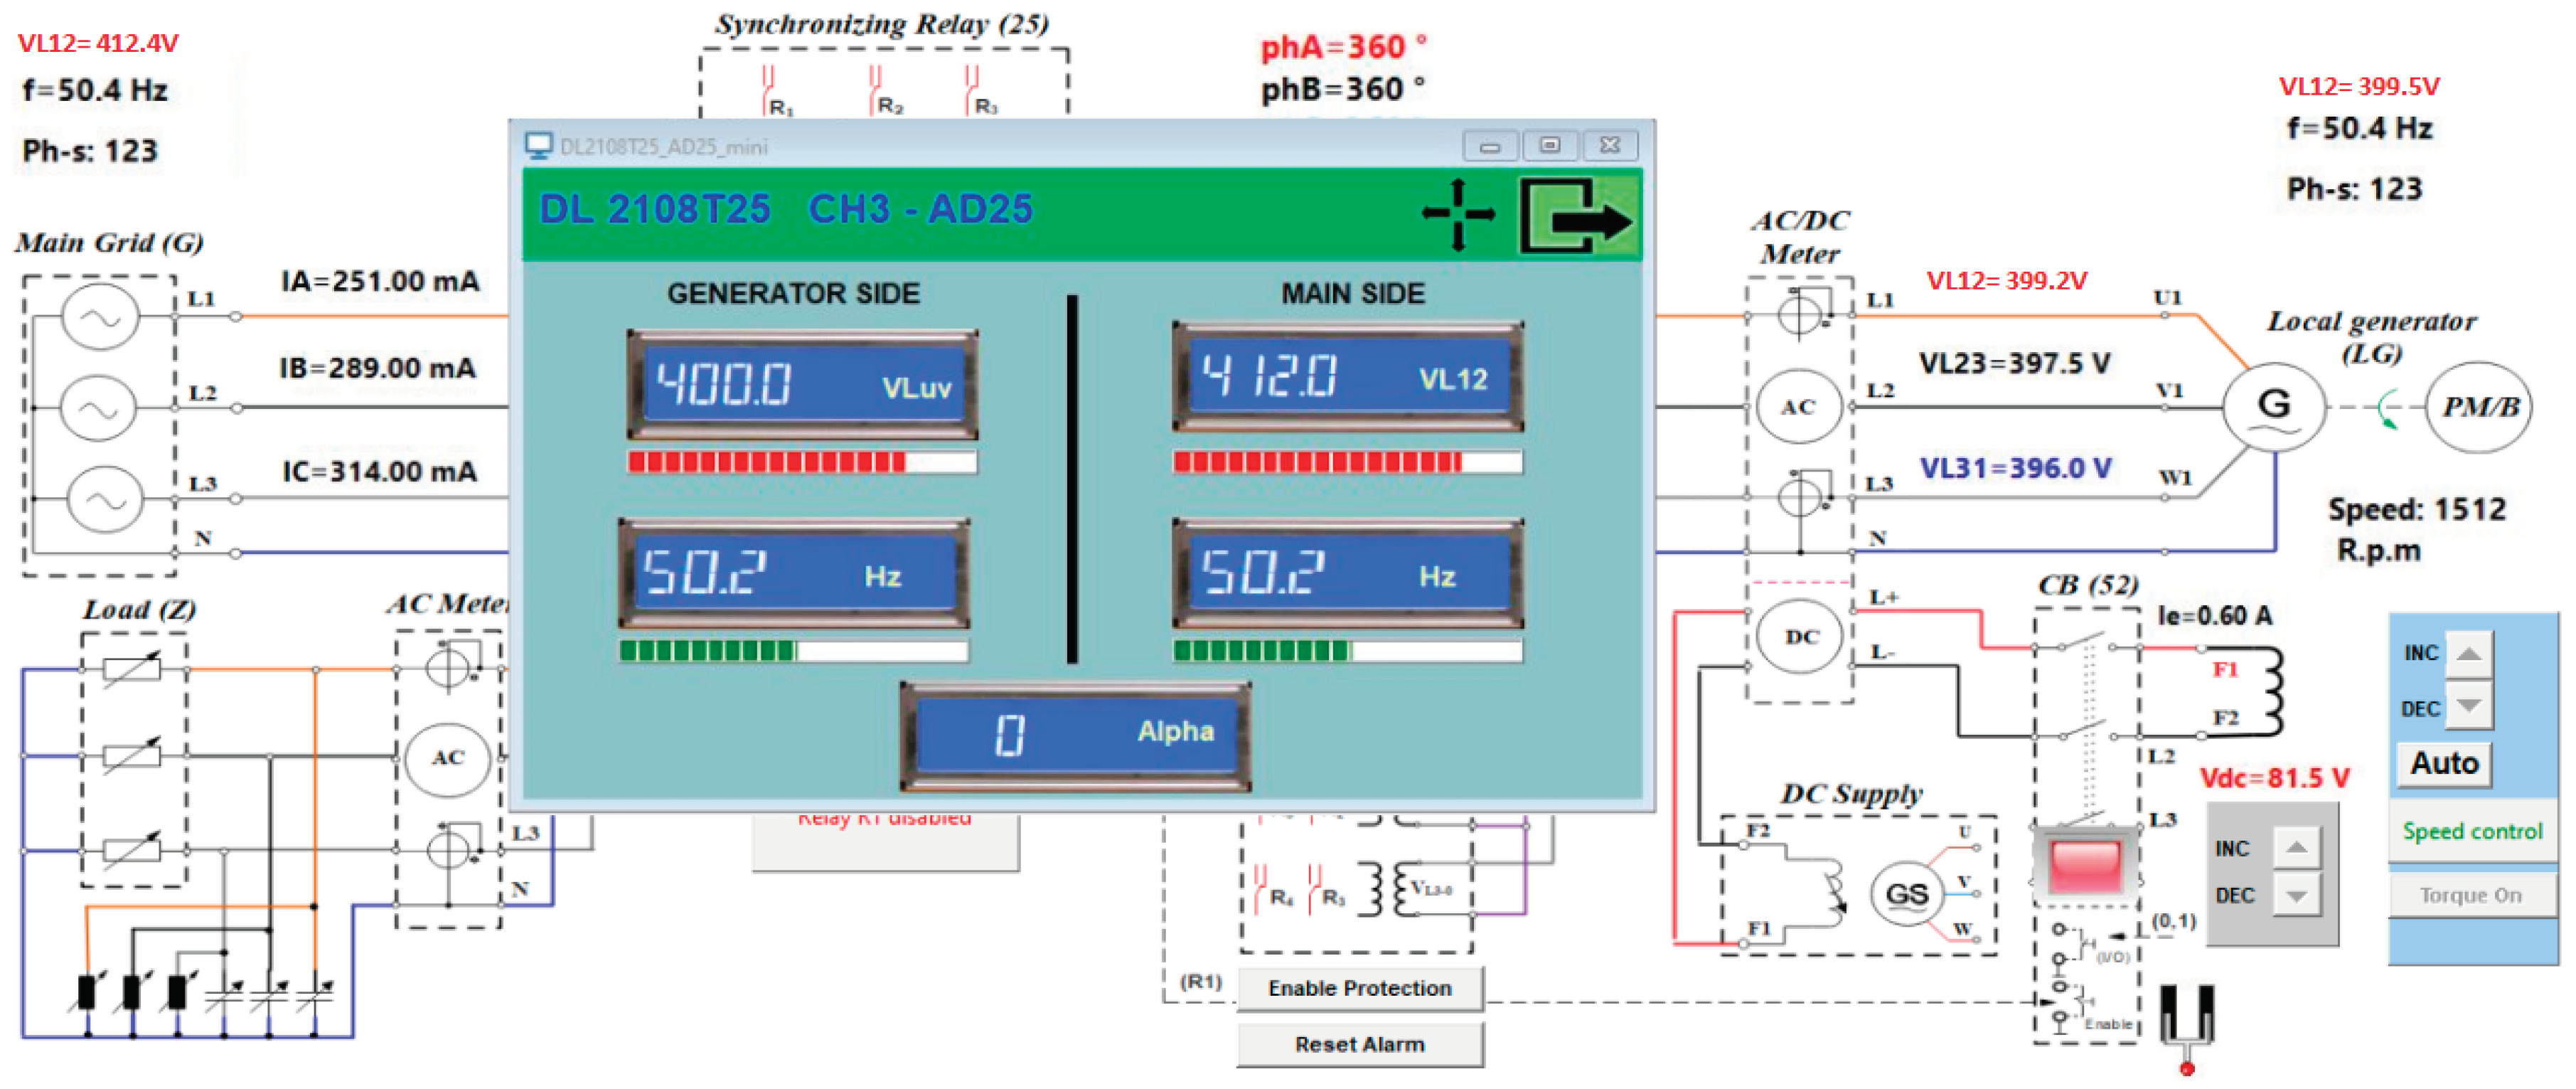
In the separate window the synchronization relay pup-up interface shows with two of the parameters (the frequencies are equal but not yet the voltages), as presented in
Figure 21.
In the current situation the excitation voltage was adjusted (INC button) until voltages reached equal values. Then the synchronisation relay followed its procedure to couple the two power systems.
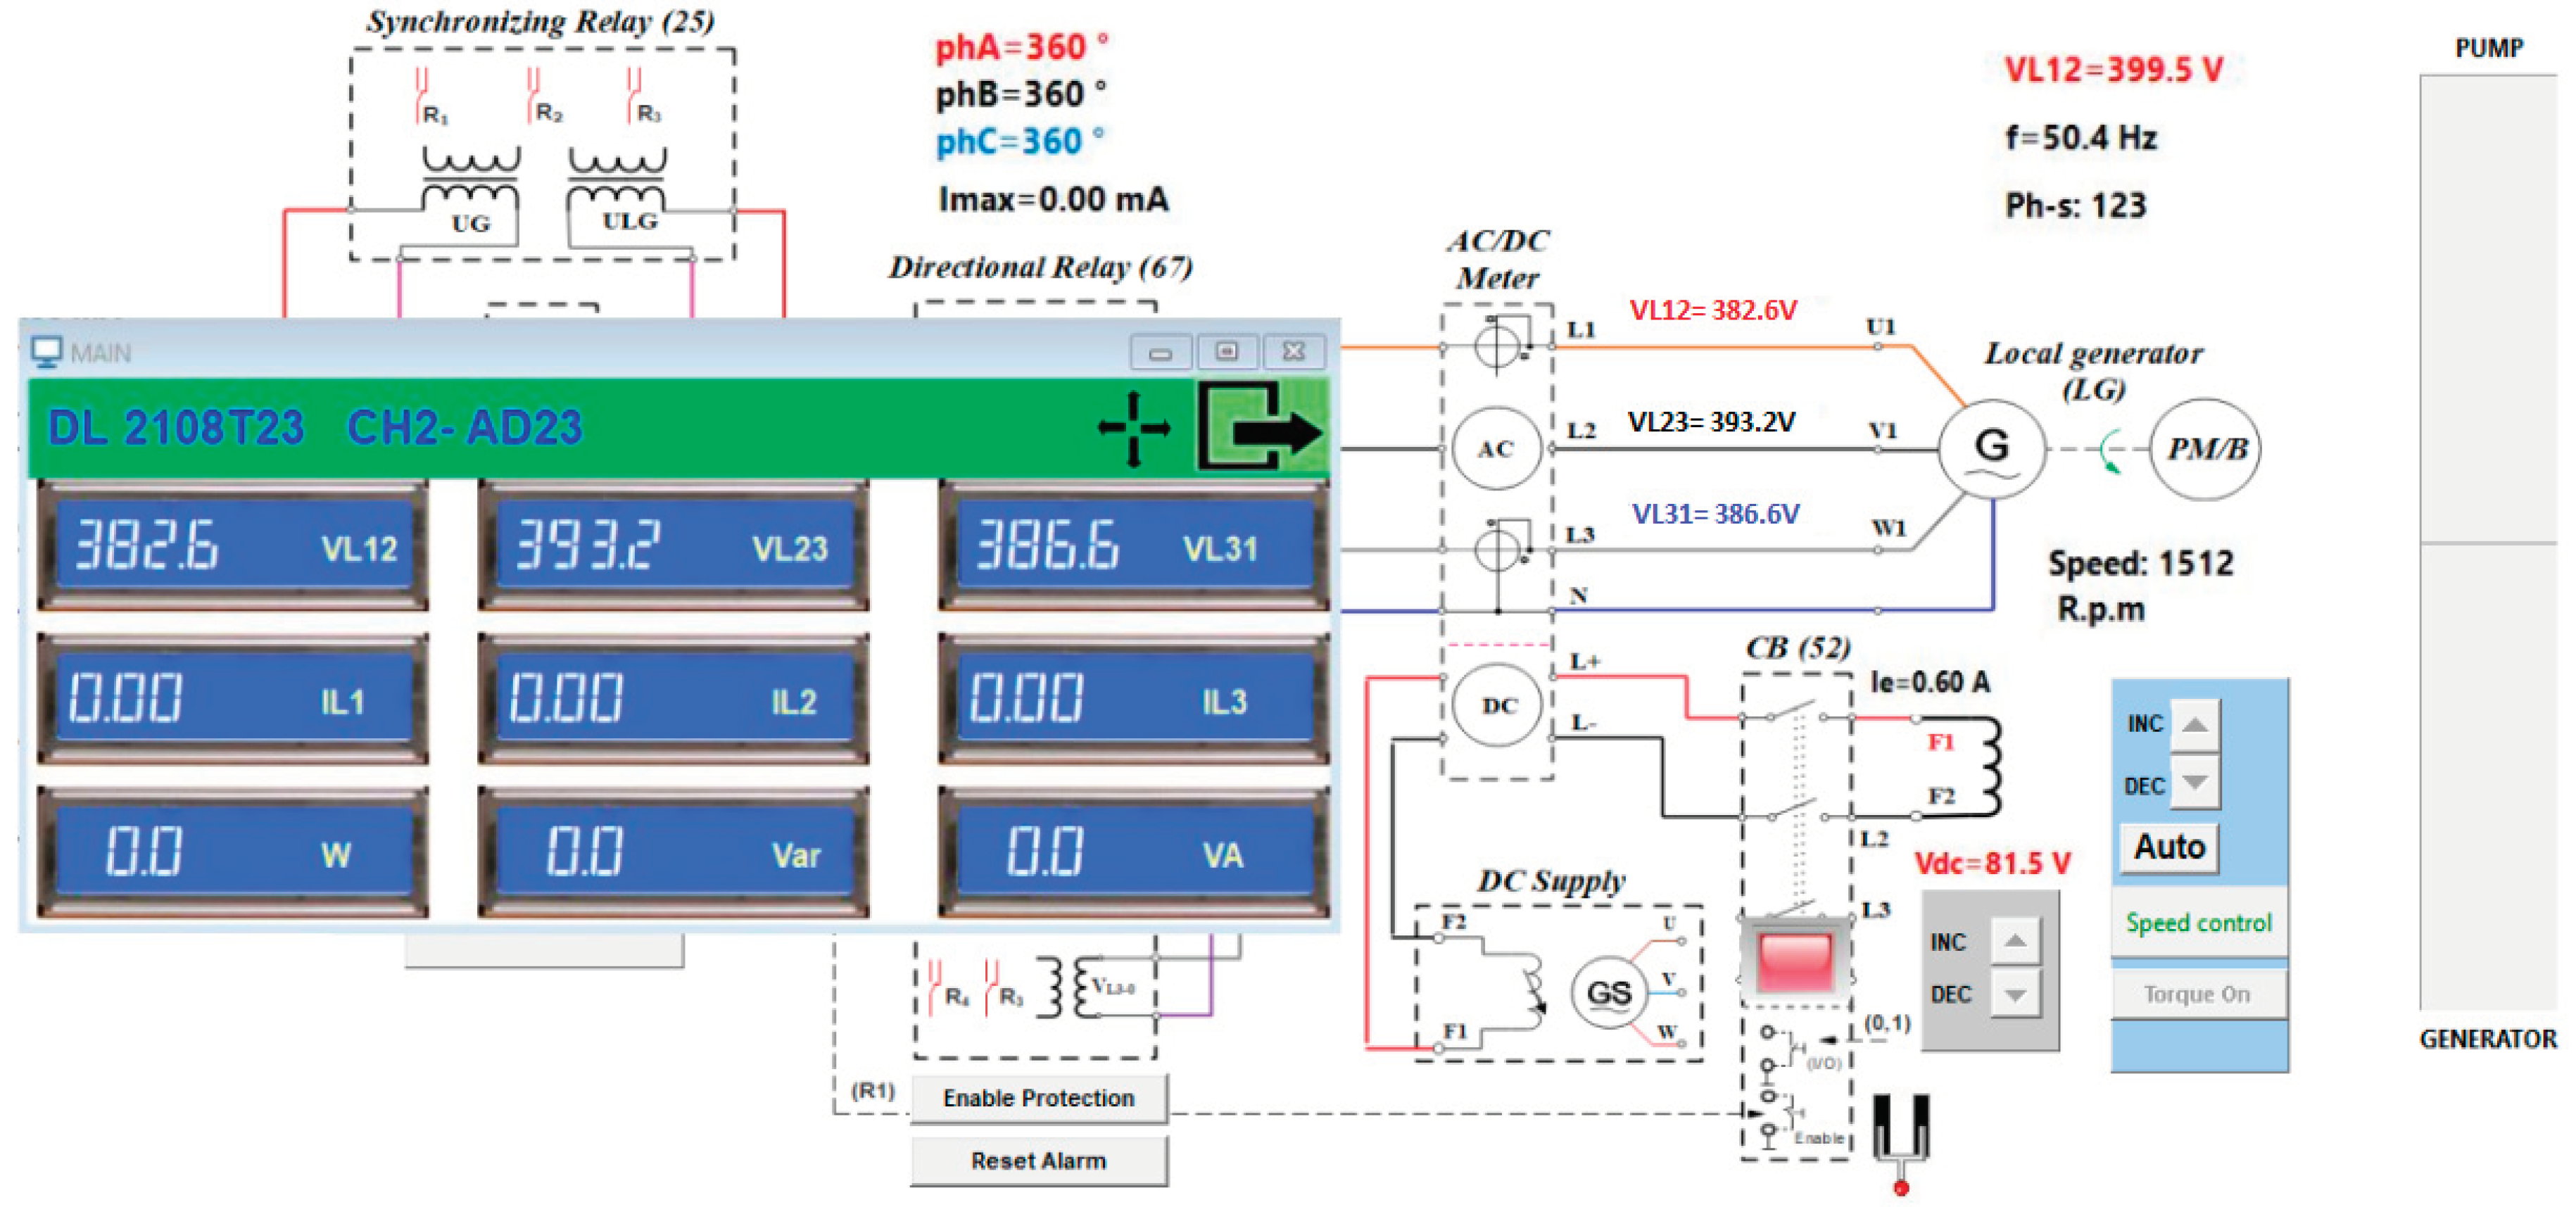
After the synchronization process was ended, the electrical parameters measured by the directional relay 67 are shown in
Figure 22. The measured injected power (line three in the opened display) was null. At the same time, the synoptic display didn’t fill any of the Pump/Generator container.
4.1. Experimental Test with the Synchronous Machine as a Motor for the Pump
After synchronization process passed, the torque control was activated and was added brake to the electrical machine’s rotor: it acts as a motor that drives a pump (for storing the water energy in upstream basin).
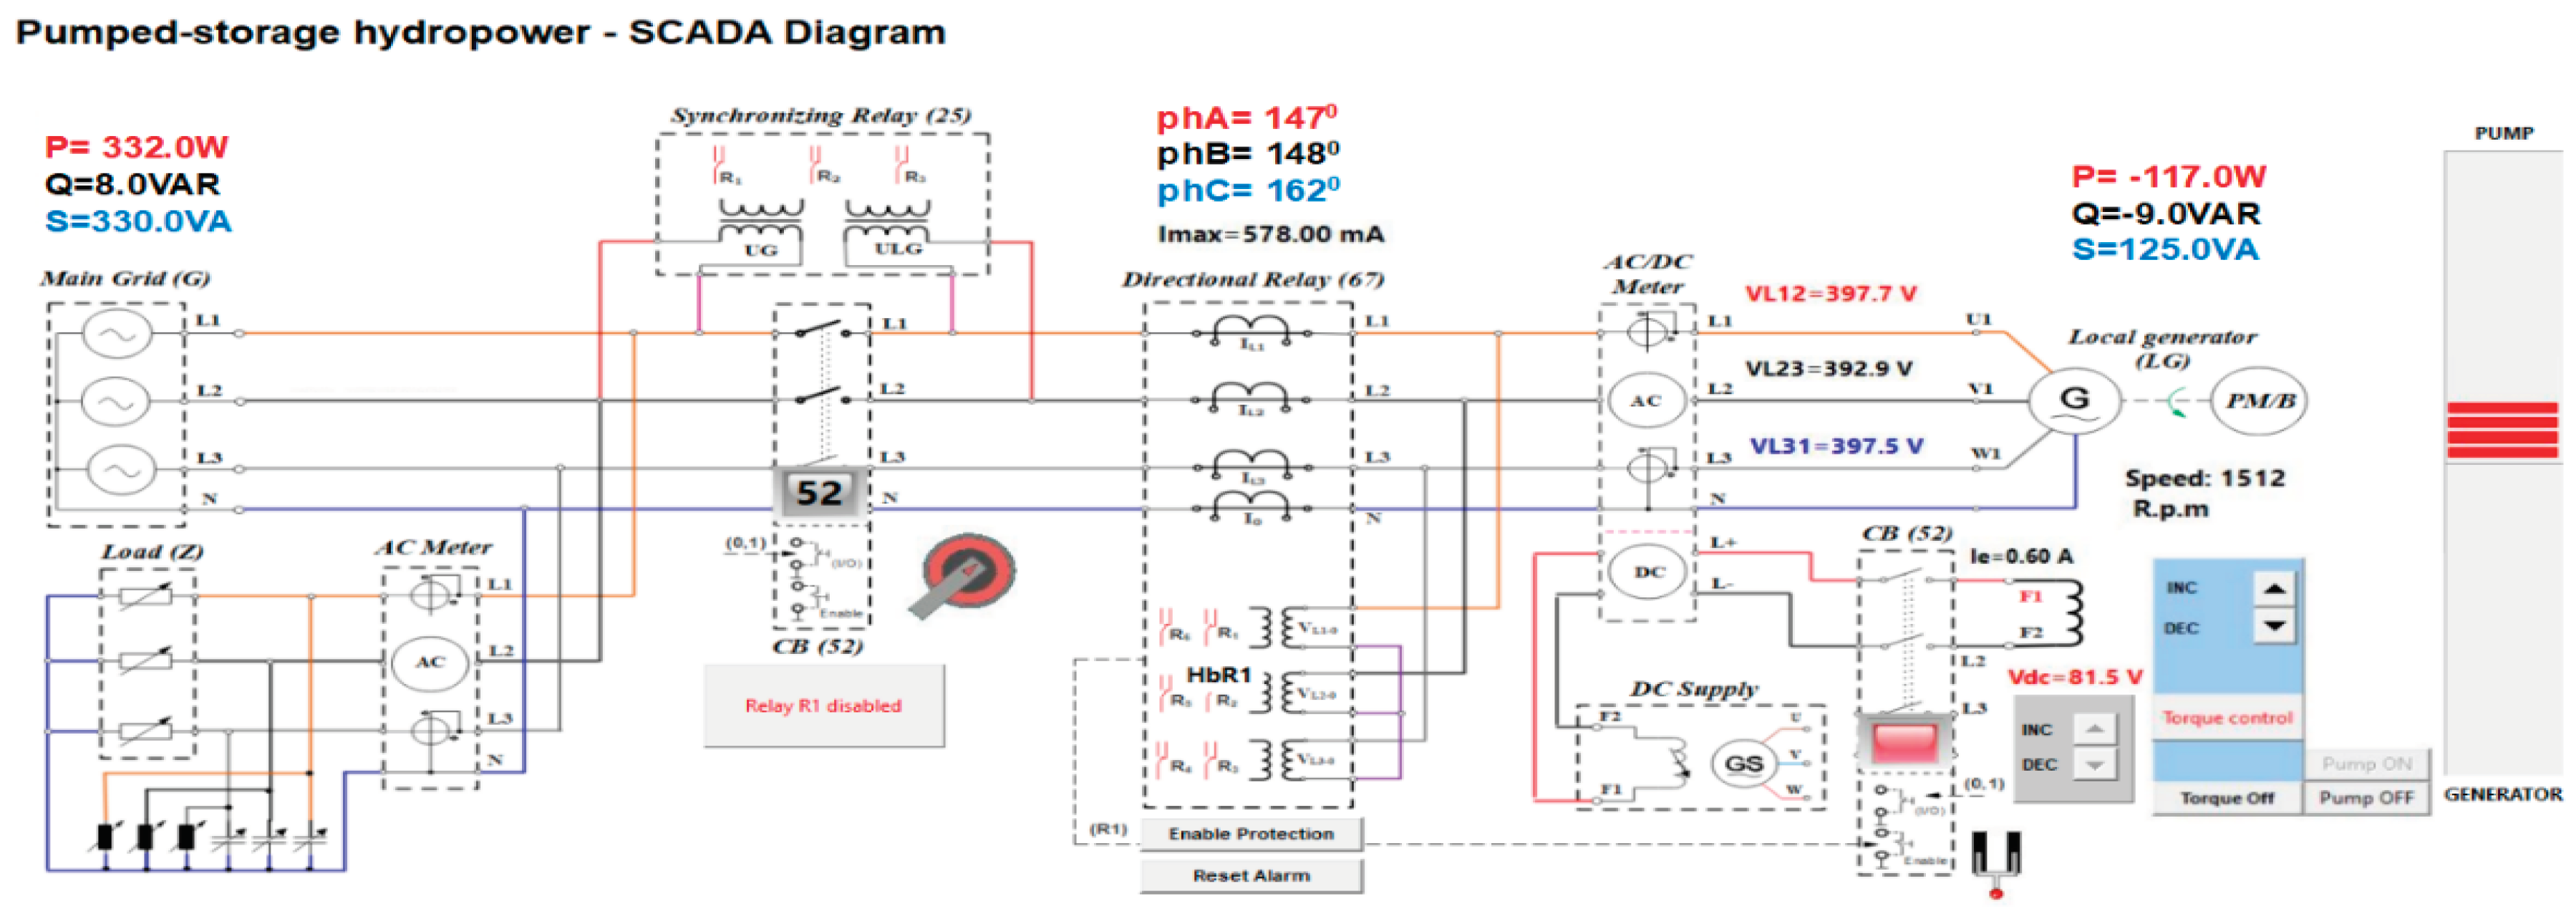
With connected load, the extracted active power from the grid was 332 W, and the required power by the pump was 117 W. The distribution busbar was at the load connection point to the electric grid, by convention, the positive sign was when the power flow comes to this point, and negative sign was when the power flow goes out from this point. According with this rule,
Figure 23 shows that the power is extracted from the grid and used for load and for the pump. The active power of 333W from de grid and 177 W from de local generator are used by the load. In the synoptic representation, the pump tank is filling proportionally with added torque. We might also notice directional relay phases (not equal because also the phases loads are very equal too).
Because the energy consumed by the pump needs to be controlled accurately, the goal was to program the directional relay to supervise this direction of the power flow.
Was supervised the magnitude of the controlled parameter and its angle direction to the reference. If one-line current was established as reference, and the vectoral difference was controlled of the other two phases (Uh), measured with 90° relay connection, we can setup the relay operation angle, based on its programming procedure.
The reference value of the tripping current was Is=500mA, the reference angle was a=60°. The relay worked, as shown in
Figure 23, because the current was higher than tripping current (Ix=Imax=578 mA) and the phase displacement outside the protected area (“φx” of 170°).
The relay supervises the direction of the current, and the operation conditions are shown in
Figure 24:
- Input voltage above 1-2% of the rated input value.
- Input current above the set level: Ix > [Is]
- Phase displacement “ϕx” within ±90° from the reference direction “a”.
In this working regime, the directional relay that detect the direction of the power flow, in improving the protection, by controlling the overcurrent limit only when the electrical machine runs as motor for water pumping.
Figure 24.
The vectorial representation for the current parameters SCADA diagram snapshot.
Figure 24.
The vectorial representation for the current parameters SCADA diagram snapshot.
4.2. Experimental Test with the Local Generator Energy Injection
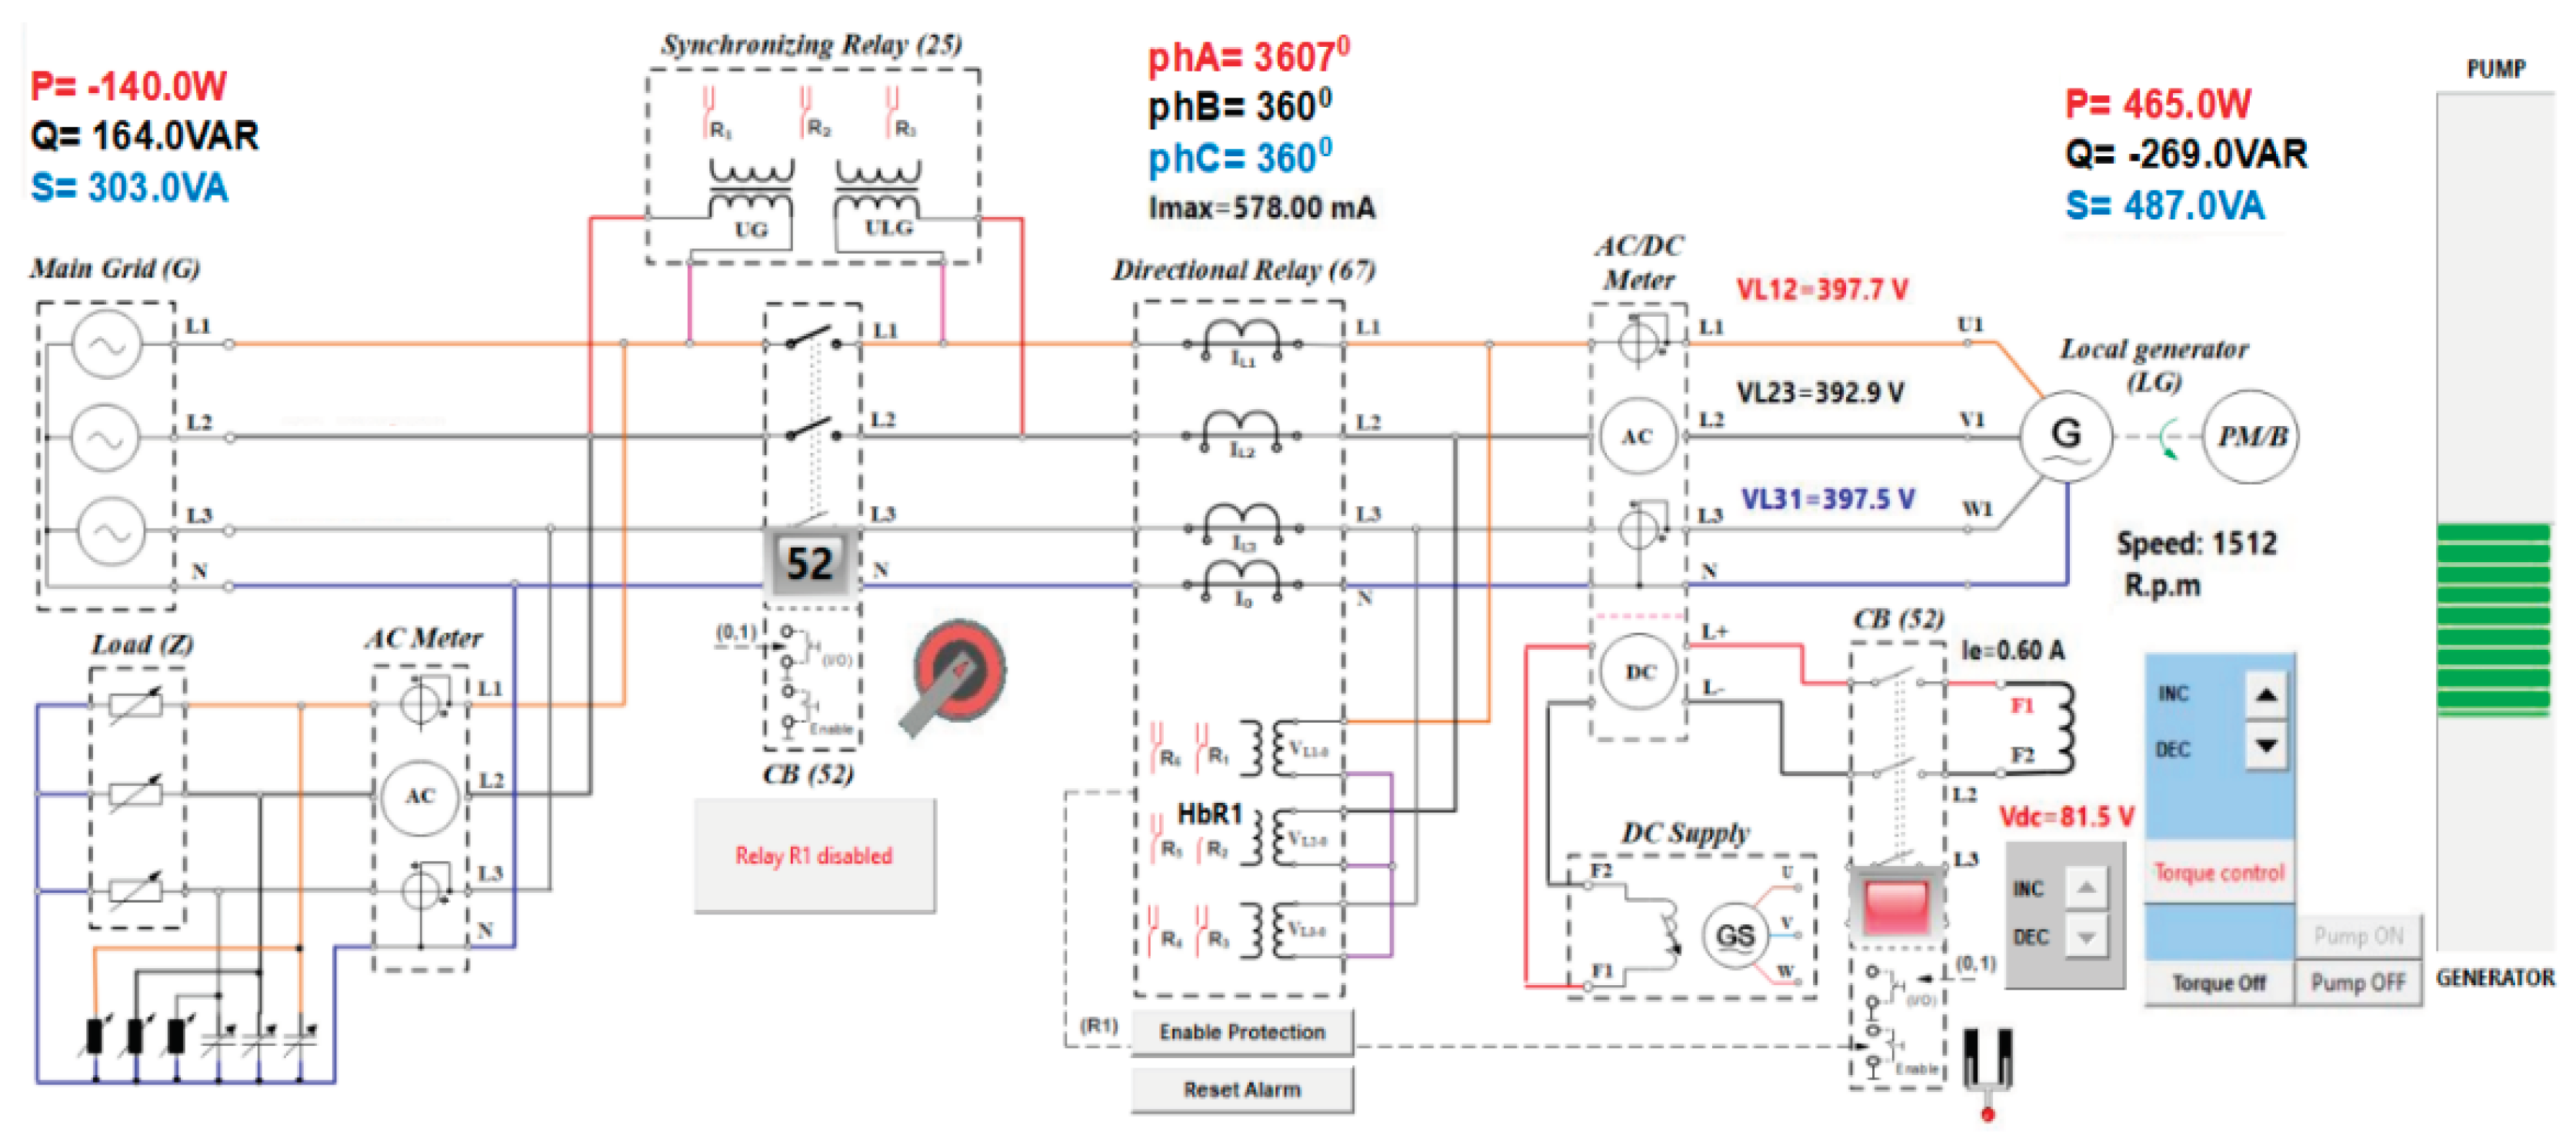
With the speed control facility from the interface, the synchronous machine was running as generator, as in
Figure 25. In this case the local generator is driven by the prime mover (simulating the energy captured at turbine level from the upstream basin water potential energy) and producing 465W power that is used by the load (465 W-140 W), and rest is pushed to the grid (140 W). In the synoptic representation, the generator tank is filling proportionally, with added torque to the prime mover. We might also notice that the directional relay phases are changed.
In the testing experiments the phase current was above 500 mA, which is the tripping value of the directional instantaneous current protection. The relay didn’t trip because in this case the phase displacement was in the protected area.
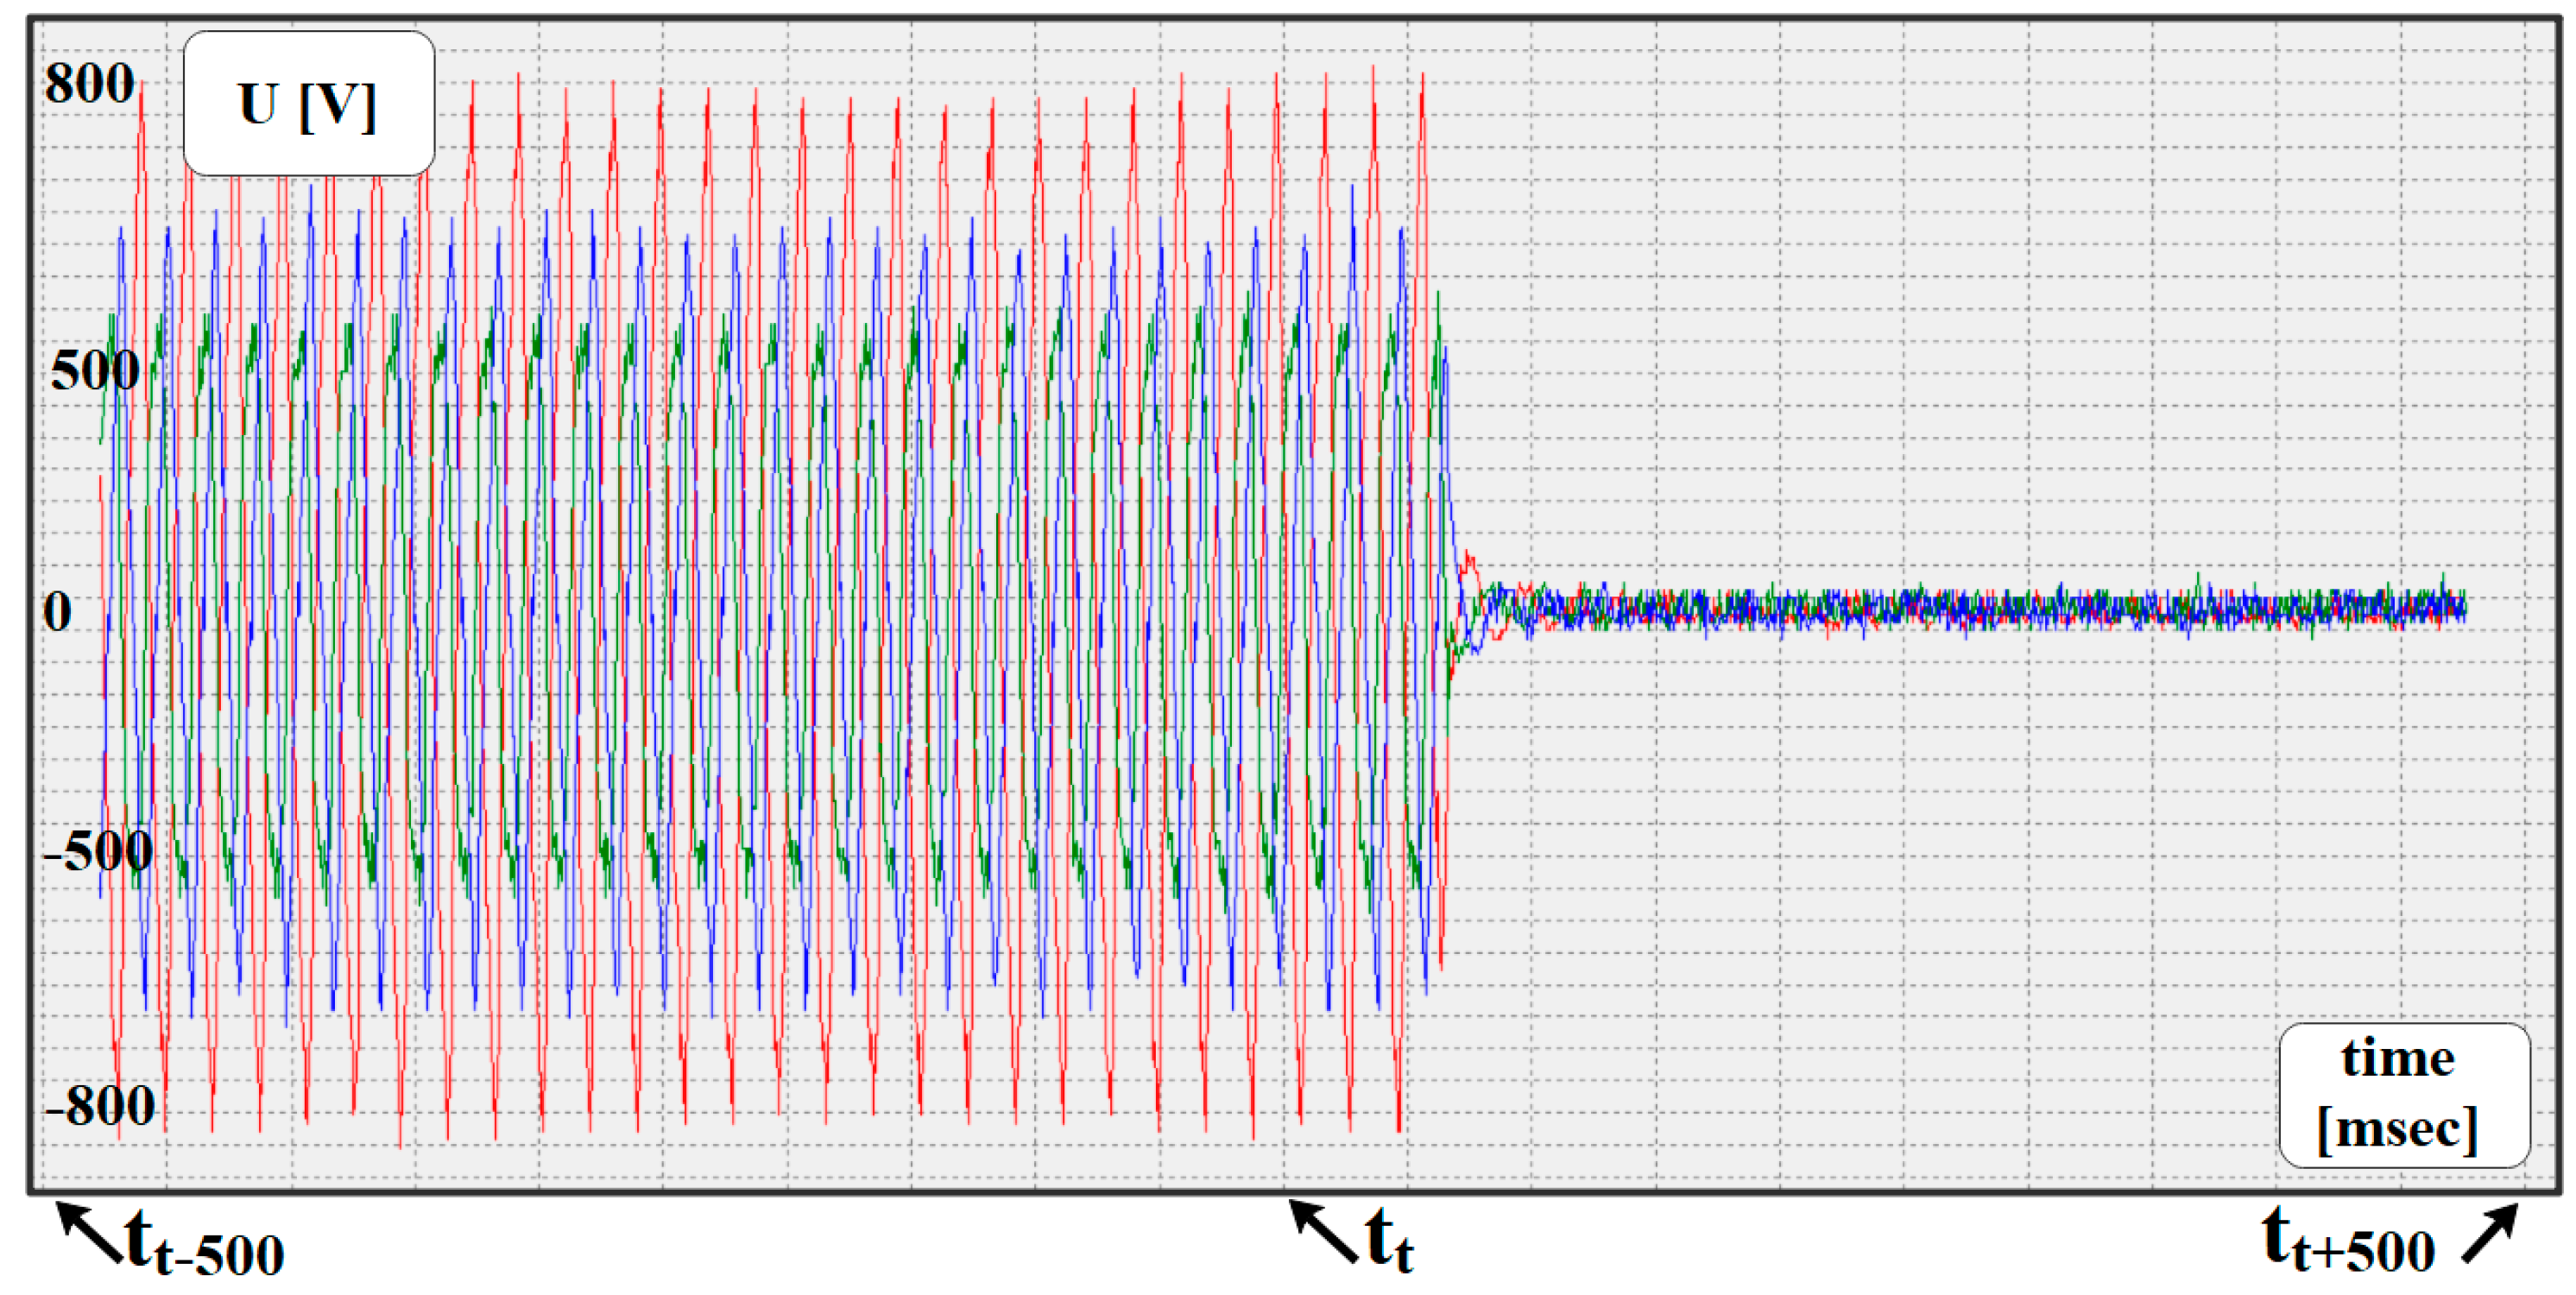
On the other hand, to validate the response of the relay (for disconnection or for connection/re-connection), was programmed the relay to record instant values for 500 milliseconds before and after command trigger (tripping or connecting command) in order to understand the time response of the relay. The first oscillography shows a tripping evolution,
Figure 26.
The significant times are marked: t
t is the tripping moment (reference zero), t
t-500, t
t+500 represents the range of event recording, important for transient analysis. The relay responds according with most general regulations [
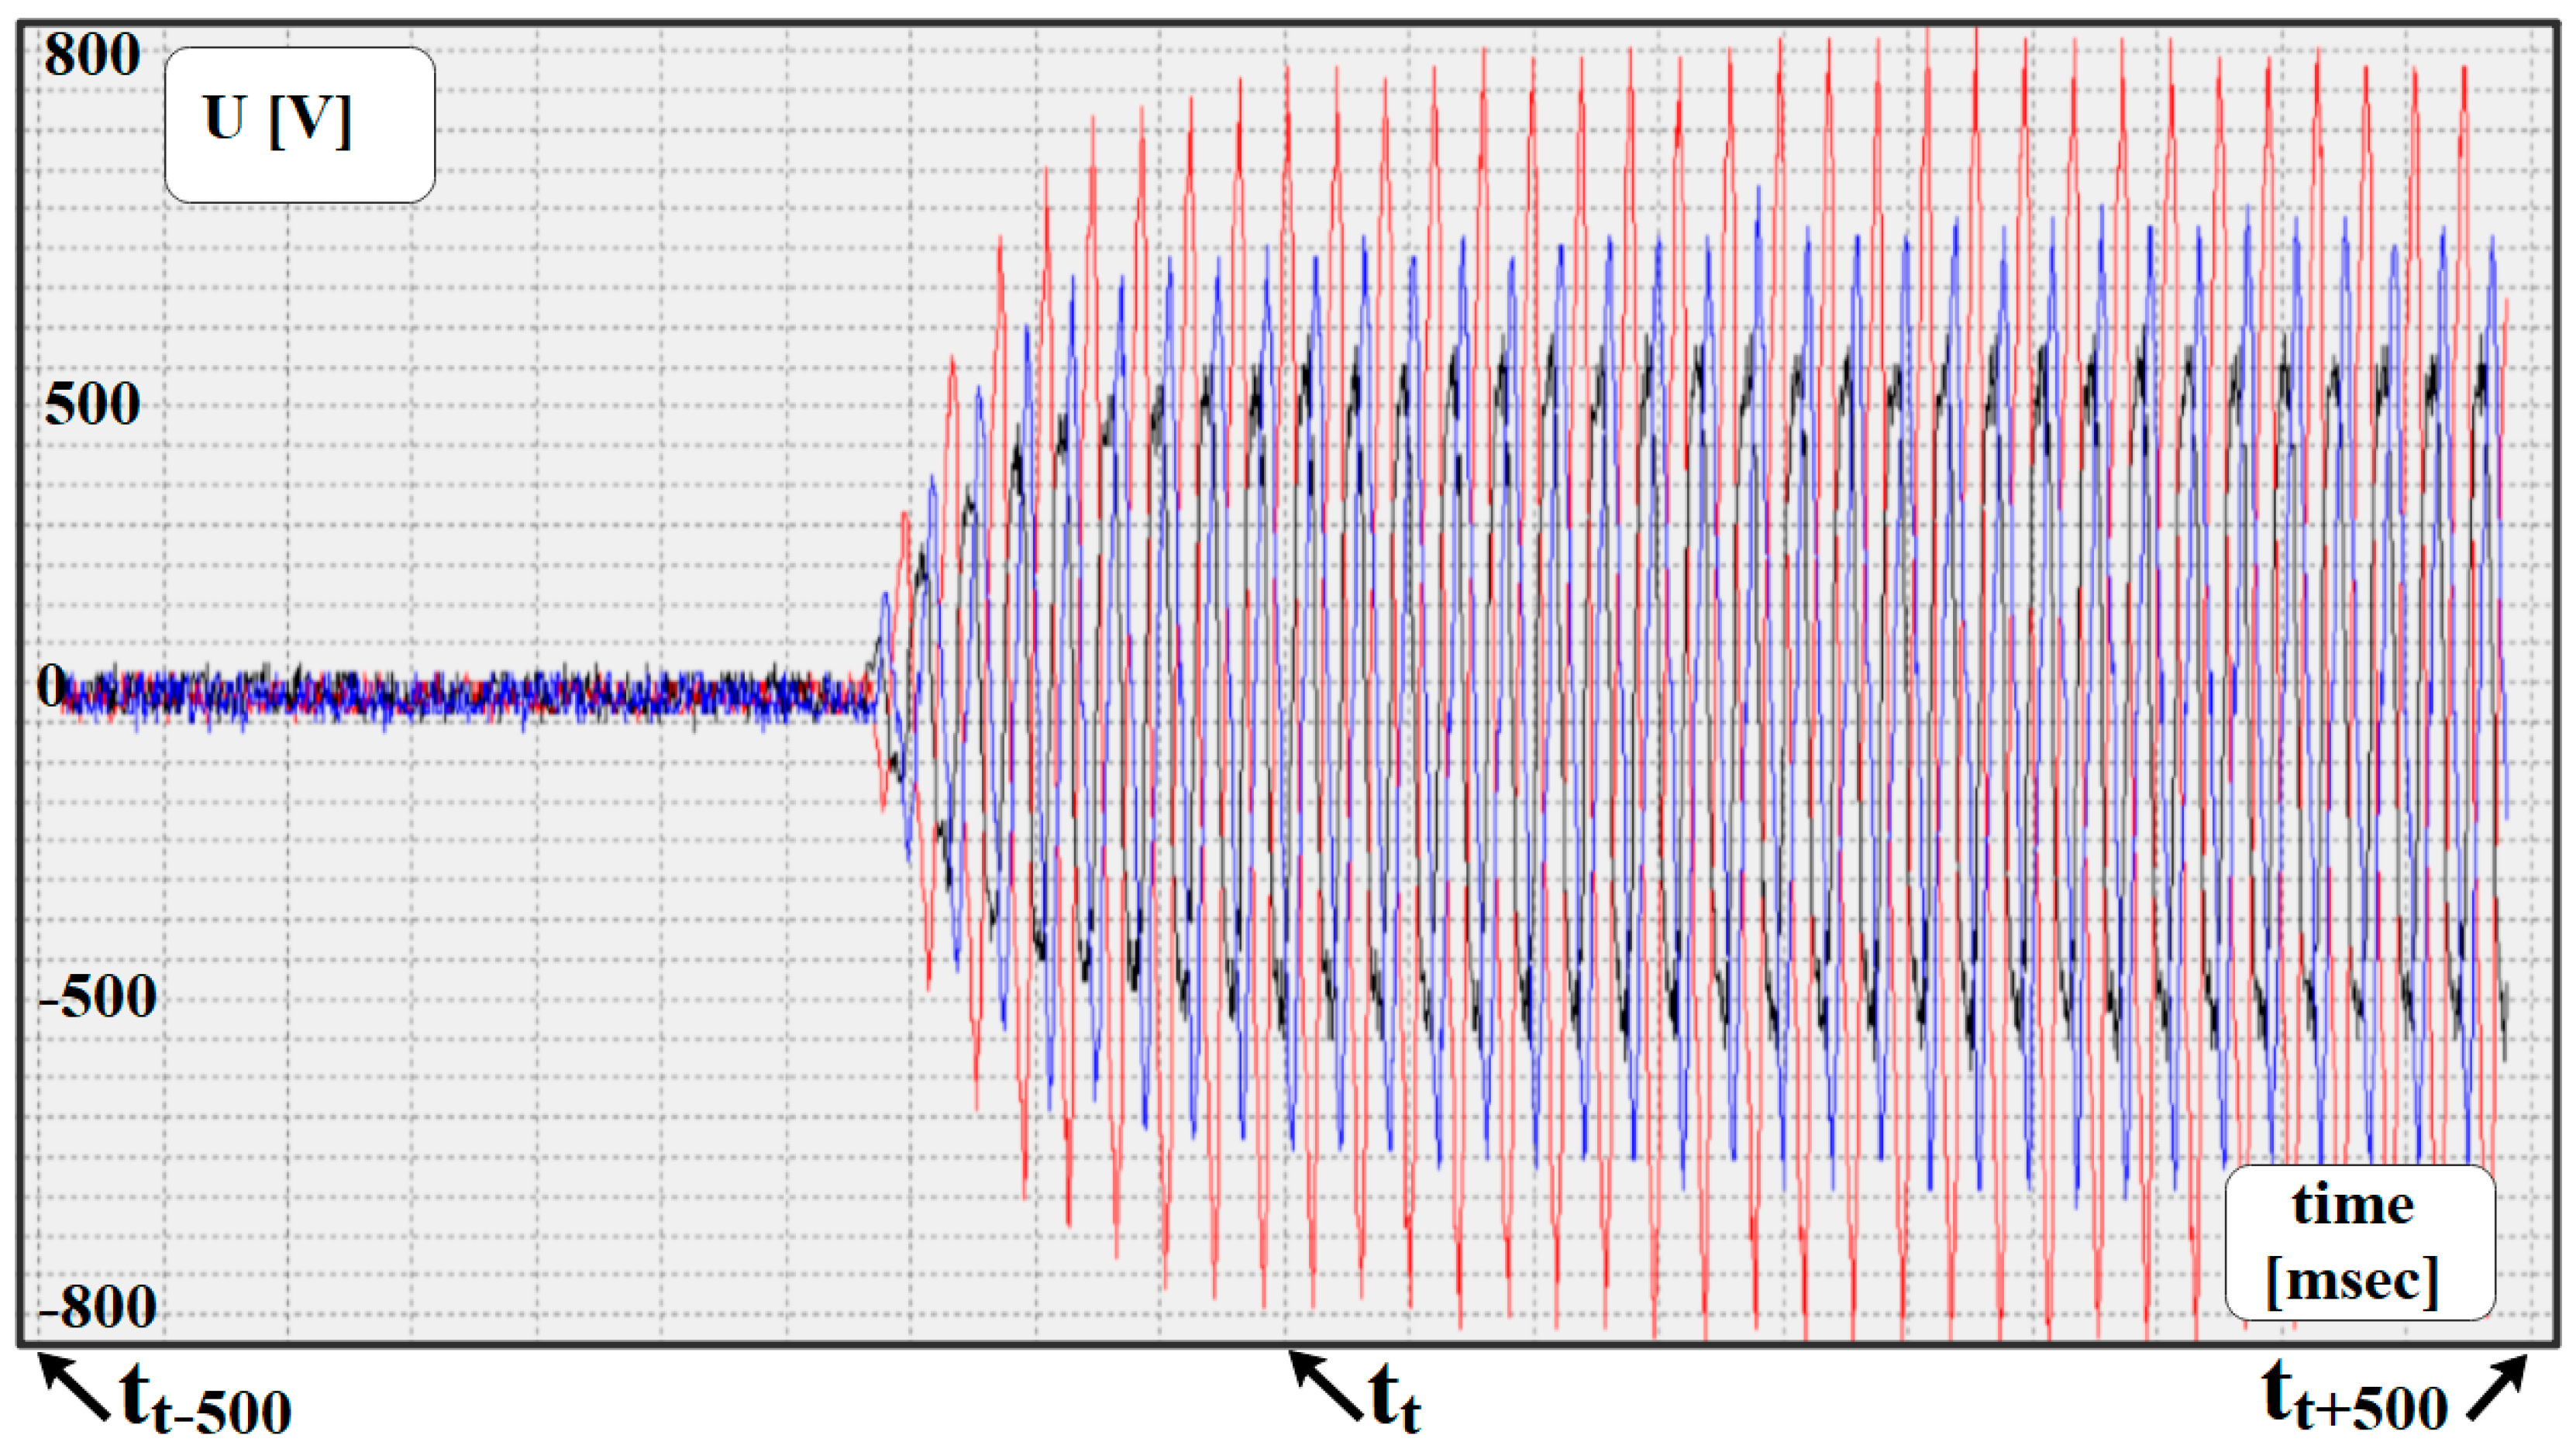
10], the disconnecting time is around two and half periods of the power frequency (around 50 milliseconds). There are also oscillography records for connecting the line as in
Figure 27.
The record is done in similar experimenting conditions (rated current, recording time). The only difference is the meaning of tt: from the relay setup point of view, the reference time is when the power is stabilized in frequency and amplitude. The important observation here is the variation of the voltage at the output of the line until it become “useful”. In our experiments we obtained variations for 150 milliseconds, value that still fits the requirements from [
11].
The records are repetitive, which means that the lab setup is stable, and the relay works correctly.
5. Conclusions
A lab model of the pumped storage system evaluation has been set up for the synchronization of two or more power supplies, to realize a smart-grid connected system. For this operation, the synchronization process is implemented. The relay allows states collection for higher level of processing (security constrained unit commitments), or smart grid implementations. The relay offers 4 outputs for integration in hardware networks and send states data via RS 485 communication networks. In this way, the designed lab model replicates real process implementation, coordinated by designed SCADA is proving the concept, and in the same time, the SCADA could be used in real situation (monitoring and controlling the industrial relays).
The objective to present a comprehensive understanding of PHS regarding peak shaving, was described in [
19,
20,
21]. We highlighted that the use of a directional relay between storage systems and the electric power grid is the outcome of our design optimization technique. This relay improves interoperability by automatically identifying and distinguishing between the fault mode and the mode of operation’s switching sequence.
The lab model uses a software controlled brushless motor that plays the role of a brake (similar with the pump turbine). The developed brake torque results in an extracted power from the system (when there is an available power at the distribution point or when the price of the grid energy is low). The preparation of the system for working as the motor-pump system is done automatically by the SCADA software, allowing exercising and knowledge base accumulation for real reverse-controlled turbine control.
The lab model uses also the same software controlled brushless motor that plays the role of a prime mover (similar with the hydro turbine). The developed brake torque results in a produced power for the system (which is consumed locally or injected into the grid as sold energy when its price is high). The preparation of the system for working as the turbine - generator system is done automatically by the SCADA software, considering time delays for working mode and transitory sequences switching.
The lab model, controlled by the SCADA, is able to switch between pumping and generating system passing through the synchronizing speed, managing the possible sleeps of the speed variation when it switches between generator and motor’s regime.
The SCADA software provides for the upper-level processing software (Smart Grid software), automatically, the power flow into the system (values and sign) every 200 milliseconds (at the speed of the Modbus protocol). Starting from the current version, as future work, there are tested Modbus over TCP in multi-clients systems, for remote monitoring and control, and for reducing the data querying time closed to the standard network delays limit.
From the practical point of view, it is underlined the fact that SCADA (designed to be used on both cases: lab model and real system) is controlling all real technological functions from the real system integrated into the lab model, for knowledge base accumulation. Then the SCADA can be installed on the real system, with fast acceptance and implementation.
Author Contributions
Conceptualization, Mircea Rîșteiu, Remus Dobra, Dan Micu; Formal analysis, Alexandru Avram; Investigation, Mircea Rîșteiu, Remus Dobra and Florin Samoila; Methodology, Remus Dobra and Georgeta Buică; Software, Mircea Rîșteiu, Remus Dobra and Florin Samoila; Supervision, Mircea Rîșteiu, Renato Rizzo and Dan Micu; Validation, Mihaela Aldea, Florin Samoila, Renato Rizzo and Dan Micu; Visualization, Georgeta Buică, Renato Rizzo and Dan Micu; Writing – original draft, Georgeta Buică; Writing – review & editing, Alexandru Avram, Renato Rizzo and Dan Micu.
Funding
This research received no external funding.
Institutional Review Board Statement
Not applicable.
Informed Consent Statement
Not applicable
Conflicts of Interest
The authors declare no conflict of interest. The funders had no role in the design of the study; in the collection, analyses, or interpretation of data; in the writing of the manuscript; or in the decision to publish the results.
Appendix A. List of Abbreviations
PHS - Pumped hydro storage
SCADA - Supervisory control and data acquisition
67 ANSI Code - Directional relay
25 ANSI Code - Synchronization relay
IEEE 1547 - IEEE Standard for Interconnection and Interoperability of Distributed Energy Resources with Associated Electric Power Systems Interfaces
EPS - energy power system
ESS - energy storage system
RES - Renewable energy sources
CEEP - Central Europe Energy Partners
G/M - synchronous machine
LG - local generator
PM/B - brushless machine
UML - Unified Modelling Language
RS 485 - duplex communication system in which multiple devices on the same bus can communicate in both directions
TCP - Transmission Control Protocol/Internet Protocol
References
- U.S. Energy Information Administration. International Energy Outlook 2021 with Projections to 2050; U.S. Department of Energy: Washington, DC, USA, 2017. Available online: https://www.eia.gov/outlooks/ieo/pdf/IEO2021_ChartLibrary_full.pdf (accessed on 21 January 2022).
- M. A. Canete, “RES Development in Central and Eastern Europe, CEEP Report (Q2),” No. 2(53) 2018. Available online: https://www.ceep.be/www/wp-content/uploads/2018/07/CEEP-Report-Q2-2018-final.pdf (accessed on 20 February 2021).
- T. Xu, W. Jang, T. Overbye, “An Economic Evaluation Tool of Inertia Services for Systems with Integrated Wind Power and Fast-Acting Storage Resources,” In Proc. of the 49th HICSS, Hostelling International, Koloa, HI, USA, 5–8 January 2016; pp. 2456–2465. [CrossRef]
- B. Kroposki, B. Johnson, Y. Zhang, V. Gevorgian, P. Denholm, B. M. Hodge, B. Hannegan, “Achieving a 100% Renewable Grid: Operating Electric Power Systems with Extremely High Levels of Variable Renewable Energy,” IEEE Power Energy Magazine, pp. 61–73, Mar. 2017. [CrossRef]
- M. M. Hussein, I. Senjyu, M. Orabi, M. A. Wahab, M. M. Hamada, “Control of a stand-alone variable speed wind energy supply system,” Applied Sciences, Vol. 3, n, 2, pp. 437–456, 2013. [CrossRef]
- R. Yan, T. K. Saha, N. Modi, N. A. Masood, M. Mosadeghy, “The combined effects of high penetration of wind and PV on power system frequency response,” Applied Energy, Vol. 145, pp. 320–330, May 2015. [CrossRef]
- U. Tamrakar, D. Shrestha, M. Maharjan, B. P. Bhattarai, T. M. Hansen, R. Tonkoski, “Virtual Inertia: Current Trends and Future Directions,” Applied Sciences, Vol. 7, n. 7, pp. 1-29, June 2017. [CrossRef]
- Al-H. Abu-Jalala, T. Cox, C. Gerada, M. Rashed, T. Hamitiy, N. Brownz, “Performance improvement of simplified synchronous generators using an active power filter,” in Proc. 2017 ECCE, Cincinnati, OH, USA, 1-5 Oct. 2017. [CrossRef]
- Q. Fu, A. Nasirib, A. Solanki, A. Bani-Ahmedb, L. Weber, V. Bhavaraju, “Microgrids: Architectures, Controls, Protection, and Demonstration,” Electric Power Components and Systems, Vol. 43, n. 12, pp. 1453-1465, July 2015. [CrossRef]
- T. Basso, “IEEE 1547 and 2030 Standards for Distributed Energy Resources Interconnection and Interoperability with the Electricity Grid,” NREL: 15013 Denver West Parkway, Golden CO 80401, 2014. [CrossRef]
- IEEE-SA Standards Board. IEEE Std 2030.2 Guide for the Interoperability of Energy Storage Systems Integrated with the Electric Power Infrastructure; IEEE: 3 Park Avenue, NY 10016-5997, USA, 2015. [CrossRef]
- F. H. Ahdam, M. T. Hagh, Security Constrained Unit Commitment (SCUC) formulation and its solving with Modified Imperialist Competitive Algorithm (MICA), Journal of King Saud University – Engineering Sciences 31 (2019) 253–261. [CrossRef]
- Ukil, B. Deck, V. H. Shah, “Current-only directional overcurrent protection for distribution automation: Challenges and solutions,” IEEE Trans. on Smart Grid, vol. 3, no. 4, pp. 1687-1694, Dec. 2012. [CrossRef]
- R. Sinha, A. Zaidi, “Protection of distribution systems with significant penetration of distributed generation,” in Proc. PGSRET, Islamabad, Pakistan, 2015, pp. 1-6. [CrossRef]
- Feeder Manager Relay Datasheet (FMR), Microelectrica Scientifica. Available online: https://www.microener.com/contenu/uploads/2012/08/UFM-x.pdf, (accessed on 5 January 2021).
- SPM21 Generator Synchronizing Relay, MicroEner, Quartier du Pavé Neuf, 49 rue de l’Université - F-93191 Noisy le Grand. Available online: http://www.microelettrica.com (accessed on 5 January 2021).
- Winlog Template Builder. Available online: https://www.sielcosistemi.com/download/Template%20Builder%20-%20English%20Manual.pdf (accessed on 10 February 2022).
- Winlog Distribution License. Available online: https://www.sielcosistemi.com/en/products/winlog_scada_hmi/winlog-licenses.html (accessed on 11 December 2021).
- Nikolaos, P.C.; Marios, F.; Dimitris, K. A Review of Pumped Hydro Storage Systems. Energies 2023, 16, 4516. [Google Scholar] [CrossRef]
- Abdelfattah, A.I.; Shaaban, M.F.; Osman, A.H.; Ali, A. Optimal Management of Seasonal Pumped Hydro Storage System for Peak Shaving. Sustainability 2023, 15, 11973. [Google Scholar] [CrossRef]
- Tao, R.; Song, X.; Ye, C. Pumped Storage Technology, Reversible Pump Turbines and Their Importance in Power Grids. Water 2022, 14, 3569. [Google Scholar] [CrossRef]
Figure 1.
The electrical bus-bar connectivity where balancing IG - extracted current from grid (red) and ILG - available current injected into the grid (green) are plotted.
Figure 1.
The electrical bus-bar connectivity where balancing IG - extracted current from grid (red) and ILG - available current injected into the grid (green) are plotted.
Figure 2.
Typical load profile when a 50 [kW] local generator is supplying the demand in upper figure. Available cogenerated power injected into main grid network is plotted with negative values in bottom figure.
Figure 2.
Typical load profile when a 50 [kW] local generator is supplying the demand in upper figure. Available cogenerated power injected into main grid network is plotted with negative values in bottom figure.
Figure 3.
Simplified structure of pumped hydro storage with local power generator (LG) combining wind and/or solar power to main electric grid (G).
Figure 3.
Simplified structure of pumped hydro storage with local power generator (LG) combining wind and/or solar power to main electric grid (G).
Figure 4.
The top-down architecture of the proposed experimental laboratory equipment.
Figure 4.
The top-down architecture of the proposed experimental laboratory equipment.
Figure 5.
A top-down algorithm based on three-layer architecture (Information, Communication and Process level) for interface management of multiple power generators.
Figure 5.
A top-down algorithm based on three-layer architecture (Information, Communication and Process level) for interface management of multiple power generators.
Figure 6.
The typical IEEE representation of a three bus (a, b and c) electric power network configuration for interfacing a local power generator LG to main power grid G and the load L.
Figure 6.
The typical IEEE representation of a three bus (a, b and c) electric power network configuration for interfacing a local power generator LG to main power grid G and the load L.
Figure 7.
The power network and associate vectorial representation of the three power phases.
Figure 7.
The power network and associate vectorial representation of the three power phases.
Figure 9.
The relay 67 used for measuring the voltage (Vh) and current (Ix) parameters of line (52) while the protection angle (a), trip overcurrent (Is) and rated current (In) are the user input parameters.
Figure 9.
The relay 67 used for measuring the voltage (Vh) and current (Ix) parameters of line (52) while the protection angle (a), trip overcurrent (Is) and rated current (In) are the user input parameters.
Figure 10.
The relay (67) integration in complex connecting/re-connecting and protection algorithm.
Figure 10.
The relay (67) integration in complex connecting/re-connecting and protection algorithm.
Figure 11.
Simulating the local generator (LG) in (i) by using a synchronous machine (G/M) driven by a brushless prime mover (PM/B).
Figure 11.
Simulating the local generator (LG) in (i) by using a synchronous machine (G/M) driven by a brushless prime mover (PM/B).
Figure 12.
The laboratory model diagram of replicated grid power supply (G- grid connection; T- insulation transformer with +5% to 15% voltage adjustments; L- overhead long transmission line with electrical parameters: 3 x 13 Ω + 11 Ω; 3 x 290 mH+ 250 mH, 6 x 0.5 μF+ 6 x 1 μF.
Figure 12.
The laboratory model diagram of replicated grid power supply (G- grid connection; T- insulation transformer with +5% to 15% voltage adjustments; L- overhead long transmission line with electrical parameters: 3 x 13 Ω + 11 Ω; 3 x 290 mH+ 250 mH, 6 x 0.5 μF+ 6 x 1 μF.
Figure 13.
The laboratory model diagram of local generator (LG) where: PM is prime mover consisting in a 1kW brushless controlled by its driver, Gen- synchronous generator, T- insulation transformer, SL- overhead short transmission line with electrical parameters: 3 x 3 Ω + 3 Ω; 3 x 80 mH+ 69 mH, 6 x 100nF+ 6 x 200 nF).
Figure 14.
The laboratory model of three-phase load (Z) with (left to right modules) variable resistance (3 x 400W), inductance (3 x 300Var), and capacity (3 x 300 VAr).
Figure 14.
The laboratory model of three-phase load (Z) with (left to right modules) variable resistance (3 x 400W), inductance (3 x 300Var), and capacity (3 x 300 VAr).
Figure 15.
The feeder relay (67), with main directional supervision function of the parameters phase and control of local generator (LG) working mode.
Figure 15.
The feeder relay (67), with main directional supervision function of the parameters phase and control of local generator (LG) working mode.
Figure 16.
The block diagram of the supervisory control and data acquisition system of laboratory model.
Figure 16.
The block diagram of the supervisory control and data acquisition system of laboratory model.
Figure 17.
The UML diagram of experimental software architecture- particularized from [
17].
Figure 17.
The UML diagram of experimental software architecture- particularized from [
17].
Figure 18.
The main SCADA designed interface for supervisory control and data acquisition of the proposed pumped-storage hydropower system.
Figure 18.
The main SCADA designed interface for supervisory control and data acquisition of the proposed pumped-storage hydropower system.
Figure 19.
The standalone display of the measuring device, opened from SCADA interface with the measured generator parameters values (voltages, currents, powers).
Figure 19.
The standalone display of the measuring device, opened from SCADA interface with the measured generator parameters values (voltages, currents, powers).
Figure 20.
Measuring device window that shows electrical parameters at the load side, with some additional information (name of the device, and its Modbus address).
Figure 20.
Measuring device window that shows electrical parameters at the load side, with some additional information (name of the device, and its Modbus address).
Figure 21.
The window of the synchronization relay interface displaying two sets of the parameters- where frequencies are equal but not yet the voltages.
Figure 21.
The window of the synchronization relay interface displaying two sets of the parameters- where frequencies are equal but not yet the voltages.
Figure 22.
The window of the synchronization relay interface displaying two sets of the parameters- where frequencies are equal but not yet the voltages.
Figure 22.
The window of the synchronization relay interface displaying two sets of the parameters- where frequencies are equal but not yet the voltages.
Figure 23.
The SCADA diagram snapshot (succeeded synchronization) when the power is extracted from the grid to be used for load (Z) and for the pump (AC Motor).
Figure 23.
The SCADA diagram snapshot (succeeded synchronization) when the power is extracted from the grid to be used for load (Z) and for the pump (AC Motor).
Figure 25.
The SCADA diagram snapshot when the synchronous machine is forced to run as generator.
Figure 25.
The SCADA diagram snapshot when the synchronous machine is forced to run as generator.
Figure 26.
The oscillography of tripping evolution where tt is reference time with additional 500 msec range in left and right direction (overlaid, added relevant information to the capture screen of the relay record).
Figure 26.
The oscillography of tripping evolution where tt is reference time with additional 500 msec range in left and right direction (overlaid, added relevant information to the capture screen of the relay record).
Figure 27.
Oscillography records when connecting the line where tt is reference time with additional 500 msec range in left and right direction (overlaid, added relevant information to the capture screen of the relay record).
Figure 27.
Oscillography records when connecting the line where tt is reference time with additional 500 msec range in left and right direction (overlaid, added relevant information to the capture screen of the relay record).
|
Disclaimer/Publisher’s Note: The statements, opinions and data contained in all publications are solely those of the individual author(s) and contributor(s) and not of MDPI and/or the editor(s). MDPI and/or the editor(s) disclaim responsibility for any injury to people or property resulting from any ideas, methods, instructions or products referred to in the content. |
© 2024 by the authors. Licensee MDPI, Basel, Switzerland. This article is an open access article distributed under the terms and conditions of the Creative Commons Attribution (CC BY) license (http://creativecommons.org/licenses/by/4.0/).
