Submitted:
29 February 2024
Posted:
29 February 2024
You are already at the latest version
Abstract
Keywords:
1. Introduction
2. Model Method
2.1. Super-Efficiency SBM-DEA Model
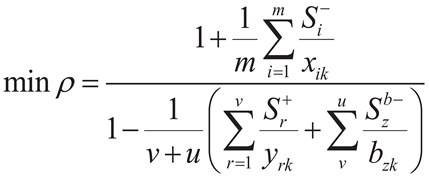 |
(1) |
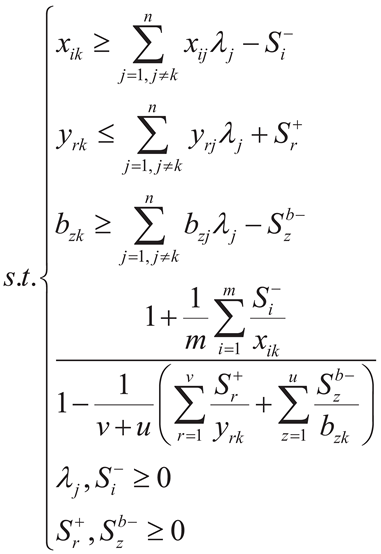 |
(2) |
 ,
it signifies that the DMU is in an efficient state. Furthermore, the higher the efficiency value, the more effective the innovation factor allocation efficiency is considered to be. When
  , DMU is invalid.
  ,
,  , and
, and  represent the quantities of inputs, desired outputs, and non-desired outputs, respectively, in the context of innovation factor allocation. The slack redundancy variables for inputs, desired outputs, and undesired outputs in the innovation factor allocation are represented by
  ,
,  , and
, and  , respectively.
  is the weight variable.
2.2. Malmquist Index Model
 |
(3) |
 |
(4) |
 and
and  are inputs and outputs for periods T and T+1.
  and
and  represent distance functions for time T and time T+1. The formula of the comprehensive productivity index under the definition of geometric average is:
 |
(5) |
 is greater than 1, it means that total factor productivity is on an upward trend, otherwise it is on a downward trend. According to Fare et al, under the definition of variable returns to scale (VRS), the total factor productivity (TFP) index can be decomposed into comprehensive technical efficiency (EFFCH) and technological progress (TECH). Therefore, the relationship between the indices is as follows:
 |
(6) |
 |
(7) |
 |
(8) |
 |
(9) |
 |
(10) |
 |
(11) |
2.3. Spatial Autocorrelation Analysis Method
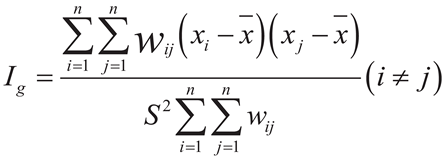 |
(12) |
 |
(13) |
 indicates the number of provinces studied.
  and
and  represent different spatial units.
  and
and  denote the innovation factor allocation efficiency in provinces
  and
and  .
.  and
and  represent the mean and variance of innovation factor allocative efficiency, respectively.
  is the spatial weight matrix. Global spatial autocorrelation can analyze the degree of variation and agglomeration of innovation factor allocation efficiency across the entire space. The Local Moran Index is designed to analyze the degree of spatial agglomeration among provinces along the Belt and Road. The value of
  ranges from [-1,1]. If
  , the innovation factor allocation efficiency exhibits a positive correlation in the spatial distribution, and the closer the value is to 1, the stronger the degree of spatial aggregation. If
  , then the provinces are spatially negatively correlated. If
  , it indicates that the innovation factor allocation efficiency across provinces is spatially uncorrelated and randomly distributed.
2.4. Sample Selection and Variable Data Sources
2.5. Input-Output Variable Selection
2.5.1. Input Index
2.5.2. Output Index
2.5.3. Non-Expected Output Index
3. Empirical Results
3.1. Results of the Super-Efficiency SBM-DEA Model
3.1.1. Decomposition Results of Innovation Factor Allocation Efficiency
3.2. Malmquist Index Model Results
3.3. Spatial Autocorrelation Analysis
3.3.1. Global Spatial Autocorrelation Analysis
3.3.2. Local Spatial Autocorrelation Analysis
4. Conclusion and Policy Recommendation
4.1. Conclusion
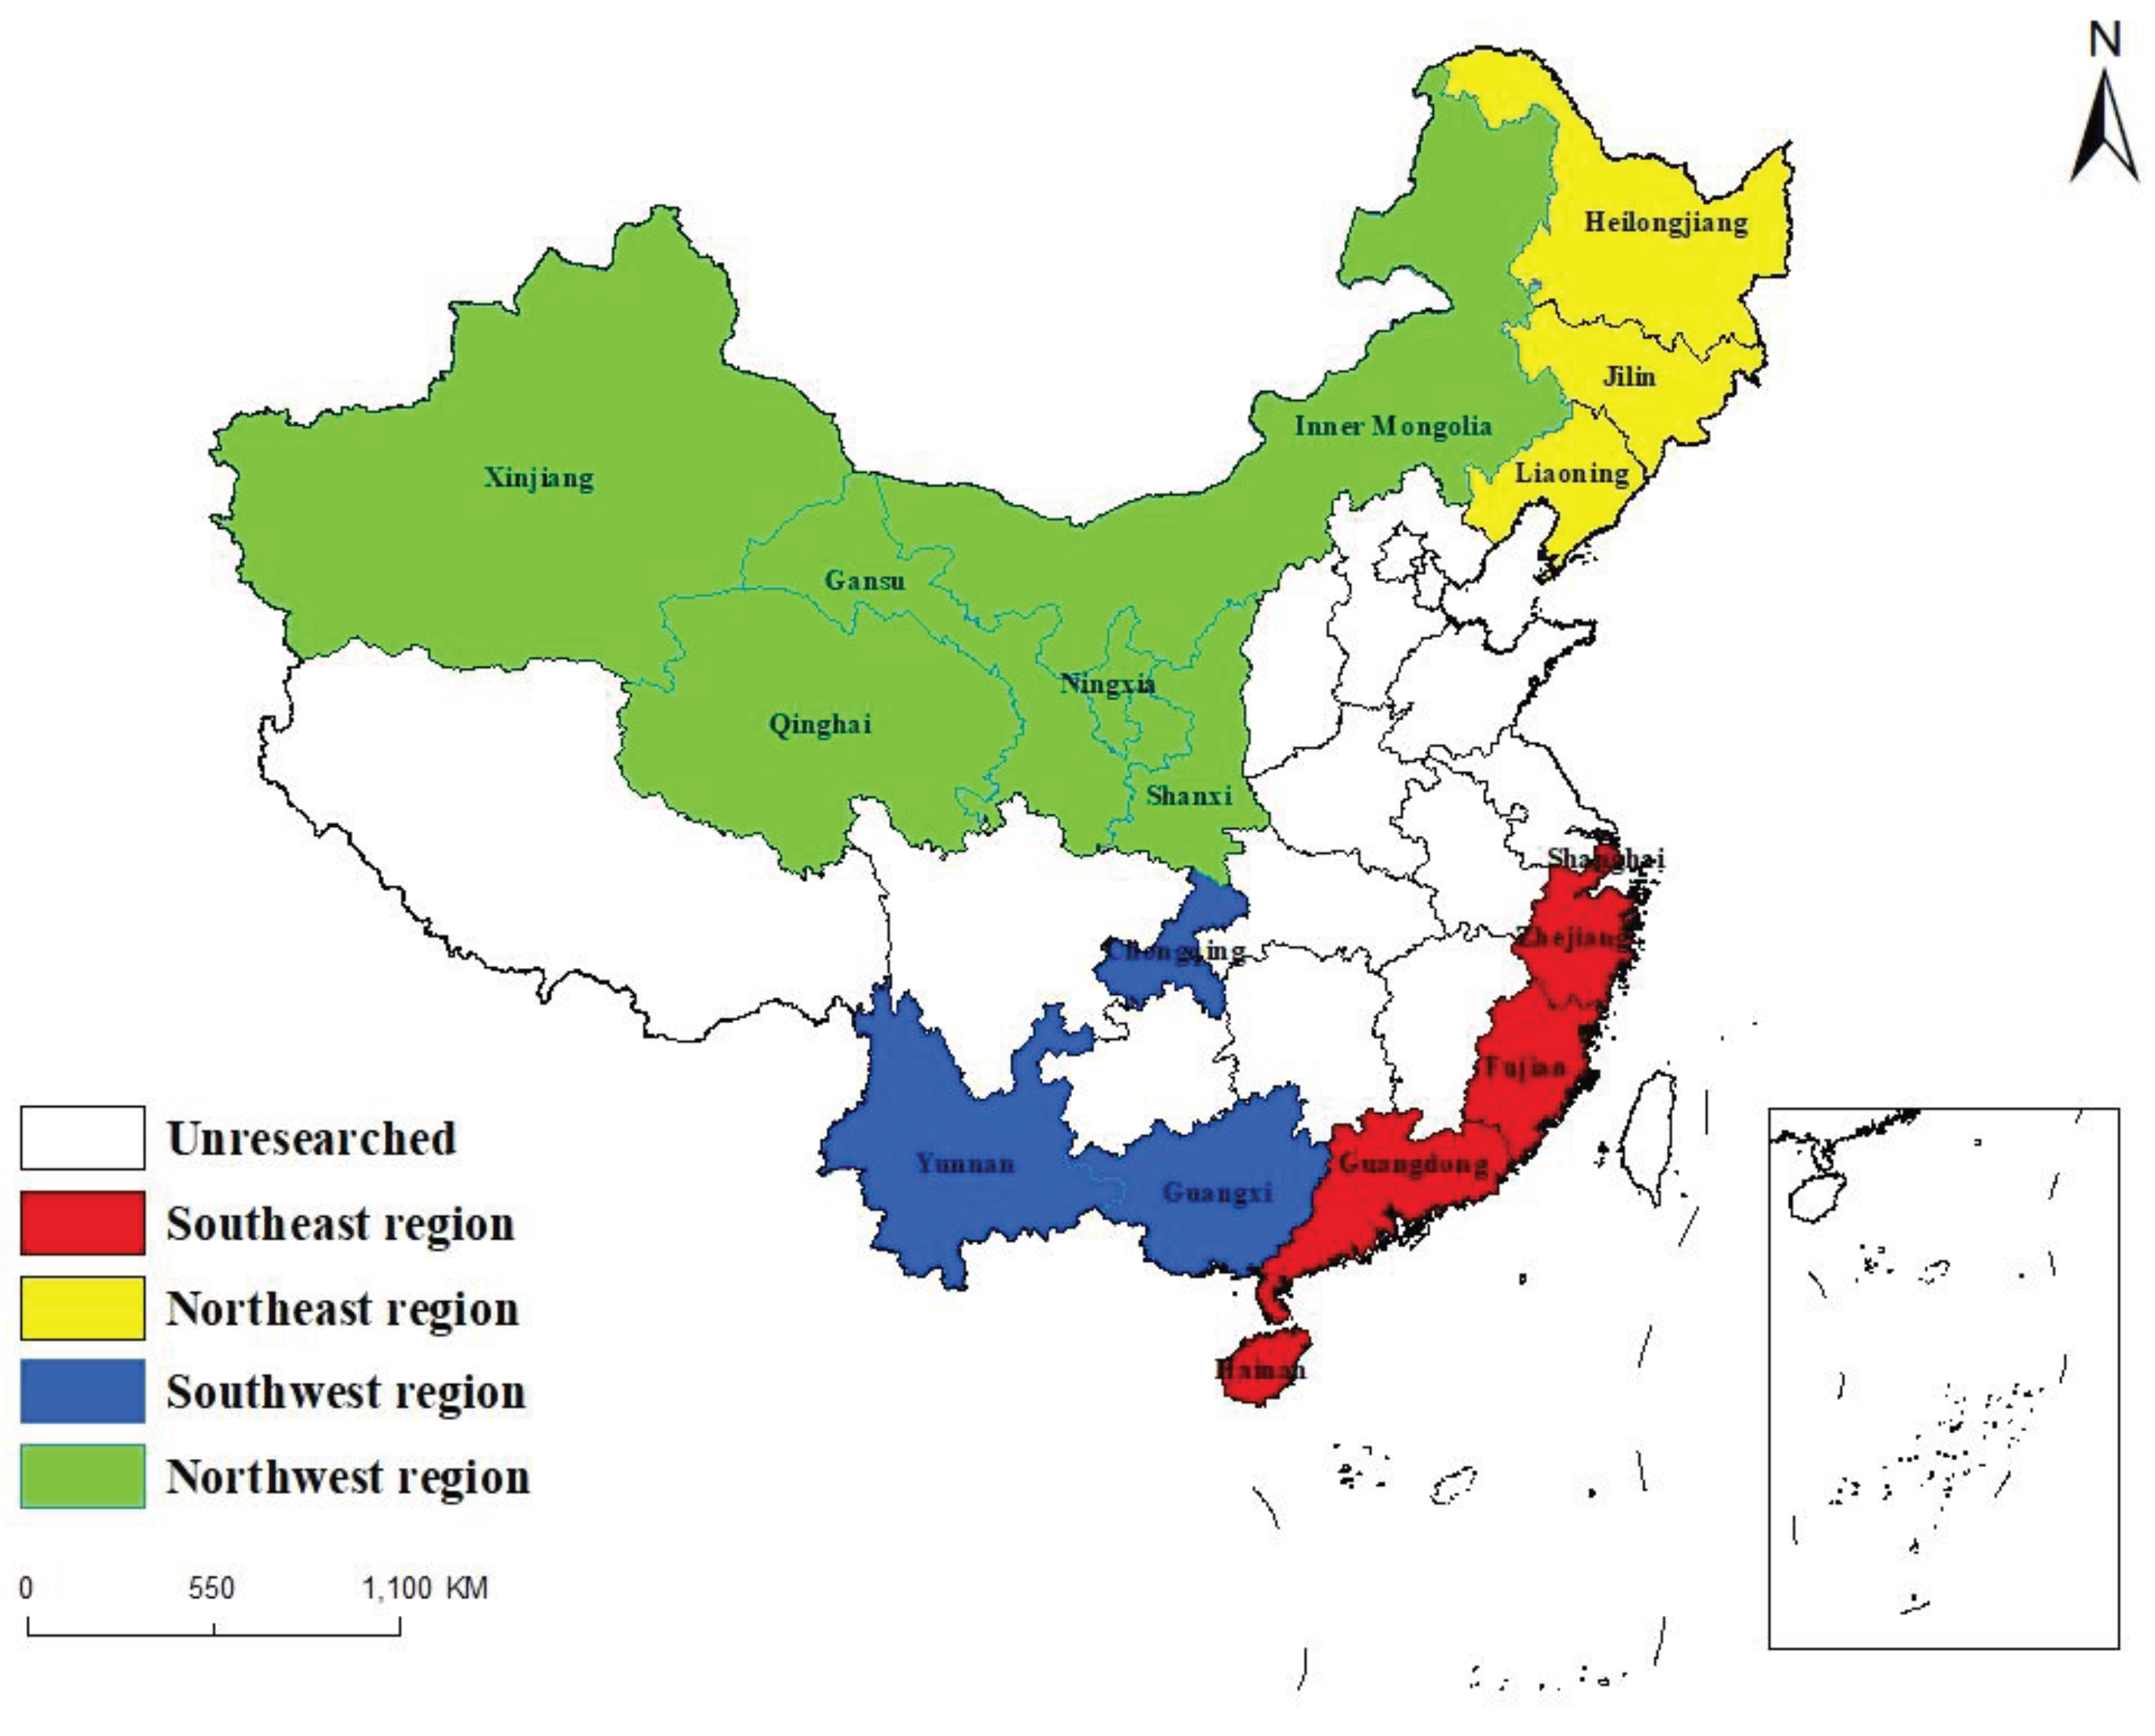
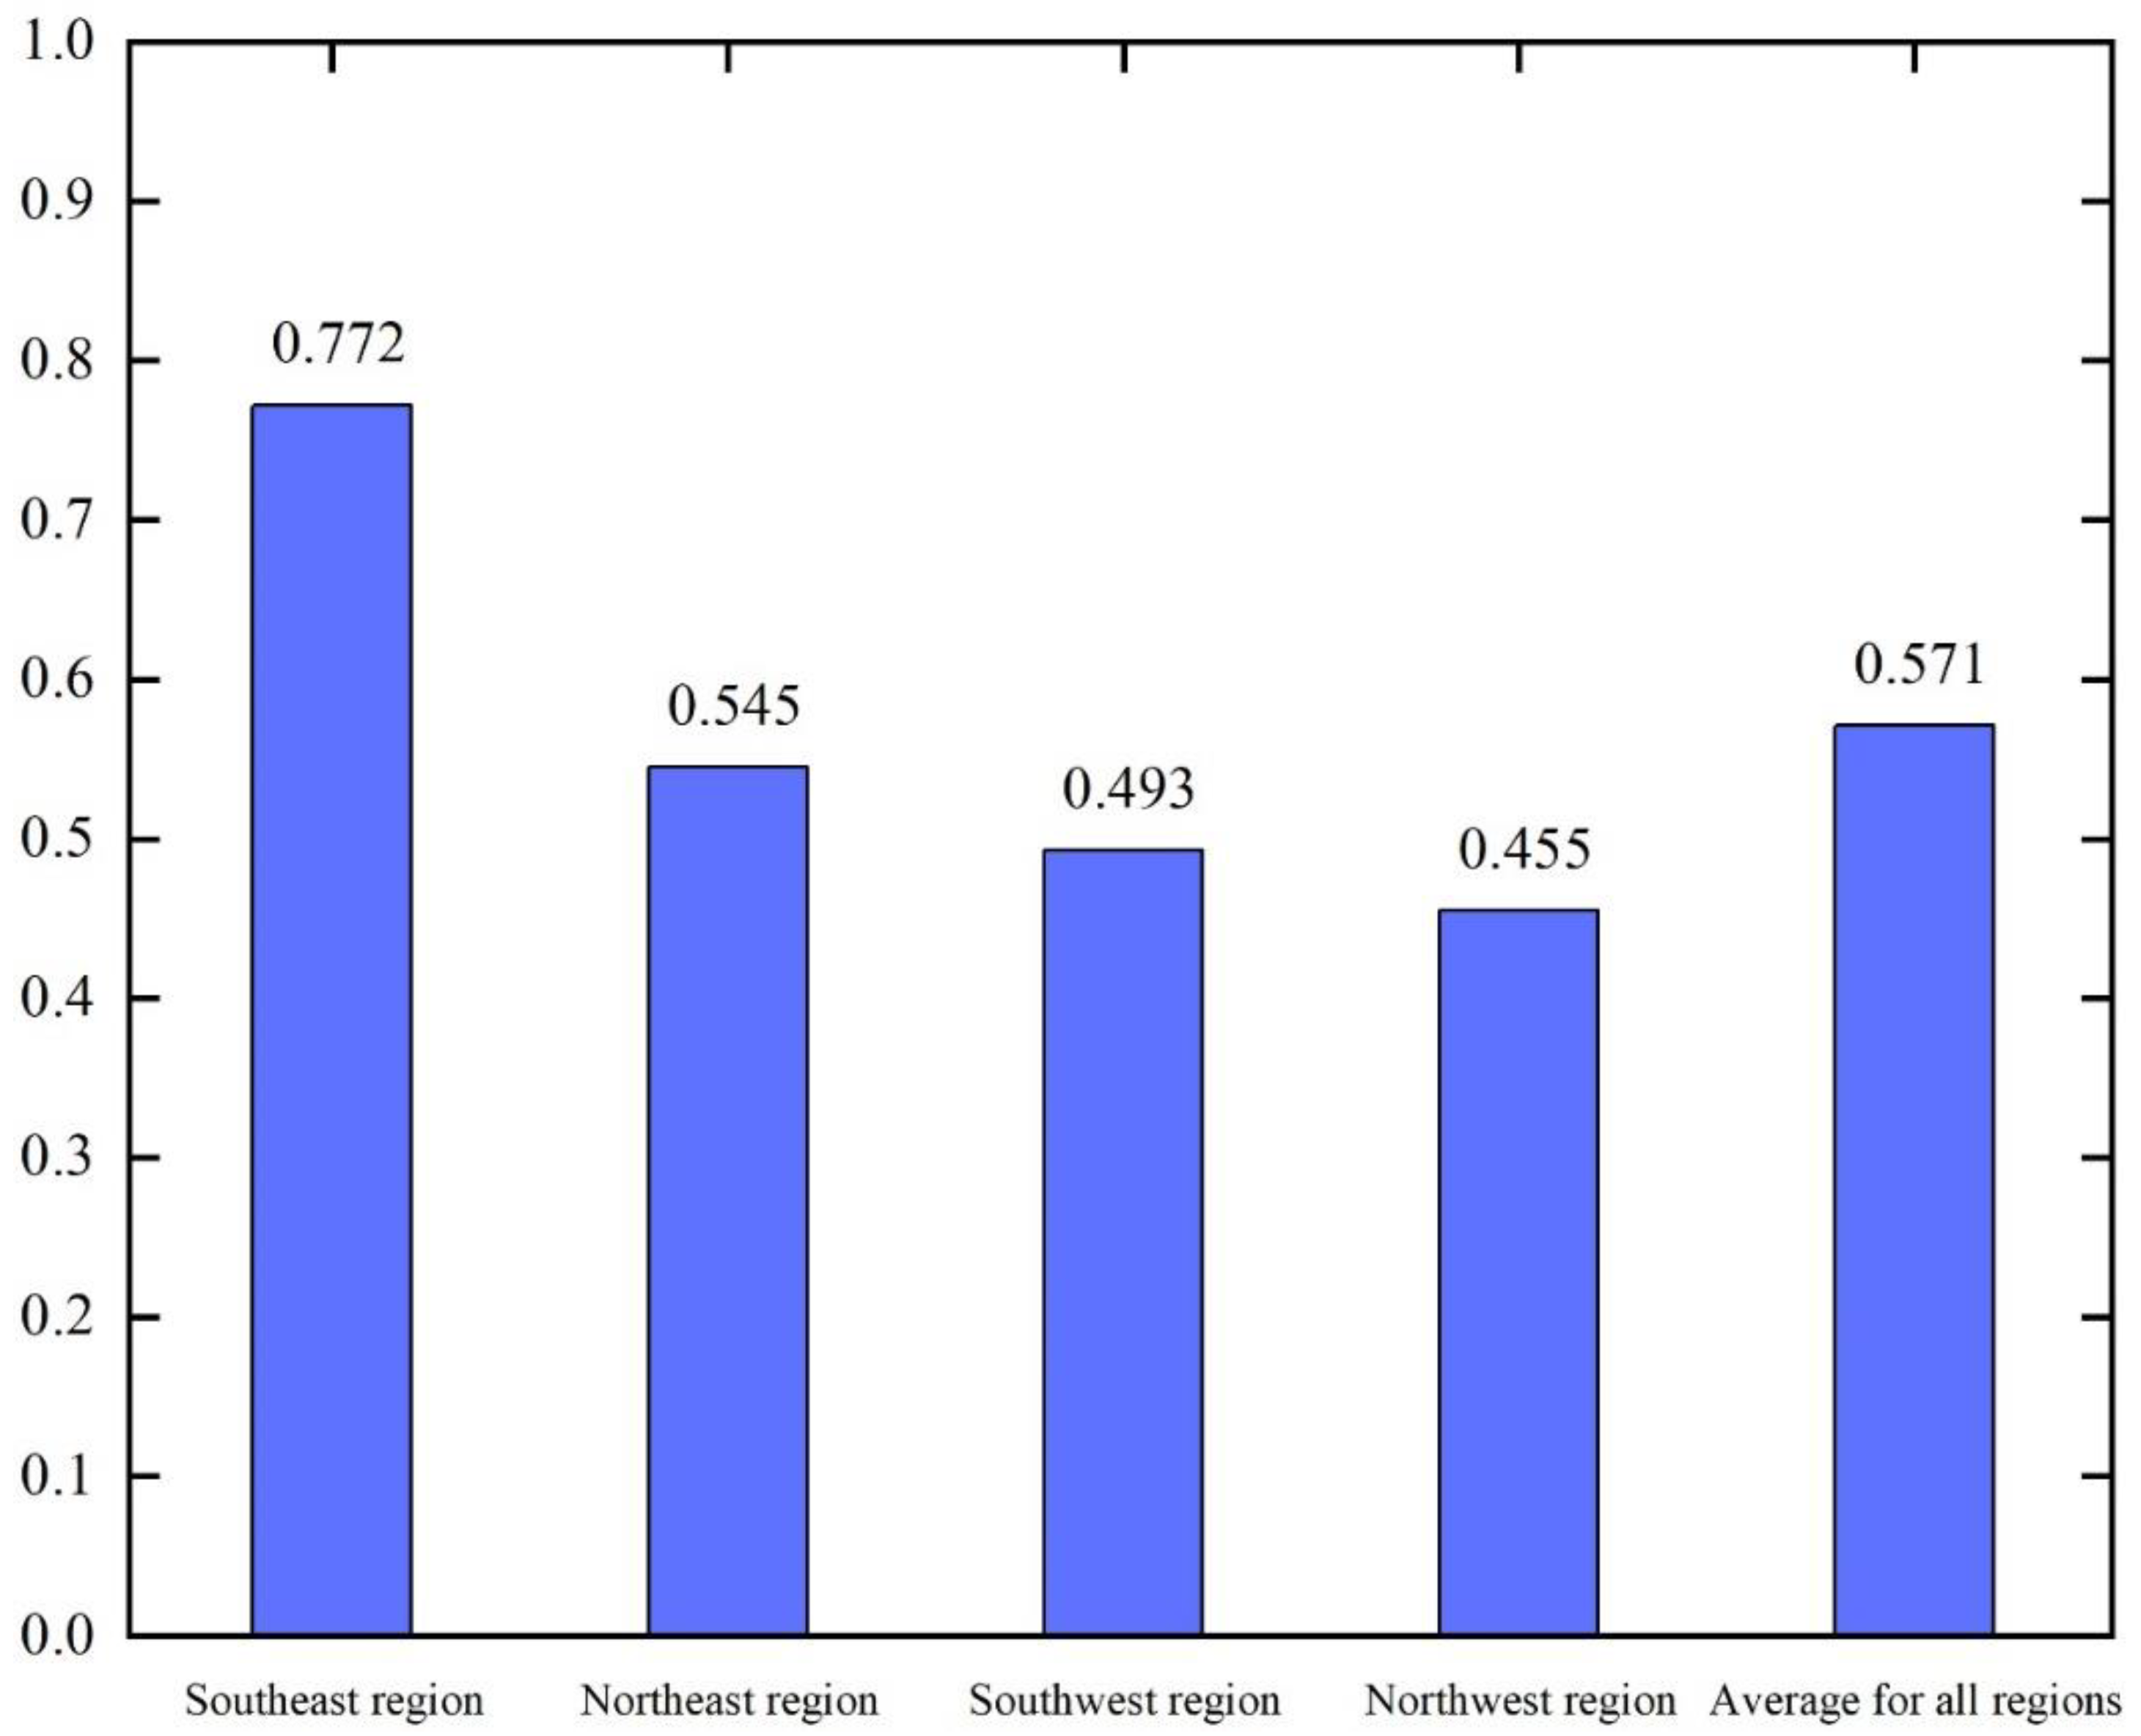
- The average innovation factor allocation efficiency of regions along China's Belt and Road from 2012 to 2021 is 0.571. Specifically, the average innovation factor allocation efficiencies for the Southeast, Northeast, Southwest, and Northwest regions are 0.772, 0.545, 0.493, and 0.455, respectively. The performance is Southeast Northeast Southwest Northwest. Overall, the performance of innovation factor allocation efficiency is not high, exhibiting significant regional disparities and a trend of decline from the eastern coastal region to the western part of the country.
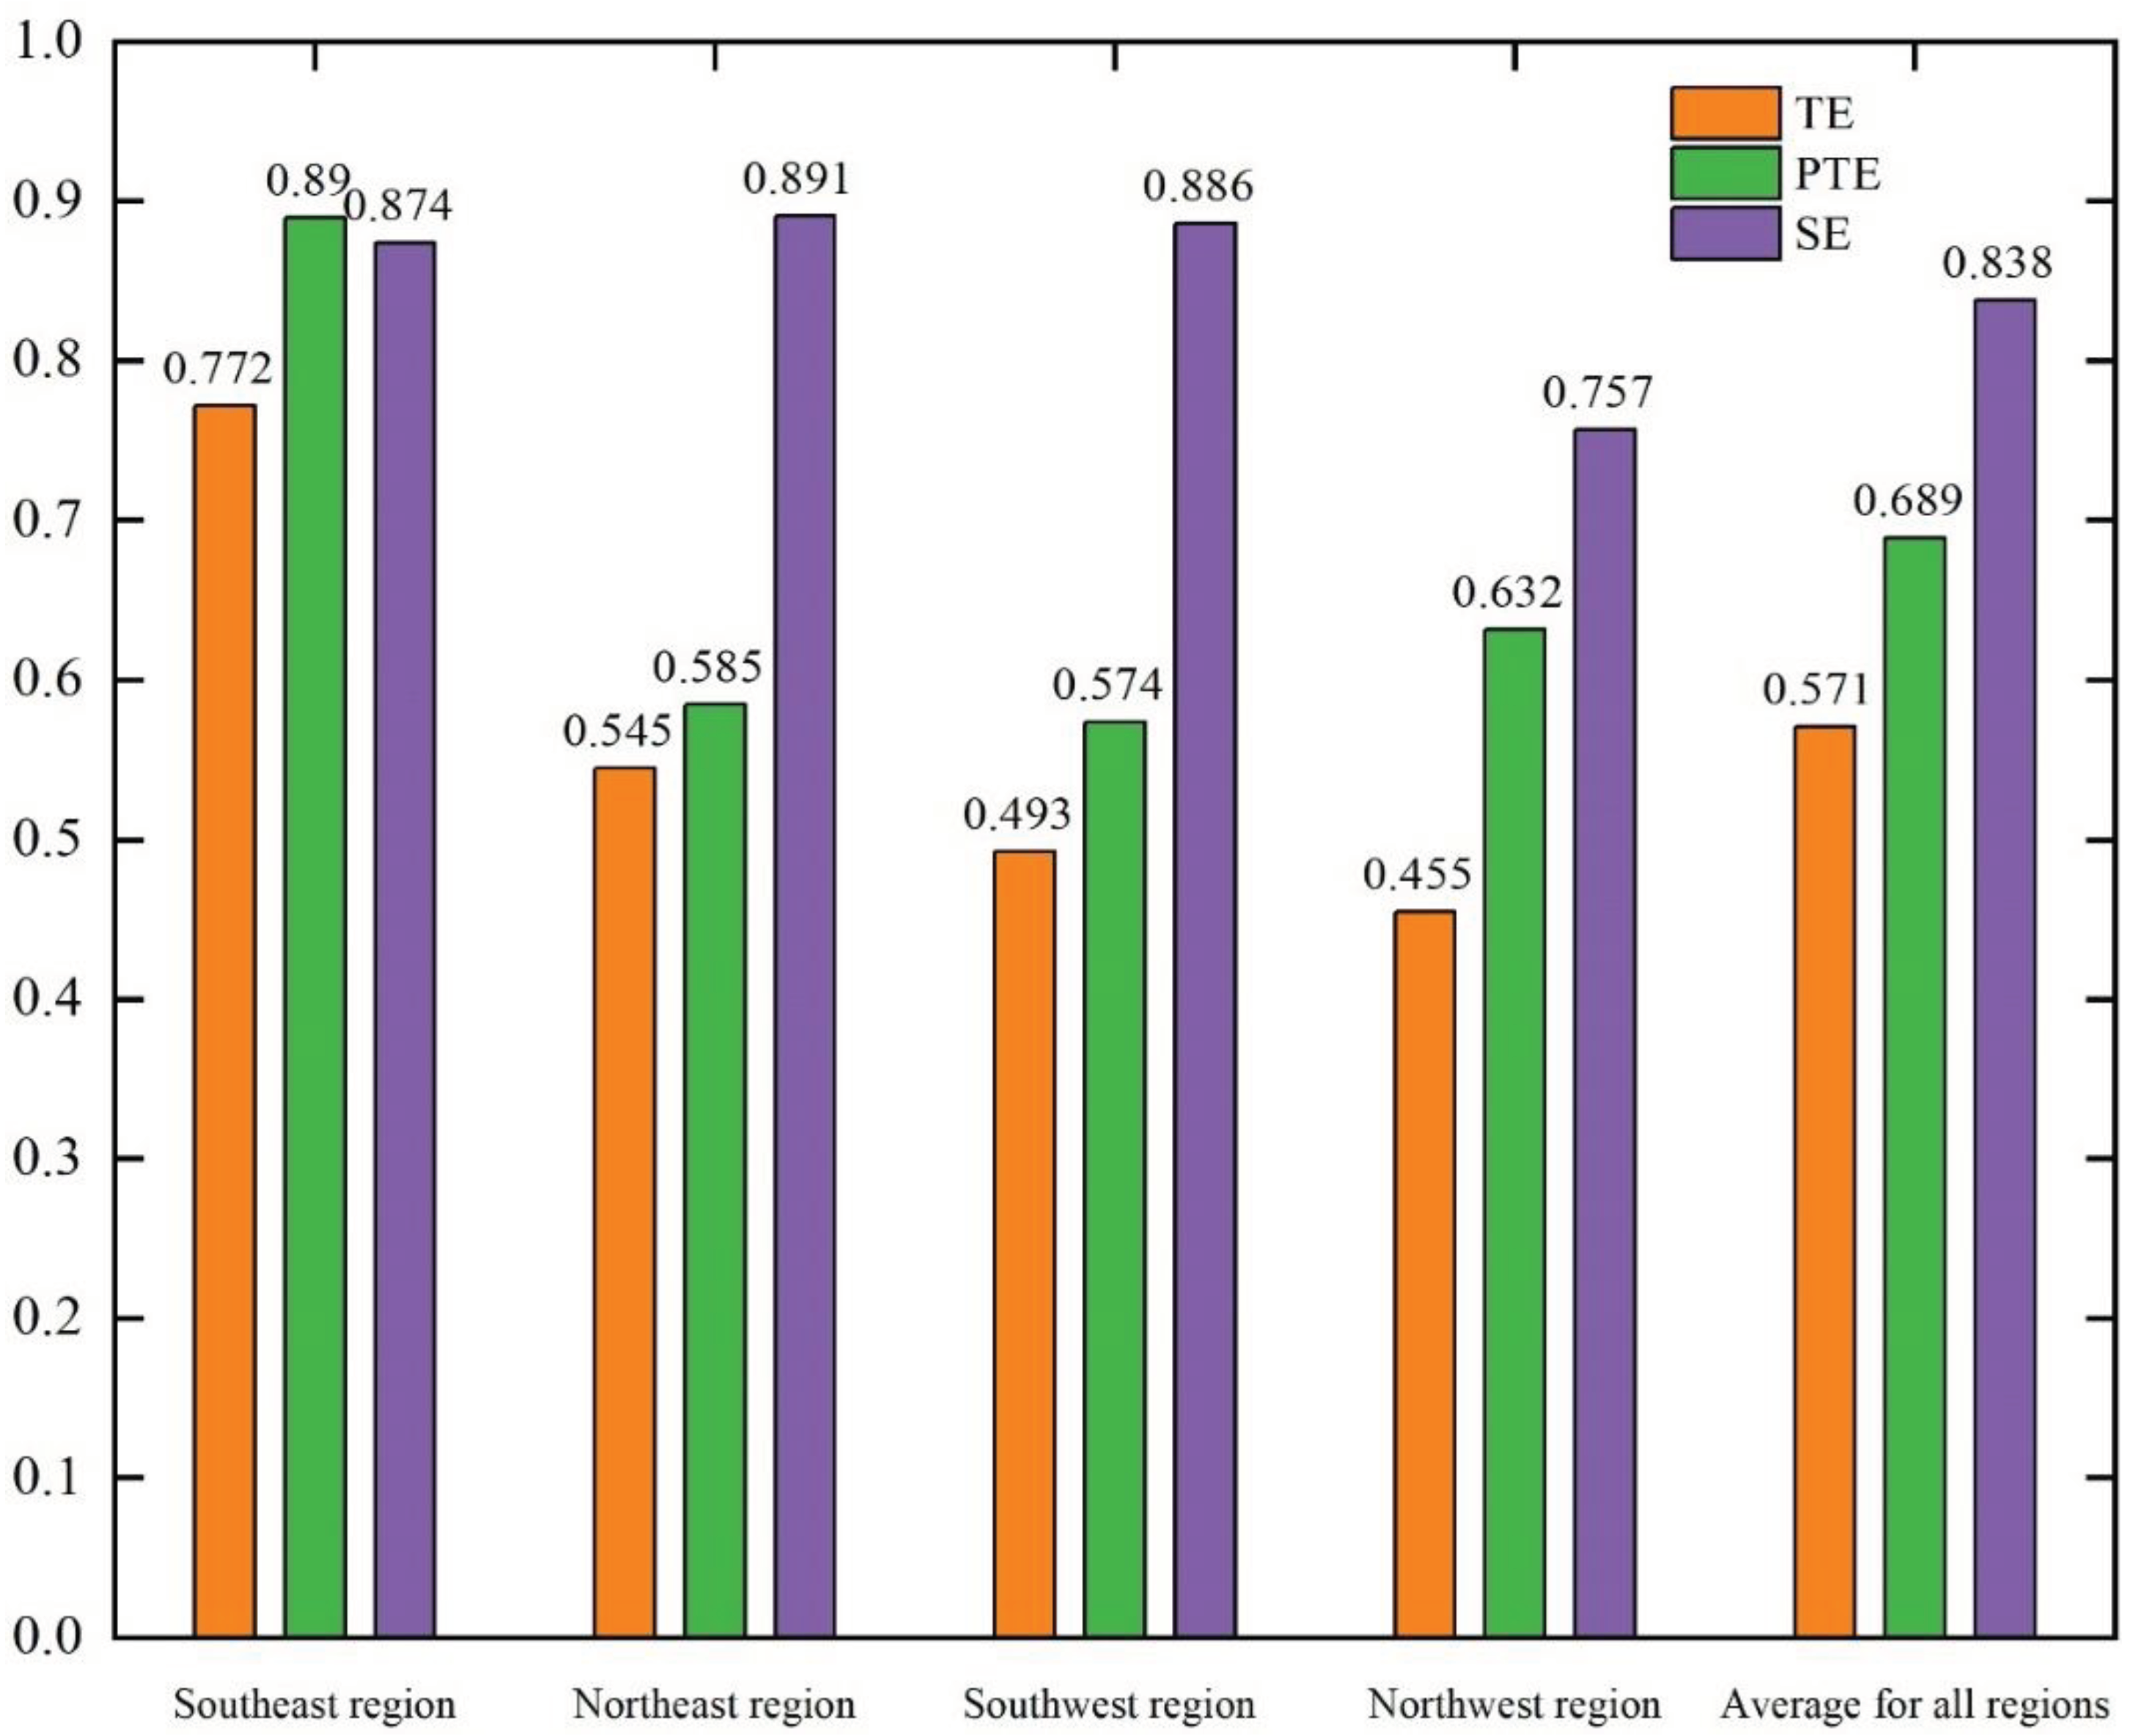
- Examining the PTE and SE components of the decomposition of innovation factor allocation efficiency in the regions along China's Belt and Road, their average values for the period 2012-2021 are 0.689 and 0.838, respectively. The results of the decomposition along the line area show SE>PTE>TE. The SE exhibits the highest level of development and is closer to the DEA efficiency frontier, indicating a relatively efficient state. Conversely, the PTE shows the lowest level. Consequently, it can be inferred that the PTE is the primary cause of inefficiencies impacting the innovation factor allocation efficiency
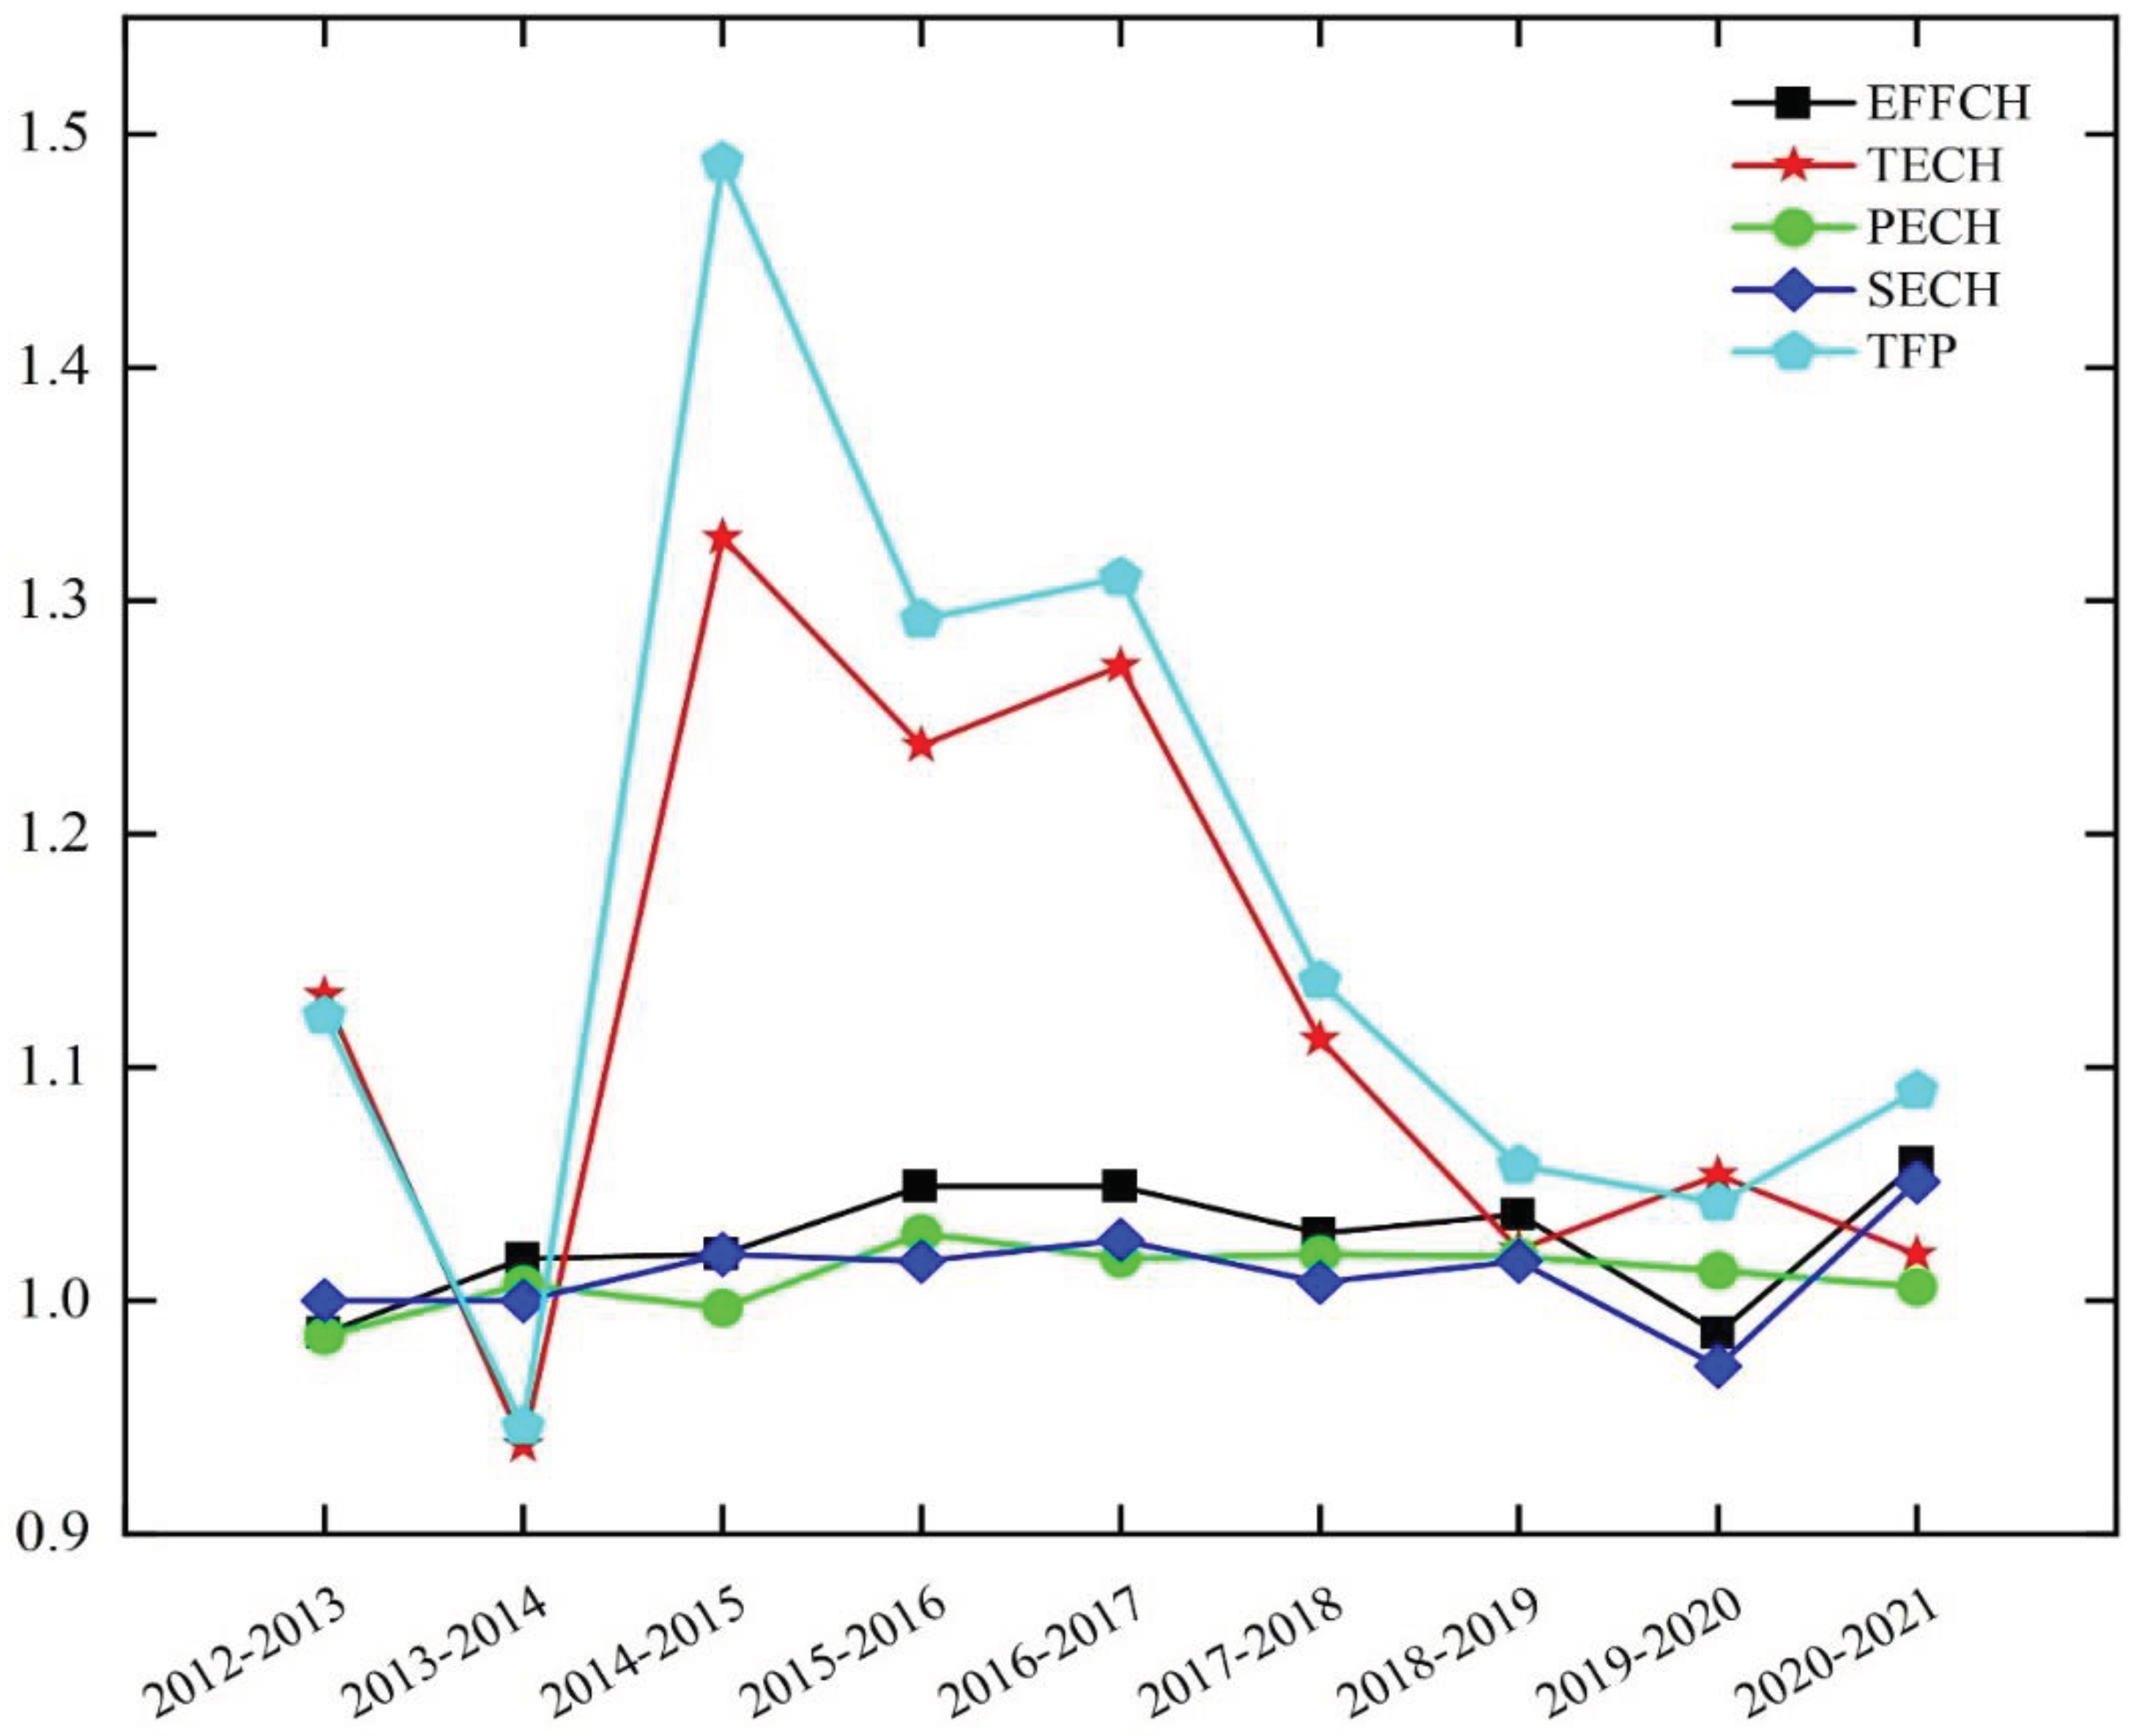
- A dynamic analysis of the innovation factor allocation efficiency in 17 provinces along the Belt and Road in China revealed that their average TFP value over the period 2012-2021 was 1.165, representing an average annual growth rate of 16.5% in innovation factors. This suggests an increasing utilization rate of innovation factor inputs and outputs across all regions. The trend graphs of Malmquist and decomposition indices indicate that PECH and SECH play crucial roles in enhancing EFFCH, while TECH has the most significant impact on TFP.
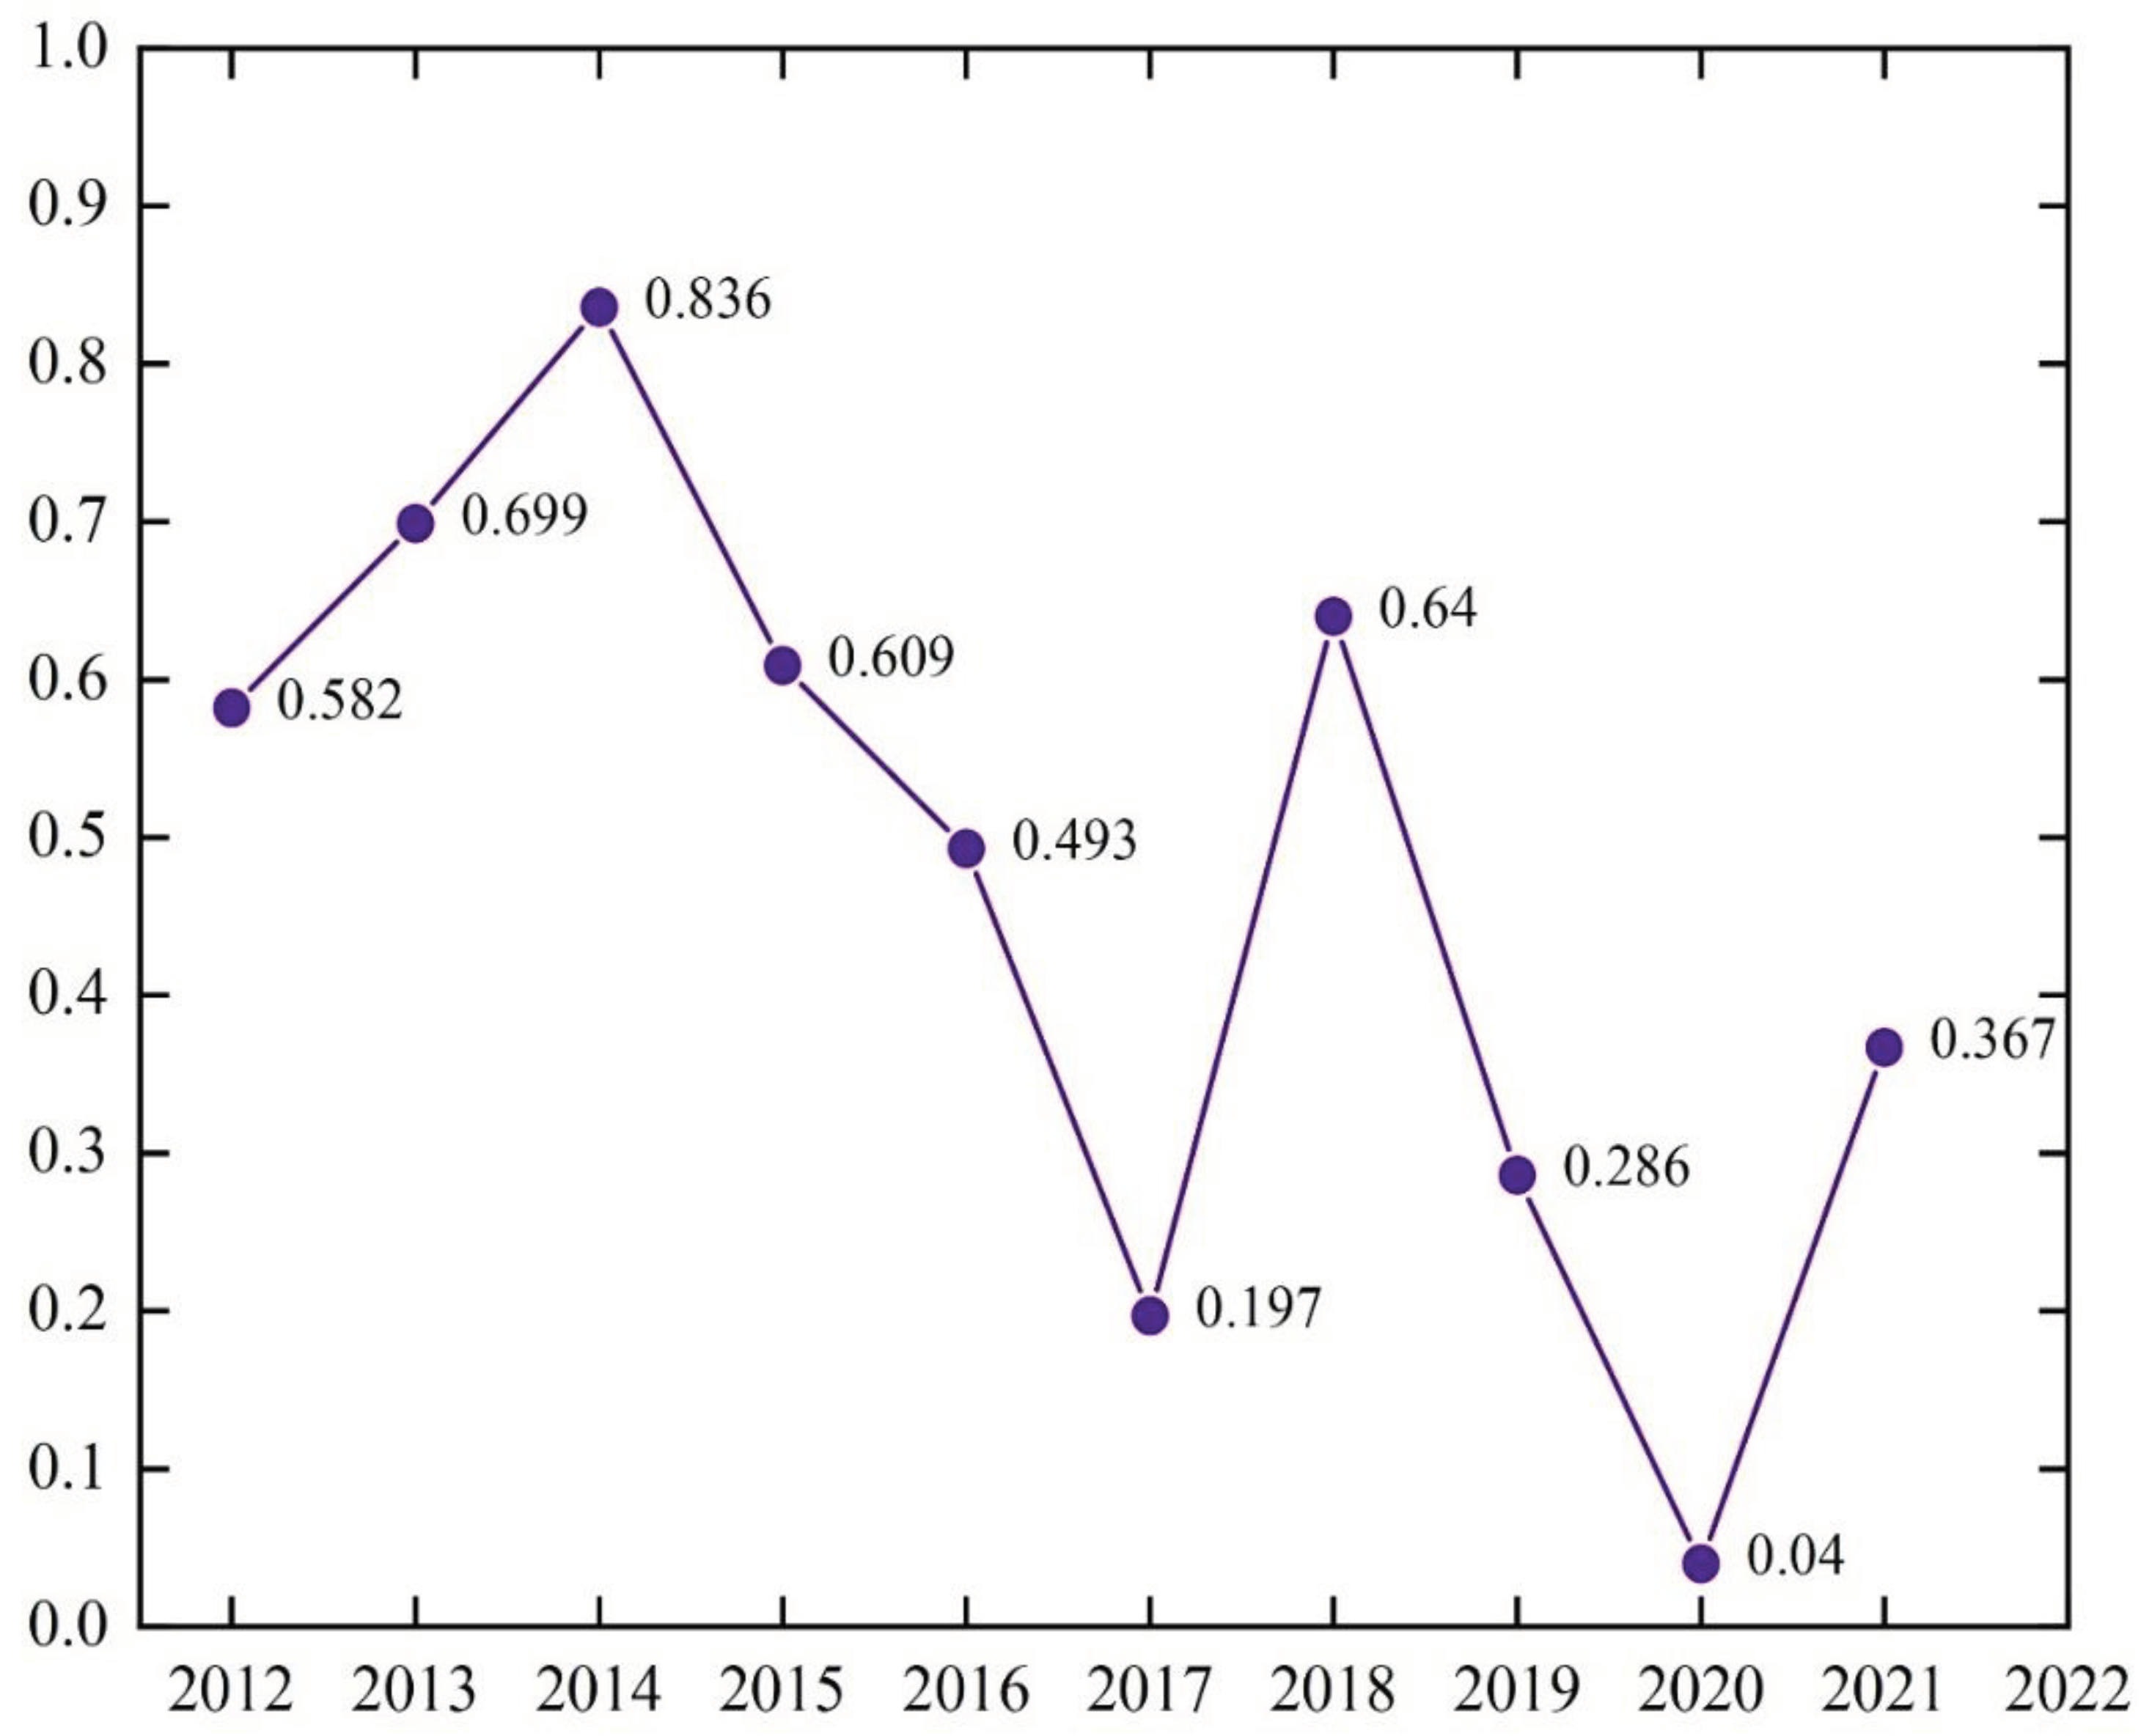
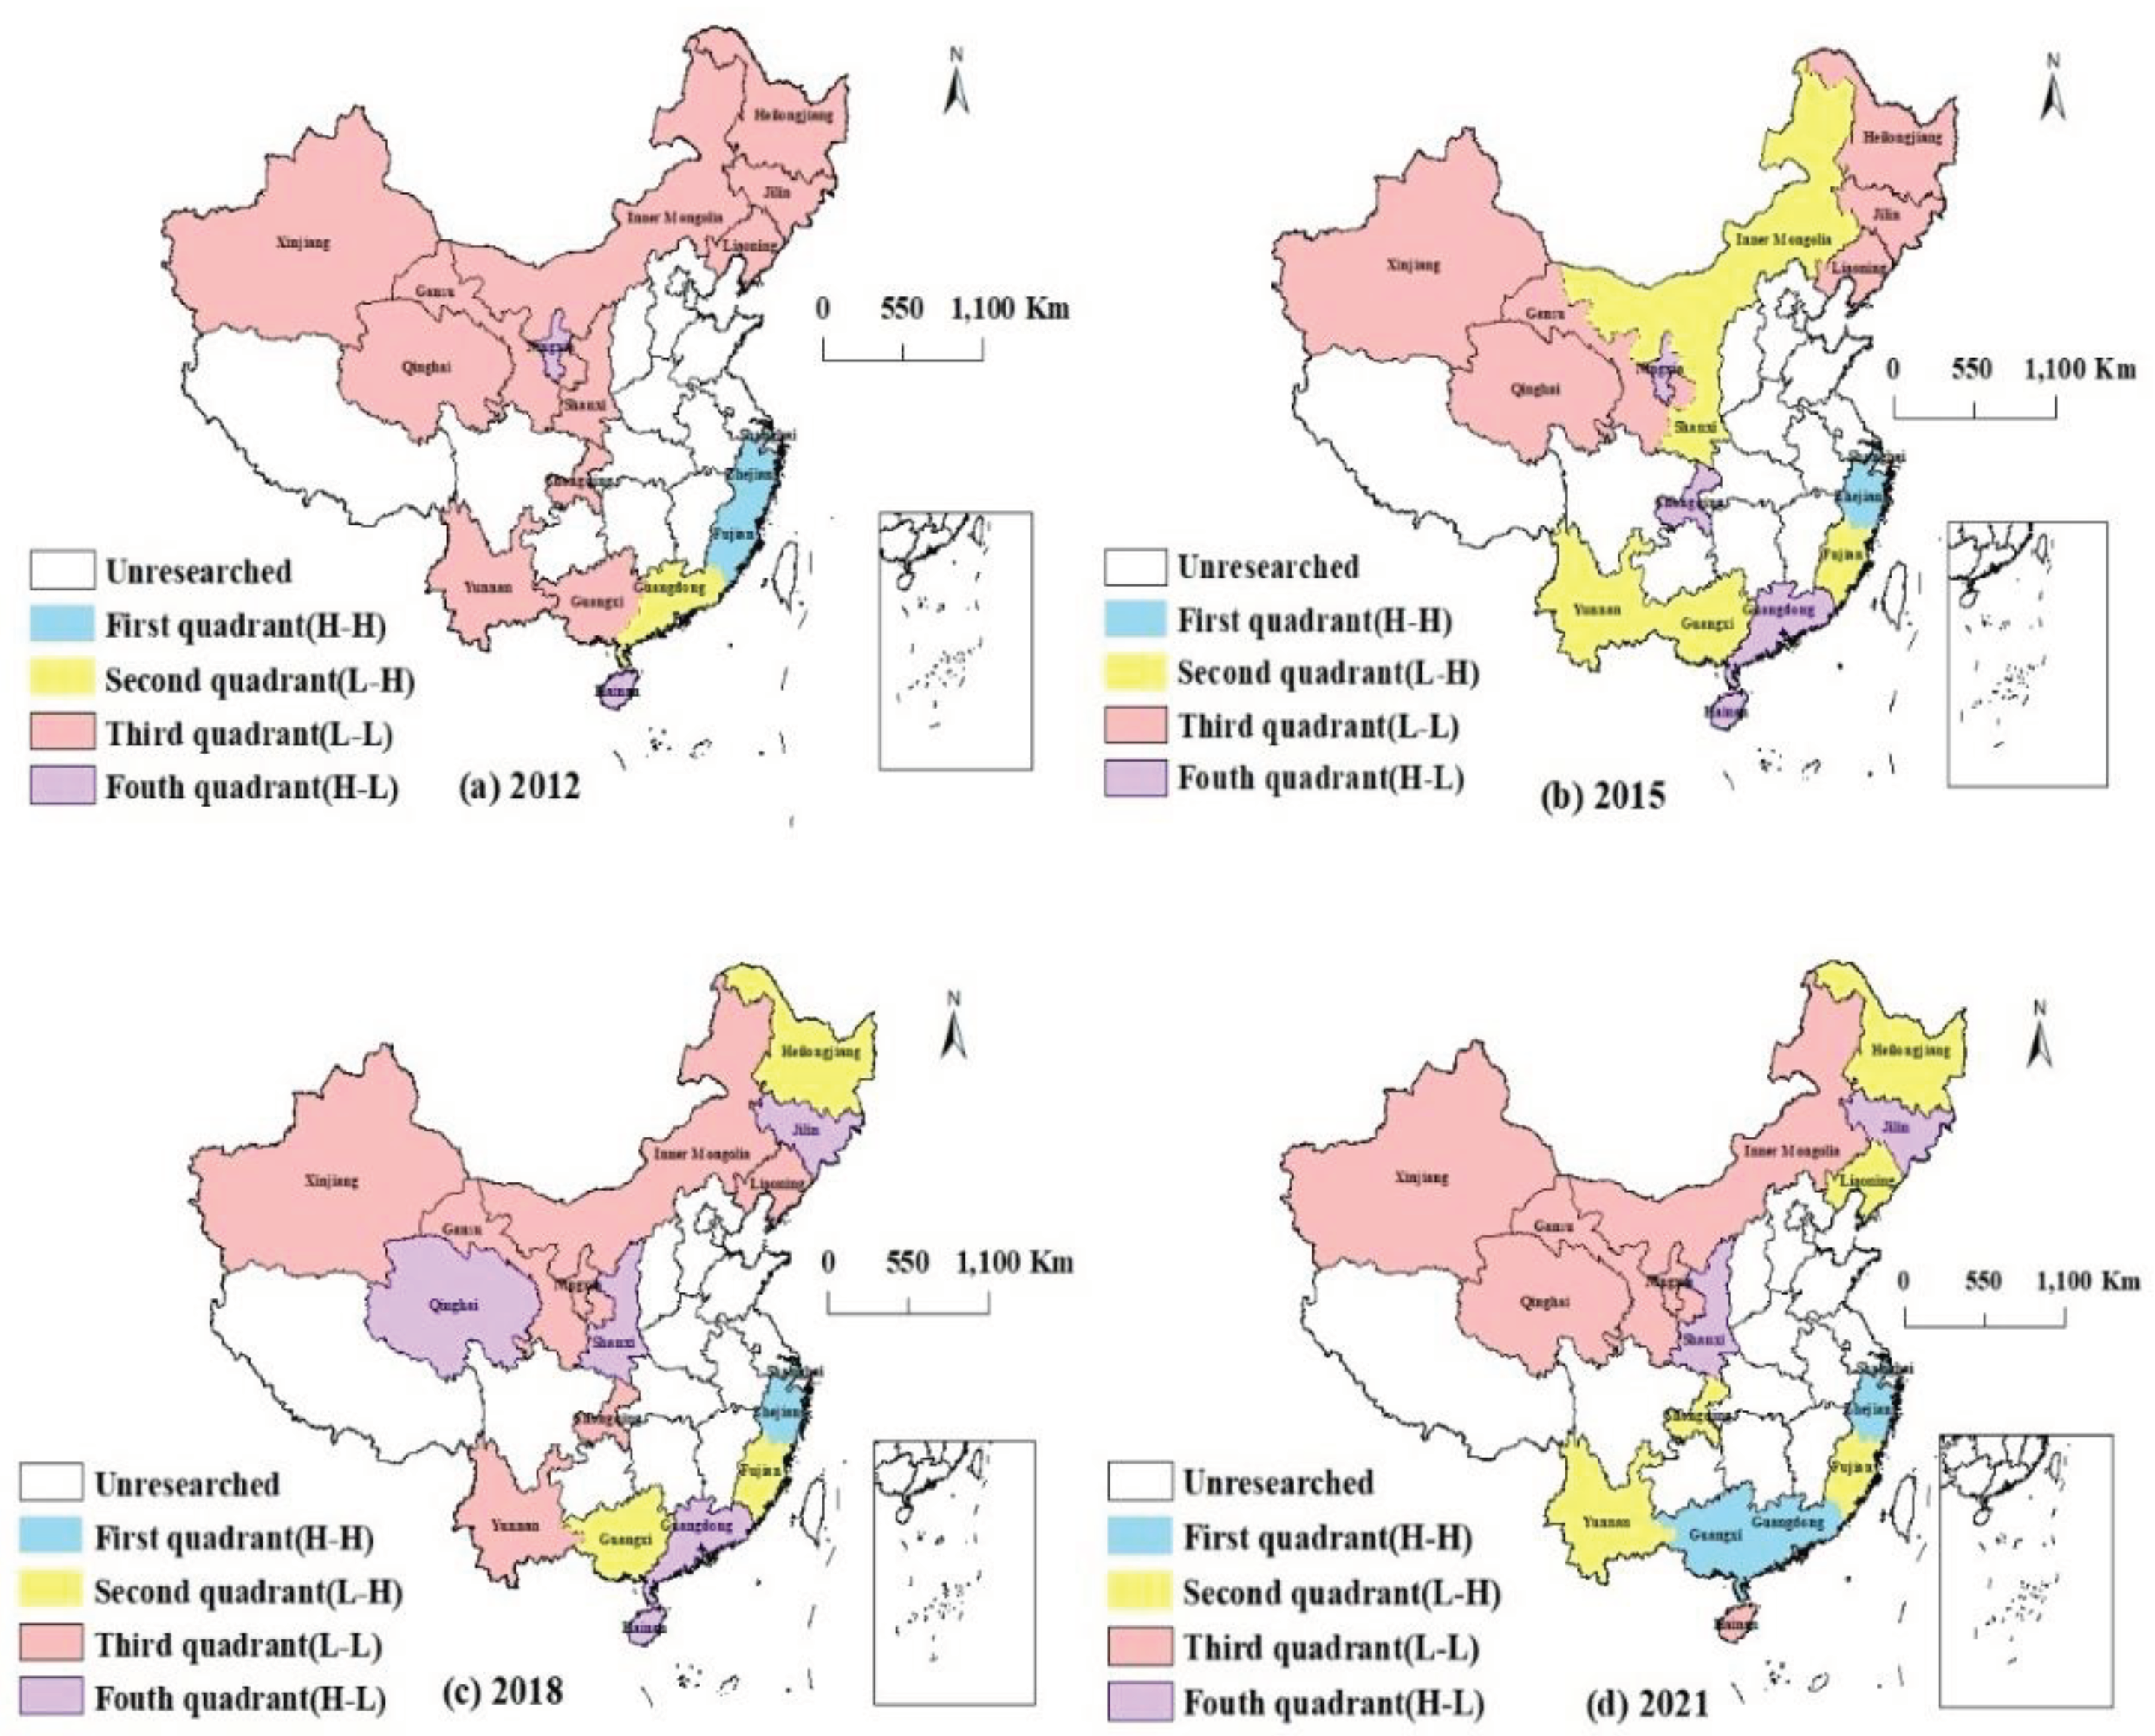
- Spatial correlation analysis reveals a high spatial correlation among the 17 provinces along the route. The global Moran index declines from 0.582 in 2012 to 0.367 in 2021, indicating fluctuations in the overall spatial distribution of the clustering degree of innovation factor allocation efficiency in each region. Further analysis using the local Moran index concludes that the innovation factor allocation efficiency of the regions along the Belt and Road primarily falls into the L-L type.
4.2. Policy Recommendation
- Optimize the allocation of funds for innovative factor inputs, enhance supervision, and vigorously promote economic development. To mobilize the enthusiasm of regions along the Belt and Road for developing innovation factors, it is essential to strengthen and enhance the financial market system. This includes optimizing the mechanism for fiscal expenditure on science and technology, coordinating the promotion of direct and indirect financing, introducing innovative financial products, and providing tailored financial lending services for various scientific and technological enterprises. Additionally, there should be encouragement for insurance institutions to enhance the system of scientific and technological insurance products. Furthermore, establishing a specialized science and technology innovation fund regulator is crucial to bolstering follow-up testing and evaluation of projects and ensuring effective fund utilization. Simultaneously, the government should enact policies supporting innovation fund investments, foster a fair market environment, and activate the potential value of the innovation factor market in each region. Utilizing capital, talent, technology, data, and other innovation factor elements in the innovation factor market activities is vital. This approach aims to continuously enhance the innovation factor allocation efficiency while promoting economic development through innovation.
- Encouraging scientific and technological innovation, facilitating regional talent mobility, and establishing a regional support mechanism for innovation factors. The overall innovation factor allocation efficiency in the Belt and Road region is relatively low, as indicated by the higher level of innovation factor development in the southeast coastal region compared to other regions. Regional governments should develop policies to stimulate scientific and technological innovation, including providing financial support for research, implementing preferential taxation, and strengthening intellectual property protection. They should establish high-level research platforms for outstanding talents, create funds for innovation, and enhance collaboration with enterprises, universities, and research institutes to promote the transformation and application of research results. High-tech firms should foster an innovation culture, improve incentives for innovation, and attract and cultivate talent. Banks should offer flexible financing for high-tech innovation enterprises. Encouraging regional mobility among research talent and supporting talent flow from high- to low-level regions can facilitate knowledge exchange and innovation. Establishing an innovation support mechanism can aid regions with weak innovation by leveraging resources from stronger regions. Government intervention should prioritize central and western regions, aiming to bridge regional disparities and achieve high-quality development.
- Enhancing the upgrading of regional industrial structure and enhancing the ecological system for innovation factor allocation. The regions along China's Belt and Road exhibit geographical complexity and diversity, leading to significant differences in economic levels. The innovation factor allocation efficiency in these regions is predominantly of the L-L type. To achieve shared development, regions should optimize their industrial structure and facilitate the structural upgrading of industrial innovation allocation. Consequently, high-tech enterprises across provinces should increase investment in scientific research funding, gradually expand industry scale, and consistently standardize enterprise fund supervision systems to mitigate resource waste and other issues. The government should not only offer macro-level financial guarantees for enterprises but also assume an organizational role in core technology research and development, emphasizing the theme of high-tech enterprise scientific and technological innovation. Each region should leverage its industrial and resource advantages to propel in-depth upgrading of modern industrial structures and traditional industries, fostering a high-standard technology industry trading platform. Additionally, deep integration of traditional and modern data and information industries is essential to create a digital innovation ecosystem for information sharing, accelerating digitalization efforts, and enhancing innovation factor flow among regions along China's Belt and Road. By leveraging both government and market roles, we can fortify and enhance the ecosystem for innovation factor allocation.
Author Contributions
Acknowledgments
Conflicts of Interest
References
- Huang, Y. (2016). Understanding China's Belt & Road initiative: motivation, framework and assessment. China Economic Review, 40, 314-321. [CrossRef]
- Johnston, L. A. (2019). The Belt and Road Initiative: what is in it for China?. Asia & the Pacific Policy Studies, 6(1), 40-58. [CrossRef]
- Tekdal, V. (2018). China's Belt and Road Initiative: at the crossroads of challenges and ambitions. The Pacific Review, 31(3), 373-390. [CrossRef]
- Wei, S. J. Wei, S. J., Xie, Z., & Zhang, X. (2017). From “made in China” to “innovated in China”: Necessity, prospect, and challenges. Journal of Economic Perspectives, 31(1), 49-70. [CrossRef]
- Zhang, F., Wu, F., & Cooke, P. (2010). China’s changing national and regional innovation systems and regional distribution of R&D. Geography Compass, 4(6), 532-544. [CrossRef]
- Liang, S., & Tan, Q. (2024). Can the digital economy accelerates China's export technology upgrading? Based on the perspective of export technology complexity. Technological Forecasting and Social Change, 199, 123052. [CrossRef]
- Zhang, Y., Zhang, Z., Jin, H., Tu, W., & Liu, Y. (2024). Innovation and OFDI along the Belt and Road. Technological Forecasting and Social Change, 200, 123136. (. [CrossRef]
- Ma, W., Bo, N., & Wang, X. (2024). Can greater openness improve green economy efficiency of countries along the belt and Road Initiative?. Heliyon. [CrossRef]
- Blažek, J., Žížalová, P., Rumpel, P., Skokan, K., & Chládek, P. (2013). Emerging regional innovation strategies in Central Europe: institutions and regional leadership in generating strategic outcomes. European urban and regional studies, 20(2), 275-294. [CrossRef]
- Jianmin, W., & Li, Y. (2020). Does factor endowment allocation improve technological innovation performance? An empirical study on the Yangtze River Delta region. Science of the Total Environment, 716, 137107. [CrossRef]
- Gao, Q., Cheng, C., & Sun, G. (2023). Big data application, factor allocation, and green innovation in Chinese manufacturing enterprises. Technological Forecasting and Social Change, 192, 122567. [CrossRef]
- Xu, Y., Wang, Z. C., & Tao, C. Q. (2024). Can innovative pilot city policies improve the allocation level of innovation factors?–Evidence from China. Technological Forecasting and Social Change, 200, 123135. [CrossRef]
- Kogan, L. Kogan, L., Papanikolaou, D., Seru, A., & Stoffman, N. (2017). Technological innovation, resource allocation, and growth. The Quarterly Journal of Economics, 132(2), 665-712. [CrossRef]
- Cao, Y. H., You, J. X., Shi, Y. J., & Hu, W. (2021). Research on the allocation efficiency and influencing factors of scientific and technological resources in the Yangtze river delta city group. Sustainability, 13(14), 7951. (, 14. [CrossRef]
- Xu, M., Qi, Y., Tao, C., & Zhang, S. (2022). A Random Forest Method for Identifying the Effectiveness of Innovation Factor Allocation. Computational Intelligence and Neuroscience, 2022. (. [CrossRef]
- Wang, B., & Liu, Y. (2023). Calculating regional innovation efficiency and factor allocation in China: the price signal perspective. Applied Economics, 1-19. [CrossRef]
- Ji, Y., Cai, H., & Wang, Z. (2023). Impact of industrial synergy on the efficiency of innovation resource allocation: Evidence from chinese metropolitan areas. Land, 12(1), 177. [CrossRef]
- Liu, M. L., & Wang, J. (2022). Regional innovation Factors, Allocation Efficiency and Innovation Performance. Statistics & Decisio (09), 169-174. [CrossRef]
- Wang, X. Y., & Jin, G. H. (2023). Research on the efficiency of innovation factor allocation from the perspective of high-qualityeconomic development in China: Analysis based on three-stage DEA-Malmguist-Tobit model. Price:Theory & Practice (12),174-178+204. [CrossRef]
- Men, X. P., Li, X. H., & He, J. Y. (2022). Regional Differences and Dynamic Evolution of Allocation Efficiency of Innovation Factors: Statistical Measurement Based on the Yangtze River Economic Belt. Statistics & Decisio (17), 97-102. [CrossRef]
- Wang, J. M., & Yang, L. (2020). Innovation Elements,Allocation Efficiency and the Performance of Innovation in the Yangtze River Delta Region. Shanghai Journal of Economic (01), 75-85. [CrossRef]
- Xu, Y., & Zhao, J. F. (2020). Measurement of the Coupling Degree of Innovation Elements Allocation and Economic High-Quality Development in China. Journal of Quantitative & Technological (10), 46-64. [CrossRef]
- Charnes, A., Cooper, W. W., & Rhodes, E. (1978). Measuring the efficiency of decision making units. European journal of operational research, 2(6), 429-444. 6). [CrossRef]
- Tone, K. (2001). A slacks-based measure of efficiency in data envelopment analysis. European journal of operational research, 130(3), 498-509. [CrossRef]
- Zhong, K., Wang, Y., Pei, J., Tang, S., & Han, Z. (2021). Super efficiency SBM-DEA and neural network for performance evaluation. Information Processing & Management, 58(6), 102728.
- Caves, D. W., Christensen, L. R., & Diewert, W. E. (1982). The economic theory of index numbers and the measurement of input, output, and productivity. Econometrica: Journal of the Econometric Society, 1393-1414. [CrossRef]
- Zhang, H., Hu, J., Hao, F., & Zhang, Y. (2024). Spatio-temporal evolution of provincial ecological footprint and its determinants in China: A spatial econometric approach. Journal of Cleaner Production, 434, 140331. [CrossRef]
| Type | Primary index | Secondary index | Unit |
| Innovation input index | Talent factor | Full-time equivalent of R&D personnel | Person-year |
| Capital factor | Internal expenditure of R&D funds | 10000 yuan | |
| Financial expenditure on science and technology | Billion yuan | ||
| Technology factor | Expenditure on purchasing domestic and foreign advanced technology | 10000 yuan | |
| Data factor | Number of mobile phone subscribers | 10000 households | |
| Innovation output index | Technological outcomes | Patent authorization | Piece |
| Economic benefits | Amount of technology market contracts | Billion yuan | |
| Sales volume of new products | 10000 yuan | ||
| Non-expected output | Production of solid hazardous waste | 10000 tons | |
| Discharge of sulfur dioxide in wastewater | 10000 tons | ||
| Chemical oxygen demand in wastewater discharge | 10000 tons |
| Province | 2012 | 2013 | 2014 | 2015 | 2016 | 2017 | 2018 | 2019 | 2020 | 2021 | Mean |
| Inner Mongolia | 0.218 | 0.125 | 0.054 | 0.056 | 0.051 | 0.108 | 0.140 | 0.153 | 0.148 | 0.263 | 0.132 |
| Liaoning | 0.396 | 0.336 | 0.353 | 0.454 | 0.501 | 0.562 | 0.680 | 0.664 | 0.597 | 1.001 | 0.555 |
| Jilin | 1.042 | 0.155 | 0.279 | 0.195 | 1.002 | 1.049 | 1.054 | 1.132 | 1.026 | 1.036 | 0.797 |
| Heilongjiang | 0.153 | 0.191 | 0.150 | 0.139 | 0.175 | 0.250 | 0.358 | 0.394 | 0.477 | 0.539 | 0.283 |
| Shanghai | 1.008 | 1.017 | 1.008 | 1.029 | 1.050 | 1.020 | 1.016 | 1.059 | 1.056 | 1.079 | 1.034 |
| Zhejiang | 0.743 | 1.036 | 1.004 | 1.001 | 1.019 | 1.011 | 1.008 | 1.059 | 0.744 | 1.140 | 0.977 |
| Fujian | 1.122 | 0.560 | 0.372 | 0.298 | 0.170 | 0.201 | 0.223 | 0.275 | 0.308 | 0.357 | 0.389 |
| Guangdong | 0.371 | 1.005 | 0.473 | 0.635 | 0.659 | 1.020 | 0.883 | 1.037 | 1.024 | 1.037 | 0.814 |
| Guangxi | 0.037 | 0.126 | 0.074 | 0.128 | 1.037 | 1.028 | 0.567 | 0.342 | 1.025 | 1.063 | 0.543 |
| Hainan | 0.125 | 0.343 | 1.005 | 0.105 | 1.000 | 1.016 | 0.740 | 1.000 | 0.094 | 1.017 | 0.645 |
| Chongqing | 0.479 | 0.337 | 1.016 | 1.015 | 1.034 | 1.174 | 0.354 | 0.371 | 0.478 | 1.008 | 0.727 |
| Yunnan | 0.232 | 0.183 | 0.180 | 0.189 | 0.216 | 0.255 | 0.247 | 0.208 | 0.159 | 0.237 | 0.211 |
| Shanxi | 0.408 | 1.071 | 0.374 | 0.602 | 1.014 | 0.543 | 0.743 | 1.083 | 1.250 | 1.205 | 0.829 |
| Gansu | 0.401 | 0.365 | 0.407 | 0.338 | 0.282 | 0.346 | 0.493 | 1.000 | 1.054 | 1.008 | 0.569 |
| Qinghai | 0.086 | 0.151 | 0.253 | 0.387 | 0.193 | 0.744 | 1.206 | 0.189 | 1.041 | 1.057 | 0.531 |
| Ningxia | 0.103 | 0.118 | 0.092 | 1.036 | 0.084 | 0.105 | 0.174 | 1.099 | 1.000 | 1.005 | 0.482 |
| Xinjiang | 0.080 | 0.037 | 0.038 | 0.039 | 0.044 | 0.069 | 0.041 | 1.010 | 0.362 | 0.127 | 0.185 |
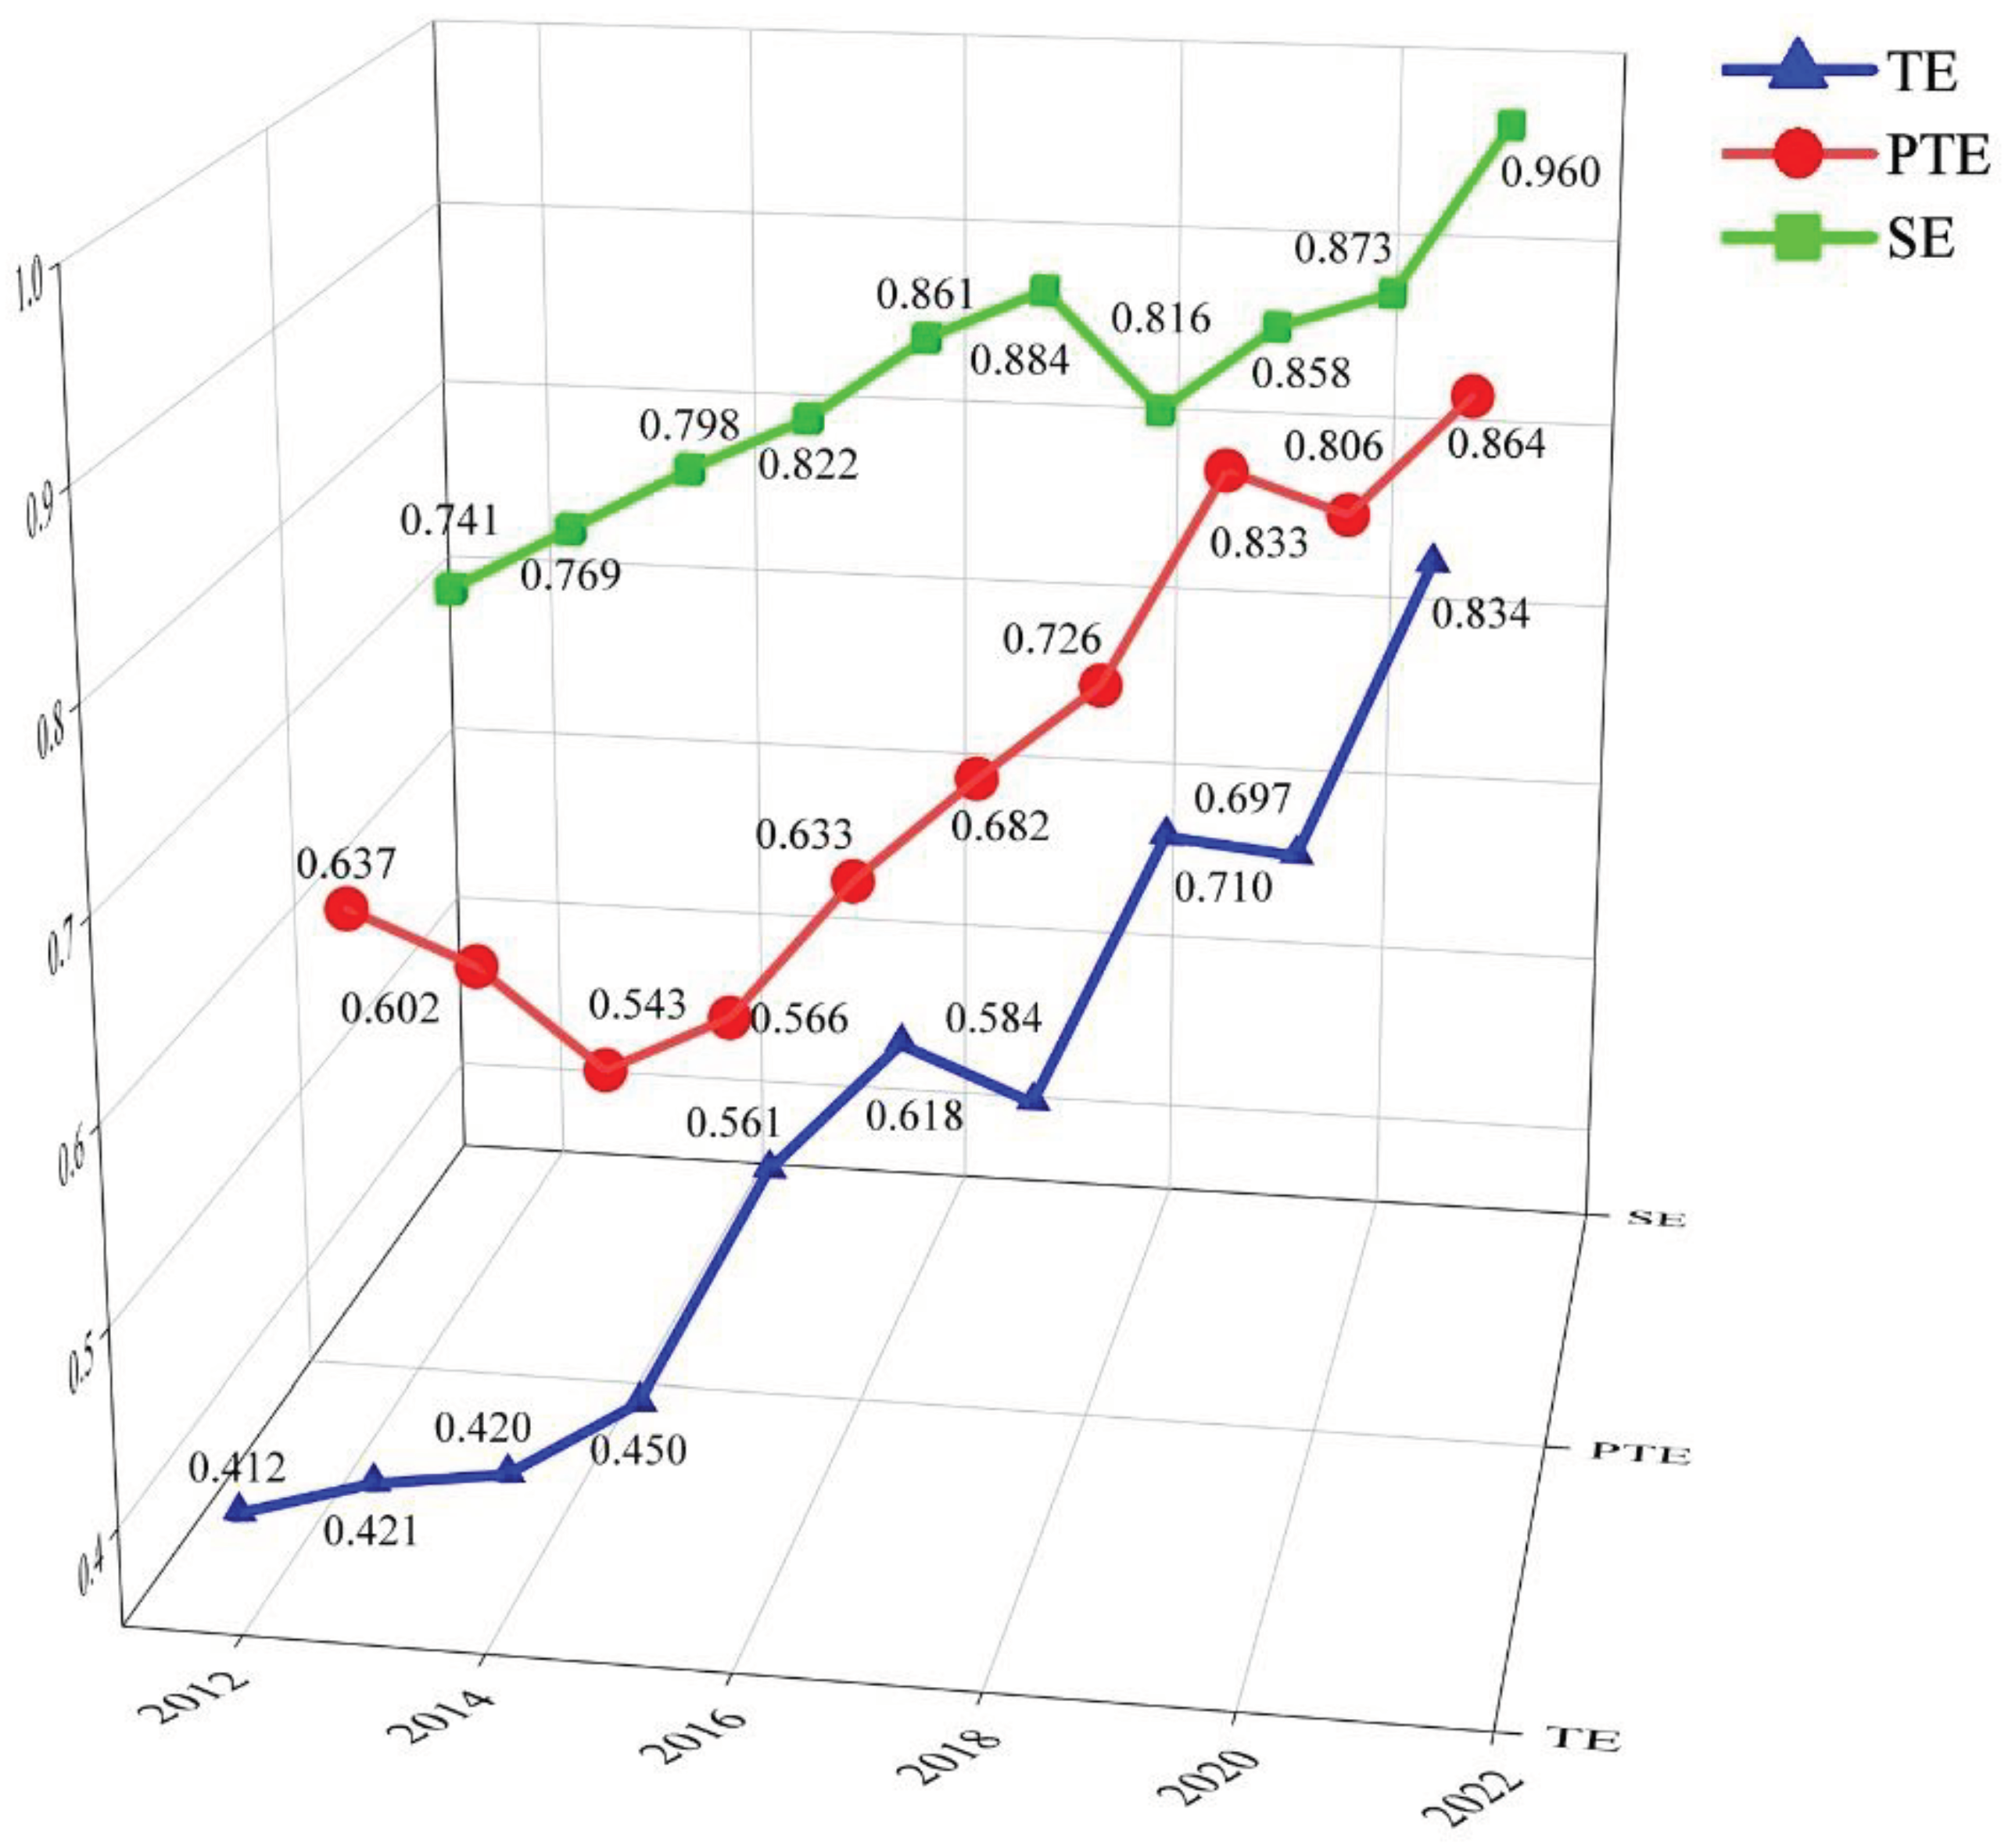
| Mean | 0.412 | 0.421 | 0.420 | 0.450 | 0.561 | 0.618 | 0.584 | 0.710 | 0.697 | 0.834 | 0.571 |
| Value of efficiency | Region |
| >1 | Shanghai |
| 0.8-1 | Zhejiang, Shanxi, Guangdong |
| 0.6-0.8 | Jilin, Chongqing, Hainan |
| 0.4-0.6 | Gansu, Liaoning, Guangxi, Qinghai, Ningxia |
| 0.2-0.4 | Fujian, Heilongjiang, Yunnan |
| 0-0.2 | Xinjiang, Inner Mongolia |
| Year | EFFCH | TECH | PECH | SECH | TFP |
| 2012-2013 | 0.986 | 1.131 | 0.985 | 1.000 | 1.122 |
| 2013-2014 | 1.018 | 0.938 | 1.007 | 1.000 | 0.946 |
| 2014-2015 | 1.020 | 1.327 | 0.997 | 1.020 | 1.488 |
| 2015-2016 | 1.049 | 1.238 | 1.029 | 1.017 | 1.292 |
| 2016-2017 | 1.049 | 1.272 | 1.018 | 1.026 | 1.310 |
| 2017-2018 | 1.029 | 1.112 | 1.020 | 1.008 | 1.137 |
| 2018-2019 | 1.037 | 1.022 | 1.019 | 1.017 | 1.058 |
| 2019-2020 | 0.986 | 1.054 | 1.013 | 0.972 | 1.042 |
| 2020-2021 | 1.059 | 1.020 | 1.006 | 1.051 | 1.090 |
| Mean | 1.026 | 1.124 | 1.010 | 1.012 | 1.165 |
| Province | EFFCH | TECH | PECH | SECH | TFP |
| Inner Mongolia | 1.112 | 1.024 | 1.065 | 1.021 | 1.126 |
| Liaoning | 1.000 | 1.042 | 1.000 | 1.000 | 1.042 |
| Jilin | 1.024 | 1.020 | 1.000 | 1.023 | 1.043 |
| Heilongjiang | 1.098 | 1.076 | 1.081 | 1.009 | 1.166 |
| Shanghai | 1.000 | 1.232 | 1.000 | 1.000 | 1.232 |
| Zhejiang | 1.000 | 1.167 | 1.000 | 1.000 | 1.167 |
| Fujian | 1.013 | 0.946 | 1.011 | 1.000 | 0.944 |
| Guangdong | 1.000 | 1.095 | 1.000 | 1.000 | 1.095 |
| Guangxi | 1.001 | 1.103 | 1.001 | 1.000 | 1.108 |
| Hainan | 1.045 | 1.070 | 1.000 | 1.045 | 1.148 |
| Chongqing | 1.000 | 1.193 | 1.000 | 1.000 | 1.193 |
| Yunnan | 1.023 | 1.094 | 1.017 | 1.002 | 1.107 |
| Shanxi | 1.000 | 1.191 | 1.000 | 1.000 | 1.191 |
| Gansu | 1.000 | 1.155 | 1.000 | 1.000 | 1.155 |
| Qinghai | 1.000 | 1.448 | 1.000 | 1.000 | 1.448 |
| Ningxia | 1.106 | 1.238 | 1.000 | 1.106 | 1.628 |
| Xinjiang | 1.018 | 1.013 | 1.003 | 1.004 | 1.011 |
| Mean | 1.026 | 1.124 | 1.010 | 1.012 | 1.165 |
| Year | Global Moran's I | Z-value | P-value |
| 2012 | 0.582 | 2.263 | 0.012 |
| 2013 | 0.699 | 2.532 | 0.006 |
| 2014 | 0.836 | 3.053 | 0.001 |
| 2015 | 0.609 | 2.236 | 0.013 |
| 2016 | 0.493 | 1.834 | 0.033 |
| 2017 | 0.197 | 0.841 | 0.200 |
| 2018 | 0.640 | 2.358 | 0.009 |
| 2019 | 0.286 | 1.142 | 0.127 |
| 2020 | 0.040 | 0.075 | 0.470 |
| 2021 | 0.367 | 1.694 | 0.042 |
Disclaimer/Publisher’s Note: The statements, opinions and data contained in all publications are solely those of the individual author(s) and contributor(s) and not of MDPI and/or the editor(s). MDPI and/or the editor(s) disclaim responsibility for any injury to people or property resulting from any ideas, methods, instructions or products referred to in the content. |
© 2024 by the authors. Licensee MDPI, Basel, Switzerland. This article is an open access article distributed under the terms and conditions of the Creative Commons Attribution (CC BY) license (http://creativecommons.org/licenses/by/4.0/).


