1. Introduction
Cancer is promoted by genomic instability that affects cell growth, metabolism and inflammation, and this has been associated with higher rates of recurrence and mortality in head and neck cancer (HNC) [
1]. These tumors are malignant and develop in the facial, oral and neck regions, affecting the upper aerodigestive tract, salivary glands and thyroid. This type of cancer ranks sixth among the most common cancers worldwide, and is associated with high mortality due to intervening in vital life functions such as phonation, swallowing, breathing, taste and smell [
2].
Each year, 450,000 global deaths are associated with HNC, and it is considered a clinically heterogeneous disease that involves different risk factors and molecular pathogenesis. In addition to the two major risk factors, tobacco and alcohol consumption, oncogenic viruses, the human papillomavirus (HPV), the microbiome and diet have also been established in recent decades as contributing sources for the development of this disease [
3]. Treatment for patients with HNC depends on the site of origin of the tumor, and generally includes surgical resection, radiotherapy, chemotherapy, molecular therapy, immunotherapy and the use of natural products as an adjuvant modality [
4].
Several natural products affect various oncogenic signaling pathways simultaneously, modulating the activity or expression of their molecular targets. These include cell death by apoptosis, proliferation, migration/invasion and angiogenesis. Thus, natural products are capable of generating intracellular signals that trigger events leading to the death of cancer cells. One of the most important sources of biologically active compounds is the plant kingdom, so there is a large list of phytochemicals (chemical compounds produced by plants) with therapeutic activity, including terpenes, alkaloids, essential oils, flavonoids and primary and secondary metabolites [
5]. Among these phytochemicals we can mention piperine (1-piperoylpiperidine), which is an alkaloid derived from plants of the Piperaceae family, which can be isolated mainly from the fruits or roots of black pepper (
Piper nigrum) and long pepper (
Piper longum) [
6].
The attention given to the study of this molecule is mainly due to its biological properties, such as: anti-inflammatory, antioxidant, immunomodulatory and anticancer, properties which allow this compound to chemically interact with various molecular targets. Specifically, in relation to piperine’s anticancer activity, recent observations have shown that its mechanism of action is multiple and involves the activation of cell signaling pathways, such as cell proliferation, programmed cell death, decreased migration and invasion of cancer cells [
7].
In this context, studies indicate that piperine can modulate various molecular targets, such as: receptors and enzymes (prostaglandin E2 receptors, cyclooxygenase 2 and matrix metalloproteinases MMPs), kinases (including the mitogen-activated protein kinase (MAPK) pathway, ERK1/2 and p38), inflammatory cytokines (IL-1β, IL-2, IL-8 and IF-y), inflammatory mediators such as JNK, AP-1 (activator protein 1), iNOS (nitric oxide synthase) and gene expression modulators (miRNAs) [
8,
9,
10].
However, the anticancer effect of piperine on head and neck carcinoma has yet to be elucidated. Therefore, the aim of this study was to investigate the effects of piperine on the signaling pathways that modulate the molecular mechanisms of cancer-associated inflammation, which could be used as a therapeutic alternative in this type of cancer.
2. Materials and Methods
2.1. Cell Lines and Treatment with Piperine
The HEp-2 cell line (laryngeal squamous cell carcinoma) was seeded in MEM-Earle medium and the SCC-25 cell line (tongue squamous cell carcinoma) in DMEM-HAM-F12 (Cultilab), both supplemented with 10% fetal bovine serum (Cultilab), 1% antibiotic/antimycotic (Invitrogen), 1% L-glutamine 200 µM, 1% non-essential amino acids 10mM and 1% sodium pyruvate 100 mM (Sigma Aldrich), cultivated under standard conditions (37°C, 5% CO2), and sourced from the American cell line bank (ATCC). Piperine (Sigma-Aldrich, St. Louis, MO, USA) was used as a treatment for the cells at concentrations of 25 μM, 50 μM, 100 μM, 150 μM, 200 μM, 250 μM, 300 μM, diluted in 0.1% dimethylsulfoxide (DMSO-Sigma - negative control), at treatment times of 4, 24, 48 and 72 hours. In subsequent experiments, only one concentration (150 µM) and one incubation time (24 hours) were chosen, these conditions being considered functional for the cells, without presenting a high degree of cytotoxicity [15]. All tests were carried out in triplicates and in three individual experiments.
2.2. Cell Proliferation, Viability/Cytotoxicity Assay
HEp-2 and SCC-25 cells were evaluated by the growth curve, in 24-well culture plates, density 5x10⁴, in 500 μL of complete medium. The concentrations of each treatment used were 100, 200 and 300 μM at 4, 24, 48 and 72 hours. Subsequently, the cells were trypsinized, stained with Trypan Blue and counted in the automated cell counter (Countess Automated Cell Counter II, Life Technologies). The viability of the tumor cells was assessed using the MTS reagent (PROMEGA, USA). The cells (5x10³) were seeded in a 96-well plate. Different concentrations of piperine were prepared (25 μM, 50 μM, 100 μM, 150 μM, 200 μM, 250 μM, 300 μM). Each experimental condition received 20μl of MTS solution - (3-(4,5-dimetiltiazol-2-il)-5-(3-carboximetoxifenil)-2-(4-sulfofenil)-2Htetrazólio) (Promega). The optical density was measured at 490 nm in a microplate reader (BioRad, Hercules, CA, USA) at 4, 24, 48 and 72 hours. The IC50 (50% inhibitory concentration) was defined as the concentration of the sample that reduced the absorbance by 50% compared to the control, using the function in the GraphPad Prism 8.0.1 software. For cell viability, two-way analysis of variance (ANOVA) and Dunnett’s test were applied.
2.3. Transwell Invasion Assay
Approximately 5x10⁴ cells were added to the upper chamber of the inserts (transwell, BD Biosciences San Jose, CA, USA), along with 200 µL of serum-free medium, and 750 µL of complete medium containing 10% serum was added to the lower compartment of the well. The cells were incubated at 37°C, 5% CO2 for 24 hours, then fixed in paraformaldehyde and stained crystal violet. The insertions were counted and photographed under a microscope (100x magnification). The numbers of cells that crossed the membrane were counted for statistical analysis using the t-test.
2.4. Clonogenic Assay
The cells (8x10²) were seeded in 6-well plates and incubated under the experimental conditions (DMSO control and piperine at a concentration of 150μM). After 24 hours the medium was changed and the treatment added, and every two days this condition was renewed over a period of 14 days. The cells (colonies) were then fixed with methanol, stained with crystal violet and counted by visual inspection, and the results were analyzed using the t-test.
2.5. Determination of Apoptosis and Cellular DNA Content
Cells (1x 10⁶) after treatment with piperine were analyzed by flow cytometry (Guava Easy Cyte, MILLIPORE), and incubated with fluorochrome-conjugated ANXA5 monoclonal antibody (PE, BD Pharmigen, San Diego, USA) and with 7-ADD. Cell cycle arrest was assessed using the Guava® Cell Cycle Reagent kit (MILLIPORE, USA), using the protocol proposed by the manufacturer. Tumor cells (1x 10⁶) were washed with PBS and fixed in 70% ethanol and resuspended in the Cell Cycle kit solution, and evaluated by flow cytometer (Guava Easy Cyte, MILLIPORE).
2.6. Genotoxicity Test (Alkaline Comet)
Cell sediments (5x10⁴) were mixed with low melting point agarose and placed on slides containing a mixture of PBS (Phosphate buffer solution) and normal melting point agarose. These slides were subjected to the lysis step and electrophoresed. The slides were then neutralized and fixed in 100% ethyl alcohol. The slides were stained with a solution of Gel Red 10000x, 1M NaCl and distilled water, and analyzed under a fluorescence microscope. The cell nuclei (100 cells per group) were classified into a damage class (0 to 4) and subjected to a formula to determine the total damage index. The statistics were based on the Kruskal-Wallis non-parametric analysis of variance, and the means were compared using the Mann-Whittney test.
2.7. Enzyme-Linked Immunosorbent Assay (ELISA)
The expression patterns for each cytokine/chemokine tested (IL-1β, IL-8 and IF-y) were analyzed according to the manufacturer BD Biosciences. The supernatant of the cells was collected from each experimental group, and then the analyses were read on a spectrophotometer at a wavelength of 450 nm. The data was plotted and analyzed using the t-test.
2.8. Immunocytochemistry Analysis
The cells were cultured at a concentration of 1x10⁵ on culture slides (Nunc, Naperville, IL, USA) and fixed (4% paraformaldehyde), permeabilized in Triton X, washed with PBS-T and subjected to blocking (PBS+Normal goat serum +BSA). Immunolabeling was done with primary mouse monoclonal antibodies (Ab) anti-p38/MAPK (BD Bioscience, USA) and anti-ERKpan (BD Biosciences, USA) diluted 1:200, and secondary goat anti-mouse IgG antibody conjugated to Alexa Fluor 546 (Dako, Glostrup, Denmark), for about 1 hour. The slides were then mounted (DAPI) for analysis under an Axioskop 2 fluorescence microscope (Zeiss, GR). Ten digital images of each replicate were captured using AxioVision software (Zeiss, GR), where six cells from each image were evaluated by densitometry obtained using image J. Statistical analysis was performed using the t-test.
2.9. RNA Isolation, Target Genes and Real-Time PCR Analysis
Initially, total RNA was extracted using Trizol, followed by reverse transcription in cDNA using the High Capacity cDNA Reverse Transcription Kit (Applied Biosystems, Forster City, CA, USA), as described by the manufacturer. The reaction for the PTGS2, PTGER4, MMP2 and MMP9 genes was carried out in a 7500 Fast Real-Time PCR System thermal cycler (Applied Biosystems), prepared in triplicate and processed in a final volume of 20uL containing 50 ng of cDNA, SYBR® Green PCR Master Mix and 100nM of each primer, according to the Applied Biosystems protocol. The 2 -∆∆ Ct method was used for relative quantification of gene expression, with the levels of the GAPDH (Glyceraldehyde-3-phosphate dehydrogenase) gene used as internal controls. The primers used were: PTGS2 (f: 5′ATTCCCTTCCTTCGAAATGC3′; r: 5′ AGAAGGCTTCCCAGCTTTTG3′); PTGER4 (f: 5′ CGAGATCCAGATGGTCATCTTAC 3′; r: 5′ CCAAACTTGGCTGATATAACTGG 3′); MMP2 (f: 5′ AAGTCTGGAGCGATGTGACC 3′; r: 5′ CCGTCAAAGGGGTATCCATC 3′); MPP9 (f: 5′ TTGTGCTCTTCCCTGGAGAC 3′; r: 5′ ATTTCGACTCTCCACGCATC 3′) e GAPDH (f: 5′ CTGTTGCTGTAGCCAAATTCGT 3′, r: 5′ ACCCACTCCTCCACCTTTGA 3′).
2.10. Protein Expression Analysis (Western Blotting)
Protein concentrations were quantified using the BCA protein assay kit (Termo Scientific, Wilmington, DE, USA). The expression of PTGS2 (1:500 μl Abcam, Cambridge, UK) and MMP2 (1:500 μl, ABclonal, Woburn, USA) were examined, and equal amounts of proteins (30µg) were separated by polyacrylamide gel electrophoresis (Bio-Rad, Hercules, Usa), and transferred to nitrocellulose membranes. The membranes were blocked with 5% powdered milk diluted in TBS-T and incubated with the specific primary and secondary antibodies (anti-rabbit IgG - 1:1000 μl Abcam, Cambridge, UK). The endogenous control used was beta-actin. The protein expression levels obtained were calculated and presented as the mean ± SEM of the mean optical density and subjected to the t-test.
4. Discussion
The identification of new anticancer therapeutic agents is a fundamental issue for the study and development of drugs aimed at treating this disease. Among these agents, we can highlight piperine, an alkaloid derived from
Piper nigrum, which has anti-inflammatory, antioxidant, and immunomodulatory effects [
11]. One of the main biological characteristics involving inflammatory/carcinogenic processes is the capacity for increased cell proliferation. In the present study, the antiproliferative action of piperine was verified, including inhibiting the multiplication of colonies in the cells studied. Other in vitro studies have also shown this antiproliferative effect of piperine in colon, lung, breast and hepatocellular adenocarcinoma cell lines, as a result of inducing cell cycle arrest in the G1 phase and regulating the expression of p21/WAF1 and p27/KIP1 [
12,
13].
Cell viability and cytotoxicity are other important indicators in the in vitro toxicological evaluation of a given compound [
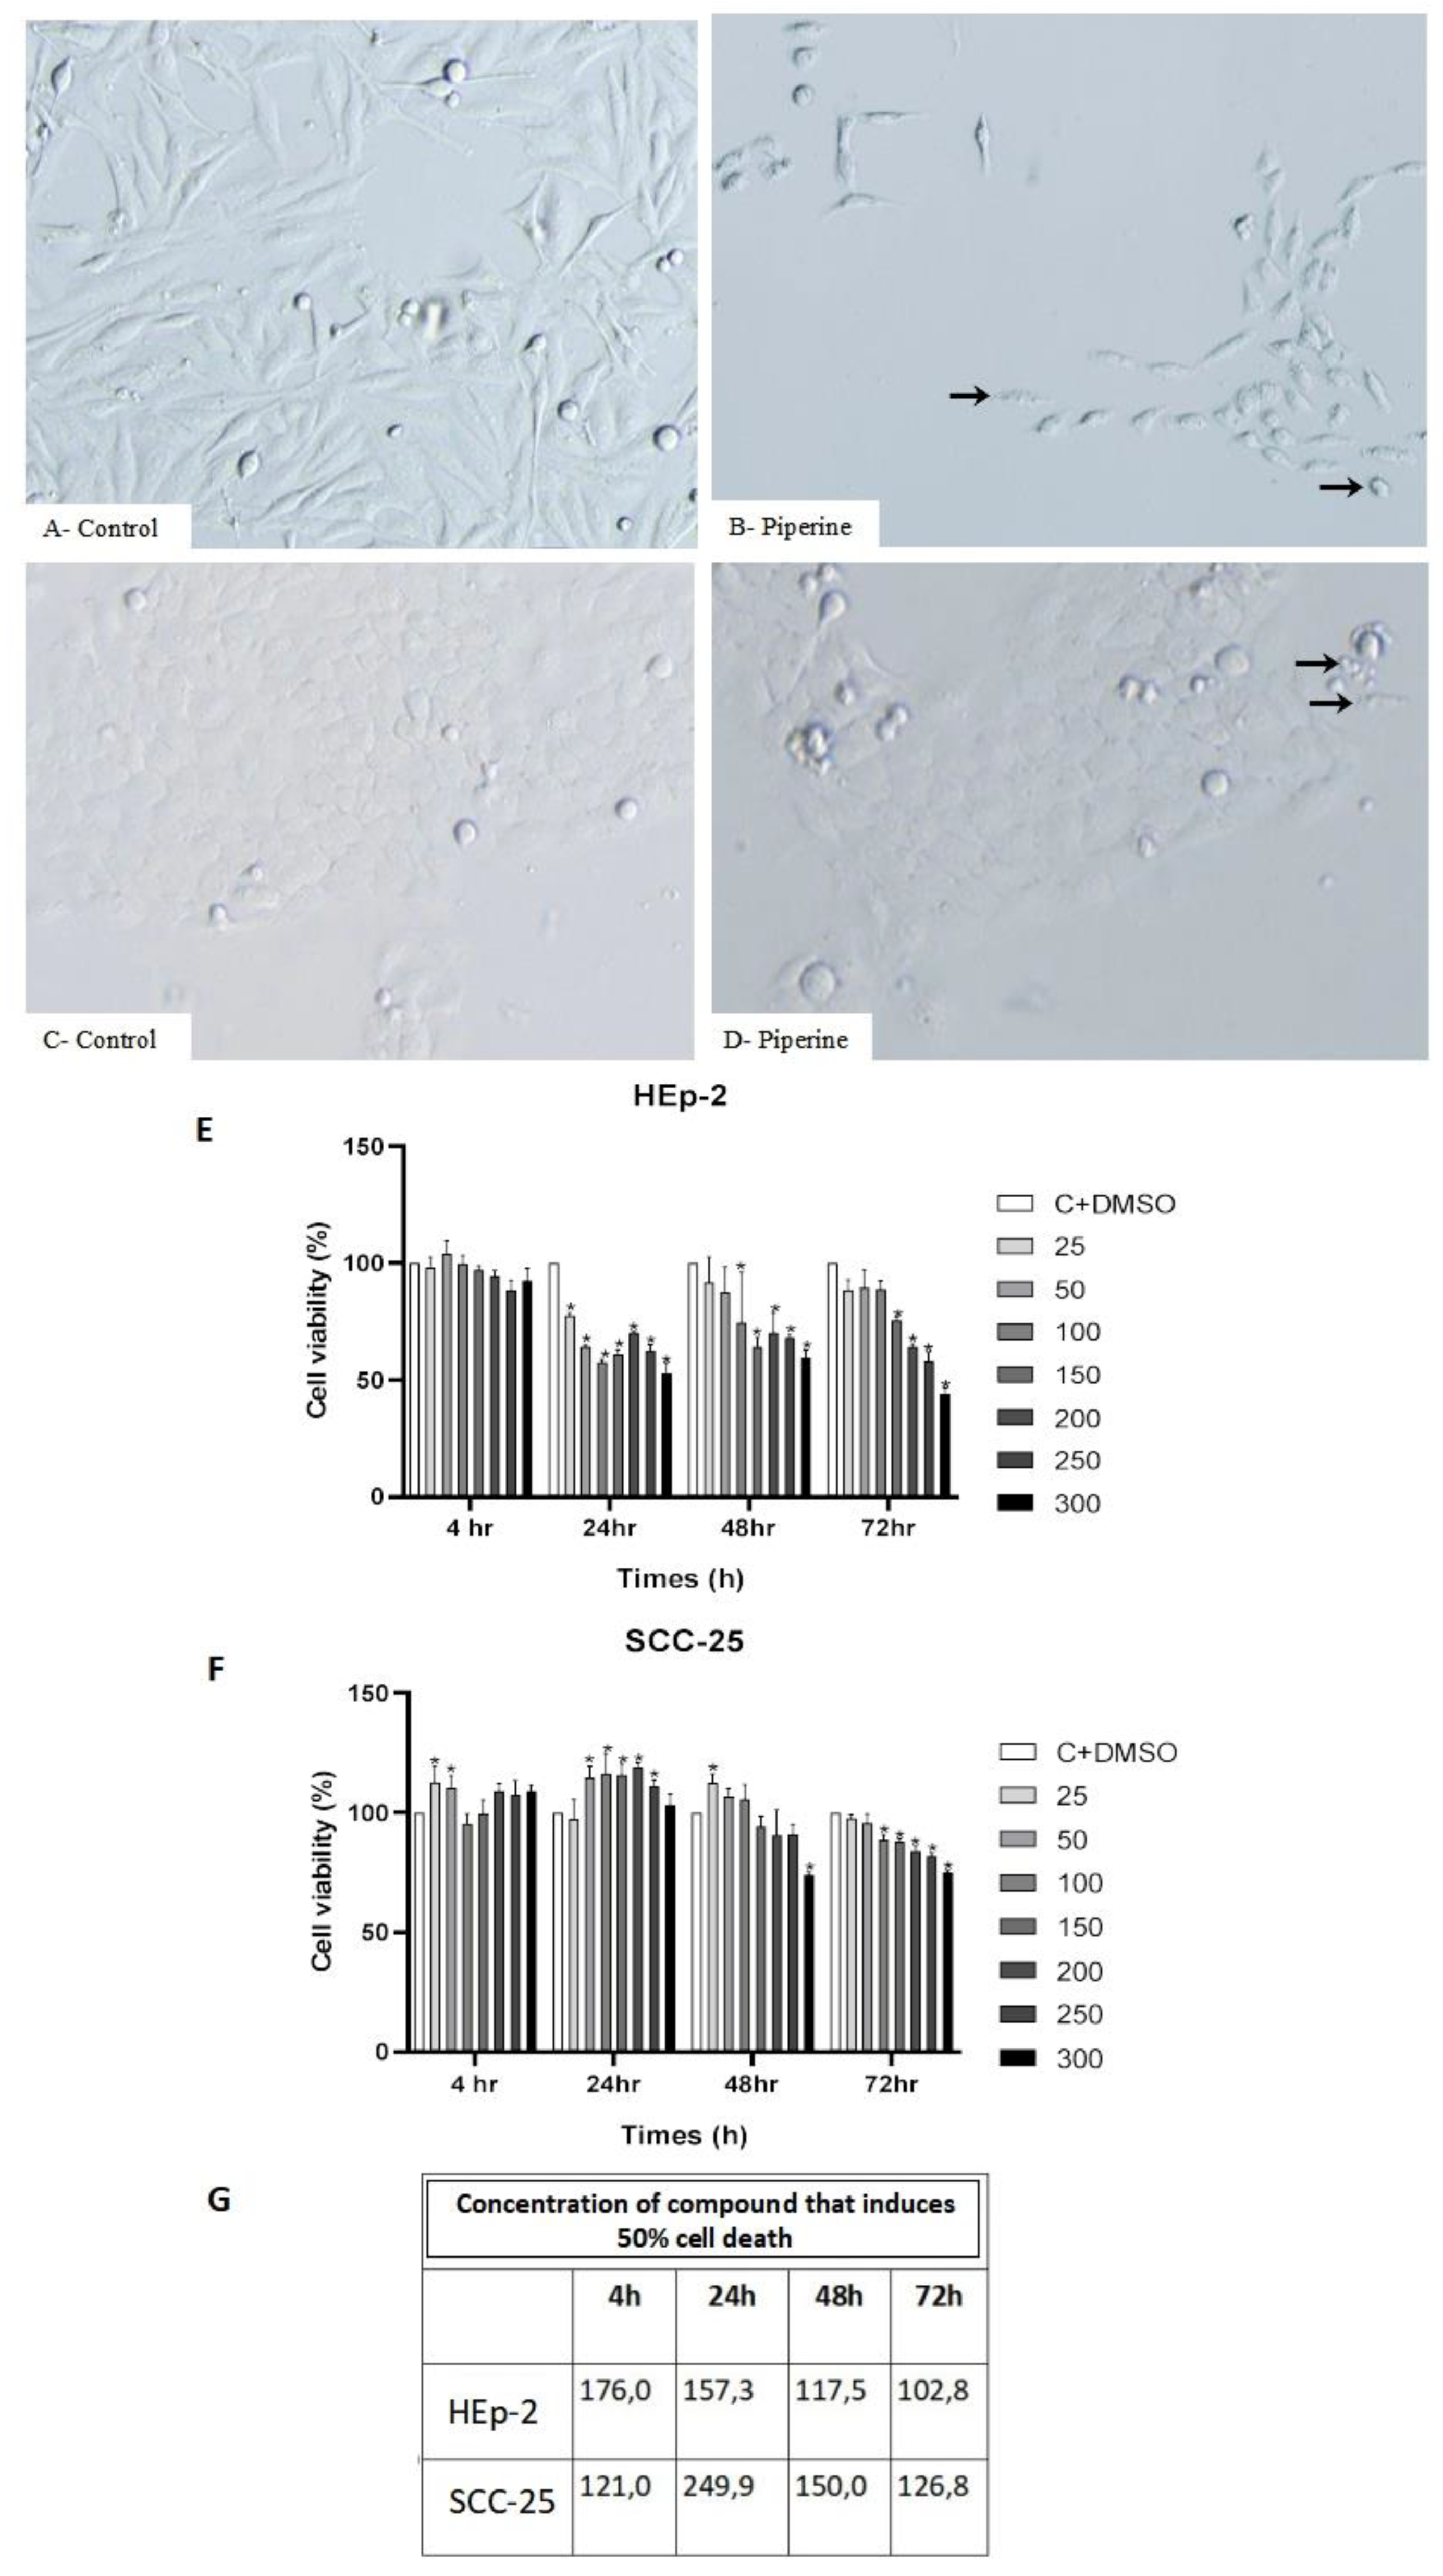
14]. Our analyzes indicated that piperine decreases cell viability upon application of the treatment, and it was even pointed out that the main biological effects of piperine in vitro occur at specific doses (75-200 µM) and incubation time between 24 and 48 hours [
15]. This cytotoxicity effect is described as piperine promoting inhibition of NADH-oxidoreductase, an enzyme that stimulates cell activity and proliferation, as well as disruption of mitochondrial membrane permeability [
16].
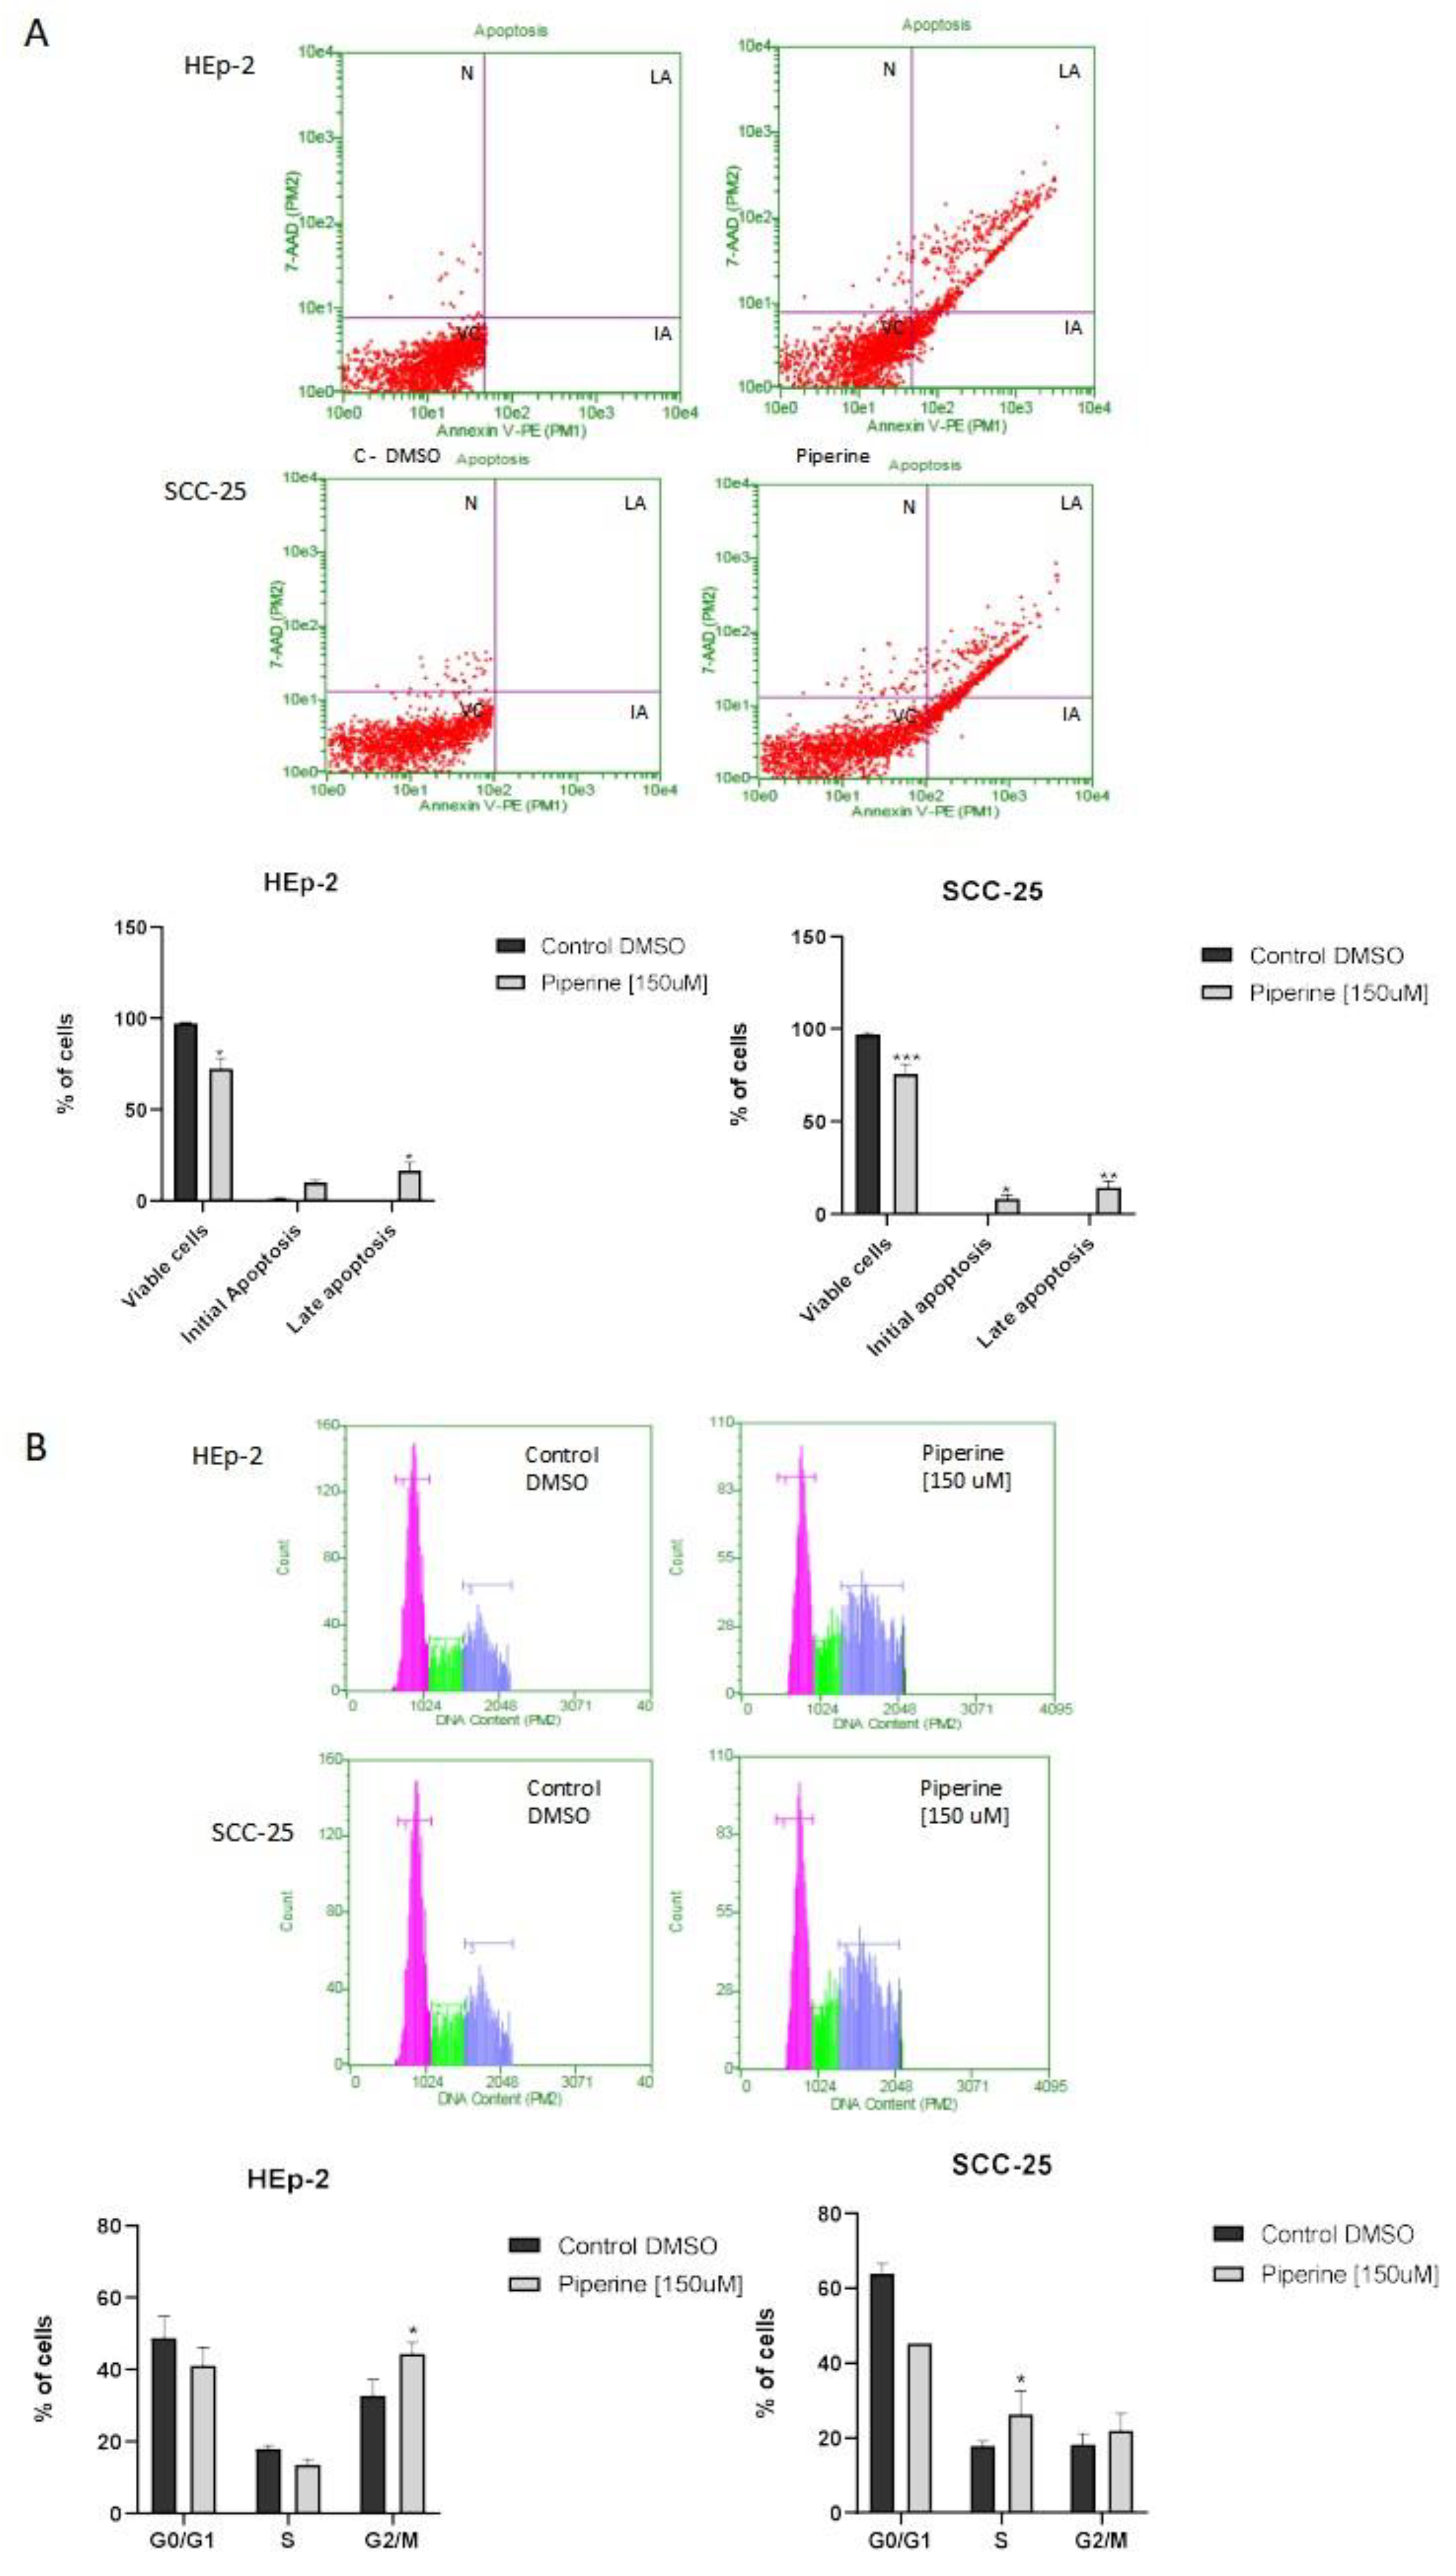
Piperine also induced apoptosis and cell cycle arrest in the G2/M and S phases in the cells studied. These mechanisms have also been described in several studies, such as in DU145 prostate cancer lines and SNU-16 and GES-1 gastric cancer lines, probably due to a decrease in the expression of anti-apoptotic proteins (Bcl-2 and Bcl-xl), which initiate caspase signaling that is responsible for the destruction of cell structure and consequent apoptotic death. Therefore, the induction of apoptosis, as well as the arrest of the cell cycle, are the main mechanisms of studies related to the discovery of compounds with possible activities against cancer [
17,
18].
Furthermore, many chemotherapeutic drugs are genotoxic agents and induce apoptosis, due to the generation of DNA damage, as does piperine in high concentrations [
19]. The antioxidant capacity of tumor cells can be deregulated by an increase in reactive oxygen species (ROS). Alkaloids, such as piperine, with pH-dependent ionizable groups, can bind and interact with DNA, and this interaction generates breaks in the DNA chain, compromising the integrity of genetic information [
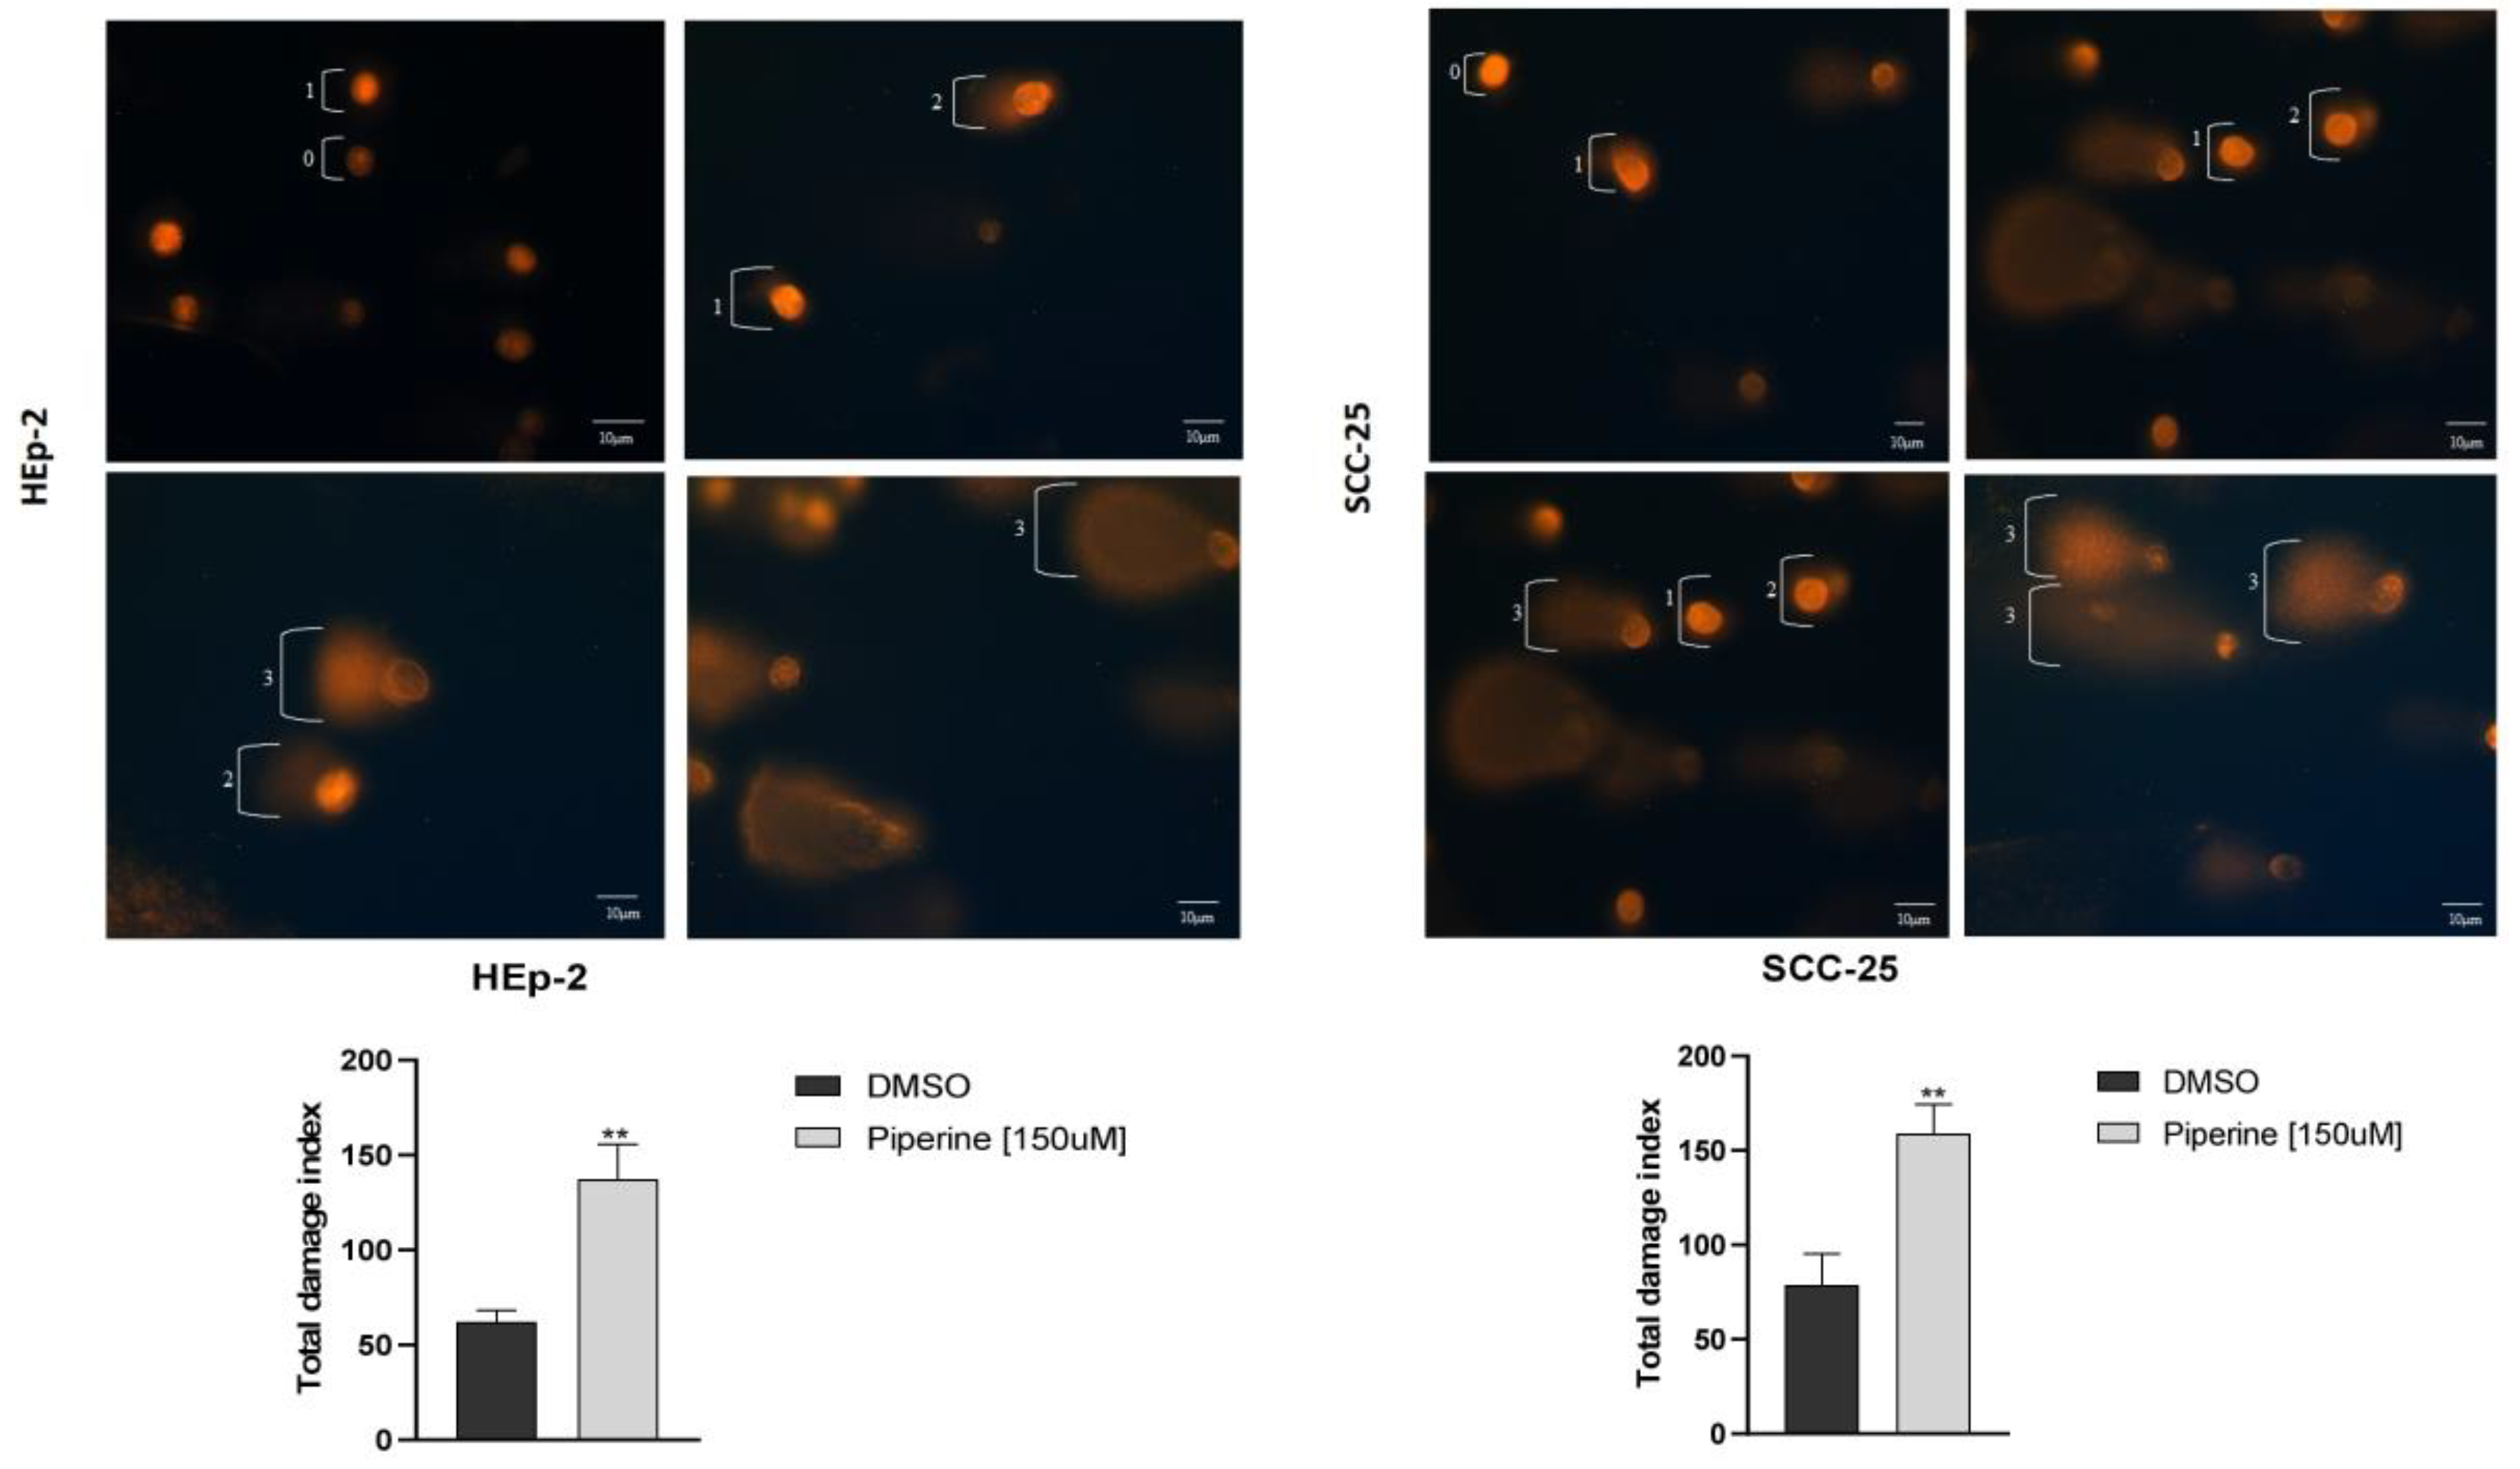
20]. So, in our study, we analyzed the damage index generated by the treatment, and thus confirmed that piperine caused DNA fragmentation in the cells studied.
In addition to the antiproliferative and genotoxic activity of piperine, the anti-metastatic effect is another efficiency observed in some studies with this herbal medicine. This action of piperine is seen in triple negative breast cancer cells (MDA-MB-468, T-47D and MCF-7) and colorectal cancer cells (SW480 and HCT-116), by decreasing the mRNA expression of metalloproteinase 2 and 9 [
21,
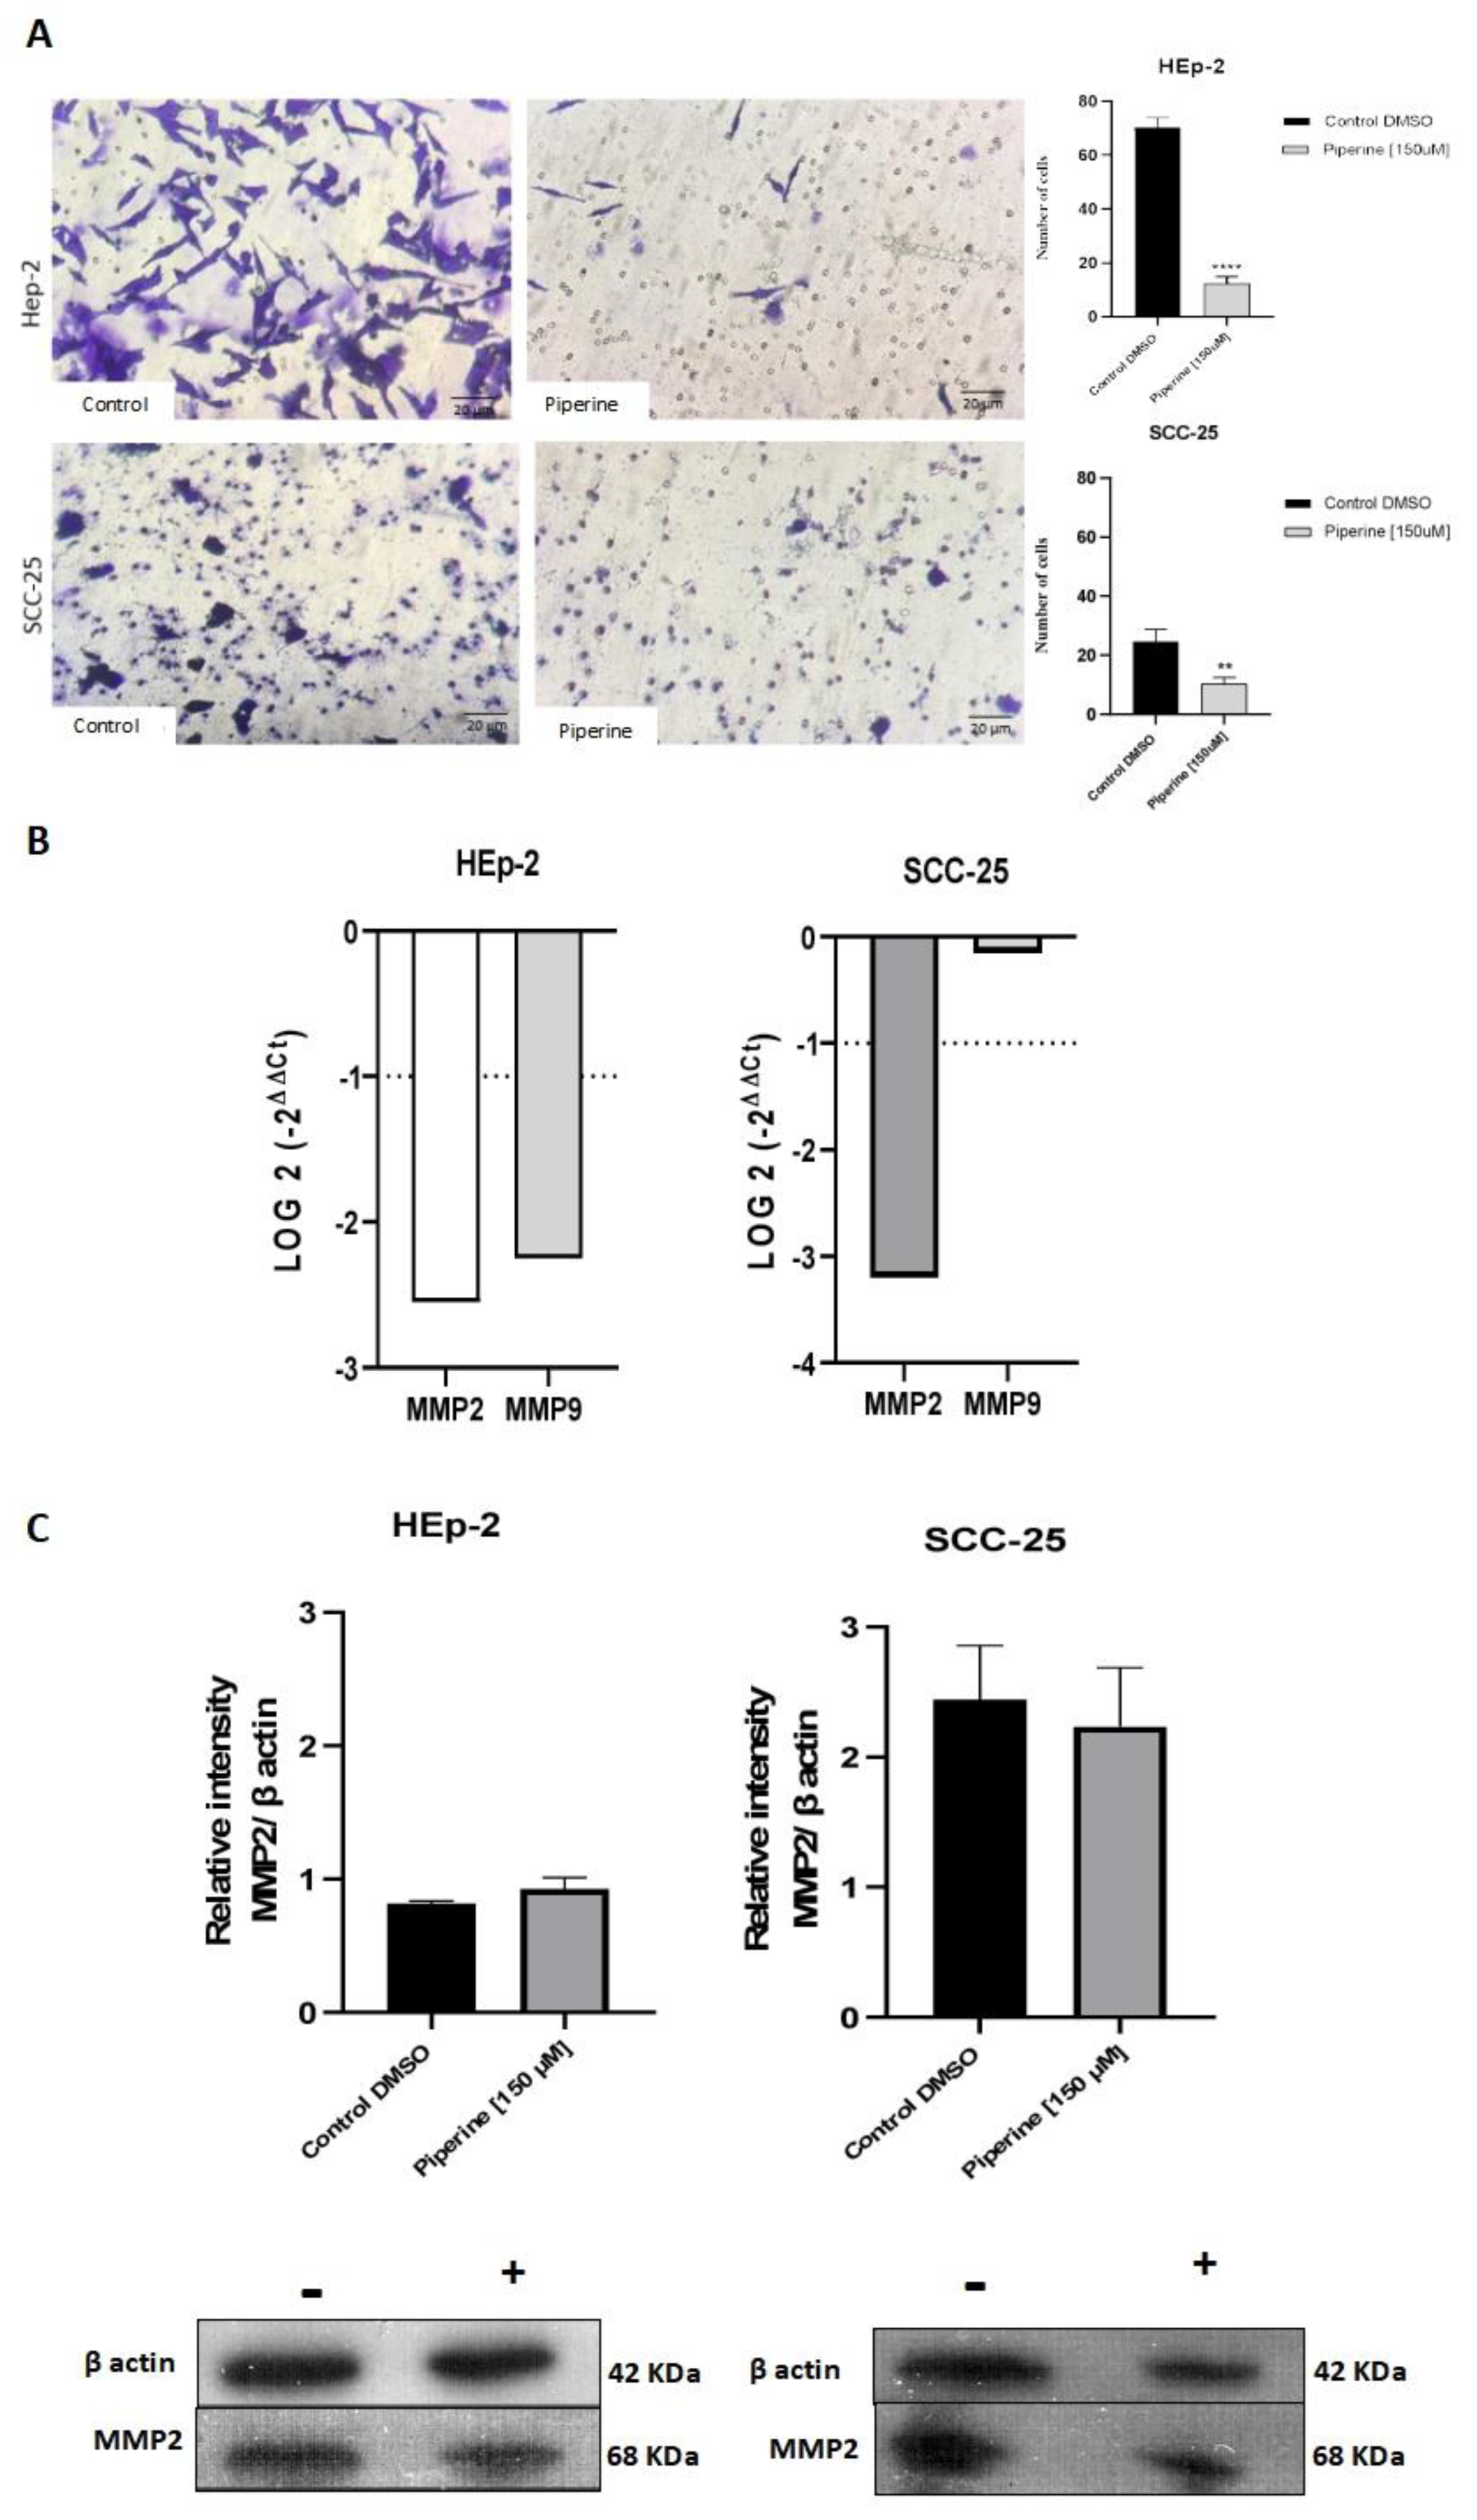
22]. In our experiments, we found that this invasive mechanism in HEp-2 and SCC-25 cells was significantly inhibited after treatment with piperine, probably suggested by the discovery of the modulation of MMP2 and MMP9 mRNA expression in these cells.
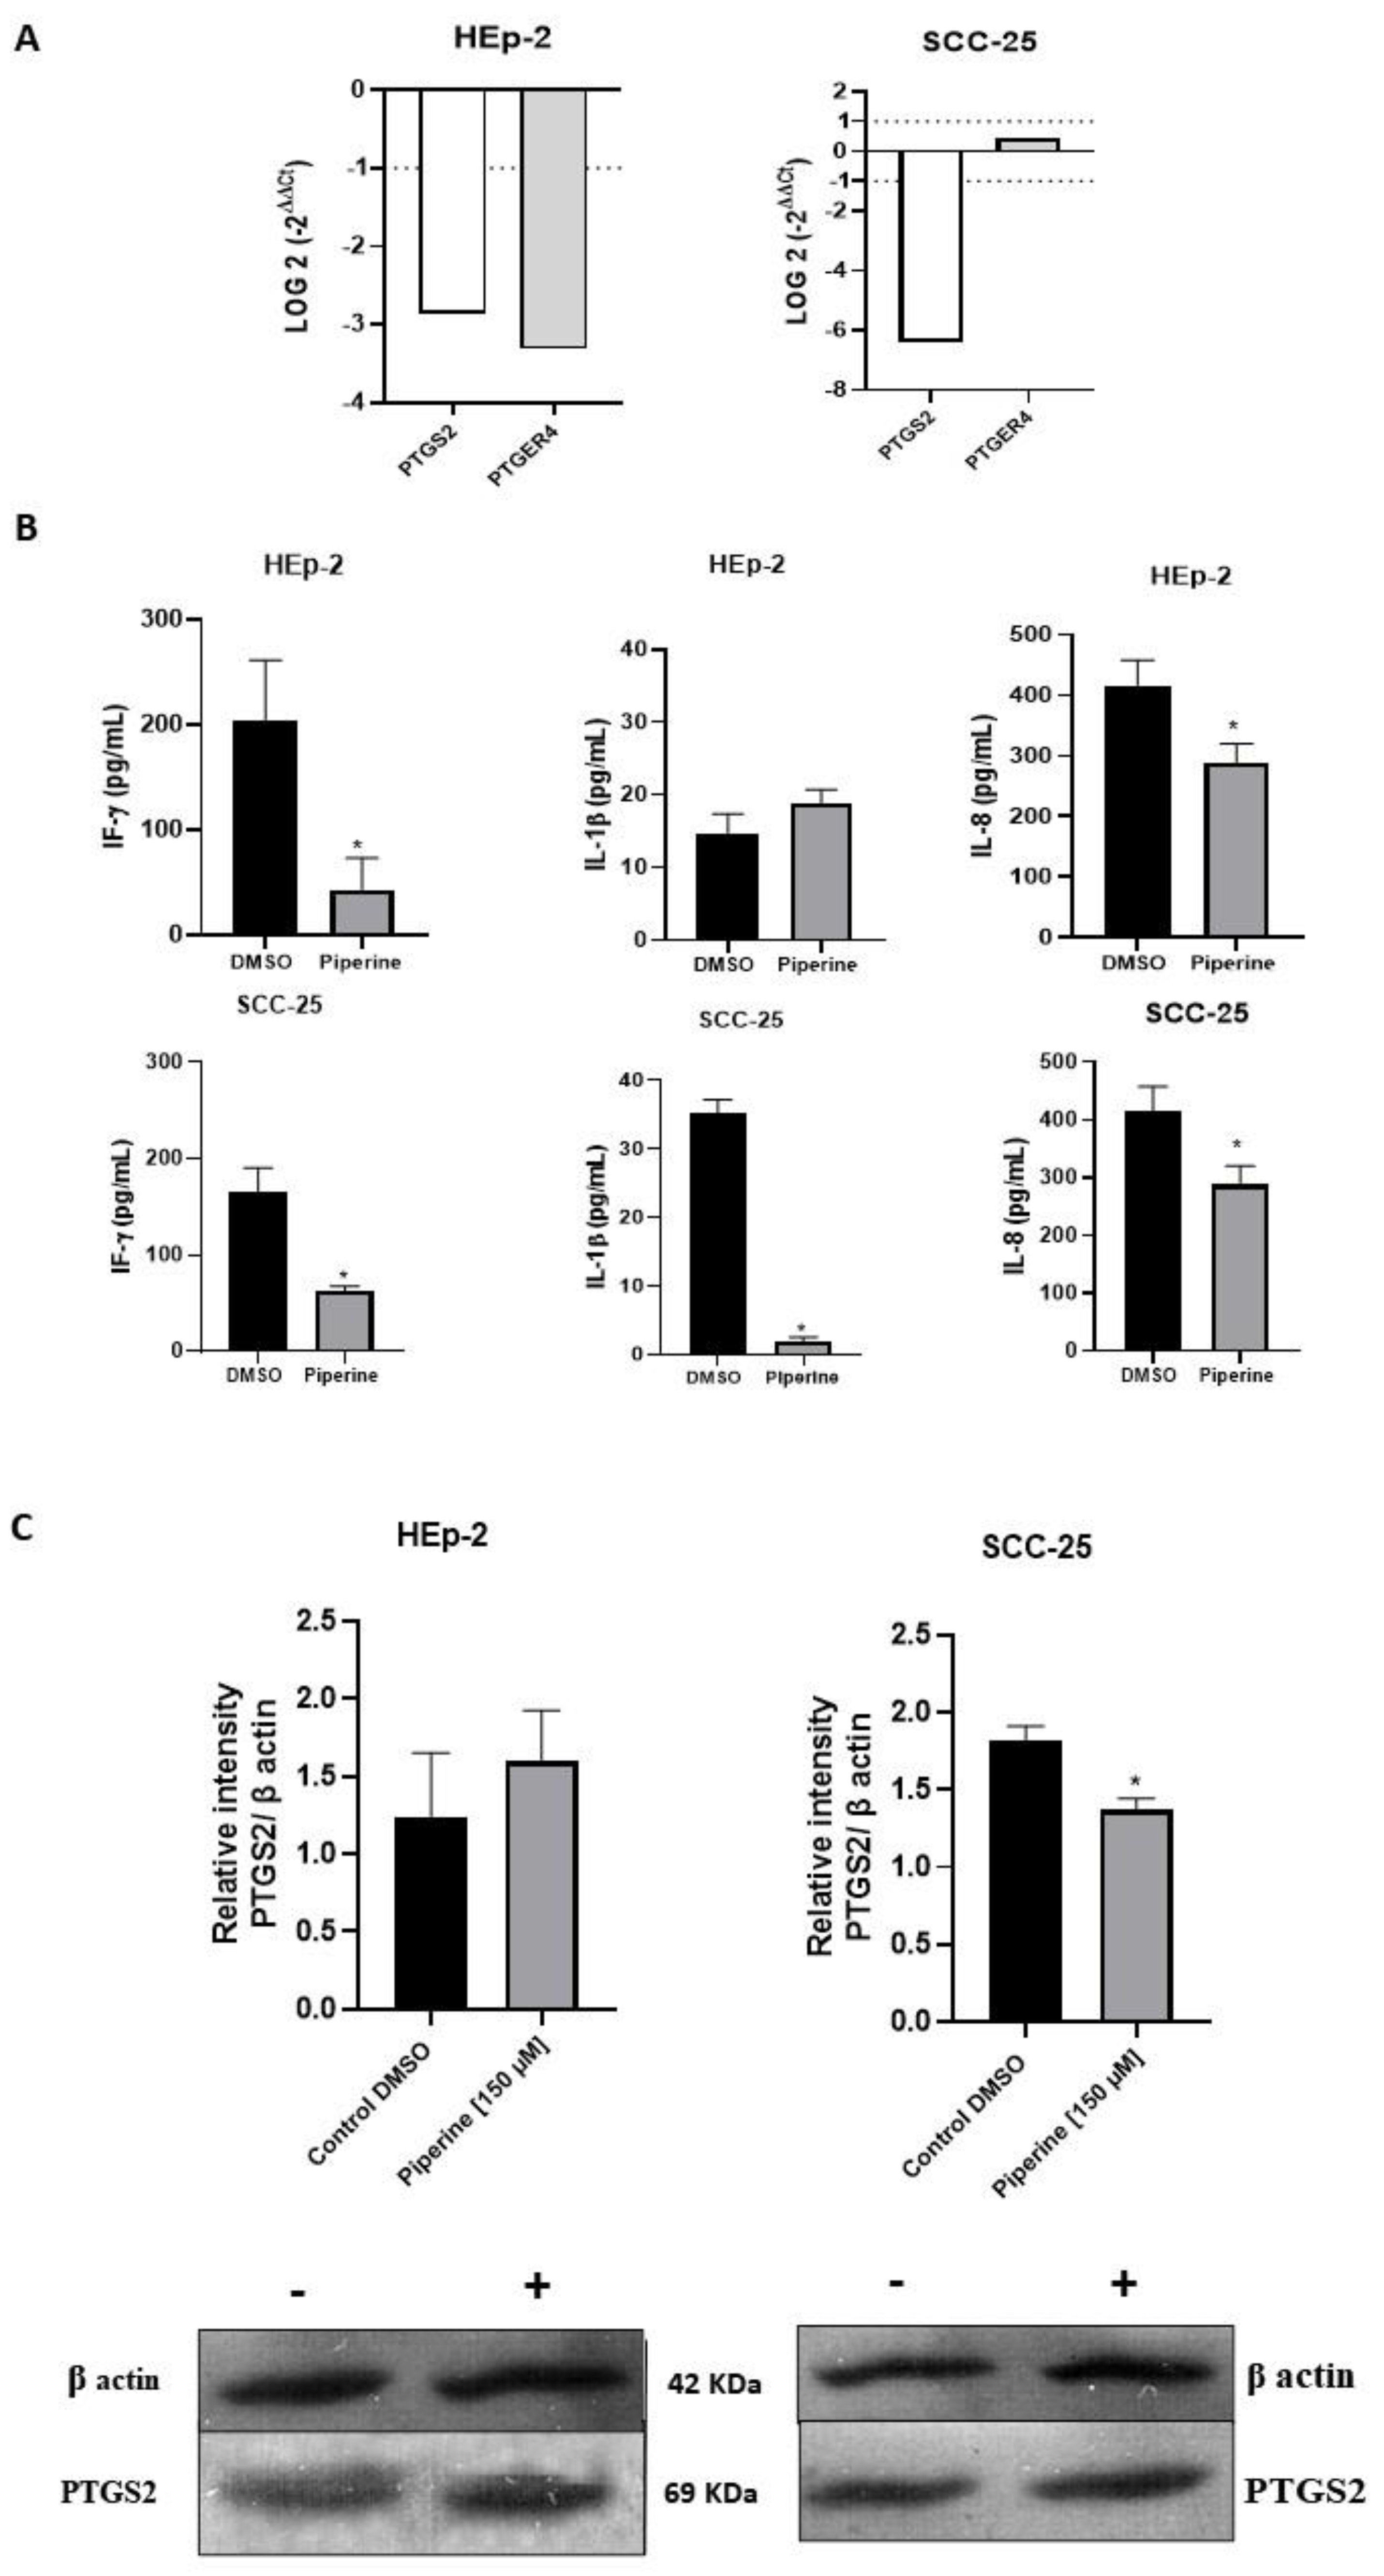
In order to better understand the mechanisms of cancer progression, some mediators (PTGS2 and PTGER4) that help cells to grow constantly have been verified, as it is known that arachidonic acid derivatives participate in inflammation and are also closely linked to tumor development, with PTGS2 being highly expressed in hyperplastic tissues [
23]. Our results on gene expression indicate that piperine significantly reduced
PTGS2 levels in the cells studied. The significant decrease in
PTGER4 expression occurred in the HEp-2 lineage, and this result was not observed in the SCC-25 cells. In terms of protein expression, our findings showed that the treatment reduced PTGS2 in both cells studied, indicating that piperine modulates gene and protein expression in our cancer model. Thus, our data corroborate the results of Kim and collaborators (2012), who also found a marked decrease in the expression levels of PTGS2 genes and proteins in mouse macrophage cells after treatment with piperine [
24].
Among the main mediators of inflammation are cytokines and proteins belonging to the mitogen-activated protein kinase (MAPK) family. Interfering with chronic inflammation means interfering with the function of these mediators and the signal transduction dependent on these molecules [
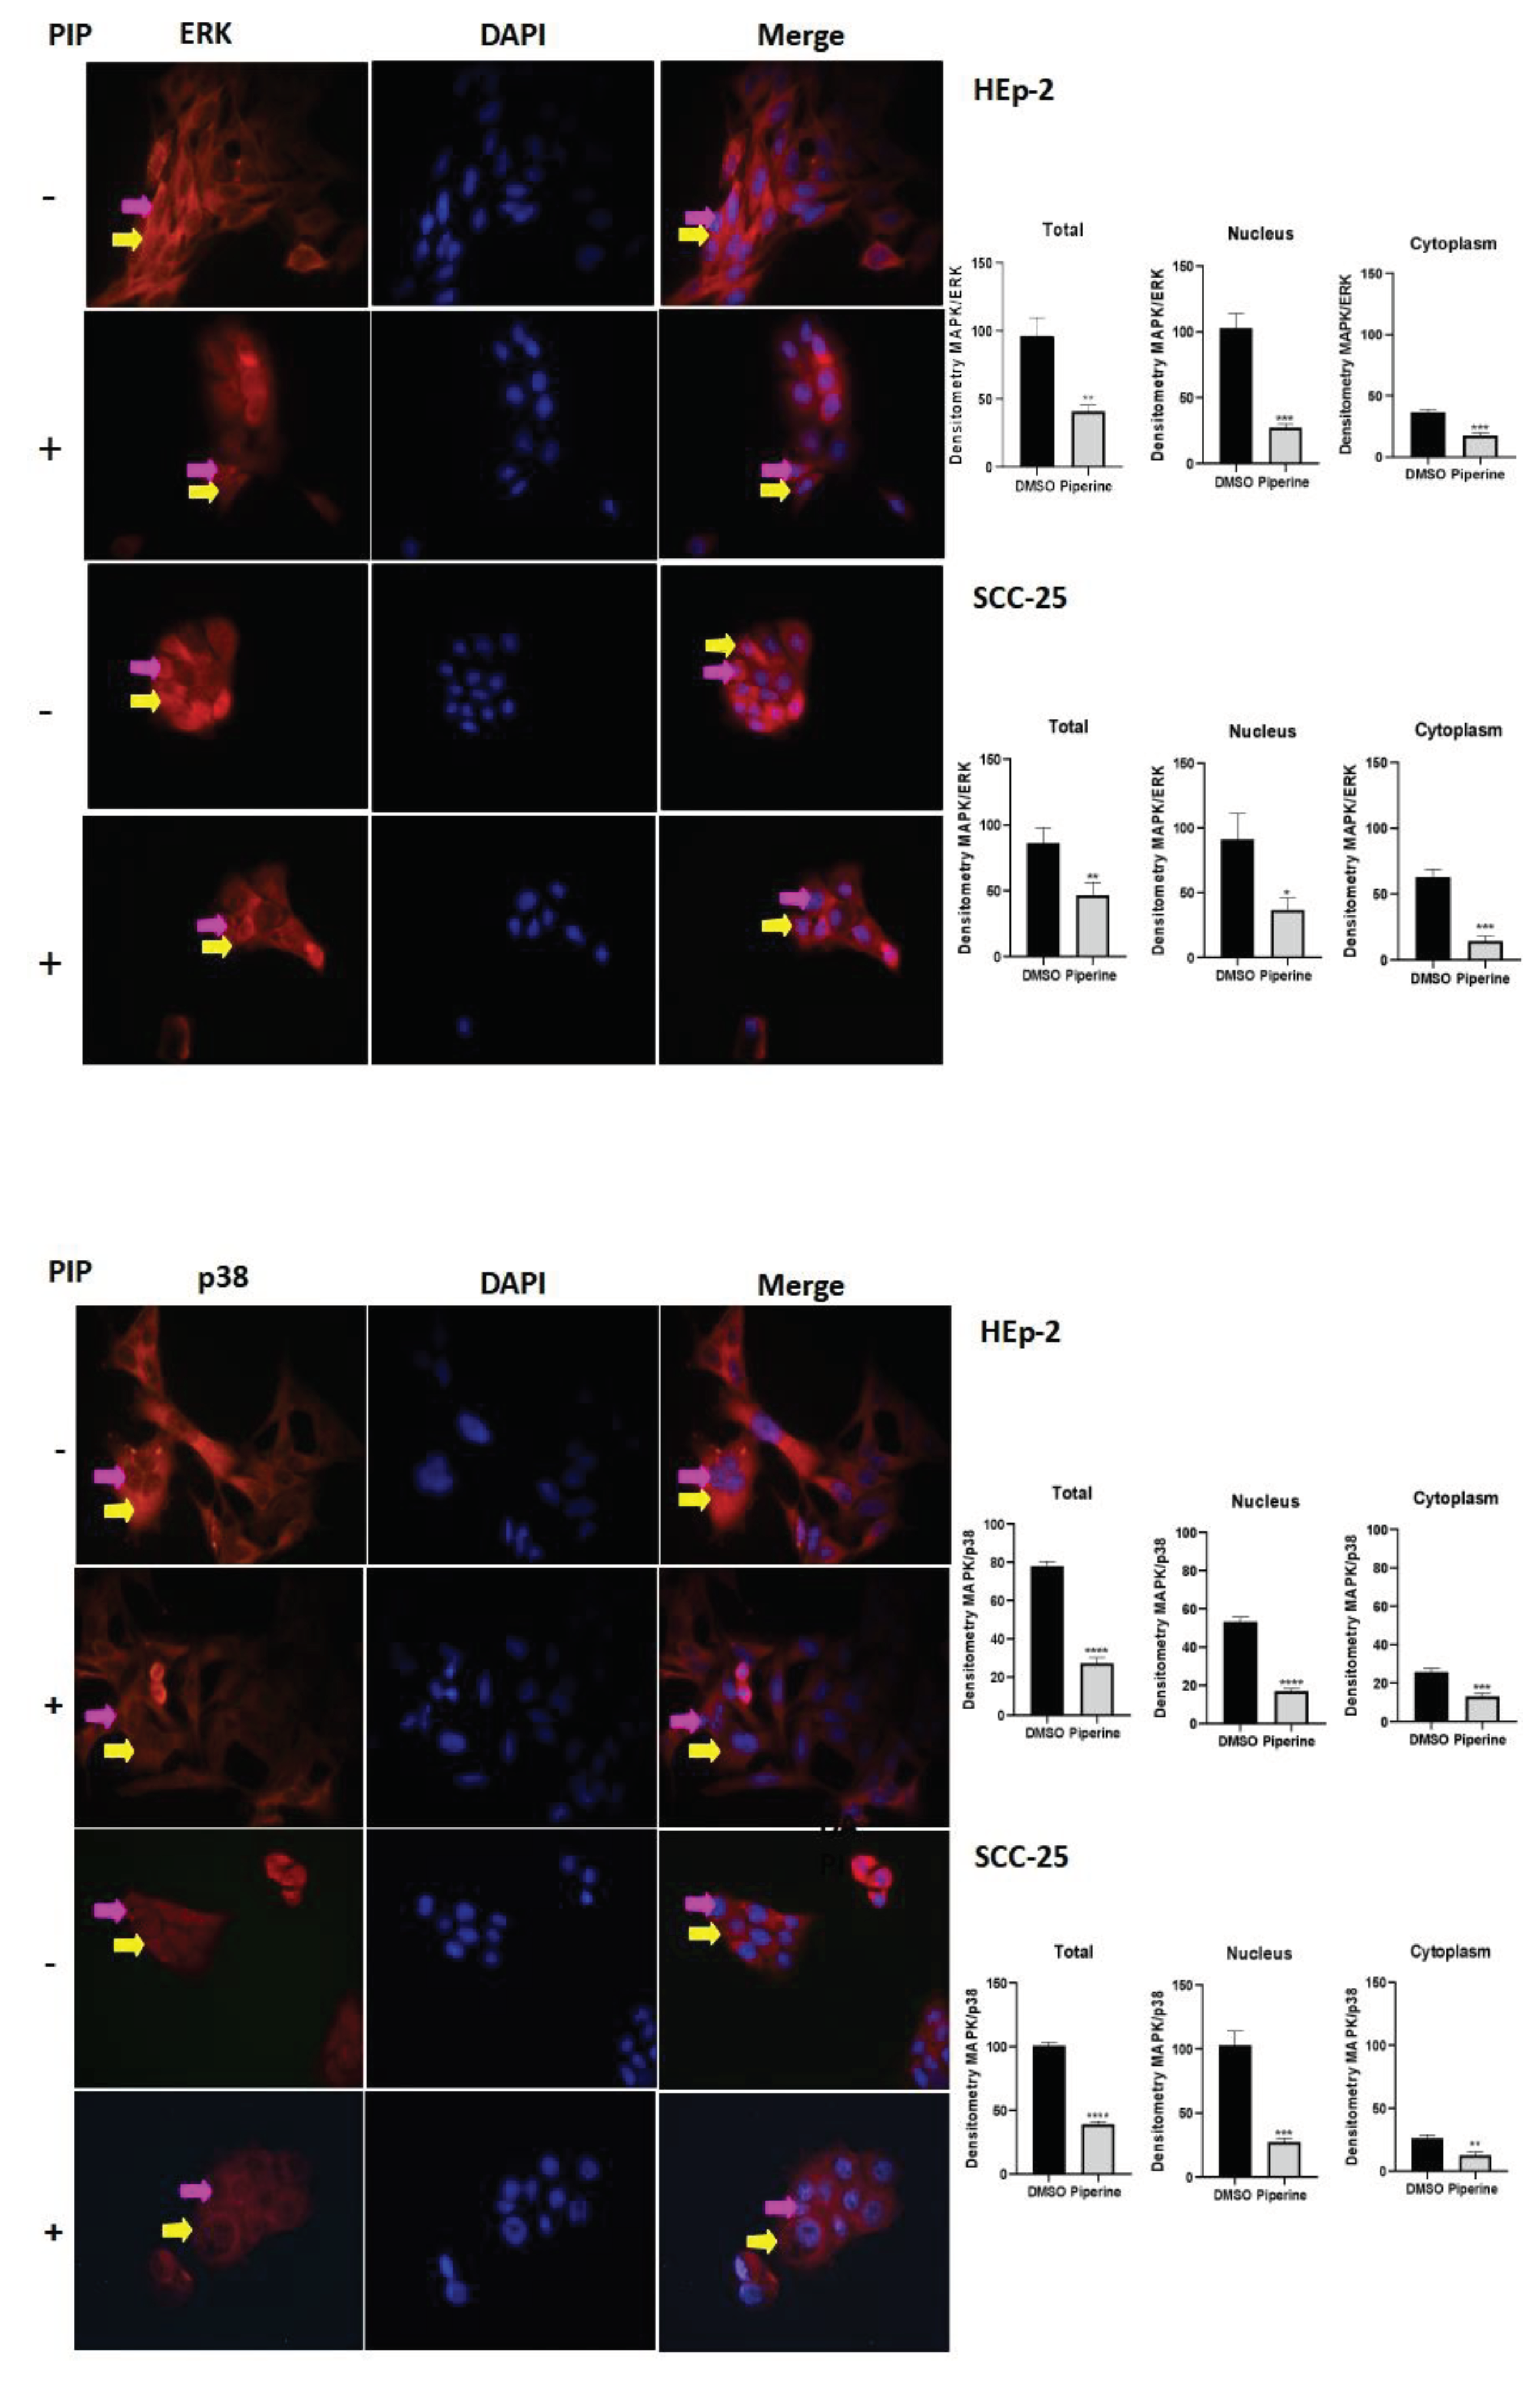
25]. In this respect, the secretion of the cytokines studied IL-8, IL-1β, IF-γ, and the expression of MAPKs (ERK and p38) were reduced following treatment with piperine, thus indicating a further mediating effect of this compound on HEp-2 and SCC-25 cells. Thus, our data corroborates other results from our research group, in which a decrease in cytokine levels (IL-8, IL-1β) and ERK and p38 was also observed in HeLa, SiHa and CaSki cervical cancer cells after treatment with piperine [
26]. Other studies also mention this action of piperine in decreasing the phosphorylation of ERK and p38 in breast cancer cells [
27], in addition, Western blot results confirmed that piperine decreased the phosphorylation of JNK and p38 in human ovarian cancer cells [
28].
Thus, piperine exerts its effects by modulating inflammation-mediating molecules such as genes, cytokines and proteins (MAPK, MMPs, PTGS2) via cyclooxygenase 2. In addition, this study provides a new understanding of the role of piperine in molecular events and signaling pathways that are directly related to the development of head and neck cancer.
Figure 1.
Growth curve of HEp-2 and SCC-25 cell lines (A), treated with piperine at three concentrations (100, 200 and 300 μM) for 4, 24, 48 and 72 hours. * p<0,05. Photomicrograph of the colony formation assay in HEp-2 and SCC-25 strains (B), after treatment with piperine [150 μM], after 24 hours, and graphs statistically representing colony formation, with comparisons of the control and piperine groups. *** vs control, p <0.0001.
Figure 2.
Photomicrographs of the morphology of control (A) and piperine-treated (B) HEp-2 cells. Control SCC-25 cells (C), and cells treated with piperine (D), at a concentration of 150 μM, over 24 hours. Graphs of cell viability (E) HEp-2 and (F) SCC-25, using the 7 concentrations tested (25 μM, 50 μM, 100 μM, 150 μM, 200 μM, 250 μM, 300 μM), at 4, 24, 48 and 72 hours. * with p<0.05. Figure (G) showing the effect of piperine in relation to cytotoxicity in HEp-2 and SCC-25 cells.
Figure 3.
Detection and statistical analysis of apoptosis (A). Treatment with piperine at a concentration of 150 μM, and a time of 24 hours, significantly increased the rate of apoptosis in HEp-2 laryngeal cancer cells and SCC-25 tongue cancer cells, as CV (Viable Cells), AI (Initial Apoptosis), AT (Late Apoptosis) and N (Necrosis). Comparison between groups, *p < 0.05. Cell cycle analysis (B). Treatment with piperine (150 μM over 24 hours) promoted cell cycle arrest in the Hep-2 and SCC-25 cancer cell lines. Comparison between groups, *p < 0.05.
Figure 4.
Evaluation of the genotoxicity assay, with photomicrographs and damage index of HEp-2 and SCC-25 cells treated with 150 μM of piperine at 24 hours. ** statistically significant difference between the treatment and the controls, with p≤ 0.05.
Figure 4.
Evaluation of the genotoxicity assay, with photomicrographs and damage index of HEp-2 and SCC-25 cells treated with 150 μM of piperine at 24 hours. ** statistically significant difference between the treatment and the controls, with p≤ 0.05.
Figure 5.
Transwell migration assay of Hep-2 and SCC-25 cells (A). Photomicrographs of cell migration of the control group of cells and those treated with piperine (150 μM), after 24 hours, and graphs representing densitometry. 200X magnification, 20μm scale. * with p<0.05. Graphs of MMP2 and MMP9 mRNA expression after piperine treatment compared to control in HEp-2 and SCC-25 cells (B). The dotted line (≥1.0 or ≤-1.0) is equivalent to the significant expression difference based on log 2. Graphs of MMP2 protein expression (C) assessed by Western Blot in HEp-2 and SCC-25 cells, after treatment with piperine [150 µM], at 24 hours in both assays.
Figure 6.
Graphs of PTGS2 and PTGER4 mRNA expression after piperine treatment compared to control in HEp-2 and SCC-25 cells (A). The dotted line (≥1.0 or ≤-1.0) is equivalent to the significant expression difference based on log 2. Graphs of the colorimetric ELISA assay for the analysis of cytokines/chemokines IL-8, IL-1β, IF-γ secreted by HEp-2 and SCC-25 cells, after treatment with piperine (150 µM), at the 24-hour time point in both conditions (B). * vs. control, p< 0.05. Graphs of PTGS2 protein expression (C) evaluated by Western Blot in HEp-2 and SCC-25 cells, after treatment with piperine [150 µM], at 24 hours.
Figure 7.
Immunocytochemistry of ERk/MAPK protein expression is indicated by a yellow arrow in the cytoplasm and a pink arrow in the nucleus. The graphs show the densitometry in each cell of the control (DMSO) and piperine [150 µM] treatment groups, at the 24-hour time point. * vs. control, p < 0.05, ** vs. control, p < 0.01, *** vs. control, p < 0.001. Immunocytochemistry of p38/MAPK protein expression is indicated by a yellow arrow in the cytoplasm and pink in the nucleus. The graphs show the densitometry in each cell of the control (DMSO) and piperine [150 µM] treatment groups, at the 24-hour time point. * vs. control, p < 0.05, ** vs. control, p < 0.01, *** vs. control, p < 0.001, **** vs. control, p < 0.001.

