Preprint
Article

Buckling Defect Optimization of Constrained Ring Rolling of Thin-Walled Conical Rings with Inner High Ribs Combining Response Surface Method with FEM

Altmetrics

Downloads

93

Views

18

Comments

0

A peer-reviewed article of this preprint also exists.

This version is not peer-reviewed

Submitted:

01 March 2024

Posted:

01 March 2024

You are already at the latest version

Alerts
Abstract
Buckling defect will appear on the outer surface of the deformed ring during constrained ring rolling (CRR) of aluminum alloy thin wall conical ring with inner high ribs (AATWCRIHR), if the geometrical dimension of the ribs doesn't match the wall thickness. To avoid the buckling defect, a quantitative method for characterizing the degree of the buckling defect is proposed using the area of buckling profile. Then an orthogonal experimental scheme was designed taking the width of the middle rib, thickness of wall, and height of the middle rib as design variables and defining the area of buckling profile as optimization objective. Subsequently, a quadratic polynomial response surface model was established by combining the optimization algorithm with the finite element method (FEM), and the geometrical dimension of the middle ribs of the deformed AATWCRIHR is optimized. Also the optimal parameter combination to minimize the area of buckling profile is obtained and verified using FE simulation. Results show that the AATWCRIHR after optimization doesn’t generate the buckling defect during constrained ring rolling, and it is proved that the quantitative buckling defect representation method and the optimization design method based on the response surface model and the finite element simulation results are feasible for the constrained ring rolling process of the AATWCRIHR.
Keywords: 
Subject: Engineering  -   Industrial and Manufacturing Engineering

1. Introduction

Thin-wall ring parts with high ribs made of aluminum alloy are the key components of aerospace equipment. Due to the structural characteristics of thin wall and high-rib, the material characteristics of low density, aluminum alloy thin wall conical ring with inner high ribs (AATWCRIHR) have the advantages of light weight, high strength and strong carrying capacity [1], and have been widely used in aerospace equipment such as rockets and high-speed aircraft [2].
At present, AATWCRIHR is manufactured using traditional machining technology and precision casting methods, which is of low material utilization rate and low strength, thus difficult to meet the higher performance requirement of aerospace equipment in the new era. The integral plastic forming manufacturing method is an effective way to achieve lightweight components and improve their performance [3]. As one of the precision plastic forming methods, the constrained ring rolling (CRR) process use the external constraint roll to restrict the radial flow of the material, and the upper and lower cover plates to restrict the axial flow of the material, which makes the metal flow along the radial by reducing the wall thickness of the ring billet while the outer diameter of ring billet keeps unchanged and is beneficial to the growth of high ribs, as shown in Figure 1. The constrained ring rolling (CRR) process has the advantages of high machining accuracy, small forming load, good performance of forming parts, and so on, and has great potential in forming thin-walled rings with high ribs [4,5]. There are still some problems such as insufficient rib filling and buckling defect in outer wall during the constrained ring rolling process of AATWCRIHR, which will affect the application of deformed component. As a result, some measures must be taken to avoid these problems in order to guarantee the forming quality. Aiming at all kinds of problems in the forming process, many scholars currently combine finite element simulation and various optimization algorithms to find the most suitable process design scheme with lower cost and higher forming quality [6].
Zhao et al. has proposed an optimization algorithm for the design of preforms and promoted the application of optimization algorithms in preforms [7]. Fourment et al. combines finite element simulation with optimization algorithm, and can successfully solve problems such as flow uniformity of metal materials by using different objective functions [8]. Kusiak et al. introduced gradient-free technology into the design of preform dies, which improves the efficiency of preform optimization design to a certain extent [9]. Box and Wilson et al. combined mathematical methods with statistical methods to propose the response surface method (RSM), which greatly improved the computational efficiency and has been widely used in the field of plastic forming [10]. Gheyserian et al. combined the finite element simulation method with the response surface method, taking surface roughness, maximum thickness change, forming time and forming force as optimization objectives, and obtained the best process parameters in incremental sheet metal forming process [11]. Vishal et al. combined response surface tables and analysis of variance to determine the greatest influence on part formability and surface roughness in the single point incremental forming process of aluminum alloys [12]. Pan et al. used the response surface method to optimize the friction coefficient, pressure rate and fillet radius of the die in the process of hydromechanical deep drawing, and obtained the best conditions to meet the maximum thinning rate. The reliability of the optimized results was verified by process experiments [13]. Li et al. used the thickness of the patched blank, the distance between the welding spot, the external contour of the patched blank, and the number of welding spots as optimization variables, analyzed the influence of the distribution of welding spots on the quality of welding. The optimized welding spots arrangement method was used to carry out the process experiment, and the parts with high forming quality were obtained [14]. Based on the finite element method and Taguchi method, Feng et al. optimized the component damage value, maximum forging force and mold filling quality during the warm forging process of spiral gear, and the optimal parameter combination was obtained through signal-to-noise ratio analysis and variance analysis, also the actual experimental results are in good agreement with the predicted values. The feasibility of the optimization method is verified [15,16]. Francy et al. optimized the extrusion parameters based on Taguchi method for aluminum alloy cold extrusion forming, and verified the theoretical results, and concluded that the extrusion ratio is the most significant factor affecting the extrusion pressure [17]. Based on finite element numerical simulation, Li et al. took extrusion pressure and velocity field standard deviation as optimization objectives to study the extrusion deformation behavior of 2195Al-Li alloy, and obtained the best combination of extrusion process parameters [18]. Luo et al. has designed orthogonal experimental to study the warping problem in the injection molding process of automotive plastic wings, and established BP neural network by genetic algorithm for global optimization, and obtained the best parameter combination of plastic wings injection molding process [19]. Hosseini et al. used the Taguchi method to optimize the critical thickness of aluminum alloy during forward extrusion and obtained the optimal level of waste minimization [20].
In this paper, the buckling defect area was used to characterize the degree of buckling defect quantitatively and the main factors affecting the degree of buckling defect were analyzed. An orthogonal test tables were designed and finite element numerical simulation was carried out and a response surface model was established by defining the height, width and thickness of the ribs as the design variables and the buckling defect area as the optimization objective. Through the combination of response surface method and finite element simulation, the influence of different parameters on the degree of defect is analyzed and the optimal parameter combination without buckling defect is obtained.

2. Optimization Method

2.1. Establishment of Finite Element Model of Constrained Ring Rolling of AATWCRIHR

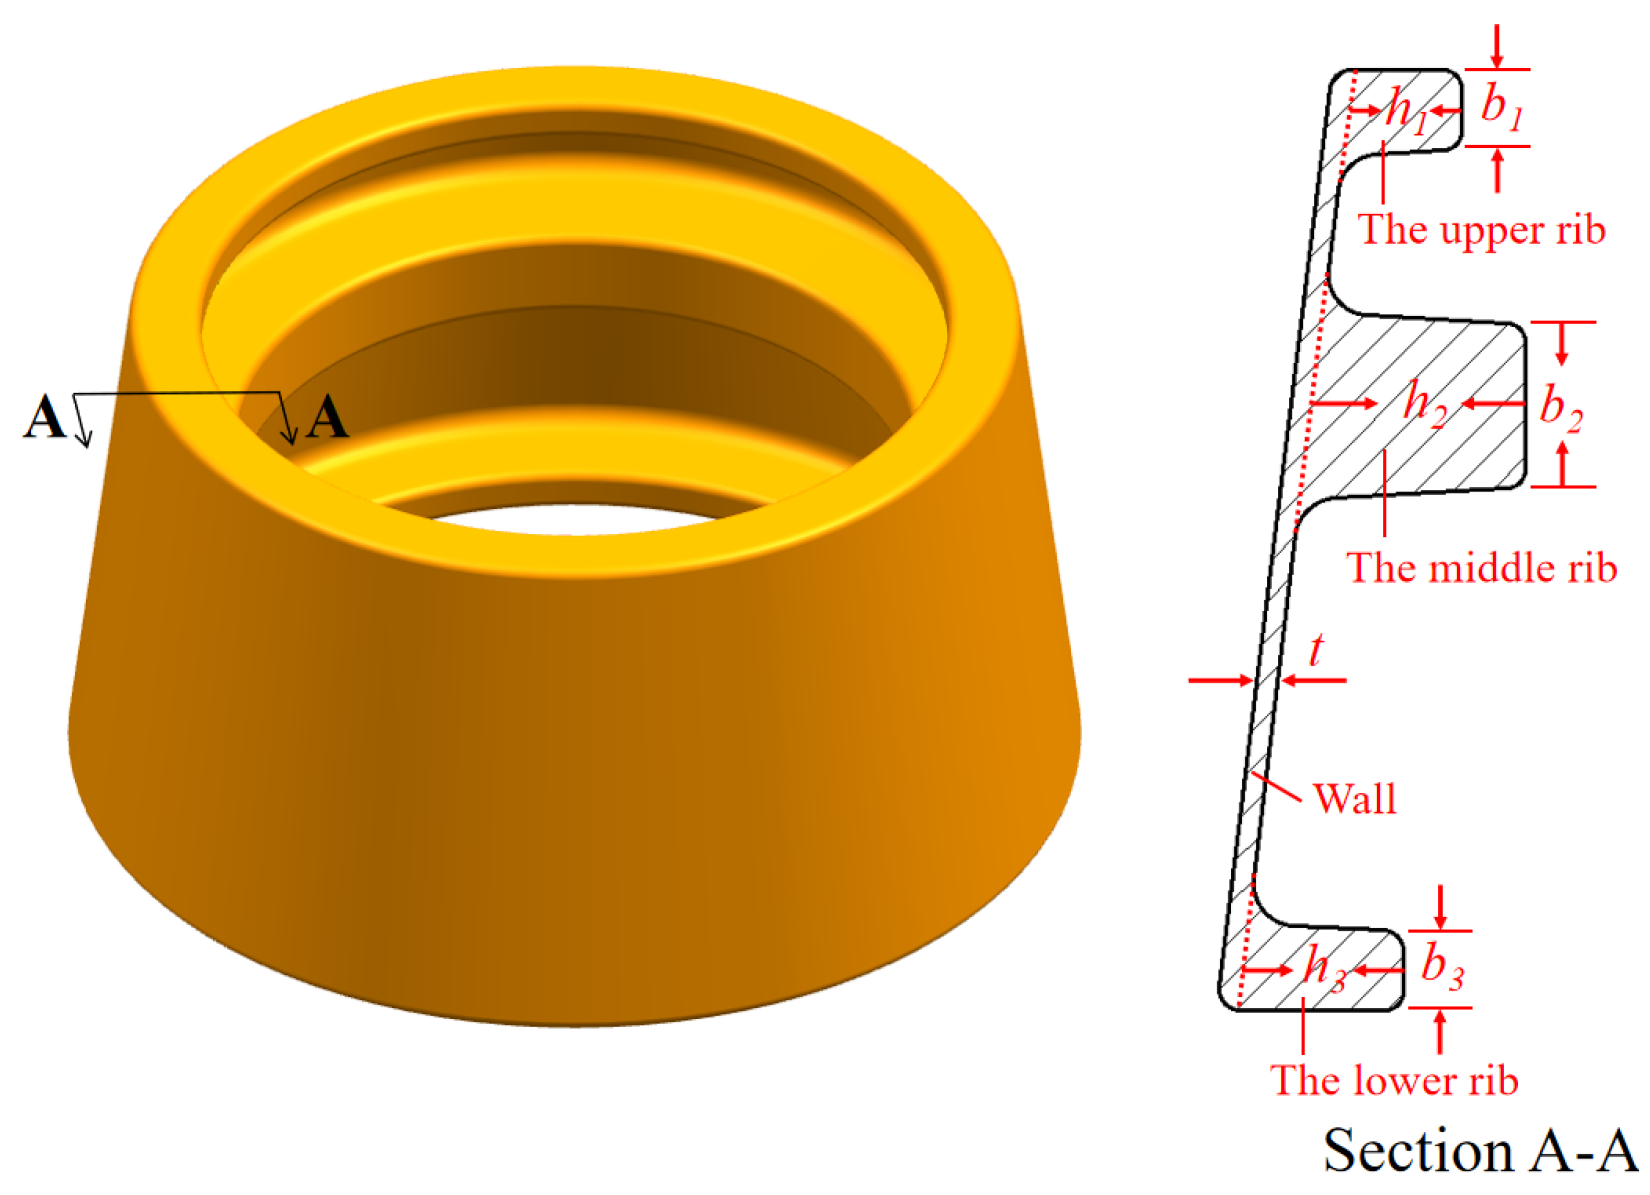
In this paper, AATWCRIHR with three ribs are taken as the research object. Figure 2 shows the main structural features and the main dimensions of AATWCRIHR. Three horizontal high ribs are arranged the inner wall of the conical ring. The three ribs are of different height and width, and their values are as follows: the thickness of wall t is 5mm, the widths of three ribs b1, b2, and b3 are 19mm, 40mm, 19mm respectively, and the heights of three ribs h1, h2, and h3 are 27mm, 51mm, 38mm respectively.
DEFORM-3D software was used to simulate the constrained rolling process of the thin-walled conical ring with high ribs. Based on the principle of constrained ring rolling process, a finite element model was established, as shown in Figure 3. The rolling roll carries on the radial feed motion and exerts radial force on the conical ring billet, and causes local deformation of the conical ring billet. The constraint roll rotates actively around the central axis and drives the conical ring billet to rotate at the same angular velocity under the action of friction. Under the radial extrusion of the rolling roll and the radial constraint of the constraint roll, the metal billet flows along the radial direction to promote the formation of the three ribs. The conical ring billet is made of 2219 Aluminum alloy and the initial deformation temperature is set to 450°. All molds are made of H13 steel and an initial preheating temperature of 300°. The conical ring billet and all molds are defined as plastic body and rigid body, respectively. The radial feed speed of the rolling roll is set to 0.25 mm/s, and the rotation angular speed of the constraint roll is set to 2π. The friction coefficient between billet, rolling roll and constraint roll is set to 0.3, and the heat transfer coefficient is set to 11 N/s/mm/℃.

2.2. Evaluation Criteria of Buckling Defect

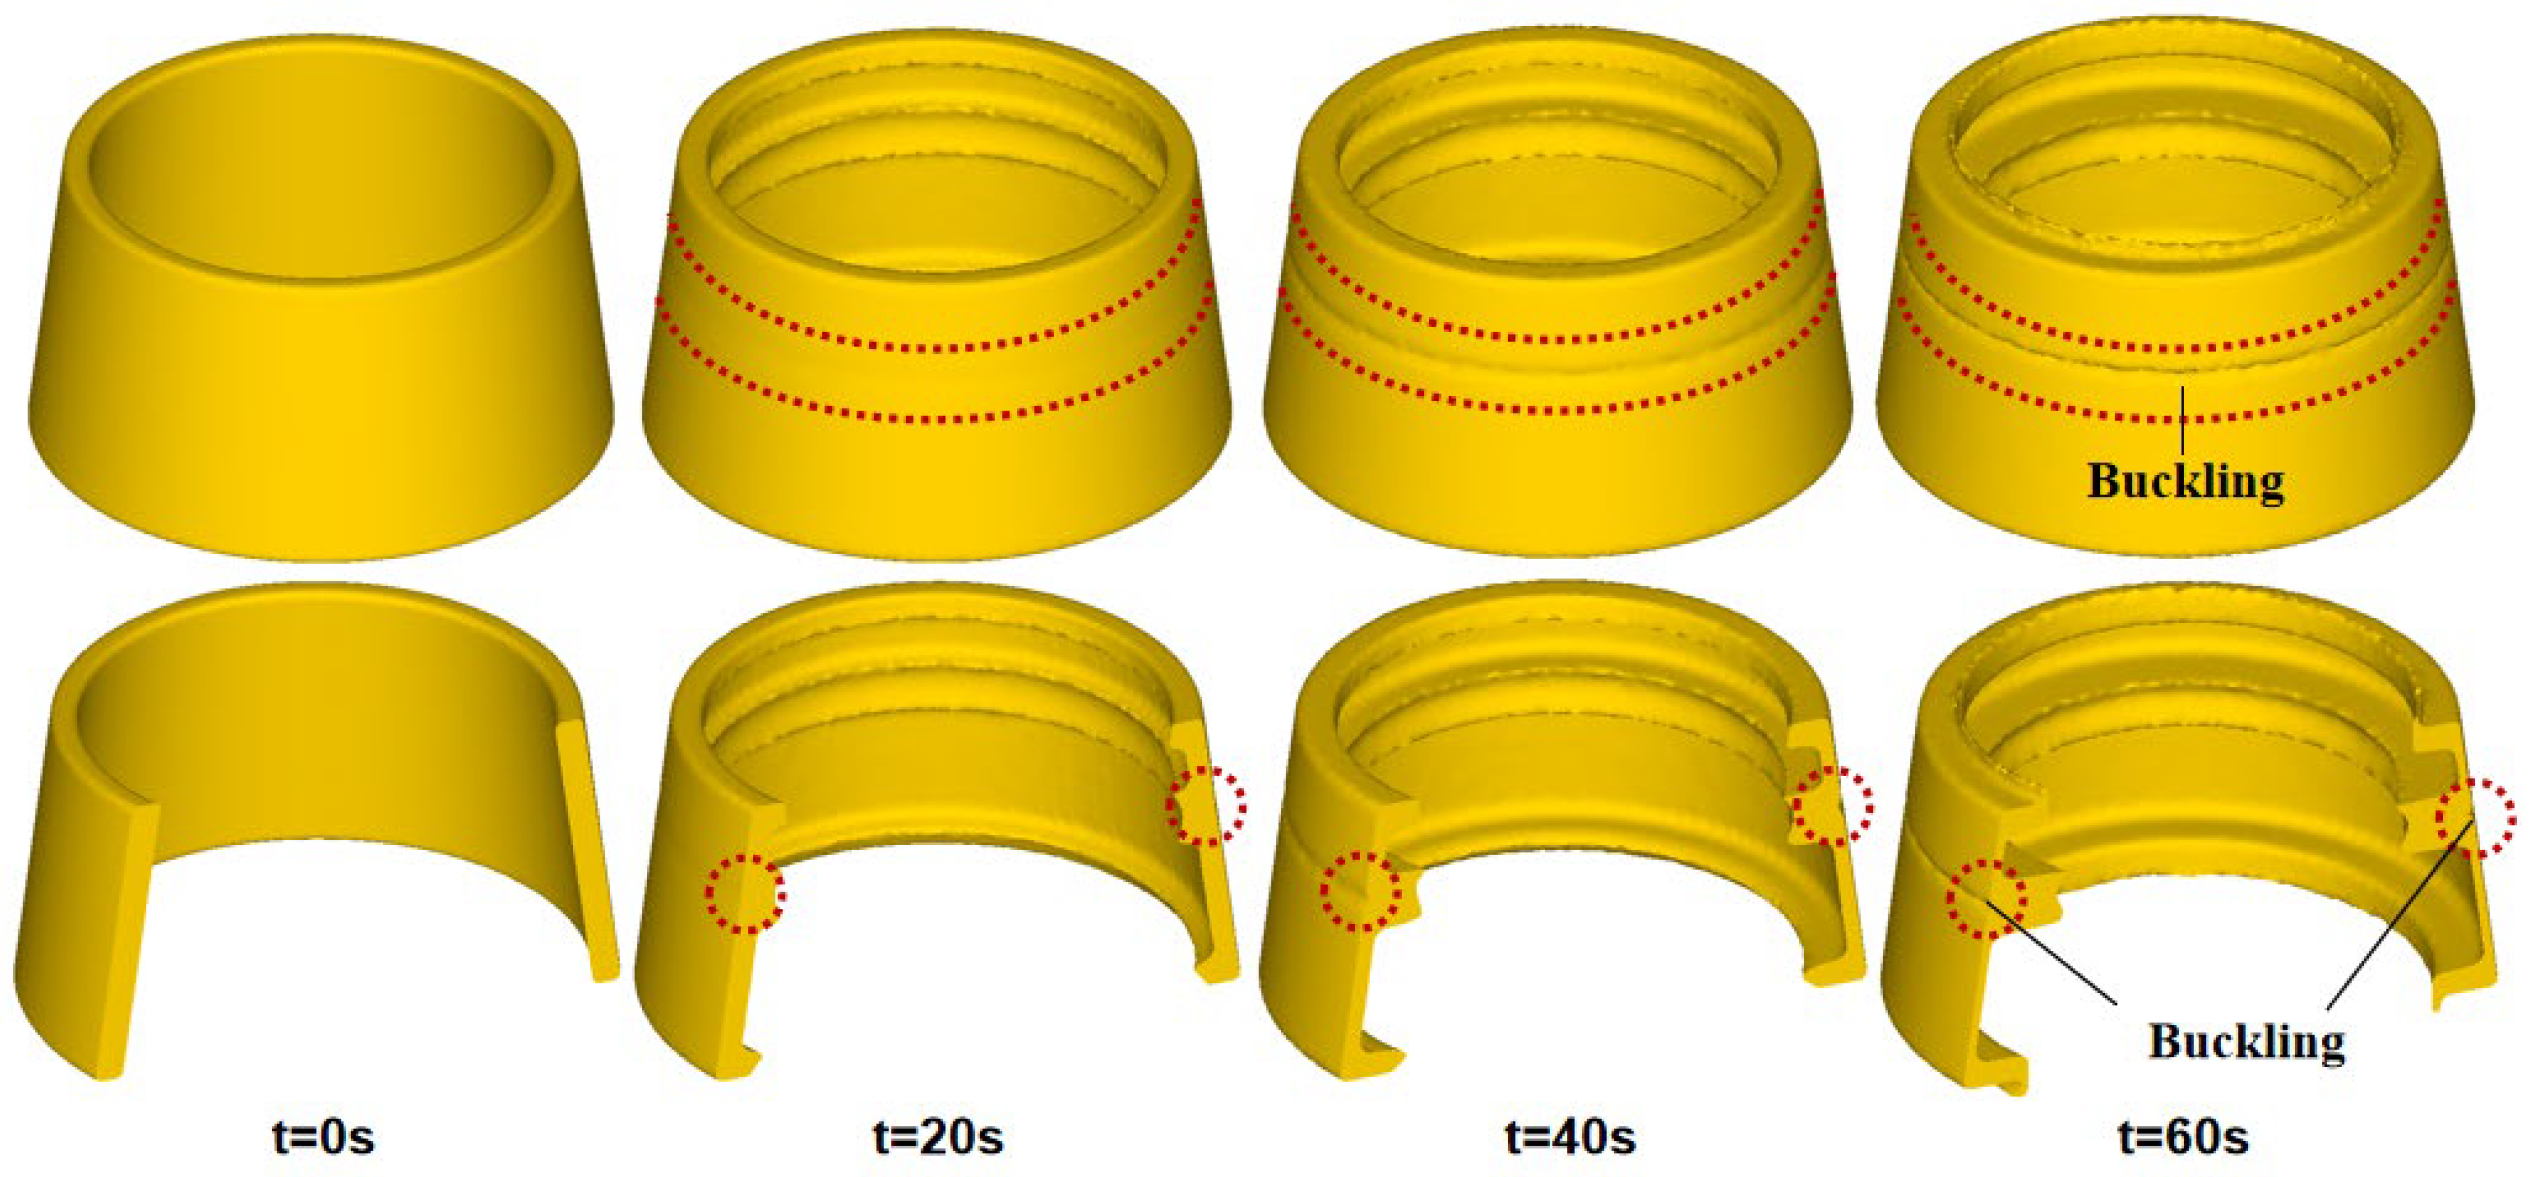
The result of finite element simulation of rolling process is shown in Figure 4. It can be seen that the conical ring is in good shape without instability defect, and the inner horizontal ribs gradually increases with the increase of rolling time, and the filling effects of three ribs is good. However, the outer surface of the middle rib began to appear circular buckling defect phenomenon in the middle stage of the rolling process, and the buckling degree increased gradually with the increase of rolling time.
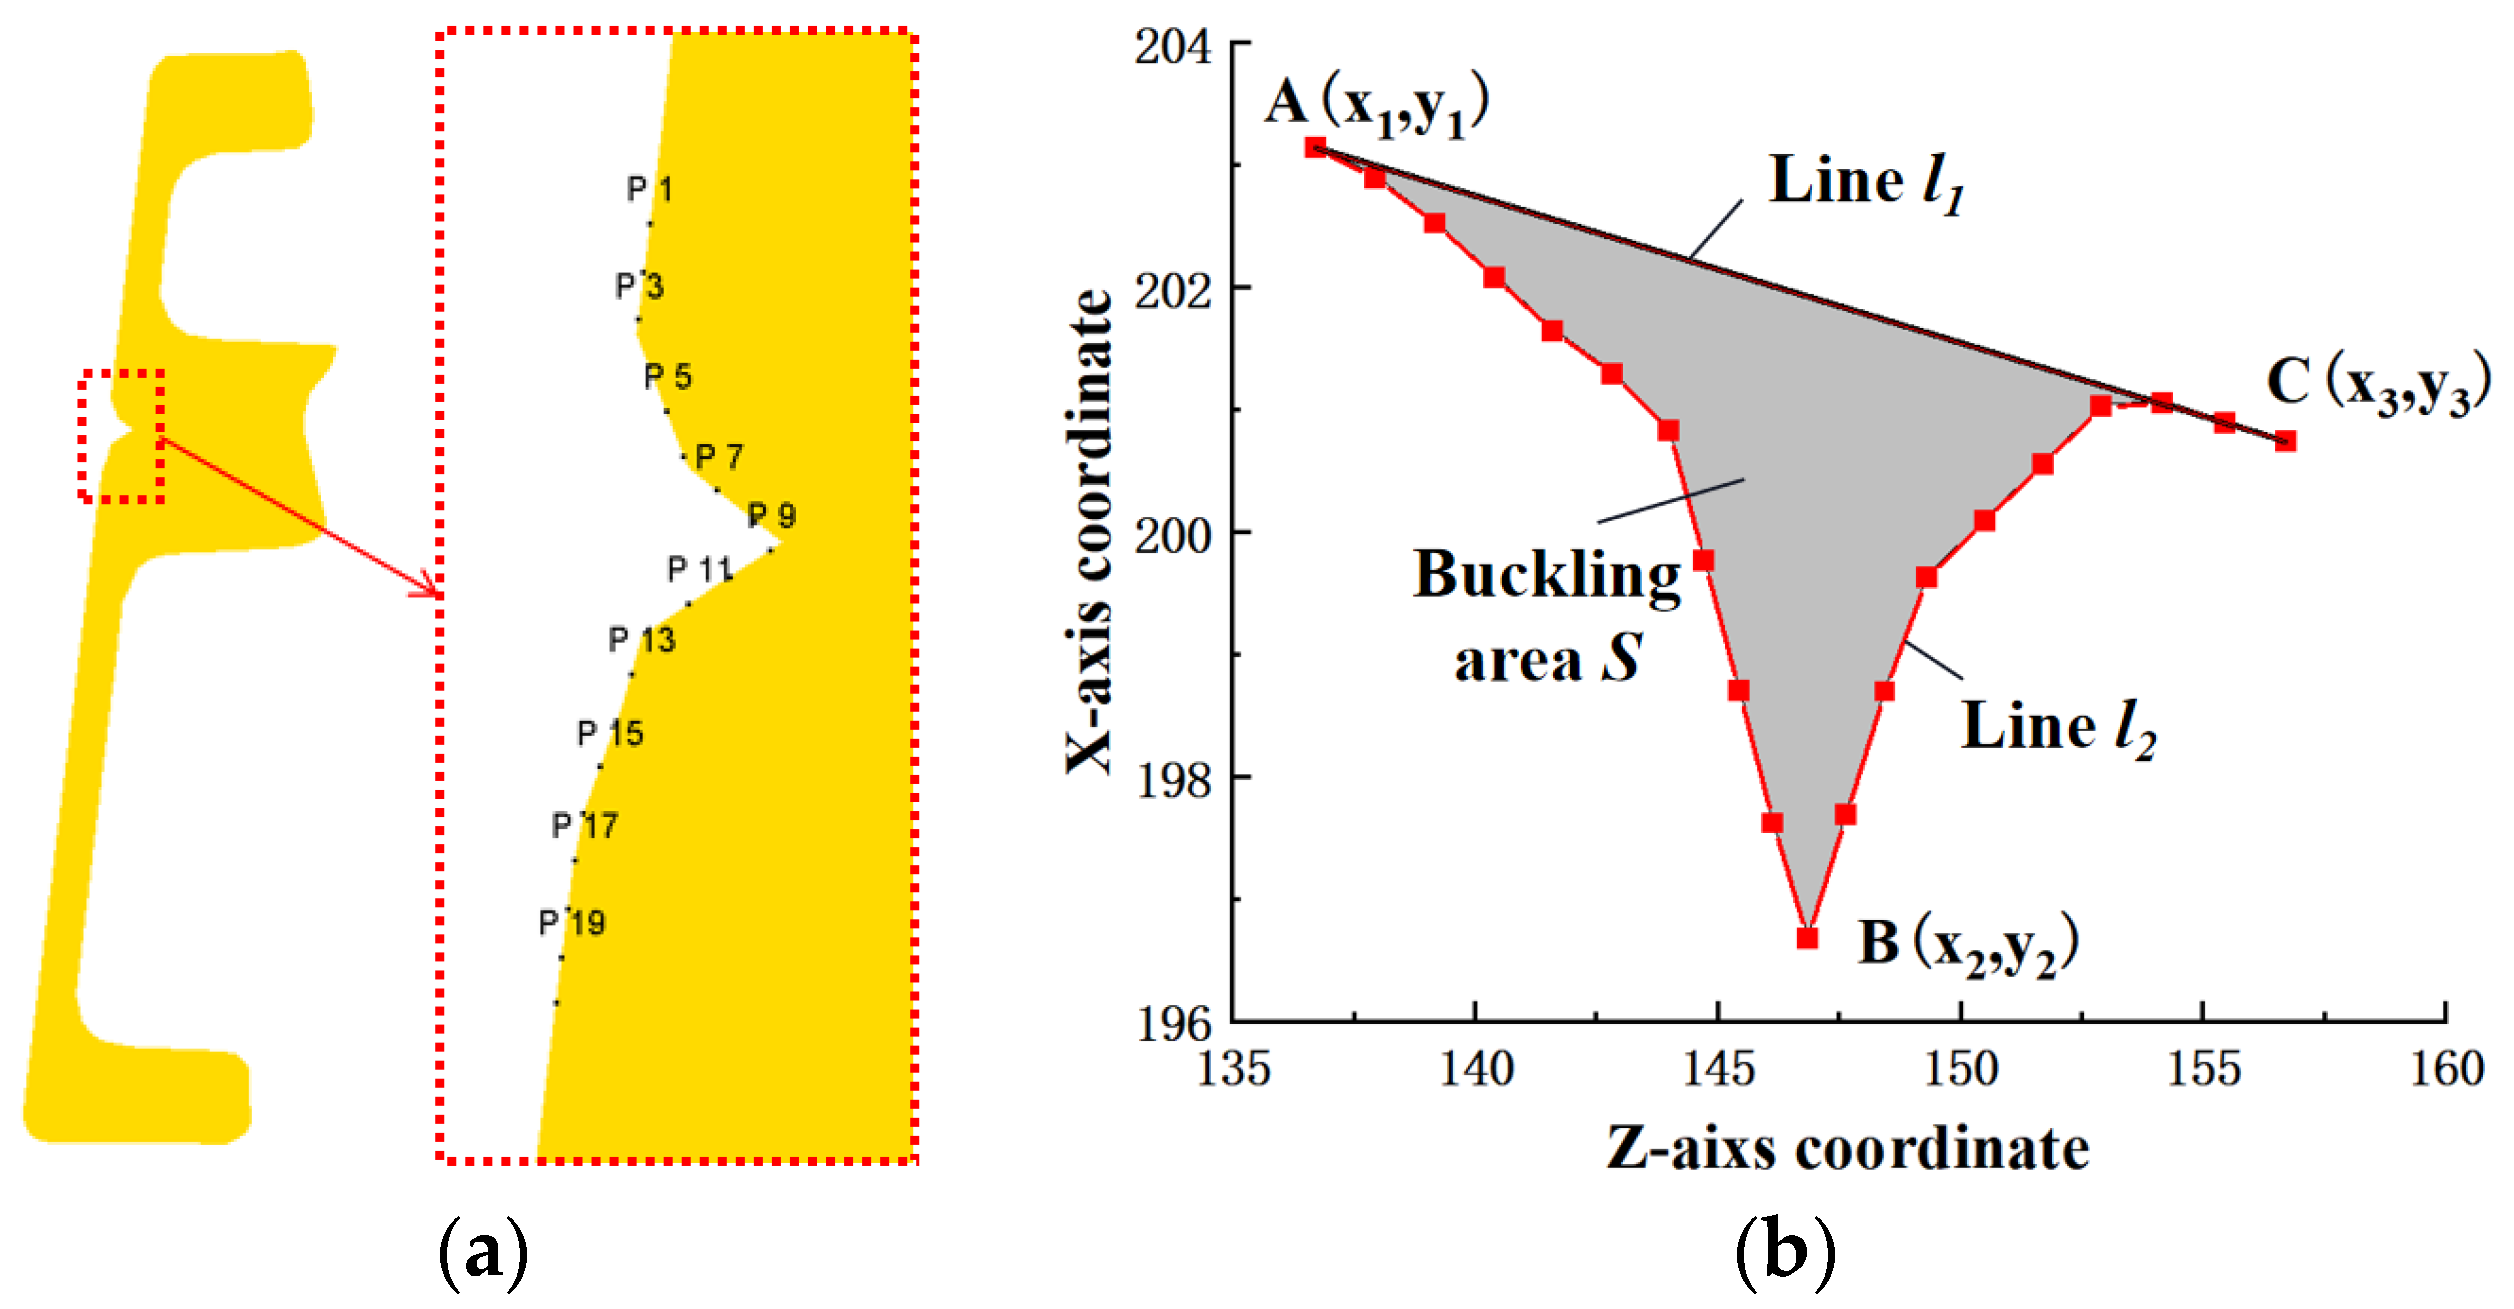
In order to quantitatively analyze the degree of buckling defect and to study the influence factor of buckling defect formation, a calculation method is proposed by measuring the area of buckling profile under different rolling time. When the buckling defect appears on the outer surface of the part, random axial section of the deformed conical ring is obtained and the profile of buckling defect can be shown based on the simulation results of the CRR process by the finite element software, as shown in Figure 5a. Dozens of points is taken along the profile of buckling, the location information of these points are extracted and the boundary curve l2 and l3 of the buckling is drawn, as shown in Figure 5b. The straight line l1 is the initial outer surface profile of the conical ring billet at the beginning of rolling process. The area enclosed by straight lines l1, boundary curve l2 and l3 is used to quantitatively represent the degree of buckling defect. In Figure 5b, point B is the point with the greatest degree of buckling, and point A and point C are the junction points between the buckling zone and the non-buckling zone.
The straight line l1 can be expressed by Equation (1):
y 1 = a x + c [ x x 1 , x 3 ]
where a, c are constants, x1, x3 are X-axis coordinates of point A and C, respectively.
The expression of the boundary curve l2 and l3 are shown in Equation (2) and (3), respectively.
y 2 = a 1 x 2 + b 1 x + c 1 [ x x 1 , x 2 ]
y 3 = a 2 x 2 + b 2 x + c 2 [ x x 2 , x 3 ]
where a1, a2, b1, b2, c1, c2 are constants, x2 is X-axis coordinate of point B.
The expression of the area of buckling profile S can be given in Equation (4) by integral method.
S = x 1 x 3 l 1 d x x 1 x 2 l 2 d x x 2 x 3 l 3 d x [ x ( x 1 , x 3 ) ]
Constants a, c, a1, a2, b1, b2, c1, c2 of equation (1), (2) and (3) can be determined according to the simulation results, then the area of buckling profile S can be calculated using equation (4), and the degree of buckling defect can be analyzed quantitatively, which will facilitate subsequent buckling defect optimization, thus the forming quality of AATWCRIHR can be improved.

2.3. Determination of Experimental Scheme

Based on the above results of finite element simulation, it is found that buckling defect is consistently located on the back of the middle rib throughout the CRR process, also the height and the width of the middle rib is largest and the material flow behavior is the most complicated in the process of forming the high ribs by reducing the wall thickness. Therefore, it is preliminarily determined that the width and height of the middle rib and the thickness of wall are three factors affecting the degree of buckling when other deformation process conditions are certain. In order to find the optimal design scheme of geometric dimensioning for AATWCRIHR without buckling defect or with the smallest degree of buckling defect, three factors, namely the width of the middle rib b2, the thickness of the wall t of the conical ring billet and height of the middle rib h2, were taken as independent design variables, four levels were selected for each factor, and the area of buckling profile S was selected as the optimized objective function. The smaller the S is, the more unlikely the deformed AATWCRIHR to generate buckling defects in the constrained ring rolling, and the better the manufactured AATWCRIHR quality will be. An orthogonal experimental table with three factors and four levels was designed, as shown in Table 1.

3. Results and Analysis

3.1. Orthogonal Experimental Analysis

16 groups of experiments are designed according to the orthogonal experiment table selected, and the finite element simulation was carried out for each group of experiments. The buckling defect contour information was extracted on the basis of the finite element results of each group, and the area of buckling profile S was calculated by equation (4). The orthogonal experimental data and calculation results are shown in Table 2. Range Rs can be used to judge the merits and demerits of each factor. The larger the value of Rs is, the greater the influence of the factor on the objective function S is. It can be seen from Table 2 that factor A has the largest Rs-value, factor B follows, and factor C has the smallest Rs-value. So, the most important factor affecting the degree of buckling defect is the width of the middle rib, the thickness of the wall is a secondary factor, and the height of the middle rib has a relatively small influence on the degree of buckling defect.

3.2. Orthogonal Experimental Level Analysis

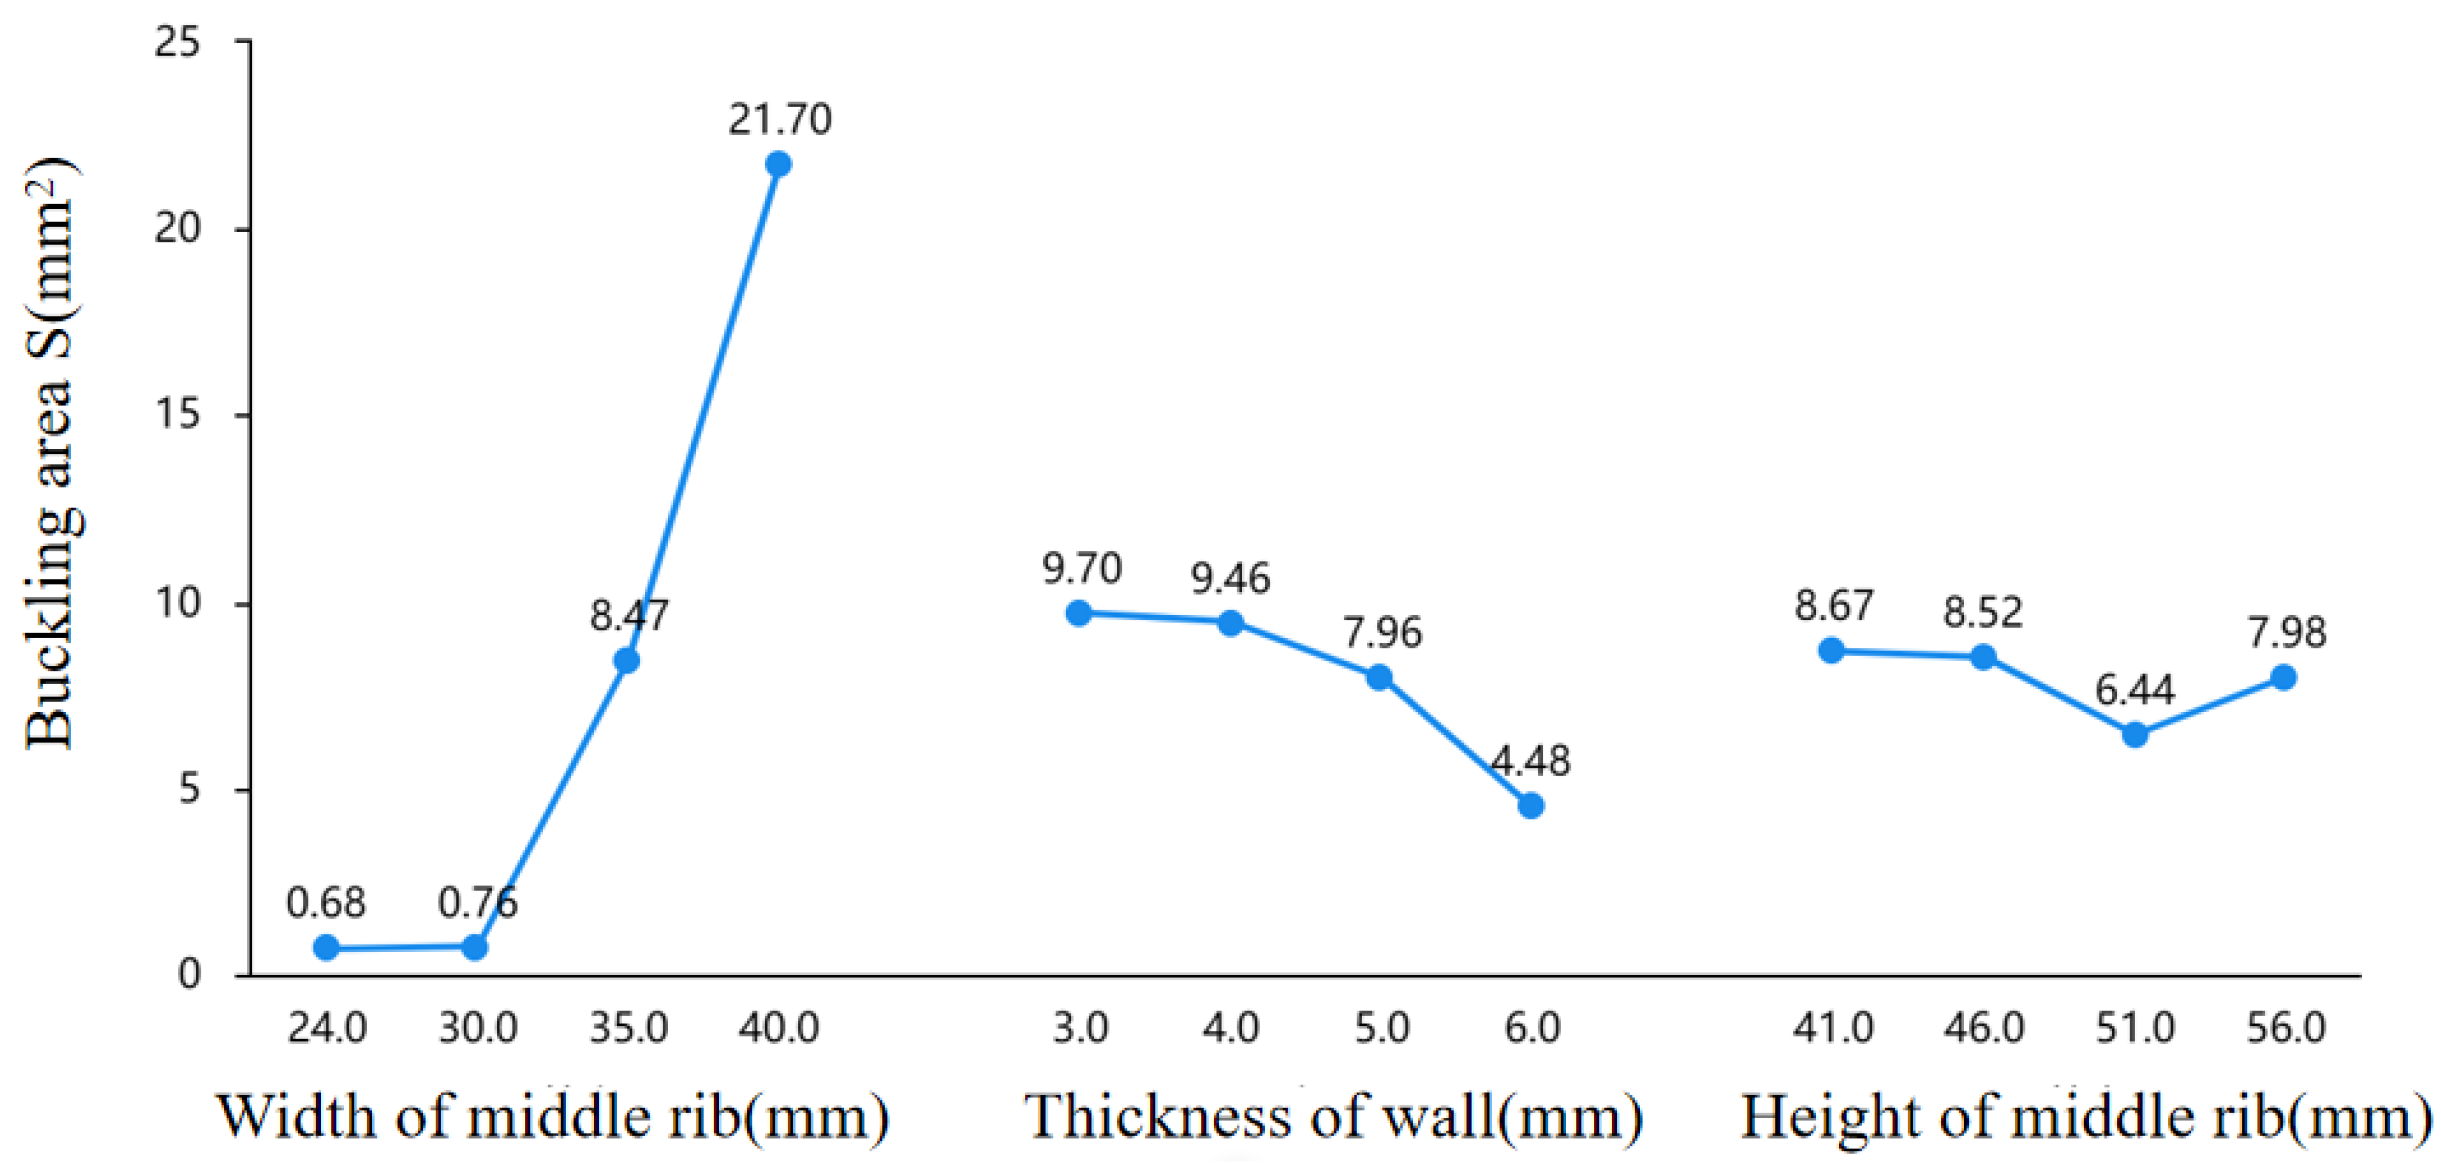
According to the orthogonal experimental data shown in Table 2, the variation graph between factors level and optimization objective S can be derived, as shown in Figure 6. As can be seen from the figure, when the width of the middle rib is 24 mm, the wall thickness is 6mm, and the height of the middle rib is 51 mm, the area of buckling profile S is the smallest, that is the degree of buckling defect on the back of the middle rib is the lowest. So the optimal factor level combination is A1B4C3. When the width of the middle rib is 40 mm, the wall thickness is 3 mm, and the height of the middle rib is 41 mm, the buckling area is the largest, and the degree of buckling defect is the worst level.

3.3. Establishment of Response Surface Model

Response Surface Model (RSM) is an approximate method to build a response surface model and predict and optimize the response value by fitting the experiment results under different experimental scheme. In this paper, the second order polynomial response surface model is chosen as an approximate model to predict the relation among objective function S and design variable in constrained ring rolling of AATWCRIHR by FE simulation.
Based on the simulation results shown in Table 2, regression analysis method was adopted to establish a regression model between the area of the buckling profile S and the width of the middle rib, the wall thickness and the height of the middle rib, as shown in equation (5). This model can be used to predict the degree of the buckling defect during constrained rolling of thin-walled conical rings with inner transverse ribs under different width and height of the middle rib and the thickness wall.
S = 90.888-5.5069*A+14.4967*B-2.0632*C-0.315*A*B+0.0035*A*C+0.0019*B*C+0.1262*A2-0.9025*B2+0.0185*C2

3.4. Analysis of Variance (ANOVA)

Analysis of Variance (ANOVA) was used to analyze the significance of primary terms, interaction terms and square terms in the regression model, and the results were shown in Table 3. As can be seen from Table 3, the F value of the model is 104.82, and the P value is < 0.0001, indicating that the regression model has reached a very significant level and the model fitting accuracy is high. In addition, the correlation coefficient R2, the modified coefficient of determination Rpred2 and the model prediction coefficient Radj2 are also commonly used to test the degree of fit of regression models. Generally speaking, the larger the R2 is, the higher and closer the values of Rpred2 and Radj2 are, the higher the degree of fitting and the more accurate the regression model is. As can be seen from Table 3, the fitting degree of the model reaches 99.37%, and the values of Rpred2 and Radj2 are 0.9842 and 0.9355, respectively, which are very close, indicating that the regression model has high accuracy and can better describe the relationship between the objective function S and the design variables A, B and C.
The larger the F value and the smaller the P value, the more significant the correlation coefficient is. From the F value and P value of each factor in Table 3, it can be seen that the P value of the primary term A and the square term A2 < 0.0001, reached the very significant level, indicating that factors A and A2 have a very significant effect on the degree of buckling defect. P values of primary terms B, C and interaction term AB < 0.05, which reached a significant level, indicating that factors B, C and AB had a significant effect on the degree of buckling.

3.5. RSM Analysis

In order to directly analyze the influence of design variables A, B and C on the response variables S in the constrained rolling process of AATWCRIHR, the relationship between significant variables A and B and the response variables S was described by using a three-dimensional surface diagram, as shown in Figure 7. As can be seen from Figure 6, when the width of the middle rib is larger, ranging from 32 to 40 mm, the buckling area is also larger, so the degree of buckling defect becomes more significant with the decrease of the wall thickness. When the width of the middle rib is smaller, ranging from 24 mm to 32 mm, the thickness of the wall has little influence on the buckling defect, and the buckling area is small and the degree of buckling defect is light.

4. Verification Model

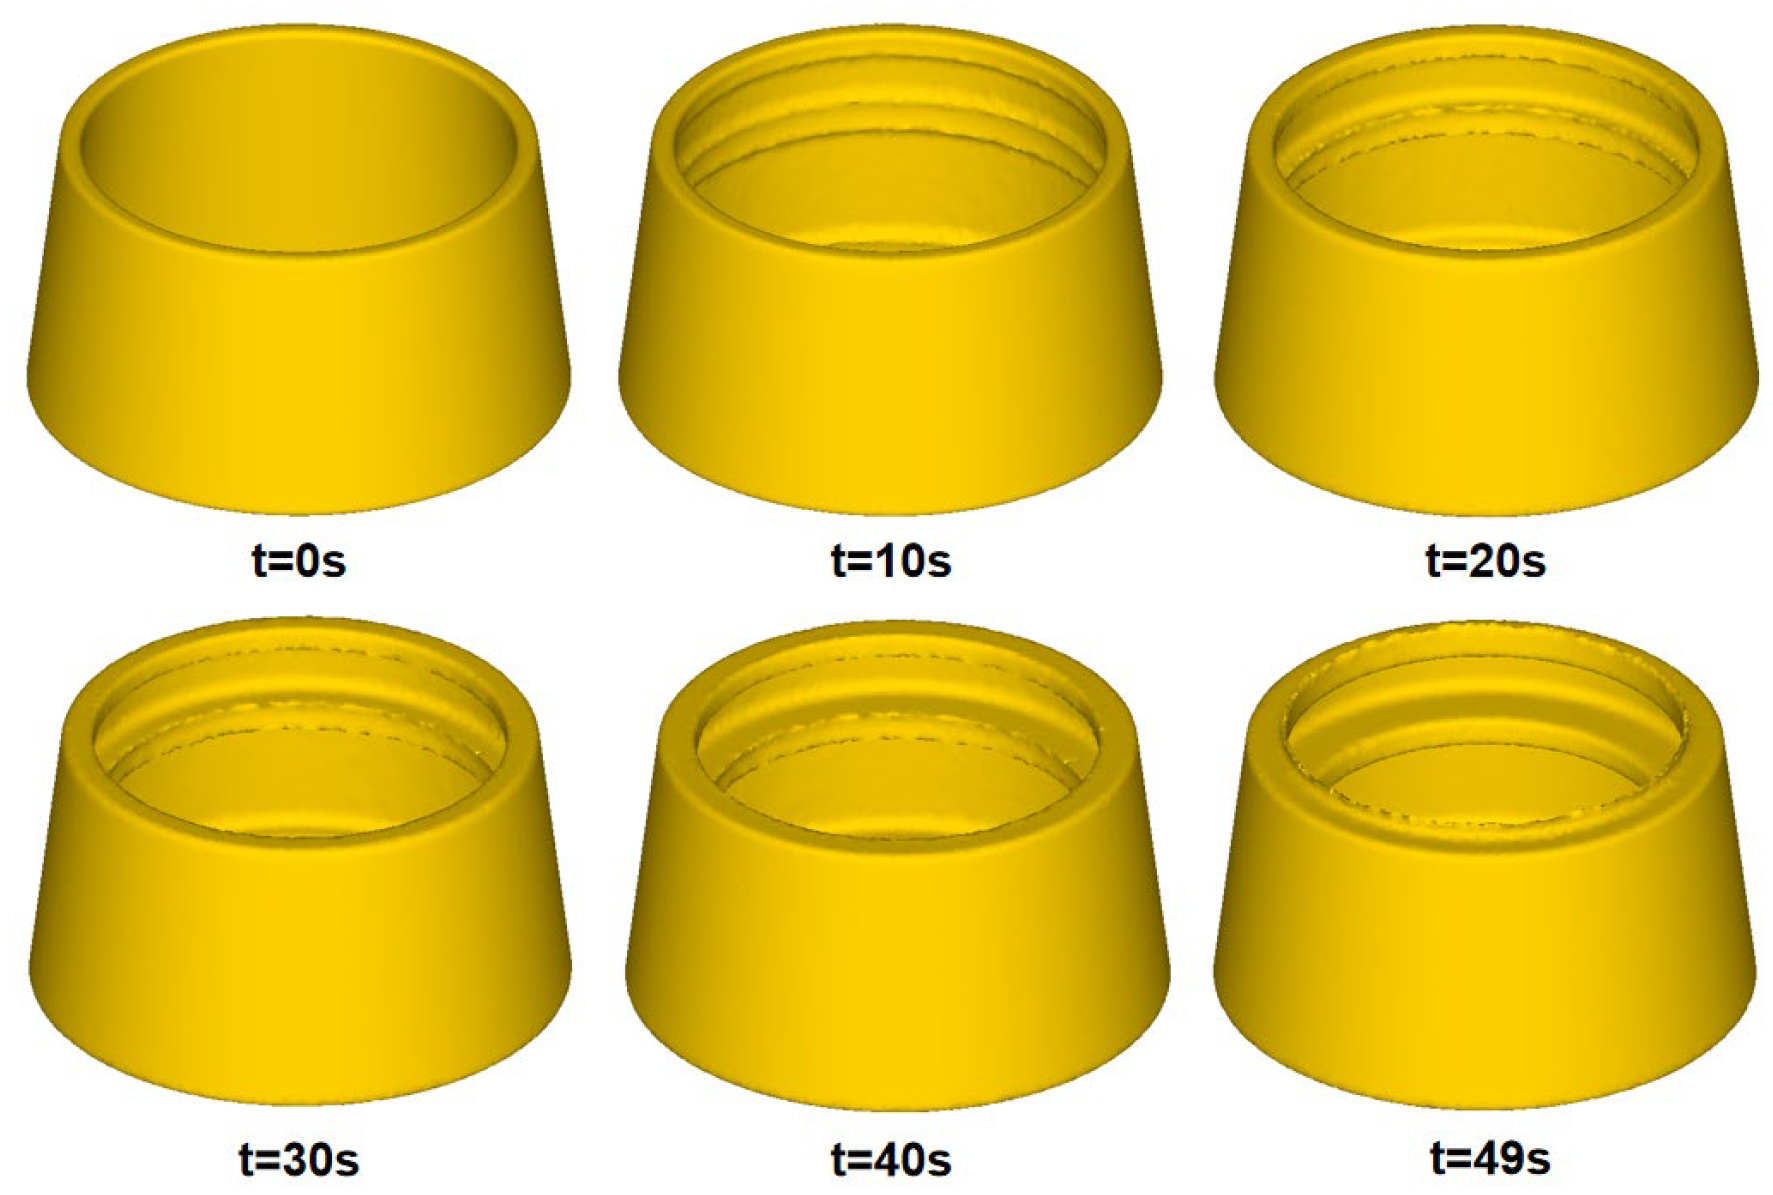
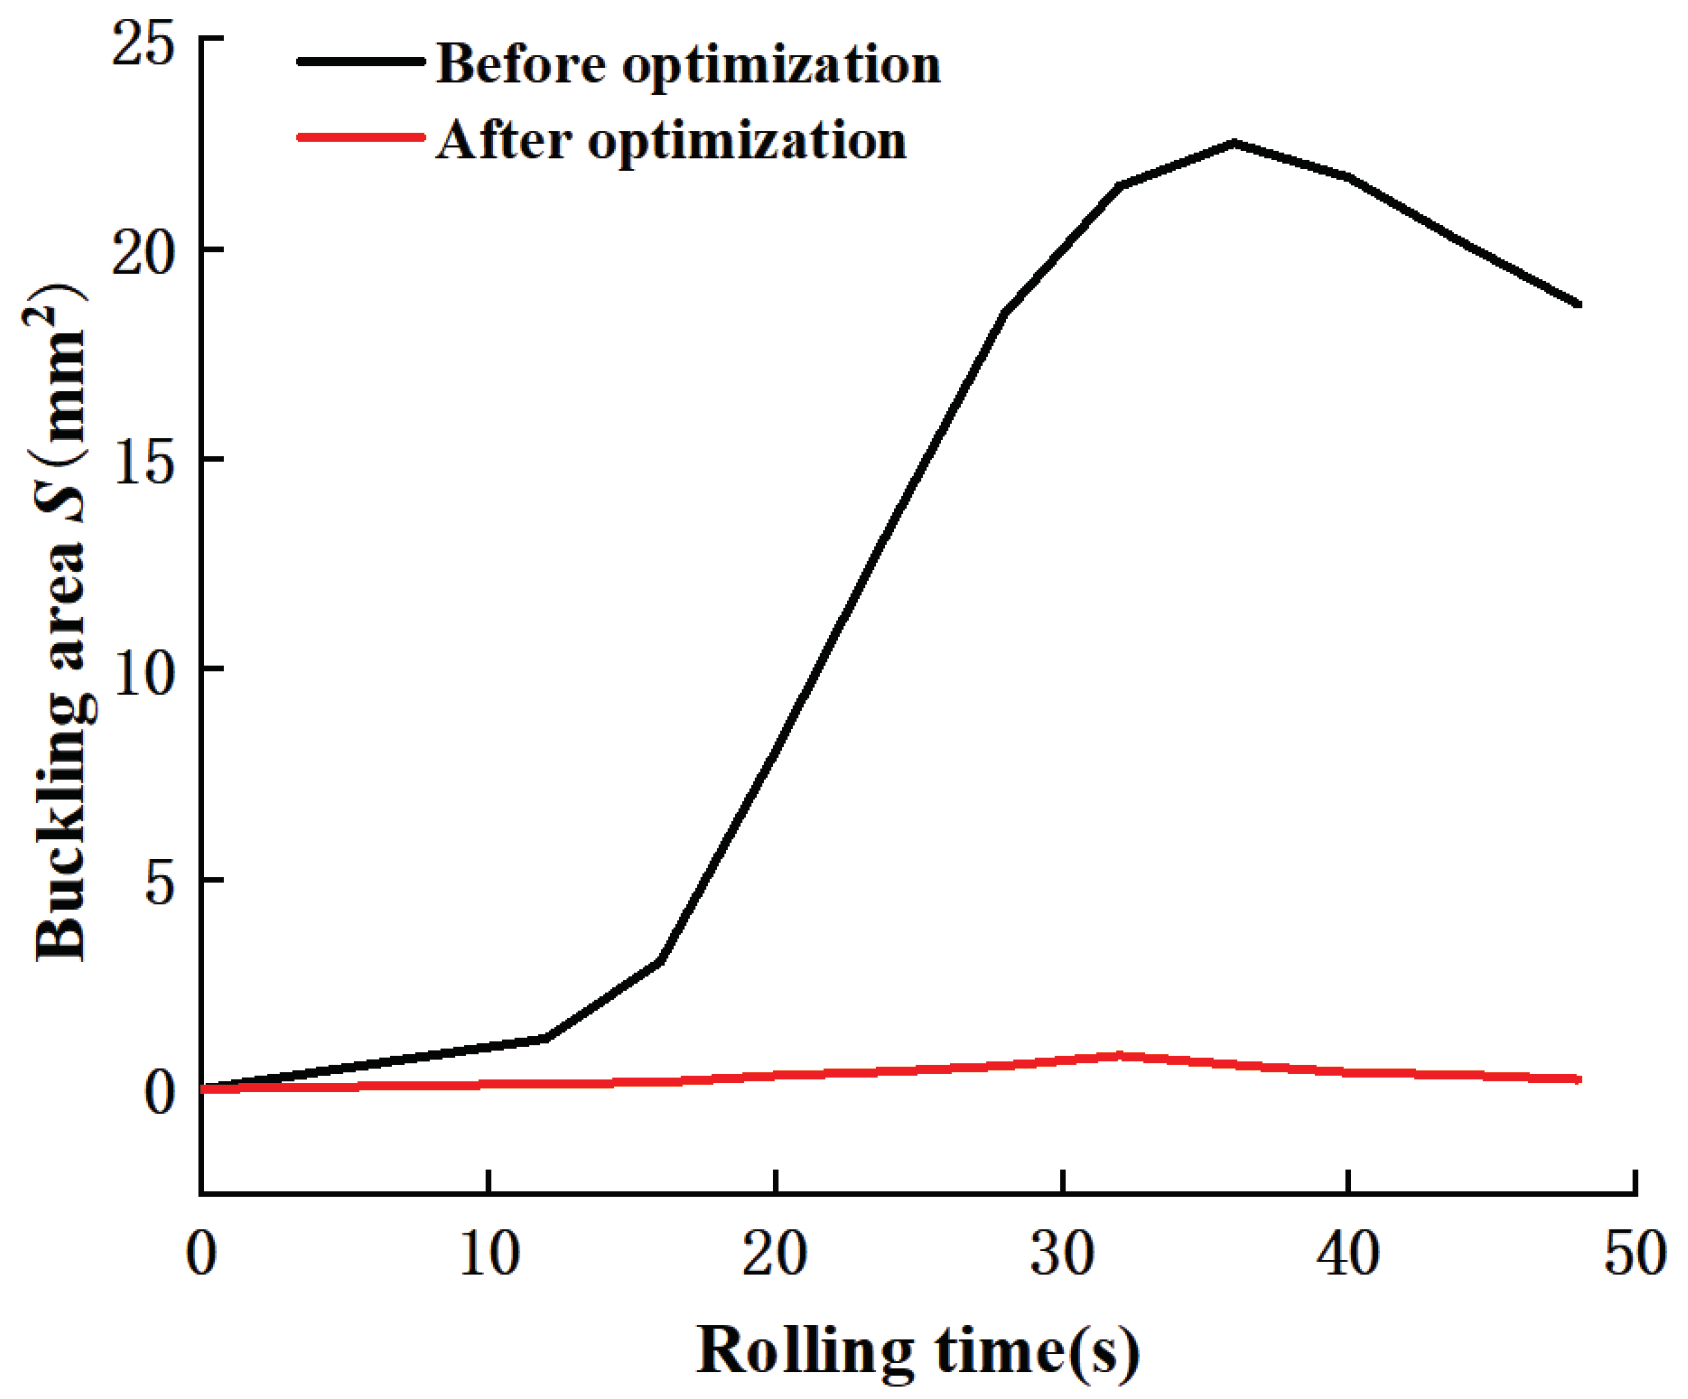
In order to verify the accuracy of the response surface optimization results for the constrained ring rolling process of AATWCRIHR, DEFORM-3D software was used to simulate the optimal level, namely, the width of the middle rib is 24 mm, the thickness of the wall is 6mm and the height of the middle rib is 51 mm. The simulation results after optimization were compared with the simulation results before optimization. The optimized simulation results are shown in Figure 8. It can be seen from Figure 8 that no obvious annular buckling defect occurs in the outer surface of the formed parts from the beginning to the end of the rolling process. The buckling area at the back of the middle rib before and after optimization was calculated, as shown in Figure 9. As can be seen from the figure, the buckling area after optimization is almost constant and its value is about zero from the beginning stage to the end stage of rolling, which indicates the degree of the buckling defect on the back of the middle rib is very low, so it can be considered that there will be no buckling defect on the outer surface of the conical ring when the width of the middle rib is 24 mm, the thickness of the wall is 6 mm and the height of the middle rib is 51 mm. By comparing the simulation results and prediction results before and after optimization, it is proved that the quantitative buckling defect representation method and the optimization design scheme based on response surface method is feasible for the constrained ring rolling process of AATWCRIHR.

5. Conclusions

Based on the response surface method and the finite element simulation results, geometric dimensions of the middle rib and the wall thickness were optimized to minimize the degree of buckling defect in CRR process of AATWCRIHR. According to range analysis, level analysis, variance analysis and response surface analysis, the following conclusions are obtained:
  • The degree of influence on buckling defect is the width of the middle rib, the wall thickness and the height of the middle rib in order.
  • The buckling area is the smallest and the degree of buckling defect on the back of the middle rib is the lowest when the width of the middle rib is 24 mm, the wall thickness is 6 mm, and the height of the middle rib is 51 mm.
  • When the width of the middle rib is larger, the degree of buckling defect becomes more significant with the decrease of the wall thickness. When the width of the middle rib is smaller, the thickness of the wall has little influence on the buckling defect, and the degree of the buckling defect is light.
  • The quantitative representation of the buckling defect proposed using the buckling profile S is feasible, and the response surface model can predict the degree of buckling defect at a given geometry dimension of the middle rib and the wall thickness of the conical ring billet by verification.

Author Contributions

Wei Feng and Peng Zhao conceived and designed this study and wrote the paper, Wei Feng conducted the experiments and edited the paper.

Funding

This research was supported by 111 Project (No. B17034) and Innovative Research Team Development Program of Ministry of Education of China (No. IRT17R83).

Data Availability Statement

Data is contained within the article.

Acknowledgments

The authors gratefully acknowledge the financial support of 111 Project (No. B17034) and Innovative Research Team Development Program of Ministry of Education of China (No. IRT17R83).

Conflicts of Interest

The authors declare no conflict of interest.

References

  1. Qian, D.; Li, G.; Deng, J.; Wang, F. Effect of die structure on extrusion forming of thin-walled component with I-type longitudinal ribs. The International Journal of Advanced Manufacturing Technology 2020, 108, 1959–1971. [Google Scholar] [CrossRef]
  2. Zeng, X.; Fan, X.; Li, H.; Li, S. Flow forming process of thin-walled tubular parts with cross inner ribs. Procedia Manufacturing 2018, 15, 1239–1246. [Google Scholar] [CrossRef]
  3. Lei, Y.; Zhan, M.; Fan, X.; Zhang, A.; Niu, H.; Bai, D.; Gao, P.; Zheng, Z. A review on manufacturing technologies of thin-walled components with ribs. Journal of Northwestern Polytechnical University 2022, 40, 1–17. [Google Scholar] [CrossRef]
  4. Tian, D.; Han, X.; Hua, L.; Wang, X.; Chen, F. Constraining ring rolling of thin-walled conical rings with transverse ribs. International Journal of Mechanical Sciences 2022, 226. [Google Scholar] [CrossRef]
  5. Hua, L.; Deng, J.; Qian, D.; Lan, J.; Long, H. Modeling and application of ring stiffness condition for radial-axial ring rolling. International Journal of Machine Tools and Manufacture 2016, 110, 66–79. [Google Scholar] [CrossRef]
  6. Zheng, Y. Multi-objective Optimization of Process Parameters of Aluminium Alloy Rib-web Forgings Based on Orthogonal Experiment. Hot Working Technology 2015, 44, 168–172. [Google Scholar]
  7. Zhao, G.; Wright, E.D.; Grandhi, R.V. Preform Die Shape Design in Metal Forming Using an Optimization Method. International Journal for Numerical Methods in Engineering 1997, 40, 1213–1230. [Google Scholar] [CrossRef]
  8. Fourment, L.; Chenot, J.L. Optimal Design for Non-Steady-State Metal Forming Processes—I. Shape Optimization Method. International Journal for Numerical Methods in Engineering 1996, 39, 33–50. [Google Scholar] [CrossRef]
  9. Kusiak, J. A technique of tool-shape optimization in large scale problems of metal forming. Journal of Materials Processing Technology 1996, 57, 79–84. [Google Scholar] [CrossRef]
  10. Montgomery, D.C. Design and analysis of experiments; John wiley & sons, 2017. [Google Scholar]
  11. Gheysarian, A.; Honarpisheh, M. Process Parameters Optimization of the Explosive-Welded Al/Cu Bimetal in the Incremental Sheet Metal Forming Process. Iranian Journal of Science and Technology, Transactions of Mechanical Engineering 2018, 43 S1, 945–956. [Google Scholar] [CrossRef]
  12. Gulati, V.; Aryal, A.; Katyal, P.; Goswami, A. Process Parameters Optimization in Single Point Incremental Forming. Journal of The Institution of Engineers (India): Series C 2015, 97, 185–193. [Google Scholar] [CrossRef]
  13. Pan, Y.; Cai, G. Optimization of Processing Parameters of Aluminum Alloy Cylindrical Parts Based on Response Surface Method during Hydromechanical Deep Drawing. Metals 2023, 13, 1406. [Google Scholar] [CrossRef]
  14. Li, W.; Zhang, Z.; Jia, H.; Ren, M. The Optimization of Welding Spots’ Arrangement in A-Pillar Patchwork Blank Hot Stamping. Metals 2023, 13, 1409. [Google Scholar] [CrossRef]
  15. Feng, W.; Hua, L. Multi-objective optimization of process parameters for the helical gear precision forging by using Taguchi method. Journal of Mechanical Science and Technology 2011, 25, 1519–1527. [Google Scholar]
  16. Feng, W.; Hua, L. Process Parameters Optimisation for Helical Gears Precision Forging with Damage Minimization. In 2010 International Conference on Digital Manufacturing & Automation; 2010; pp. 117–120. [Google Scholar]
  17. Anupama Francy, K.; Sai Sudheer, S.V.; Naga Krishna, N.; Gopalakrishnaih, P. Optimization of input process parameters for Al 2024 alloy in cold extrusion process. Materials Today: Proceedings 2023. [Google Scholar] [CrossRef]
  18. Li, H.; Chang, C.; Huang, Y.; Fu, R.; Shao, H. Optimization of numerical parameters and microstructure evolution on 2195 Al–Li alloy extrusion process. Journal of Materials Research and Technology 2023, 26, 7694–7706. [Google Scholar] [CrossRef]
  19. Luo, W.; Tang, L.; Guo, F. Mold design and forming process parameters optimization for passenger vehicle front wing plate. Journal of Mechanical Science and Technology 2022, 36, 187–196. [Google Scholar] [CrossRef]
  20. Hosseini, S.H.; Sedighi, M.; Mosayebnezhad, J. Numerical and experimental investigation of central cavity formation in aluminum during forward extrusion process. Journal of Mechanical Science and Technology 2016, 30, 1951–1956. [Google Scholar] [CrossRef]
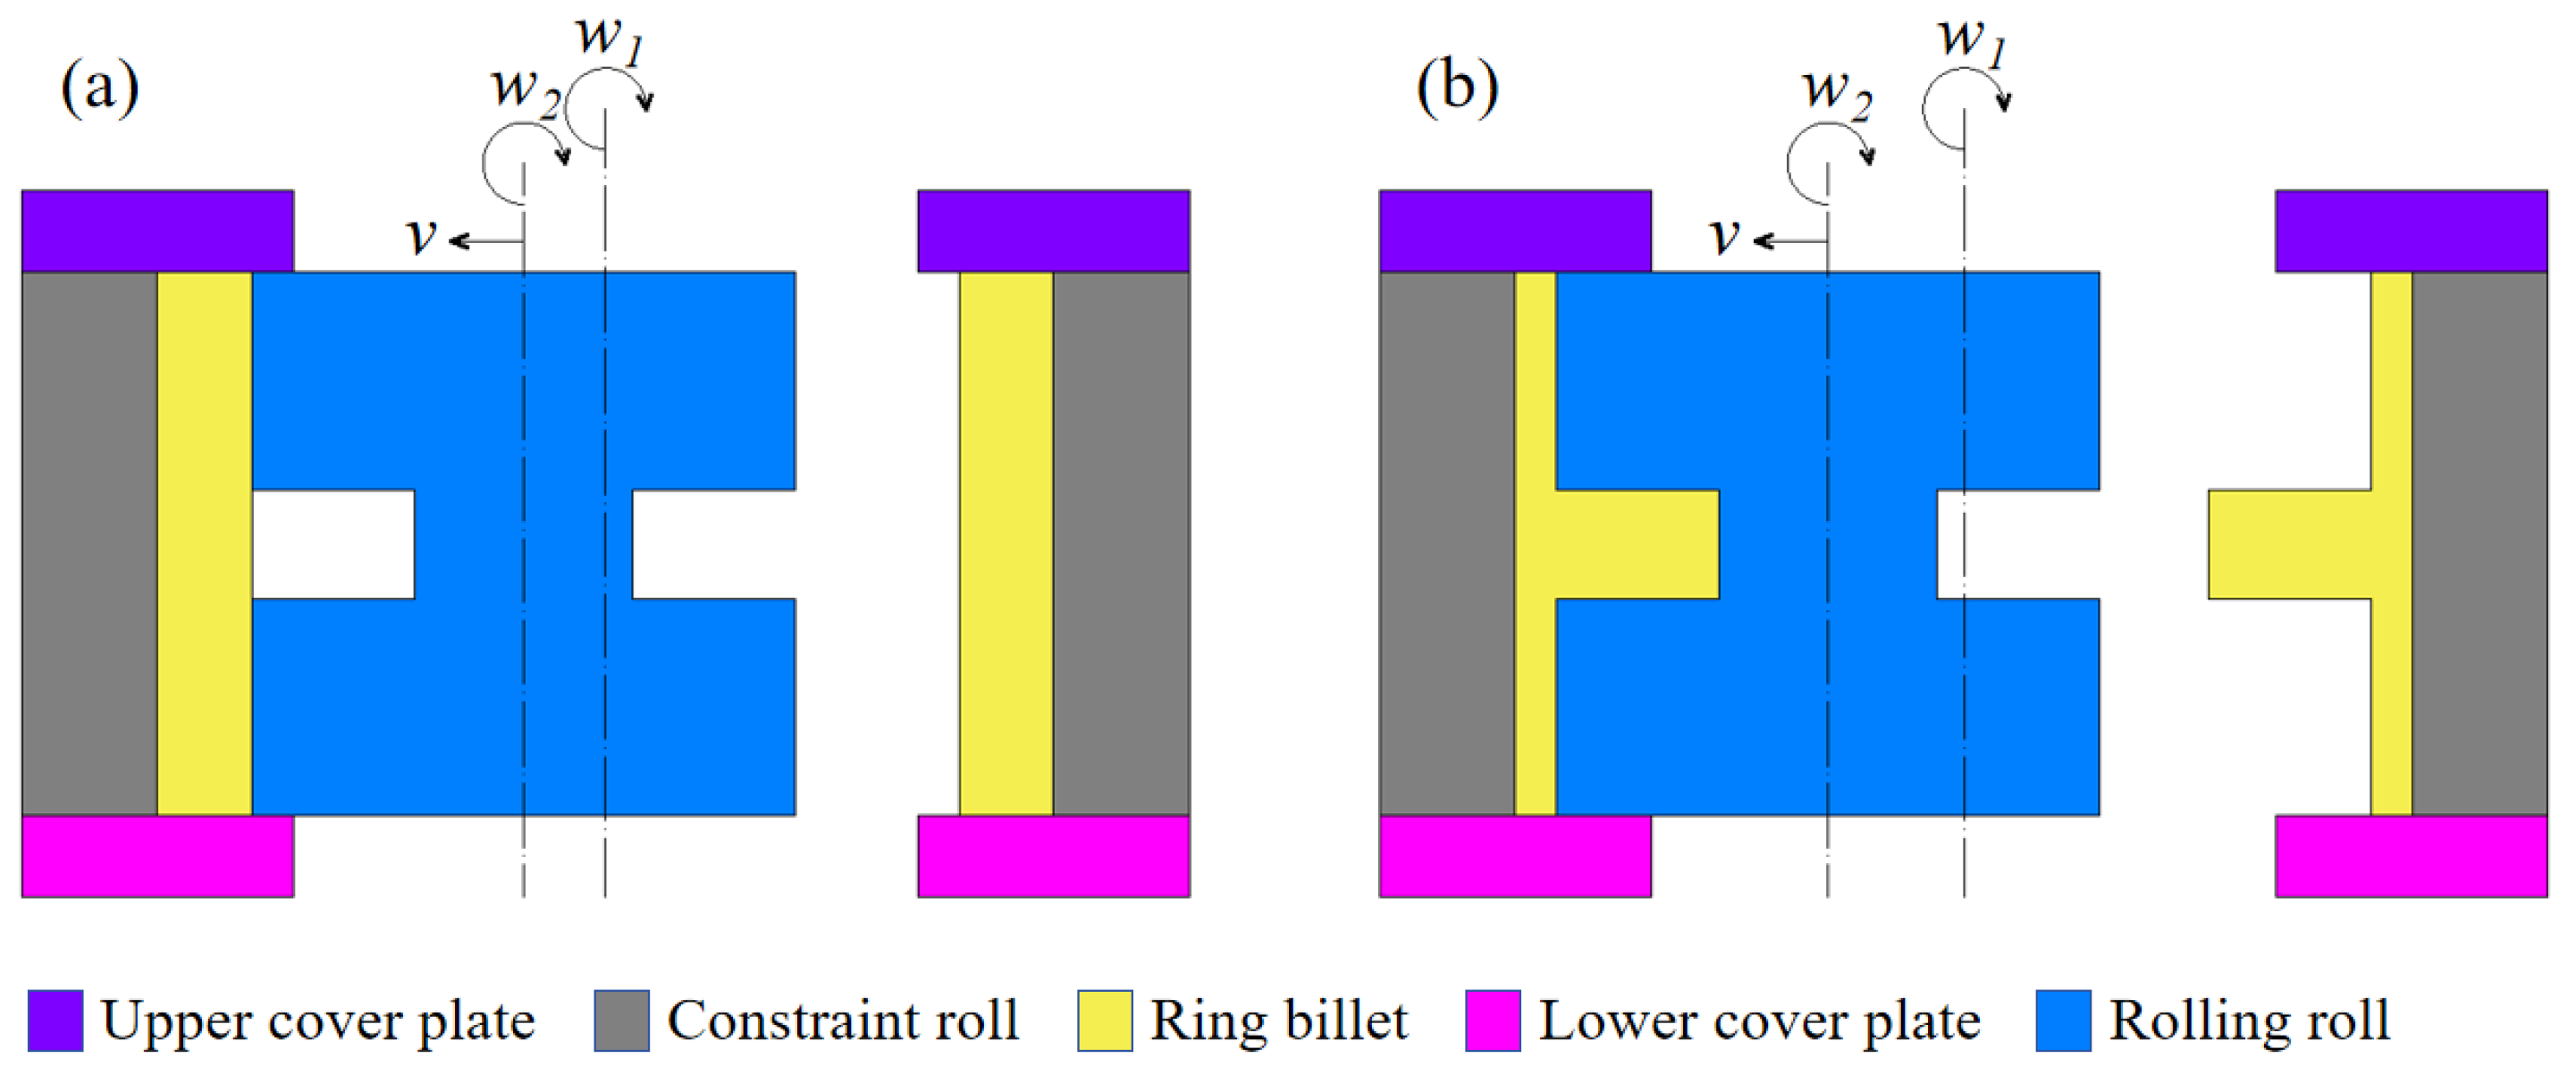
Figure 1. Principle of CRR. (a) Beginning of CRR; (b) End of CRR.
Preprints 100295 g001
Figure 2. Aluminum ally thin wall conical ring with inner high ribs.
Preprints 100295 g002
Figure 3. Finite element model of CRR. (a) Section view of FE model; (b) Rolling roll; (c) Conical ring billet; (d) Constraint roll.
Preprints 100295 g003
Figure 4. FE simulation result of CRR for AATWCRIHR.
Preprints 100295 g004
Figure 5. Calculation method degree of buckling defect. (a) The data extraction points; (b) Schematic diagram of buckling area S calculation.
Preprints 100295 g005
Figure 6. The variation graph between factors and optimization object S.
Preprints 100295 g006
Figure 7. 3D response surface diagram of significant variables A, B and buckling area S.
Preprints 100295 g007
Figure 8. Optimized simulation results.
Preprints 100295 g008
Figure 9. Buckling area of before and after optimization.
Preprints 100295 g009
Table 1. Influencing factors and levels.
Symbol Factors Level 1 Level 2 Level 3 Level 4
A Width of rib/ b2 (mm) 24 30 35 40
B Thickness of wall/ t(mm) 3 4 5 6
C Height of rib/ h2 (mm) 41 46 51 56
Table 2. Orthogonal experimental results.
Experiment NO. A(mm) B(mm) C(mm) S(mm2)
1 24 3 41 0.58
2 24 4 56 0.85
3 24 5 51 0.87
4 24 6 46 0.44
5 30 3 46 0.57
6 30 4 56 0.83
7 30 5 51 0.82
8 30 6 41 0.83
9 35 3 51 11.35
10 35 4 41 10.85
11 35 5 46 7.75
12 35 6 56 3.92
13 40 3 56 26.30
14 40 4 46 25.32
15 40 5 41 22.42
16 40 6 51 12.75
K1 0.68 9.70 8.67
K2 0.76 9.46 8.52
K3 8.47 7.69 6.44
K4 21.70 4.48 7.98
Rang Rs -21.01 -5.21 -2.23
Table 3. Analysis of variance.
Source Sum of squares DOF Mean square F-Value P-Value Degree of significance
Model 1316.65 9 146.29 104.82 <0.0001 significant
A 926.77 1 926.77 664.04 <0.0001
B 47.21 1 47.21 33.83 0.0011
C 10.96 1 10.96 7.85 0.0311
AB 38.32 1 38.32 27.46 0.0019
AC 0.073 1 0.073 0.052 0.8269
BC 1.206*10-3 1 1.206*10-3 8.640*10-4 0.9775
A2 211.28 1 211.28 151.38 <0.0001
B2 4.57 1 4.57 3.27 0.1205
C2 3.40 1 3.40 2.44 0.1695
Residual error 8.37 6 1.40
Correlation coefficient R2 Modified coefficient of determination Radj2 Model prediction coefficient Rpred2 S/N Ratio
0.9937 0.9842 0.9355 28.303
Disclaimer/Publisher’s Note: The statements, opinions and data contained in all publications are solely those of the individual author(s) and contributor(s) and not of MDPI and/or the editor(s). MDPI and/or the editor(s) disclaim responsibility for any injury to people or property resulting from any ideas, methods, instructions or products referred to in the content.
Copyright: This open access article is published under a Creative Commons CC BY 4.0 license, which permit the free download, distribution, and reuse, provided that the author and preprint are cited in any reuse.
Prerpints.org logo

Preprints.org is a free preprint server supported by MDPI in Basel, Switzerland.

Subscribe

© 2024 MDPI (Basel, Switzerland) unless otherwise stated