BACKGROUND
Human papillomavirus (HPV) infection is a major risk factor for both men and women, especially women, around the world. HPV, which is the cause of more than 300,000 cervical cancer-related deaths every year, is one of the most common viral infections in the sexually transmitted infections (STI) category of the World Health Organization (WHO) [
1]. As of January 2024, there exist 451 distinct references to Human papillomavirus genome entries on Papillomavirus Episteme (PaVE), a web-based database that serves as an integrated resource for papillomavirus genome sequences [
2,
3]. Altogether there are some XX types are documented, and some of them are probably carcinogenic, only twelve of these types (HPV 16, 18, 31, 33, 35, 39, 45, 51, 52, 56, 58, 59) have been highlighted as carcinogenic by the International Agency for Research on Cancer [
4]. Two of them, HPV-16 and 18 are the most common types, and almost seven out of ten cervical cancers reported worldwide develop as a result of infections of these two types [
5]. Upon conducting a thorough analysis of more specified locations, it has been observed that this ratio remains consistently similar. The rate of cervical cancer due to HPV 16 and 18 infections was stated as 68% in women in the Asian region, and even in the regions of Southern and Western Asia, this rate was recorded as more than 80% [
5]. It has also been reported that HPV-related anal, laryngeal, oropharyngeal, and oral cavity cancer types also have a fair incidence among men [
5].
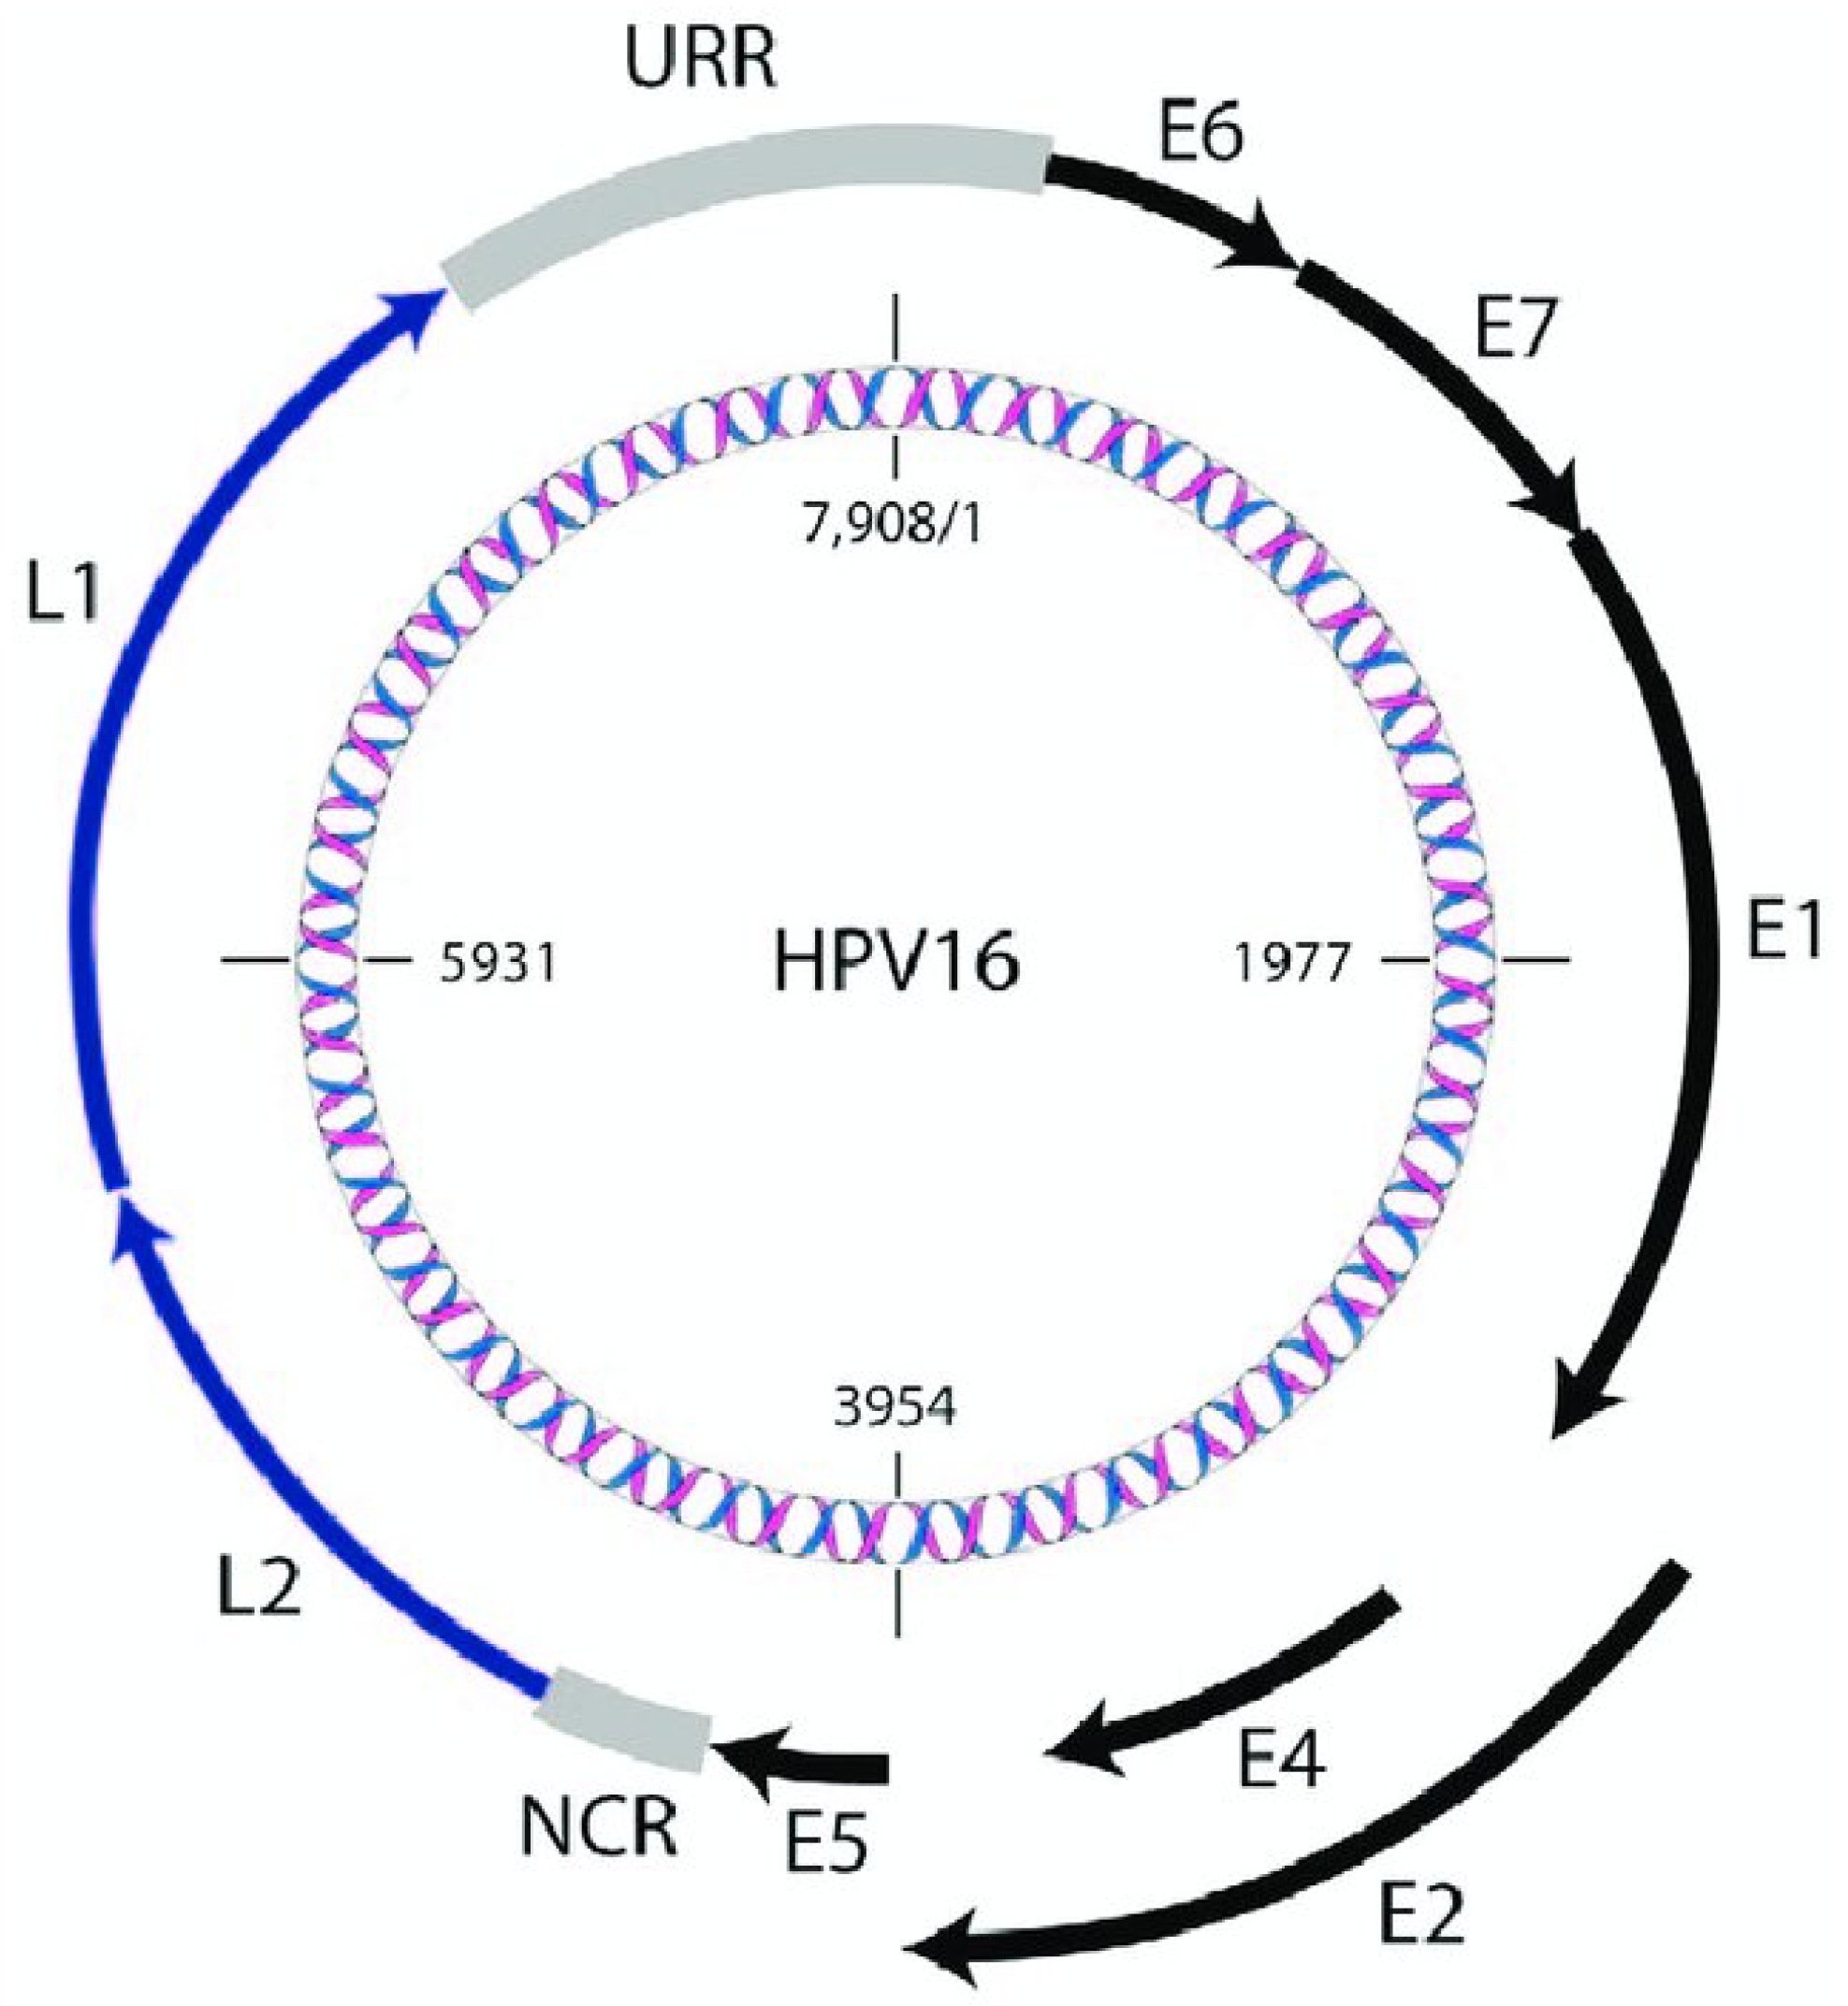
Human papillomavirus (HPV) is a dsDNA virus belonging to the papillomaviridae family and its genome size is indicated about 8kb [
6]. Structurally, it is a virus with 72 capsomeres in an icosahedral structure, without an envelope, 55 nm tall. Its genome encodes 8 proteins; E1, E2, E4, E5, E6, E7, L1, and L2 [
6]. The E1, E2, E4, E5, E6, and E7 proteins, which are referred to as "Early" proteins, are involved in vital cycle functions such as genome replication, cell cycle and regulation, cell growth and differentiation [
7]. Also, the oncogenicity of specific HPV types relies on the act of E6 and E7 proteins on the p53 and pRb by interfering with the normal functions [
8]. The "late" proteins, on the other hand, are involved in the formation of the major capsid protein, L1, and the minor capsid protein, L2, which forms the capsid structure of the virus [
9].
Figure 1.
Schematic representation of the HPV-16 double-stranded circular DNA genome with 7,908 bp long. Early genes are represented with black which are E1, E2, E4, E5, E6, E7. Late genes are represented with dark blue which are L1 and L2. URR refers to the Upstream Regulatory Region and NCR refers to Non-Coding Region. [
7].
The major capsid protein, L1, is a protein with a highly conserved sequence of about 55 kDa [
9]. Due to this characteristic, HPV types are classified according to the similarity rates in L1 sequences. In the process of assigning a name to a novel HPV type, it is required that the L1 sequence similarity be less than 90% and this score rises to 98% for novel subtypes [
10,
11]. Despite its rather conservative characteristic, there are certain sequences in the L1 protein where there are also variable sequences. These surface loops are named BC, CD, DE, EF, FG, and HI loops based on the beta strands they connect [
12,
13,
14]. Moreover, the lysine residues located on FG and HI loops have been identified as regions involved in the initial stages of the viral infection cycle, where they interact with heparan sulfate. [
15,
16]. The residues contained within these loops hold immense significance.
The L1 major capsid protein self-assembles into virus-like particles (VLPs) and FDA-approved HPV vaccines such as Cervarix®, Gardasil®, and Gardasil®9, are developed based on VLPs [
12,
17,
18,
19,
20]. These particles trigger the immune systems of host organisms by mimicking the actual virus capsid without the viral genome [
20]. The quadrivalent Gardasil®, which was the first approved of these vaccines as 4vHPV, received FDA approval in 2006. This vaccine, formulated with VLPs of HPV 6, 11, 16, and 18 types whose infection results in the common cancerous and genital wart-causing types, is used for prevention against these four types [
17,
21,
22]. The second HPV vaccine approved by the FDA was the bivalent (2vHPV) Cervarix® vaccine which provided protection against HPV types 16 and 18 [
17]. The last one, Gardasil®9 was approved for use by the FDA in 2014. This vaccine was developed against nine human papillomavirus types, including 6, 11, 16, 18, 31, 33, 45, 52, and 58, unlike the quadrivalent Gardasil® [
19].
This study aims to analyze the L1 gene and protein sequences, which are the major capsid proteins of the HPV16 type. The studied sequences of HPV type 16 (NCBI:txid333760) from human host organism (NCBI:txid9606) have been collected from the NCBI Virus public database from the Asian region and selected referring to the year when the last vaccine was approved [
23,
24].
RESULTS
The result section of the study will provide output images from the processing of selected sequences in the R software environment. Residues that changed in amino acid sequences compared to the reference sequence were presented in a table. In addition, the crucial residues that facilitate primary viral attachment were also scrutinized, it was also aimed to compare loop structures and their associated critical residues, and nuclear localization signal sequences located in the L1 sequence. This comparison was conducted to identification of potential residue dissimilarities between the studied sequences.
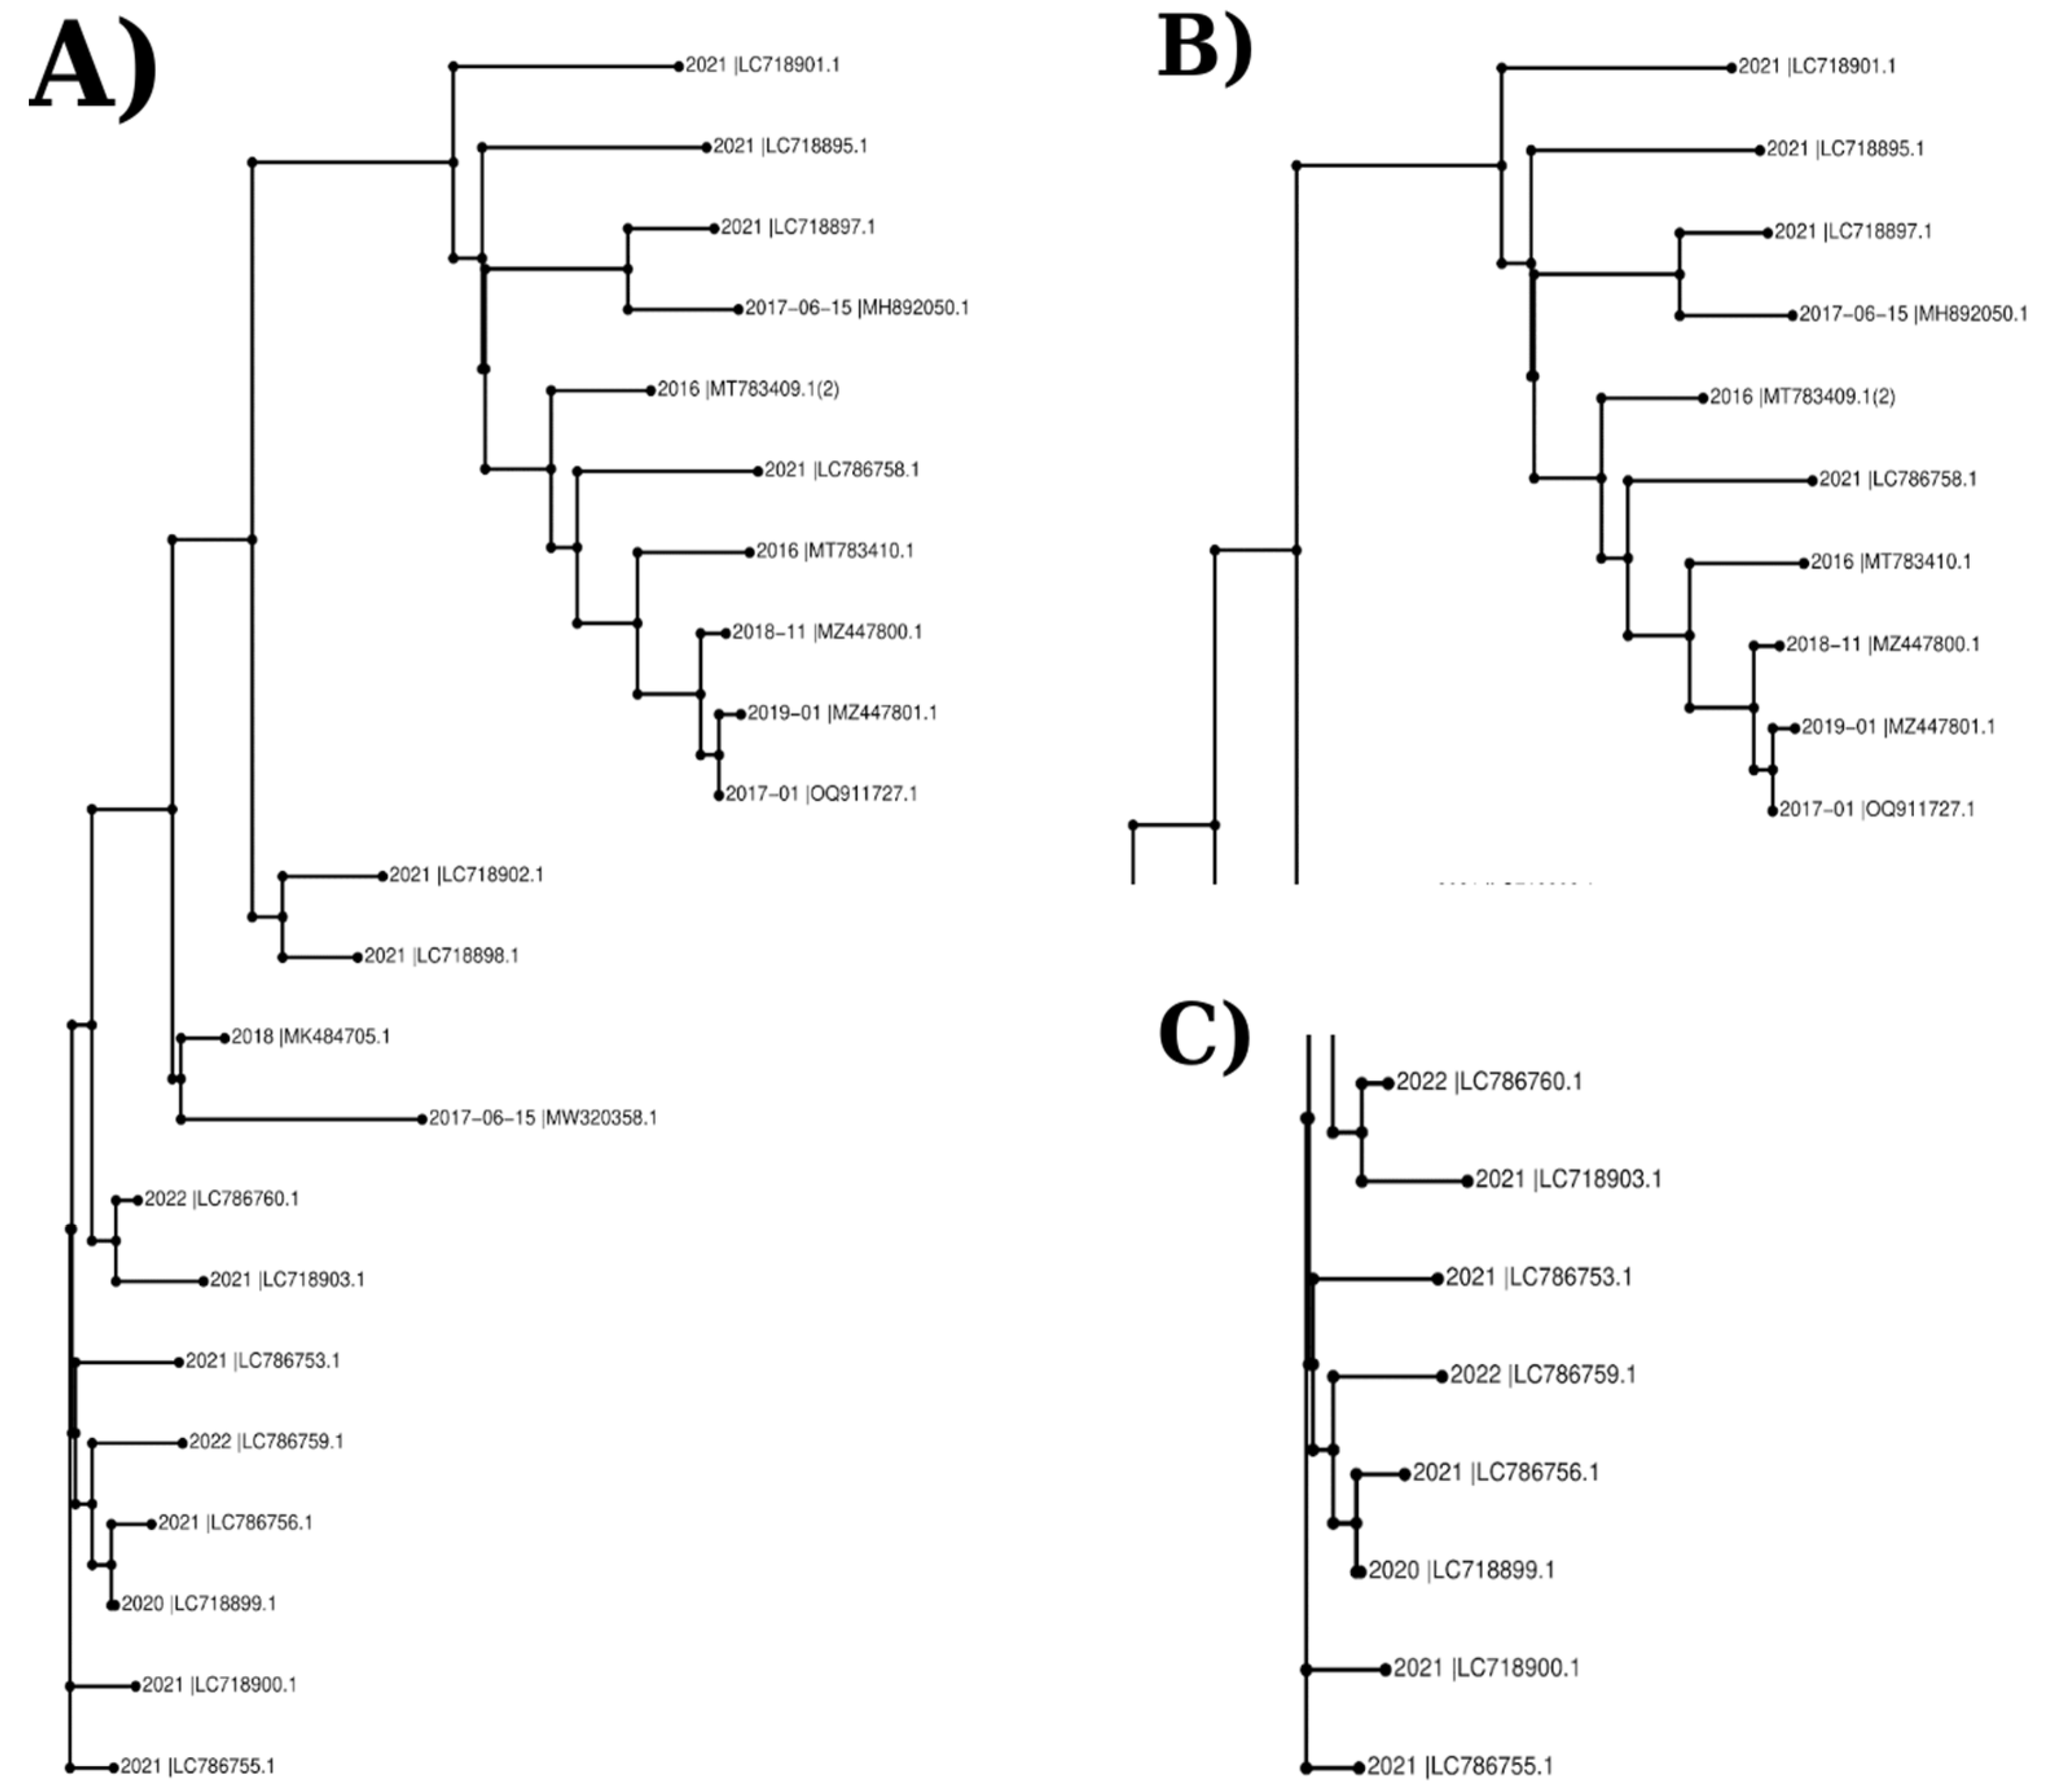
An unrooted and scaled rectangular phylogram was created for the phylogenetic tree, as shown in
Figure 2. At first glance, the most noticeable inference of this phylogram is the presence of two main separate clusters. Within these clusters, the data in the group shown in
Figure 2C, which can be called the lower cluster, appear to be separated from each other with the shorter branches from the roots, compared to the upper cluster in
Figure 2B. Available data supports the contention that they share a close phylogenetic affiliation. Notably, these clusters exhibited a marked geographic association, with sequences from the same countries predominantly clustering together. Upon reviewing the data presented in
Table 1, it is discernible that the sequences featured in this section were submitted by various individuals and institutions located in Japan.
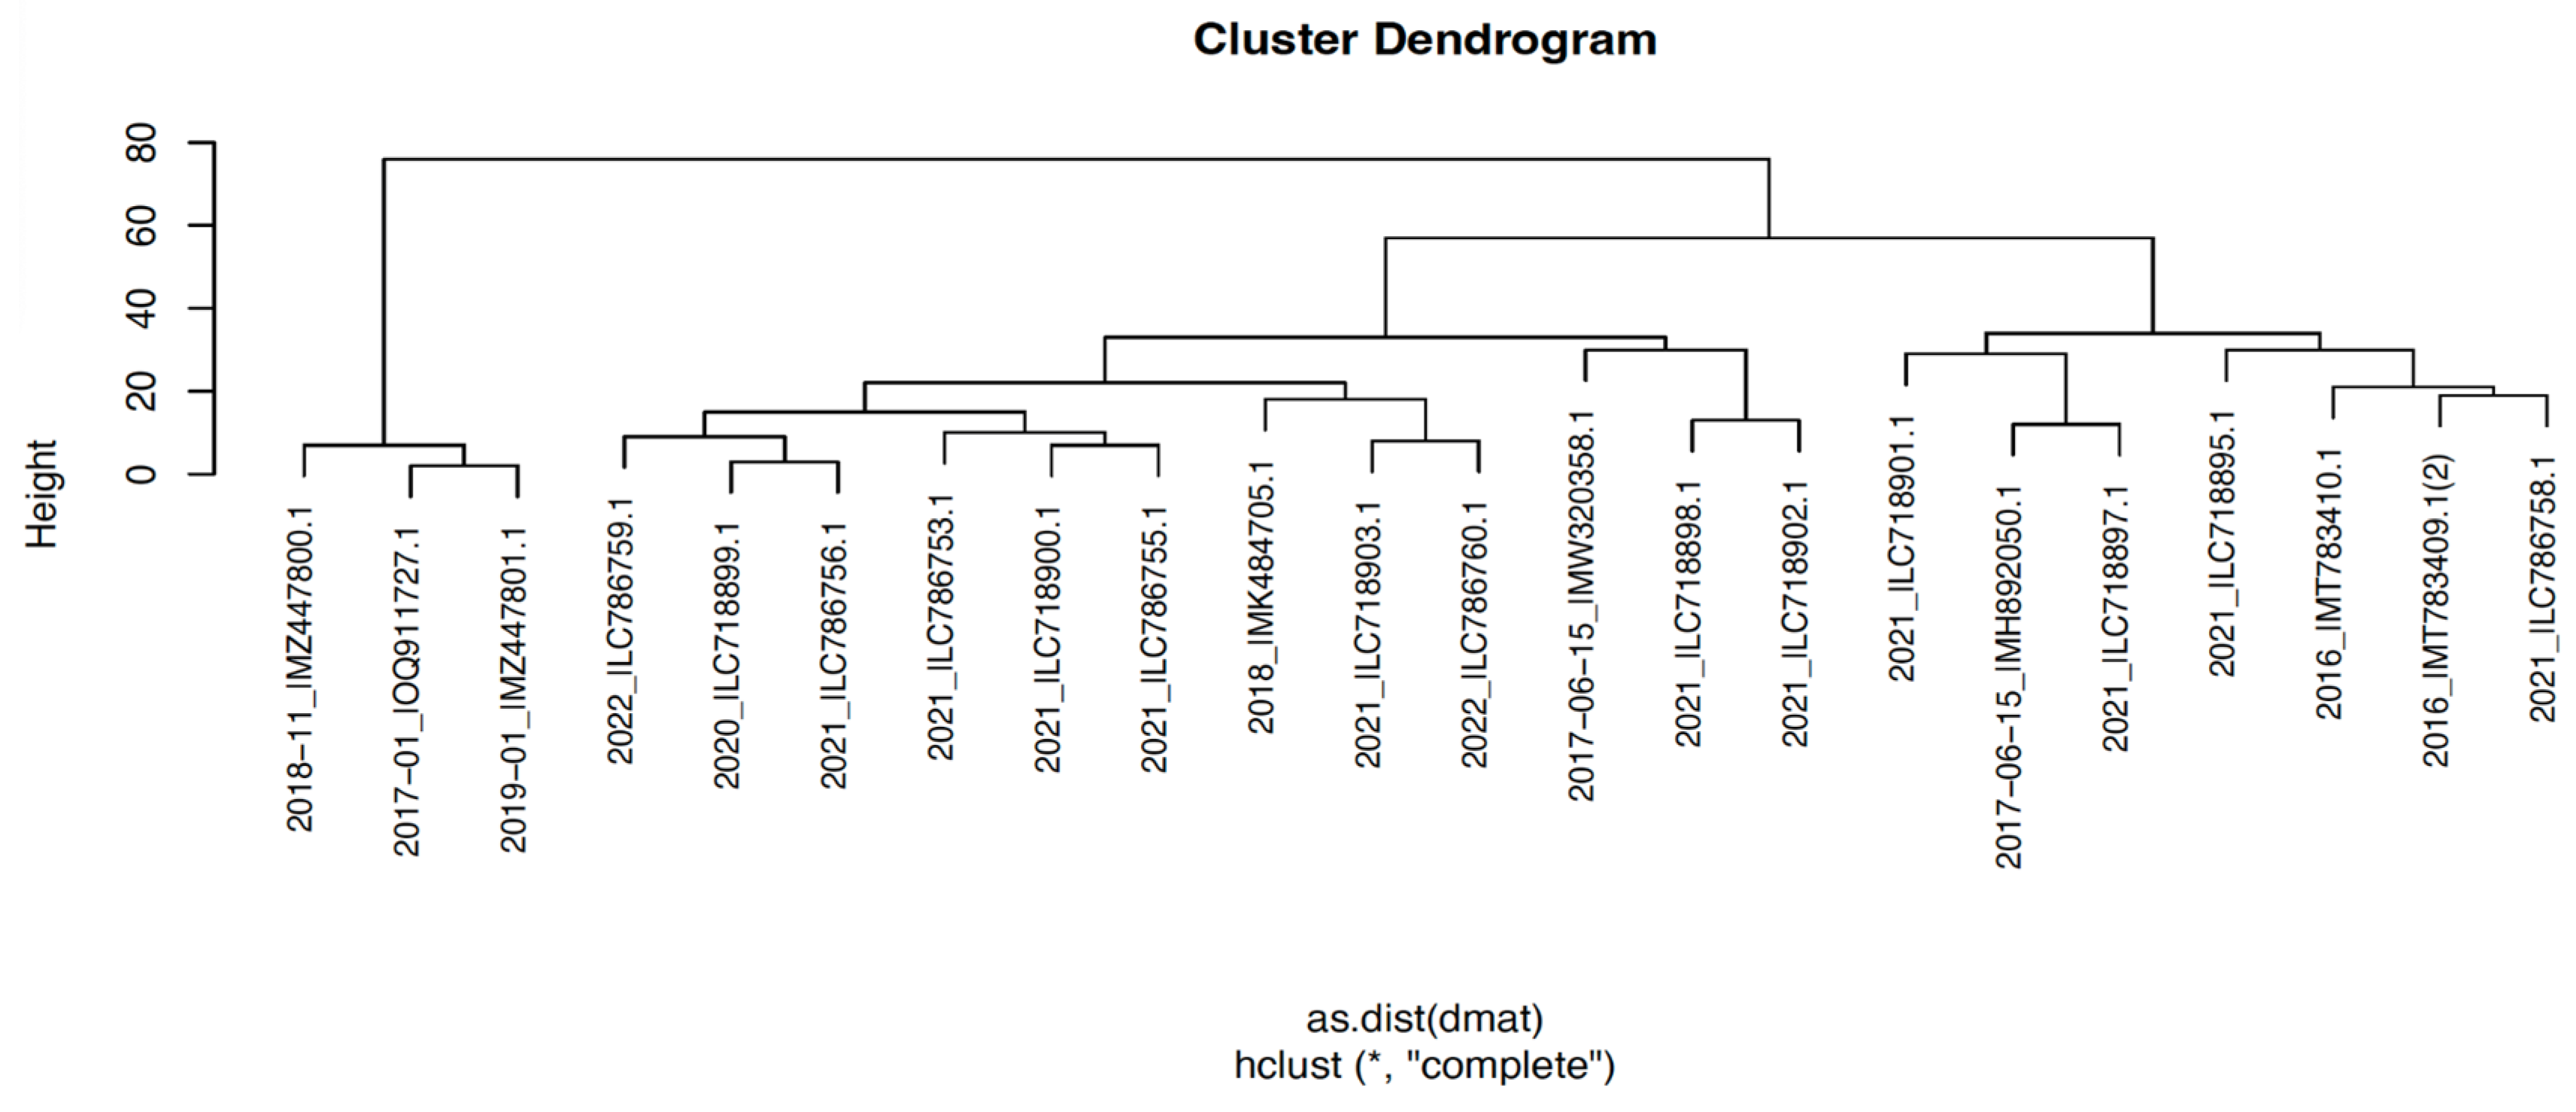
The cluster dendrogram in
Figure 3 was created using the distance matrix of sequences. The cluster dendrogram of nucleotide sequences was also revealed mainly divided into 2 clusters. In contrast to the clustering pattern observed in
Figure 2,
Figure 3 reveals a notable discrepancy regarding the branching topology and root position of specific sequences. While the Pakistani sequences (
2017-01-_|OQ911727, 2018-11-_|MZ447800, and
2019-01-_|MZ447801 submitted to NCBI from Pakistan in 2017, 2018, and 2019), depicted in
Figure 2B appear proximal to other sequences within the phylogenetic tree, they form a distinct clade when visualized through the distance matrix-based cluster dendrogram. However, when the phylogenetic tree was analyzed, the isolates named
2016 |MT783409, 2016 |MT783410, 2017-06-05 |MH892050,
2021 |LC786758, 2021 |LC718895, 2021 |LC718897 and 2021 |LC718901 possessed a common root with the samples submitted from Pakistan.
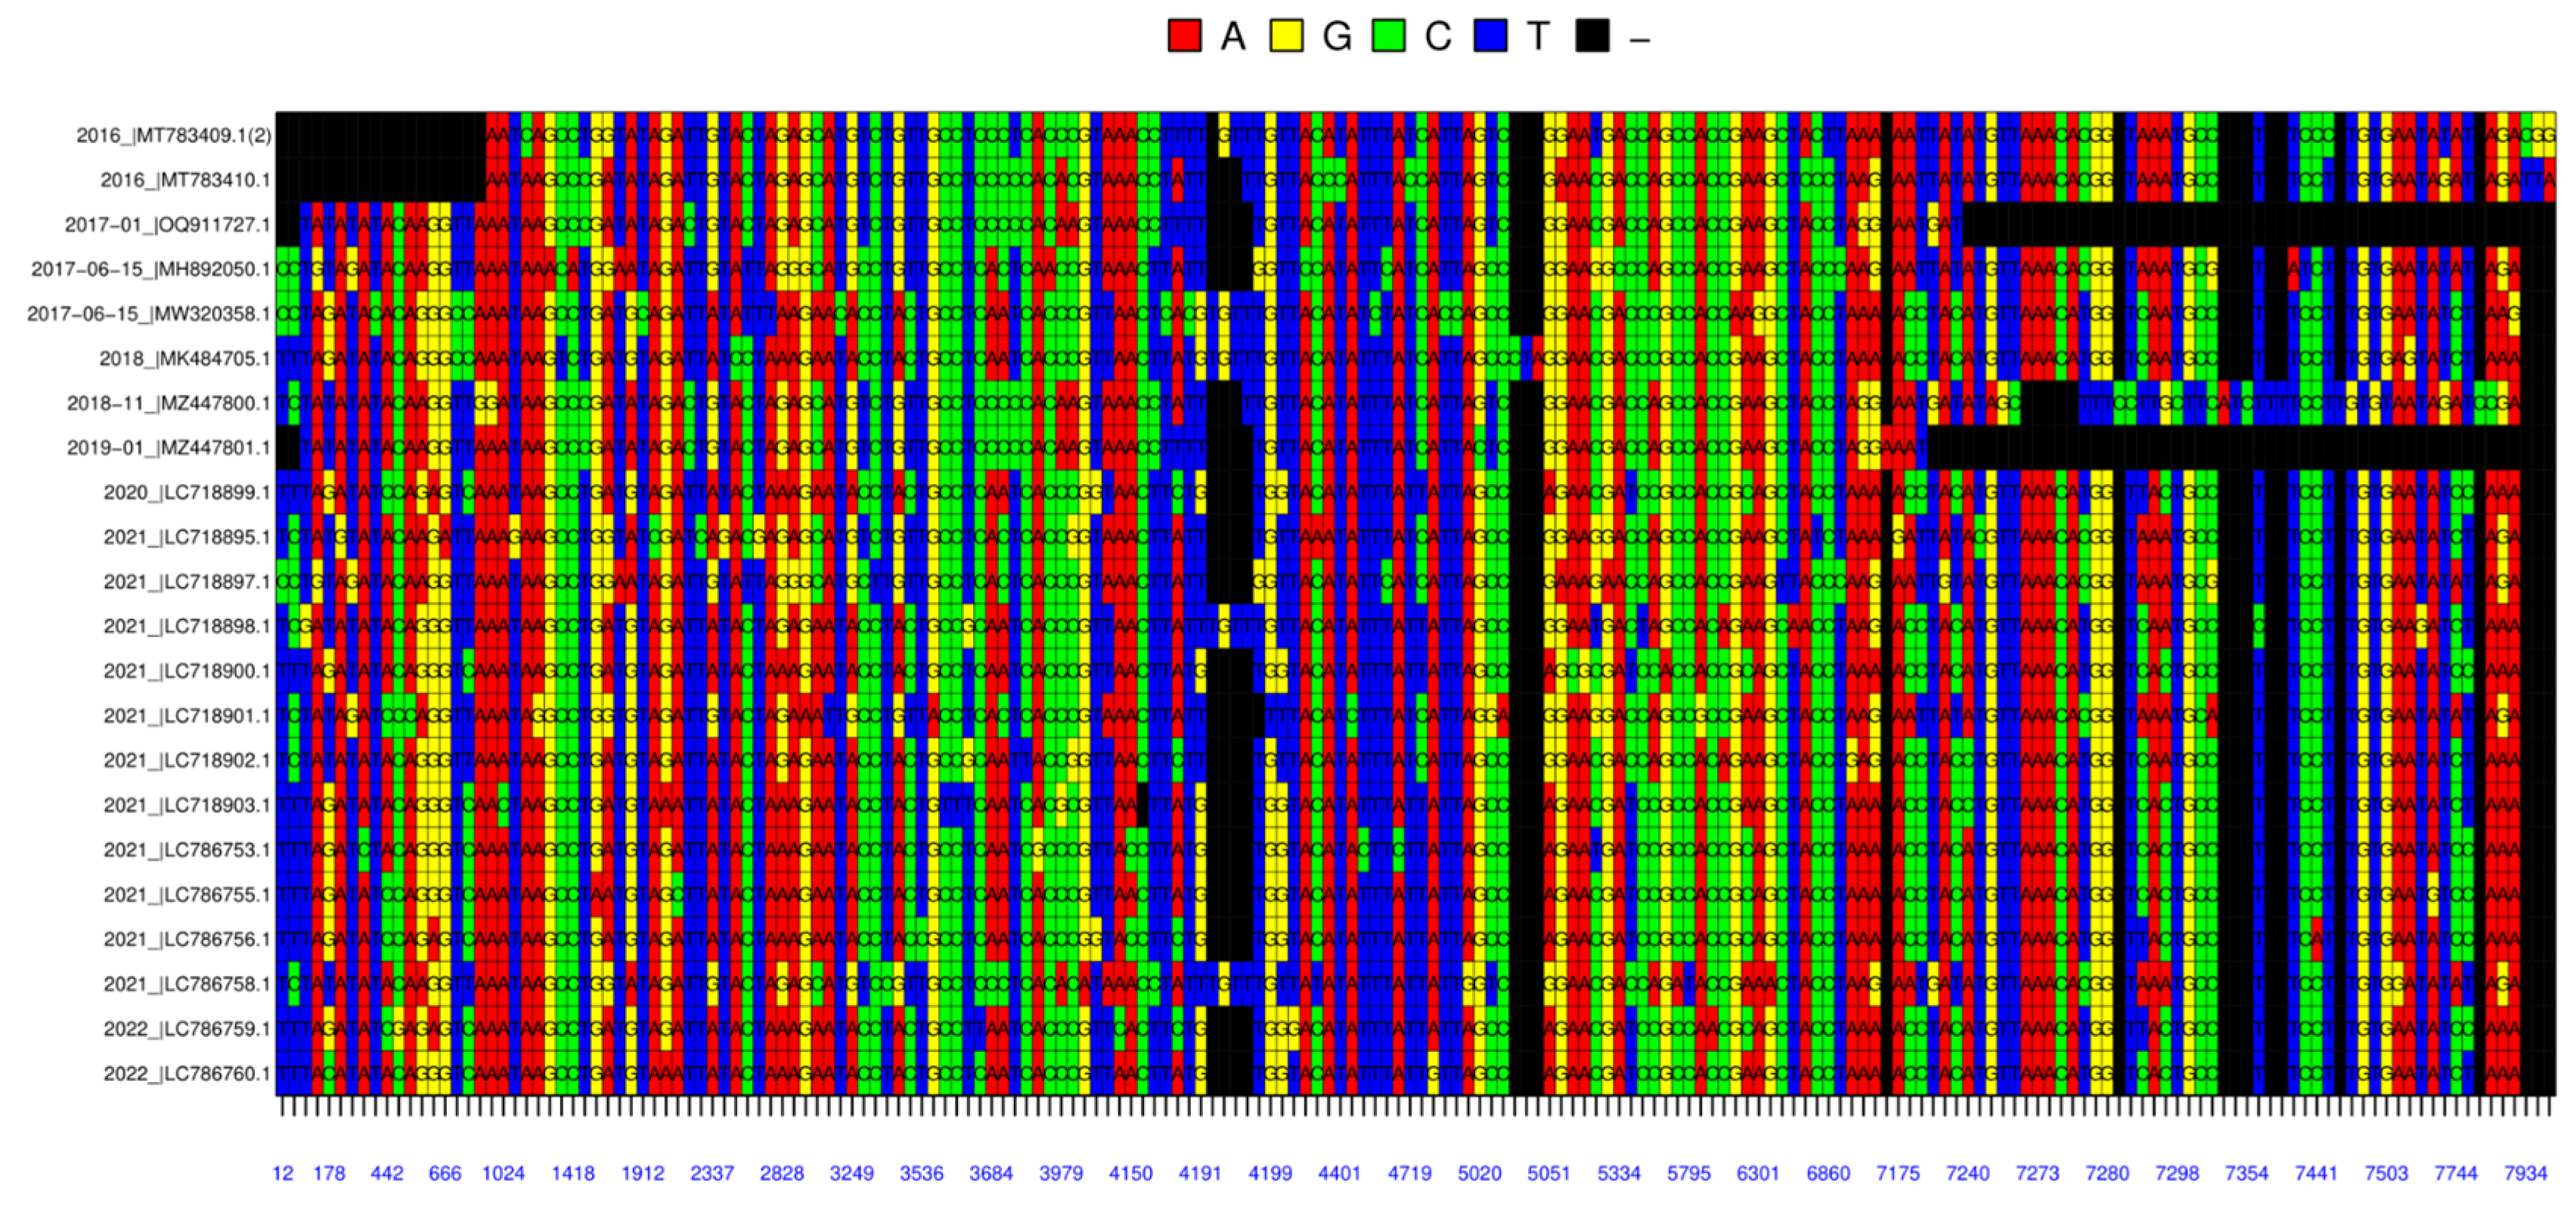
Additionally, the visualization of the alignment of studied nucleic acid sequences based on the color code for each nucleotide was conducted in the R software environment, referring to
Figure 4. In this alignment, there are certain conserved guanine/cytosine-dense, around the indicated position at 3979 and 5795 in
Figure 4, and adenine-dense, around the indicated position at 1024, regions within sequences. It is noteworthy that two Pakistani nucleotide sequences, submitted in 2017 and 2019, present extensive terminal gaps within their alignments,
Figure 4. Upon cross-checking of guided-by sequence length data presented in
Table 1, it has been revealed that these two particular sequences are 742 ±8 base pairs shorter than the others. These factors could offer an explanation for why the
2017−01_|OQ911727 and
2019−01_|MZ447801 data are located in a different branch than the
2018−11 |MZ447800.1 data, as data clearly shown in
Figure 2B.
Furthermore, a relevant observation from
Figure 4 was made on sequences that were named
2016 |MT783410.1 and
2016 |MT783409.1 were submitted from China in 2016. There is one point that separates the L1 sequences of these two isolates from the other; the length of the sequences. The nucleic acid sequences of isolates 7908bp and 7906bp are of similar length to the other sequences, respectively. However, because the protein sequences are 533 amino acid lengths, they are 2 amino acids longer, with additional methionine and leucine residues at the N-terminus, than the other 20 sequences, which are 531 amino acid lengths.
The sequences under discussion, the presence of extended terminal missing in two specific sequences, were deposited from the same institution in Japan, between 2020 and 2022. Notably, these sequences originated from studies associated with multiple unpublished articles and could have suggested a potential shared source or experimental origin.
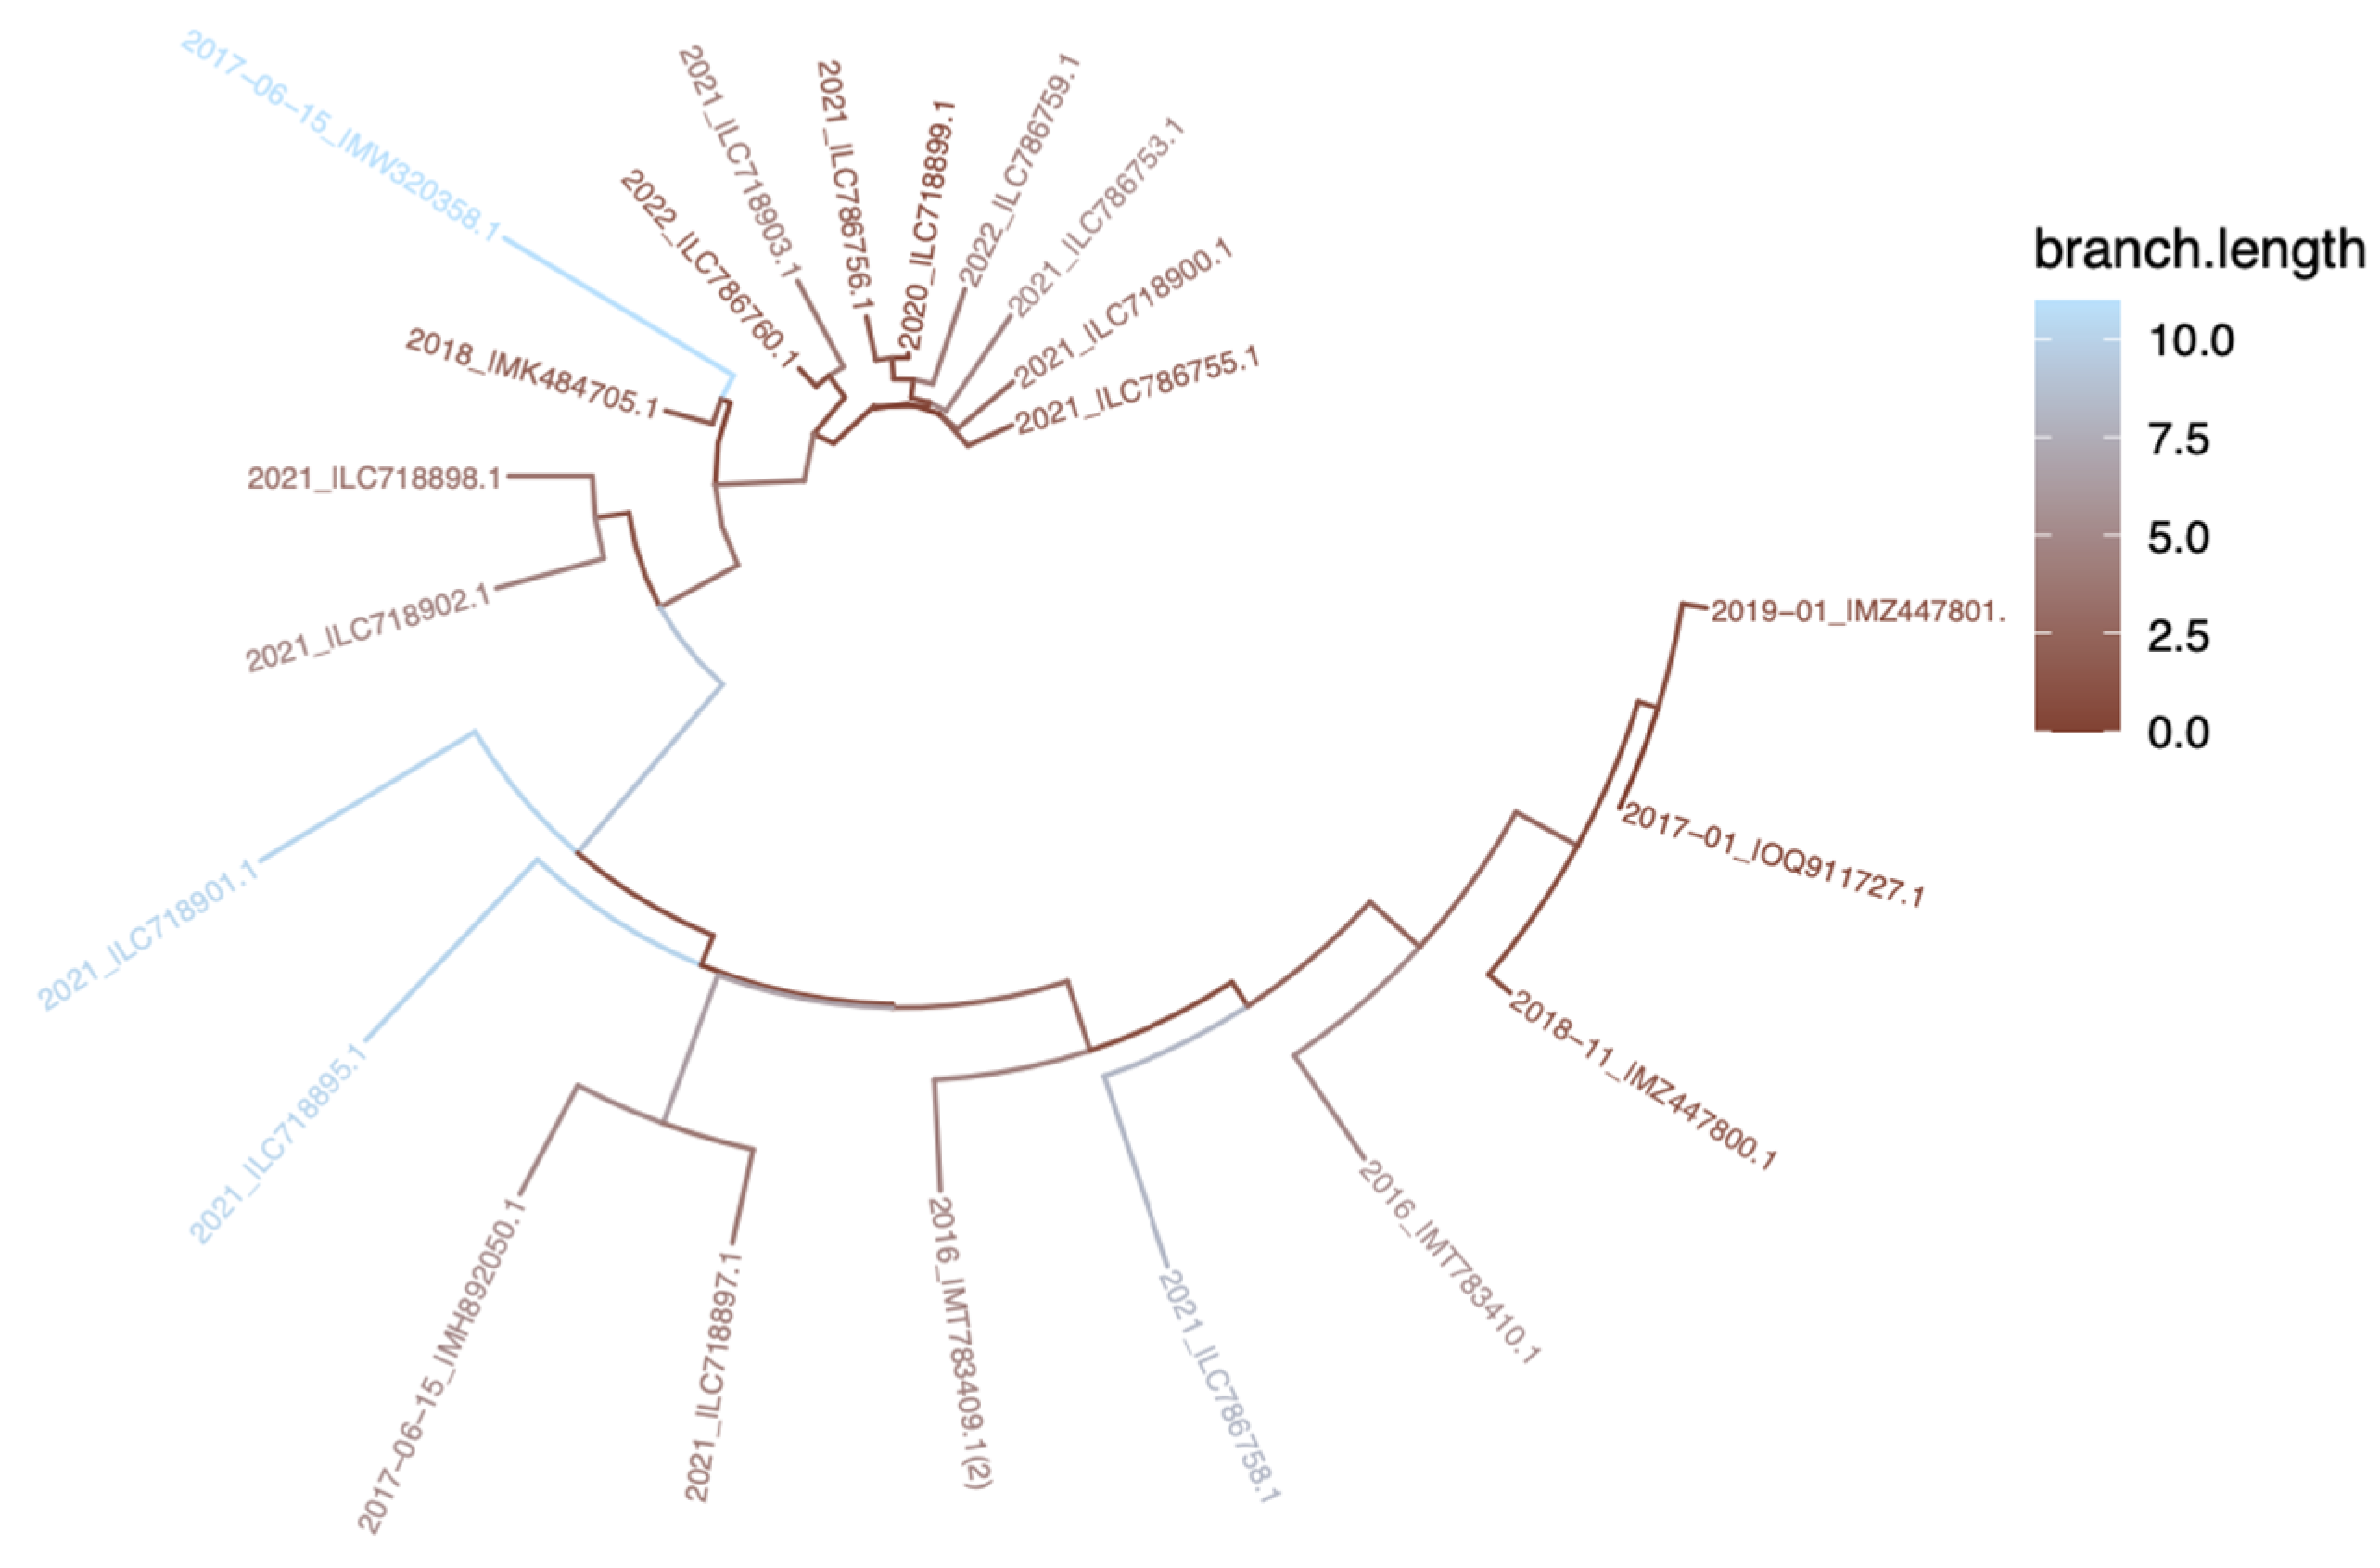
The circular tree, in
Figure 5, was constructed based on the nucleic acid sequences of the samples. In the circular tree, the first noticeable point is the branch length of
2017-06-15_|MW320358, 2021 |LC718901, and
2021 |LC718895, which also were indicated with blue color. Moreover, In
Figure 5, as mentioned above in the
Figure 2C, the data deposited in 2021 (
specifically 2021_|LC718900, 2021_|LC786753, 2021_|LC786755, 022_|LC786759, 2020_|LC718899, 2021_|LC718903, 2021_|LC786756, 2022_|LC786760) were observed to have stronger phylogenetic affinities with each other. This observation was made in the light of branching lengths and provided colors.
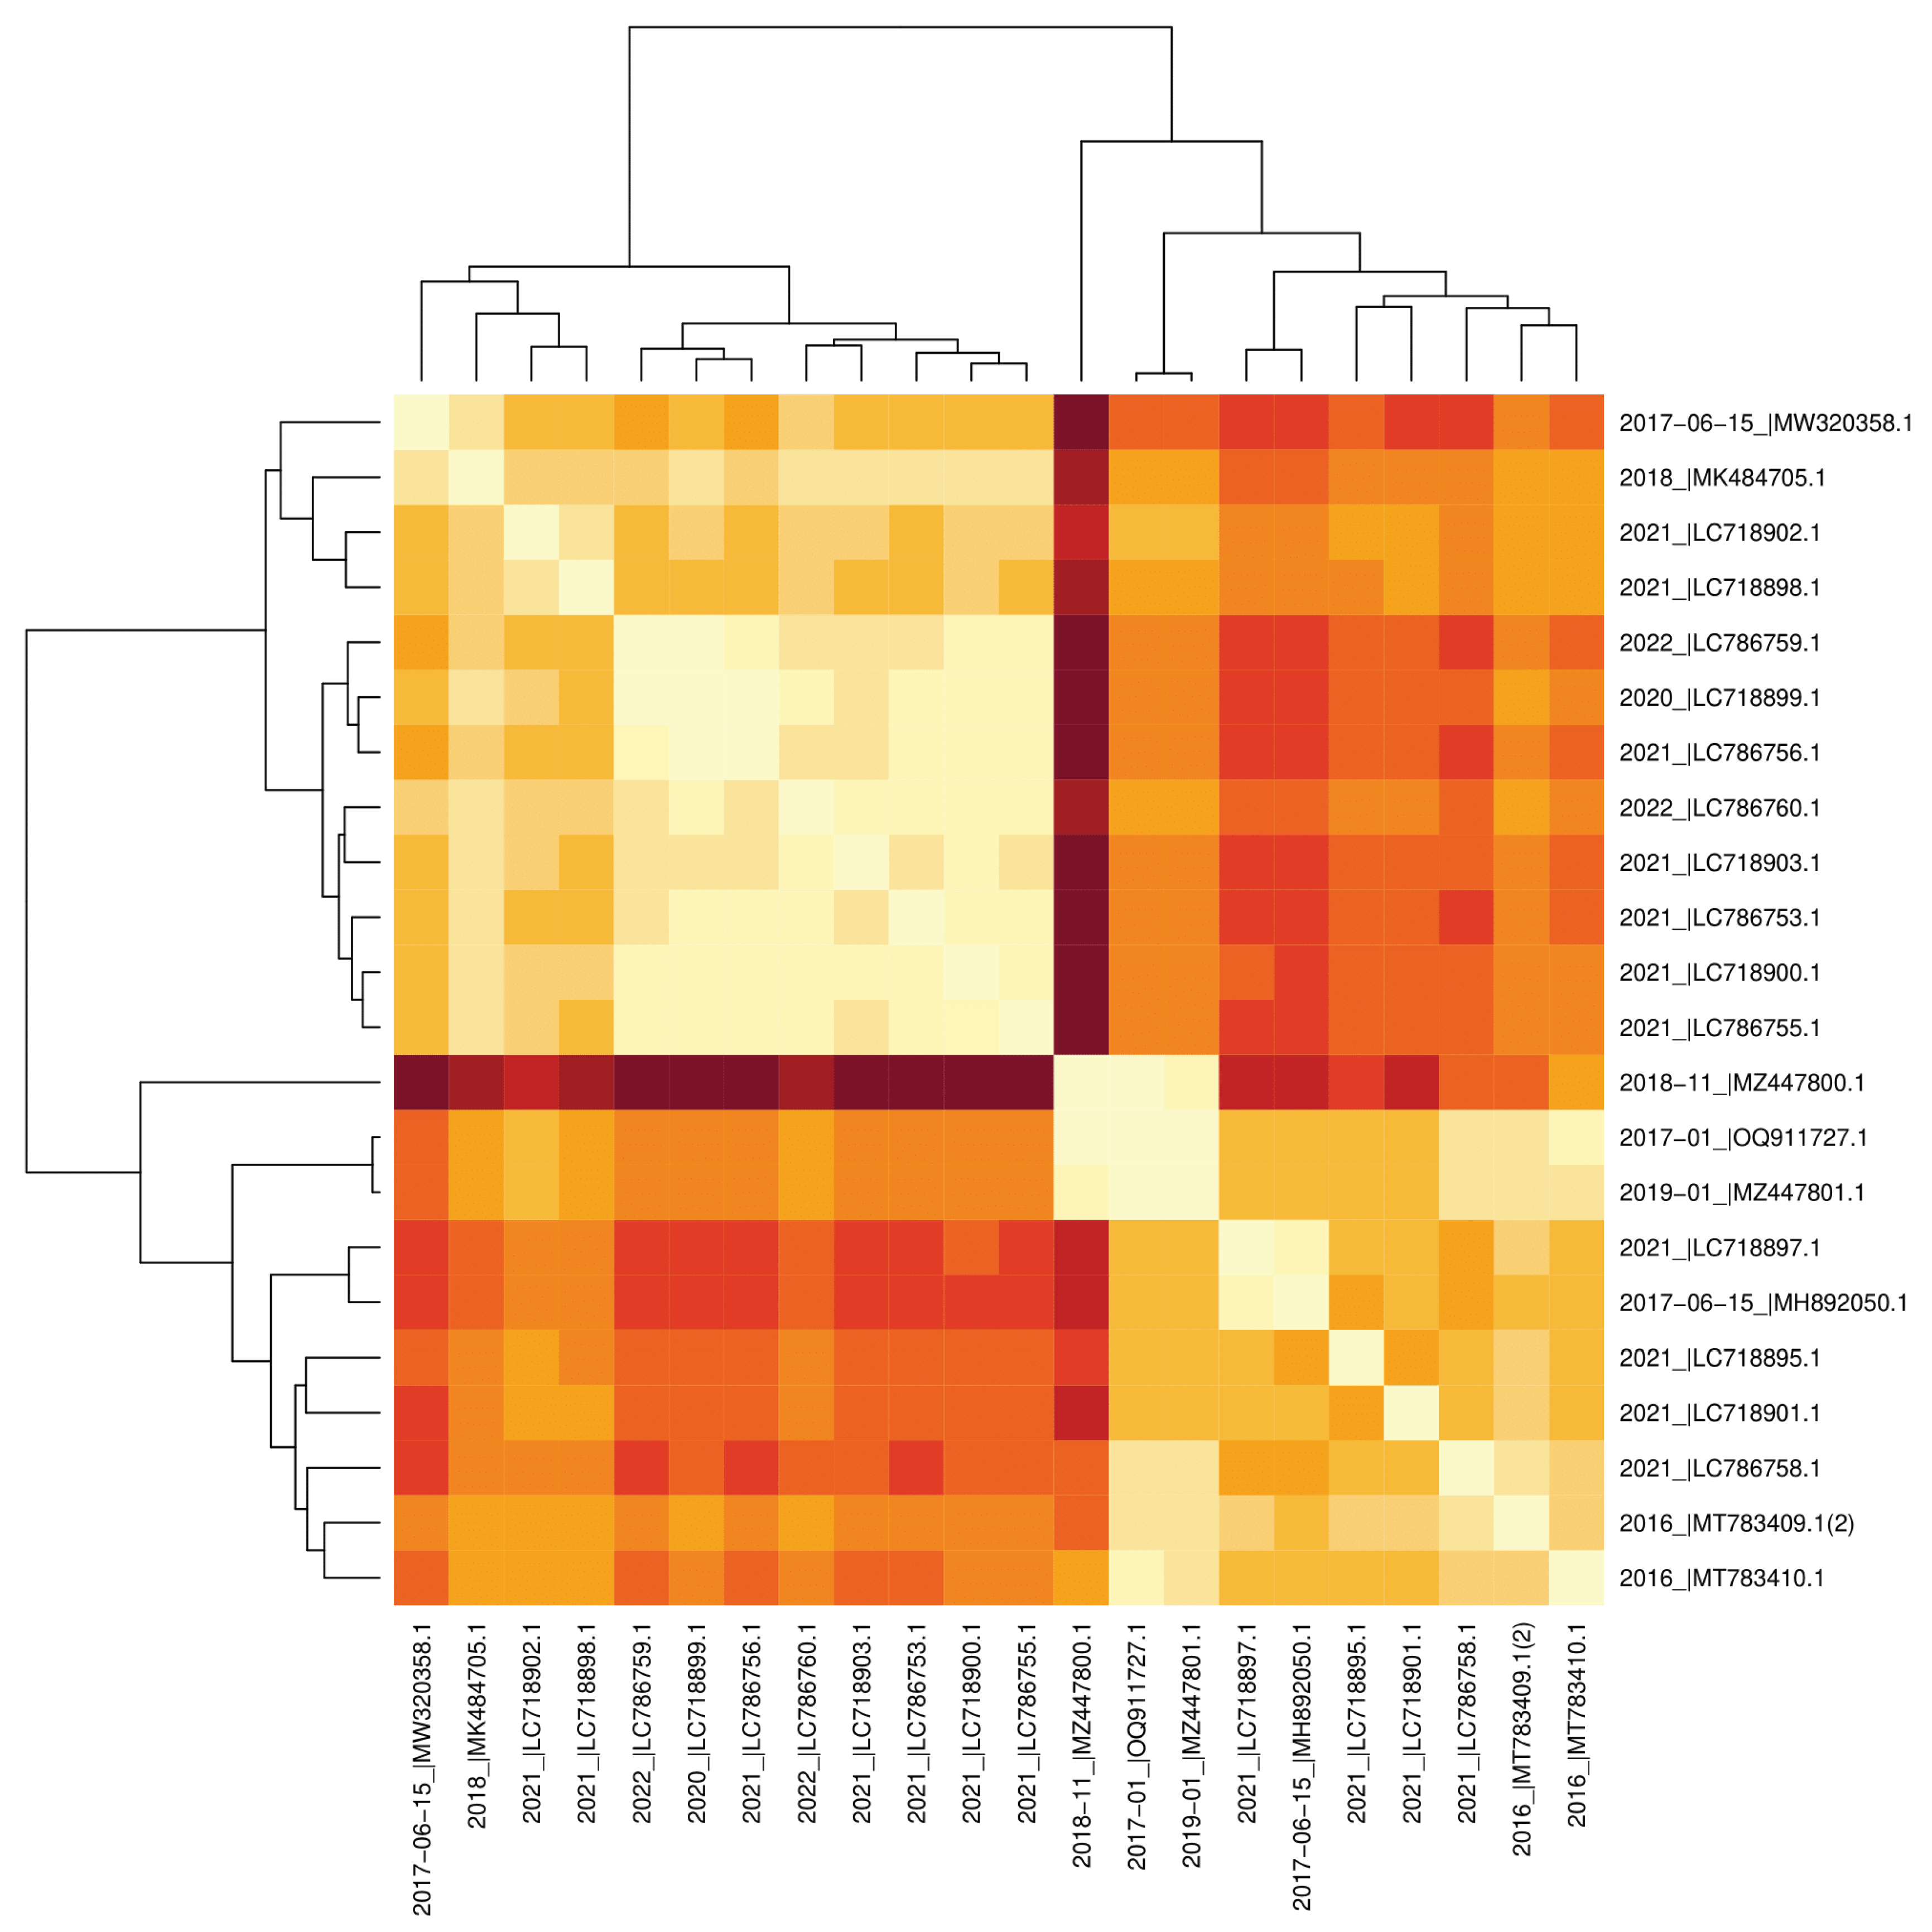
Visual output of the studied sequences yielded a heat map visualization, constructed through R code processing. The heat map employed a color gradient ranging from dark red (representing maximum distance) to light yellow (indicating decreasing distance), effectively illustrating the pairwise relationships between the sequences. Consistent with previous observations that can be demonstrated from
Figure 2,
Figure 3, and
Figure 5 so far appeared similarly from the heat-map; the presence of two distinct clustering. In addition to these two main clusters, the sequences that originated from Pakistan also have a significant degree of similarity. among themselves, as evidenced by
Figure 2 and
Figure 3. Among the two main clusters, the sequences whose phylogenetic affinity to each other can be clearly observed indicate the same sequences as the previously indicated in
Figure 2C which were
2021_|LC786755, 2021_|LC718900, 2021_|LC786753, 2021_|LC718903, 2022_|LC786760, 2021_|LC786756, 2020_|LC718899, and
2022_|LC786759. The only common point of all these 8 sequences showing a close phylogenetic relationship with each other is that they were uploaded from Japan according to the information checked from
Table 1, so again, the possibility of phylogenetic clustering based on the shared geographical origin of sequences can be highlighted as in the sequences submitted from Pakistan.
Figure 6.
Heatmap of the Studied Sequences. The heatmap graph of the studied nucleic acid sequences with their clustering that each branch of the clusters represents related sequences, nearer sequences are light-colored, and further distance is indicated with darker colors Each branch of the clusters represents related sequences.
In
Table 3, residue variabilities between the studied protein sequences were combined in a table. From this table, it was found that Asparagine was the most common amino acid at position 209, occurring in 19 out of 24 sequences (79.2%). Threonine was the second most common amino acid, occurring in the remaining 5 sequences (20.8%).
In the amino acid residue at position 76, a change from Proline to Threonine was observed in the protein sequence with BEU33878 accession, unlike the other 23 sequences. In the same sequence, again unlike the other 23 sequences, Serine was observed instead of Proline at the 79 locations.
Assuming, the Pro-to-Thr substitution is equivalent to the value of -1 found in the difference matrix. Similarly, if we apply the theory of substitution, the Pro-to-Ser difference would also be -1. [
26].
The protein sequence with accession number QQL88061 shows asparagine instead of aspartic acid at positions 127 and 153, which is unlike the other 23 sequences. Using the BLOSUM62 matrix, it can be seen that this change from Asp-to-Asn has a substitution that would have a value of +1 [
26]
. With a ratio of Asn209:Thr209 at 19:5, five isolates exhibit threonine protein location at 209. This particular difference is valued at zero when assuming a substitution from Asn-to-Thr according to the BLOSUM62 [
26].
In addition, amino acid substitutions were not observed in the nuclear localization signal region, located at the C terminus of the L1 protein sequence include about 22 amino acid, which is involved in the recruitment of karyopherin that mediates taking the viral genome into the host cell [
27,
28].
In our research, we also conducted a thorough comparison of the L1 protein sequence with the HPV 16 type reference sequence obtained from NCBI (NCBI Reference Sequence: NP_041332.2) [
29]. Our main area of focus was on the amino acid residues at specific locations that play a crucial role in initiating attachment which are at 54, 278, 356, and 361, in addition, each of these specific points, except 361K, is located in the hypervariable loops mentioned in the introduction section. 54K in BC loop, 278K in FG loop, and 356K in HI loop [
15,
30]. Upon conducting an alignment analysis of the reference sequence, it was discerned that the vital residues at positions 278, 356, and 361 retained their original Lysine amino acid composition. Hence, it can be inferred that Lysine remained present at these crucial locations.
DISCUSSION
This research delved into the L1 sequences of HPV 16, specifically focusing on the major capsid protein, at both the protein and nucleic acid levels. The sequences were sourced from a public database that covered the period since the approval of HPV vaccines in Asia. The primary objective was to discern and investigate any changes between these sequences. Furthermore, a comparative analysis was conducted to check the significant positions within the reference sequence that play a crucial role in the entry of virions and subsequently bind with heparan within the host organism.
The phylogenetic relationships of the sequences in the section in
Figure 2C are closer to each other, and all of these sequences were uploaded from Japan for the years 2020-2021-2022. The sequences uploaded to NCBI may have a common infectious connection since they are from the same country and have a phylogenetic common ancestor. However, this will stay a quite weak argument because of the expansion of geographic location. Also, it is hard to evaluate and discuss this argument numerically, and it is impossible to be sure without obtaining detailed information from the individuals from whom the isolates were collected.
Table 1 indicates that substitutions from Proline to Threonine or Serine, which carry a score of -1 in BLOSUM62, do not result in a loss of hydrophilic properties conferred by the R groups. According to the Kyte & Doolittle Scale, Proline, Threonine, and Serine exhibit hydropathy indexes of -1.6, -0.7, and -0.6, respectively [
31]. Also, because of their negative BLOSUM62 score, it could be stated that these substitutions are unlikely to transpire during evolutionary events [
26,
30]. Another observation regarding
Table 1 is the substitution from Asp-to-Asn, which boasts a BLOSUM62 score of +1, indicating its more expected or high likelihood occurrence [
26,
32]. Moreover, the two amino acids possess identical hydropathy indices of -3.5 on the Kyte & Doolittle scale and are highly hydrophilic [
31].
Table 1 reveals that all five isolates, with accession BDO24711, BEU33838, BEU33838, BEU33862, and BDO24719, displayed a substitution Asn-to-Thr at position 209. Although this change falls under the category of expected change with a BLOSUM62 matrix score of 0, the significant variance in the hydropathy index between Asn (-3.5) and Thr (-0.7) on the hydropathy index scale implies that the substitution may have a discernible effect [
26,
32]. Despite both amino acids having hydrophilic properties, this distinction in the hydropathy index indicates that the substitution may have an impact.
Figure 2.
The Phylogenetic Tree of Sequences Based on L1 Nucleotide Sequences. A) The unrooted rectangular phylogram here is created according to the nucleotide sequences of isolates on the R software. B) Upper section, first main group or cluster, of the phylogram. C) Lower section, second main group or cluster, of the phylogram.
Figure 3.
The Cluster Dendrogram. Cluster dendrogram graph of the nucleotide sequences. All sequences are named CollectionDate_|AccessionNumber. On the upper left of the panel, the height scale of the dendrogram was given. In the bottom-middle of the panel "as.dist(dmat)" and “hclust (*, "complete")” refer to the clustering algorithms.
Figure 4.
Alignment of the L1 Nucleic Acid Sequences of Selected Isolates. The graph was colored based on the nucleotides; the Red - Adenine, Yellow– Guanine, Green – Cytosine, Blue – Thymine, and Black indicate a missing. Numbers below the alignment table represent the positions of the nucleotides in the sequence.
Figure 5.
Circular Tree Based on Nucleic Acid Sequences of L1 Protein. Branch lengths are colour-scaled where blue refers to further distance, and brown refers to closer sequences.
Figure 5.
Circular Tree Based on Nucleic Acid Sequences of L1 Protein. Branch lengths are colour-scaled where blue refers to further distance, and brown refers to closer sequences.
Table 1.
Information of Selected Nucleotide Sequences from NCBI-Virus. The table contains the nucleotide sequences and their information after the preprocessing step of the dataset. NCBI accession number, collection date, geographic location, host, name of isolate, and length of nucleotide sequences, respectively.
| Accession |
Collection_Date |
Geo_Location |
Host |
Isolate |
Length |
Accession |
| MT783409 |
2016 |
China |
Homo sapiens |
|
7908 |
MT783409 |
| MT783410 |
2016 |
China |
Homo sapiens |
|
7906 |
MT783410 |
| OQ911727 |
2017 |
Pakistan |
Homo sapiens |
HNC49 |
7171 |
OQ911727 |
| MW320358 |
2017 |
China |
Homo sapiens |
|
7909 |
MW320358 |
| MH892050 |
2017 |
China |
Homo sapiens |
|
7905 |
MH892050 |
| MK484705 |
2018 |
China |
Homo sapiens |
xuca1916 |
7912 |
MK484705 |
| MZ447800 |
2018 |
Pakistan |
Homo sapiens |
C50 |
7909 |
MZ447800 |
| MZ447801 |
2019 |
Pakistan |
Homo sapiens |
C122 |
7155 |
MZ447801 |
| LC718899 |
2020 |
Japan |
Homo sapiens |
21-20-P-002 |
7905 |
LC718899 |
| LC786753 |
2021 |
Japan |
Homo sapiens |
SW0127 |
7905 |
LC786753 |
| LC786755 |
2021 |
Japan |
Homo sapiens |
SW0129 |
7905 |
LC786755 |
| LC786756 |
2021 |
Japan |
Homo sapiens |
SW0131 |
7905 |
LC786756 |
| LC786758 |
2021 |
Japan |
Homo sapiens |
SW0138 |
7909 |
LC786758 |
| LC718895 |
2021 |
Japan |
Homo sapiens |
K3131 |
7905 |
LC718895 |
| LC718897 |
2021 |
Japan |
Homo sapiens |
K5048 |
7905 |
LC718897 |
| LC718898 |
2021 |
Japan |
Homo sapiens |
K5060 |
7909 |
LC718898 |
| LC718900 |
2021 |
Japan |
Homo sapiens |
21-21-P-001 |
7905 |
LC718900 |
| LC718901 |
2021 |
Japan |
Homo sapiens |
21-21-P-007 |
7904 |
LC718901 |
| LC718902 |
2021 |
Japan |
Homo sapiens |
21-21-P-008 |
7905 |
LC718902 |
| LC718903 |
2021 |
Japan |
Homo sapiens |
21-21-P-011 |
7904 |
LC718903 |
| LC786759 |
2022 |
Japan |
Homo sapiens |
SW0142 |
7905 |
LC786759 |
| LC786760 |
2022 |
Japan |
Homo sapiens |
SW0152 |
7905 |
LC786760 |
Table 2.
Information of Selected Protein Sequences from NCBI-Virus. The table contains the protein sequences and their information after the preprocessing step of the dataset. NCBI accession number, collection date, geographic location, host, name of isolate, and length of protein sequences, respectively.
| Accession |
Collection_Date |
Geo_Location |
Host |
Isolate |
Length |
| QOI17574 |
2016 |
China |
Homo sapiens |
|
533 |
| QOI17579 |
2016 |
China |
Homo sapiens |
|
533 |
| WKC12512 |
2017 |
Pakistan |
Homo sapiens |
HNC49 |
531 |
| QQL88061 |
2017 |
China |
Homo sapiens |
|
531 |
| AYV61481 |
2017 |
China |
Homo sapiens |
|
531 |
| QEG53826 |
2018 |
China |
Homo sapiens |
xuca1916 |
531 |
| UNF16173 |
2018 |
Pakistan |
Homo sapiens |
C50 |
531 |
| UNF16181 |
2019 |
Pakistan |
Homo sapiens |
C122 |
531 |
| BDO24711 |
2020 |
Japan |
Homo sapiens |
21-20-P-002 |
531 |
| BEU33838 |
2021 |
Japan |
Homo sapiens |
SW0127 |
531 |
| BEU33854 |
2021 |
Japan |
Homo sapiens |
SW0129 |
531 |
| BEU33862 |
2021 |
Japan |
Homo sapiens |
SW0131 |
531 |
| BEU33878 |
2021 |
Japan |
Homo sapiens |
SW0138 |
531 |
| BDO24681 |
2021 |
Japan |
Homo sapiens |
K3131 |
531 |
| BDO24695 |
2021 |
Japan |
Homo sapiens |
K5048 |
531 |
| BDO24703 |
2021 |
Japan |
Homo sapiens |
K5060 |
531 |
| BDO24719 |
2021 |
Japan |
Homo sapiens |
21-21-P-001 |
531 |
| BDO24727 |
2021 |
Japan |
Homo sapiens |
21-21-P-007 |
531 |
| BDO24735 |
2021 |
Japan |
Homo sapiens |
21-21-P-008 |
531 |
| BDO24743 |
2021 |
Japan |
Homo sapiens |
21-21-P-011 |
531 |
| BEU33886 |
2022 |
Japan |
Homo sapiens |
SW0142 |
531 |
| BEU33894 |
2022 |
Japan |
Homo sapiens |
SW0152 |
531 |
Table 3.
Presence Inter-sequence Variabilities of Protein Sequences. In this table, protein sequences were compared with each other, and amino acids were represented with their one-letter codes. 5 residues were detected in terms of their differences compared to the majority and these are; 75, 77, 127, 153, and 209.
| Residues |
|
|
|
|
|
| Accession |
76 |
79 |
127 |
153 |
209 |
| QOI17574 |
P |
P |
D |
D |
N |
| QOI17579 |
P |
P |
D |
D |
N |
| WKC12512 |
P |
P |
D |
D |
N |
| QQL88061 |
P |
P |
N |
N |
N |
| AYV61481 |
P |
P |
D |
D |
N |
| QEG53826 |
P |
P |
D |
D |
N |
| UNF16173 |
P |
P |
D |
D |
N |
| UNF16181 |
P |
P |
D |
D |
N |
| BDO24711 |
P |
P |
D |
D |
T |
| BEU33838 |
P |
P |
D |
D |
T |
| BEU33854 |
P |
P |
D |
D |
T |
| BEU33862 |
P |
P |
D |
D |
T |
| BEU33878 |
T |
S |
D |
D |
N |
| BDO24681 |
P |
P |
D |
D |
N |
| BDO24695 |
P |
P |
D |
D |
N |
| BDO24703 |
P |
P |
D |
D |
N |
| BDO24719 |
P |
P |
D |
D |
T |
| BDO24727 |
P |
P |
D |
D |
N |
| BDO24735 |
P |
P |
D |
D |
N |
| BDO24743 |
P |
P |
D |
D |
N |
| BEU33886 |
P |
P |
D |
D |
T |
| BEU33894 |
P |
P |
D |
D |
N |
