Submitted:
02 March 2024
Posted:
04 March 2024
You are already at the latest version
Abstract
Keywords:
1. Introduction
2. Materials and Methods
3. Results
3.1. Biosensor Chip Preparation
3.2. Surface Plasmon Resonance (SPR) Binding Data
3.3. Predicting the Clofazimine Binding Site on S2 with Molecular Docking
3.4. Modeling a Series of Clofazimine Derivatives Binding to the S2 Segment
3.5. Modeling a Series of Clofazimine Derivatives Binding to Other SARS-CoV-2 Targets
4. Discussion
4.1. Possible Implications for Broad-Spectrum Antiviral Activity
4.2. Possible Implications for Spike-Dependent Mechanism of Action as a Fusion Inhibitor
5. Conclusions
Supplementary Materials
Author Contributions
Funding
Data Availability Statement
Acknowledgments
Conflicts of Interest
References
- Wang, X.; Cao, R.; Zhang, H.; Liu, J.; Xu, M.; Hu, H.; Li, Y.; Zhao, L.; Li, W.; Sun, X.; Yang, X.; Shi, Z.; Deng, F.; Hu, Z.; Zhong, W.; Wang, M. The anti-influenza virus drug, arbidol is an efficient inhibitor of SARS-CoV-2 in vitro. Cell Discov. 2020, 6, 28. [Google Scholar] [CrossRef] [PubMed]
- Xiao, X.; Wang, C.; Chang, D.; Wang, Y.; Dong, X.; Jiao, T.; Zhao, Z.; Ren, L.; Dela Cruz, C. S.; Sharma, L.; Lei, X.; Wang, J. Identification of Potent and Safe Antiviral Therapeutic Candidates Against SARS-CoV-2. Front. Immunol. 2020, 11, 586572. [Google Scholar] [CrossRef] [PubMed]
- Ke, Y. Y.; Peng, T. T.; Yeh, T. K.; Huang, W. Z.; Chang, S. E.; Wu, S. H.; Hung, H. C.; Hsu, T. A.; Lee, S. J.; Song, J. S.; Lin, W. H.; Chiang, T. J.; Lin, J. H.; Sytwu, H. K.; Chen, C. T. Artificial intelligence approach fighting COVID-19 with repurposing drugs. Biomed J. 2020, 43, 355. [Google Scholar] [CrossRef] [PubMed]
- Riva, L.; Yuan, S.; Yin, X.; Martin-Sancho, L.; Matsunaga, N.; Pache, L.; Burgstaller-Muehlbacher, S.; De Jesus, P. D.; Teriete, P.; Hull, M. V.; Chang, M. W.; Chan, J. F.; Cao, J.; Poon, V. K.; Herbert, K. M.; Cheng, K.; Nguyen, T. H.; Rubanov, A.; Pu, Y.; Nguyen, C.; Choi, A.; Rathnasinghe, R.; Schotsaert, M.; Miorin, L.; Dejosez, M.; Zwaka, T. P.; Sit, K. Y.; Martinez-Sobrido, L.; Liu, W. C.; White, K. M.; Chapman, M. E.; Lendy, E. K.; Glynne, R.J.; Albrecht, R.; Ruppin, E.; Mesecar, A. D.; Johnson, J. R.; Benner, C.; Sun, R.; Schultz, P. G.; Su, A. I.; García-Sastre, A.; Chatterjee, A. K.; Yuen, K. Y.; Chanda, S. K. Discovery of SARS-CoV-2 antiviral drugs through large-scale compound repurposing. Nature. 2020, 586, 113. [Google Scholar] [CrossRef] [PubMed]
- Yuan, S.; Yin, X.; Meng, X.; Chan, J. F.; Ye, Z. W.; Riva, L.; Pache, L.; Chan, C. C.; Lai, P. M.; Chan, C. C.; Poon, V. K.; Lee, A.C.; Matsunaga, N.; Pu, Y.; Yuen, C. K.; Cao, J.; Liang, R.; Tang, K.; Sheng, L.; Du, Y.; Xu, W.; Lau, C. Y.; Sit, K. Y.; Au, W.K.; Wang, R.; Zhang, Y. Y.; Tang, Y. D.; Clausen, T. M.; Pihl, J.; Oh, J.; Sze, K. H.; Zhang, A. J.; Chu, H.; Kok, K. H.; Wang, D.; Cai, X. H.; Esko, J. D.; Hung, I. F.; Li, R. A.; Chen, H.; Sun, H.; Jin, D. Y.; Sun, R.; Chanda, S. K.; Yuen, K. Y. Clofazimine broadly inhibits coronaviruses including SARS-CoV-2. Nature. 2021, 593, 418. [Google Scholar] [CrossRef]
- Mirabelli, C.; Wotring, J. W.; Zhang, C. J.; McCarty, S. M.; Fursmidt, R.; Pretto, C. D.; Qiao, Y.; Zhang, Y.; Frum, T.; Kadambi, N. S.; Amin, A. T.; O'Meara, T. R.; Spence, J. R.; Huang, J.; Alysandratos, K. D.; Kotton, D. N.; Handelman, S. K.; Wobus, C. E.; Weatherwax, K. J.; Mashour, G. A.; O'Meara, M. J.; Chinnaiyan, A. M.; Sexton, J. Z. Morphological cell profiling of SARS-CoV-2 infection identifies drug repurposing candidates for COVID-19. Proc Natl Acad Sci U S A. 2021, 118, e2105815118. [Google Scholar] [CrossRef] [PubMed]
- Wan, W.; Zhu, S.; Li, S.; Shang, W.; Zhang, R.; Li, H.; Liu, W.; Xiao, G.; Peng, K.; Zhang, L. High-Throughput Screening of an FDA-Approved Drug Library Identifies Inhibitors against Arenaviruses and SARS-CoV-2. ACS Infect Dis. 2021, 7, 1409. [Google Scholar] [CrossRef] [PubMed]
- Le, B. L.; Andreoletti, G.; Oskotsky, T.; Vallejo-Gracia, A.; Rosales, R.; Yu, K.; Kosti, I.; Leon, K. E.; Bunis, D. G.; Li, C.; Kumar, G. R.; White, K. M.; García-Sastre, A.; Ott, M.; Sirota, M. Transcriptomics-based drug repositioning pipeline identifies therapeutic candidates for COVID-19. Sci Rep. 2021, 11, 12310. [Google Scholar] [CrossRef] [PubMed]
- Ginex, T.; Garaigorta, U.; Ramírez, D.; Castro, V.; Nozal, V.; Maestro, I.; García-Cárceles, J.; Campillo, N. E.; Martinez, A.; Gastaminza, P.; Gil, C. Host-Directed FDA-Approved Drugs with Antiviral Activity against SARS-CoV-2 Identified by Hierarchical In Silico/In Vitro Screening Methods. Pharmaceuticals (Basel). 2021, 14, 332. [Google Scholar] [CrossRef]
- Aherfi, S.; Pradines, B.; Devaux, C.; Honore, S.; Colson, P.; Scola, B.; Raoult, D. Drug repurposing against SARS-CoV-1, SARS-CoV-2 and MERS-CoV. Future Microbiol. 2021, 16, 1341. [Google Scholar] [CrossRef]
- Kushwaha, N. D.; Mohan, J.; Kushwaha, B.; Ghazi, T.; Nwabuife, J. C.; Koorbanally, N.; Chuturgoon, A. A. A comprehensive review on the global efforts on vaccines and repurposed drugs for combating COVID-19. Eur J Med Chem. 2023, 260, 115719. [Google Scholar] [CrossRef] [PubMed]
- Li, G.; Hilgenfeld, R.; Whitley, R.; De Clercq, E. Therapeutic strategies for COVID-19: progress and lessons learned. Nat Rev Drug Discov. 2023, 22, 449. [Google Scholar] [CrossRef] [PubMed]
- Chan, S. W. Current and Future Direct-Acting Antivirals Against COVID-19. Front Microbiol. 2020, 11, 587944. [Google Scholar] [CrossRef] [PubMed]
- Cannalire, R.; Stefanelli, I.; Cerchia, C.; Beccari, A. R.; Pelliccia, S.; Summa, V. SARS-CoV-2 Entry Inhibitors: Small Molecules and Peptides Targeting Virus or Host Cells. Int J Mol Sci. 2020, 21, 5707. [Google Scholar] [CrossRef] [PubMed]
- Bobrowski, T.; Chen, L.; Eastman, RT.; Itkin, Z.; Shinn, P.; Chen, C. Z.; Guo, H.; Zheng, W.; Michael, S.; Simeonov, A.; Hall, M. D.; Zakharov, A. V.; Muratov, E. N. Synergistic and Antagonistic Drug Combinations against SARS-CoV-2. Mol Ther. 2021, 29, 873. [Google Scholar] [CrossRef] [PubMed]
- Chen, C.; Fang, J.; Chen, S.; Rajaofera, M. J. N.; Li, X.; Wang B, Xia Q. The efficacy and safety of remdesivir alone and in combination with other drugs for the treatment of COVID-19: a systematic review and meta-analysis. BMC Infect Dis. 2023, 23, 672. [Google Scholar] [CrossRef] [PubMed]
- Tian H, Yang C, Song T, Zhou K, Wen L, Tian Y, Tang L, Xu W, Zhang X. Efficacy and safety of paxlovid (nirmatrelvir/ritonavir) in the treatment of COVID-19: An updated meta-analysis and trial sequential analysis. Rev Med Virol. 2023, 33, e2473. [CrossRef] [PubMed]
- Akinosoglou K, Schinas G, Gogos C. Oral Antiviral Treatment for COVID-19: A Comprehensive Review on Nirmatrelvir/Ritonavir. Viruses 2022, 14, 2540. [Google Scholar] [CrossRef]
- Freidel, M. R.; Armen, R. S. Mapping major SARS-CoV-2 drug targets and assessment of druggability using computational fragment screening: Identification of an allosteric small-molecule binding site on the Nsp13 helicase. PLoS One. 2021, 16, e0246181. [Google Scholar] [CrossRef]
- Freidel, M. R.; Armen, R. S. Modeling the Structure-Activity Relationship of Arbidol Derivatives and Other SARS-CoV-2 Fusion Inhibitors Targeting the S2 Segment of the Spike Protein. J Chem Inf Model. 2021, 61, 5906. [Google Scholar] [CrossRef]
- Chen, C. Z.; Xu, M.; Pradhan, M.; Gorshkov, K.; Petersen, J. D.; Straus, M. R.; Zhu, W.; Shinn, P.; Guo, H.; Shen, M.; Klumpp-Thomas, C.; Michael, S.G.; Zimmerberg, J.; Zheng, W.; Whittaker, G. R. Identifying SARS-CoV-2 Entry Inhibitors through Drug Repurposing Screens of SARS-S and MERS-S Pseudotyped Particles. ACS Pharmacol. Transl. Sci. 2020, 3, 1165. [Google Scholar] [CrossRef]
- Riccardi, N.; Giacomelli, A.; Canetti, D.; Comelli, A.; Intini, E.; Gaiera, G.; Diaw, M. M.; Udwadia, Z.; Besozzi, G.; Codecasa, L.; Biagio, A. D. Clofazimine: an old drug for never-ending diseases. Future Microbiol. 2020, 15, 557. [Google Scholar] [CrossRef] [PubMed]
- Zhang, X.; Shi, Y.; Guo, Z.; Zhao, X.; Wu, J.; Cao, S.; Liu, Y.; Li, Y.; Huang, W.; Wang, Y.; Liu, Q.; Li, Y.; Song, D. Clofazimine derivatives as potent broad-spectrum antiviral agents with dual-target mechanism. Eur J Med Chem. 2022, 234, 114209. [Google Scholar] [CrossRef]
- Stadler, J. A. M.; Maartens, G.; Meintjes, G.; Wasserman, S. Clofazimine for the treatment of tuberculosis. Front Pharmacol. 2023, 14, 1100488. [Google Scholar] [CrossRef] [PubMed]
- Mirnejad, R.; Asadi, A.; Khoshnood, S.; Mirzaei, H.; Heidary, M.; Fattorini, L.; Ghodousi, A.; Darban-Sarokhalil, D. Clofazimine: A useful antibiotic for drug-resistant tuberculosis. Biomed Pharmacother. 2018, 105, 1353. [Google Scholar] [CrossRef]
- Falzon, D.; Schünemann, H. J.; Harausz, E.; González-Angulo, L.; Lienhardt, C.; Jaramillo, E.; Weyer, K. World Health Organization treatment guidelines for drug-resistant tuberculosis, 2016 update. Eur Respir J. 2017, 49, 1602308. [Google Scholar] [CrossRef]
- Egiz, A.; Gala, D. Clofazimine: another potential magic bullet for the treatment of COVID-19? Postgrad Med J. 2022, 98, e124. [Google Scholar] [CrossRef]
- Wang, D.; Loo, J. F. C.; Chen, J.; Yam, Y.; Chen, S.C.; He, H.; Kong, S. K.; Ho, H. P. Recent Advances in Surface Plasmon Resonance Imaging Sensors. Sensors (Basel). 2019, 19, 1266. [Google Scholar] [CrossRef] [PubMed]
- Nguyen, H. H.; Park, J.; Kang, S.; Kim, M. Surface plasmon resonance: a versatile technique for biosensor applications. Sensors (Basel). 2015, 15, 10481. [Google Scholar] [CrossRef]
- Vankadari, N. Arbidol: A potential antiviral drug for the treatment of SARS-CoV-2 by blocking trimerization of the spike glycoprotein. Int. J. Antimicrob. Agents. 2020, 56, 105998. [Google Scholar] [CrossRef]
- Shuster, A.; Pechalrieu, D.; Jackson, C. B.; Abegg, D.; Choe, H.; Adibekian, A. Clinical Antiviral Drug Arbidol Inhibits Infection by SARS-CoV-2 and Variants through Direct Binding to the Spike Protein. ACS Chem Biol. 2021, 16, 2845. [Google Scholar] [CrossRef] [PubMed]
- O'Connell, N. Protein Ligand Interactions Using Surface Plasmon Resonance. Methods Mol Biol. 2021, 2365, 3. [Google Scholar]
- Frostell-Karlsson, A.; Remaeus, A.; Roos, H.; Andersson, K.; Borg, P.; Hämäläinen, M.; Karlsson, R. Biosensor analysis of the interaction between immobilized human serum albumin and drug compounds for prediction of human serum albumin binding levels. J Med Chem. 2000, 43, 1986. [Google Scholar] [CrossRef]
- Brooks, B. R.; Brooks 3rd, C. L.; Mackerell Jr, A. D.; Nilsson, L.; Petrella, R.J.; Roux, B.; Won, Y.; Archontis, G.; Bartels, C.; Boresch, S.; Caflisch, A.; Caves, L.; Cui, Q.; Dinner, A. R.; Feig, M.; Fischer, S.; Gao, J.; Hodoscek, M.; Im, W.; Kuczera, K.; Lazaridis, T.; Ma, J.; Ovchinnikov, V.; Paci, E.; Pastor, R. W.; Post, C. B.; Pu, J. Z.; Schaefer, M.; Tidor, B.; Venable, R. M.; Woodcock, H. L.; Wu, X.; Yang, W.; York, D. M.; Karplus, M. CHARMM: the biomolecular simulation program. J. Comput. Chem. 2009, 30, 1545. [Google Scholar] [CrossRef]
- Rahaman, O.; Estrada, T. P.; Doren, D. J.; Taufer, M.; Brooks 3rd, C. B.; Armen, R. S. Evaluation of several two-step scoring functions based on linear interaction energy, effective ligand size, and empirical pair potentials for prediction of protein-ligand binding geometry and free energy. J. Chem. Inf. Model. 2011, 51, 2047. [Google Scholar] [CrossRef]
- Armen, R. S.; Chen, J.; Brooks 3rd, C. B. An Evaluation of Explicit Receptor Flexibility in Molecular Docking Using Molecular Dynamics and Torsion Angle Molecular Dynamics. J. Chem. Theory Comput. 2009, 5, 2909. [Google Scholar] [CrossRef]
- Momany, F. A.; Rone, R. Validation of the general purpose QUANTA® 3.2/CHARMm® force field. J Comput Chem. 1992, 13, 888. [Google Scholar] [CrossRef]
- Roche, O.; Kiyama, R.; Brooks, C. L. 3rd. Ligand-protein database: linking protein-ligand complex structures to binding data. J Med Chem. 2001, 44, 3592. [Google Scholar] [CrossRef] [PubMed]
- Lee, M. S.; Feig, M.; Salsbury, Jr., F. R.; Brooks, C. L. 3rd. New analytic approximation to the standard molecular volume definition and its application to generalized Born calculations. J. Comput. Chem. 2003, 24, 1348. [Google Scholar] [CrossRef]
- Feig, M.; Im, W.; Brooks, C. L. 3rd. Performance comparison of generalized born and Poisson methods in the calculation of electrostatic solvation energies for protein structures J. Chem. Phys. 2004, 2, 903. [Google Scholar]
- Available at: http://www.chemaxon.com.
- Walls, A. C.; Park, Y.-J.; Tortorici, M. A.; Wall, A.; McGuire, A. T.; Veesler, D. Structure, Function, and Antigenicity of the SARS-CoV-2 Spike Glycoprotein. Cell. 2020, 181, 281–292. [Google Scholar] [CrossRef]
- https://www.rcsb.org/structure/6W63.
- Jia, Z.; Yan, L.; Ren, Z.; Wu, L.; Wang, J.; Guo, J.; Zheng, L.; Ming, Z.; Zhang, L.; Lou, Z.; Rao, Z. Delicate structural coordination of the Severe Acute Respiratory Syndrome coronavirus Nsp13 upon ATP hydrolysis. Nucleic Acids Res. 2019, 47, 6538. [Google Scholar] [CrossRef]
- https://www.rcsb.org/structure/6WKQ.
- Pettersen, E. F.; Goddard, T. D.; Huang, C. C.; Couch, G. S.; Greenblatt, D. M.; Meng, E. C.; Ferrin, T. E. UCSF Chimera--a visualization system for exploratory research and analysis. J Comput Chem. 2004, 25, 1605. [Google Scholar] [CrossRef]
- Jeon, S.; Ko, M.; Lee, J.; Choi, I.; Byun, S. Y.; Park, S.; Shum, D.; Kim, S. Identification of Antiviral Drug Candidates against SARS-CoV-2 from FDA-Approved Drugs. Antimicrob Agents Chemother. 2020, 64, e00819–20. [Google Scholar] [CrossRef]
- Yang, L.; Pei, R. J.; Li, H.; Ma, X. N.; Zhou, Y.; Zhu, F. H.; He, P. L.; Tang, W.; Zhang, Y, C; Xiong, J.; Xiao, S. Q.; Tong, X. K.; Zhang, B.; Zuo, J. P. Identification of SARS-CoV-2 entry inhibitors among already approved drugs. Acta Pharmacol Sin. 2021, 42, 1347. [Google Scholar] [CrossRef]
- Braga, L.; Ali, H.; Secco, I.; Chiavacci, E.; Neves, G.; Goldhill, D.; Penn, R.; Jimenez-Guardeño, J. M.; Ortega-Prieto, A. M.; Bussani, R.; Cannatà, A.; Rizzari, G.; Collesi, C.; Schneider, E.; Arosio, A.; Shah, A. M.; Barclay, W. S.; Malim, M. H.; Burrone, J.; Giacca, M. Drugs that inhibit TMEM16 proteins block SARS-CoV-2 spike-induced syncytia. Nature 2021, 594, 88. [Google Scholar] [CrossRef]
- Sakkal, L. A.; Rajkowski, K. Z.; Armen, R. S. Prediction of consensus binding mode geometries for related chemical series of positive allosteric modulators of adenosine and muscarinic acetylcholine receptors. J Comput Chem. 2017, 38, 1209. [Google Scholar] [CrossRef]
- Guo, L.; Lin, S.; Chen, Z.; Cao, Y.; He, B.; Lu, G. Targetable elements in SARS-CoV-2 S2 subunit for the design of pan-coronavirus fusion inhibitors and vaccines. Signal Transduct Target Ther. 2023, 8, 197. [Google Scholar] [CrossRef]
- Bangaru, S.; Antanasijevic, A.; Kose, N.; Sewall, L. M.; Jackson, A. M.; Suryadevara, N.; Zhan, X.; Torres, J. L.; Copps, J.; Torrents de la Peña, A.; Crowe Jr, J. E.; Ward, A. B. Structural mapping of antibody landscapes to human betacoronavirus spike proteins. Sci Adv. 2022, 8, eabn2911. [Google Scholar] [CrossRef]
- Pronker, M. F.; Creutznacher, R.; Drulyte, I.; Hulswit, R. J. G.; Li, Z.; van Kuppeveld, F. J. M.; Snijder, J.; Lang, Y.; Bosch, B. J.; Boons, G. J.; Frank, M.; de Groot, R. J.; Hurdiss, D. L. Sialoglycan binding triggers spike opening in a human coronavirus. Nature. 2023. [Google Scholar] [CrossRef]
- Li, Z.; Tomlinson, A. C.; Wong, A. H.; Zhou, D.; Desforges, M.; Talbot, P. J.; Benlekbir, S.; Rubinstein, J.L.; Rini, J. M. The human coronavirus HCoV-229E S-protein structure and receptor binding. Elife. 2019, 8, e51230. [Google Scholar] [CrossRef]
- Yu, J.; Qiao, S.; Guo, R.; Wang, X. Cryo-EM structures of HKU2 and SADS-CoV spike glycoproteins provide insights into coronavirus evolution. Nat Commun. 2020, 11, 3070. [Google Scholar] [CrossRef]
- Zannella, C.; Chianese, A.; Greco, G.; Santella, B.; Squillaci, G.; Monti, A.; Doti, N.; Sanna, G.; Manzin, A.; Morana, A.; De Filippis, A.; D'Angelo, G.; Palmieri, F.; Franci, G.; Galdiero, M. Design of Three Residues Peptides against SARS-CoV-2 Infection. Viruses. 2022, 14, 2103. [Google Scholar] [CrossRef]
- Cai, Y.; Zhang, J.; Xiao, T.; Peng, H.; Sterling, S. M.; Walsh Jr, R. M.; Rawson, S.; Rits-Volloch, S.; Chen, B. Distinct conformational states of SARS-CoV-2 spike protein. Science. 2020, 369, 1586. [Google Scholar] [CrossRef]
- Cappelletto, A.; Allan, H. E.; Crescente, M.; Schneider, E.; Bussani, R.; Ali, H.; Secco, I.; Vodret, S.; Simeone, R.; Mascaretti, L.; Zacchigna, S.; Warner, T. D.; Giacca, M. SARS-CoV-2 Spike protein activates TMEM16F-mediated platelet procoagulant activity. Front Cardiovasc Med. 2023, 9, 1013262. [Google Scholar] [CrossRef]
- Kakarla, V.; Kaneko, N.; Nour, M.; Khatibi, K.; Elahi, F.; Liebeskind, D. S.; Hinman, J. D. Pathophysiologic mechanisms of cerebral endotheliopathy and stroke due to Sars-CoV-2. J Cereb Blood Flow Metab. 2021, 41, 1179. [Google Scholar] [CrossRef]
- Albornoz, E. A.; Amarilla, A. A.; Modhiran, N.; Parker, S.; Li, X. X.; Wijesundara, D. K.; Aguado, J.; Zamora, A. P.; McMillan, C. L. D.; Liang, B.; Peng, N.Y.G.; Sng, J.D.J.; Saima, F.T.; Fung, J.N.; Lee, J. D.; Paramitha, D.; Parry, R.; Avumegah, M. S.; Isaacs, A.; Lo, M.W.; Miranda-Chacon, Z.; Bradshaw, D.; Salinas-Rebolledo, C.; Rajapakse, N.W.; Wolvetang, E.J.; Munro, T.P.; Rojas-Fernandez, A.; Young, P. R.; Stacey, K. J.; Khromykh, A. A.; Chappell, K. J.; Watterson, D.; Woodruff, T. M. SARS-CoV-2 drives NLRP3 inflammasome activation in human microglia through spike protein. Mol Psychiatry. 2023, 28, 2878. [Google Scholar] [CrossRef]
- Peng, Q.; Zhou, R.; Liu, N.; Wang, H.; Xu, H.; Zhao, M.; Yang, D.; Au, K. K.; Huang, H.; Liu, L.; Chen, Z. Naturally occurring spike mutations influence the infectivity and immunogenicity of SARS-CoV-2. Cell Mol Immunol. 2022, 19, 1302. [Google Scholar] [CrossRef]
- Fernández-de-Las-Peñas, C.; Cancela-Cilleruelo, I.; Rodríguez-Jiménez, J.; Arias-Navalón, J.A.; Martín-Guerrero, J. D.; Pellicer-Valero, O. J.; Arendt-Nielsen, L.; Cigarán-Méndez, M. Trajectory of post-COVID brain fog, memory loss, and concentration loss in previously hospitalized COVID-19 survivors: the LONG-COVID-EXP multicenter study. Front Hum Neurosci. 2023, 17, 1259660. [Google Scholar] [CrossRef]
- Volk, P.; Manesh, M. R.; Warren, M. E.; Besko, K.; Gonçalves de Andrade, E.; Wicki-Stordeur, L. E.; Swayne, L. A. Long-term neurological dysfunction associated with COVID-19: Lessons from influenza and inflammatory diseases? J Neurochem. 2023. [Google Scholar] [CrossRef]
- Zhang, Q.; Tang, W.; Stancanelli, E.; Jung, E.; Syed, Z.; Pagadala, V.; Saidi, L.; Chen, C. Z.; Gao, P.; Xu, M.; Pavlinov, I.; Li, B.; Huang, W.; Chen, L.; Liu, J.; Xie, H.; Zheng, W.; Ye, Y. Host heparan sulfate promotes ACE2 super-cluster assembly and enhances SARS-CoV-2-associated syncytium formation. Nat Commun. 2023, 14, 5777. [Google Scholar] [CrossRef] [PubMed]
- Baldari, C. T.; Onnis, A.; Andreano, E.; Del Giudice, G.; Rappuoli, R. Emerging roles of SARS-CoV-2 Spike-ACE2 in immune evasion and pathogenesis. Trends Immunol. 2023, 44, 424. [Google Scholar] [CrossRef] [PubMed]
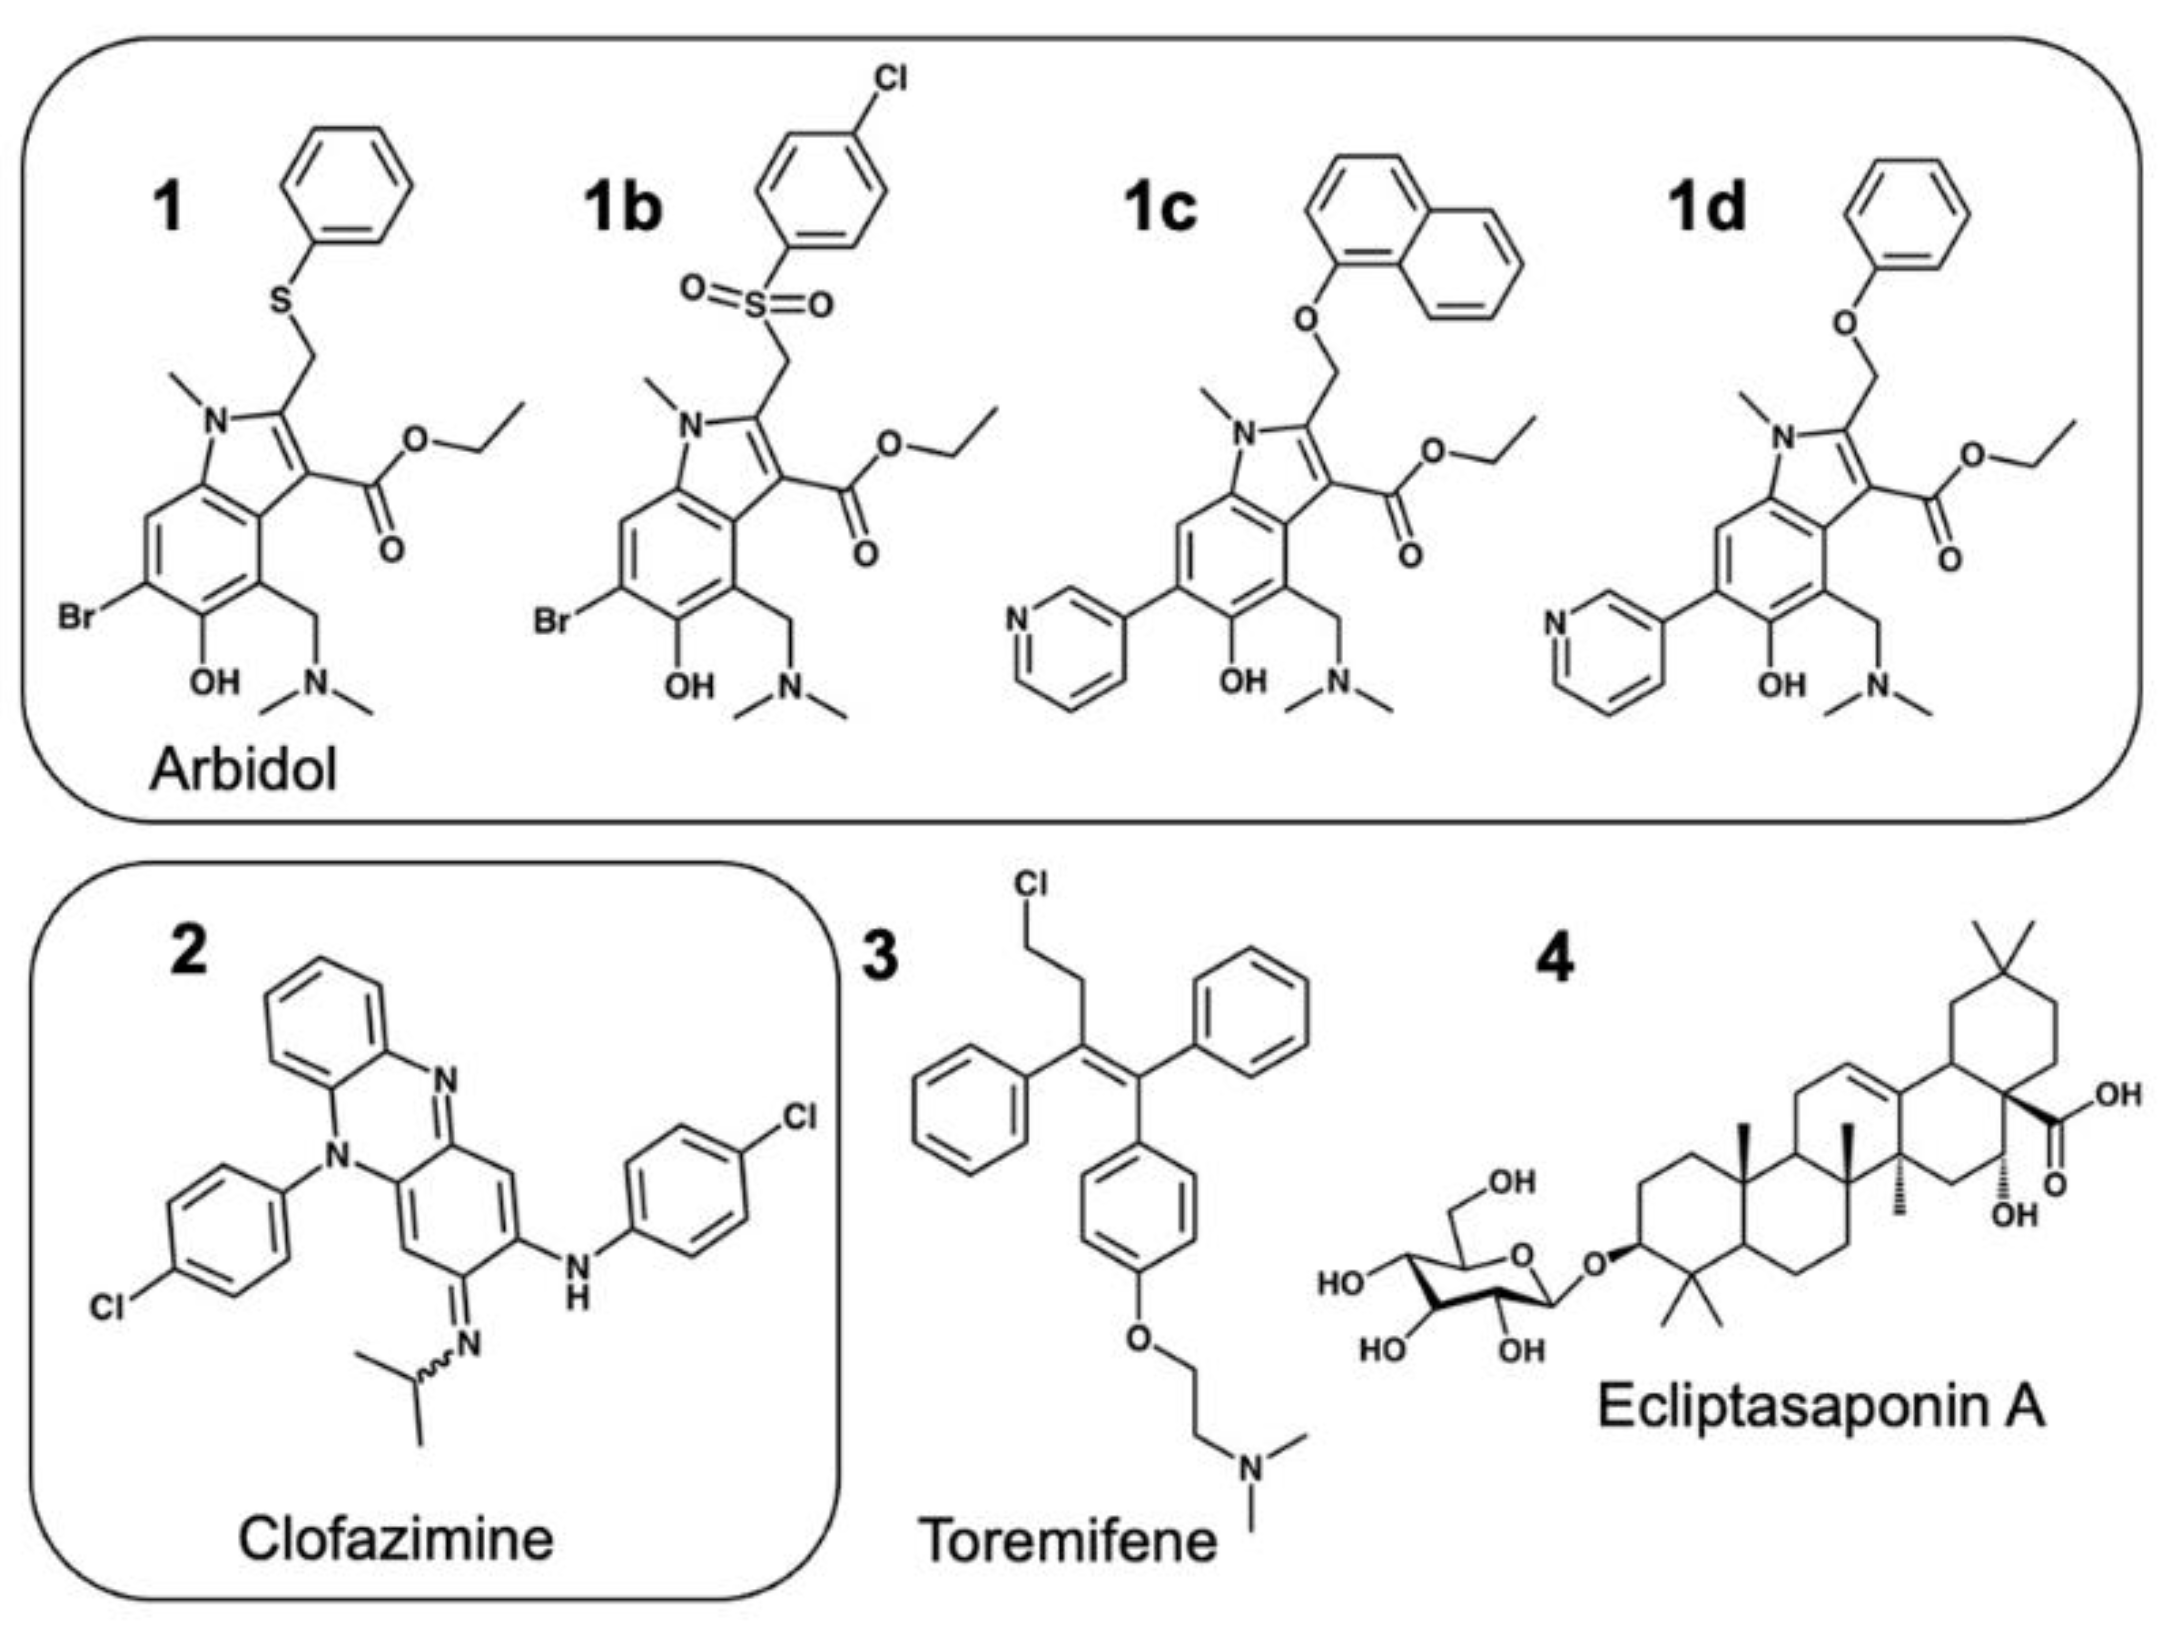
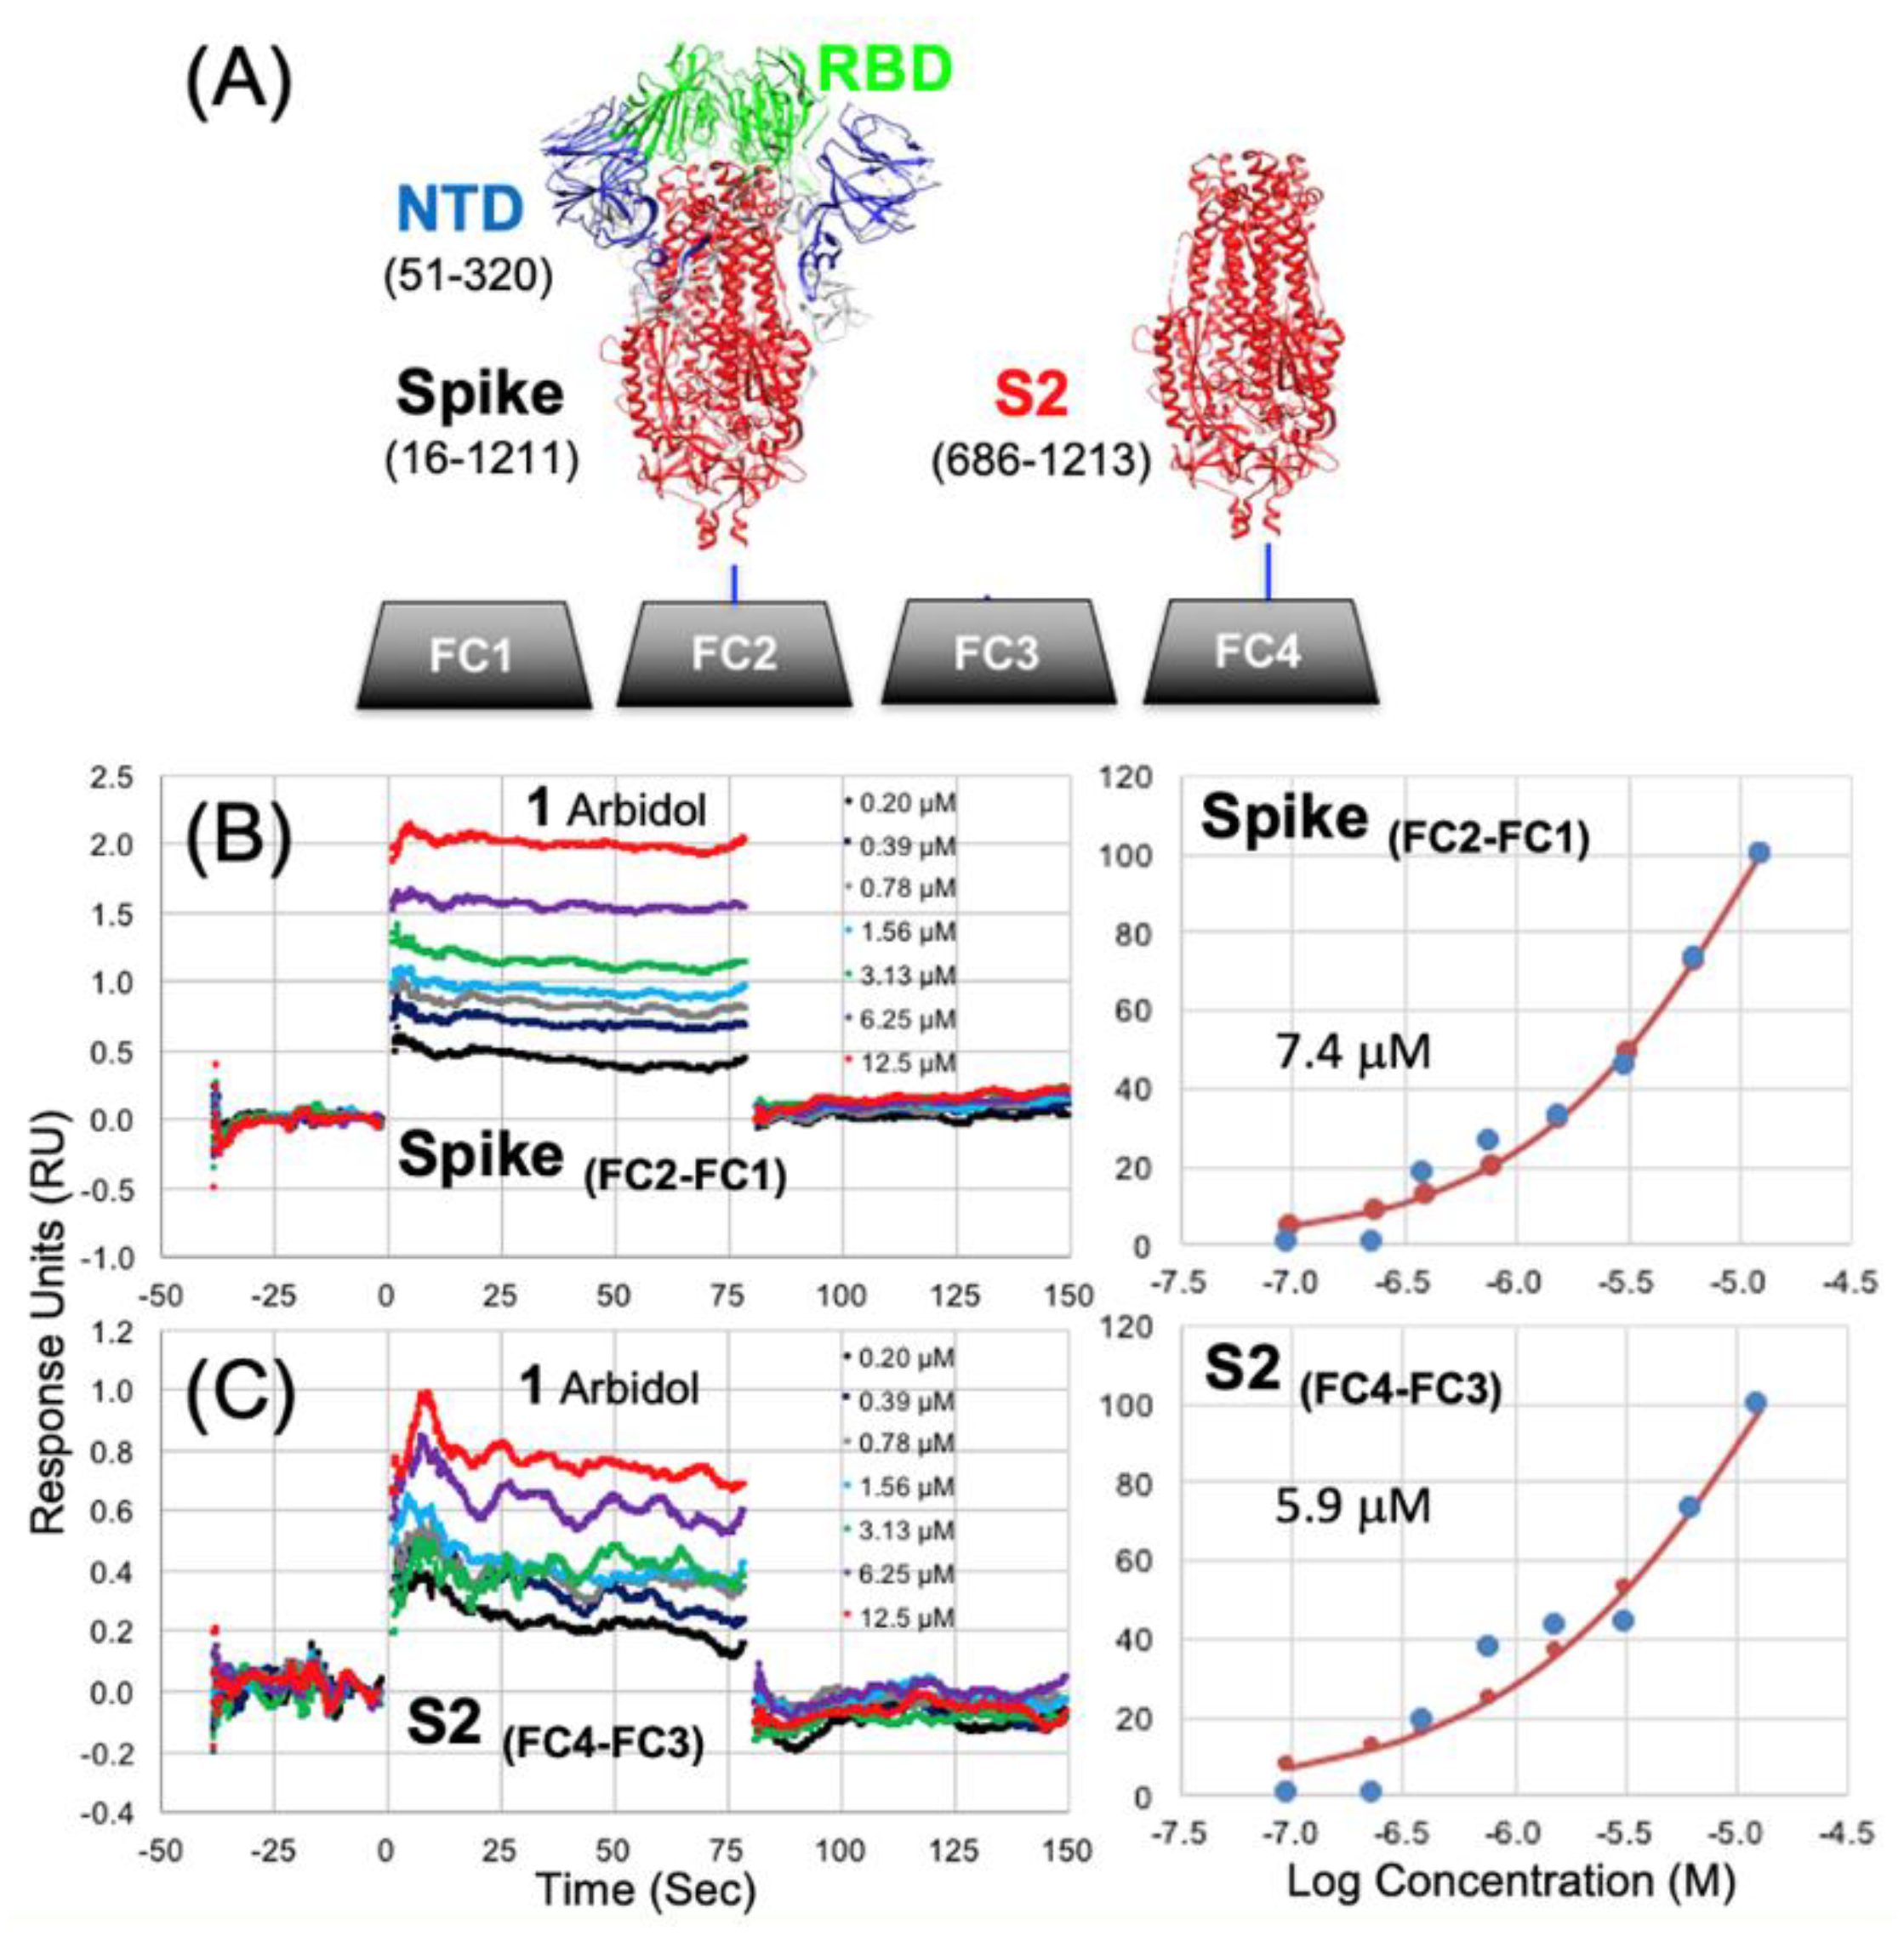
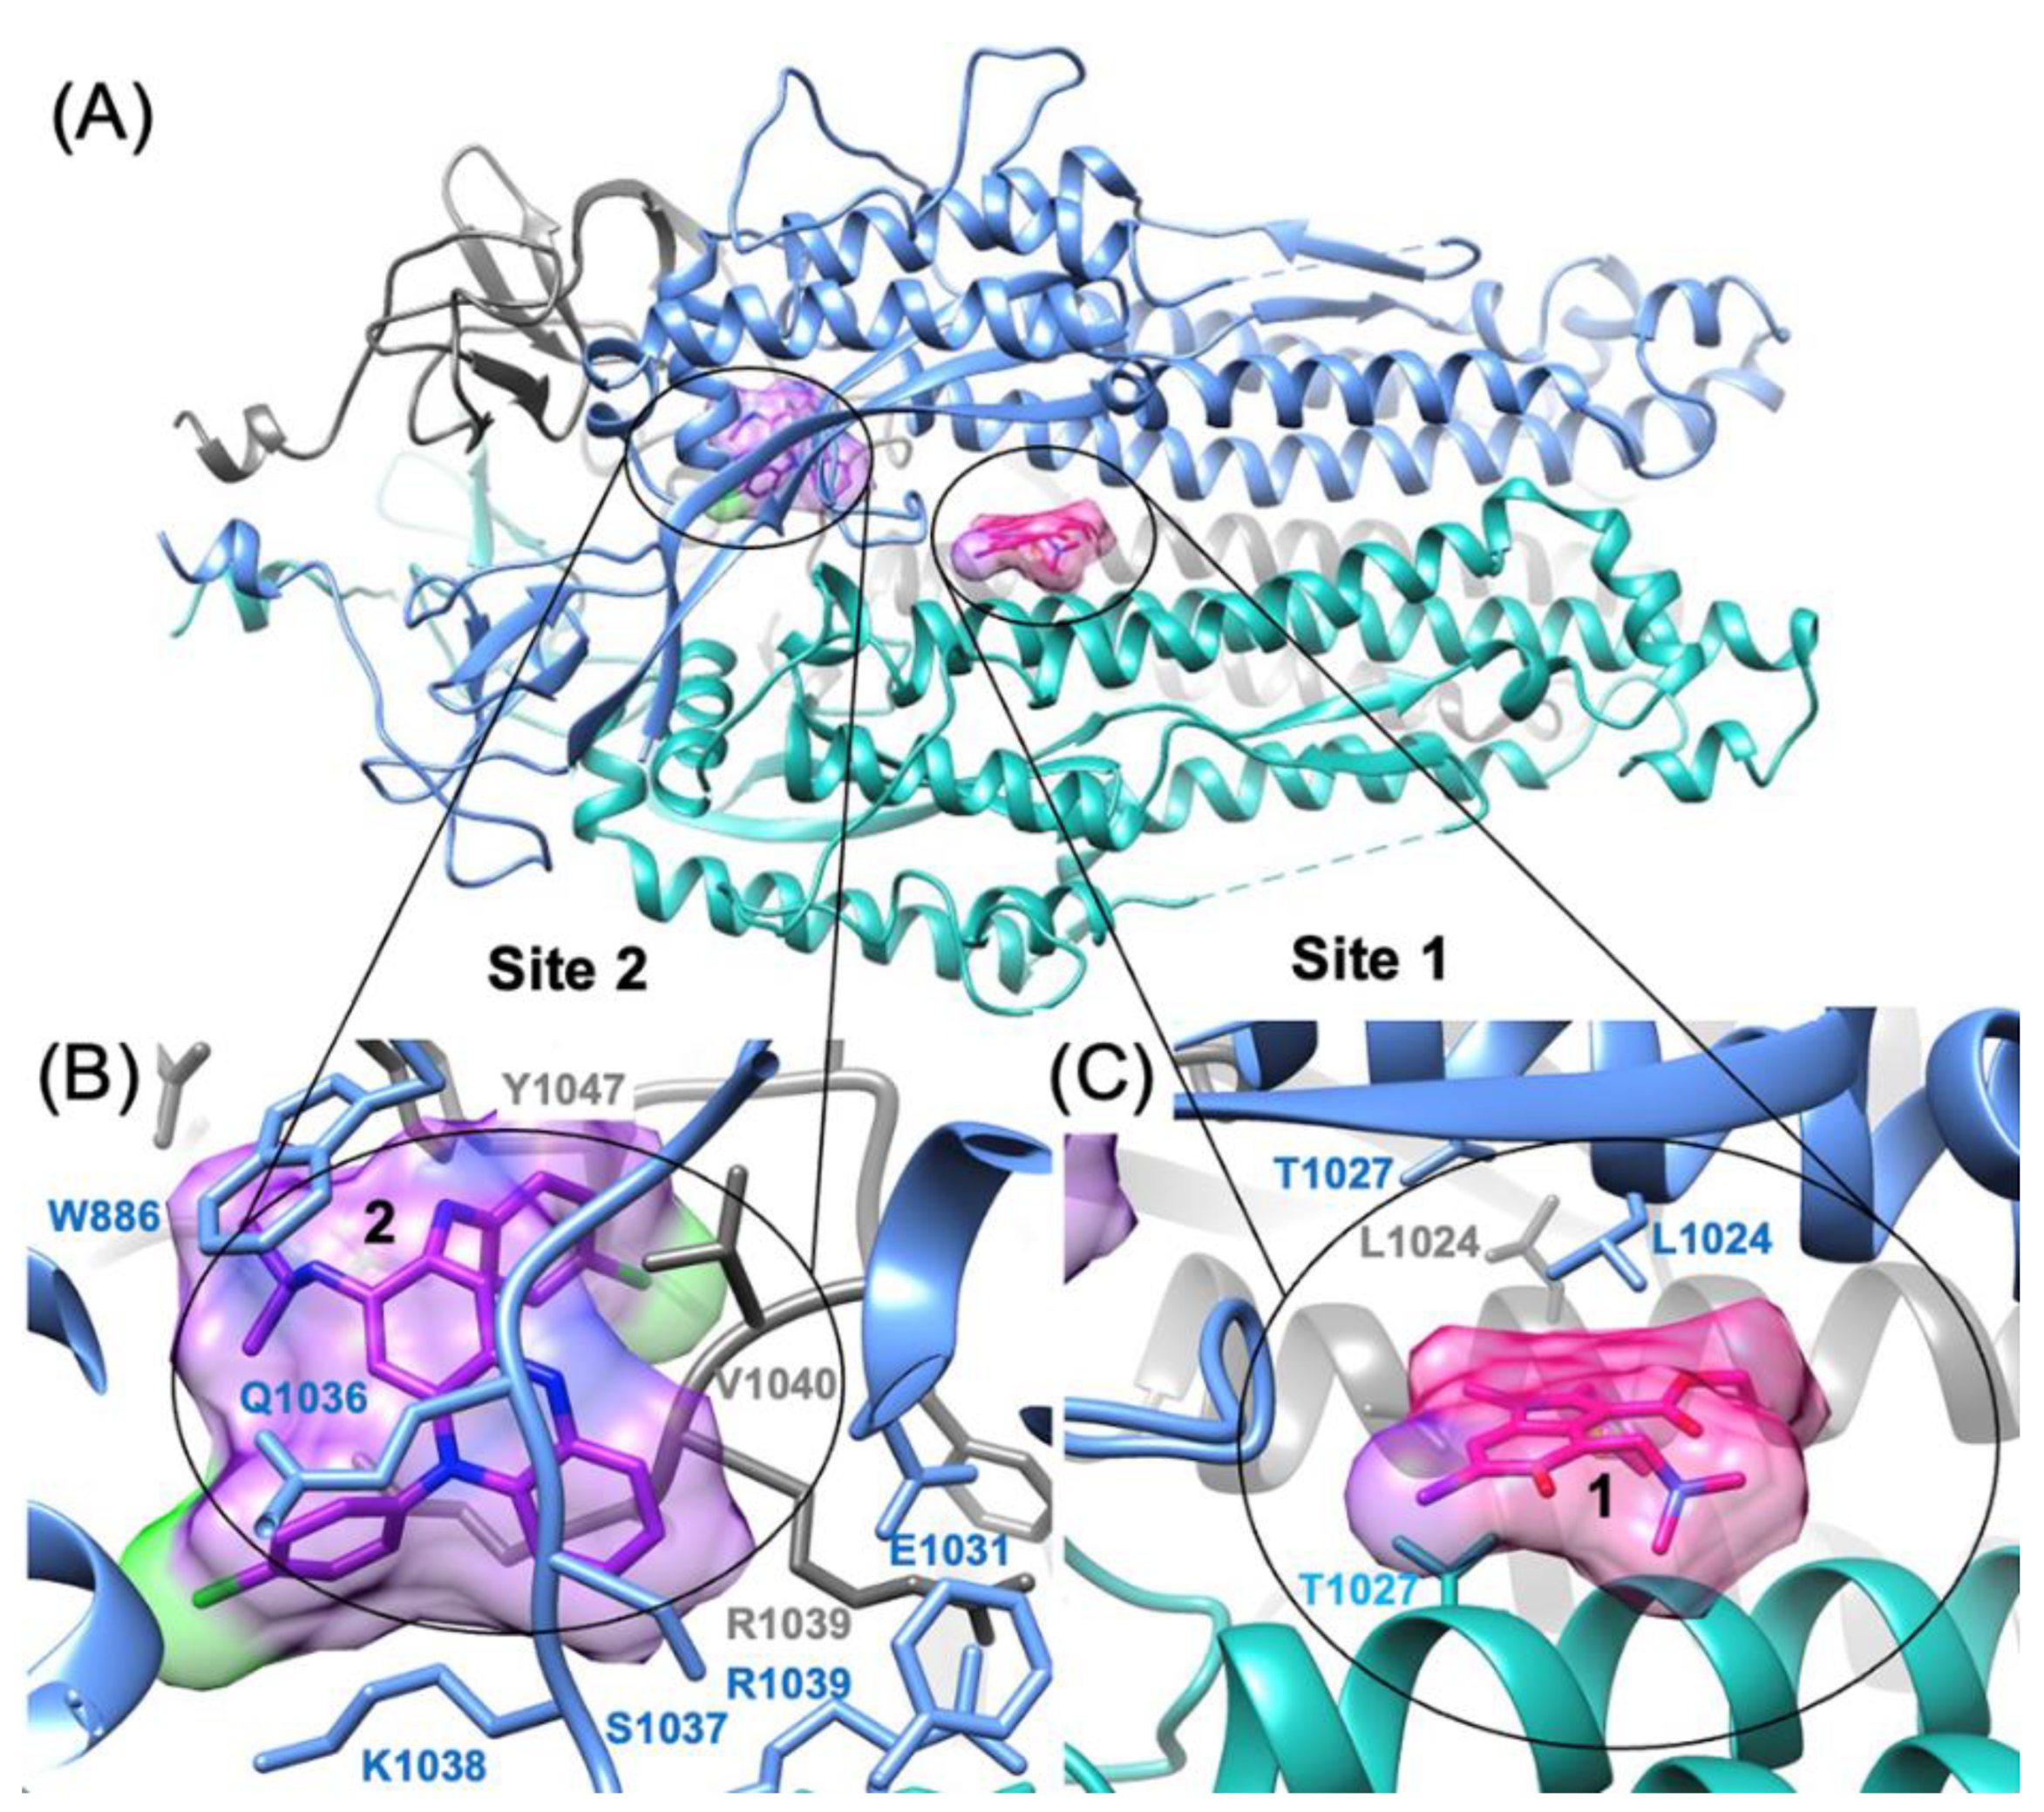
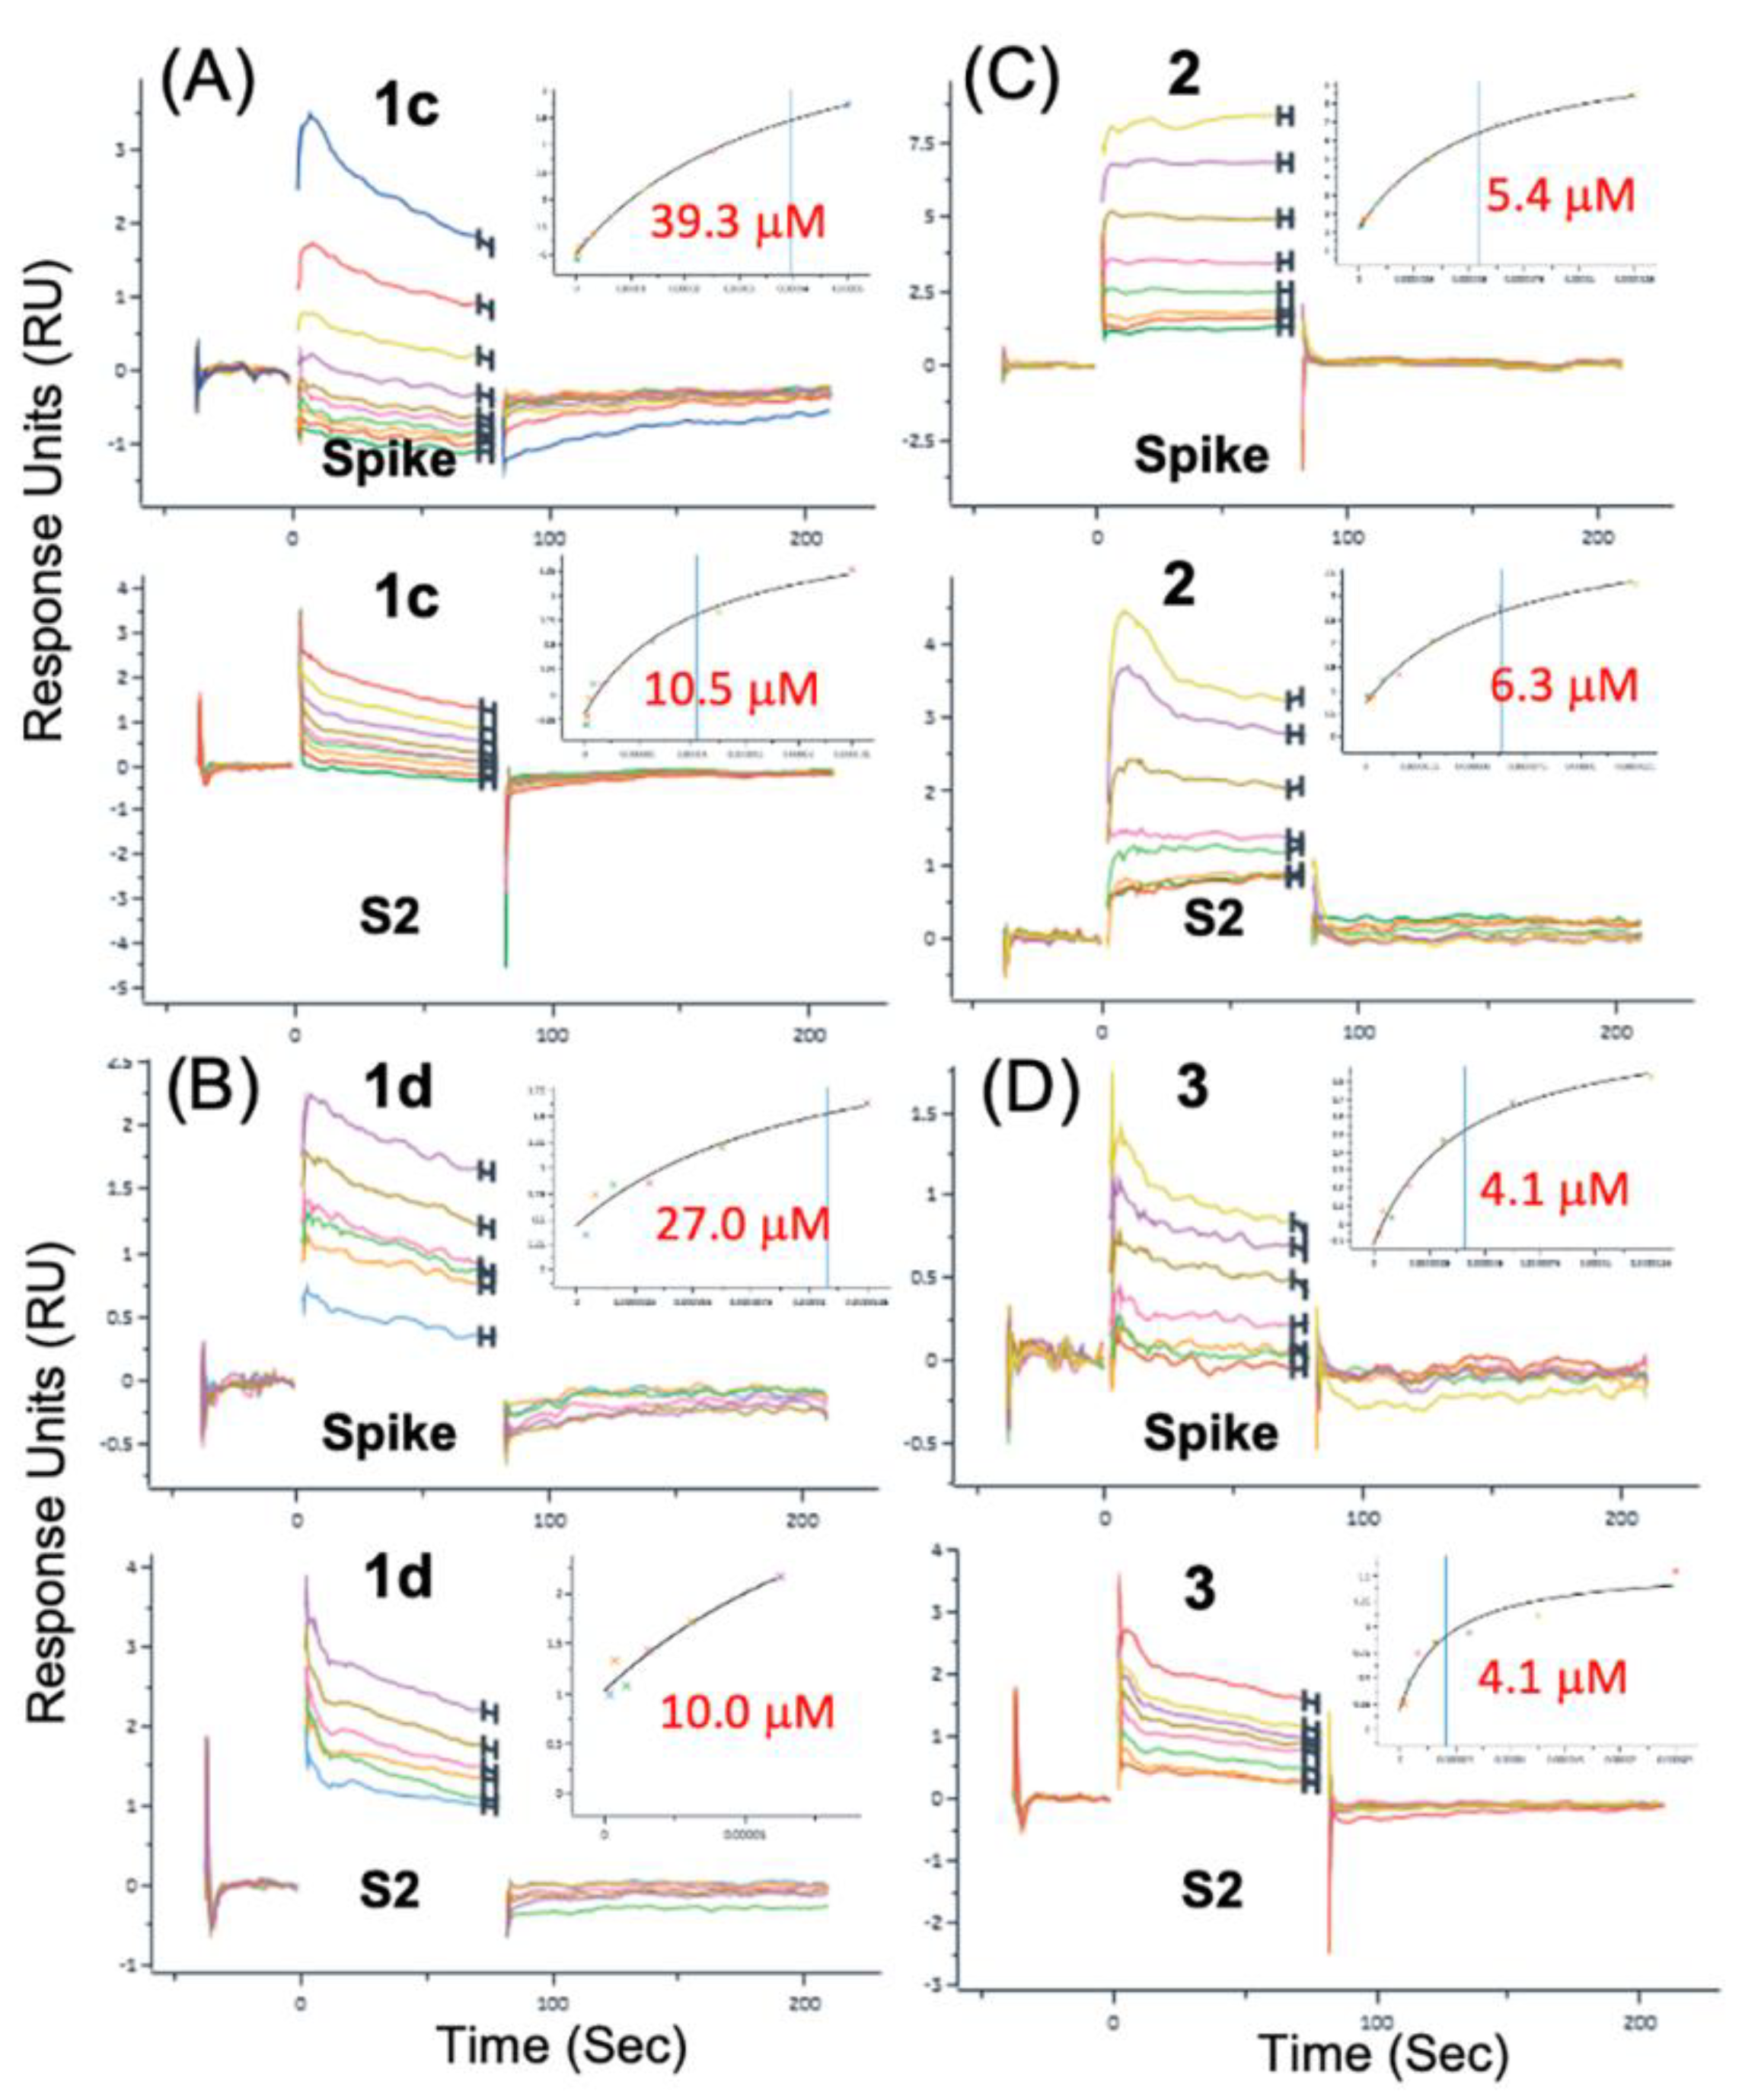
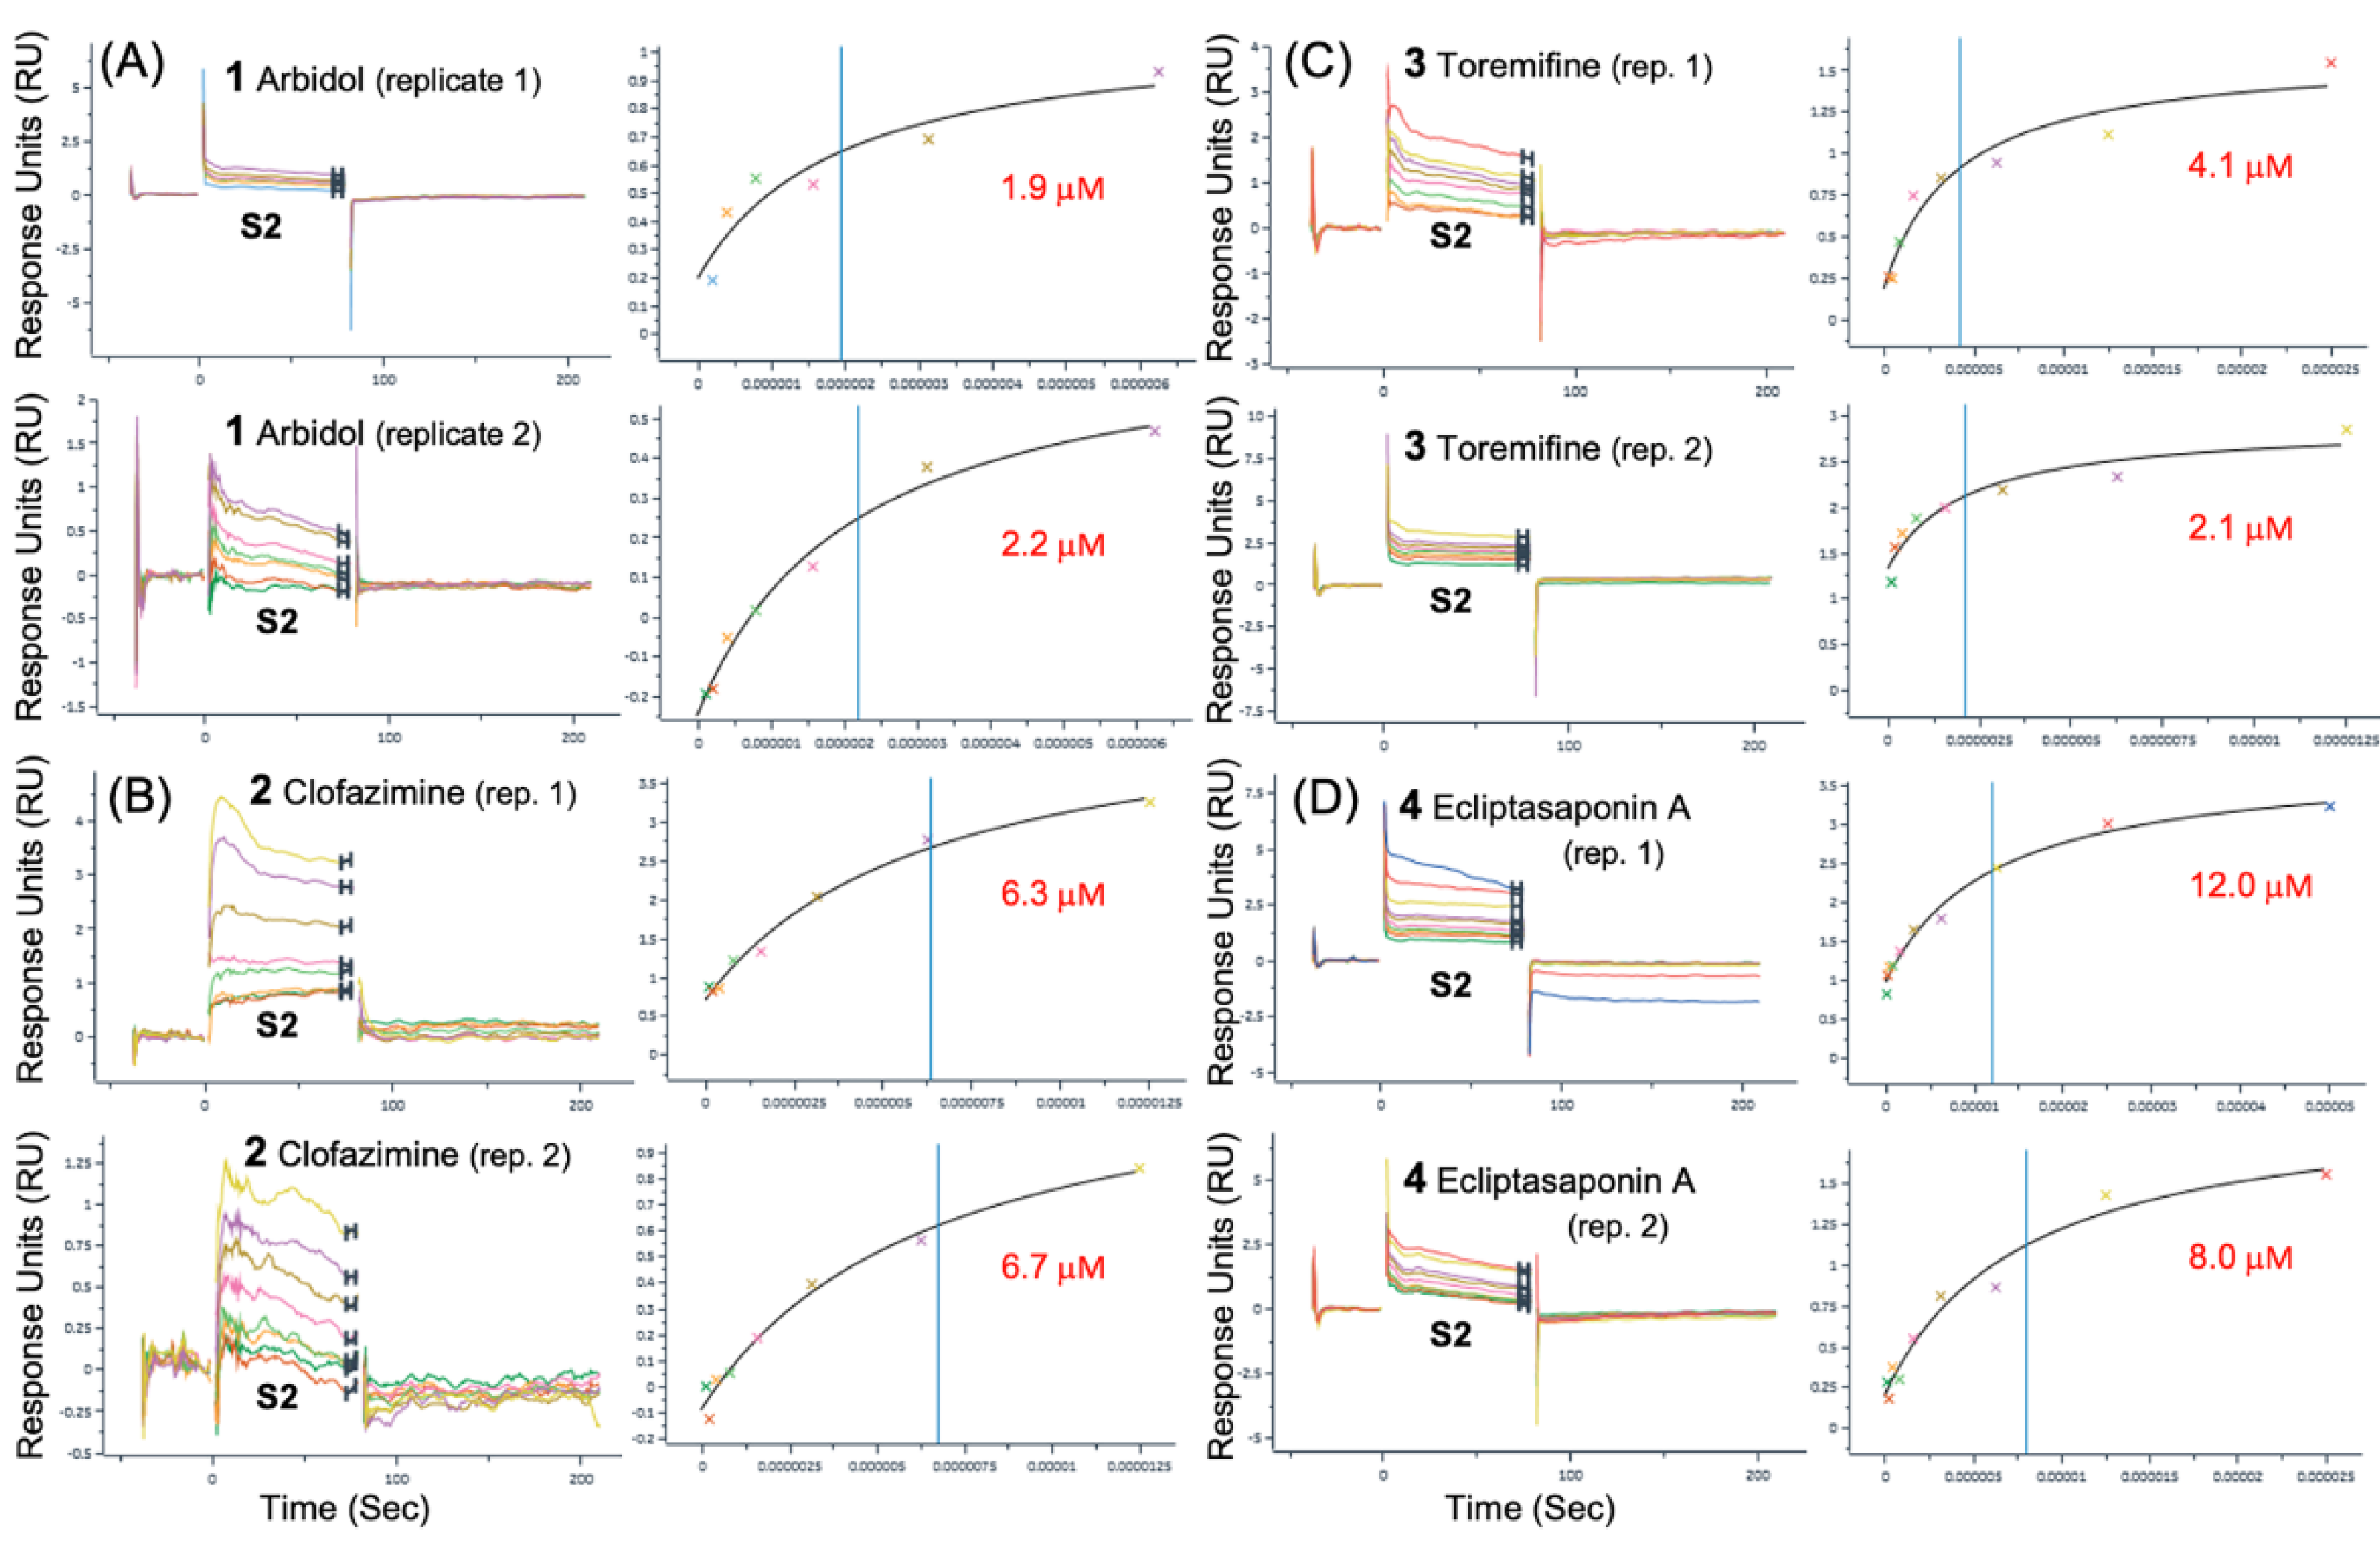
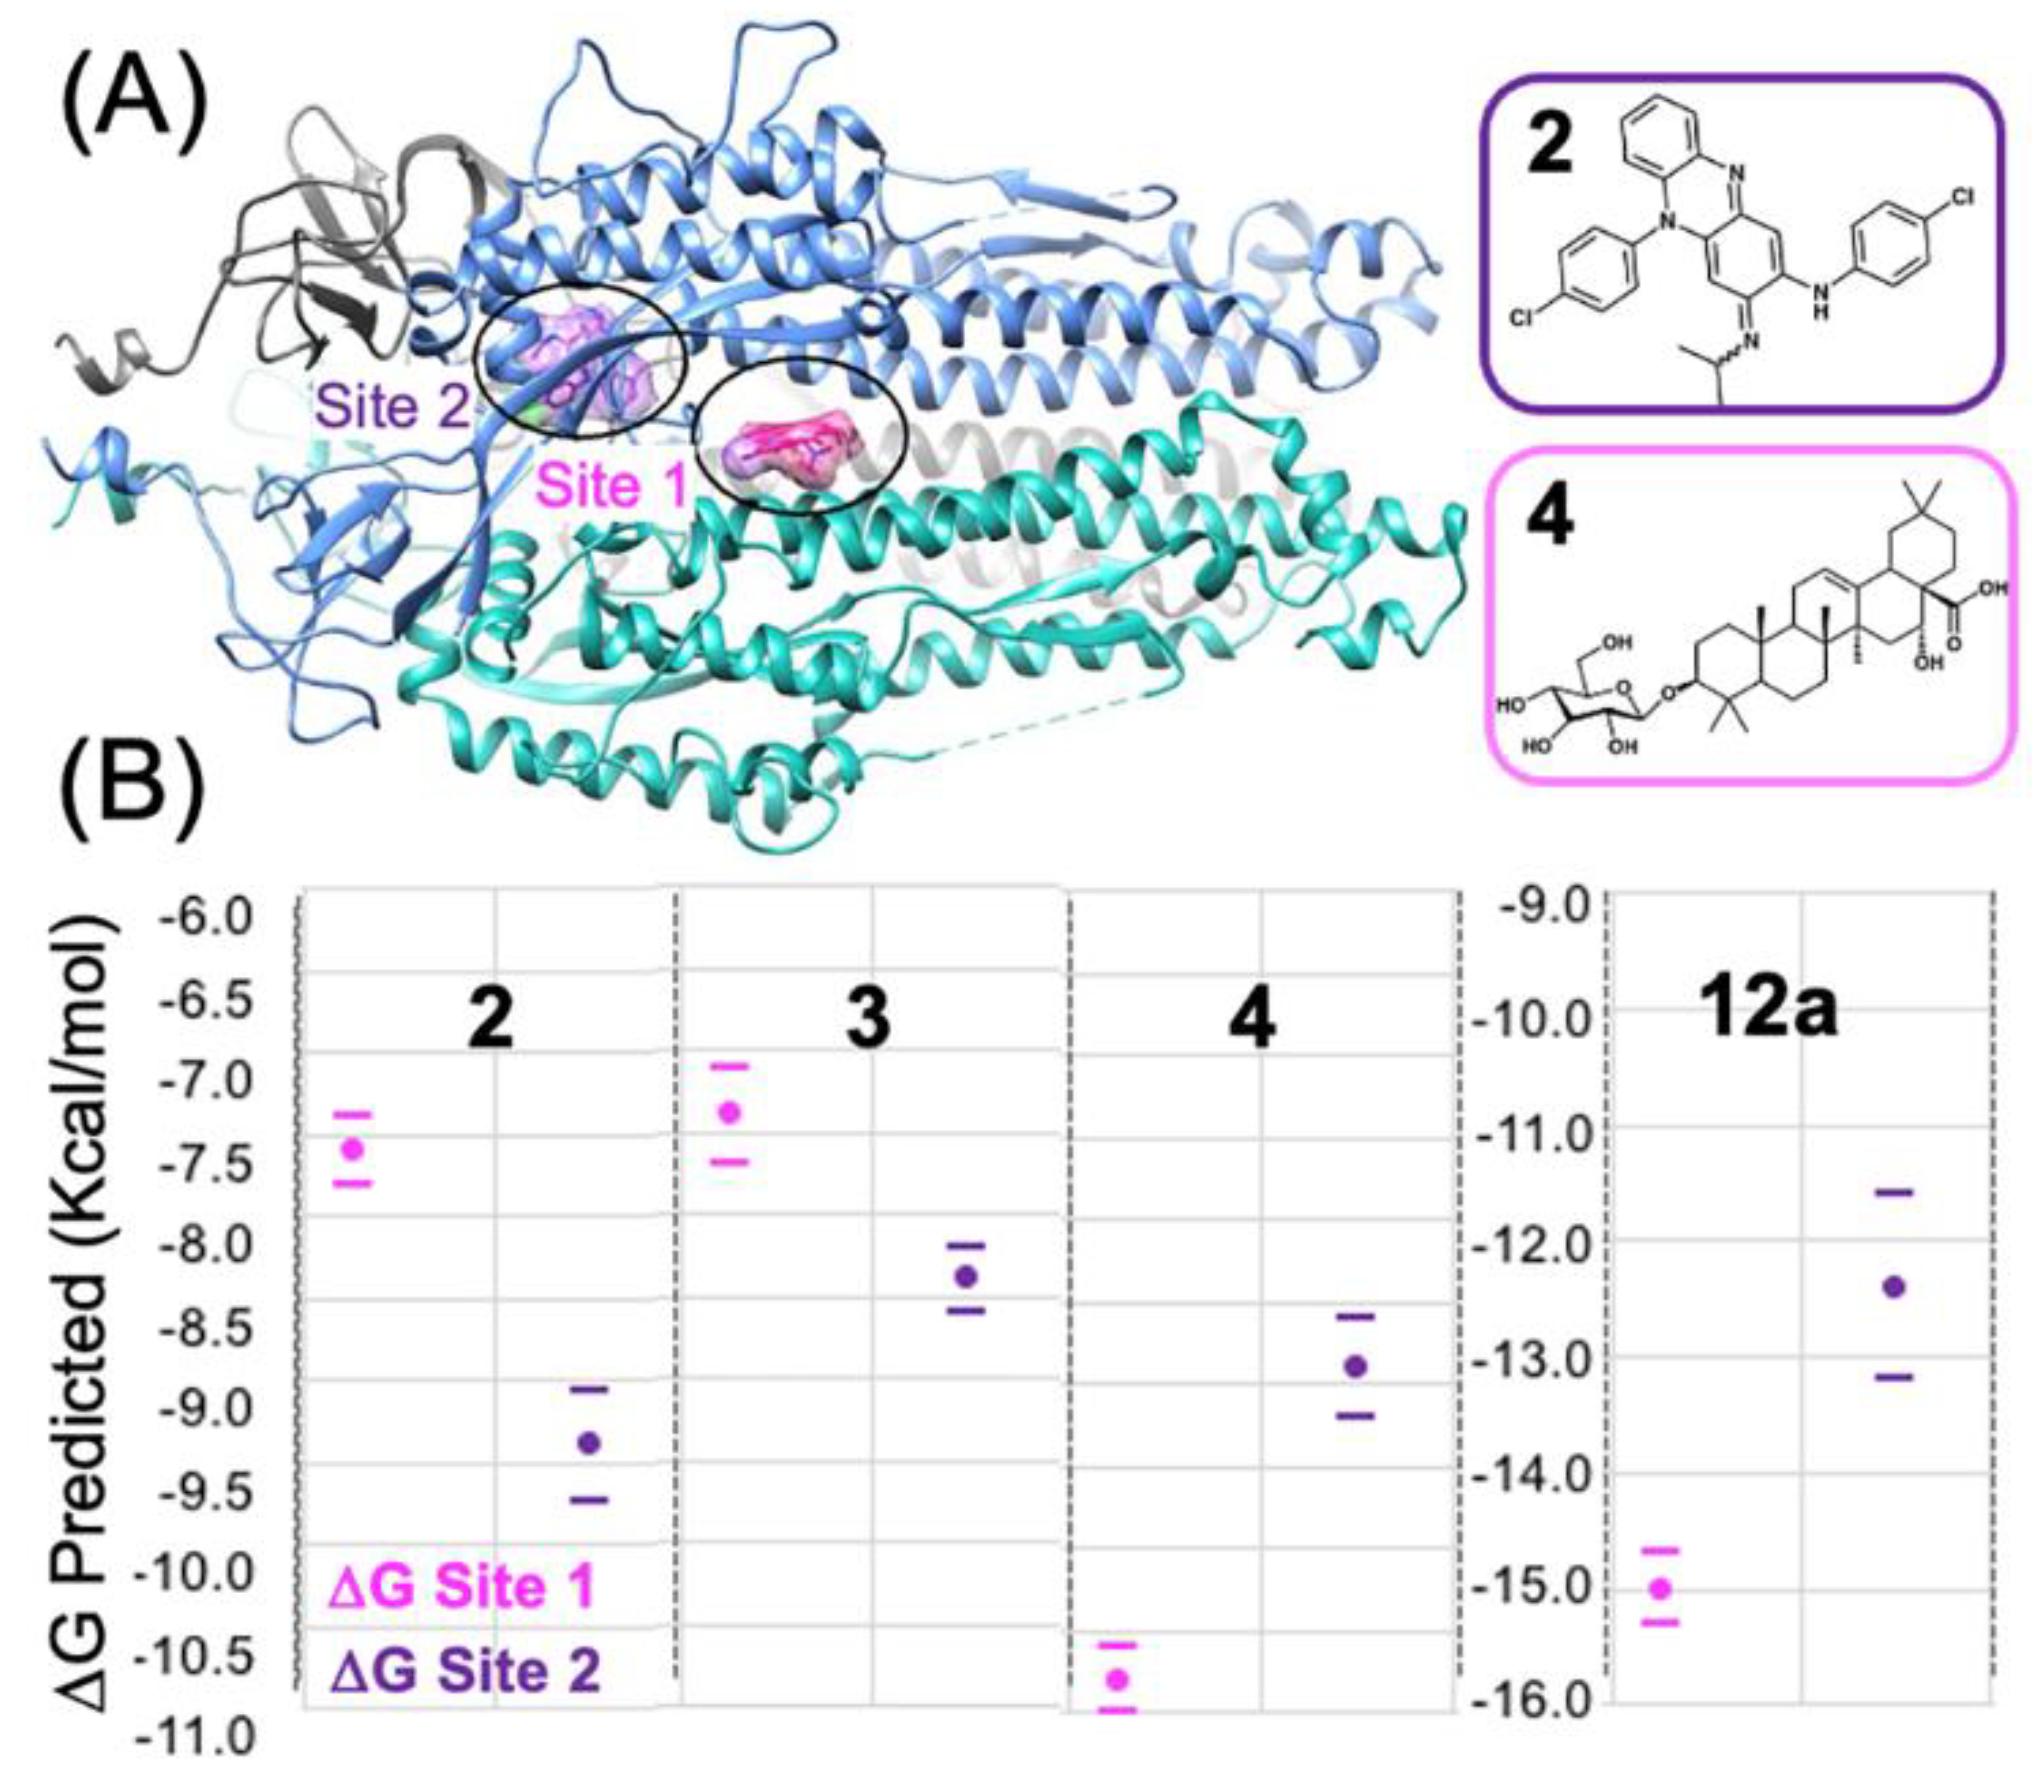
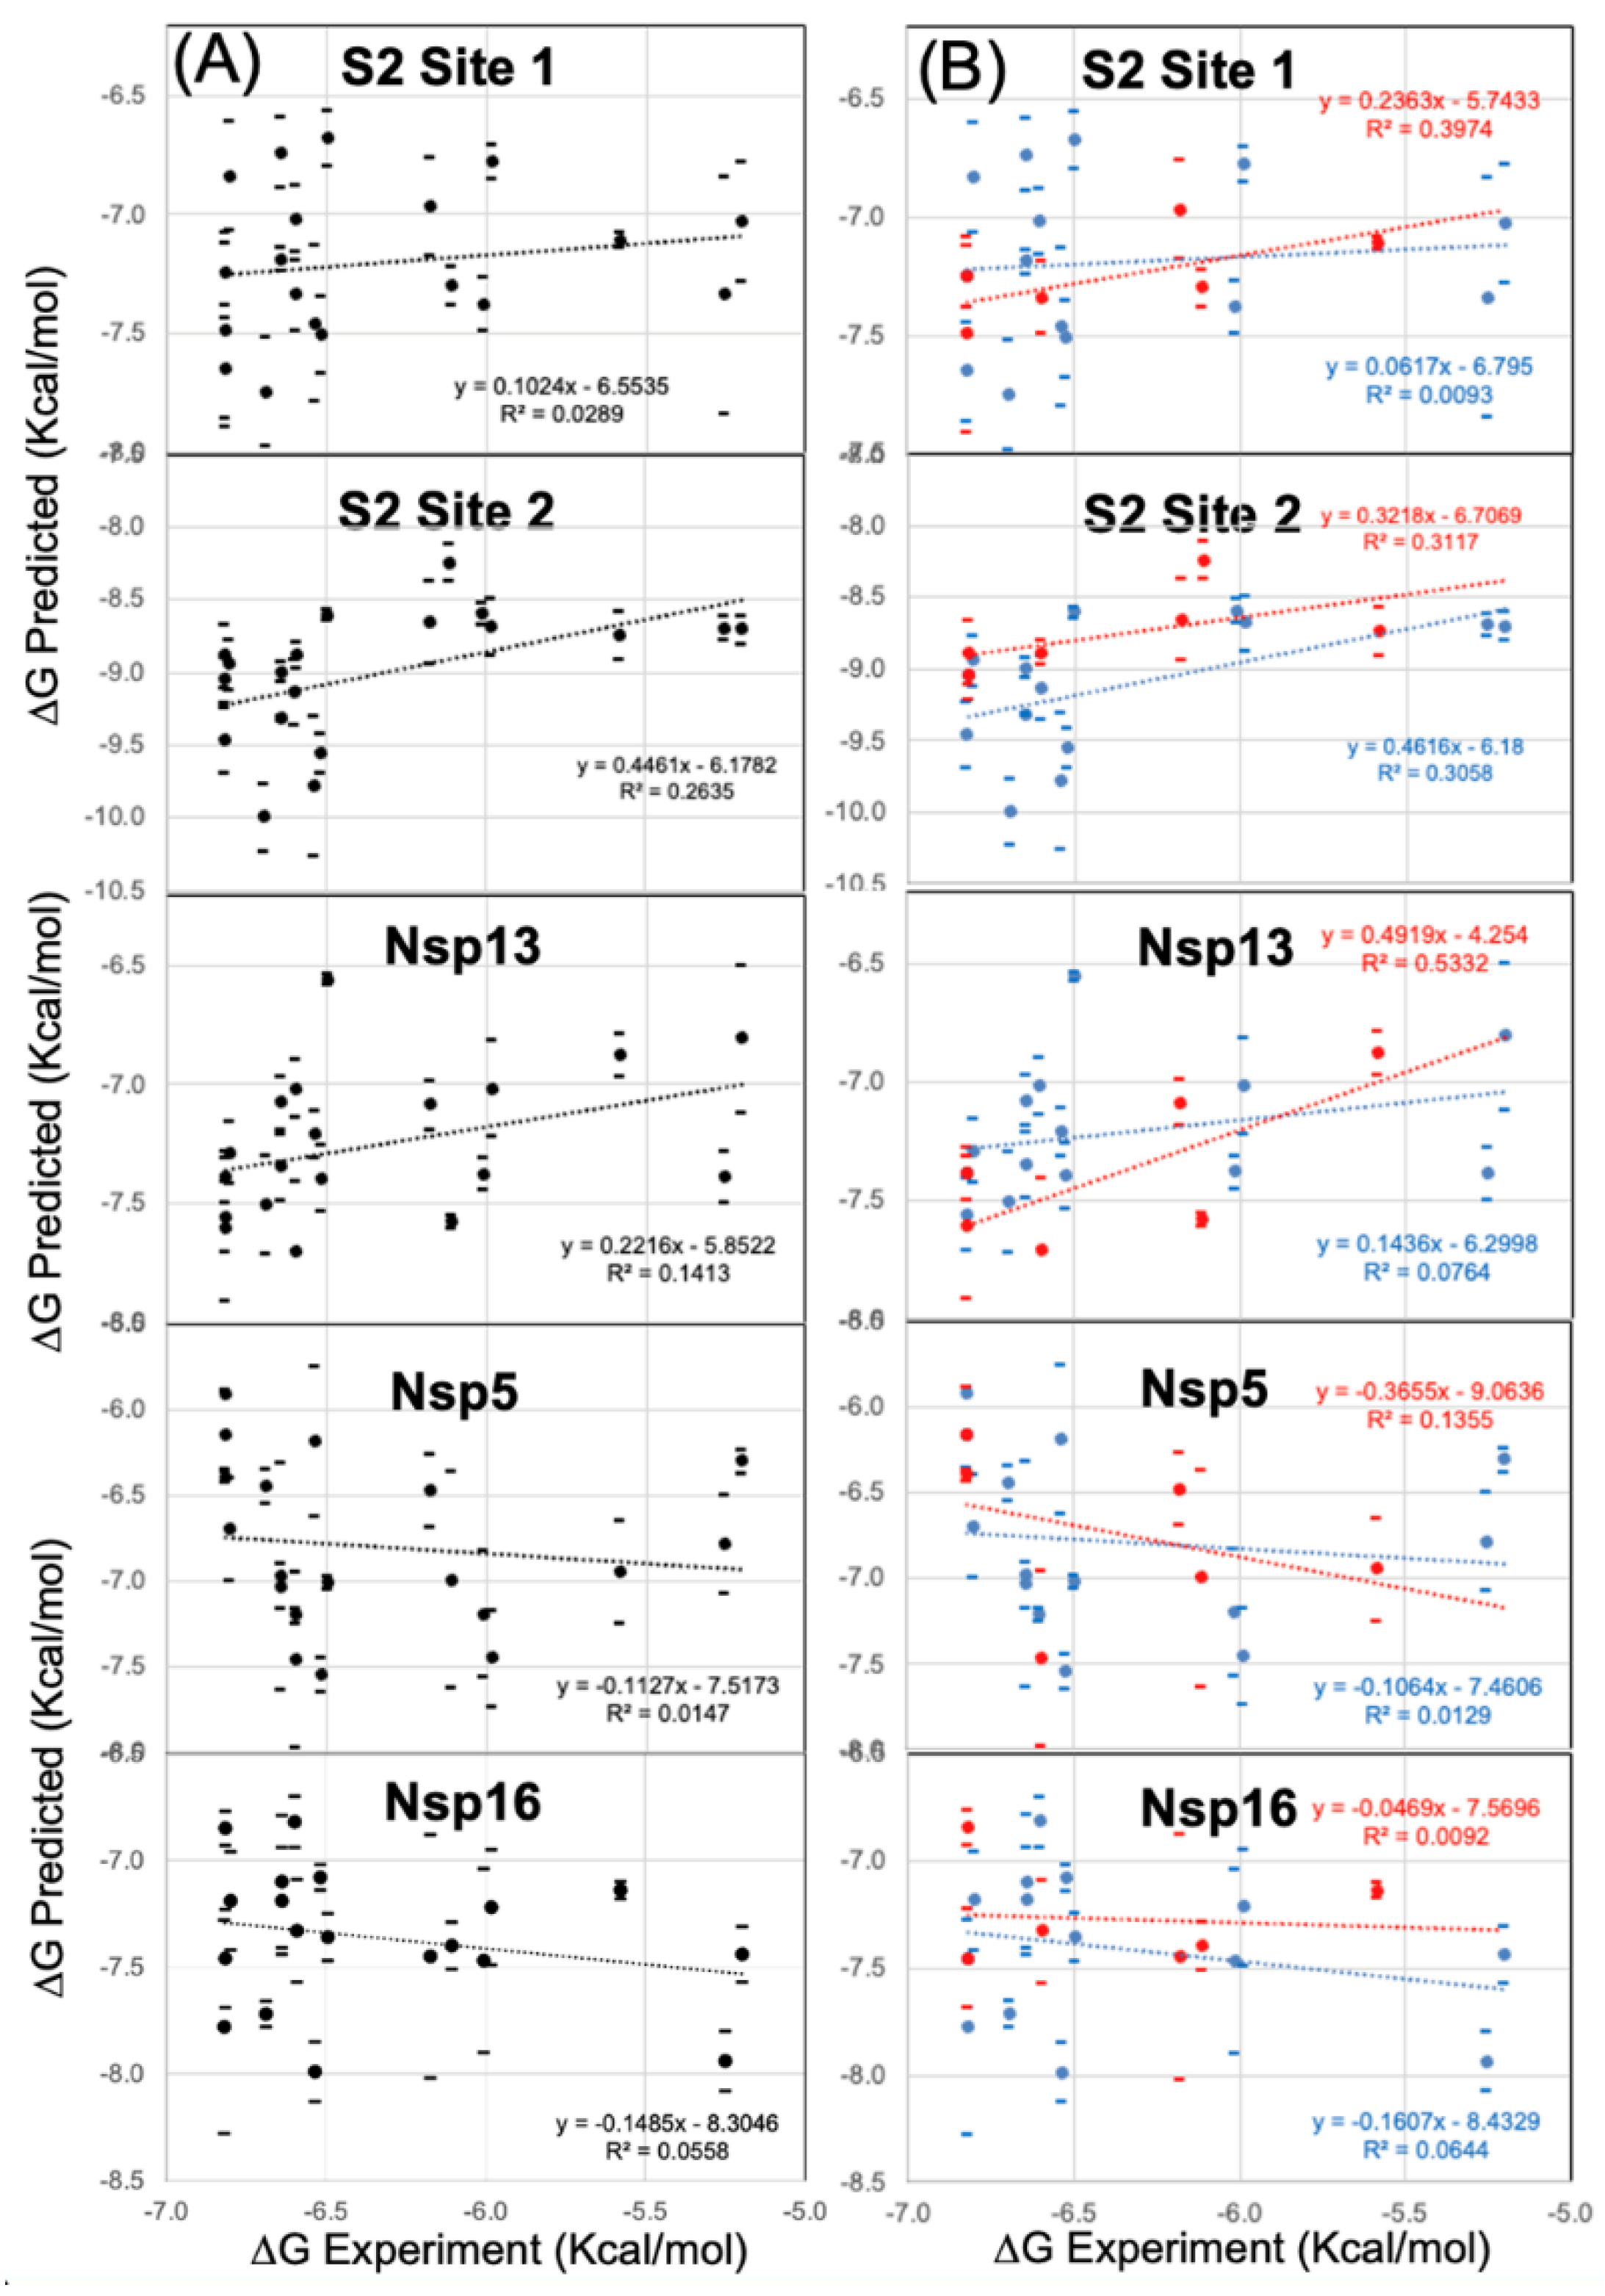
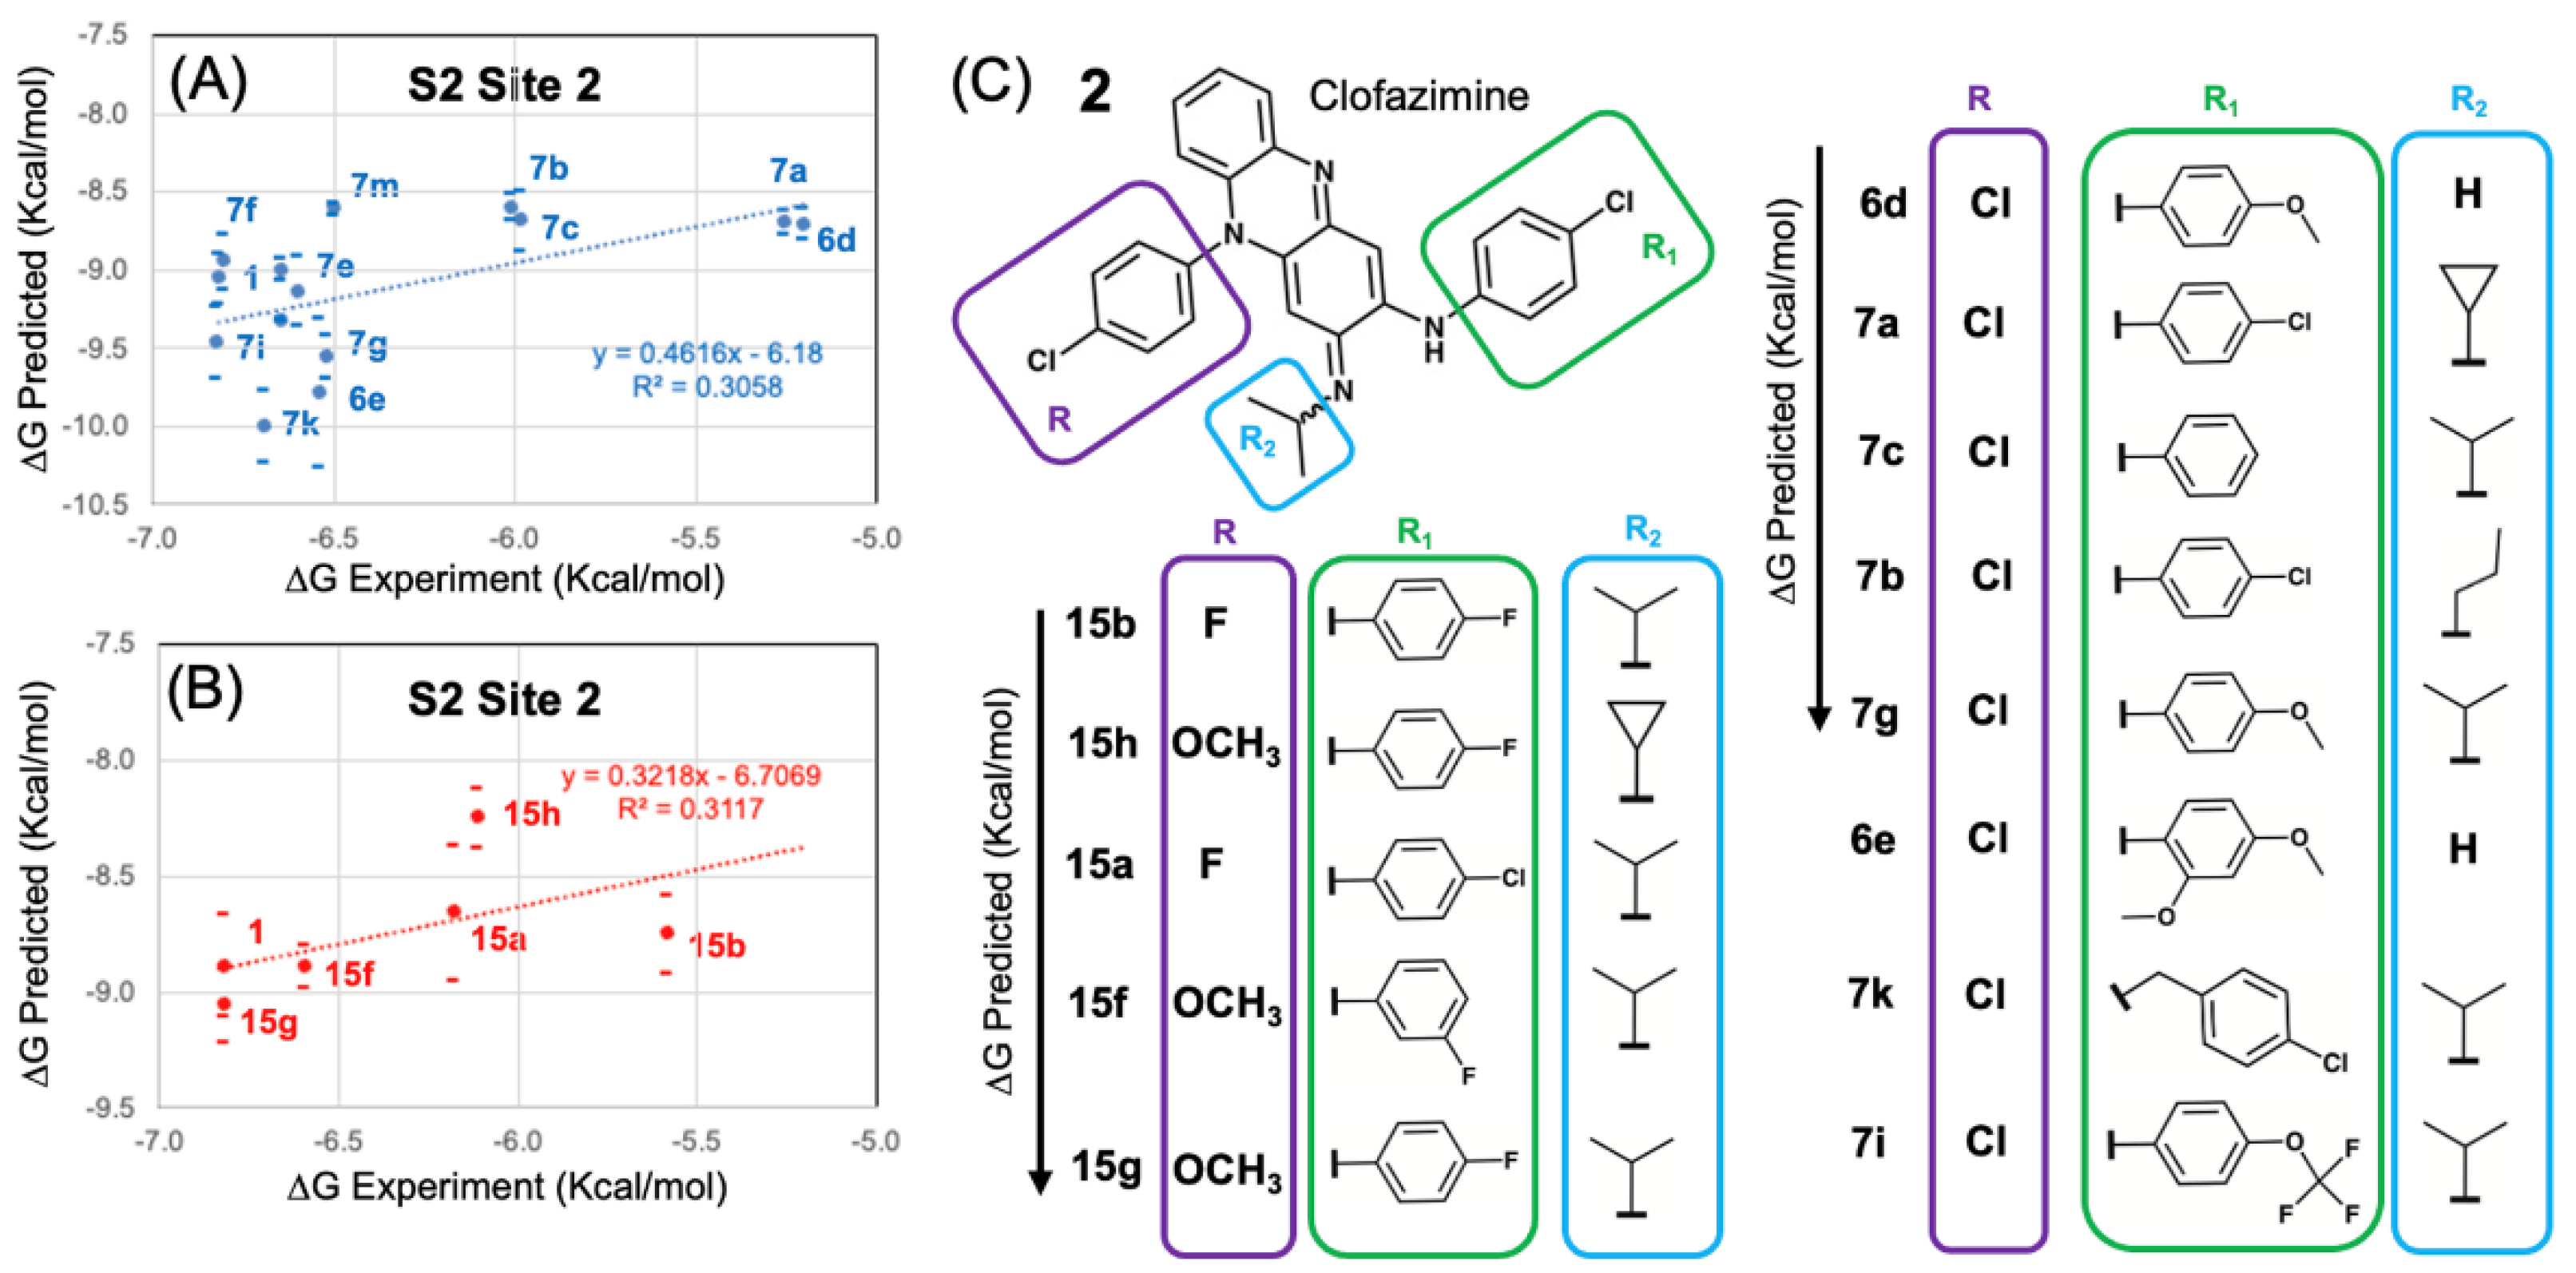
| Spike | Spike | S2 | S2 | |
| cmp | Kd (mM) |
Affinity Chi² (RU²) | Kd (mM) |
Affinity Chi² (RU²) |
| 1 | 7.44 | 1.04E-02 | 5.9 | 4.10E-03 |
| 1b | N/A | N/A | 31.2 | 4.06E-03 |
| 1d | 10 | 2.47E-02 | 27 | 2.35E-02 |
| 2 | 2.9 | 9.46E-03 | 3.9 | 4.93E-02 |
| Spike | Spike | S2 | S2 | |
| cmp | Kd (mM) |
Affinity Chi² (RU²) | Kd (mM) |
Affinity Chi² (RU²) |
| 1 | N/A | N/A | 2.1 ± 0.2 | 1.43E-03 |
| 1c | 40.4 ± 1.5 | 6.10E-03 | 11.4 ± 1.3 | 9.86E-03 |
| 2 | 4.6 ± 1.2 | 5.34E-03 | 6.5 ± 0.3 | 1.30E-02 |
| 3 | 4.1 | 2.70E-03 | 3.1 ± 1.4 | 1.69E-02 |
| 4 | 73.8 ± 8.3 | 2.69E-03 | 10.0 ± 2.8 | 1.04E-02 |
Disclaimer/Publisher’s Note: The statements, opinions and data contained in all publications are solely those of the individual author(s) and contributor(s) and not of MDPI and/or the editor(s). MDPI and/or the editor(s) disclaim responsibility for any injury to people or property resulting from any ideas, methods, instructions or products referred to in the content. |
© 2024 by the authors. Licensee MDPI, Basel, Switzerland. This article is an open access article distributed under the terms and conditions of the Creative Commons Attribution (CC BY) license (http://creativecommons.org/licenses/by/4.0/).


