1. Introduction
The climate dynamics of the last decades indicates that the climate changes affect in a significant way most of the natural systems and this especially concerns the global warming associated with higher temperature variations [
1]. Furthermore, various climate scenarios (see for example [
2,
3]) indicate that a negative impact of climate change is expected in almost all regions of the world inducing a visible enhancement of the intensity and frequency of the extreme events [
4]. Coastal environments are more sensitive to such extreme events [
5]. They represent the interface between land and water and, on the other hand, the wind is usually stronger in the marine environment [
6] and that is why its impact on the land located in the vicinity of the sea is higher.
From this perspective, the objective of the present work is to provide a more comprehensive picture concerning the expected dynamics of the extreme wind and wave conditions at the mouths of the Danube River in the Black Sea in connection with the navigation hazards. The focus is on the entrance in Sulina channel, which represents the main navigation exit from the Danube to the Black Sea [
7], being at the same time the southern gate of the seventh Pan-European transportation corridor linking the Black Sea to the North Sea via the Rhine-Maine-Danube navigation system (inaugurated in 1992) [
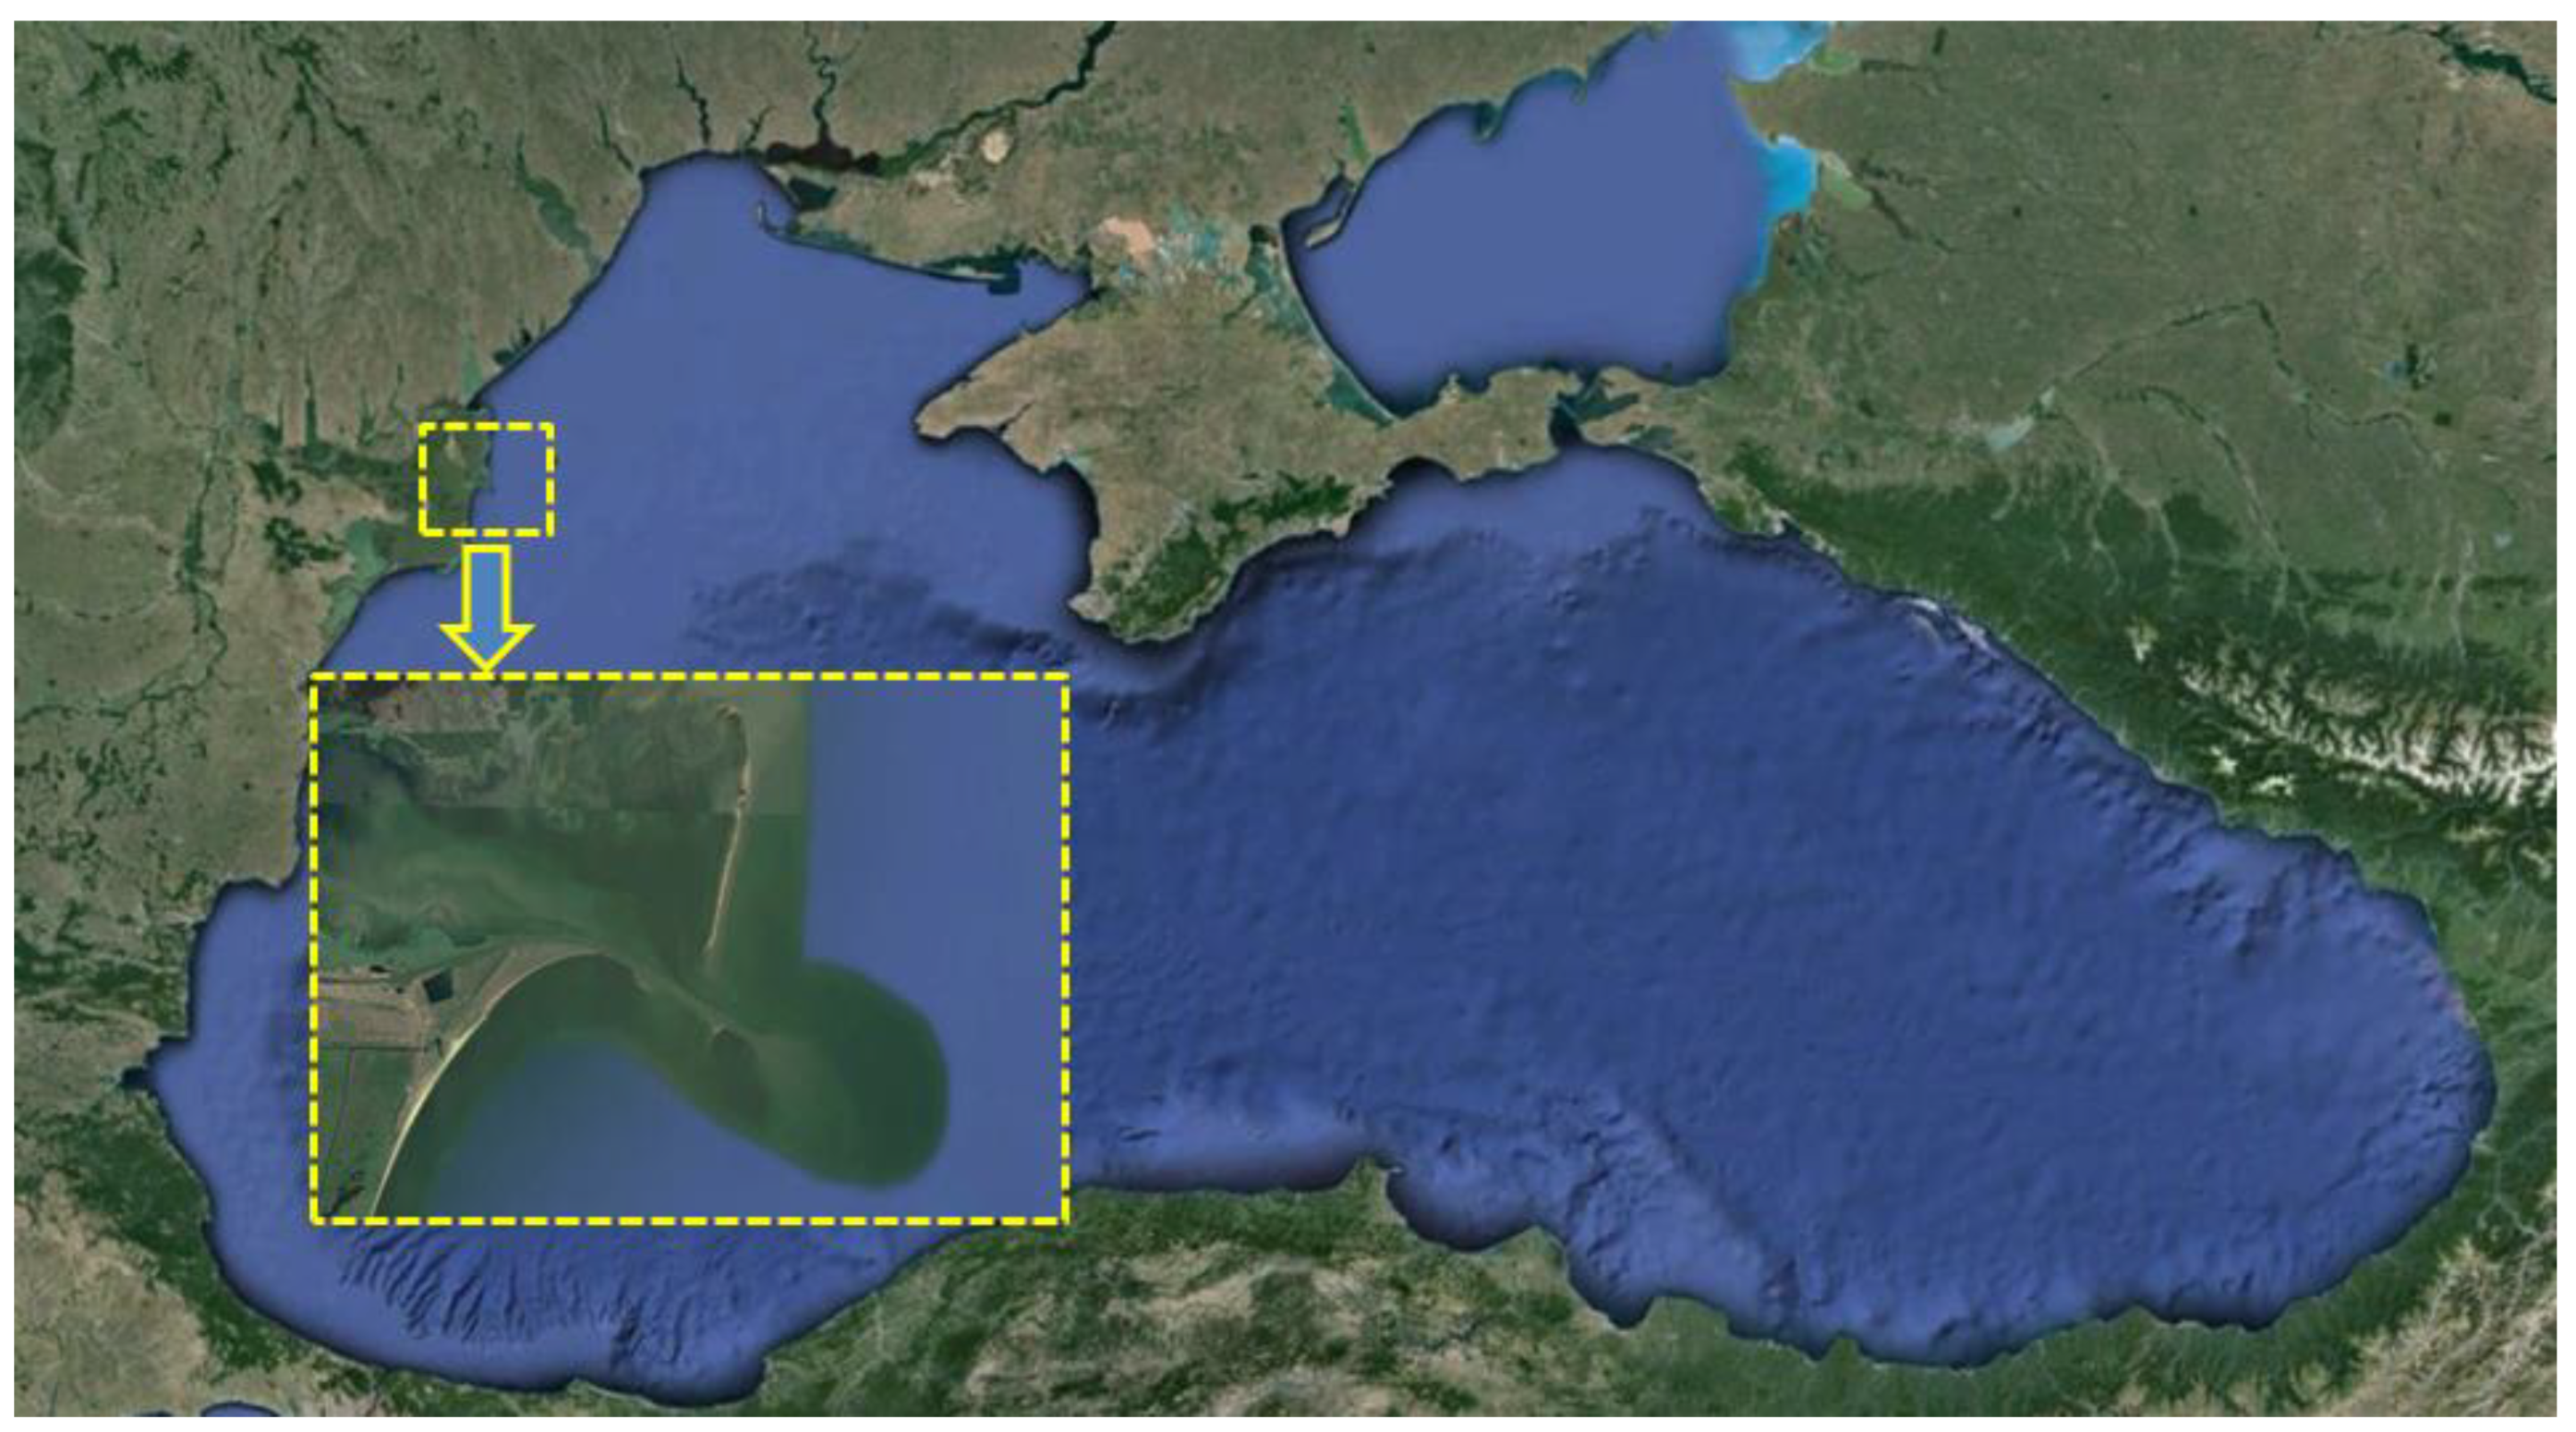
8]. The location of the target area in the Black Sea is illustrated in
Figure 1. Since this represents the main southern entrance in the largest European inland navigation system it is subjected to high navigation traffic [
9]. Furthermore, for a distance of about 170 kilometers, from Sulina at the Black Sea (considered kilometer zero) and up to the Romanian port of Braila (kilometer 170), the so called Maritime Danube extends and the Danube is also navigable by maritime ships [
10], while river ships can navigate upstream to Ulm, in Germany [
11]. Moreover, since the beginning of the war in Ukraine in February 2022, this traffic was significantly increased [
12], the Danube being an alternative and more secure route for the cereals and other goods exported by Ukraine.
Since the most important water resource for the Black Sea is represented by the Danube [
13], the river outflow generates relatively strong currents in the coastal environment neighboring the deltaic zone, which is the largest in Europe [
14]. The delta is delimited by the three principal branches of the Danube River, Chilia, Sulina (which represents the main navigation waterway) and Saint George [
15], and there are often risks of floods [
16,
17] or various other hazards [
18]. The wind and wave climate are characterized through relatively high energy conditions [
19], and extreme storms also occur with a certain frequency in this nearshore [
20]. Furthermore, the waves are often increased at the mouths of the Danube by the wave-current interactions that occur between the incoming waves and the coastal currents induced by the river discharge into the sea [
21]. Taking into account the complexity of this coastal environment and the processes associated, the relatively high frequency of the severe weather conditions and also the quite high navigation traffic and the proximity of an outgoing war, various studies (see for example [
22]) indicate this area as being subjected to high risks from the point of view of the navigation hazards.
In this context, an analysis of the characteristics of the environmental matrix and its expected dynamics in the coastal area at the mouths of the Danube River, and especially at the entrance in Sulina channel (considered as the zero kilometer of the Danube River), is made in the present work. This analysis includes first some in situ measurements for the wind and water level, reanalysis wind data from the European Centre for Medium-Range Weather Forecast (ECMWF), and projections of the future expected wind fields provided by regional climate models (RCMs) under various RCP (Representative Concentration Pathway) and SSP (Shared Socioeconomic Pathway) scenarios. Furthermore, an analysis of the wave conditions is also made by performing simulations over the entire basin of the sea with SWAN (acronym from Simulating WAves Nearshore) spectral model [
23] and focusing the modeling system with higher resolution domains on the coastal environment at the mouths of the Danube River.
4. Discussion
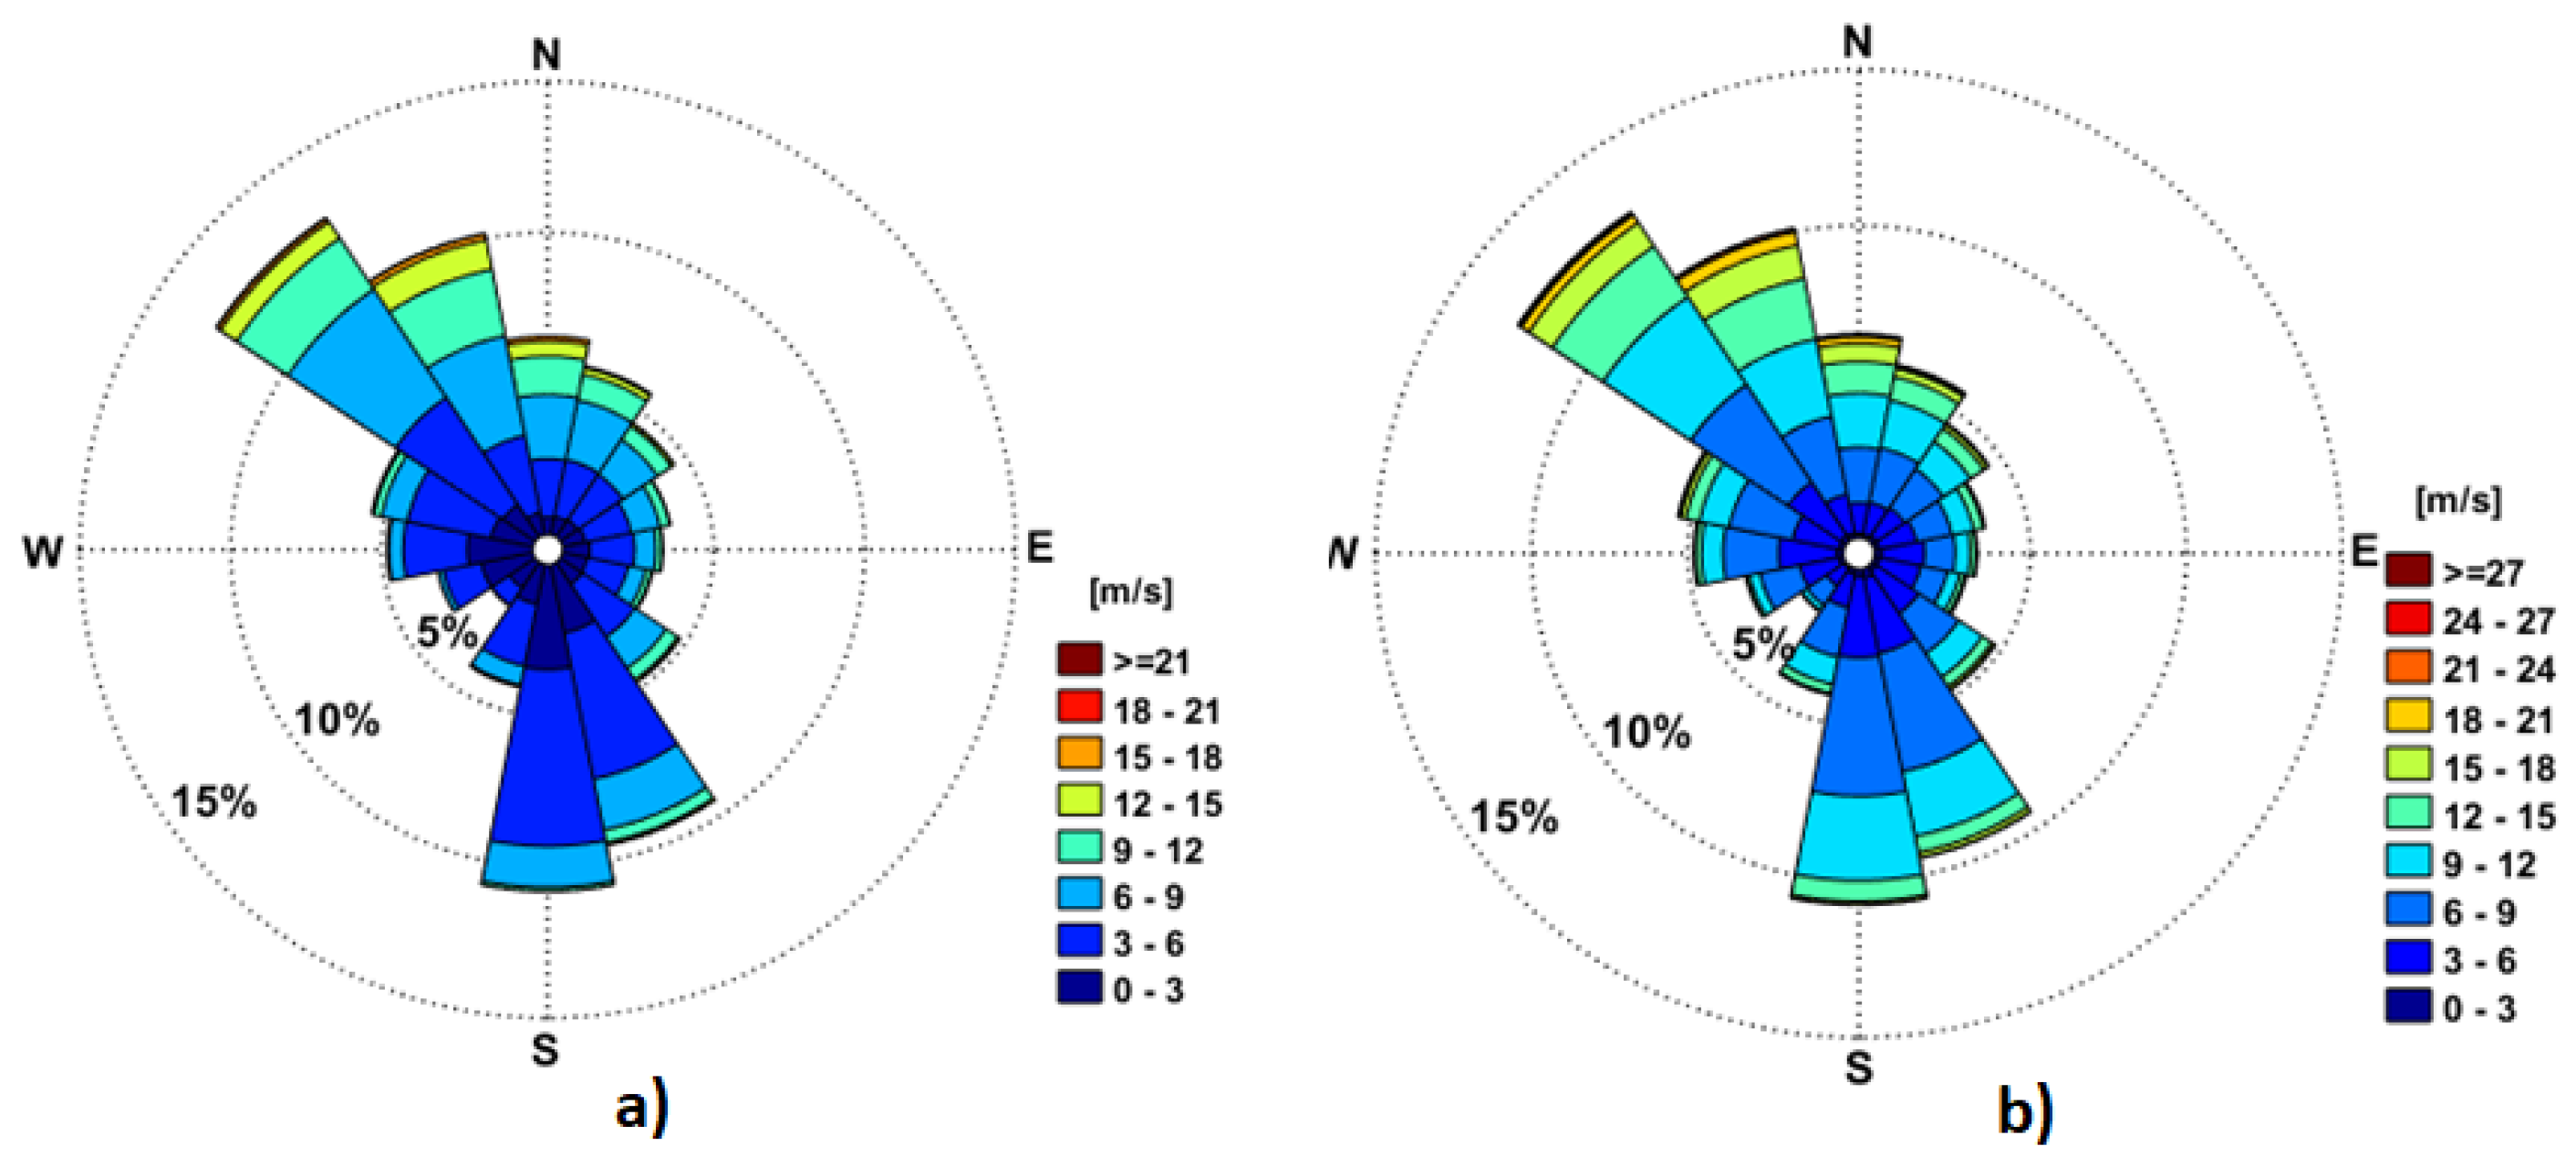
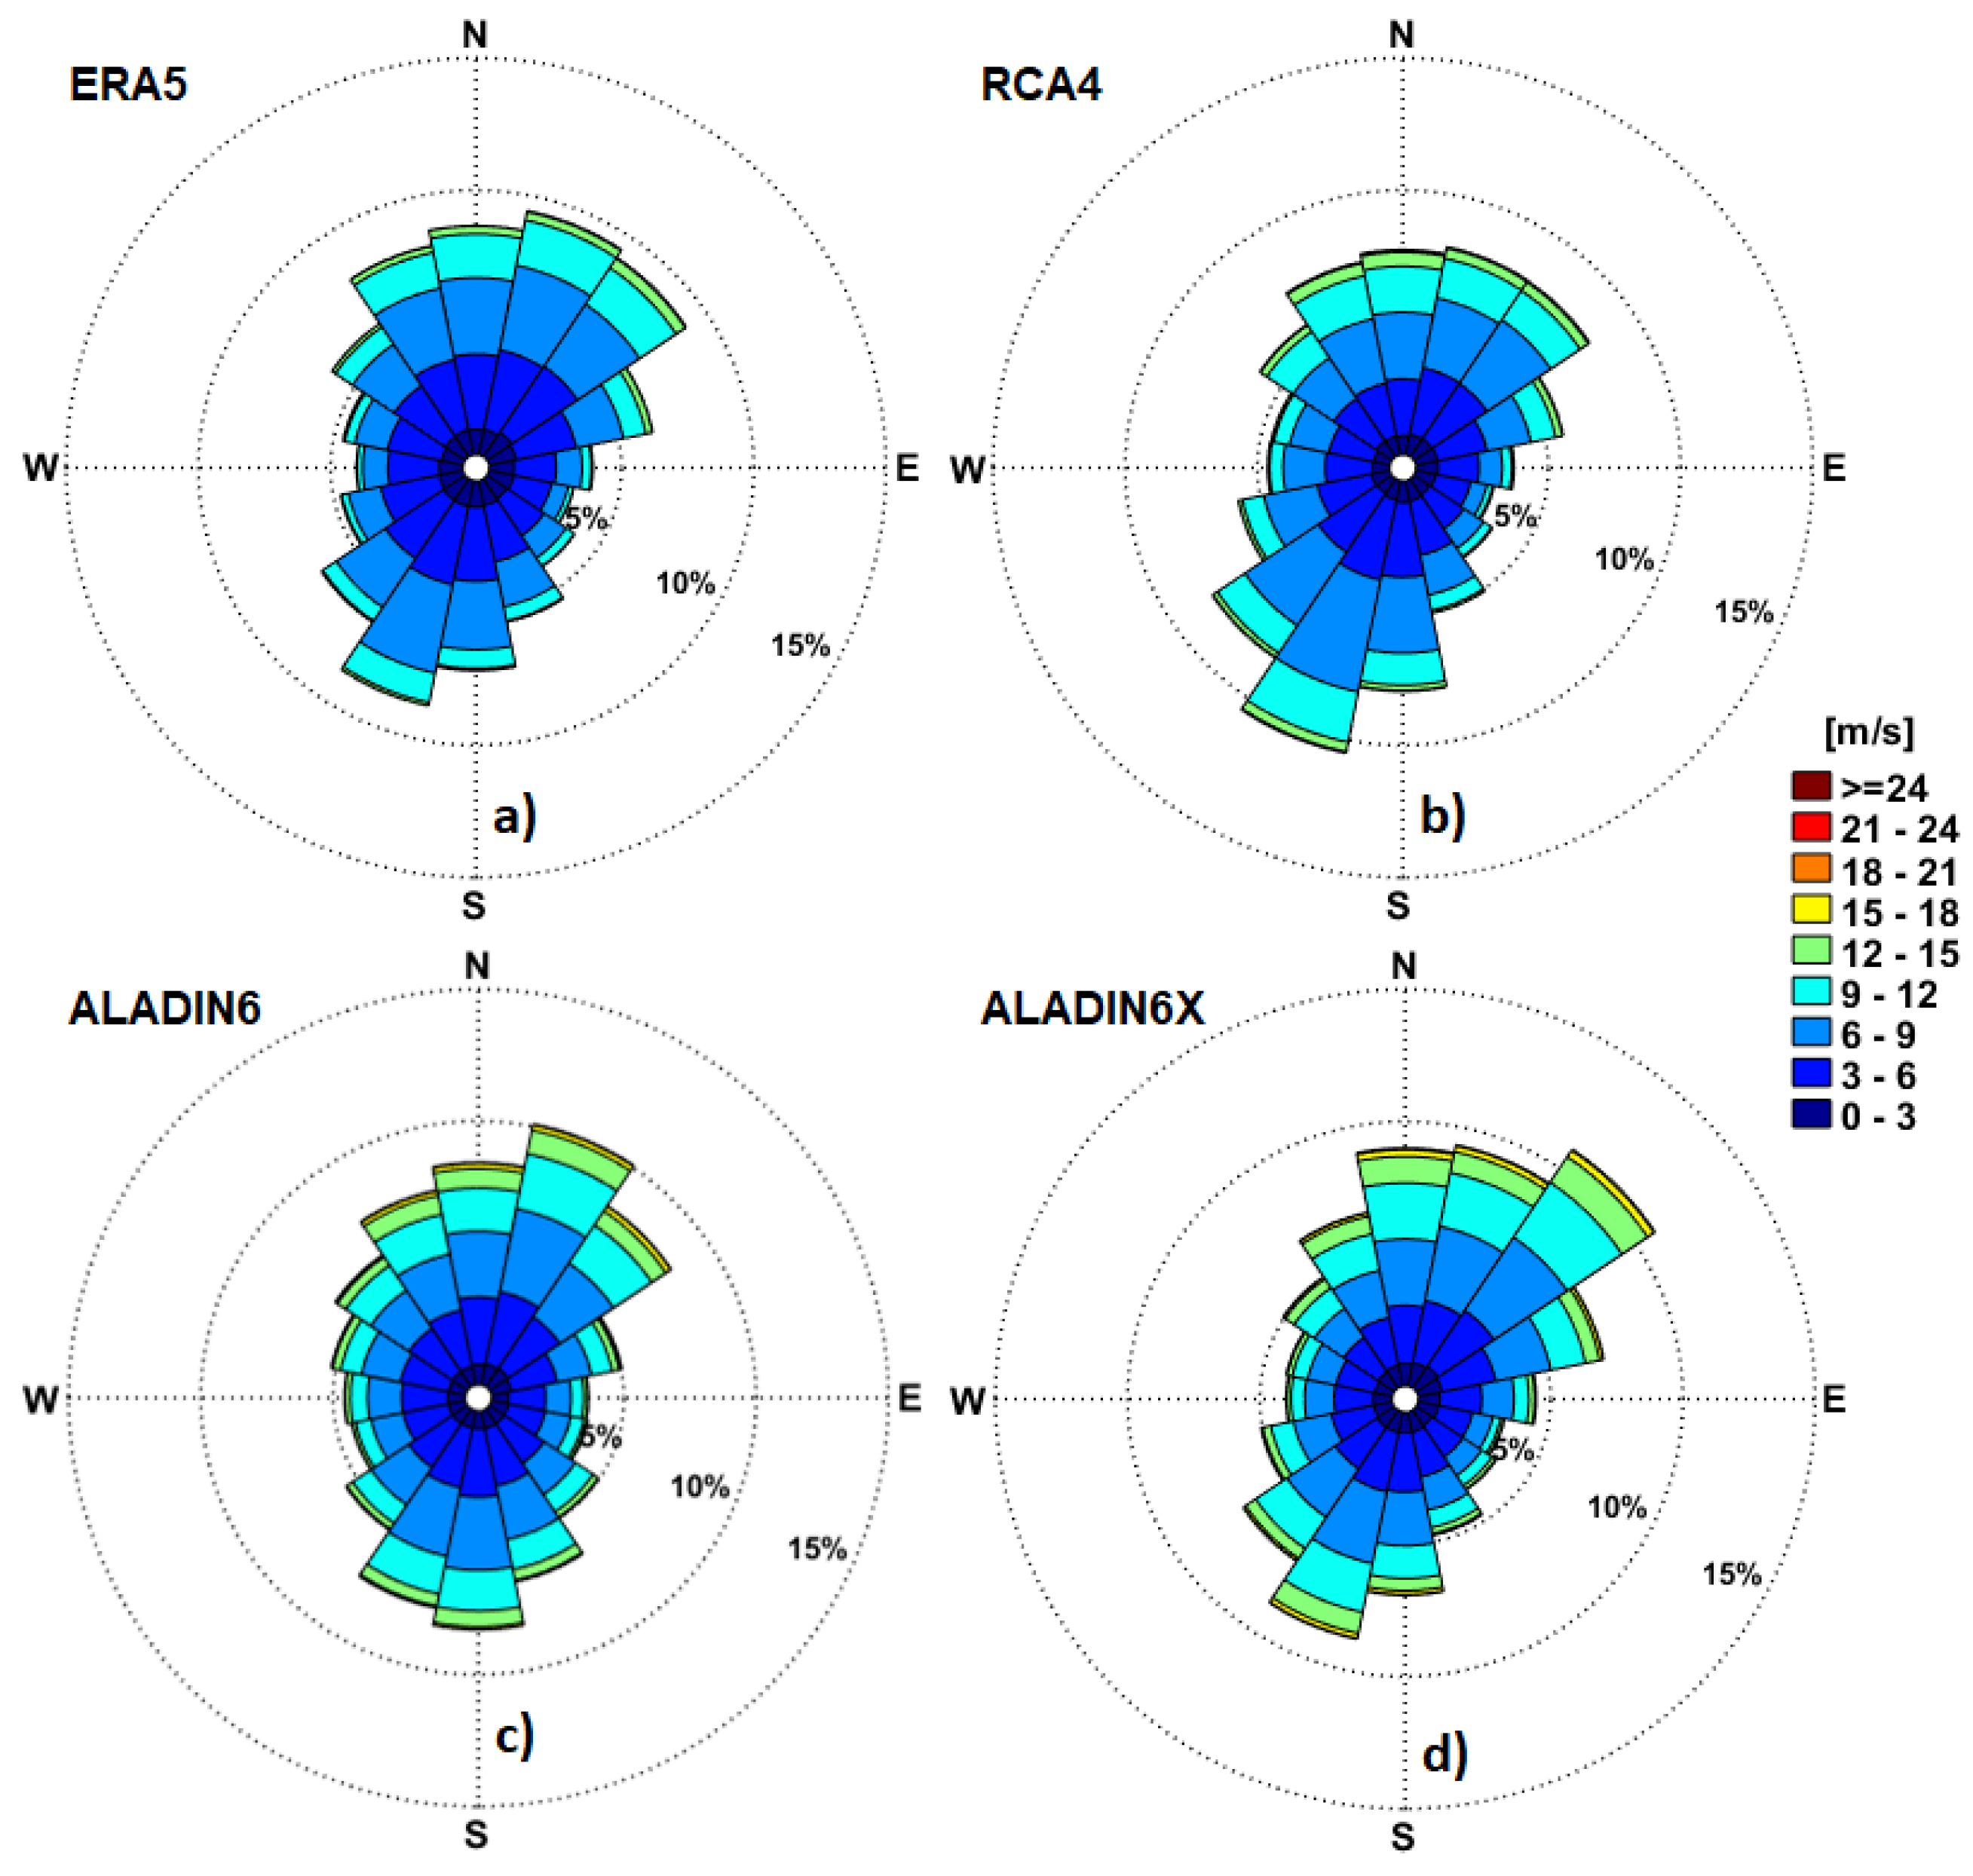
The analysis of the wind data shows that there is in general a good match between the measurements and the model results, especially as regards the intensity of the maximum wind speeds. However, by comparing
Figure 4 and
Figure 6 we can notice that in RP0 the dominant wind direction is from North-Northwest while in RP1 is from North-Northeast. Furthermore, unlike in RP0, in RP1 significant winds are coming also from the Southeast, while in both cases significant winds are coming from the South. The main explanation for the differences is that while RP1 is located 30km offshore, RP0 represents the zero kilometer of the Danube, where both the influence of the coast and also of the local wind currents propagating along the river are consistent.
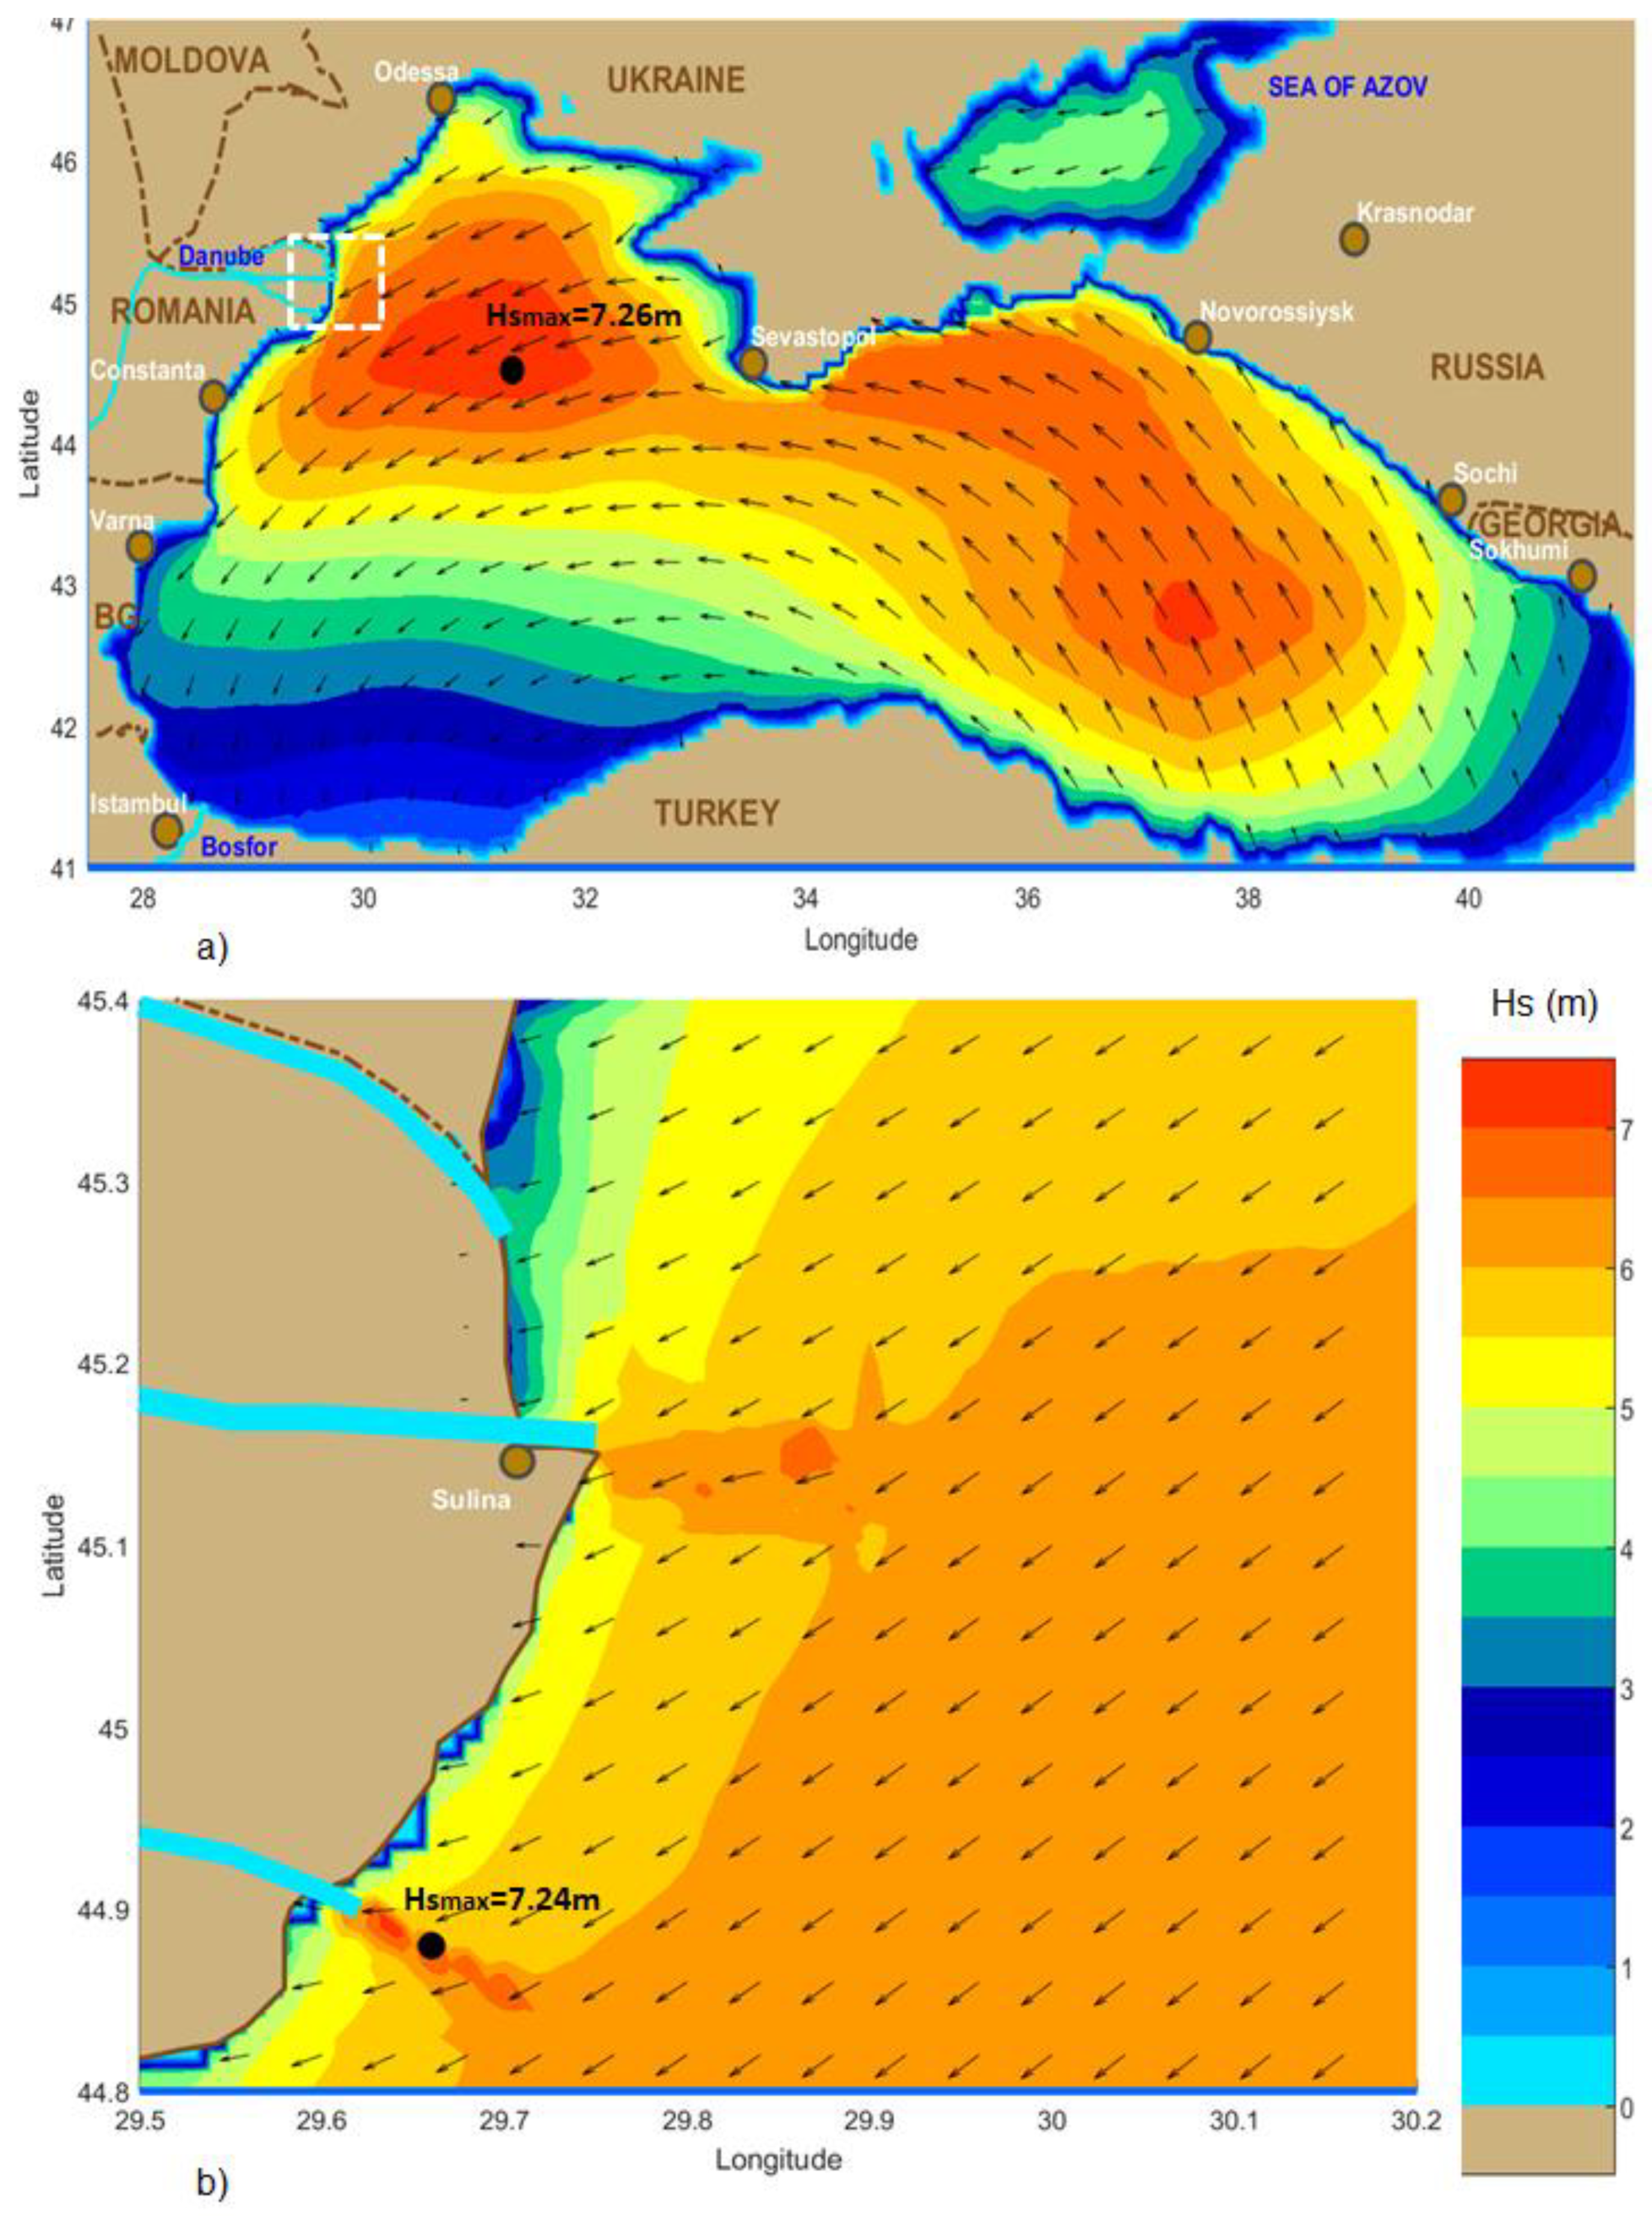
As regards the waves, the results show that we can expect significant wave heights even higher than 7m in the coastal environment offshore the mouths of the Danube River. Furthermore, as
Figure 14 clearly illustrates, the local processes, and especially the wave-current interactions and the shallow water effects, induce in the nearshore considerable enhancements of the significant wave height. From this perspective and in order to assess better the influence of the local effects at the entrance in Sulina channel, wave model simulations have been carried out considering the most common wave patterns from the point of view of the significant wave height (
Hso) and mean wave direction of the incoming waves on the offshore boundary (
Wdir), as indicated by the
Figure 15,
Figure 16,
Figure 19 and
Figure 20. Furthermore, previous results in terms of wave modeling presented in [
48,
49] have been also considered. Thus, in the high resolution computational domain described in
Table 1, SWAN simulations have been performed considering significant wave heights and wave directions in the ranges [1m-5m] and [30⁰-150⁰]. Based on the results of these simulations, an index giving the relative enhancement due to the wave-current interactions of the significant wave height at the entrance in Sulina channel (
REHs) has been evaluated. The expression of this index is given by the equation below, while the corresponding values are provided in
Table 4.
On the other hand, while the spectral wave models, such as SWAN, are used to provide predictions in terms of the significant wave height, which represents four times the area under spectral density, from the point of view of the navigation hazards we are more interested in the prediction of the larger wave heights, such as the maximum wave height. Usually, this is estimated based on some theoretical probabilistic distributions [
50] among which the most common is the Rayleigh distribution [
51], according to which waves with maximum wave height almost double the significant wave height can be often expected in a wave group. There are however situations when the ratio between the maximum and the significant wave height can be higher, or even much higher, than 2. Such kind of waves are called freak or rogue waves and they are very dangerous inducing a high risk of hazards in both navigation and any other marine activities. Thus, passing now from a statistical approach to a probabilistic one, we can estimate higher risks of occurrences for such kind of waves via the Benjamin-Feir Index (
BFI).
BFI, or the steepness-over-randomness ratio, has been introduced by Jansen [
52] and is defined as:
St represents the integral wave steepness and represents the ration between the significant wave height and the wavelength while
Qp is the peakedness of the wave spectrum defined as:
In fact,
BFI is a spectral shape parameter that can be related to the kurtosis of the wave height distribution, the kurtosis depending on the square of
BFI. Experimental results indicate that for
BFI = 0.2 the maximum wave heights are very well described by the Rayleigh distribution while for values of
BFI greater than 0.9 the ratio
Hmax/Hs is substantially underestimated. The values of the
BFI index corresponding to the most relevant wave propagation patterns are presented also in
Table 4. The results indicate that
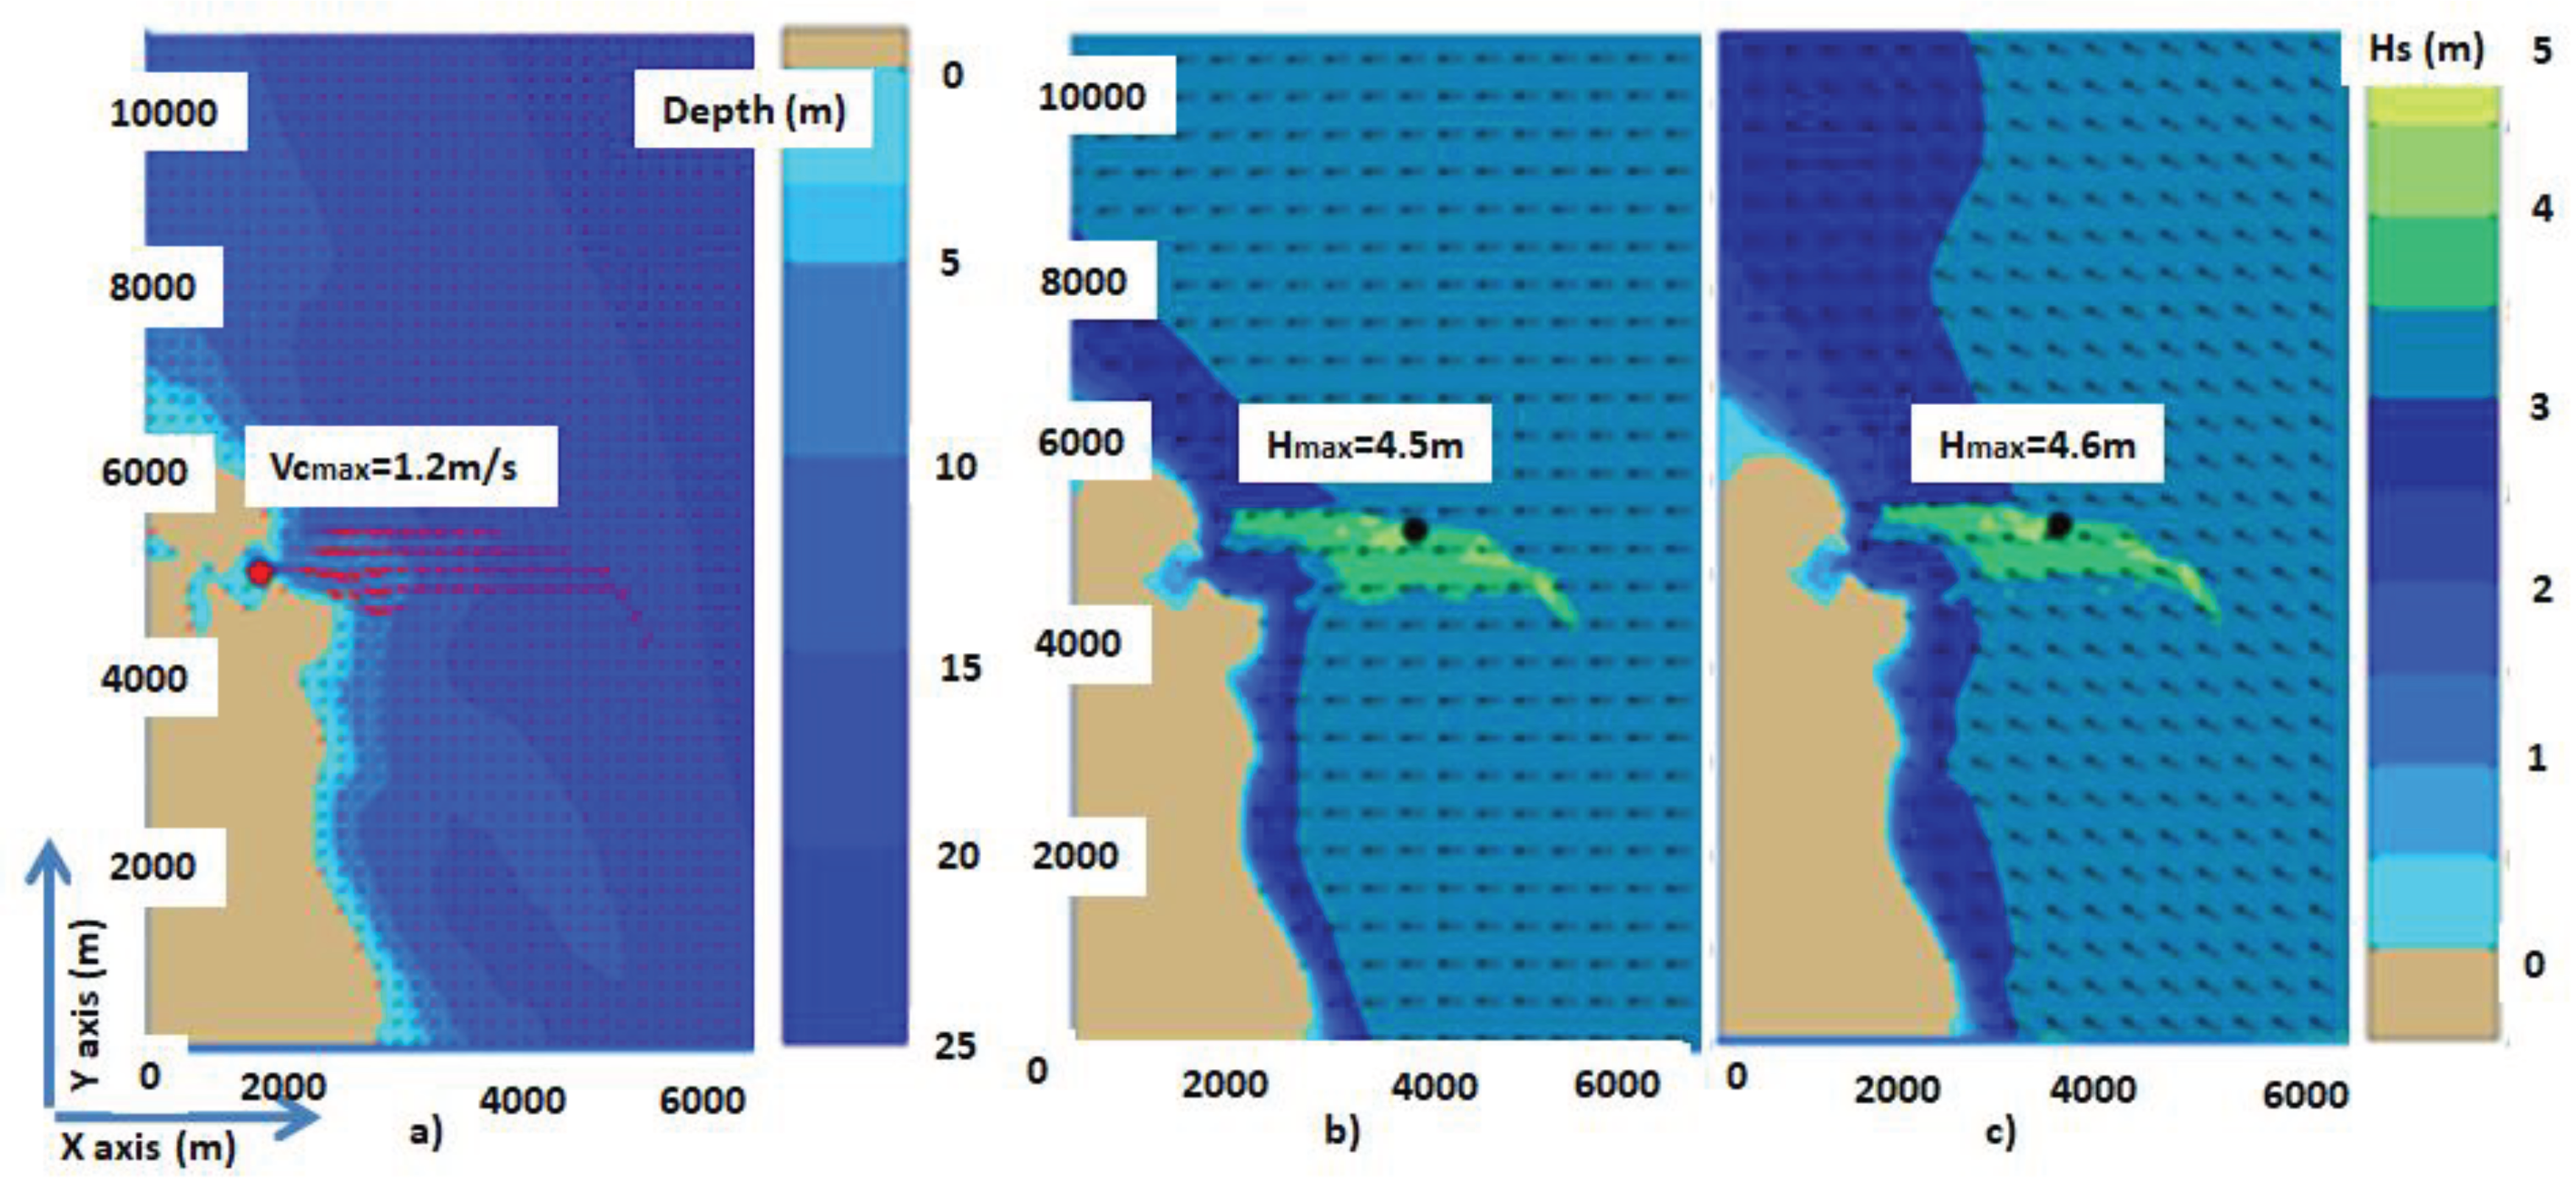
BFI values higher than 1.5 occur in this area for waves with significant wave heights between 3 and 4 meters and when the mean wave direction on the offshore boundary is between 90 and 120 degrees. From this perspective, two additional simulations have performed considering two situations presenting the highest risk form the point of view of the rogue waves’ occurrence, and the results are illustrated in
Figure 23. Thus,
Figure 23a presents the bathymetric map of the computational domain and the average current field.
Figure 23b illustrates in terms of significant wave height scalar fields and wave vectors the results of the SWAN simulations considering the offshore wave conditions
Hs=3.5m and mean wave direction of 90 degrees, while in
Figure 23c the same results considering the offshore wave conditions
Hs=3.5m and mean wave direction 120 degrees. The values of the
BFI index are indeed higher than those presented in
Table 4, being 1.95 (with
REHs=28.6%) for the simulations from
Figure 23b and 1.9 (with
REHs=31.4%) for that illustrated in
Figure 23c. The above results indicate that, besides the enhancement in terms of
Hs expressed by the values of the
REHs index, there is also a high risk of occurrence of abnormal waves for which the ratio between the maximum and the significant wave height is higher than 2.
5. Conclusions
The objective of this work was to study the past and future dynamics of the environmental matrix, especially wind and waves, at the entrance in Sulina channel. This is one of the three arms defining the Danube Delta in the Black Sea. At the same time, Sulina channel represents the main southern entrance in the navigation system Rhine-Maine-Danube, which represents the largest inland waterway in Europe linking the Black and the North seas. Hence, this sector is subjected to high navigation traffic. On the other hand, strong environmental conditions are very often encountered in this area inducing a high risk of navigation hazards and many accidents and incidents occurred in the past in this sector.
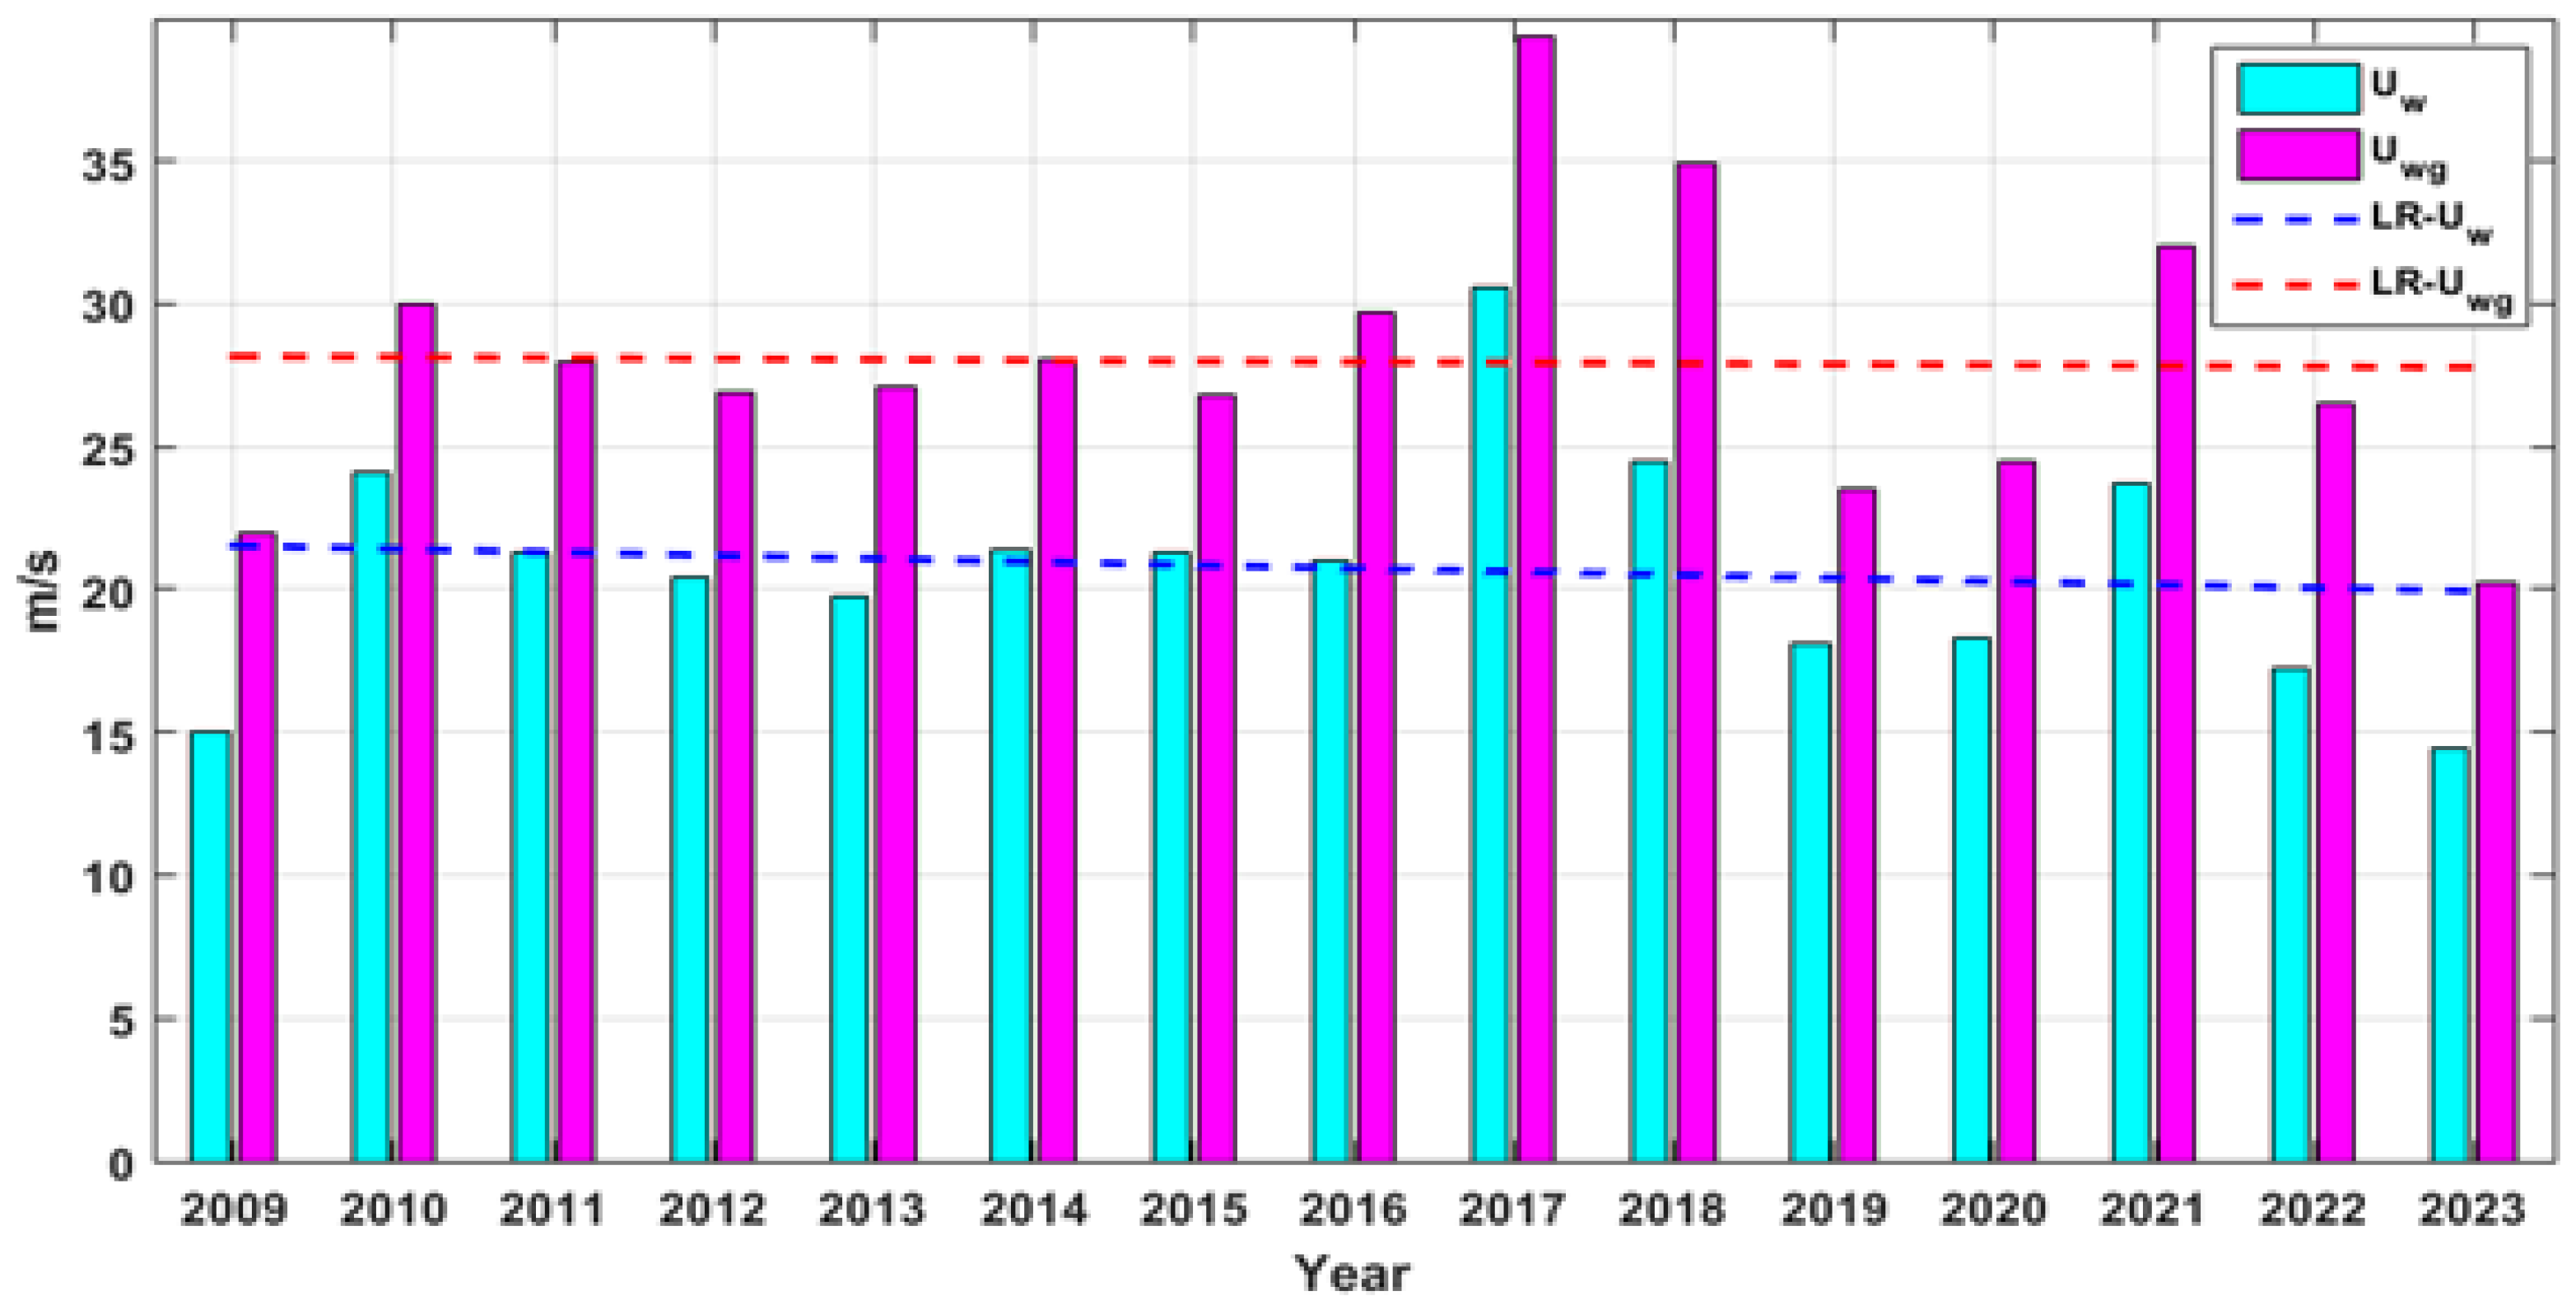
The analysis of 15 years of recent in situ measurements at the zero kilometer of the Danube showed that the maximum value of the wind speed (one hour step) registered in this point was almost 31m/s, while the maximum speed of the wind gust was almost 40m/s being with about 30% higher than the hourly value. The results also indicate that, for the entire data set analyzed, the average value of ratio between the maximum speed of the wind gust and the hourly wind speed value is of 1.7. However, in the case of the high wind speeds the intensity of the wind gust is relatively lower and the values of the ratio between the maximum speed of the wind gust and the hourly wind speed value is in general in the range [1.3-1.4].
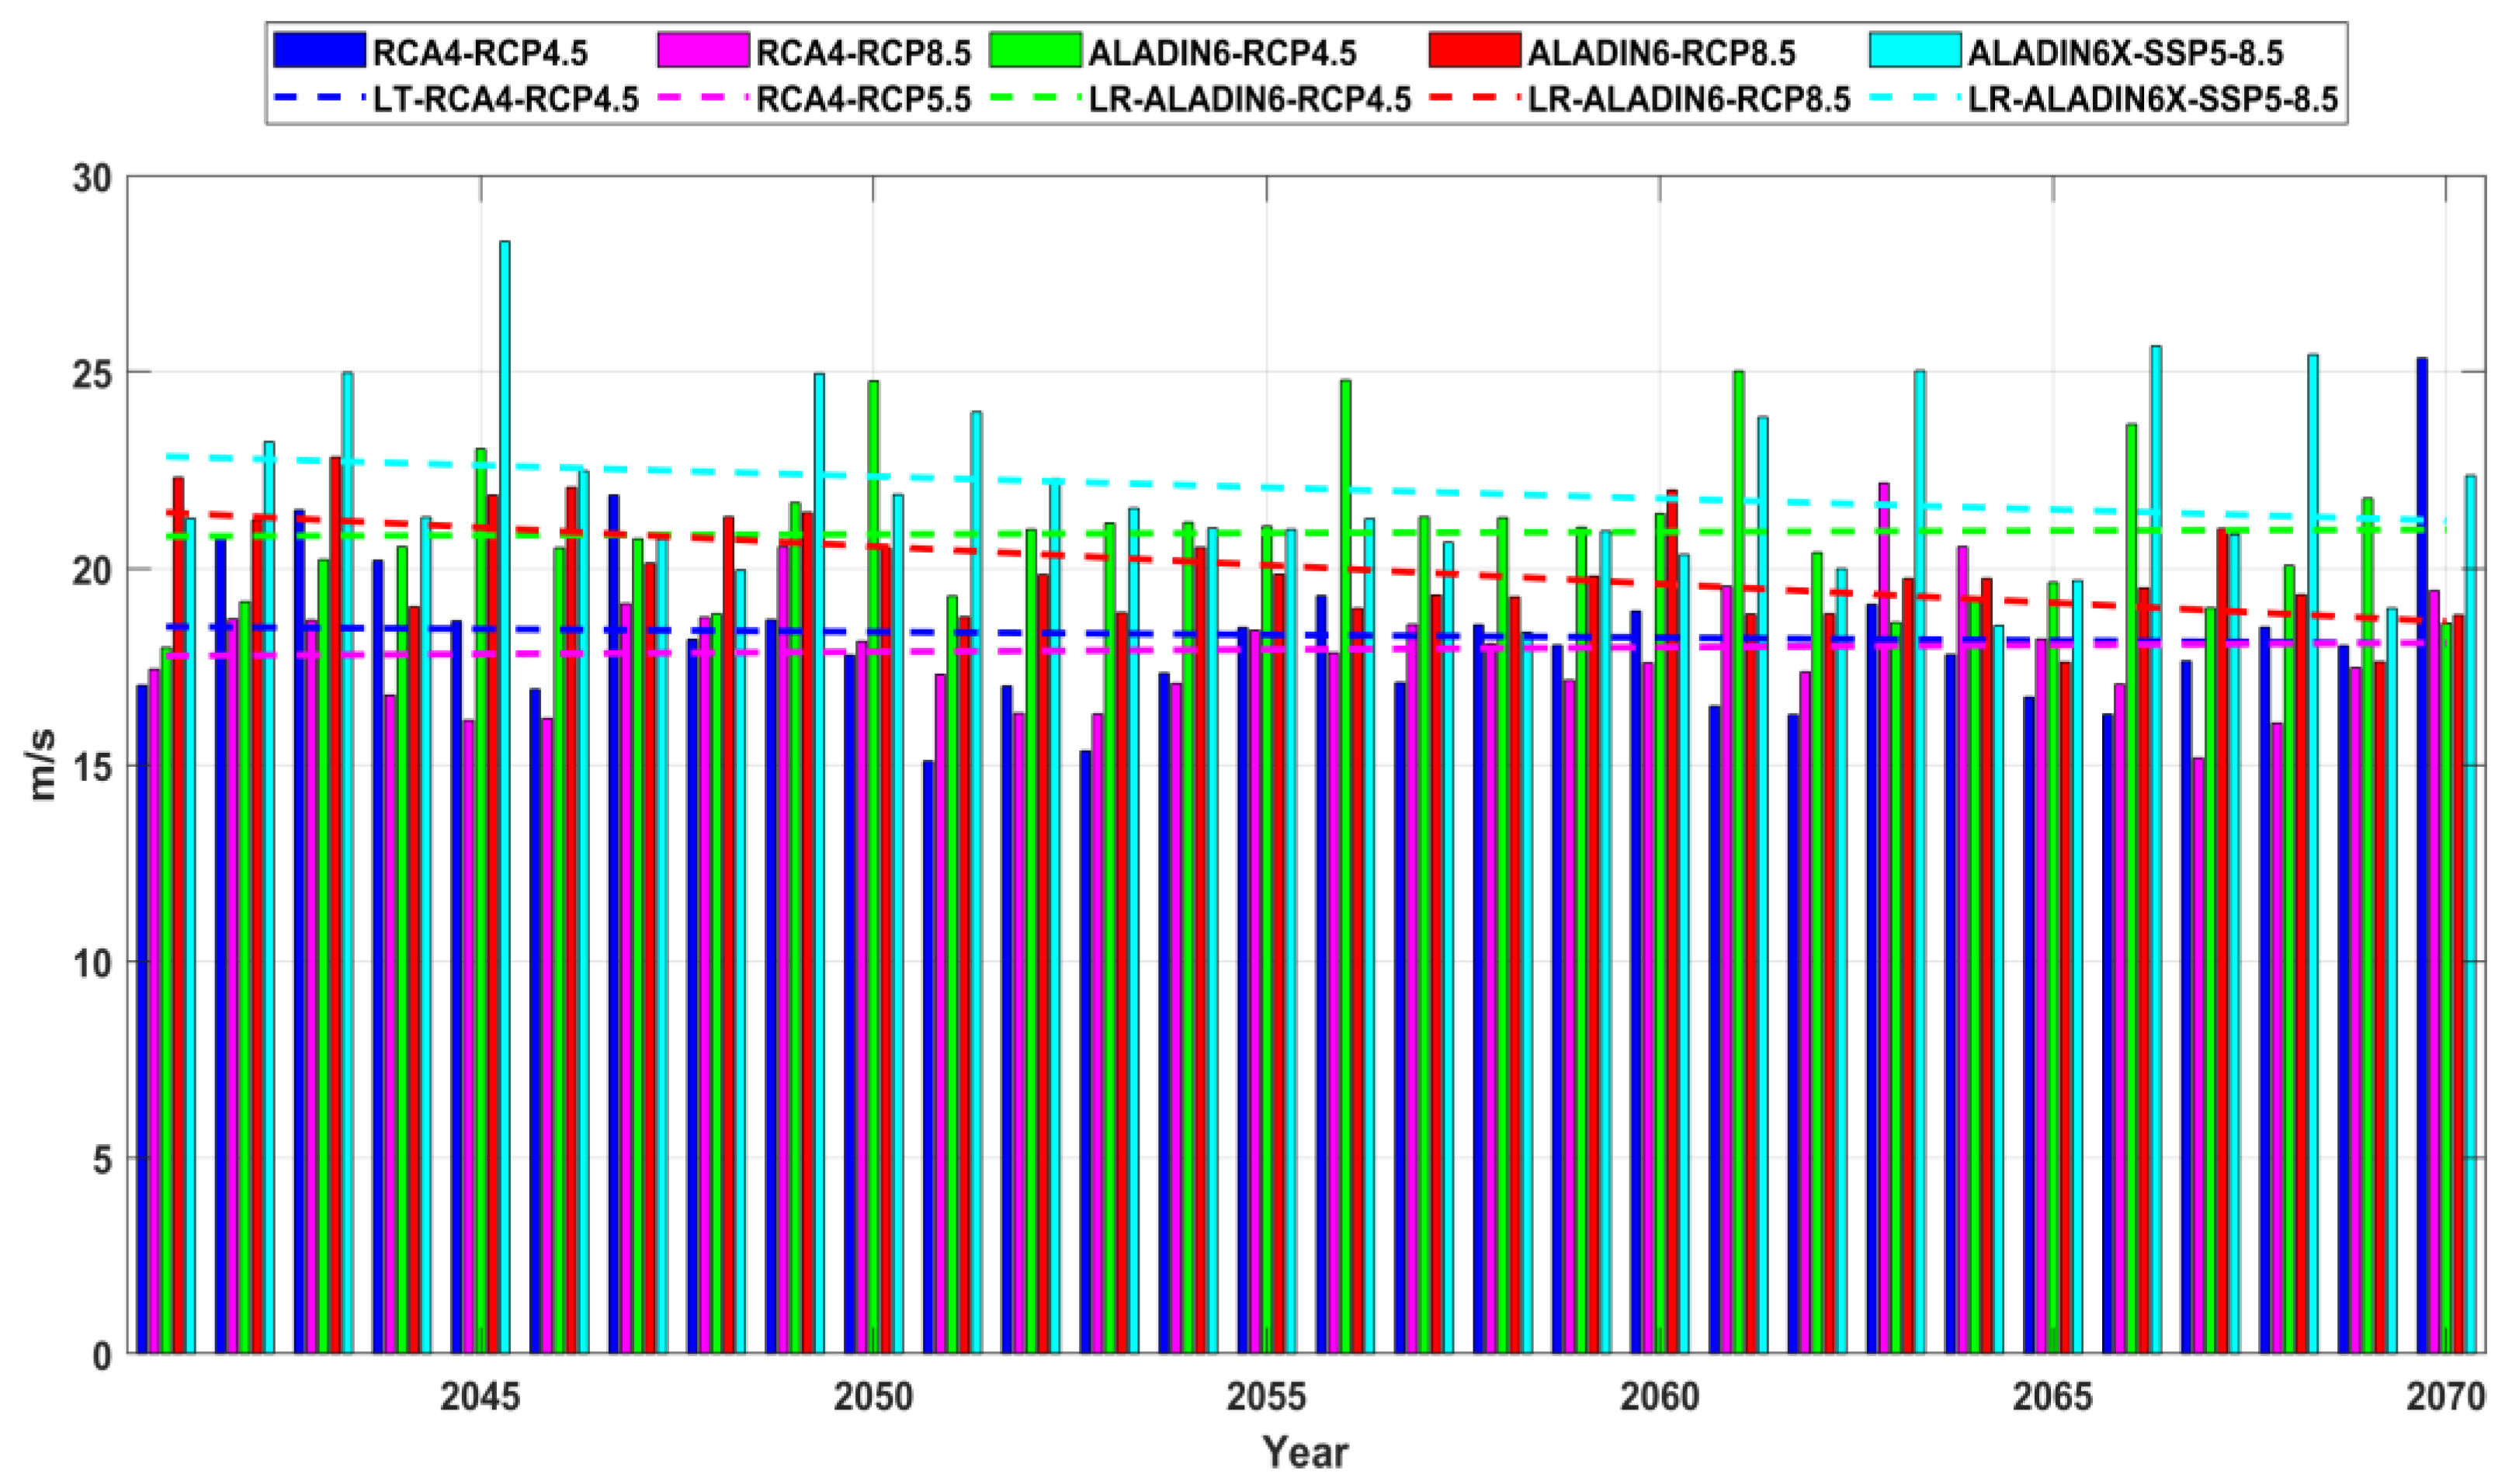
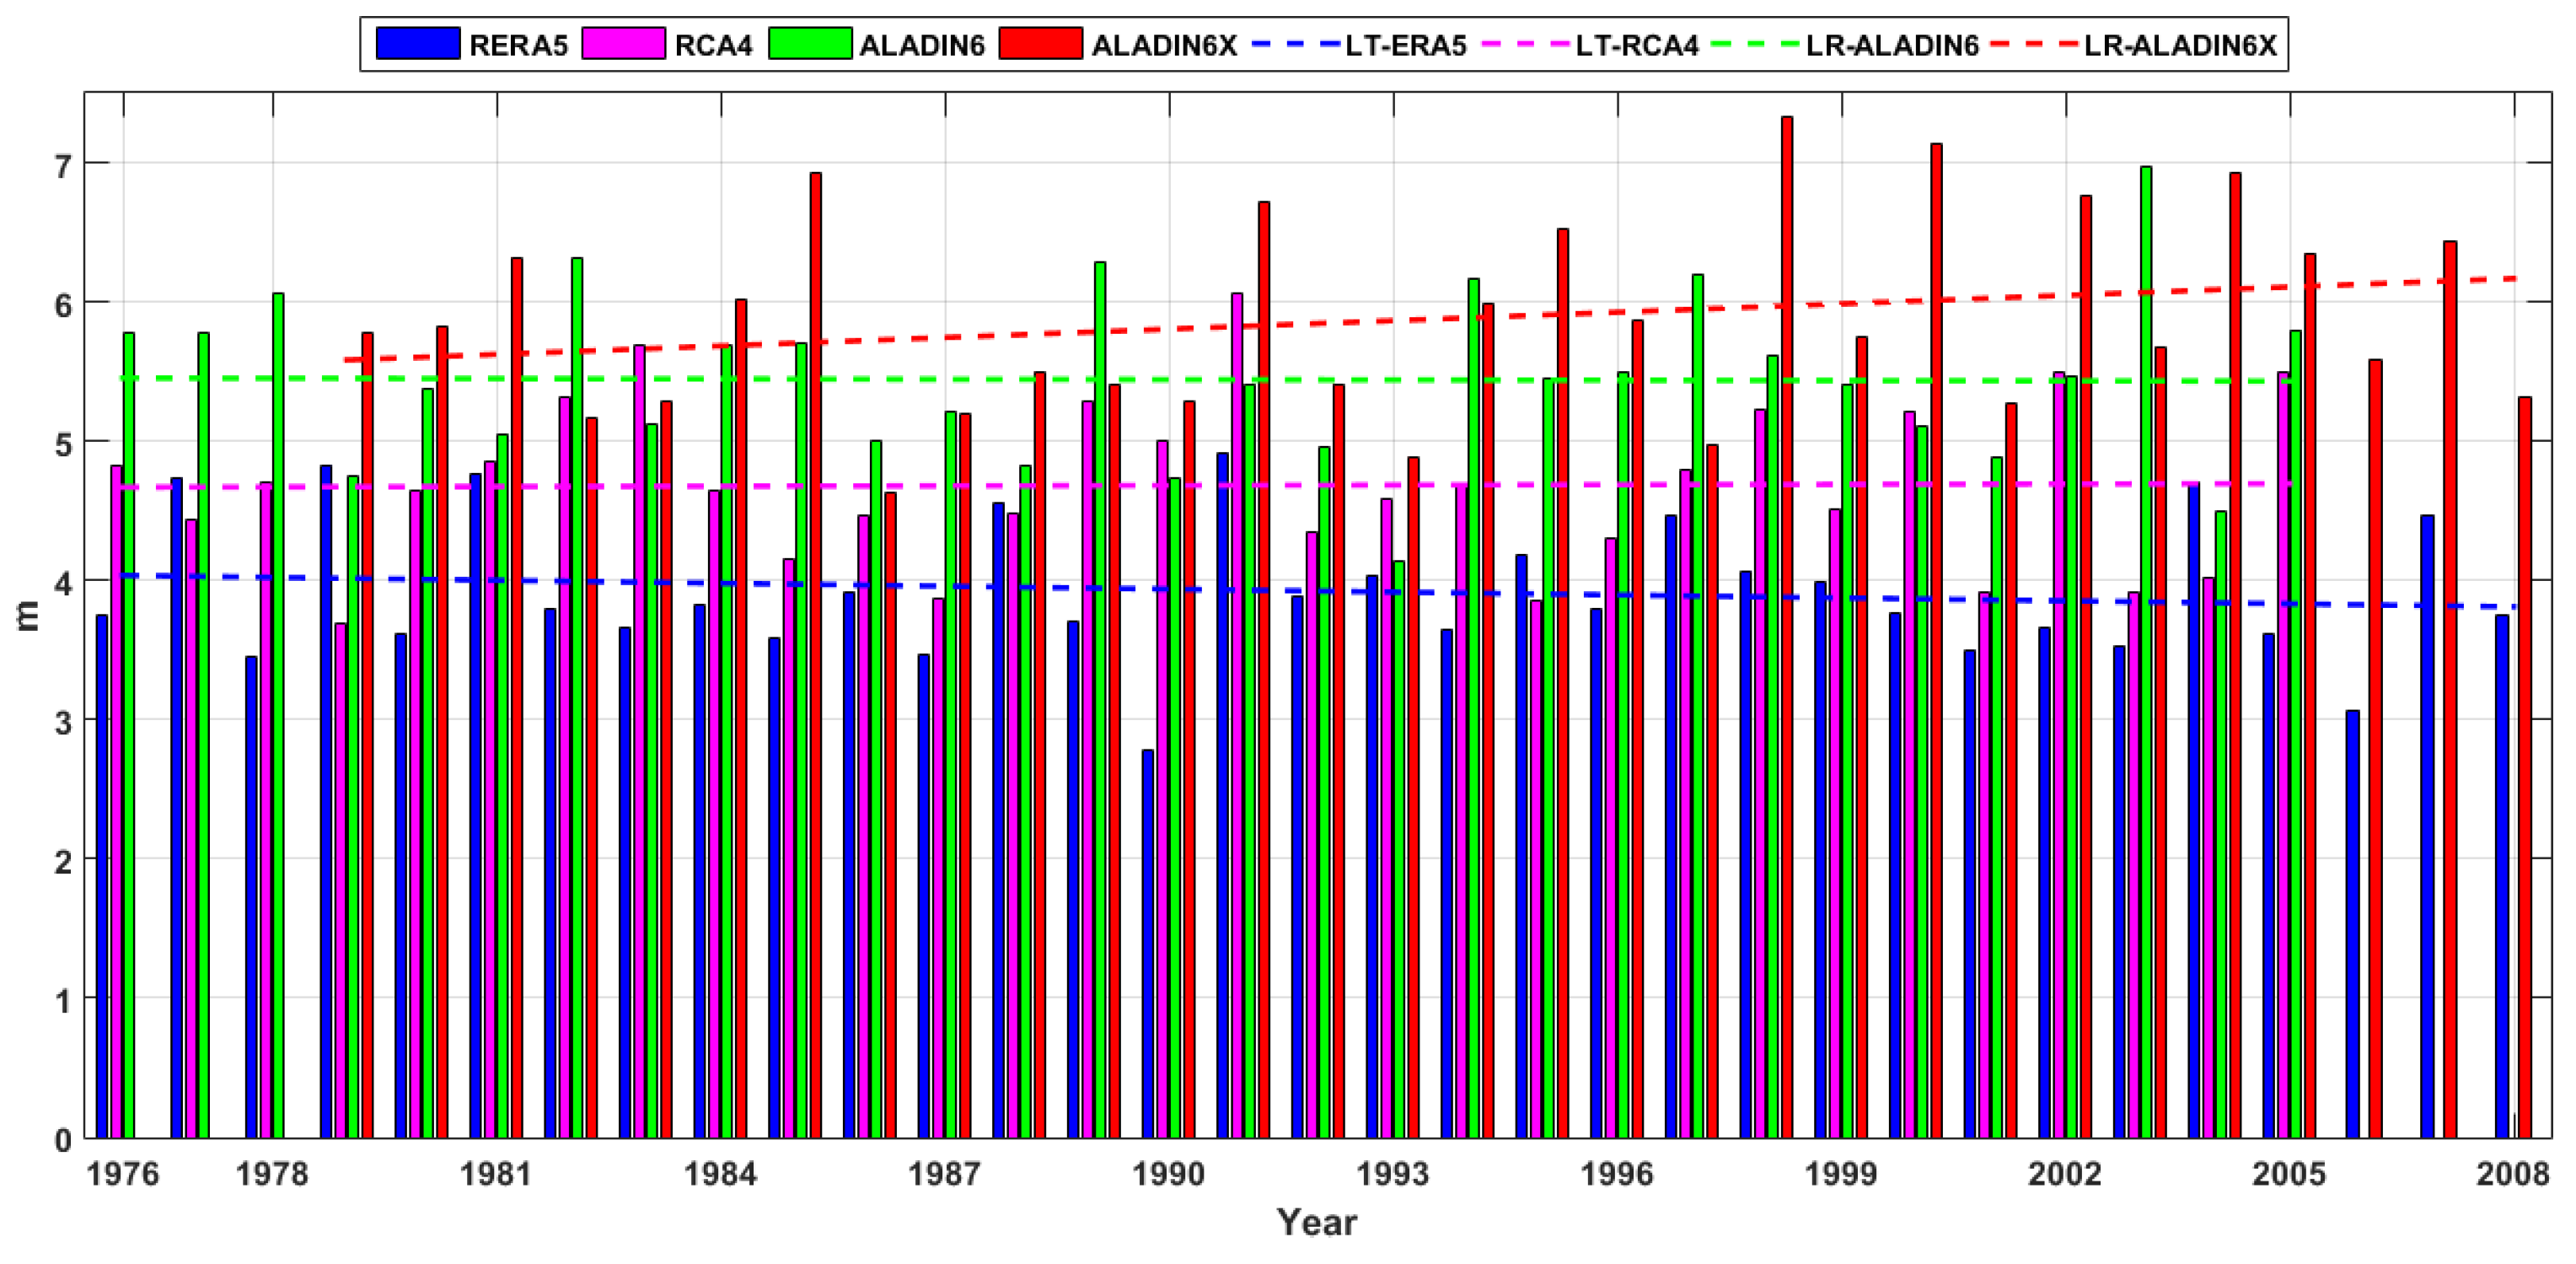
A second analysis was performed in two locations (one offshore Sulina and the other offshore Saint George) and it is based on data provided by two regional wind climate models (RCA4 and ALADIN) under several scenarios (RCP4.5, RCP8.5 and SSP5-8.5). The analysis was performed for the future 30-year time interval (2041-2070). In order to compare the evolution of wind climate in relationship with the past conditions, a 30-year time interval from the past was also considered when ERA5 reanalysis data have been processed and analyzed in parallel with the RCM data. The climate model results indicate for the past similar intensities with those provided by the measurements for the maximum wind speed, all the models indicating maximum values of the wind speed higher than 25m/s. It has to be highlighted also that the time step considered for all models was 3 hours. The results show that slightly higher values than in the past are expected in the future for the wind speed, especially in the case of SSP5-8.5.
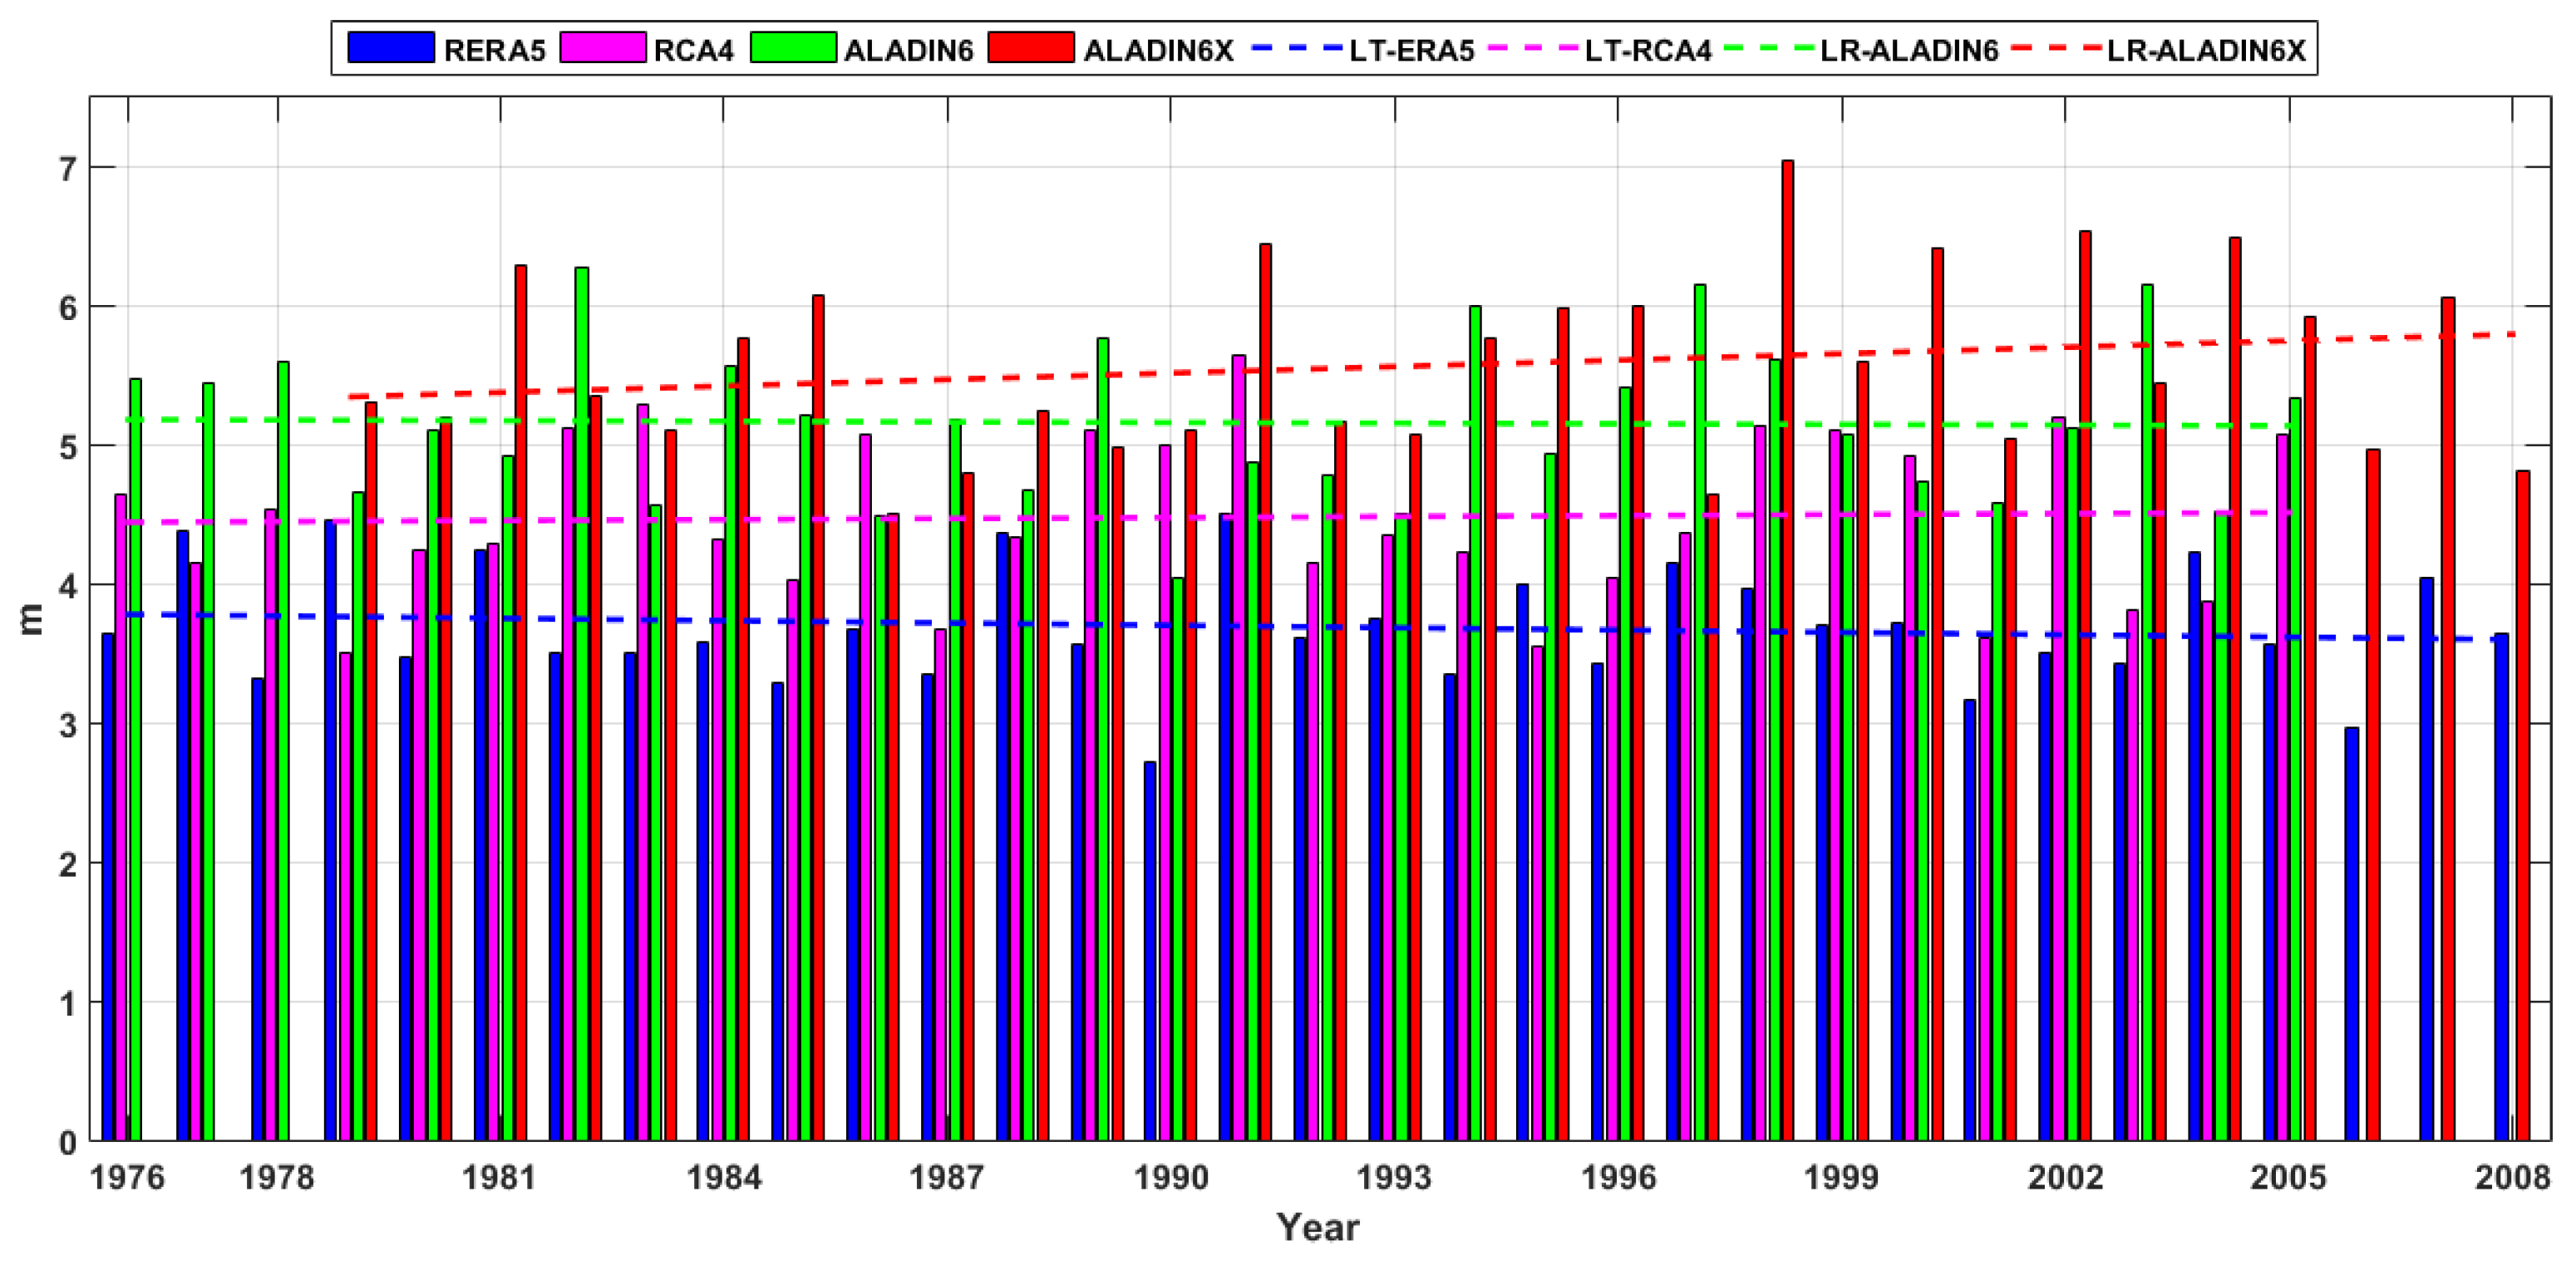
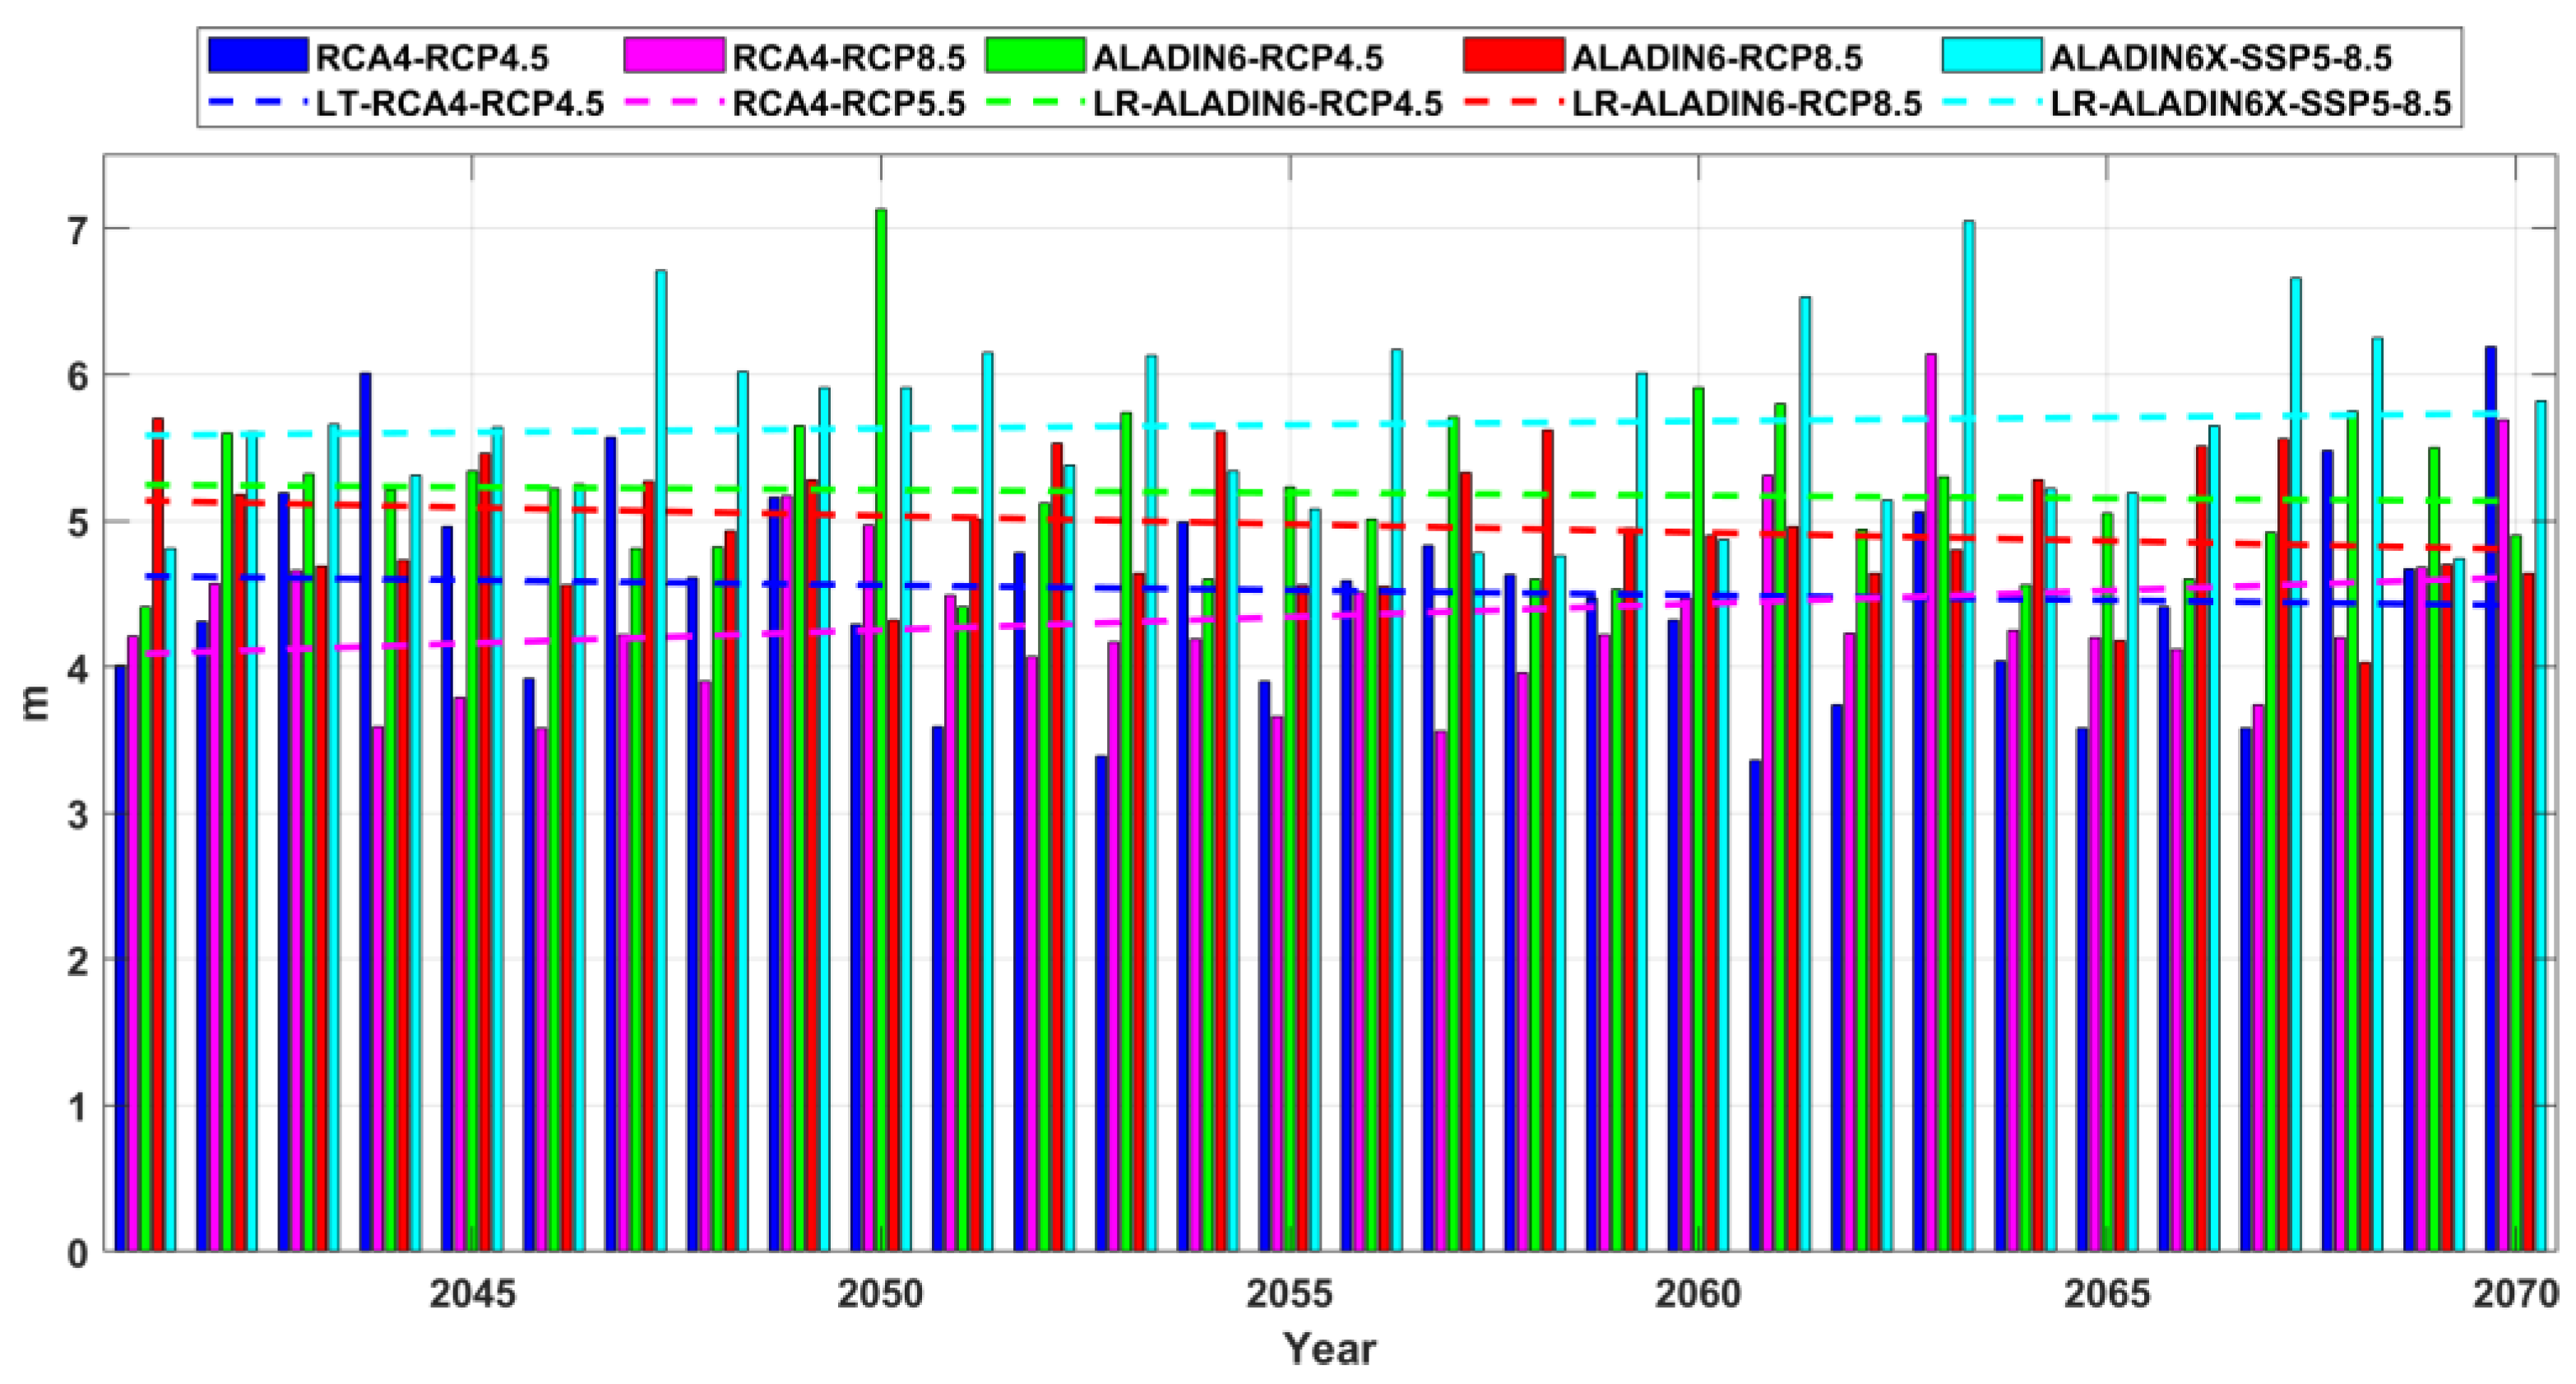
The last analysis relates the waves. In this connection, a wave modeling system that was previously validated against both in situ measurements and satellite data, was forced successively with each wind data field considered and simulations have been performed for the two 30-year time periods previously considered in the case of the wind analysis. The results show that Hs values of about 7 meters have been encountered in the past offshore close to the mouths of the Danube and such extreme values might be also expected more often in the future. The wave model simulations performed in the high resolution computational domain focused on Sulina channel also showed that, due to the nearshore effects, an enhancement between 30% and 40% in terms of significant wave height may be expected at the entrance in Sulina channel. Furthermore, not only the significant wave heights are higher, but also, due to the strong wave-current interaction processes, the probability of rogue waves occurrence is very high. This indicates that waves with heights of 20 meters, or even more, and also wind speeds higher than 30m/s, associated with wind gusts that might exceed 40m/s, can be expected in extreme storm conditions in this coastal environment.
Finally, the general conclusion of this work is that the navigation conditions in this sector present high risk of hazards, especially in the winter time. In fact, for this reason very often, even in the case of the moderate storms, the navigation is closed at the entrance in Sulina channel.
Figure 1.
The Black Sea and the entrance in Sulina channel, the main navigation gate for the Maritime Danube and for the 7th Pan-European transport corridor (figure processed from Google Earth).
Figure 1.
The Black Sea and the entrance in Sulina channel, the main navigation gate for the Maritime Danube and for the 7th Pan-European transport corridor (figure processed from Google Earth).
Figure 2.
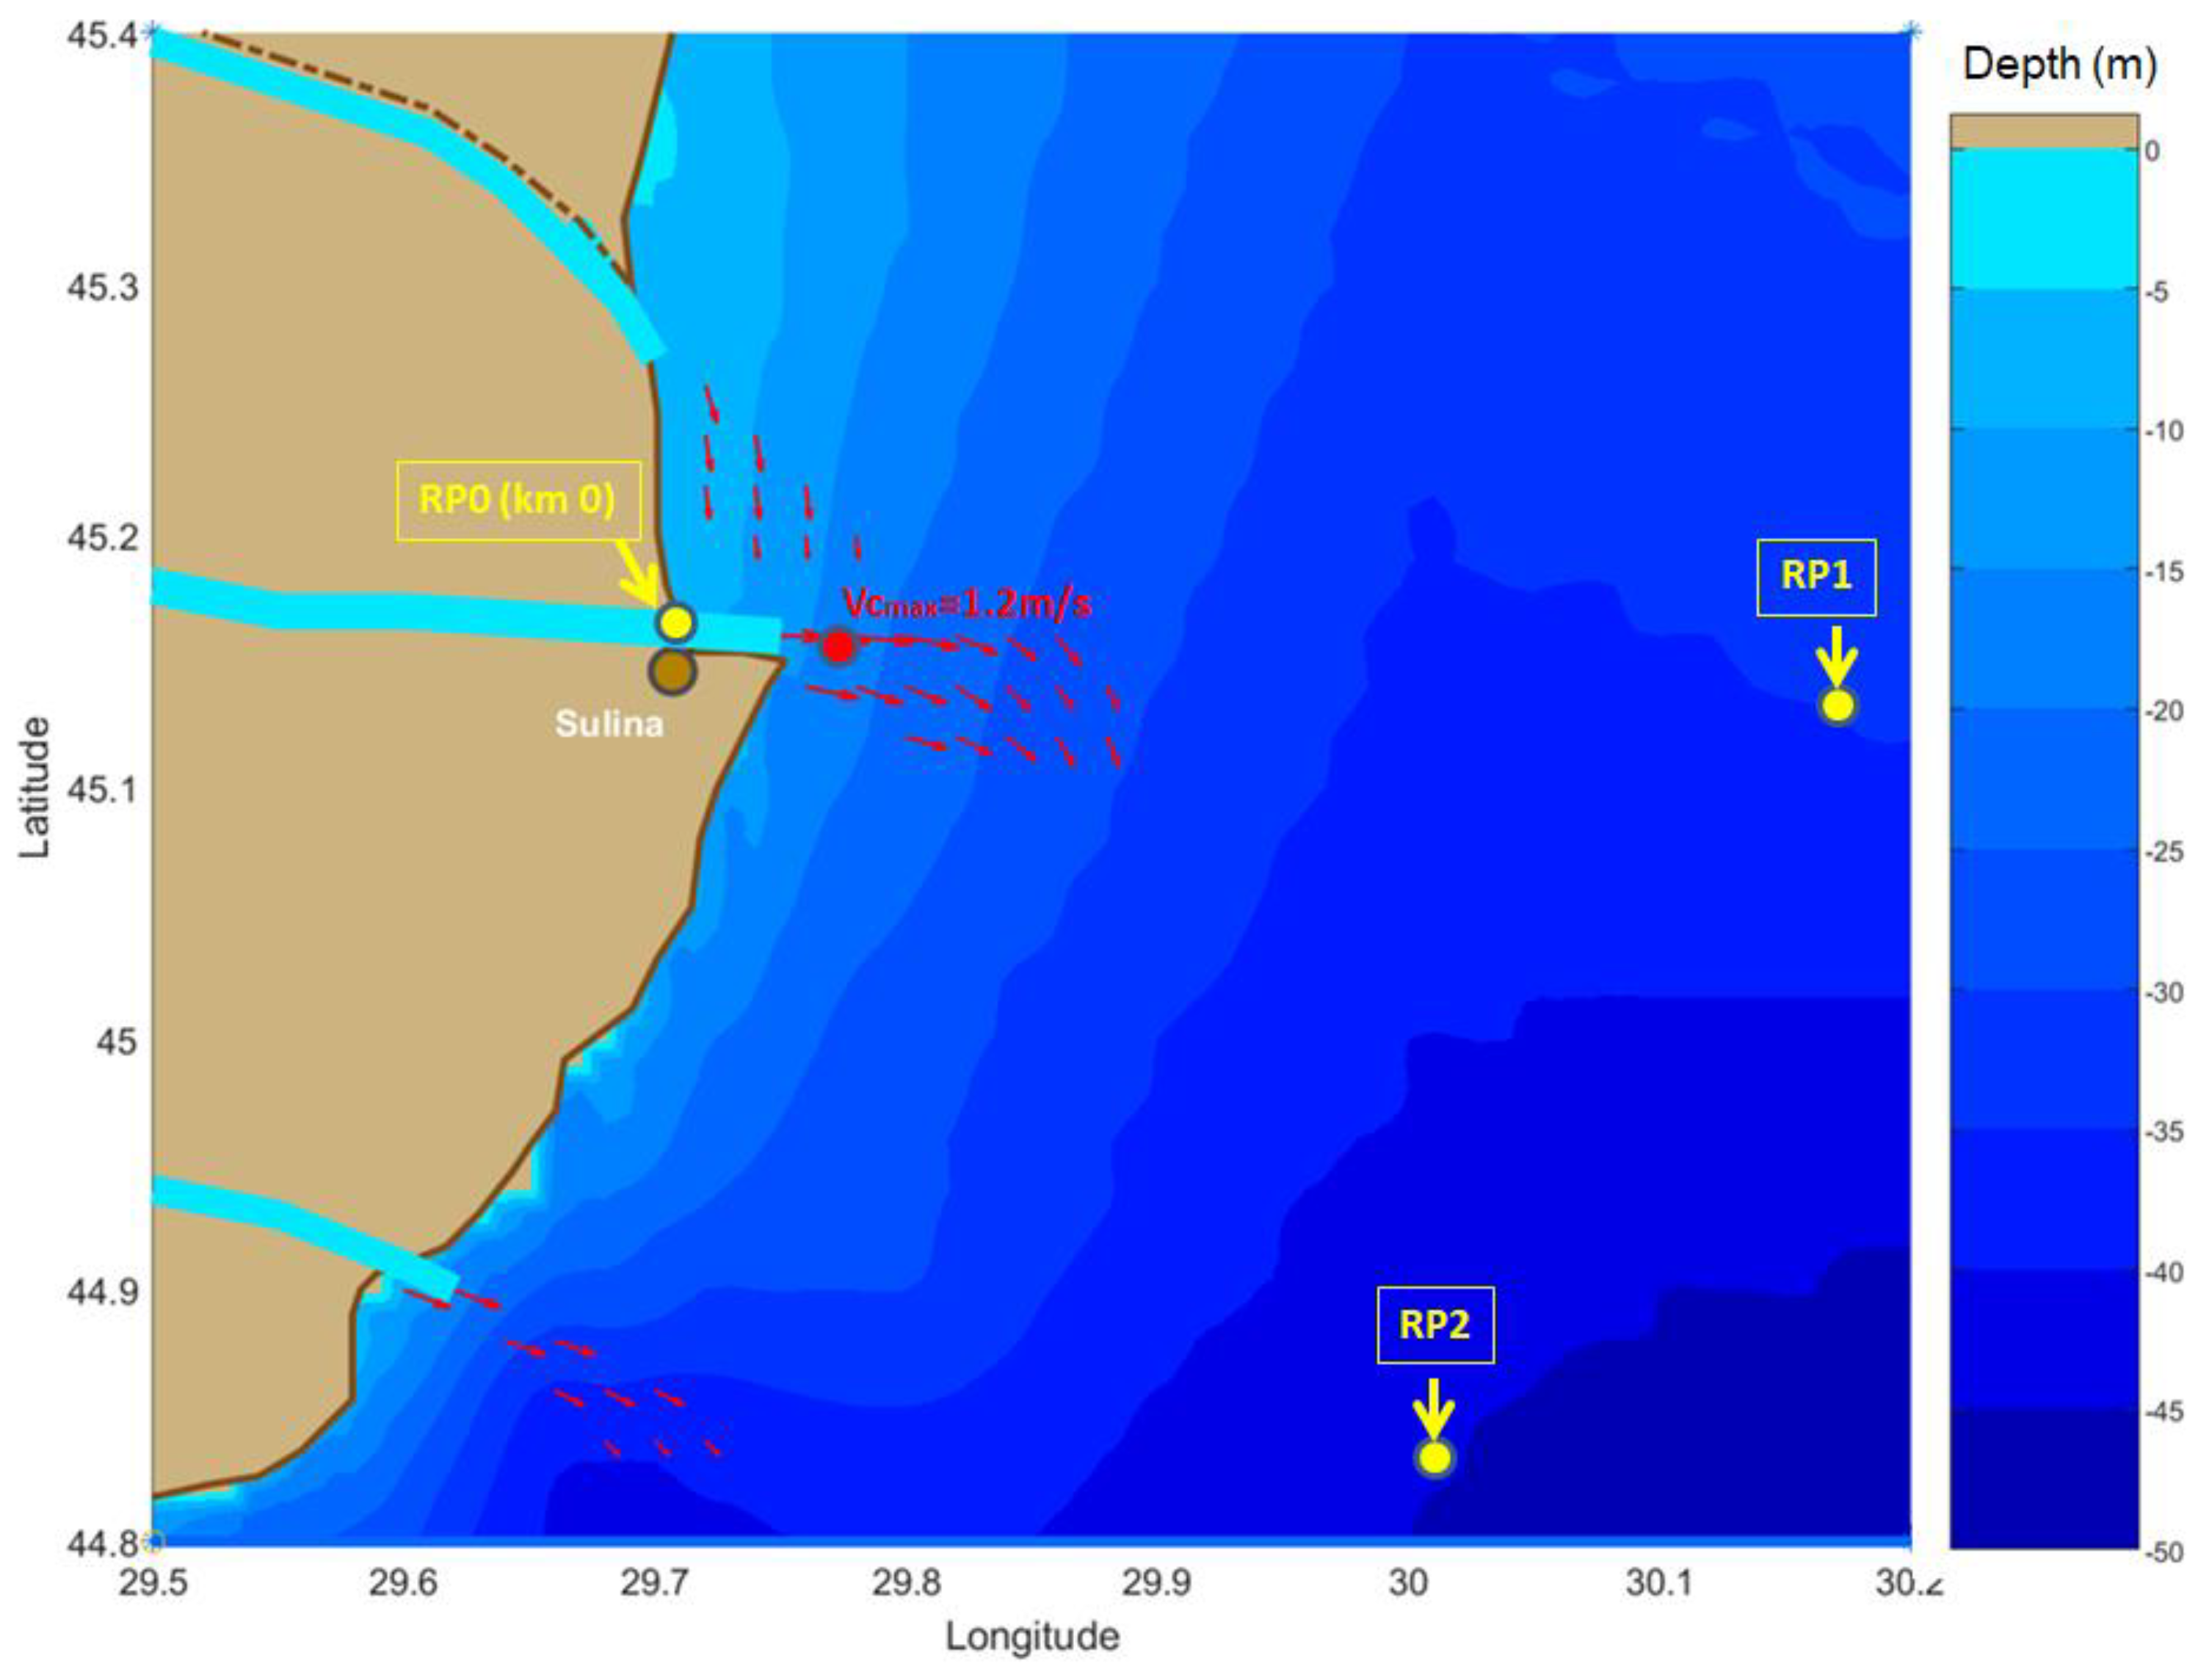
Bathymetric map of the coastal area at the Danube’s mouths and the position of the three reference points considered. The coastal currents induced by the river outflow, estimated according to [
24,
25,
26], are also represented with red arrows.
Figure 2.
Bathymetric map of the coastal area at the Danube’s mouths and the position of the three reference points considered. The coastal currents induced by the river outflow, estimated according to [
24,
25,
26], are also represented with red arrows.
Figure 3.
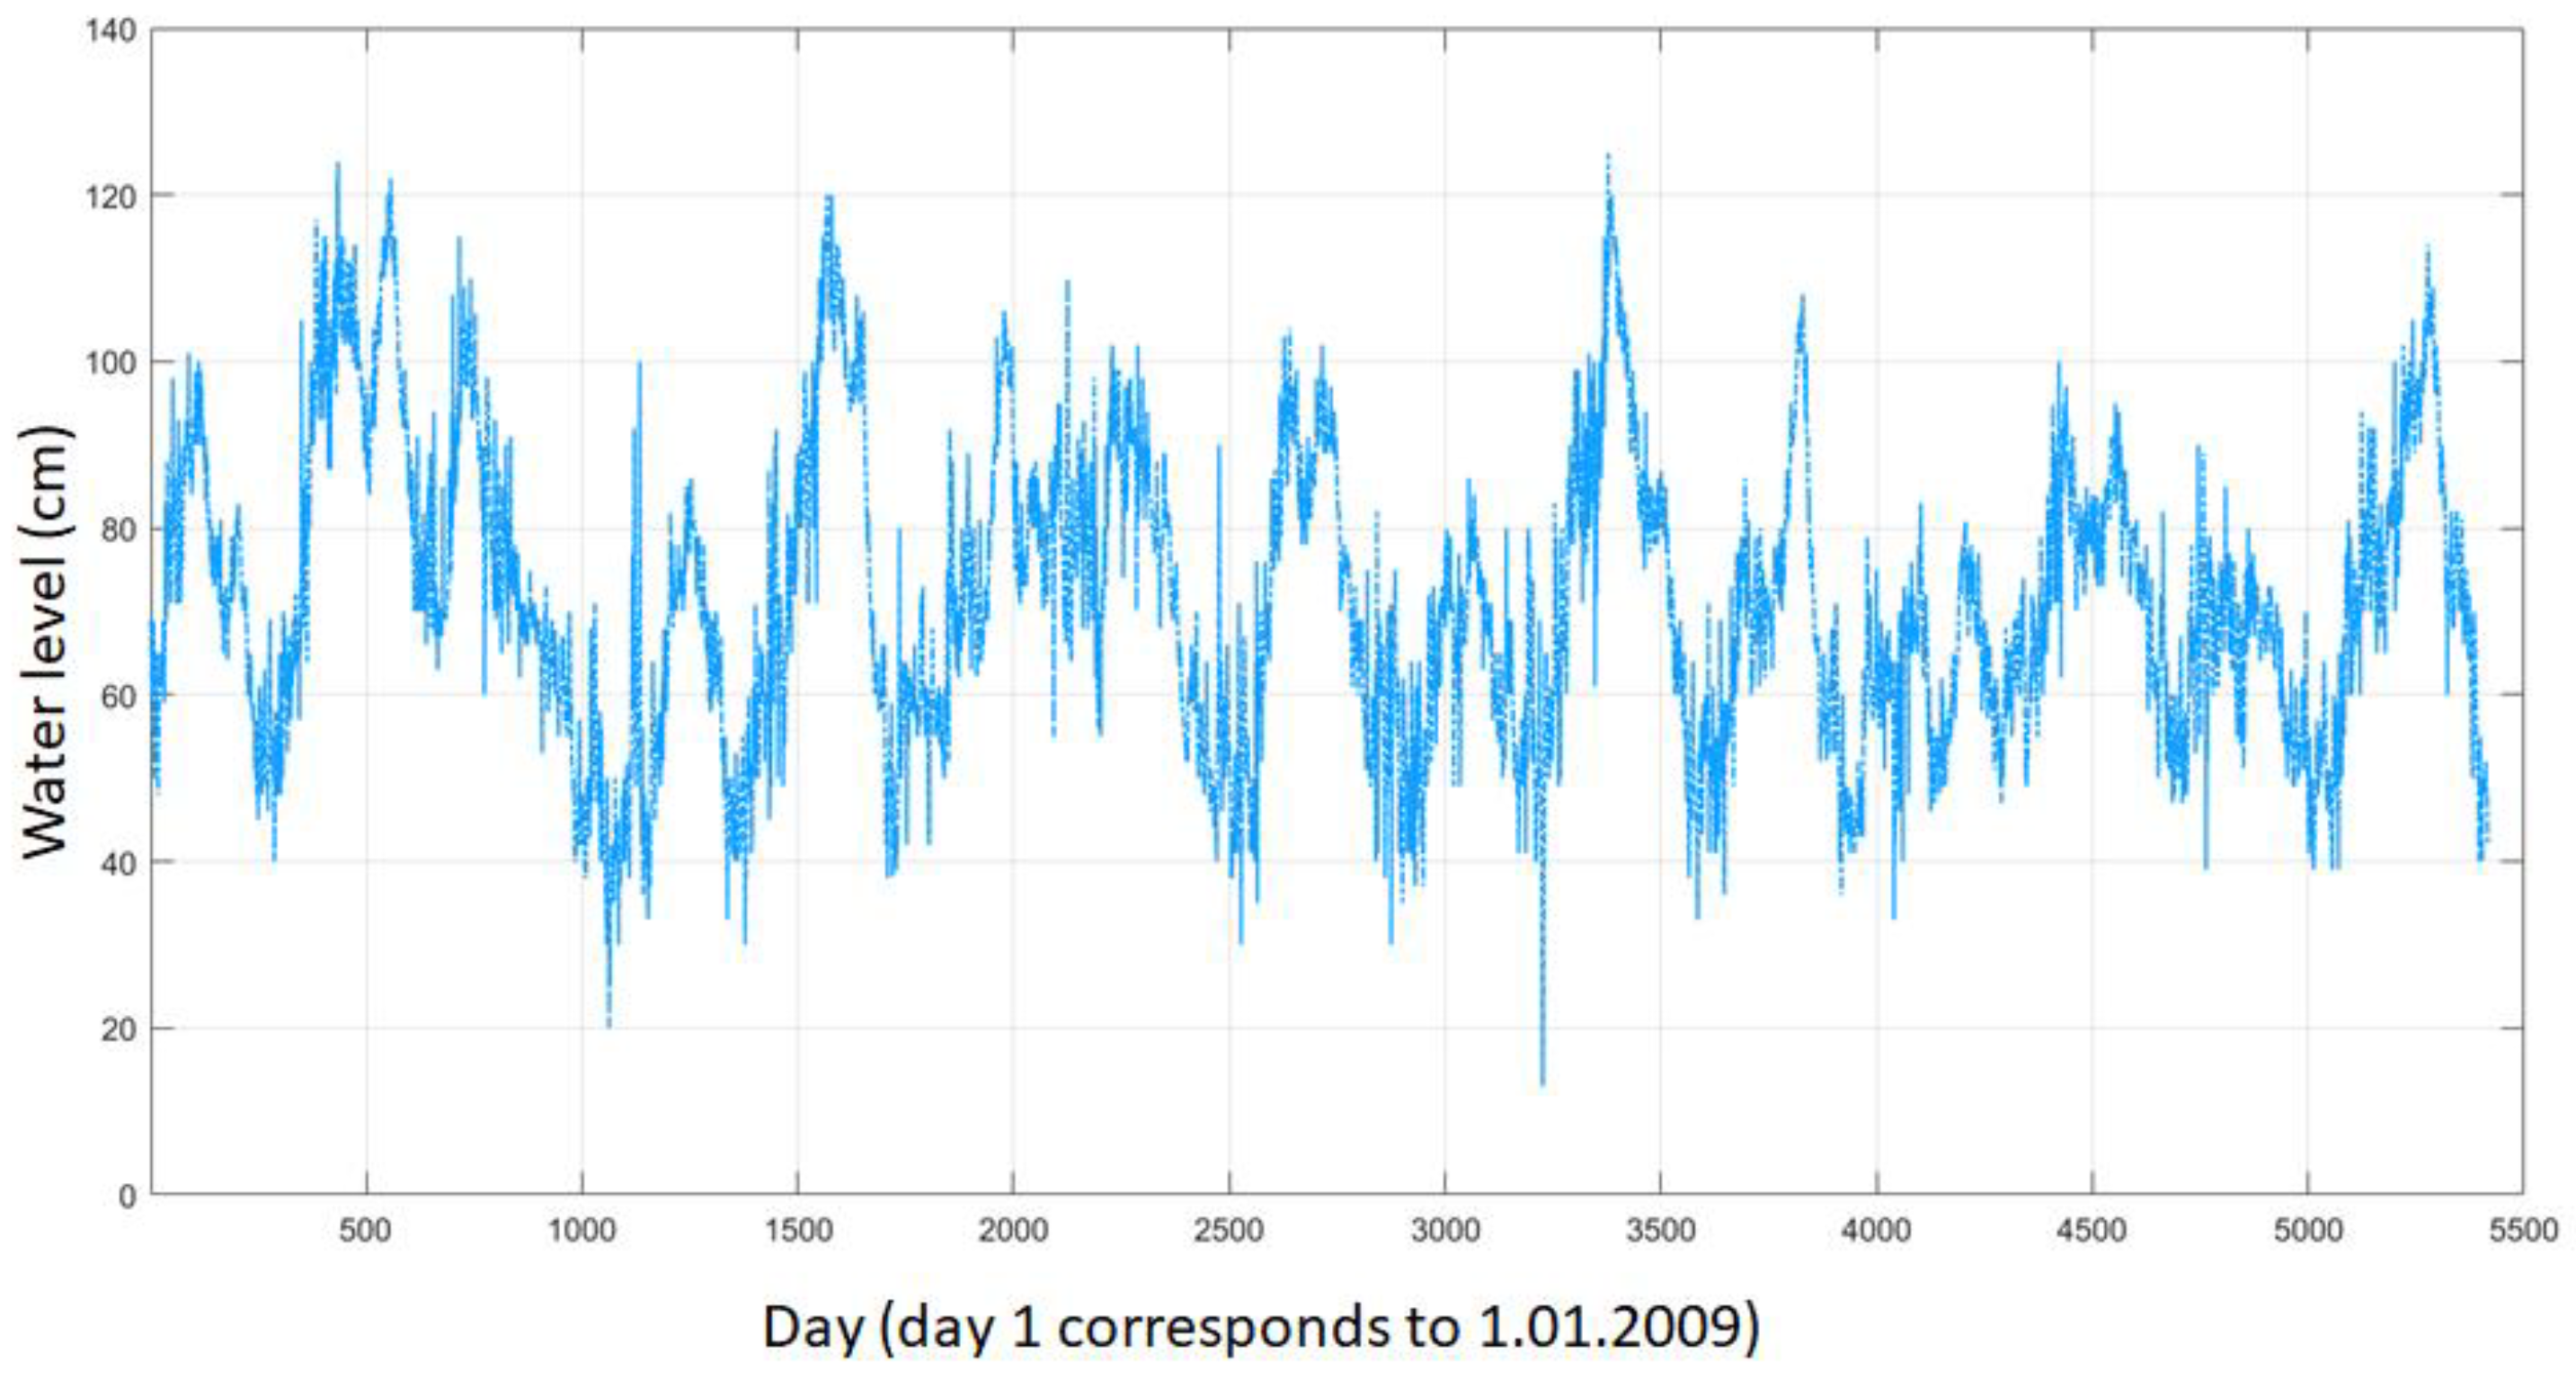
Variation of the water level at the entrance in Sulina channel (RP0). Results of the daily measurements carried out for the 15-year time interval 2009-2023.
Figure 3.
Variation of the water level at the entrance in Sulina channel (RP0). Results of the daily measurements carried out for the 15-year time interval 2009-2023.
Figure 4.
Wind roses corresponding to the 15-year time interval 2009-2023. a) Uw - hourly averaged values of the wind speed; b) Uwg - maximum value of the wind gust.
Figure 4.
Wind roses corresponding to the 15-year time interval 2009-2023. a) Uw - hourly averaged values of the wind speed; b) Uwg - maximum value of the wind gust.
Figure 5.
Uw and Uwg annual maxim series measured at the entrance in Sulina channel (RP0), corresponding to 15-year time interval 2009-2023.
Figure 5.
Uw and Uwg annual maxim series measured at the entrance in Sulina channel (RP0), corresponding to 15-year time interval 2009-2023.
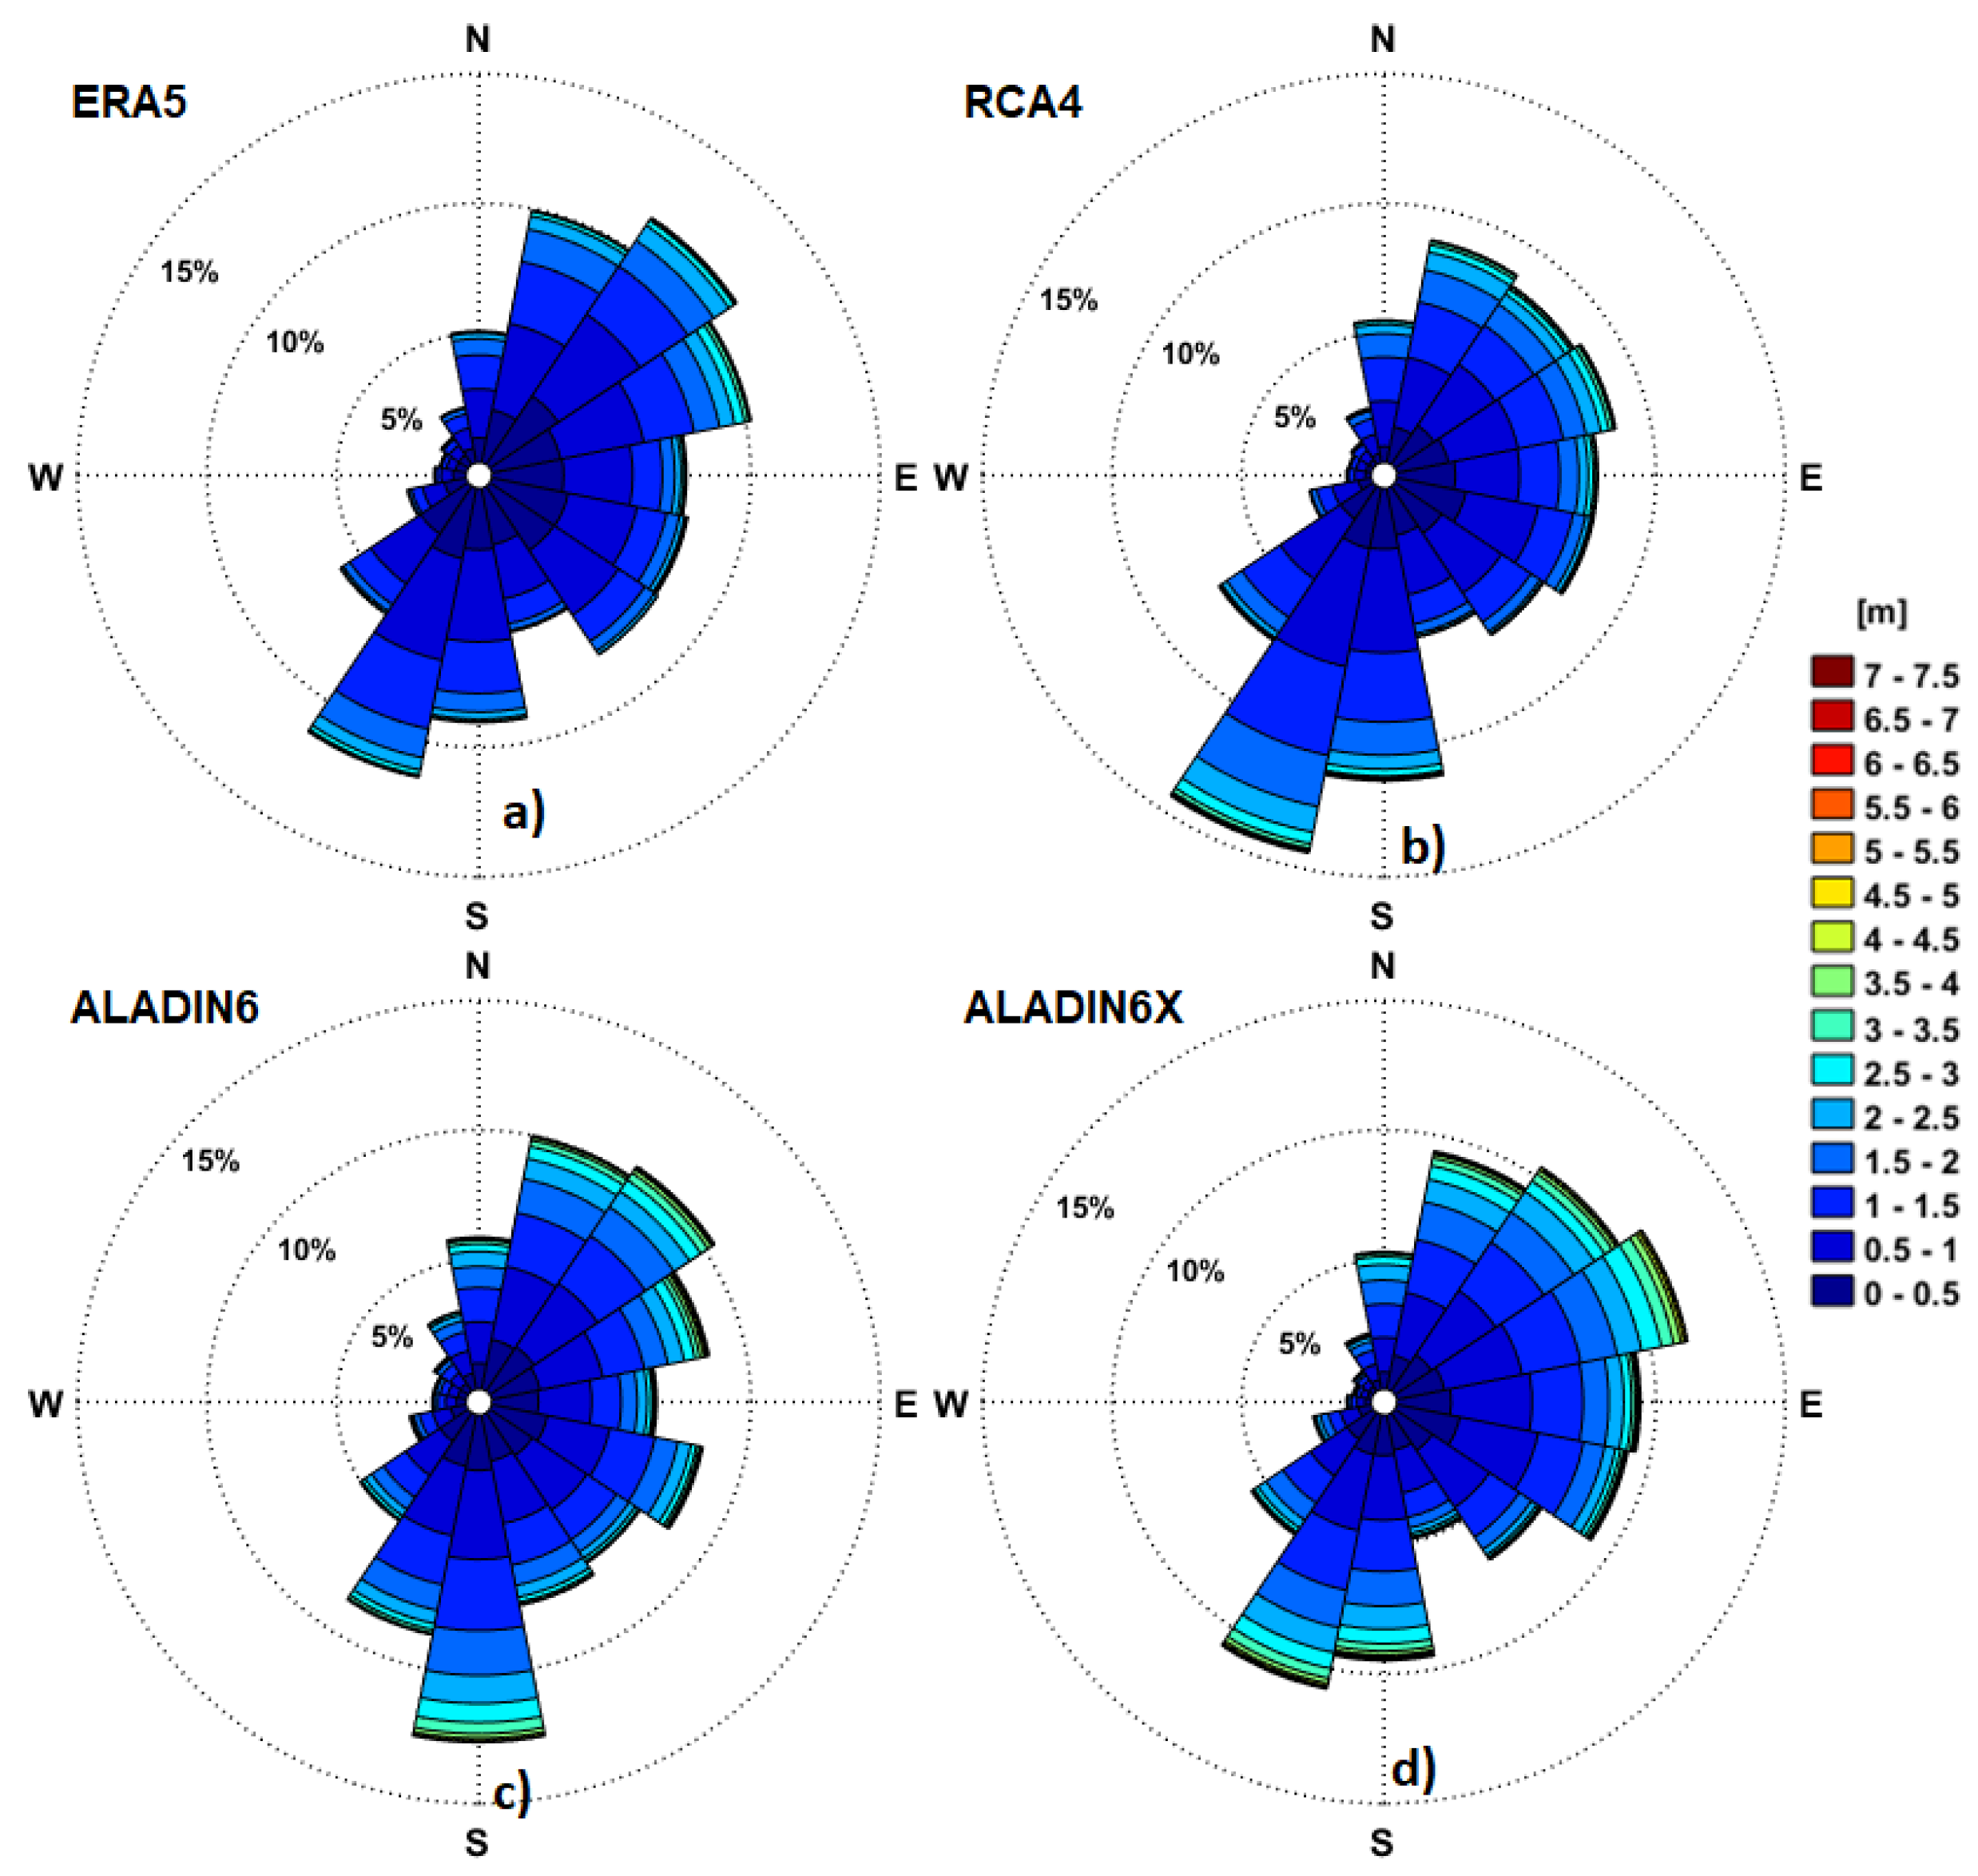
Figure 6.
Wind roses offshore Sulina channel (RP1) for the recent past period based on analysis of the hindcast and climate models data. a) ERA5 (1976-2008); b) RCA4, for RCP scenarios (1976-2005); c) ALADIN6, for RCP scenarios (1976-2005); d) ALADIN6x, for SSP scenario (1979-2008).
Figure 6.
Wind roses offshore Sulina channel (RP1) for the recent past period based on analysis of the hindcast and climate models data. a) ERA5 (1976-2008); b) RCA4, for RCP scenarios (1976-2005); c) ALADIN6, for RCP scenarios (1976-2005); d) ALADIN6x, for SSP scenario (1979-2008).
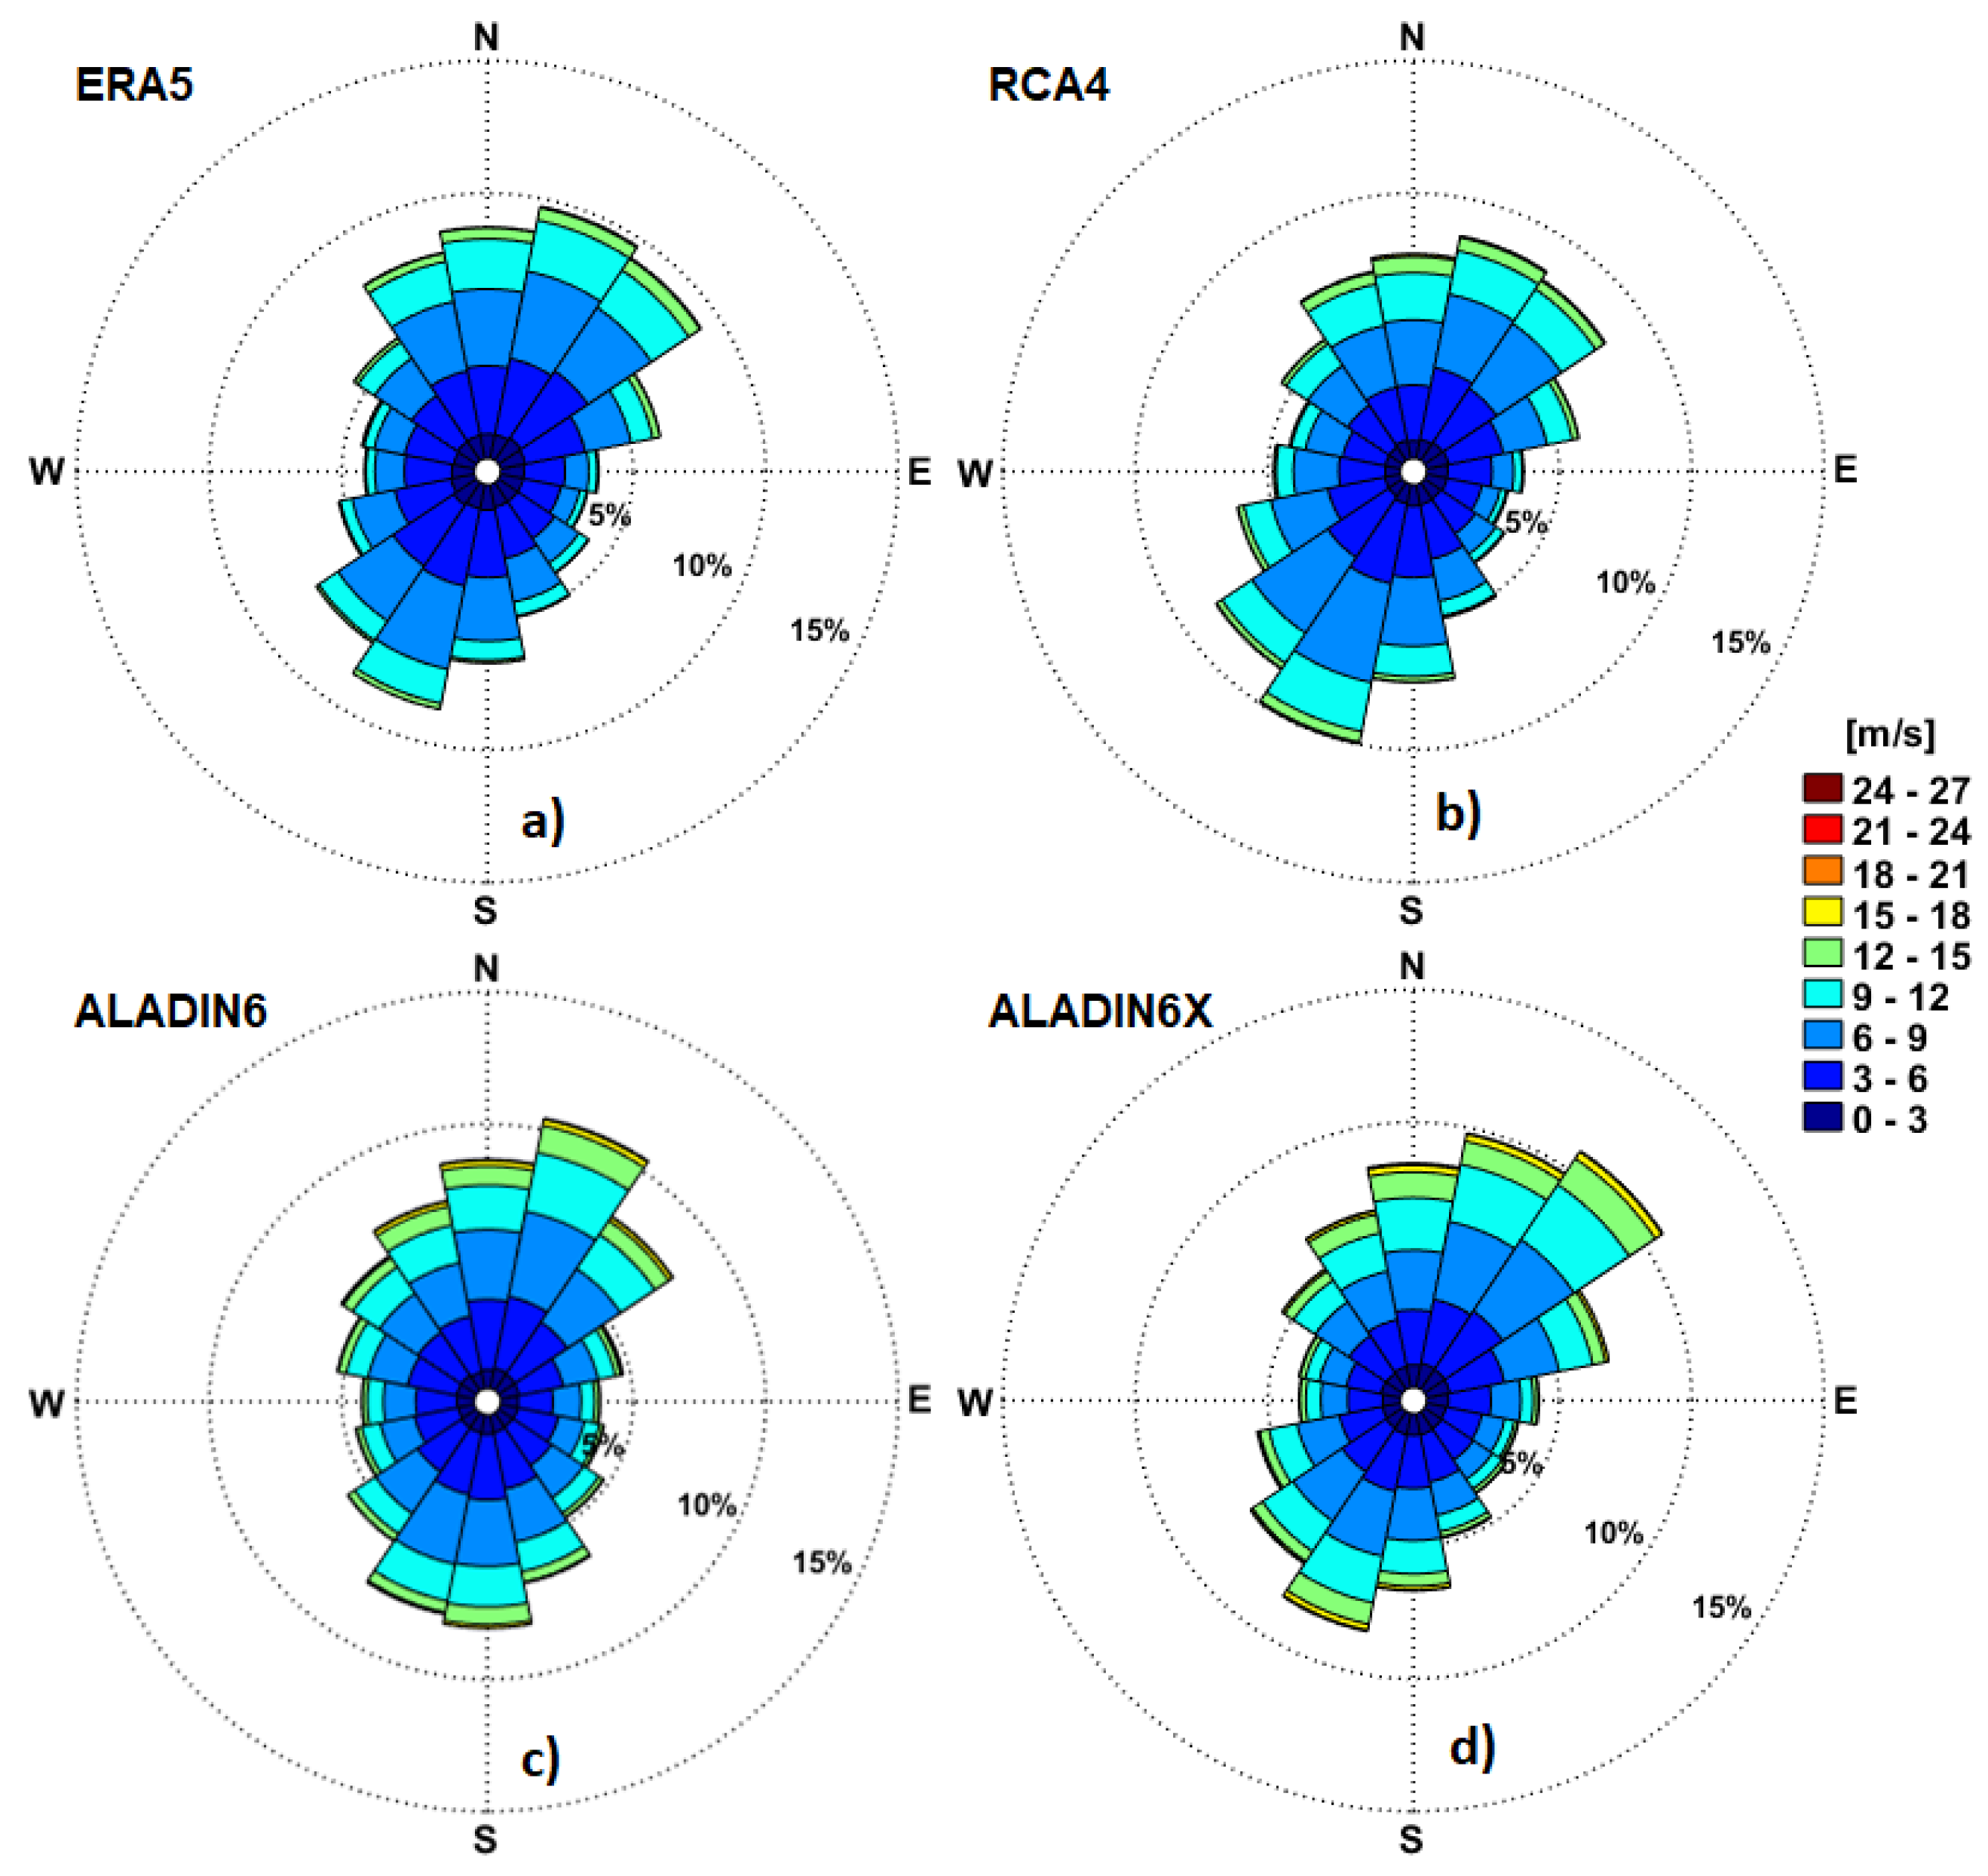
Figure 7.
Wind roses offshore Saint George arm of the Danube (RP2) for the recent past period based on analysis of the hindcast and climate models data. a) ERA5 (1976-2008); b) RCA4, for RCP scenarios (1976-2005); c) ALADIN6, for RCP scenarios (1976-2005); d) ALADIN6x, for SSP scenario (1979-2008).
Figure 7.
Wind roses offshore Saint George arm of the Danube (RP2) for the recent past period based on analysis of the hindcast and climate models data. a) ERA5 (1976-2008); b) RCA4, for RCP scenarios (1976-2005); c) ALADIN6, for RCP scenarios (1976-2005); d) ALADIN6x, for SSP scenario (1979-2008).
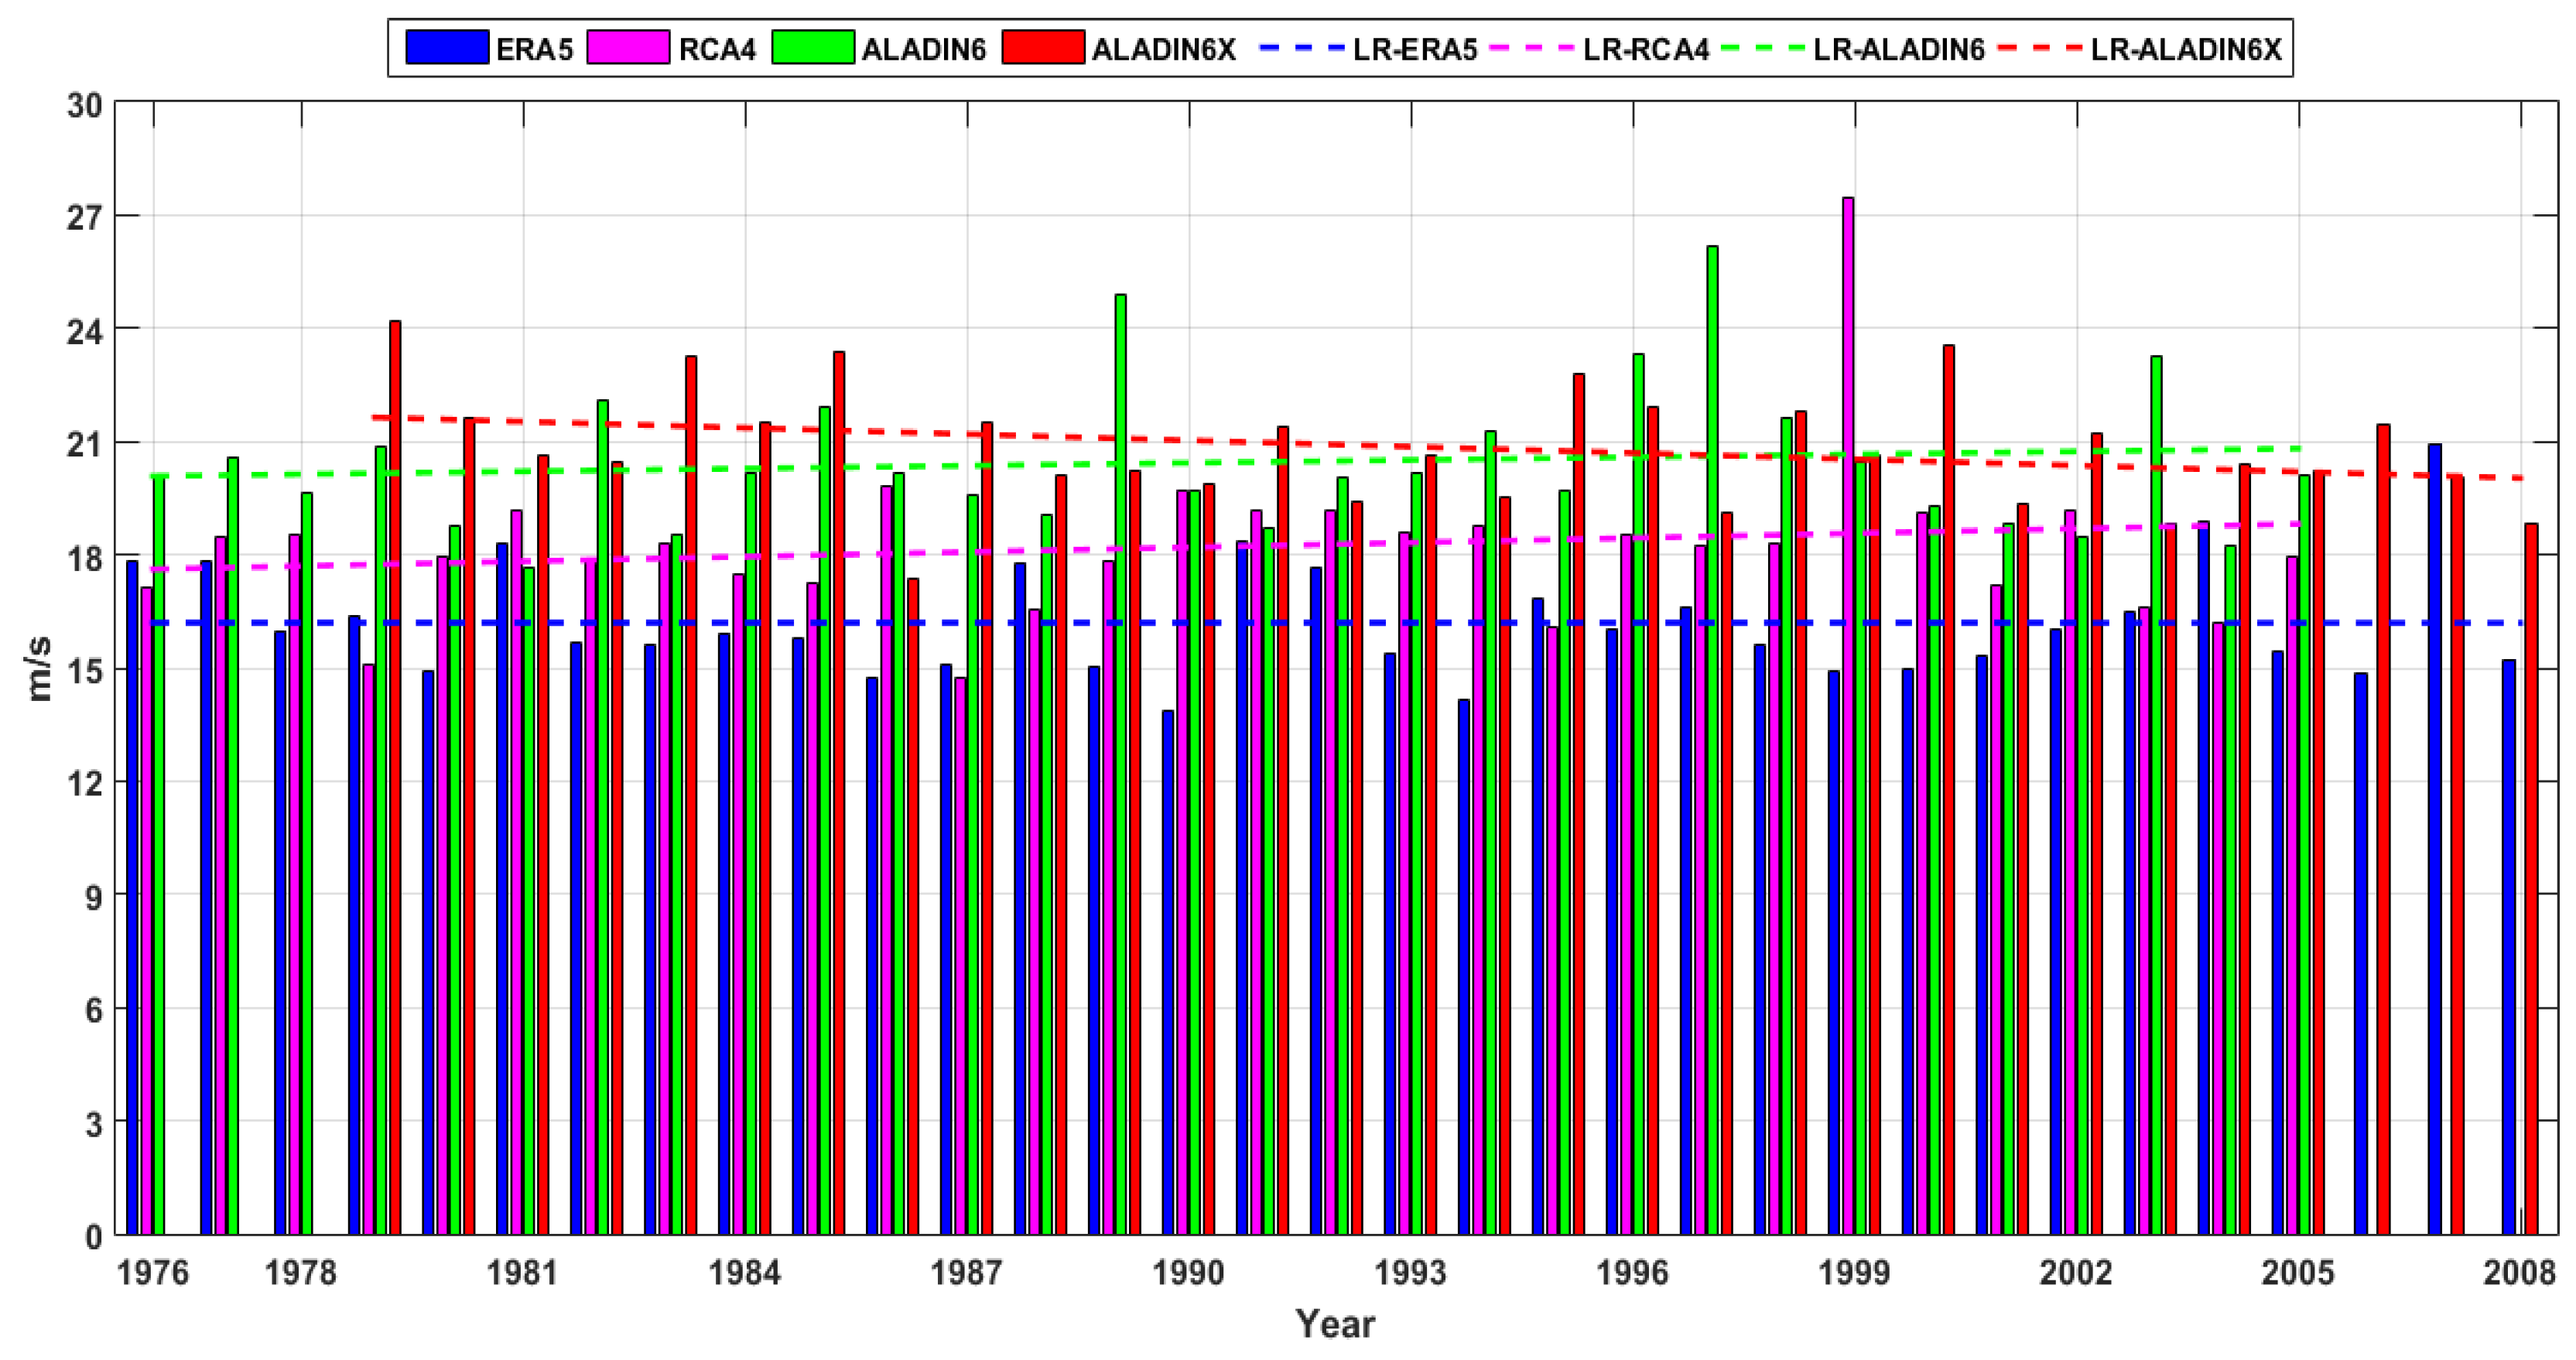
Figure 8.
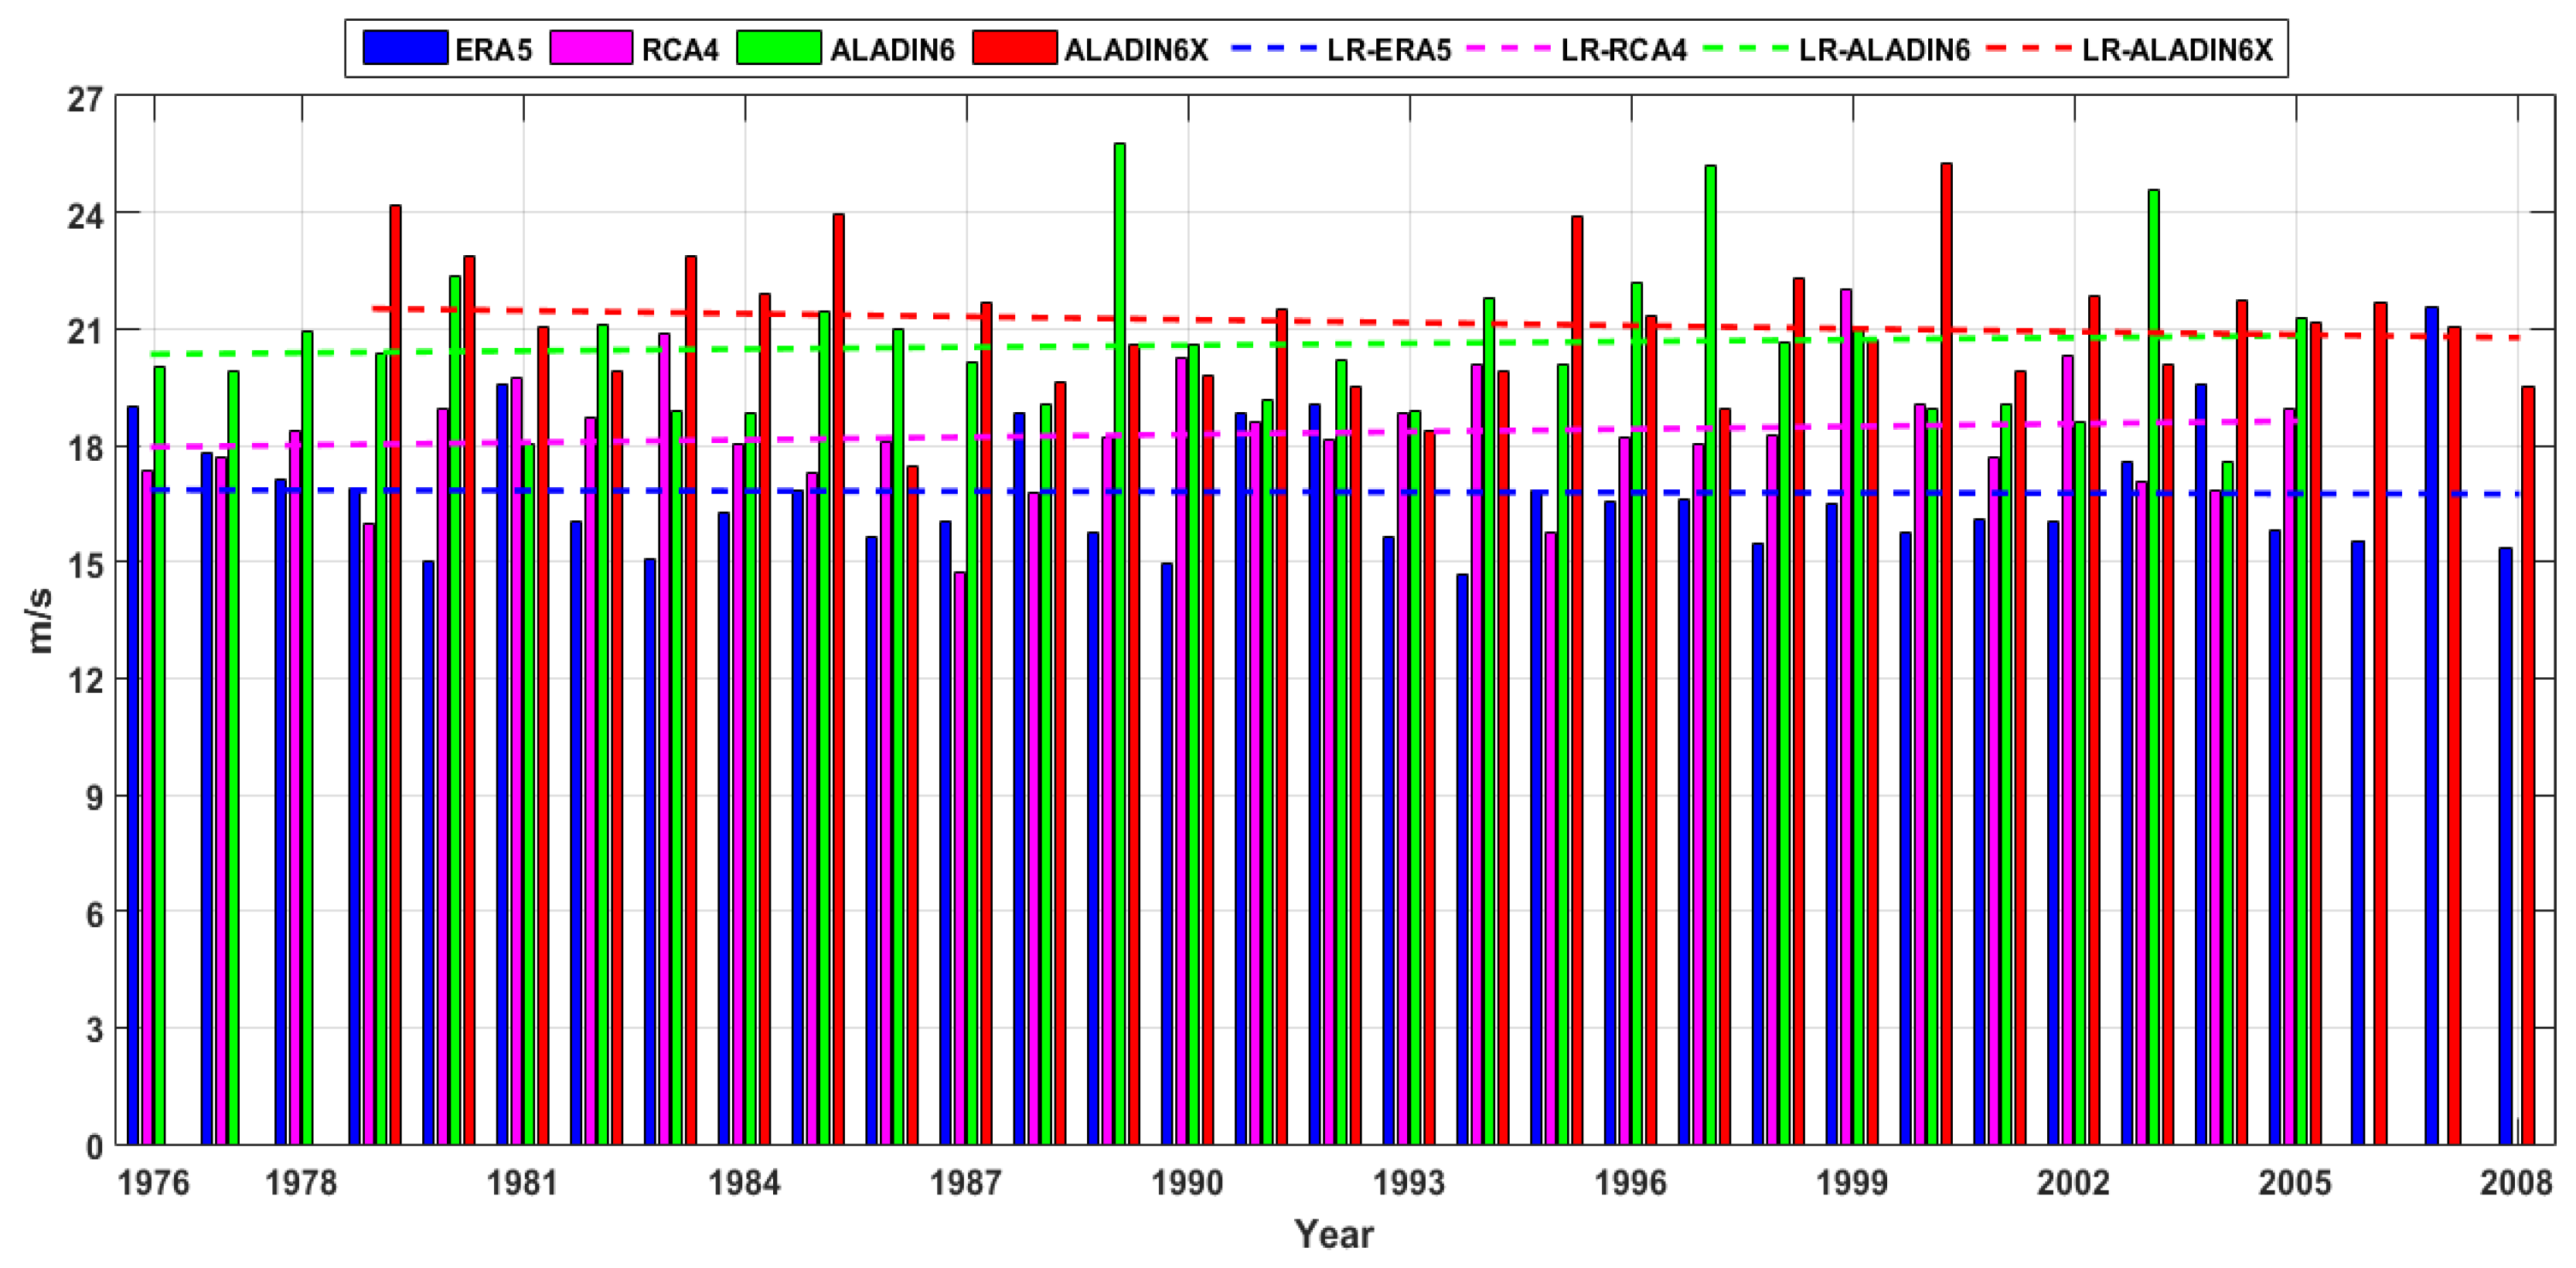
Wind speed (U10) annual maximum series and linear trends for the recent past period offshore Sulina (RP1). ERA5 (1976-2008), RCA4 and ALADIN6 (1976-2005), and ALADIN6x (1979-2008).
Figure 8.
Wind speed (U10) annual maximum series and linear trends for the recent past period offshore Sulina (RP1). ERA5 (1976-2008), RCA4 and ALADIN6 (1976-2005), and ALADIN6x (1979-2008).
Figure 9.
Wind speed (U10) annual maximum series and linear trends for the recent past period offshore Saint George (RP2). ERA5 (1976-2008), RCA4 and ALADIN6 (1976-2005), and ALADIN6x (1979-2008).
Figure 9.
Wind speed (U10) annual maximum series and linear trends for the recent past period offshore Saint George (RP2). ERA5 (1976-2008), RCA4 and ALADIN6 (1976-2005), and ALADIN6x (1979-2008).
Figure 10.
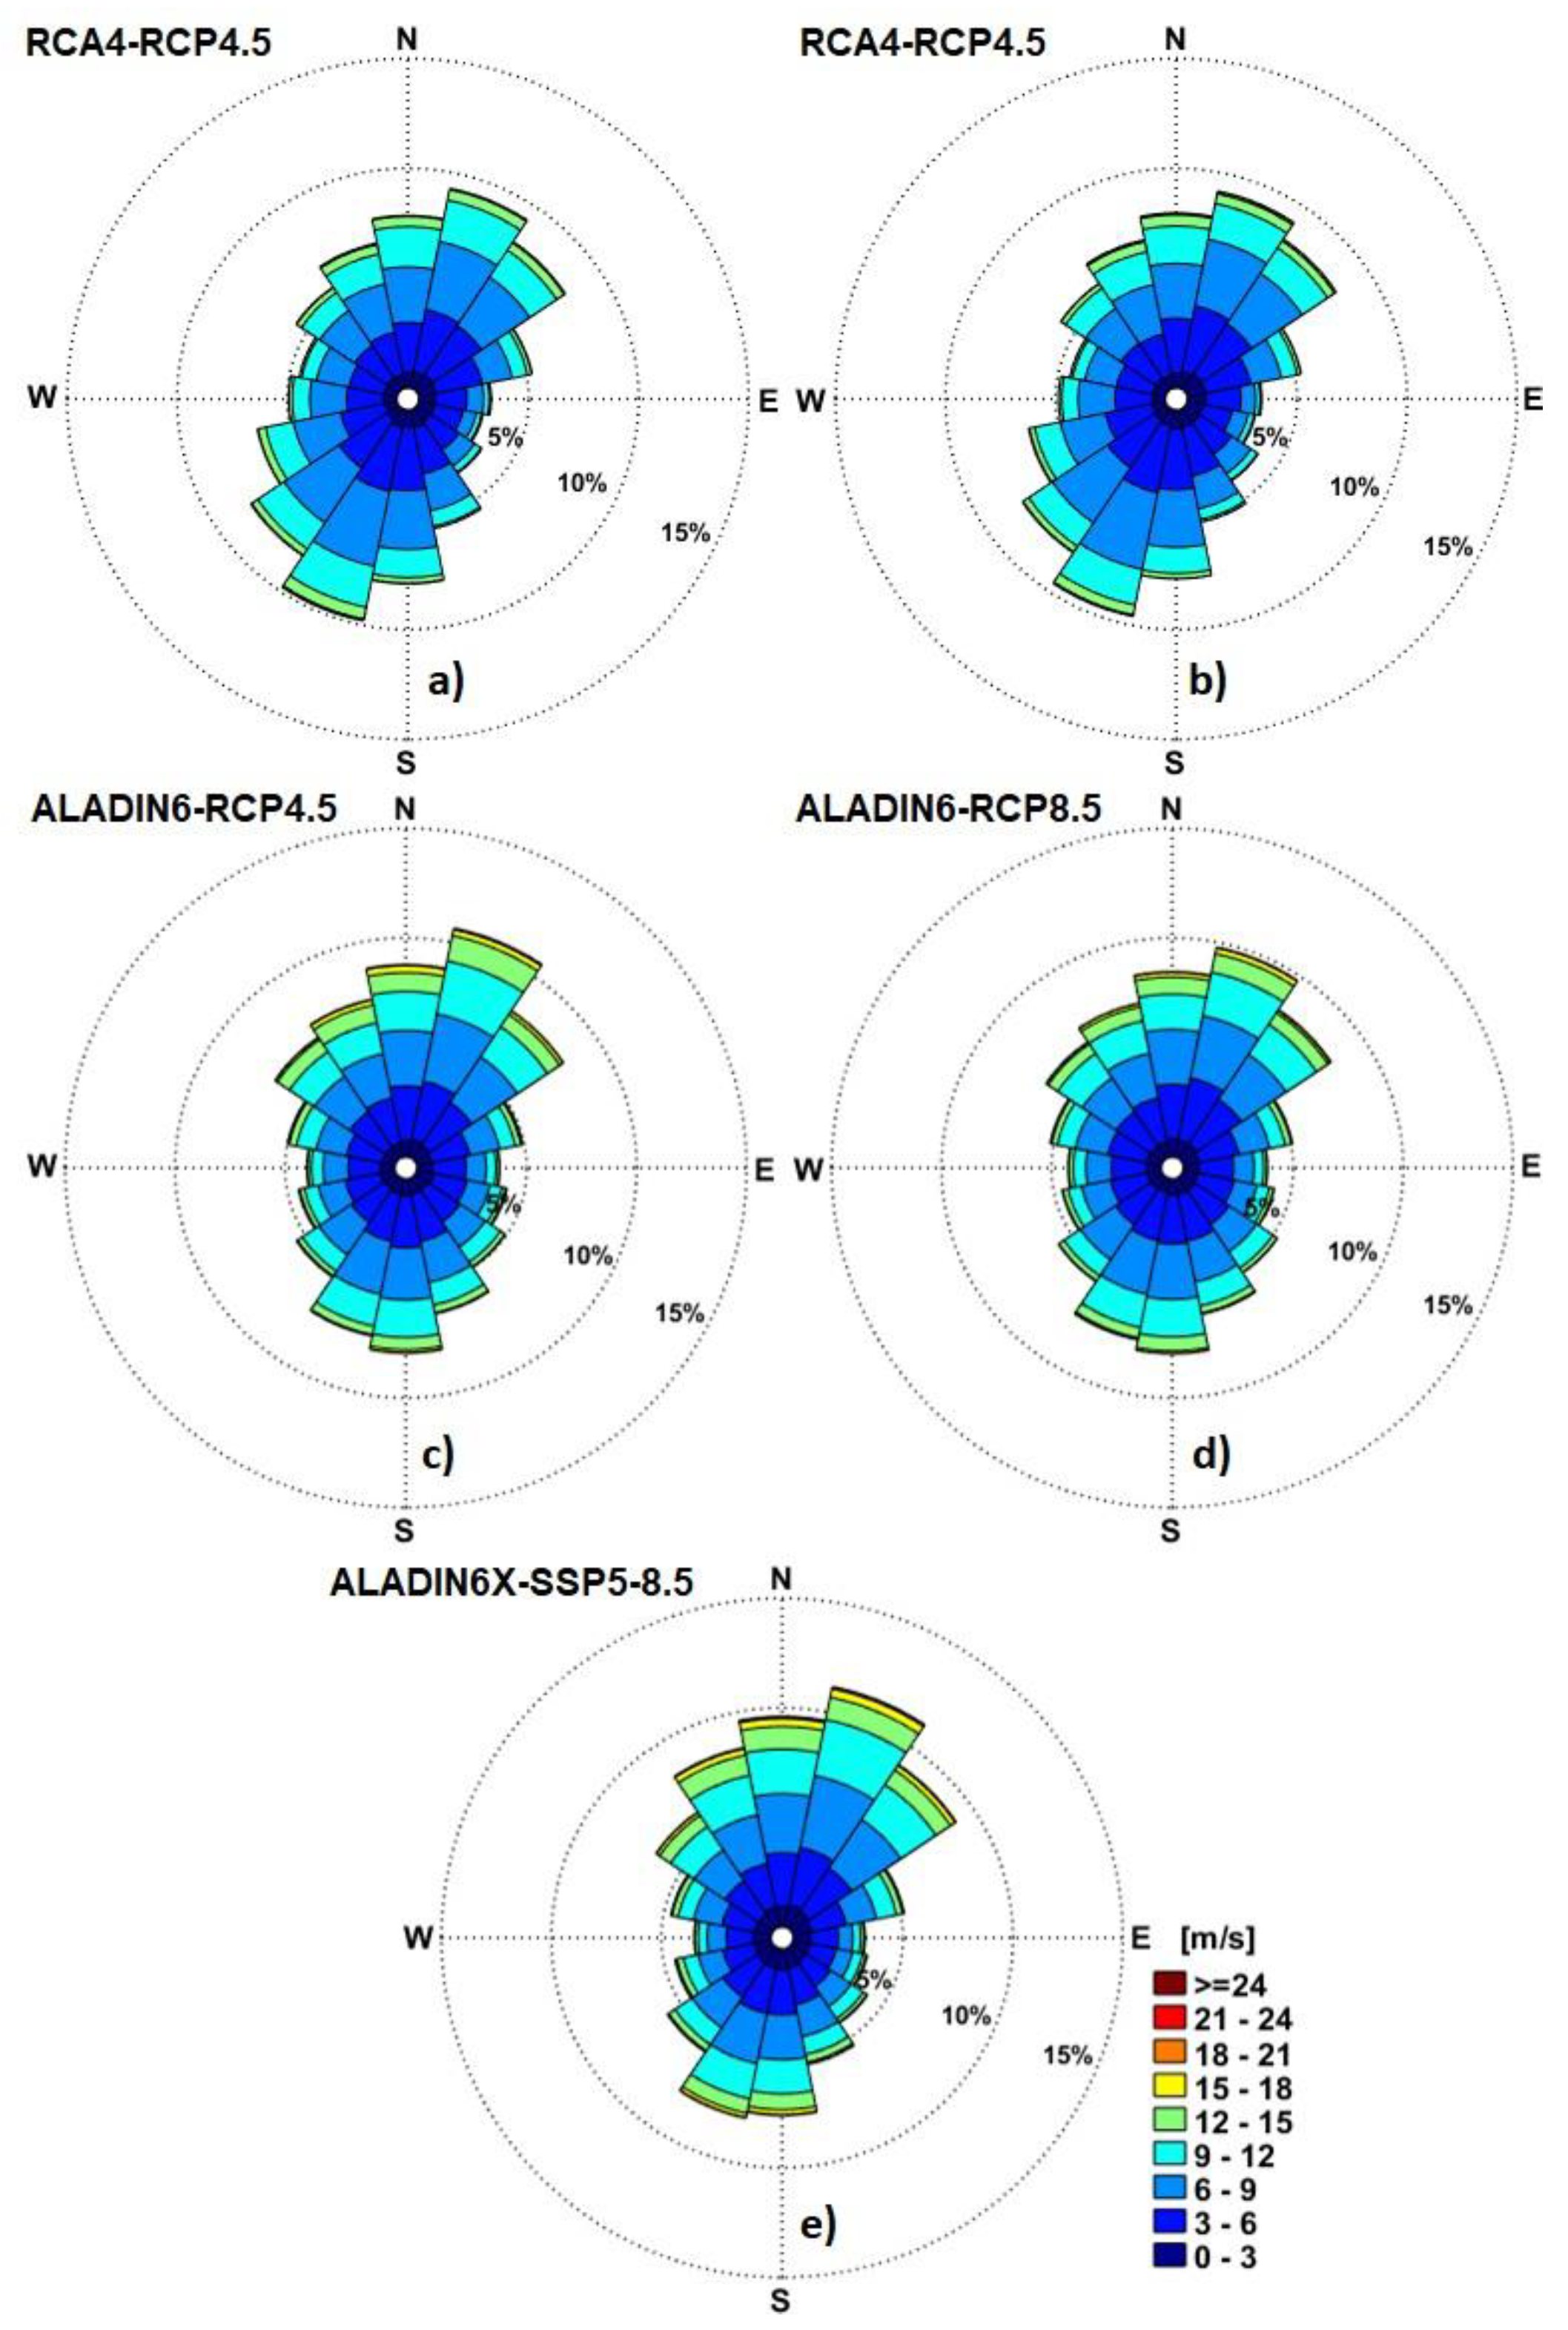
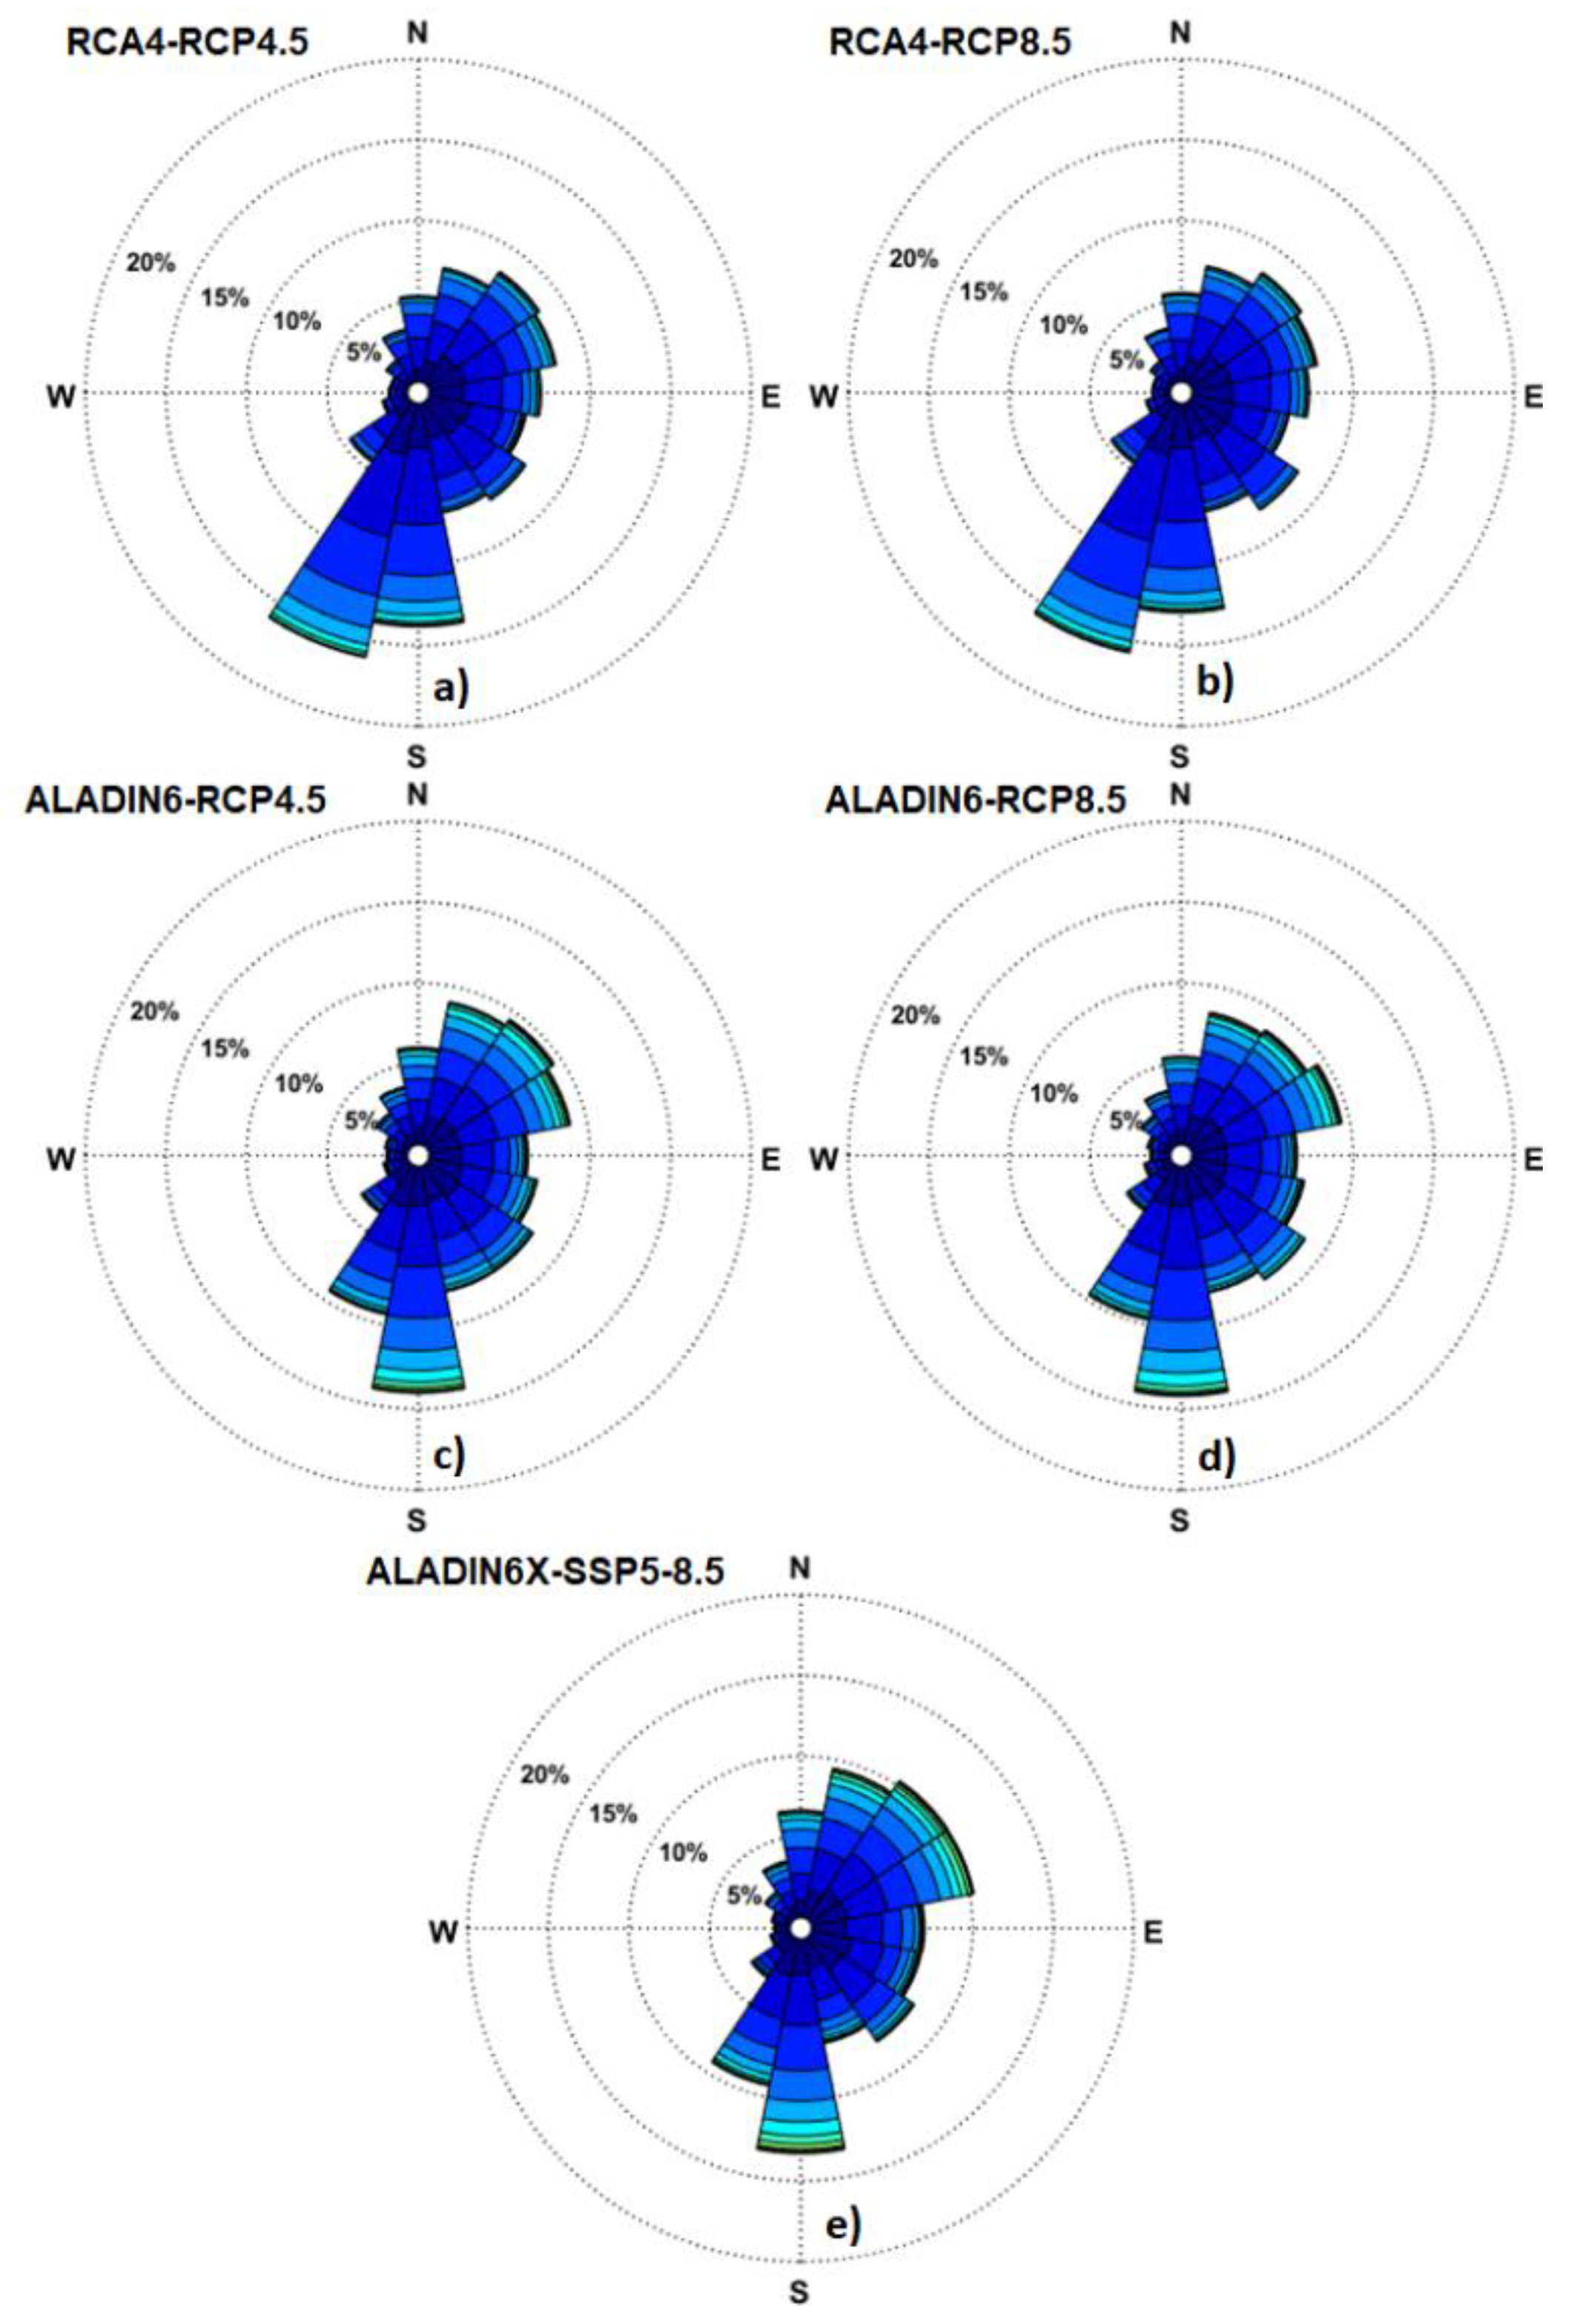
Wind roses offshore Sulina channel (RP1) for the near future period (2041-2070) based on analysis of the climate models data. a) RCA4-RCP4.5; b) RCA4-RCP8.5; c) ALADIN6-RCP4.5; ; d) ALADIN6-RCP8.5; e) ALADIN6x-SSP5-8.5.
Figure 10.
Wind roses offshore Sulina channel (RP1) for the near future period (2041-2070) based on analysis of the climate models data. a) RCA4-RCP4.5; b) RCA4-RCP8.5; c) ALADIN6-RCP4.5; ; d) ALADIN6-RCP8.5; e) ALADIN6x-SSP5-8.5.
Figure 11.
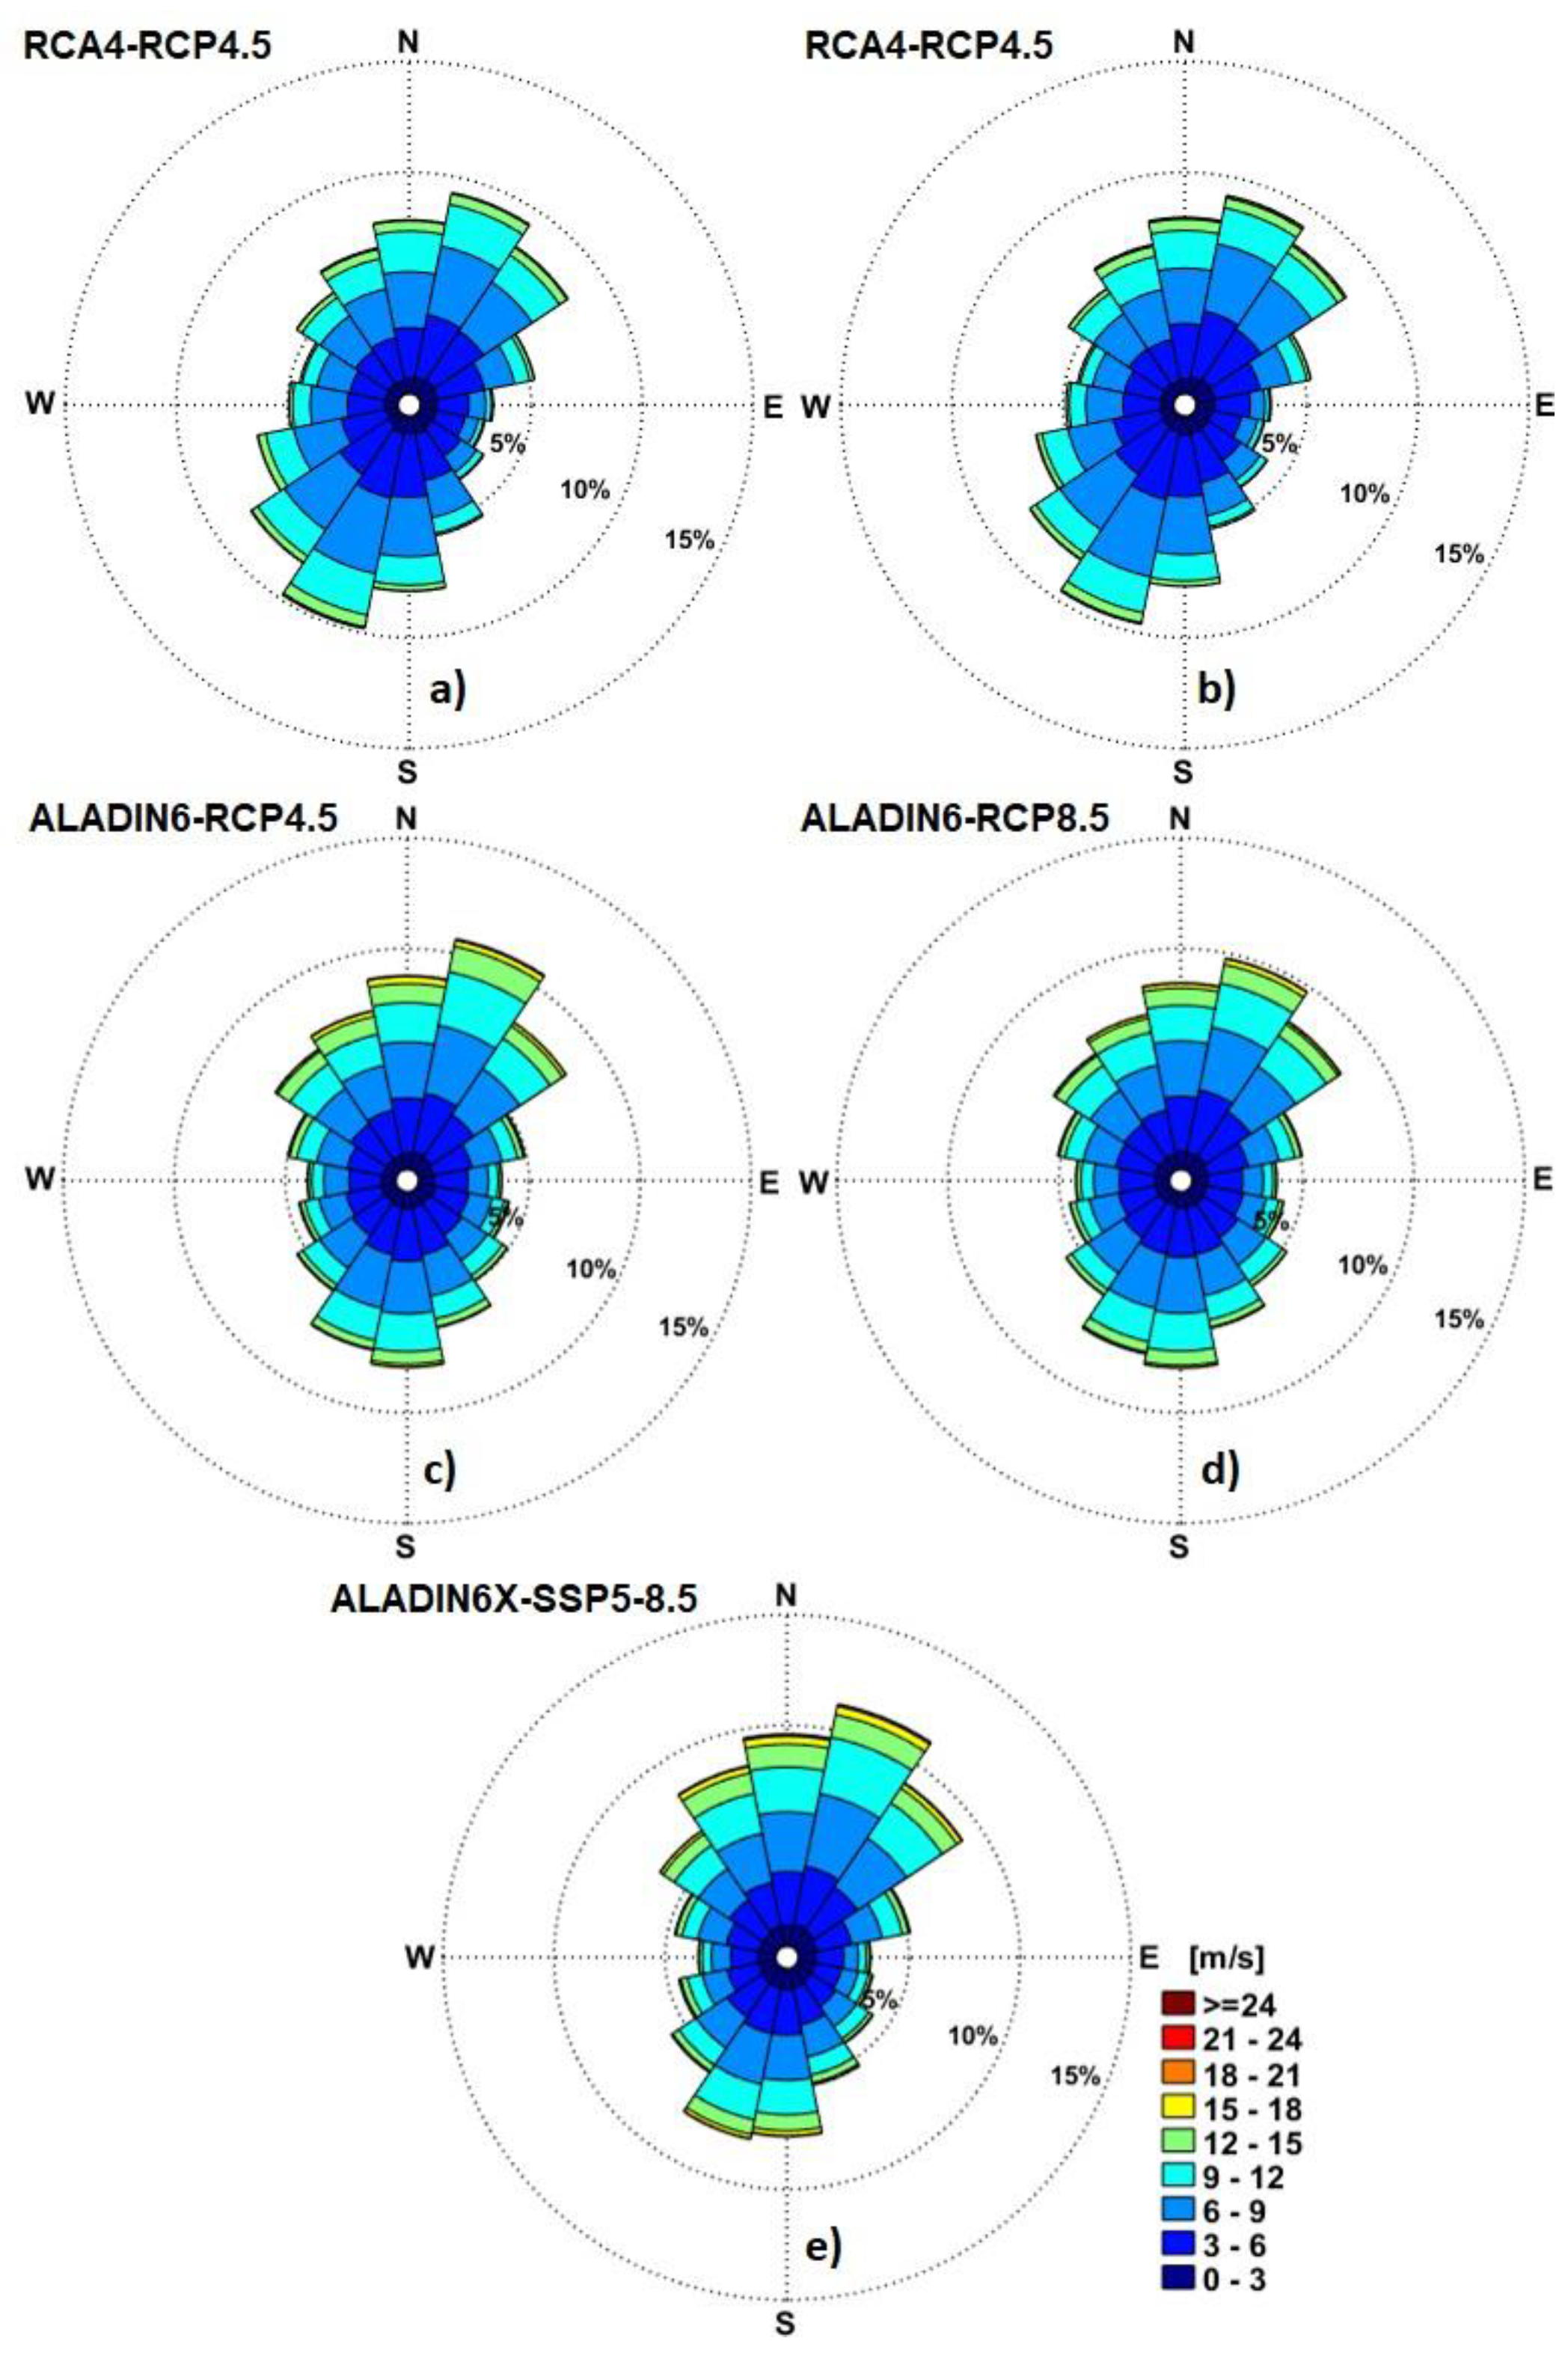
Wind roses offshore Saint George (RP2) for the near future period (2041-2070) based on analysis of the climate models data. a) RCA4-RCP4.5; b) RCA4-RCP8.5; c) ALADIN6-RCP4.5; d) ALADIN6-RCP8.5; e) ALADIN6x-SSP5-8.5.
Figure 11.
Wind roses offshore Saint George (RP2) for the near future period (2041-2070) based on analysis of the climate models data. a) RCA4-RCP4.5; b) RCA4-RCP8.5; c) ALADIN6-RCP4.5; d) ALADIN6-RCP8.5; e) ALADIN6x-SSP5-8.5.
Figure 12.
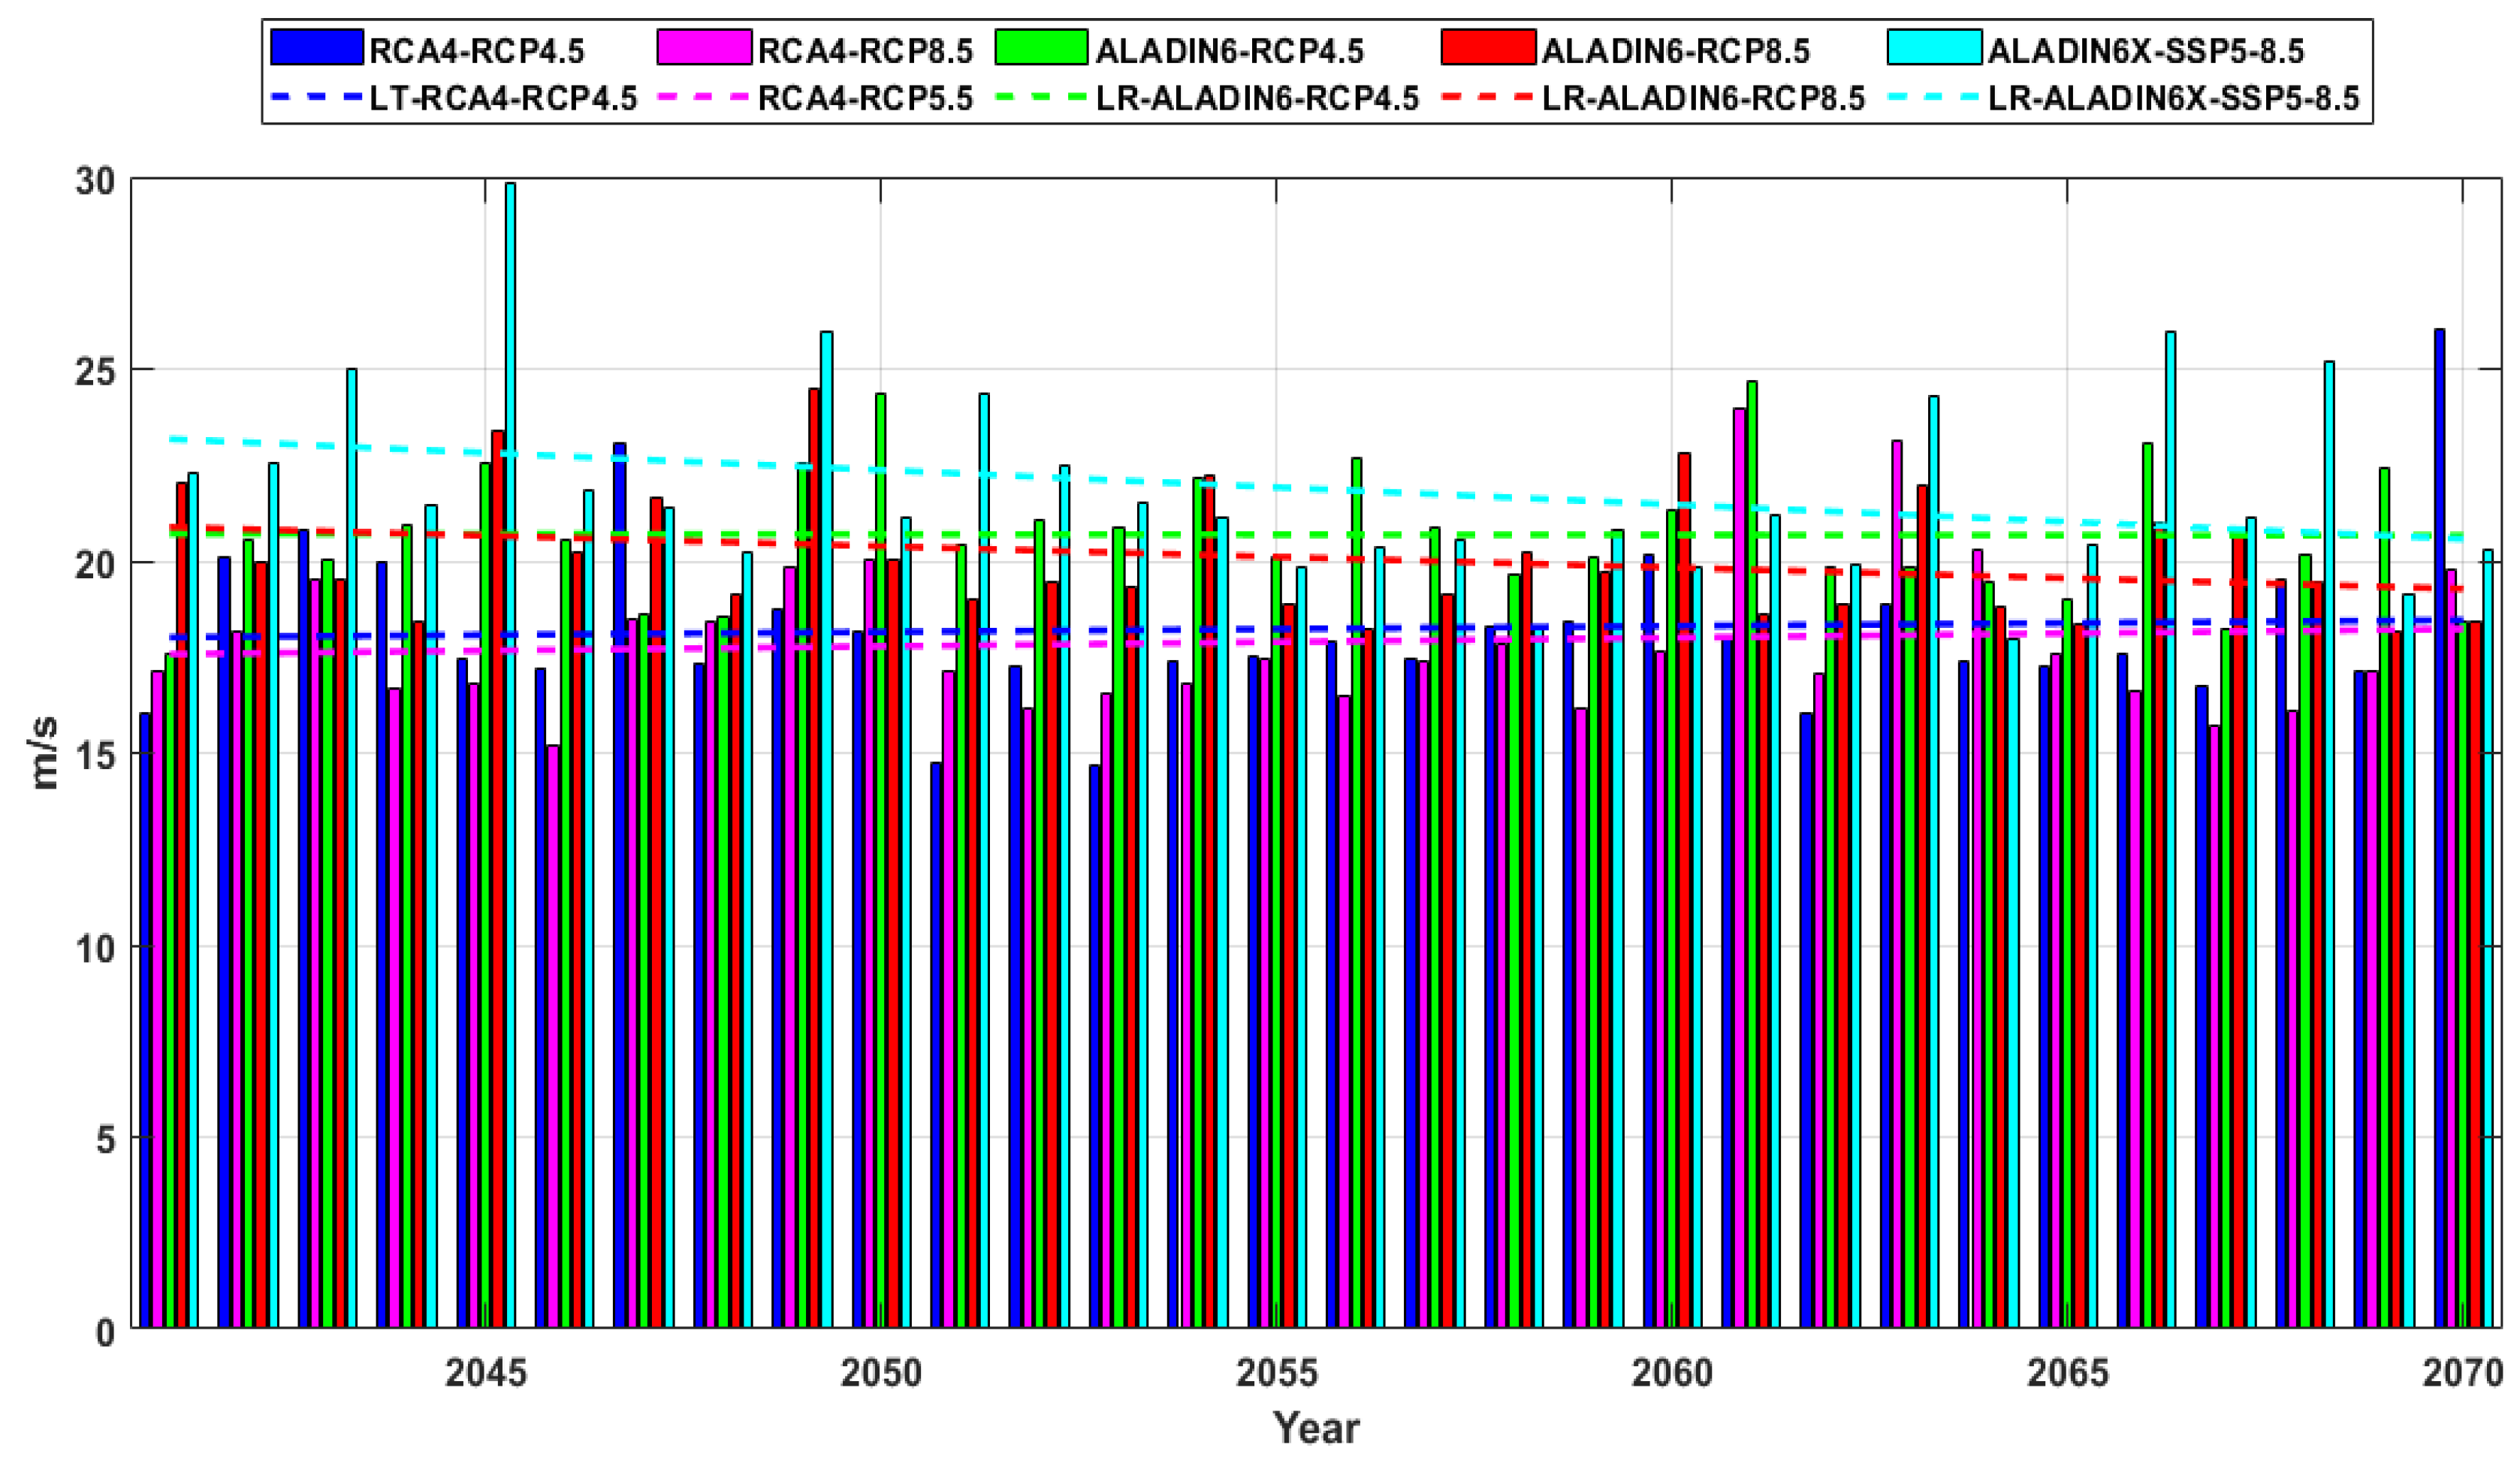
Wind speed (U10) annual maximum series and linear trends, projections for the near future period (2041-2070) offshore Sulina (RP1). RCA4 (RCP4.5 and RCP8.5), ALADIN6 (RCP4.5 and RCP8.5), and ALADIN6x SSP5-8.5.
Figure 12.
Wind speed (U10) annual maximum series and linear trends, projections for the near future period (2041-2070) offshore Sulina (RP1). RCA4 (RCP4.5 and RCP8.5), ALADIN6 (RCP4.5 and RCP8.5), and ALADIN6x SSP5-8.5.
Figure 13.
Wind speed (U10) annual maximum series and linear trends, projections for the near future period (2041-2070) offshore Saint George (RP2). RCA4 (RCP4.5 and RCP8.5), ALADIN6 (RCP4.5 and RCP8.5), and ALADIN6x SSP5-8.5.
Figure 13.
Wind speed (U10) annual maximum series and linear trends, projections for the near future period (2041-2070) offshore Saint George (RP2). RCA4 (RCP4.5 and RCP8.5), ALADIN6 (RCP4.5 and RCP8.5), and ALADIN6x SSP5-8.5.
Figure 14.
Typical storm in the Black Sea, significant wave height fields and wave vectors. SWAN model simulation corresponding to the time frame 21.12.2004h03. a) Black Sea basin; b) Coastal environment at the mouths of the Danube River.
Figure 14.
Typical storm in the Black Sea, significant wave height fields and wave vectors. SWAN model simulation corresponding to the time frame 21.12.2004h03. a) Black Sea basin; b) Coastal environment at the mouths of the Danube River.
Figure 15.
Hs wave roses offshore Sulina channel (RP1) for the recent past period, based on the analysis of the results provided by the wave modeling system forced with reanalysis and climate models data. The forcing wind fields considered are: a) ERA5 (1976-2008); b) RCA4, for RCP scenarios (1976-2005); c) ALADIN6, for RCP scenarios (1976-2005); d) ALADIN6x, for SSP scenario (1979-2008).
Figure 16.
Hs wave roses offshore Saint George arm of the Danube (RP2) for the recent past period, based on the analysis of the results provided by the wave modeling system forced with reanalysis and climate models data. The forcing wind fields considered are: a) ERA5 (1976-2008); b) RCA4, for RCP scenarios (1976-2005); c) ALADIN6, for RCP scenarios (1976-2005); d) ALADIN6x, for SSP scenario (1979-2008).
Figure 17.
Hs annual maximum series and linear trends for the recent past period offshore Sulina (RP1). Results of wave model simulations forced with the following wind fields: ERA5 (1976-2008), RCA4 and ALADIN6 (1976-2005), and ALADIN6x (1979-2008).
Figure 17.
Hs annual maximum series and linear trends for the recent past period offshore Sulina (RP1). Results of wave model simulations forced with the following wind fields: ERA5 (1976-2008), RCA4 and ALADIN6 (1976-2005), and ALADIN6x (1979-2008).
Figure 18.
Hs annual maximum series and linear trends for the recent past period offshore Saint George (RP2). Results of wave model simulations forced with the following wind fields: ERA5 (1976-2008), RCA4 and ALADIN6 (1976-2005), and ALADIN6x (1979-2008).
Figure 18.
Hs annual maximum series and linear trends for the recent past period offshore Saint George (RP2). Results of wave model simulations forced with the following wind fields: ERA5 (1976-2008), RCA4 and ALADIN6 (1976-2005), and ALADIN6x (1979-2008).
Figure 19.
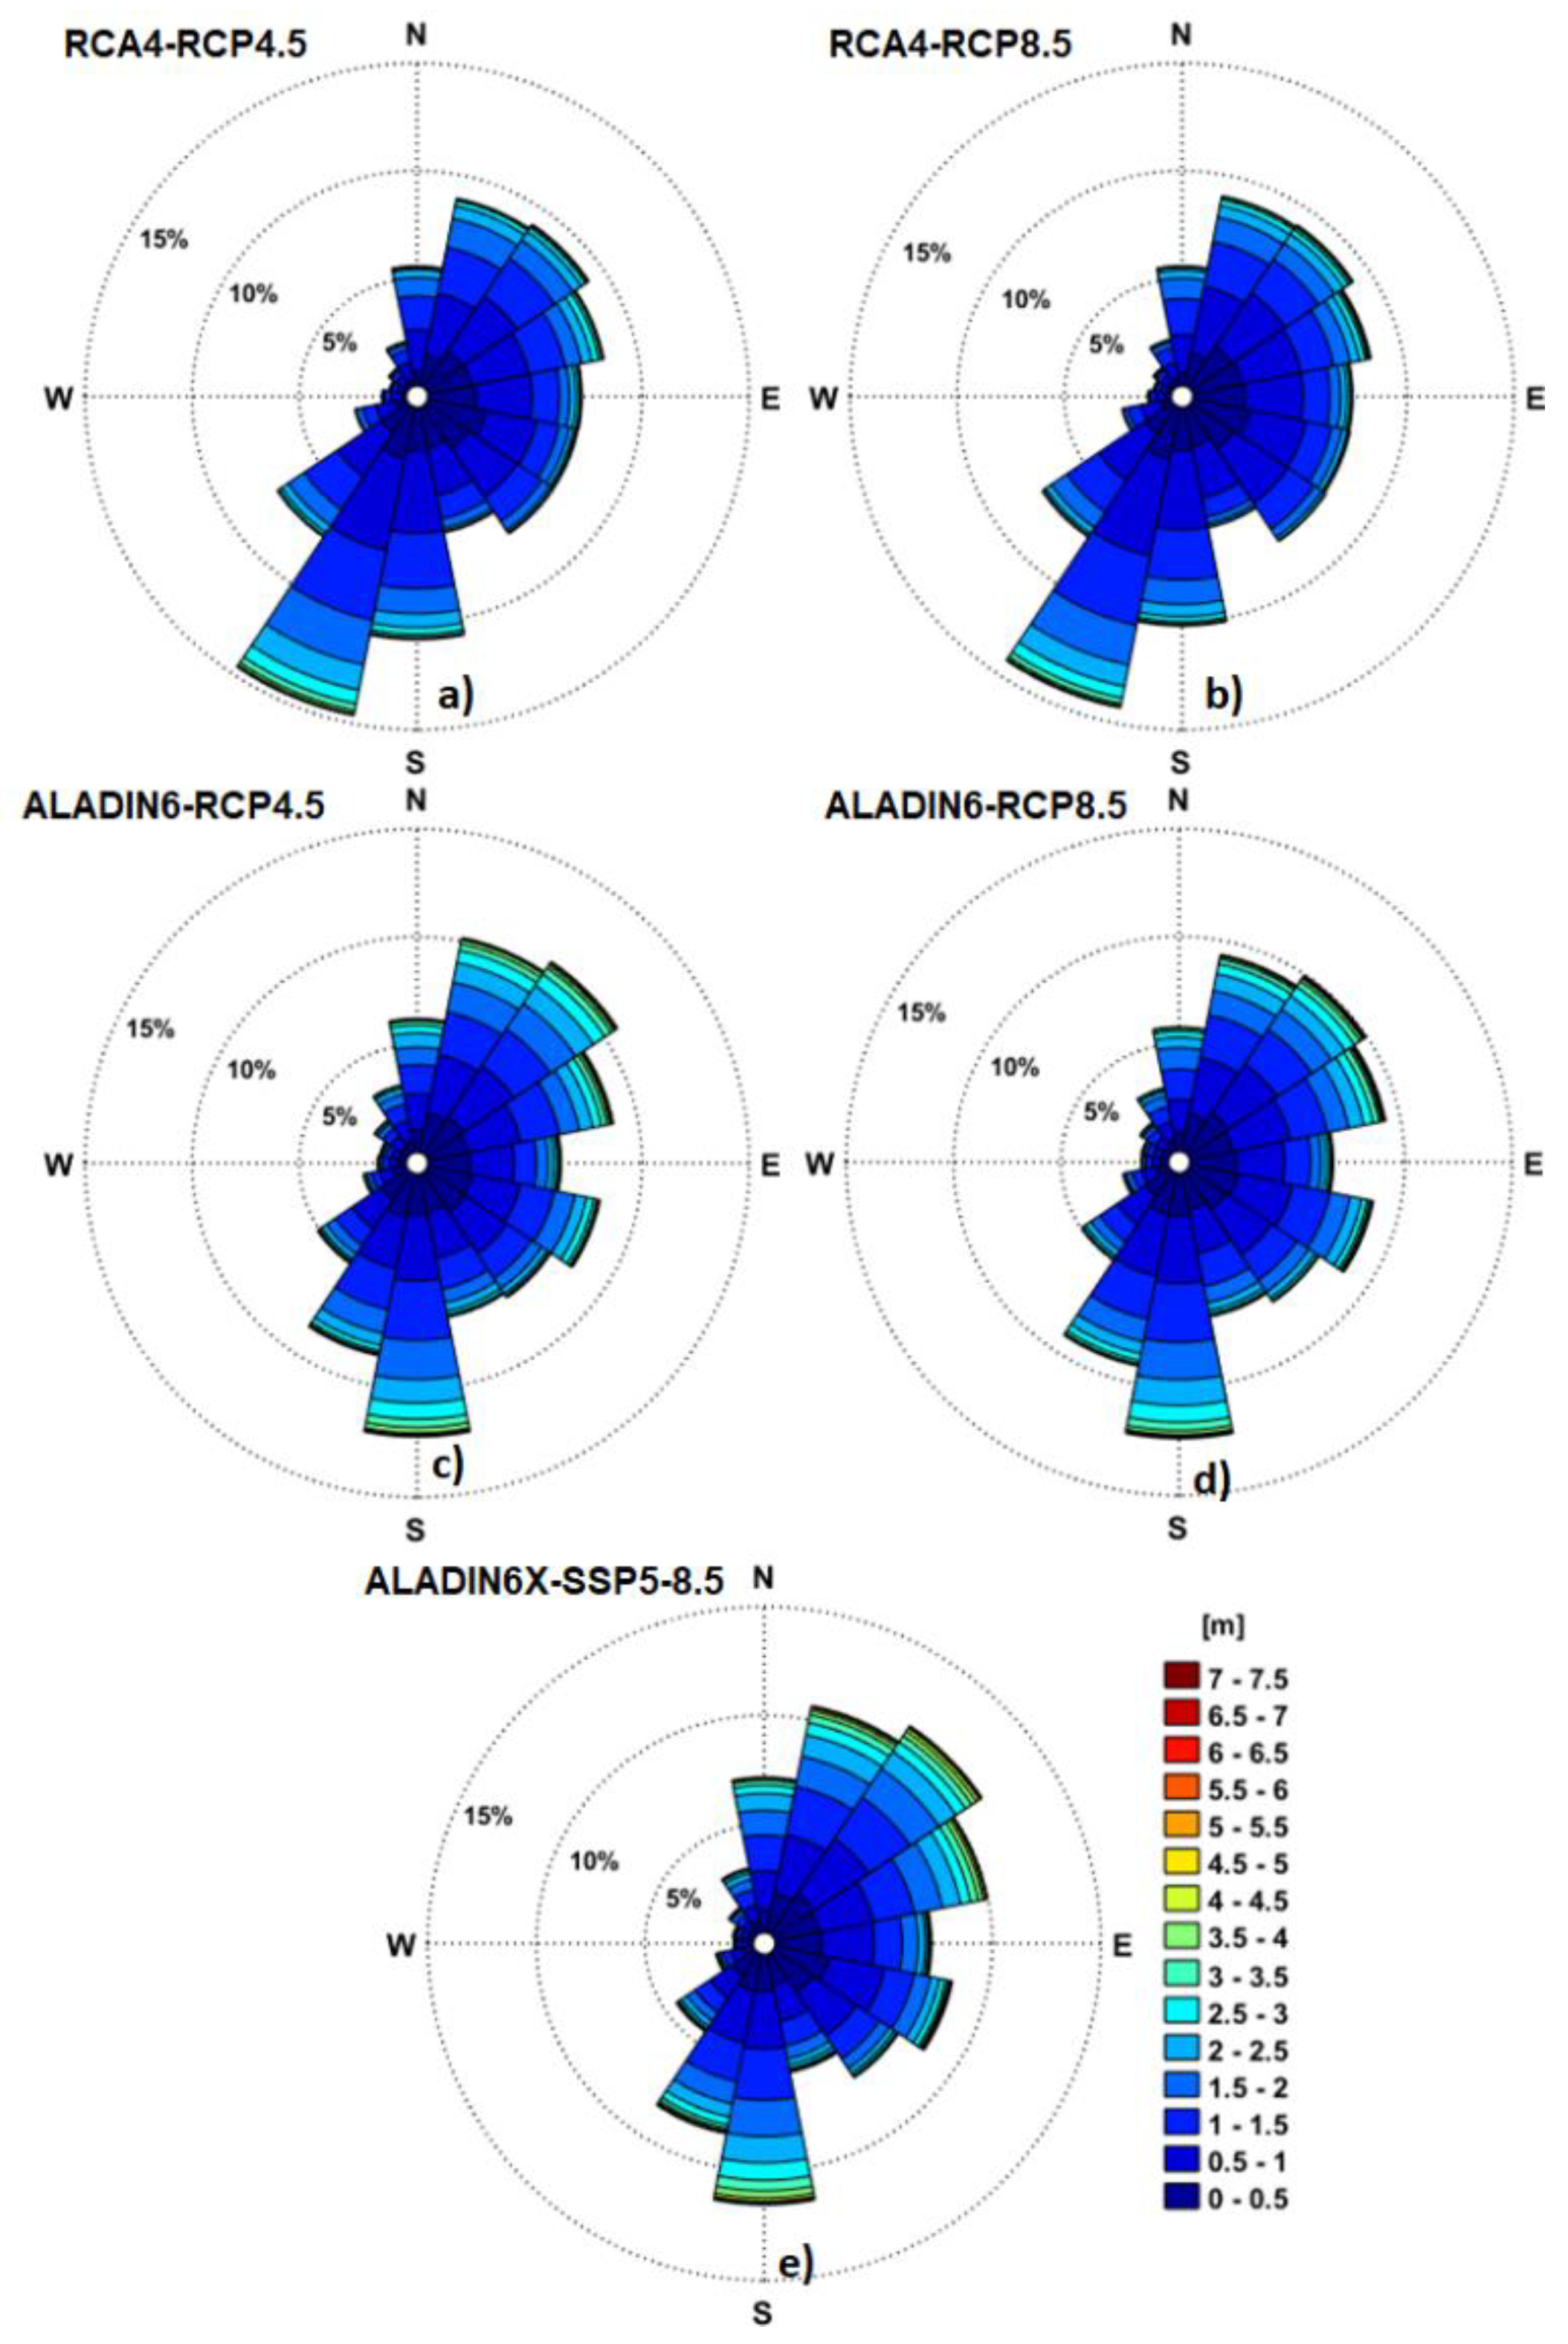
Hs wave roses offshore Sulina channel (RP1) for the near future period (2041-2070) based on the analysis of the results provided by the wave modeling system forced with climate model data. The forcing wind fields considered are: a) RCA4-RCP4.5; b) RCA4-RCP8.5; c) ALADIN6-RCP4.5; d) ALADIN6-RCP8.5; e) ALADIN6x-SSP5-8.5.
Figure 20.
Hs wave roses offshore Saint George arm of the Danube (RP2) for the near future period (2041-2070) based on the analysis of the results provided by the wave modeling system forced with climate model data. The forcing wind fields considered are: a) RCA4-RCP4.5; b) RCA4-RCP8.5; c) ALADIN6-RCP4.5; d) ALADIN6-RCP8.5; e) ALADIN6x-SSP5-8.5.
Figure 21.
Hs annual maximum series and linear trends, projections for the near future period (2041-2070) offshore Sulina (RP1). Results of wave model simulations forced with the following wind fields: RCA4 (RCP4.5 and RCP8.5), ALADIN6 (RCP4.5 and RCP8.5), and ALADIN6x SSP5-8.5.
Figure 21.
Hs annual maximum series and linear trends, projections for the near future period (2041-2070) offshore Sulina (RP1). Results of wave model simulations forced with the following wind fields: RCA4 (RCP4.5 and RCP8.5), ALADIN6 (RCP4.5 and RCP8.5), and ALADIN6x SSP5-8.5.
Figure 22.
Hs annual maximum series and linear trends, projections for the near future period (2041-2070) offshore Saint George (RP2). Results of wave model simulations forced with the following wind fields: RCA4 (RCP4.5 and RCP8.5), ALADIN6 (RCP4.5 and RCP8.5), and ALADIN6x SSP5-8.5.
Figure 22.
Hs annual maximum series and linear trends, projections for the near future period (2041-2070) offshore Saint George (RP2). Results of wave model simulations forced with the following wind fields: RCA4 (RCP4.5 and RCP8.5), ALADIN6 (RCP4.5 and RCP8.5), and ALADIN6x SSP5-8.5.
Figure 23.
Swan simulations in the high resolution computational domain focused on the entrance in Sulina channel; a) Bathymetric map of the computational domain and current field; b) Significant wave height scalar fields and wave vectors considering offshore wave conditions Hs=3.5 and mean wave direction 90 degrees; c) Significant wave height scalar fields and wave vectors considering offshore wave conditions Hs=3.5m and mean wave direction 120 degrees.
Table 1.
Characteristics of the computational domains defined for the SWAN model simulations focused on the coastal area at the mouths of the Danube in the Black Sea.
Table 1.
Characteristics of the computational domains defined for the SWAN model simulations focused on the coastal area at the mouths of the Danube in the Black Sea.
| Spherical domains |
Δλ × Δφ |
Δt (min) |
nf |
nθ |
ngλ × ngφ = np |
| Sph1- Black Sea |
0.08°× 0.08° |
10 non-stat |
24 |
36 |
176x76=13376 |
| Sph2- Danube mouths |
0.01°×0.01° |
10 non-stat |
24 |
36 |
71x61=4331 |
| Cartesian Domain |
Δx × Δy (m) |
Δt (min) |
nf |
nθ |
ngx × ngy = np |
| Cart- Sulina |
50 × 50 |
60 stat |
30 |
36 |
135x216=29160 |
Table 2.
Physical processes activated in the SWAN simulations, corresponding to the eight computational domains defined. X – process activated, 0 – process inactivated.
Table 2.
Physical processes activated in the SWAN simulations, corresponding to the eight computational domains defined. X – process activated, 0 – process inactivated.
| Input/ Process |
Wave |
Wind |
Tide |
Curr |
Gen |
Wcap |
Quad |
Triad |
Diffr |
Bfric |
Set up |
Br |
| Domains |
|---|
| Sph1 |
0 |
X |
0 |
0 |
X |
X |
X |
0 |
0 |
X |
0 |
X |
| Sph2 |
X |
X |
0 |
X |
X |
X |
X |
X |
0 |
X |
0 |
X |
| Cart |
X |
X |
0 |
X |
X |
X |
X |
X |
X |
X |
X |
X |
Table 3.
Maximum values for the wind speed (Uw) and wind gust (Uwg) corresponding to each month for the 15-year period 2009-2023.
Table 3.
Maximum values for the wind speed (Uw) and wind gust (Uwg) corresponding to each month for the 15-year period 2009-2023.
| Month |
Jan |
Feb |
Mar |
Apr |
May |
Jun |
Jul |
Aug |
Sept |
Oct |
Nov |
Dec |
|
Uw (m/s) |
30.6 |
24.1 |
17.2 |
21.0 |
16.9 |
16.7 |
20.7 |
17.6 |
18.3 |
18.4 |
18.2 |
21.4 |
|
Uwg (m/s) |
39.4 |
32.0 |
22.4 |
27.3 |
21.2 |
24.0 |
23.9 |
23.0 |
23.3 |
25.6 |
24.2 |
30.0 |
| Uwg/ Uw |
1.29 |
1.33 |
1.30 |
1.30 |
1.25 |
1.44 |
1.16 |
1.31 |
1.27 |
1.39 |
1.33 |
1.40 |
Table 4.
Results of the SWAN model simulations in the presence of currents considering various significant wave heights and mean wave directions incoming on the external boundary of the computational domain.
Table 4.
Results of the SWAN model simulations in the presence of currents considering various significant wave heights and mean wave directions incoming on the external boundary of the computational domain.
| Hso (m) |
Wdir (°) |
| 30 |
60 |
90 |
120 |
150 |
| REHs(%) |
BFI |
REHs(%) |
BFI |
REHs(%) |
BFI |
REHs(%) |
BFI |
REHs(%) |
BFI |
| 1 |
23 |
0.7 |
30 |
0.8 |
38 |
0.9 |
42 |
0.94 |
38 |
0.85 |
| 2 |
17.5 |
1.2 |
25 |
1.5 |
36.5 |
1.75 |
38.5 |
1.4 |
27.5 |
1.3 |
| 3 |
11 |
1.2 |
18.6 |
1.6 |
32.5 |
1.9 |
35 |
1.7 |
20.7 |
1.4 |
| 4 |
8.25 |
1.1 |
15 |
1.5 |
30 |
1.8 |
31.75 |
1.6 |
17.75 |
1.4 |
| 5 |
6 |
0.9 |
12.8 |
1.4 |
23.4 |
1.7 |
24.2 |
1.5 |
13.6 |
1.3 |
