1. Introduction
Natural gas, as a high-quality, efficient, green and clean low-carbon energy source, holds a significant position in the global energy consumption structure. The Yinggehai region in the South China Sea harbors abundant natural gas resources characterized by high temperature and pressure conditions, with temperatures reaching up to 216℃ and pressures peaking at 93MPa. However, these extreme temperature and pressure systems pose challenges for the development of such reservoirs. They not only demand more stringent technical requirements during the development process but also open up new avenues of research into fluid physical properties. For instance, high-temperature and high-pressure formation fluids exhibit large deviation coefficients (Z > 2.0), surpassing typical industry charts (Z≤1.7) commonly used for evaluation of gas reservoir reserves and engineering calculations [
1]. Moreover, these fluids often display near-critical characteristics due to condensate gas properties such as low gas-liquid interfacial tension [
2]. Extensive studies have been conducted by both domestic and foreign scholars on this subject matter [
3]. Building upon Buckley-Leverett's displacement front hypothesis for water-driven oil or water-driven gas flow proposed in 1951 [
4], Rapoport and Leas introduced the concept of unsteady relative permeability testing method followed by further investigations carried out by Potter [
5]. Additionally, preliminarily examined how water saturation influences the relative permeability coefficient of gas phase when two-phase flow occurs along cracks; specifically observing that an increase in water saturation leads to a decrease in gas relative permeability [
6]. The gas-water relative permeability of coal cores using the unsteady state method to measure and establish the phase permeability curvey [
7]. A method measured fractal flow experimental data related to gas relative permeability and water relative permeability during gas-water two-phase seepage [
8]. Although the experimental principle for obtaining gas-water relative permeability has been relatively clear, there is still a lack of research on high temperature (>100℃) and high pressure (>40MPa) conditions, resulting in an unclear understanding of the relative seepage law.
To address these issues, we independently developed a set of equipment capable of achieving high temperature (up to 250℃) and high pressure (up to 120MPa), accurately separating and measuring effluent and gas volume, thereby establishing an experimental method for determining gas-water phase permeability. By conducting fluid phase experiments and gas-water two-phase seepage experiments on Wells A and B cores in Yinggehai Basin, we deeply analyze the laws governing gas-water relative permeability as well as the influence of temperature, pressure, and gases on infiltration. This analysis provides a scientific theoretical basis and technical support for large-scale development of natural gas fields.
2. Materials and Methods
2.1. Experiment
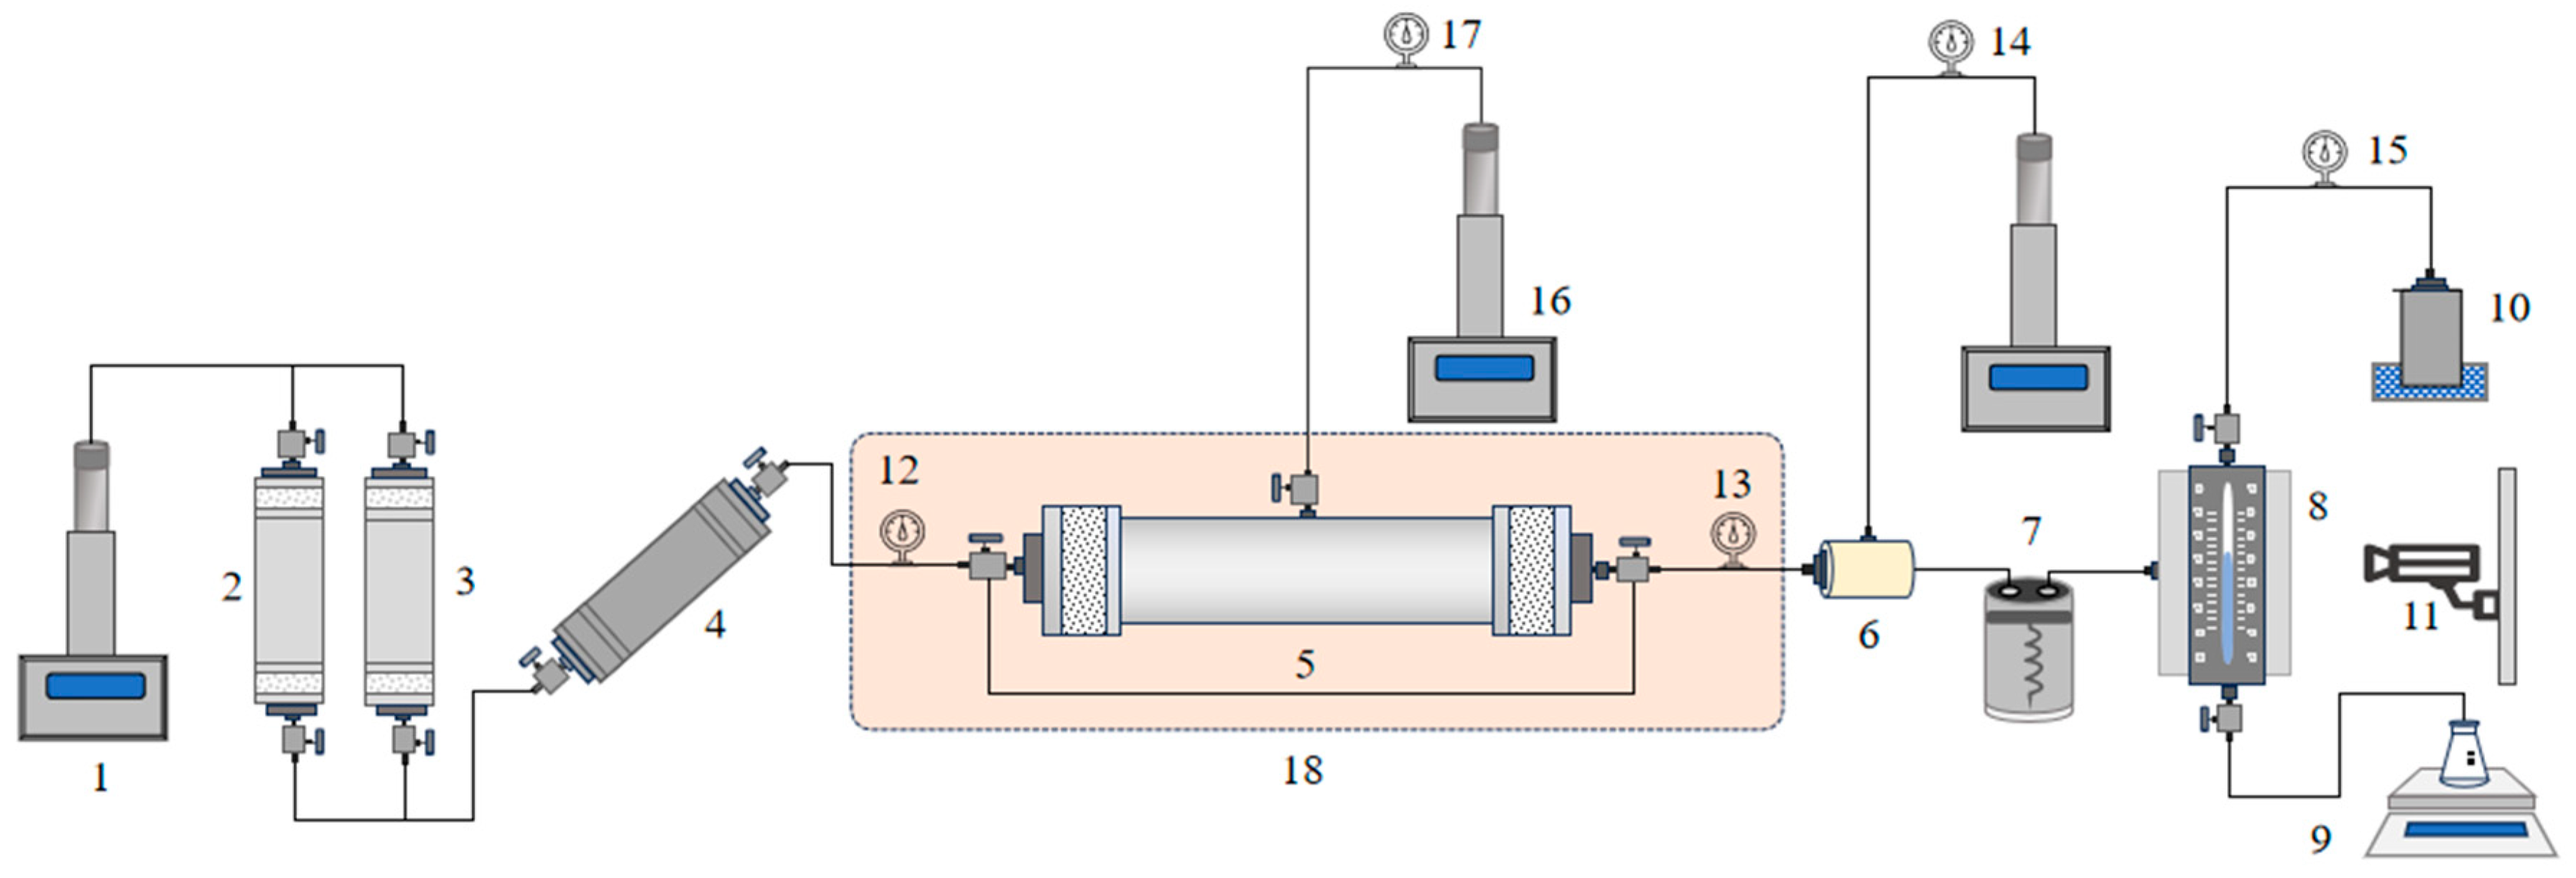
The conventional experimental device for measuring gas-water relative permeability under high temperature and high pressure conditions faces challenges in achieving the required temperature and pressure levels, while also being susceptible to inaccuracies in water measurement and fluctuations in back pressure valve pressures. Additionally, the small pore volume of flowing cores in high temperature and high pressure gas reservoirs leads to a significant decrease in gas production shortly after encountering water saturation, resulting in rapid increases in water content. To address these issues, an independently designed relative permeability measurement device has been developed that enables accurate separation and quantification of effluent and gas volumes under high temperature and high pressure conditions.
The device comprises a high-temperature and high-pressure core gripper, thermostat, electric displacement pump, back pressure pump, gas-water separation metering device, gas booster pump and console. The high-temperature and high-pressure core holder can withstand temperatures up to 250℃ and pressures up to 120MPa. The thermostat can be heated stably up to 280℃.
The gas-water separation metering device enables full and rapid separation of gas and water while achieving real-time measurement with visualization capillary method and image recognition-based gas-liquid interface method with an accuracy of up to 0.05mL that meets the requirements for high temperature and pressure experiments.
Figure 1 illustrates the experimental flow for measuring relative permeability of gas-water under high temperature and pressure conditions.
2.2. Samples
(1) Core
The core used in the experiment is the real core taken from the target interval of the gas reservoir of well A and well B. The core with relatively little damage is selected for numbering and trimming. Its basic parameters are shown in
Table 1. The core permeability of well A gas reservoir is about 6×10
-3μm
2, and that of well B gas reservoir is about 2.5× 10
-3μm
2, both of which belong to low permeability cores.
(2) Simulated gas
The natural gas composition of Well B reservoir is mainly methane, the molar content is 88.6%, and the composition also contains a small amount of CO2 and N2. According to this composition, simulated gas is configured to carry out core displacement experiments.
(3) Simulating formation water
The original data showed that the formation water salinity was 36,491 mg/L.
2.3. Experimental Scheme
For the confirmed core and formation water, the main factors affecting gas-water relative permeability are pressure, temperature, gas types and so on. Aiming at these influencing factors, a series of experiments are designed, and the experimental scheme is shown in
Table 2.
2.4. Core Saturation
After measuring the gas permeability (Kg), gas porosity (Φ), length (L), and diameter (D) of the core, it shall be dried at 116℃ for a minimum duration of 4 hours. Subsequently, the dried core should be removed and placed in a dryer for cooling purposes. Following cooling, the weight (m1) of the dried core must be measured using an electronic balance. Upon weighing, both the core and saturated water should undergo separate vacuuming processes at a vacuum degree of 0.1MPa for no less than 4 hours. The vacuumed saturated water is then introduced into the rock chamber for further vacuuming lasting 1 hour. Once this process is completed, the vacuum device can be closed while simultaneously opening the valve connected to atmospheric pressure within the rock chamber; allowing it to stand undisturbed for a period of 12 hours. The saturated core should then be carefully extracted, any surface float water removed through drying, and its weight (m2) determined to calculate liquid porosity Φ1. If there exists a relative error between liquid porosity Φ1 and gas porosity Φ that is less than 2%, saturation is considered complete; otherwise, pressure saturation will proceed under conditions ensuring no damage to the core by applying pressures ranging from 5-20MPa with saturation lasting over 12 hours. Finally, recalculation of fluid measurement porosity Φ1 shall take place.
2.5. Simulation of Formation Temperature and Pressure Environment
The core is placed in the core holder, while the formation water is introduced into the intermediate container for subsequent use in pressurizing the experimental gas. Following the connection of the experimental process, a return pressure valve is pressurized to 5MPa, and then the core is driven using formation water until water starts flowing out from the outlet. Subsequently, an additional increase of 2MPa in return pressure, displacement pressure, and back pressure occurs simultaneously. This boost ensures that both confining pressure and displacement pressure are maintained at a stress difference of approximately 5-8MPa. Once internal pressure reaches formation pressure, further elevation of internal pressure ceases; only confining pressure above overlying formation pressures continues to rise. Finally, heating to formation temperature through thermostat control takes place.
2.6. Measure Water-Phase Permeability
Water-phase permeability serves as a fundamental value for determining water-gas relative permeability. By setting constant-pressure (flow rate) displacement conditions and ensuring stable pressures and flows, inlet/outlet pressures along with flow rates are recorded accordingly.
Darcy's formula (1) was employed to calculate water phase permeability which was measured three times consecutively with relative deviations less than 3% in order to complete accurate measurement.
where
K is the water phase permeability under formation conditions, mD.
Q is the flow rate through the core under formation conditions, ml/s.
µw is the viscosity of water under formation conditions, mPa·s.
L is the core length, cm.
A is the core cross-sectional area, cm
2.
△P is the pressure difference between the inlet and outlet of the core, MPa.
2.7. Gas-Alternating-Water
To determine the relative permeability curve of high temperature and high pressure gas-alternating-water using the constant pressure method, it is crucial to carefully select an appropriate displacement pressure difference. The chosen pressure difference must ensure that turbulence does not occur during the experiment. Maintain a constant displacement pump pressure based on the selected displacement pressure difference. Once the pressure stabilizes, initiate data collection through software to record liquid production volume, gas production, inlet and outlet pressures, as well as time. Set the data collection interval between 2 to 10 seconds and commence with the gas-alternating-water experiment.
Upon completion of the experiment, measure effective gas permeability at 1/2 and 1/4 of displacement pressures respectively to assess for any occurrence of turbulence. If low-pressure differential permeability exceeds 10% of high-pressure differential permeability, it indicates turbulence.
2.8. Water-Alternating-Gas
After conducting the gas-alternating-water experiment, gradually increase the displacement pressure differential until no further water efflux is observed, and meticulously document the cumulative water production. The aforementioned recorded total water production shall be converted to reflect formation conditions, enabling computation of bound water saturation Sw based on the correlation between bound water saturation under formation conditions and total pore volume of the core.
The determination of confined underwater gas permeability is conducted by setting the displacement pressure and stabilizing the pressure and flow rate. Subsequently, the inlet pressure, outlet pressure, and flow rate are recorded to calculate the gas phase permeability using formula (2). To complete the measurement of gas phase permeability, three consecutive measurements are performed with a relative deviation less than 3%. This measured gas permeability serves as the fundamental value for water-alternating-gas relative permeability.
K is the gas phase permeability under formation conditions, mD. Q is the flow rate through the core under formation conditions, ml/s. µg is the viscosity of gas under formation conditions, mPa·s. L is the core length, cm. A is the core cross-sectional area, cm2. P2 is the pressure at the outlet end of the core under the formation condition, MPa. P1 is the pressure at the inlet of the core under the formation condition, MPa.
The water-alternating-gas process proceeds as follows: based on selected displacement pressure difference or flow rate, set up a displacement pump and initiate data collection on software. Record liquid production, gas production, inlet pressure, outlet pressure,and time while setting a data collection interval between 2~10S. Commence withthe water-gas displacement experiment.
3. Correction
The measurement of gas-water relative permeability curve under room condition follows the Buckley-Leverett equation and gas equation of state: unsteady-state experiment ignoring the effect of capillary pressure and gravity(Industry standard: SY/T5345-2007)[
9].
Due to high temperature and high pressure to consider the dissolution of natural gas in water, as well as water when the volume of natural gas changes with temperature and pressure, water will be produced at normal temperature and pressure volume and gas production are calibrated to high temperature and high pressure conditions.
3.1. Liquid Volume Correction
The liquid volume correction, accounting for the variation in liquid volume from underground formation conditions to the surface, is performed using formula (3).
The liquid volume Vw (ml) under formation conditions is determined by the product of the liquid volume Vsw (ml) and the surface condition's volume factors of water Bw.
3.2. Gas Volume Correction
The gas volume correction, accounting for the variation in gas volume from underground formation conditions to the surface, is performed using formula (4).
The volume of gas Vg (ml) under formation conditions is determined by multiplying the gas volume Vsg (ml) under ground conditions with volume factors of gas Bg.
3.3. Average Pressure Correction of Gas Volume
The average pressure correction of the gas volume is shown in formula(5) .
where
Vi is the value of the cumulative moisture production at time i, ml.
△V0(w)i is the value of the water increment from time i-1 to time i, ml.
Vi-1 is the value of the accumulated moisture production at the time i-1, ml.
P2 is the pressure at the outlet end of the core under the formation condition, MPa.
△P is the displacement pressure difference, MPa.
△Vgi is the value of the gas increment measured at the outlet at a certain time interval, ml.
3.4. Gas-Water Relative Permeability Calculation Method
The unsteady gas-water relative permeability characterization method was developed based on the calculation formula for oil-water phase permeability. Please refer to Formula (6), Formula (7), Formula (8), Formula (9), and Formula (10) for the calculation procedure of gas drive water.
where
fw(Sg) is the value of water content, expressed as a decimal.
Vw(t) is the value of dimensionless cumulative water recovery, expressed as a multiple of pore volume.
V(t) is the value of dimensionless cumulative production, expressed as a multiple of pore volume.
Krw is the value of the relative permeability of water phase, expressed as a decimal.
Krg is the gas phase relative permeability value, expressed as a decimal.
I is the value of relative injection capacity, also known as flow capacity.
Sg is the value of gas saturation on the end face of the outlet of the rock sample, expressed as a decimal.
Water-alternating-gas calculation is shown in formula (11), formula (12), formula (13), formula (14), formula (15).
where
fg(Sw) is the value of the gas content, expressed as a decimal.
Vg(t) is the value of the cumulative amount of water extracted without a result, expressed as a multiple of the pore volume.
V(t) is the value of cumulative production without resulting, expressed as a multiple of pore volume.
Krw is the value of the relative permeability of the water phase, expressed as a decimal.
Krg is a numerical value of the relative permeability of the gas phase, expressed as a decimal.
I is the value of relative injection capacity, also known as flow capacity.
Sw is the value of the water saturation of the outlet end face of the rock sample, expressed as a decimal.
4. Results
Most domestic and foreign experiments on high-temperature and high-pressure gas-water relative permeability have been limited to single formation conditions, such as either high temperature or high pressure. Furthermore, even the research conducted under high temperature and high pressure falls significantly below the current formation pressure of high-pressure gas reservoirs. Additionally, there is a lack of quantitative comparison between conventional and high-temperature/high-pressure relative permeability using the same core [
10,
11]. In order to address these gaps in knowledge, we conducted gas-water relative permeability experiments under joint action of elevated temperature and pressure. The experiment was carried out considering different temperatures, pressures, and types of gases to investigate their influence on gas-water phase permeability at elevated temperature and pressure.
4.1. Effect of Temperature on Gas-Water Relative Permeability
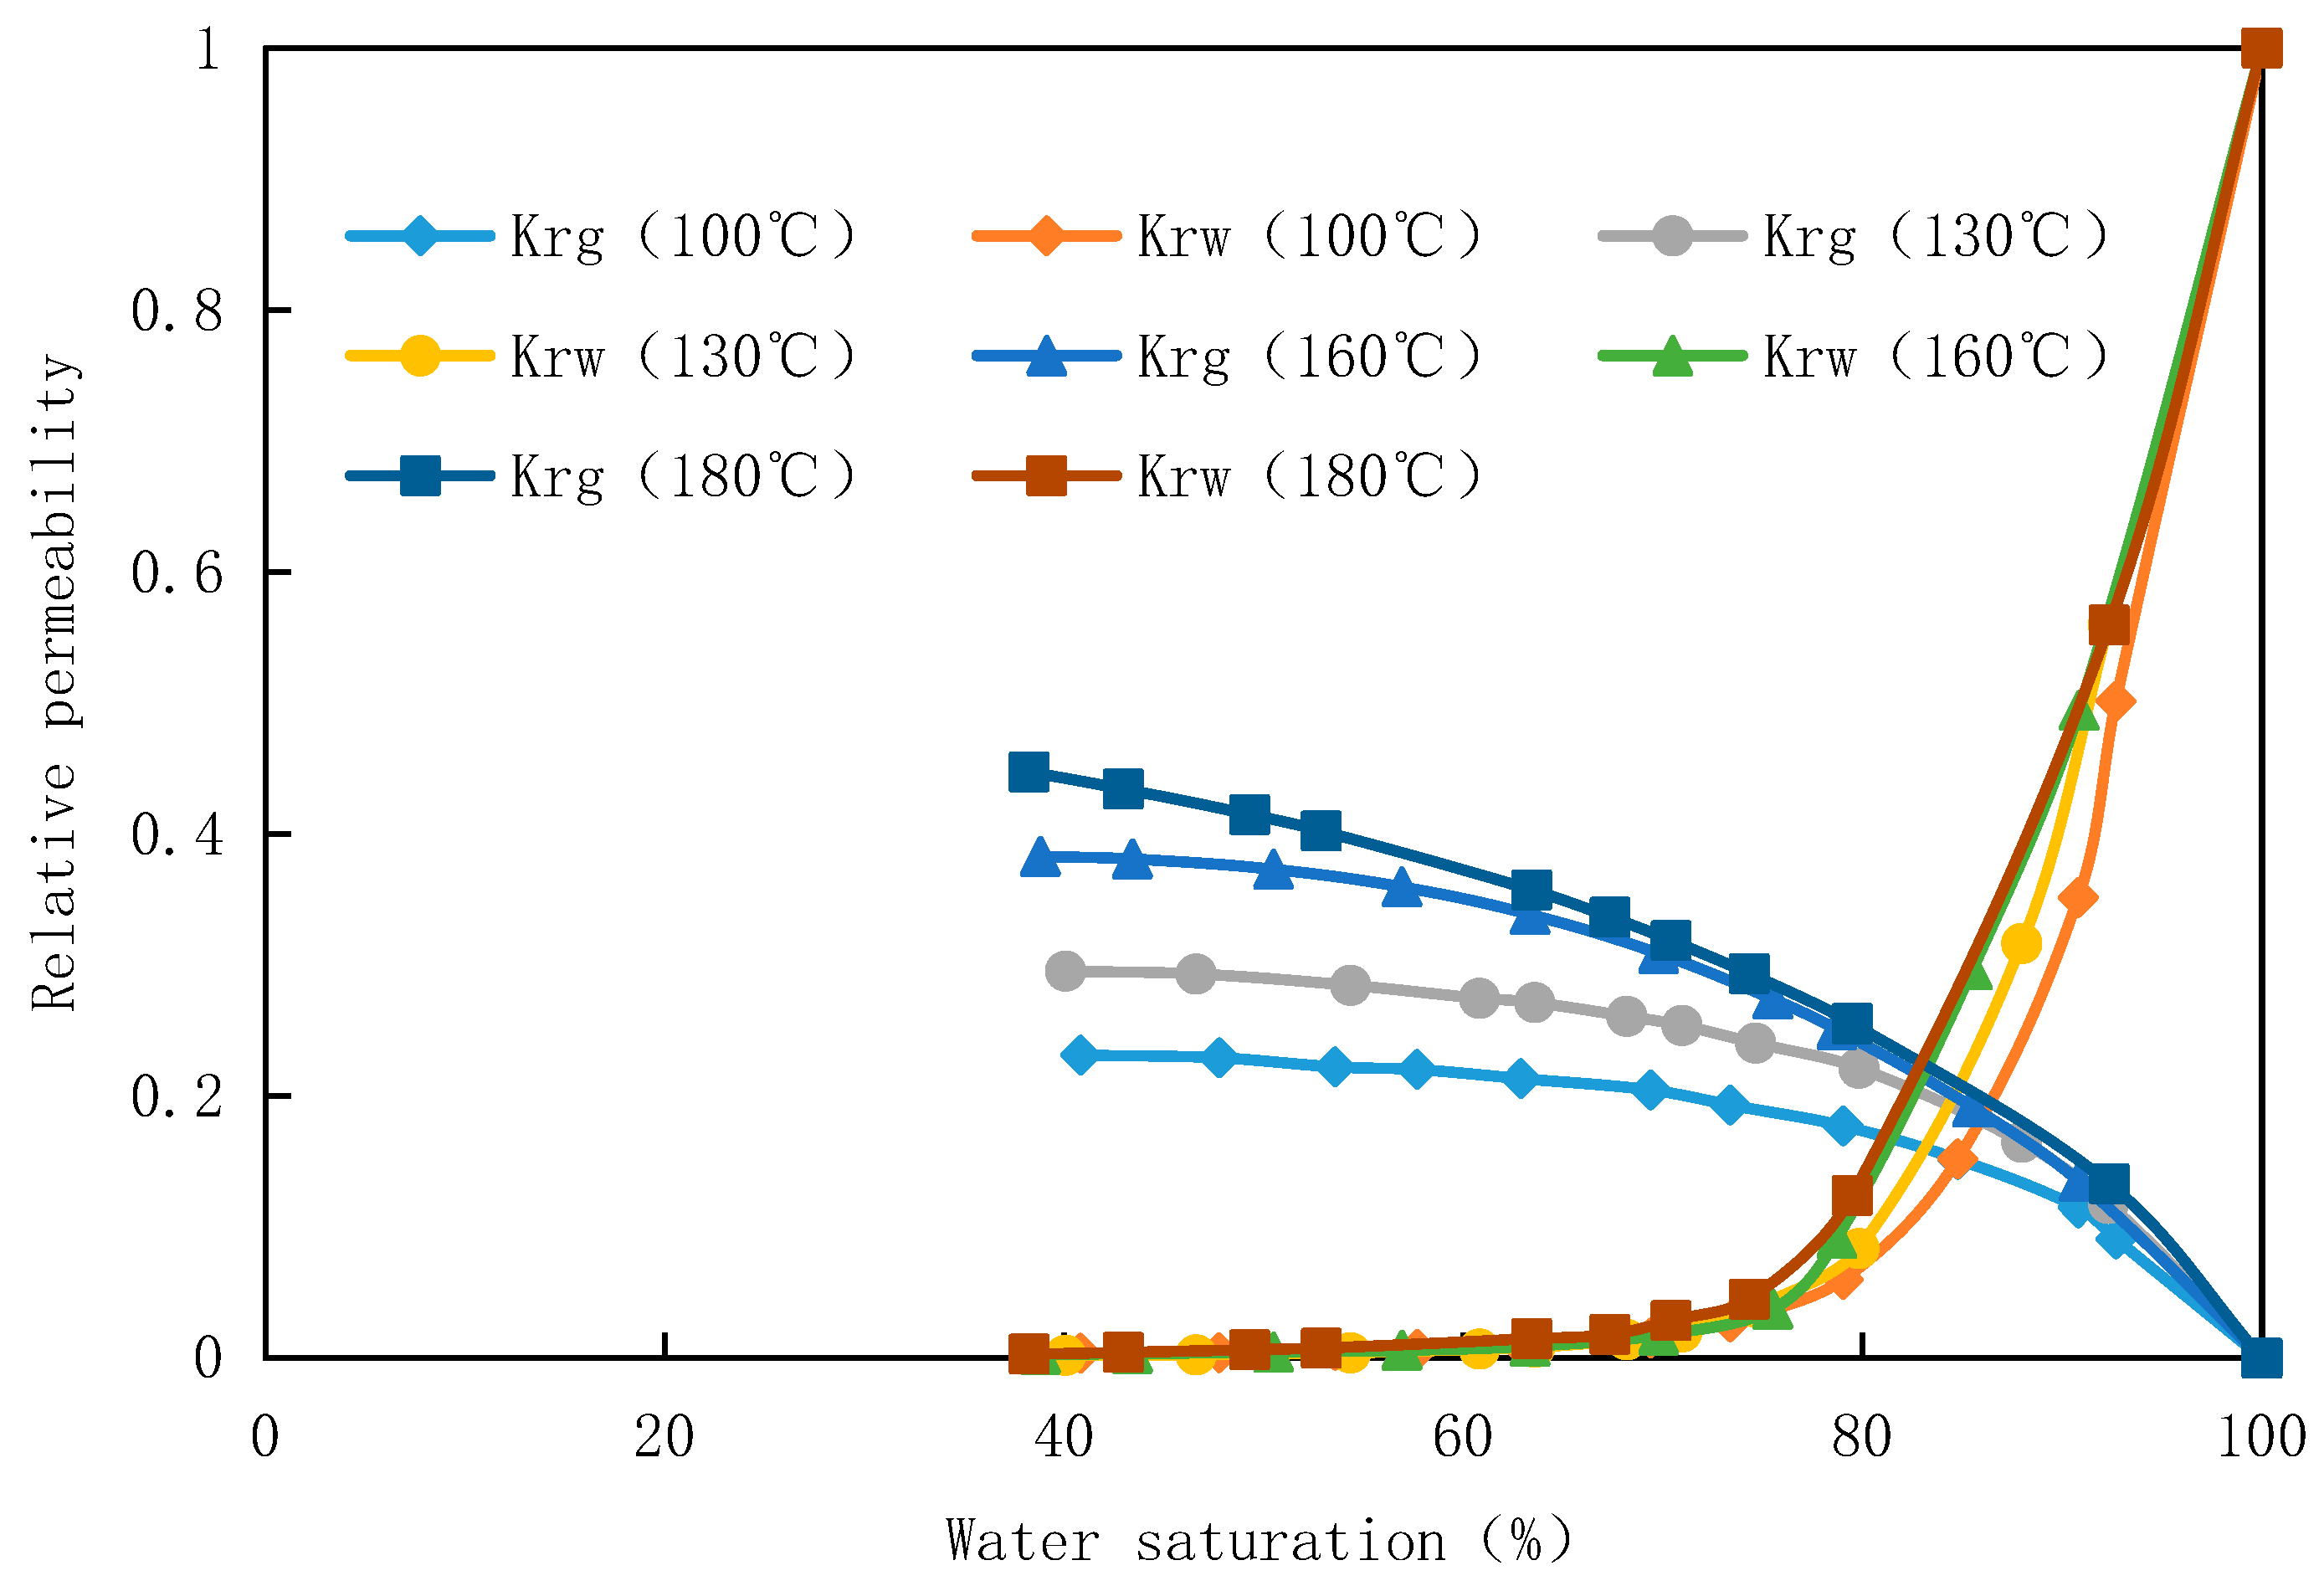
The gas-water relative permeability experiment was conducted on core 2-12 of well B at temperatures of 180℃ and 100℃, while core 2-20 of well B was selected for the experiment at temperatures of 160℃ and 130℃. Simulated gas was used as the medium, and the experimental pressure was maintained at 70MPa. The resulting gas-water relative permeability curve is presented in
Figure 2. The experimental findings demonstrate that temperature exerts a significant influence on both gas and water relative permeability, particularly on the former.
With the rise in temperature, the saturation of bound water decreases, leading to an expansion of the gas-water two-phase seepage zone. Additionally, there is a significant increase in relative permeability for the gas phase while minimal changes occur for the water phase. Consequently, the gas-water relative permeability curve shifts towards the upper left. This phenomenon can be attributed to the larger intermolecular spacing within gas molecules, making them more sensitive to temperature and exhibiting increased activity as temperature rises. As a result, their relative permeability increases accordingly. Elevated temperatures also enhance molecular motion, facilitate gas dissolution, and reduce interfacial tension between gas and water phases. These effects collectively diminish water phase entrapment within pores and adhesion on rock surfaces, ultimately resulting in a decrease in bound water saturation with increasing temperature. Furthermore, higher temperatures lead to a gradual convergence of gas-water viscosities along with decreased interfacial tension and capillary pressure; consequently widening the gas-water two-phase seepage zone and gradually improving overall sweep efficiency.
4.2. Effect of Pressure on Gas-Water Relative Permeability
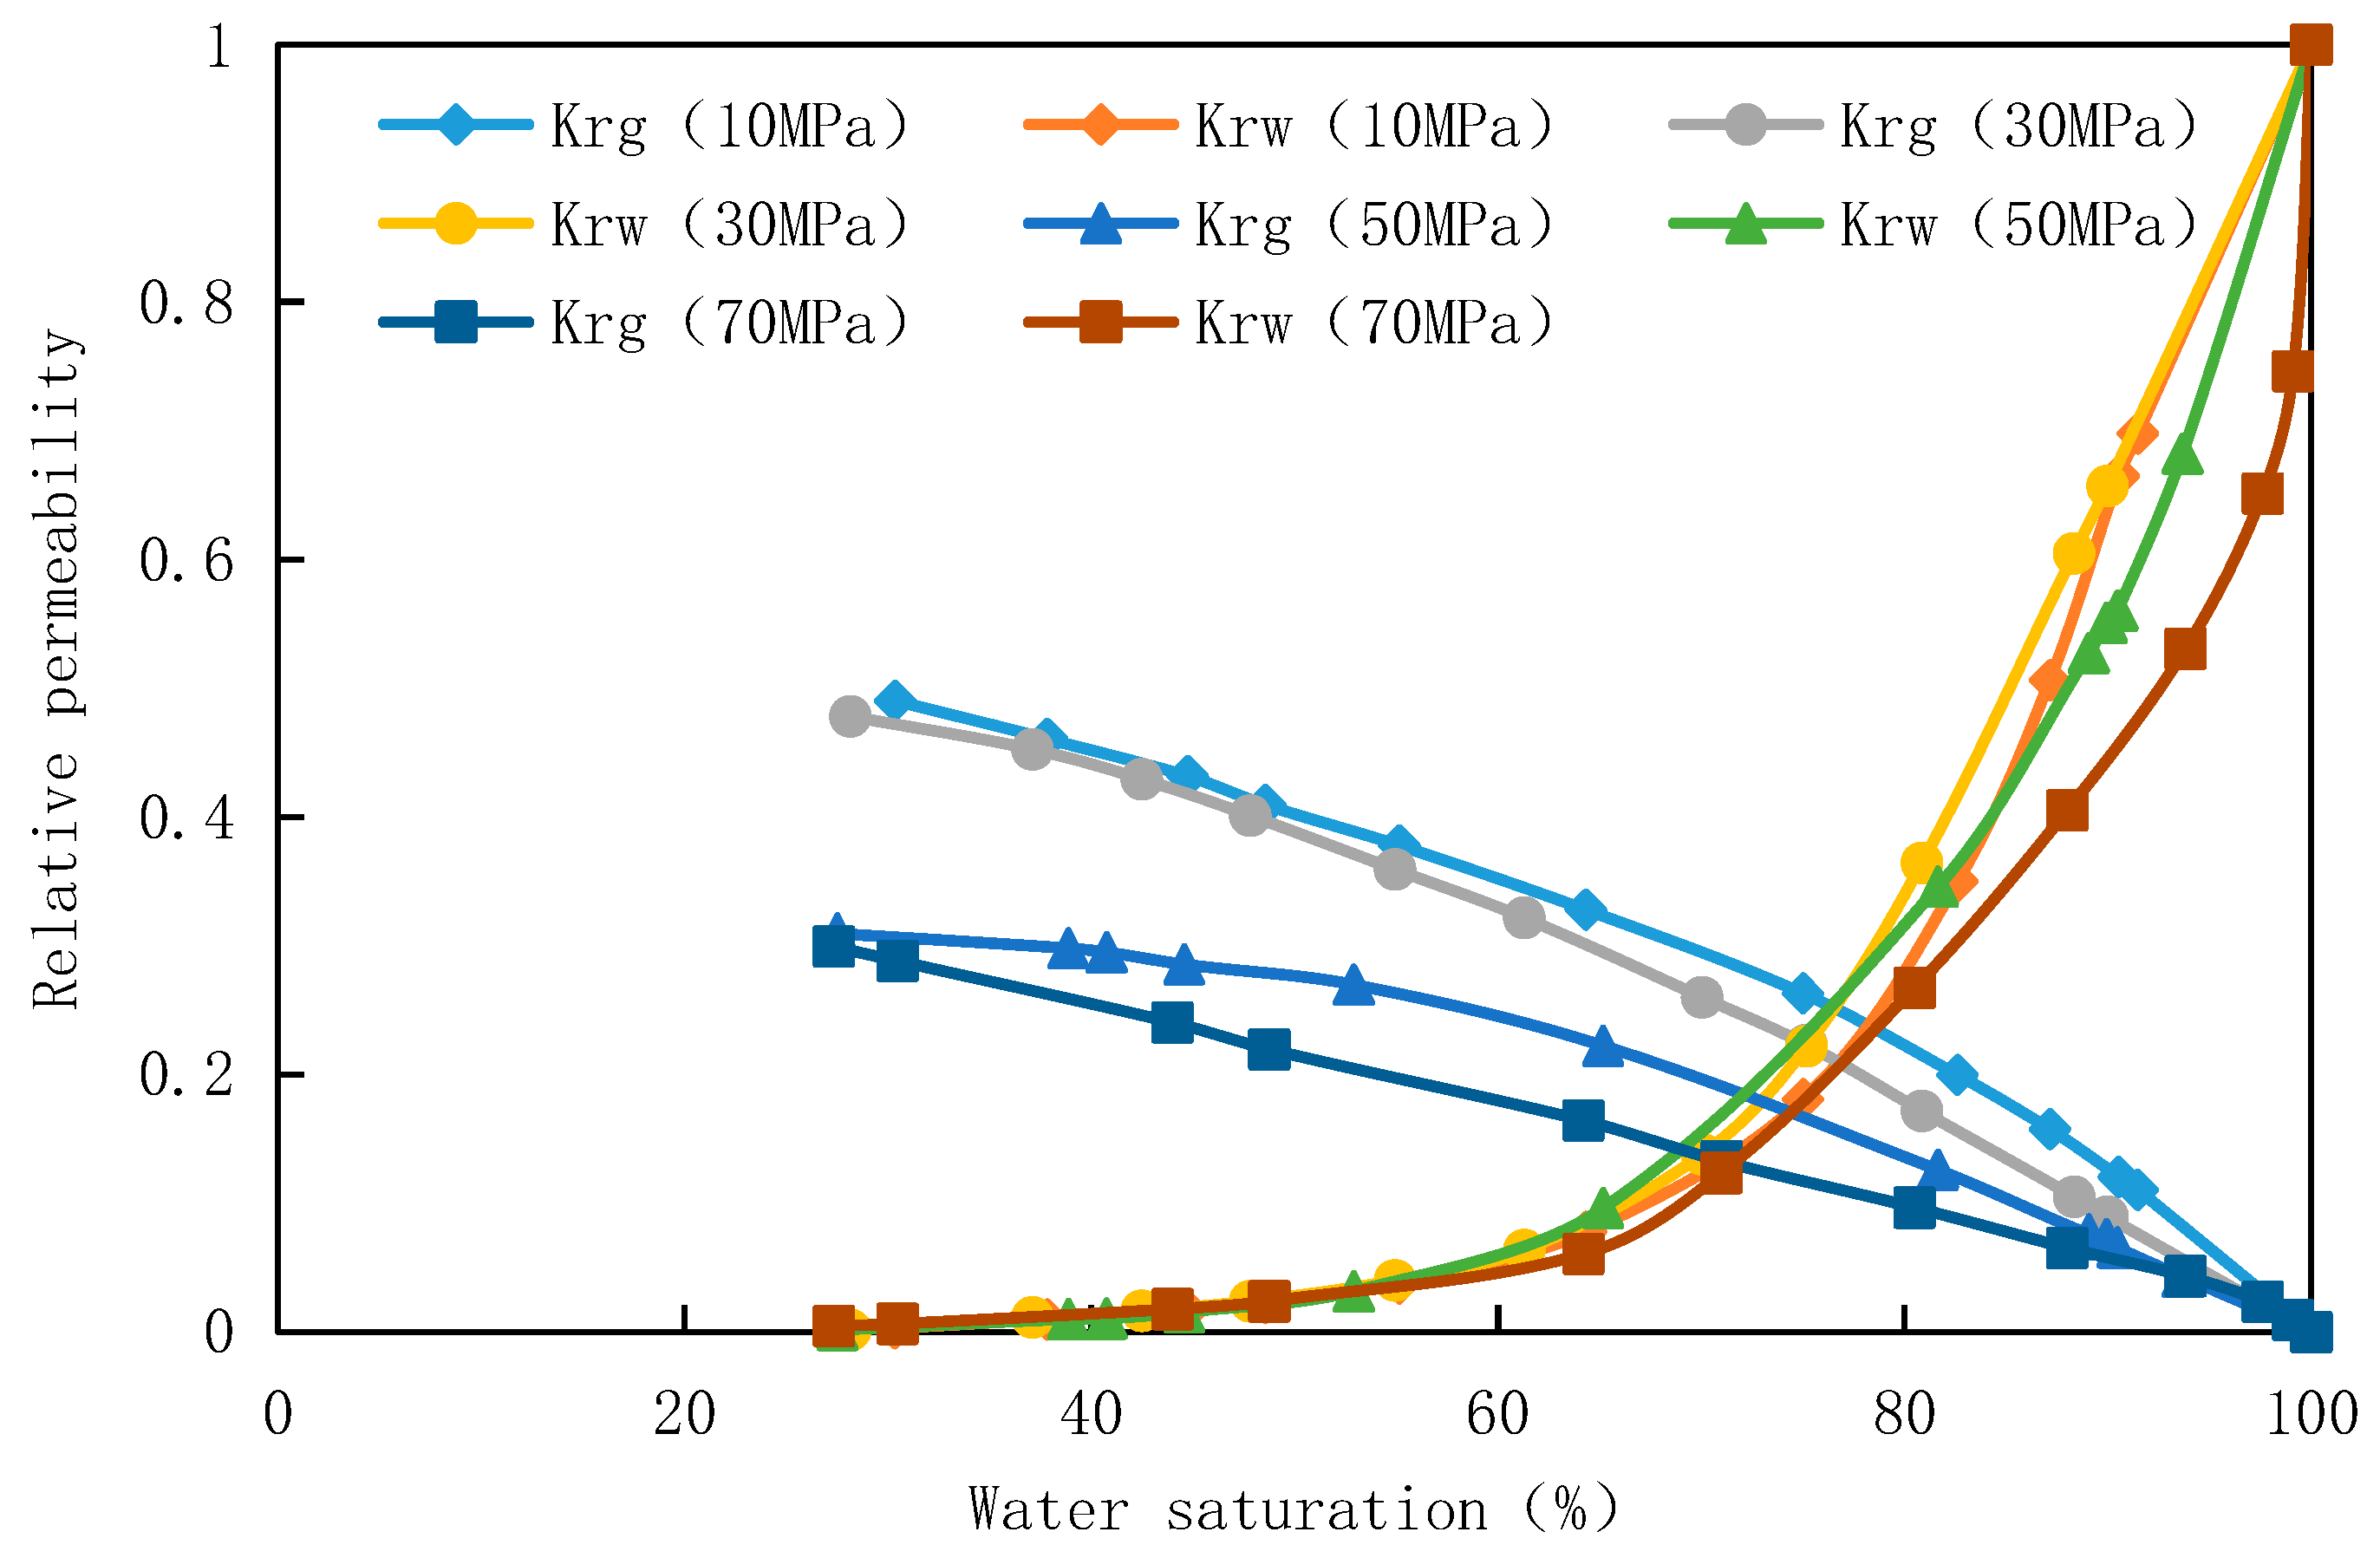
For core 1-14 of well A in Block A, an high temperature and high pressure gas-water phase permeation meter was used to measure the gas-water phase permeation curve under the experimental temperature of 160℃ and experimental pressure of 70MPa, 50MPa, 30MPa and 10MPa with simulated gas as the medium. The gas-water phase permeation curve under different experimental pressures was shown in
Figure 3. It can be seen from the curve that under the same effective stress, the gas and water relative permeability curves of move downward with the increase of pressure. Fluid pressure 10MPa and 30MPa phase permeability is close, 50MPa and 70MPa phase permeability is close.This is closely related to temperature-pressure and core physical property parameters during the experiment. With the increase of experimental fluid pressure, the viscosity of gas and formation water increases, but the increase proportion is different, resulting in different gas-water phase permeability changes.
4.3. Influence of Different Gases on Gas-Water Relative Permeability
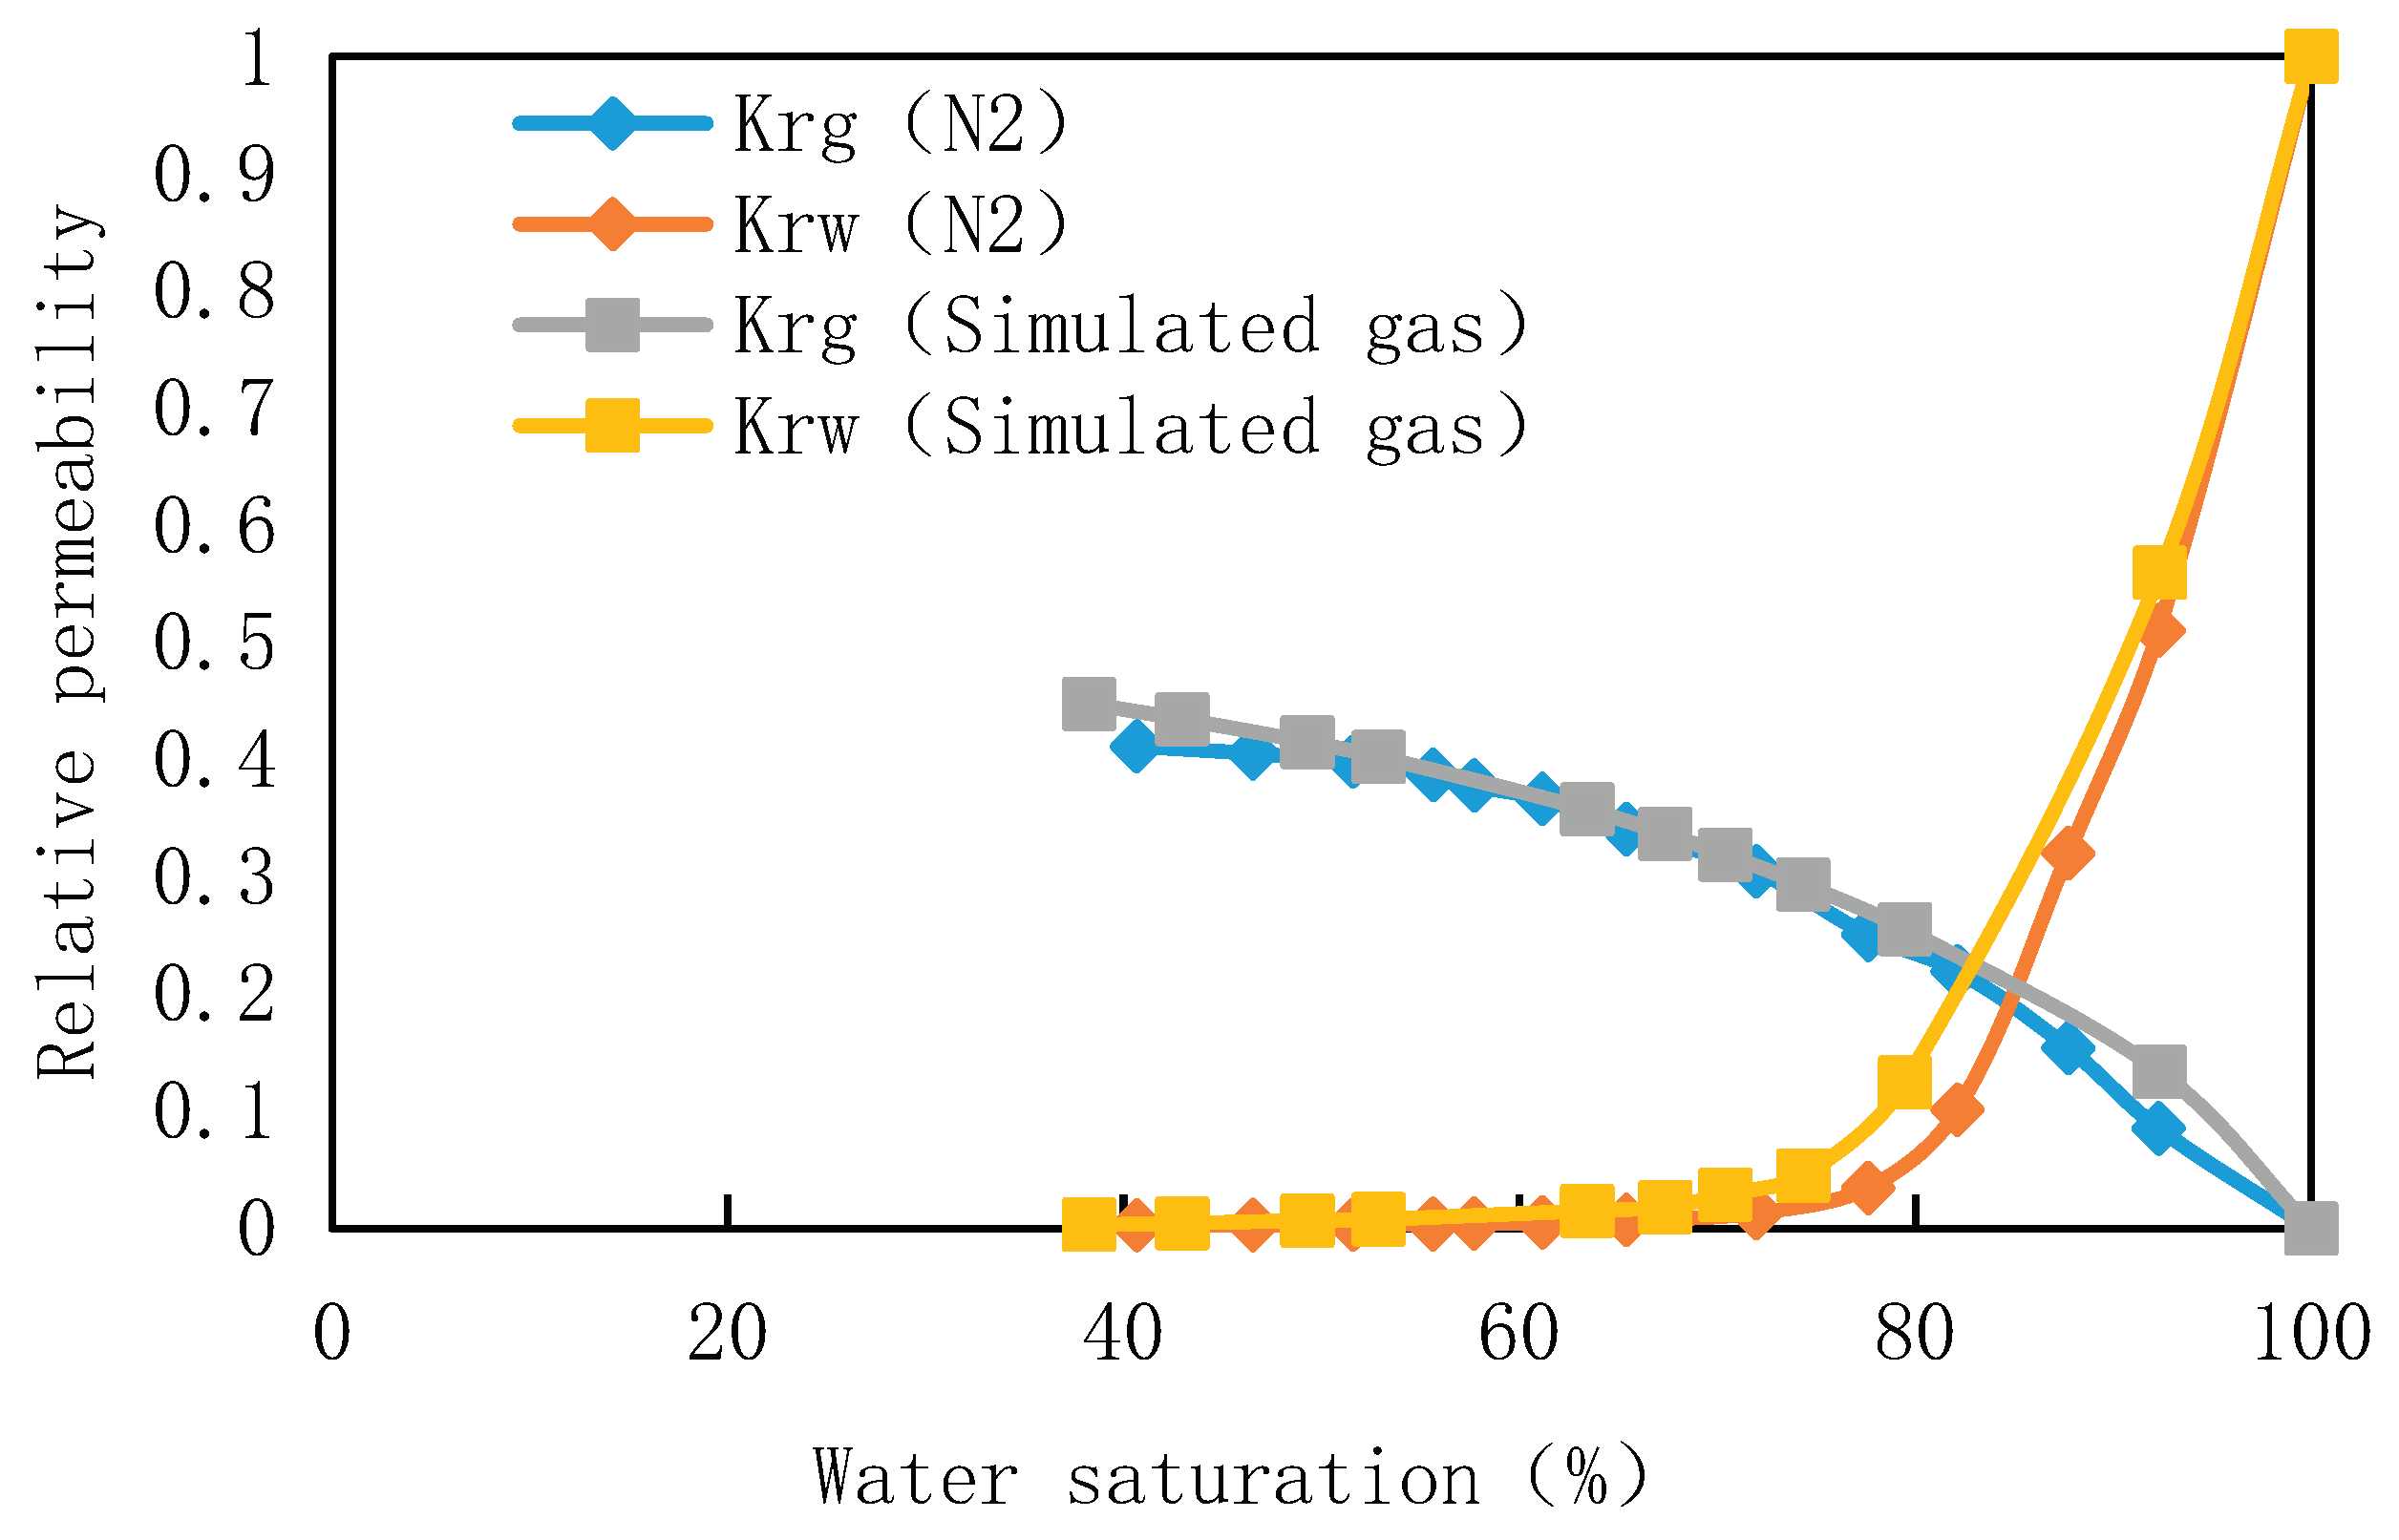
For core 2-12 of well B in Block A, high temperature and high pressure gas-water relative permeability meter was used to measure the gas-water relative permeability curve under the experimental temperature of 180℃ and pressure of 70MPa with simulated gas and nitrogen as the medium. The gas-water relative permeability curve of different displacement gases was shown in
Figure 4. As can be seen from
Figure 4, the gas type has little influence on the phase permeability, and the main influence is in the high water saturation part. The relative permeability of gas phase measured by different displacement gases is not obvious when the water saturation is 80%-50%. When the water saturation is higher than 80%, the difference is gradually obvious. Under the condition of bound water saturation, the relative permeability of nitrogen is less than that of simulated gas, about 92% of the latter. It is found that the relative permeability of simulated gas is higher than that of nitrogen due to its high solubility under high temperature and high pressure.
5. Conclusion
The present study describes the independent development of a relative permeability measuring device capable of operating under high temperature and high pressure conditions, enabling accurate separation and measurement of water and gas.
The experimental device has a maximum temperature capability of 250℃ and can withstand pressures up to 120MPa, facilitating efficient and rapid gas-water separation with a measurement accuracy as fine as 0.05 L.
The experimental results show that the temperature has a certain effect on the gas and water relative permeability, especially on the gas relative permeability. With the increase of temperature, the gas relative permeability increases greatly, but the water relative permeability changes little.
It can be seen from the curve that under the same effective stress, the gas and water relative permeability curves of move downward with the increase of pressure. Gas relative permeability decreased more.
The gas type has little influence on the phase permeability, and the main influence is in the high water saturation part. The relative permeability of gas phase measured by different displacement gases is not obvious when the water saturation is 80%-50%. When the water saturation is higher than 80%, the difference is gradually obvious. Under the condition of bound water saturation, the relative permeability of nitrogen is less than that of simulated gas, about 92% of the latter.
Nomenclature
| A |
core cross-sectional area, cm2
|
| Bg |
volume factors of gas |
| Bw |
volume factors of water |
| K |
absolute permeability,mD |
| kr |
relative permeability |
| krg |
gas relative permeability |
| Krw |
water relative permeability |
| µg |
gas viscosity,mPa·s |
| µw |
water viscosity,mPa·s |
| P1 |
the pressure at the inlet of the core under the formation condition, MPa |
| P2 |
the pressure at the outlet end of the core under the formation condition, MPa |
| △P |
the pressure differential between the core's inlet and outlet, MPa |
| I |
the value of relative injection capacity |
| L |
core length, cm |
| Q |
flow rate through the core under formation conditions, ml/s |
| Sg |
gas saturation |
| Sw |
water saturation |
| Vg |
gas volume under formation conditions, ml |
| Vw |
liquid volume under formation conditions, ml |
| Vsg |
gas volume under ground conditions, ml |
| Vsw |
liquid volume under ground conditions, ml |
References
- Hao Guoxi, Yuan Shiyi, Wei Wenjie, et al. Fluid phase behavior and physical properties of Overpressured condensate gas reservoir [J]. Journal of petroleum, 2004,25(4):70-74.
- Liu Qi, Sun Lei, Liu Dengfeng. Research status of phase behavior characteristics of condensate oil and gas system [J]. Drilling and production technology, 2008,31(1):112-113.
- Shen Pingping. Review of methods for calculating relative permeability by displacement experiment [J]. Petroleum exploration and development, 1982, (3):73-80.
- Leas W J, Jenks J H, Russell C D. Relative permeability to gas[J]. Journal of Petroleum Technology, 1950, 2(03): 65-72. [CrossRef]
- Heaviside,J., Brown,C.E., et al. Relative Permeability for Intermediate Wettability Reservoirs[J]. SPE Annual Technical Conference and Exhibition, 1987: 823-836. [CrossRef]
- Poilkar M, Farouq All S M, Puttagunta V R. High-temperature relative permeability for Athabasca oil sands[J]. SPE Reservoir Engineering, 1990, 5(01): 25-32. [CrossRef]
- Potter,G.,&Lyle,G.L. Measuring Relative Permeability of High-Permeability Samples From Egypt[J]. Society of Petroleum Engineers. 1993: 53-62. [CrossRef]
- Mao Qianru, Fan Caiwei, Luo Jinglan, Cao Jiangjun, You Li, Fu Yong, Li Shanshan, Shi Xiaofan, Wu Shijiu. Differential analysis of sedimentary diagenetic evolution of middle deep sandstone reservoirs under overpressure background: takes Miocene Huangliu Formation in Yinggehai Basin, South China Sea as an example [J]. Journal of Paleogeography, 2022,24 (02): 344-360.
- Yang Z, Li Y, Chen Z, et al. Measuring Gas-Water Relative Permeability in Tight Sandstones at High-Temperature High-Pressure Conditions: Experimental Design and Correction[C]//SPE Reservoir Characterisation and Simulation Conference and Exhibition. SPE, 2017: D021S006R004. [CrossRef]
- Dai Long, You Li, Wu Shijiu, Zhong Jia, Zhu Peiyuan, Zhao Zhanjie. Physical property lower limit and classification of high-temperature and overpressure reservoirs in Ledong District, Yinggehai Basin [J]. Marine Oil and Gas Geology, 2022,27 (02): 157-166.
- Guo Xiao, Ma Jing, Li Jiudi, et al. Effect of reservoir temperature and pressure on relative permeability[R]. SPE 158055-MS, 2012. [CrossRef]
|
Disclaimer/Publisher’s Note: The statements, opinions and data contained in all publications are solely those of the individual author(s) and contributor(s) and not of MDPI and/or the editor(s). MDPI and/or the editor(s) disclaim responsibility for any injury to people or property resulting from any ideas, methods, instructions or products referred to in the content. |
© 2024 by the authors. Licensee MDPI, Basel, Switzerland. This article is an open access article distributed under the terms and conditions of the Creative Commons Attribution (CC BY) license (http://creativecommons.org/licenses/by/4.0/).


