1. Introduction
Temporary water deficit influences physiological, biochemical, metabolic and morphological processes, interfering with plant growth and development, and consequently plant productivity [
1,
2]. Water deficiency in these processes involves complexity and plants respond to stress through mechanisms that avoid or lead to adaptation to these effects [
3,
4].
In plants under water deficit, the formation of chlorophyll can be inhibited, due to the increased production of hydrogen peroxide, which causes damage to membranes and degradation of pigments [
5]. In periods of drought, lack of water can alter the photosynthetic activities of plants [
6], modifying stomatal conductance (
gs) and restricting the entry of CO
2 into the substomatal chamber [
7,
8].
The reduction in CO
2 assimilation promoted by stomatal closure contributes to the imbalance between photochemical activity in photosystem II (PSII) and the requirement for electrons for photosynthesis, promoting photoinhibitory damage to the PSII reaction center [
9,
10], causing deviation of absorbed light to other processes, such as thermal dissipation to protect the photosynthetic apparatus [
11,
12], especially under stress conditions due to water scarcity.
Under water stress conditions, resistance inducers have been applied, which act in plant protection, improving plant defense mechanisms. Among protection inductors, salicylic acid (SA) stands out, an endogenous signaling molecule involved in physiological processes and in the induction of biosynthesis reactions for the development of protection systems [
13,
14,
15].
SA has been used to modulate the physiological and biochemical response of plants subjected to drought, salinity, low and high temperatures [
16,
17]. Among physiological responses, SA increases net photosynthesis [
18], interfering both in the activity of ribulose-1,5-bisphosphate carboxylase oxygenase (RuBP) [
19], and regulating sweating under dry conditions, which reduces water loss and maintains turgor, leading to maintenance of photosynthesis and productivity [
20,
21].
Thus, the attenuating effect of SA under drought conditions may be associated with its role in photosynthesis [
22,
23] and in stomatal regulation [
24], which, in turn, act as pathways eliminating reactive oxygen species and providing protection to the photosynthetic apparatus under stress conditions [
25,
26].
Specifically, in the cultivation of bell pepper (
Capsicum annum L.), water is an essential factor and its scarcity causes production losses [
27,
28]. In this context, SA application may represent a promising source for inducing drought resistance mechanisms in pepper and several other crops of agricultural interest, including vegetables, which are generally susceptible to water stress. ‘Melina’ hybrid pepper, suitable for cultivation in tropical regions, has high acceptability by producers; however, it is subject to adverse weather conditions, such as cycles consisting of lack of water, followed by rain, which can lead to plant non-reestablishment due to the presence of successive stress cycles. Although the physiological responses of plants to SA under water stress are known, specifically in pepper plants, there is a lack of research on this topic. Thus, we believe that rehydration and exogenous SA application strengthen the physiological responses of plants, favoring carbon dioxide assimilation and the production of pigments, resulting in less damage to the photosynthetic apparatus and increase in plant defense when subjected to a drought period.
Thus, the hypothesis of this research is that exogenous SA application together with rehydration improves leaf water potential, pigment and carotenoid synthesis, stomatal conductance and chlorophyll a fluorescence throughout the day and it is crucial to attenuate effects arising from the production of hydrogen peroxide in young sweet pepper plants subjected to drought.
If the hypothesis of this study is accepted, it will make it possible to advance strategies for optimizing the use of SA to combat water deficit with global implications given the increase in the frequency of drought with climate change, which affects pepper production in different growing regions.
This study aims to unravel the mechanisms of salicylic acid and rehydration and the physiological benefits in pepper plants grown under water deficit on based on pigment content, leaf water potential, stomatal conductance and chlorophyll a fluorescence throughout the day, as well as hydrogen peroxide content in young pepper plants subjected to drought.
2. Results
The moisture percentage in leaves was different throughout the day only at 12:00 am and 02:00 pm, with higher values for leaves of plants in the irrigated treatment, an expected result, since plants under this condition have greater water availability in the soil. However, there was no effect of salicylic acid (SA) concentrations on the moisture percentage in leaves (
Table 1).
Regarding plants submitted to irrigated treatment and rehydration of plants submitted to drought 12 days after application of treatments (DAAT), no statistical difference was observed either in relation to the period of the day or in relation to SA concentrations. However, it is possible to verify the recovery of plants subjected to water suspension followed by rehydration, at 12:00am - 02:00 pm, seven days after being subjected to drought (
Table 1).
The water potential did not vary in plants in the irrigated and dry treatments, with no effect of SA application being observed (
Table 2).
Chlorophylls
a,
b and carotenoids were not influenced by water suspension, not differing from plants not subjected to water deficit (
Table 2). However, when the highest SA concentration (1.5 mM) was applied, there was reduction in chlorophyll
a and carotenoid contents (
Table 2), reflecting reduction in the hydrogen peroxide levels (H
2O
2) (Figure 5), suggesting that this concentration is excessive for the plants defense mechanism.
Plants in the irrigated and rehydrated treatment and those subjected to SA concentrations showed no difference in water potential, chlorophyll
a,
b and carotenoids (
Table 2).
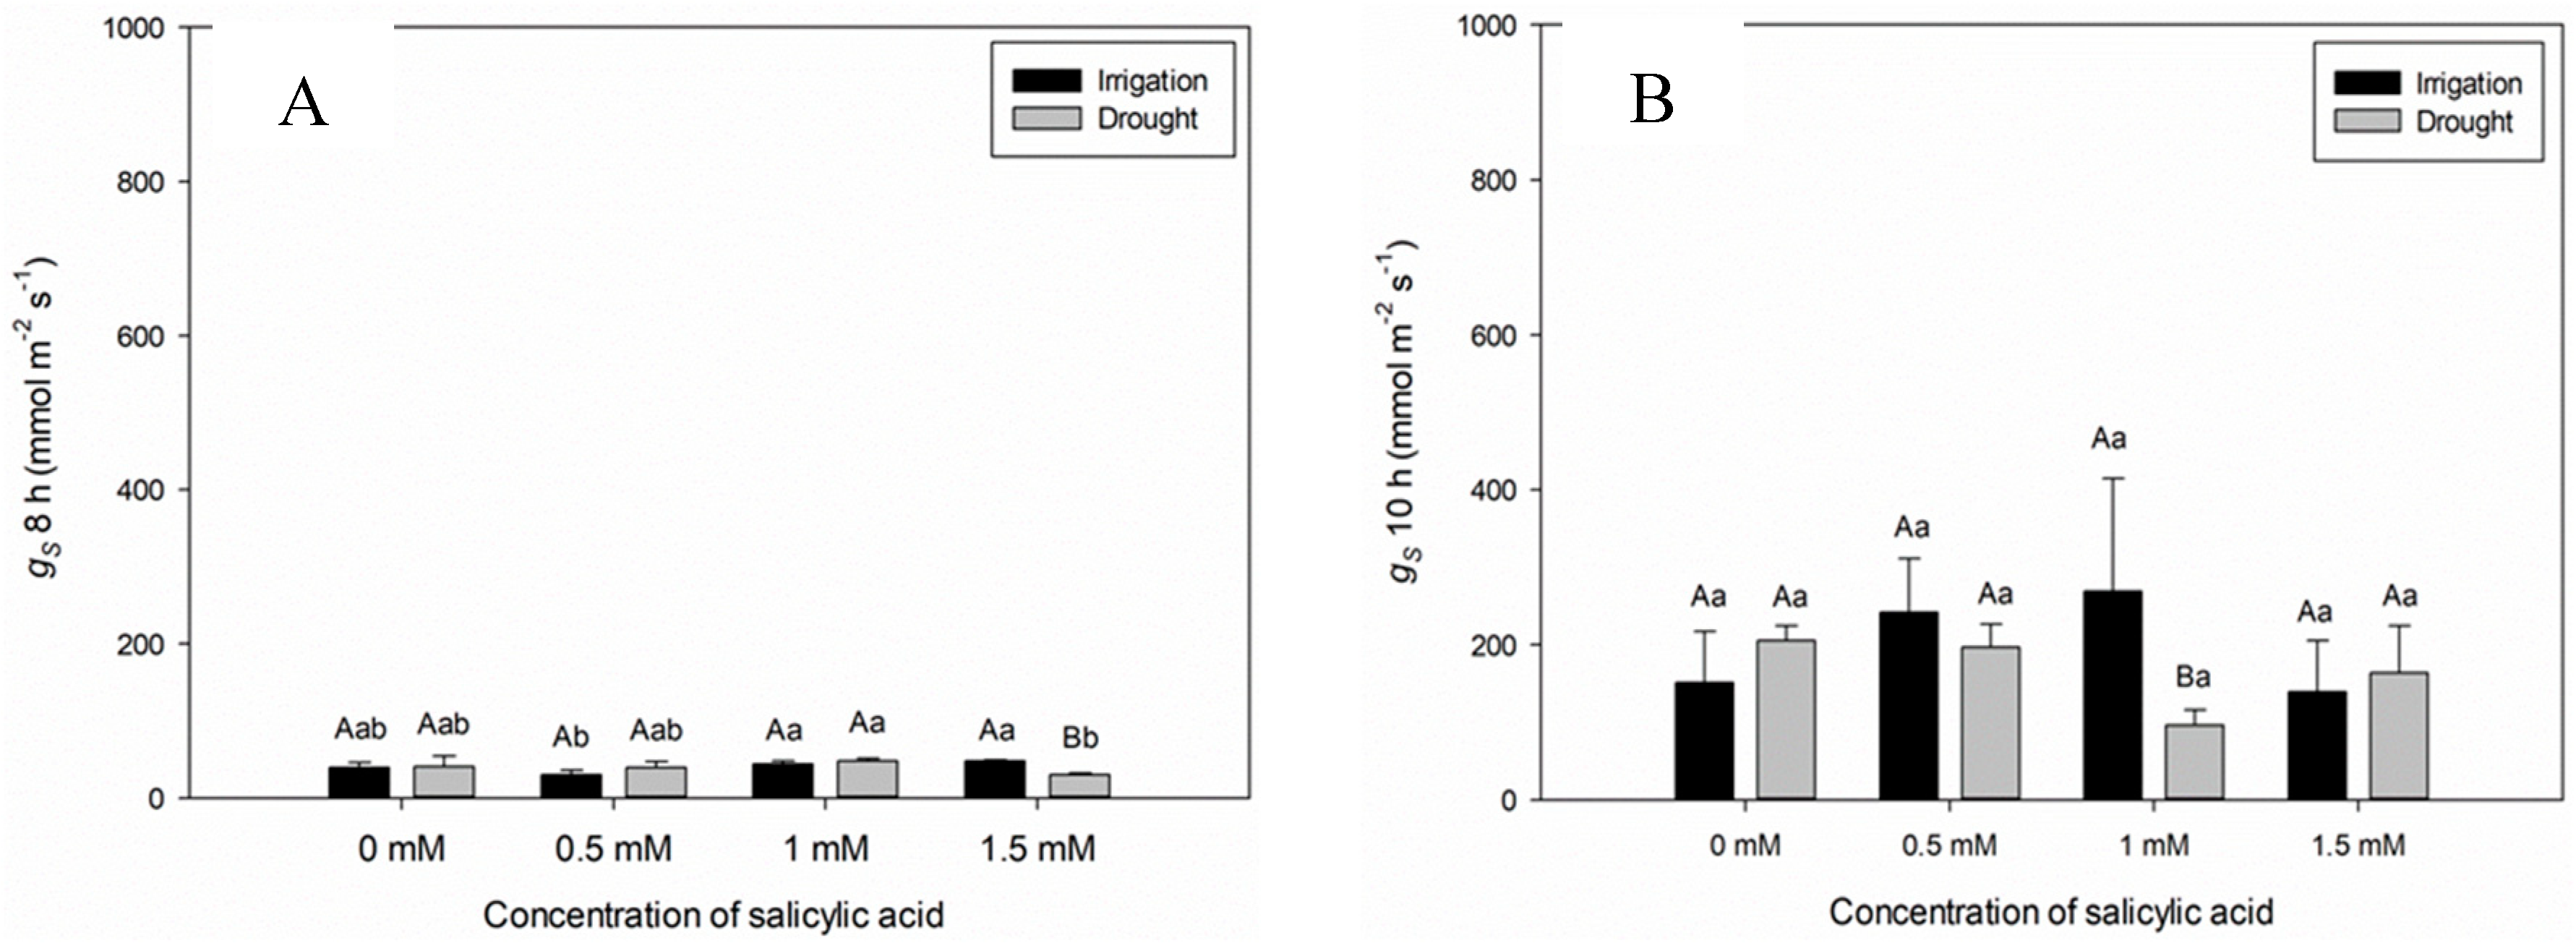
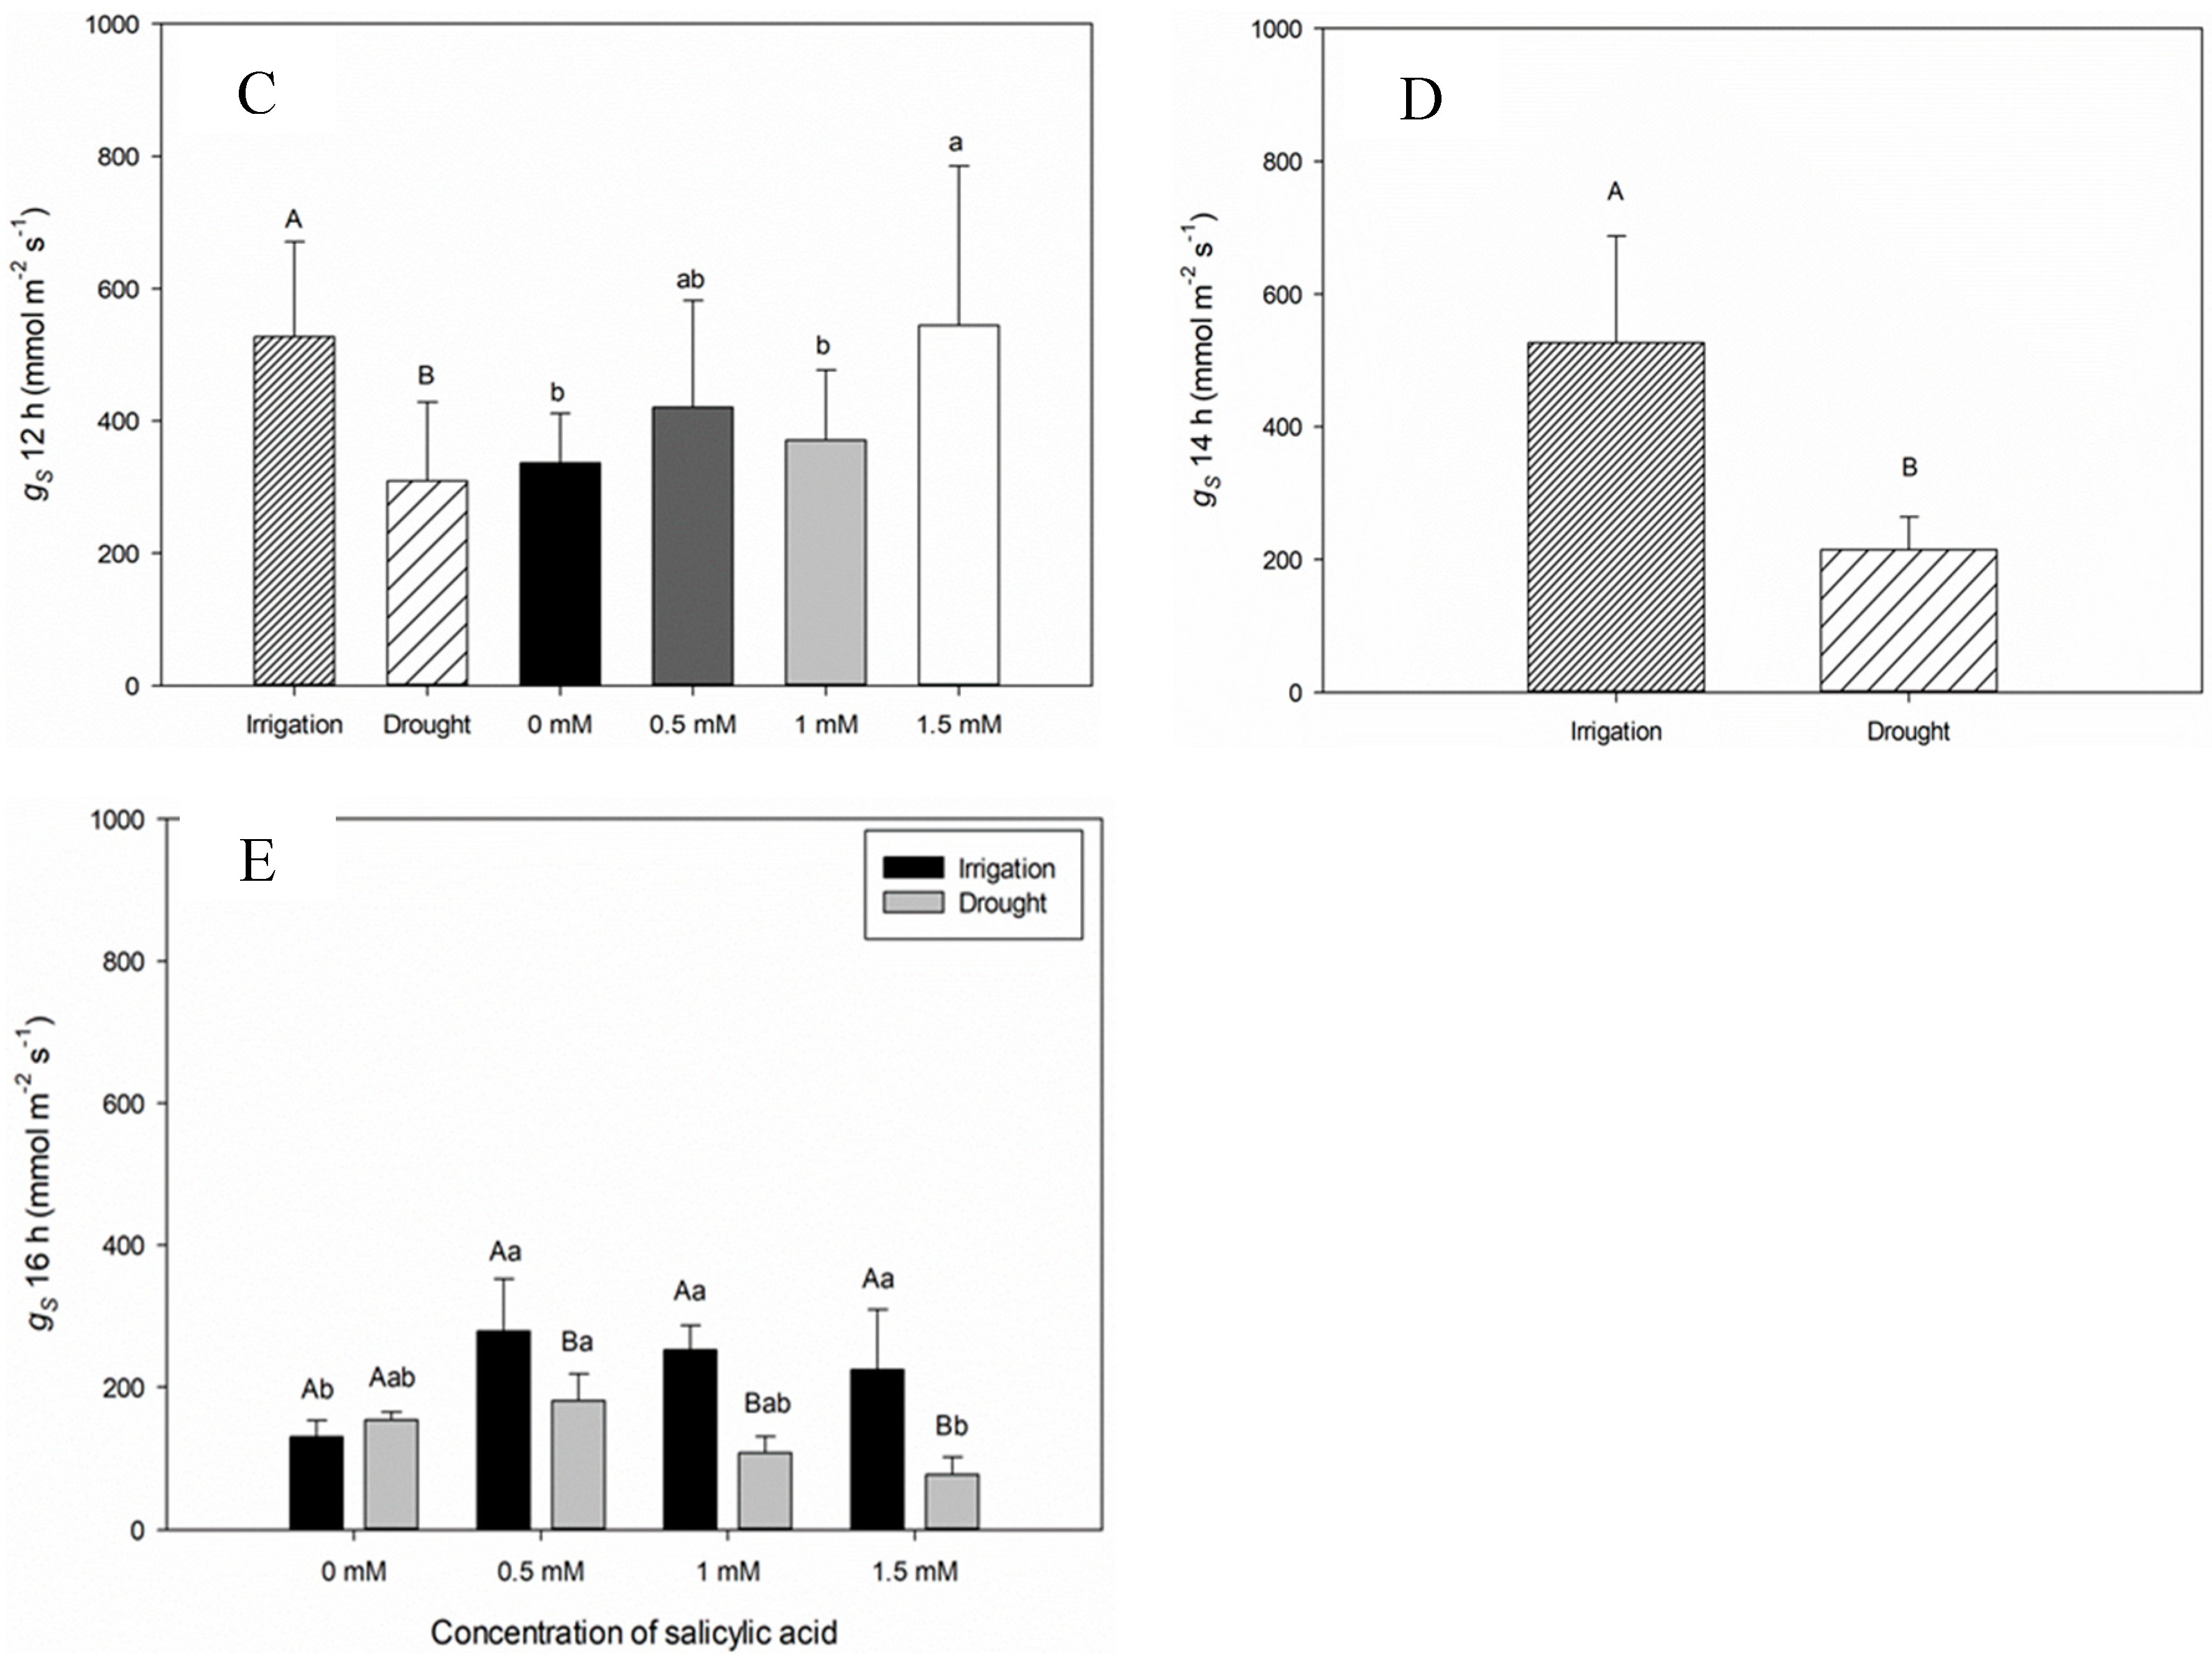
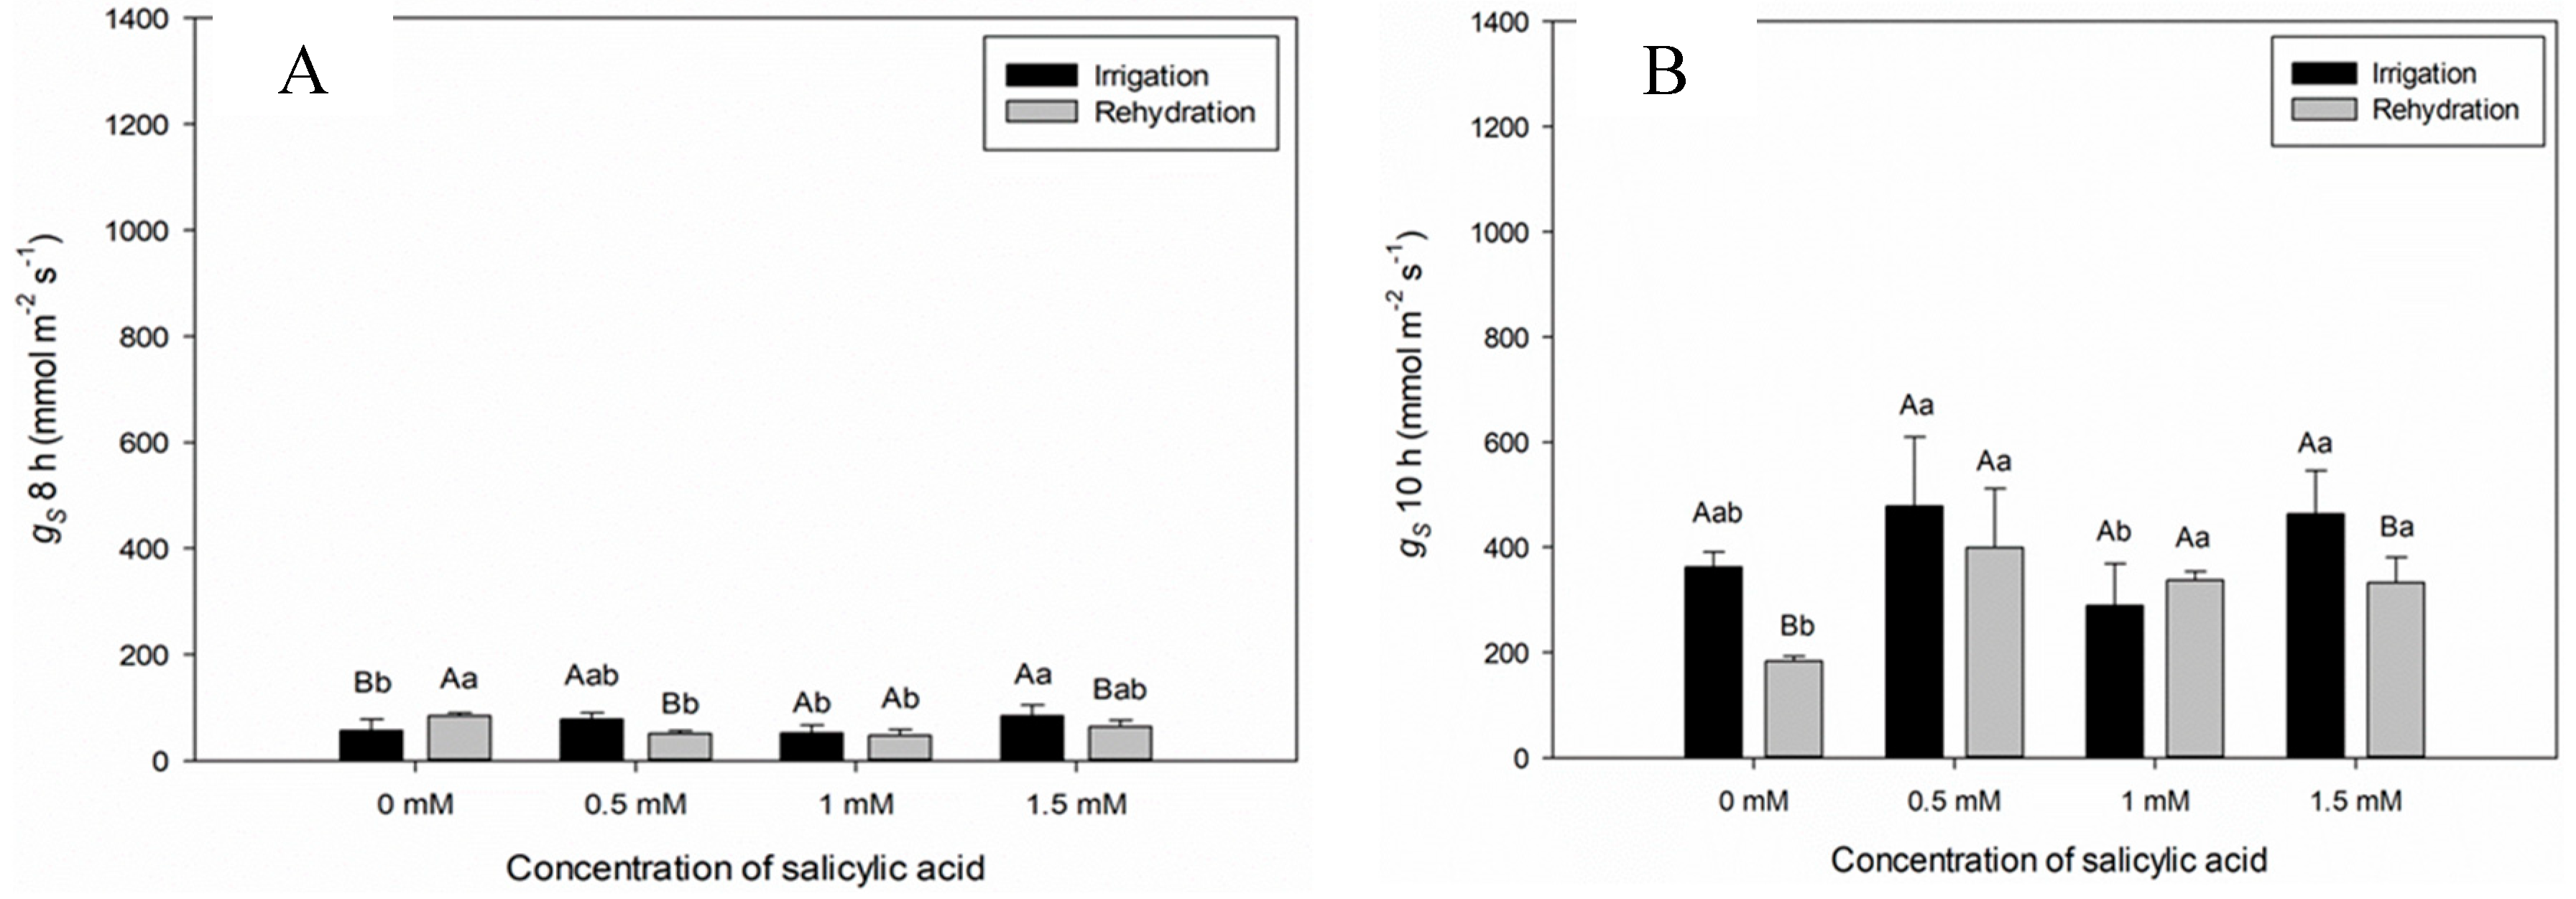
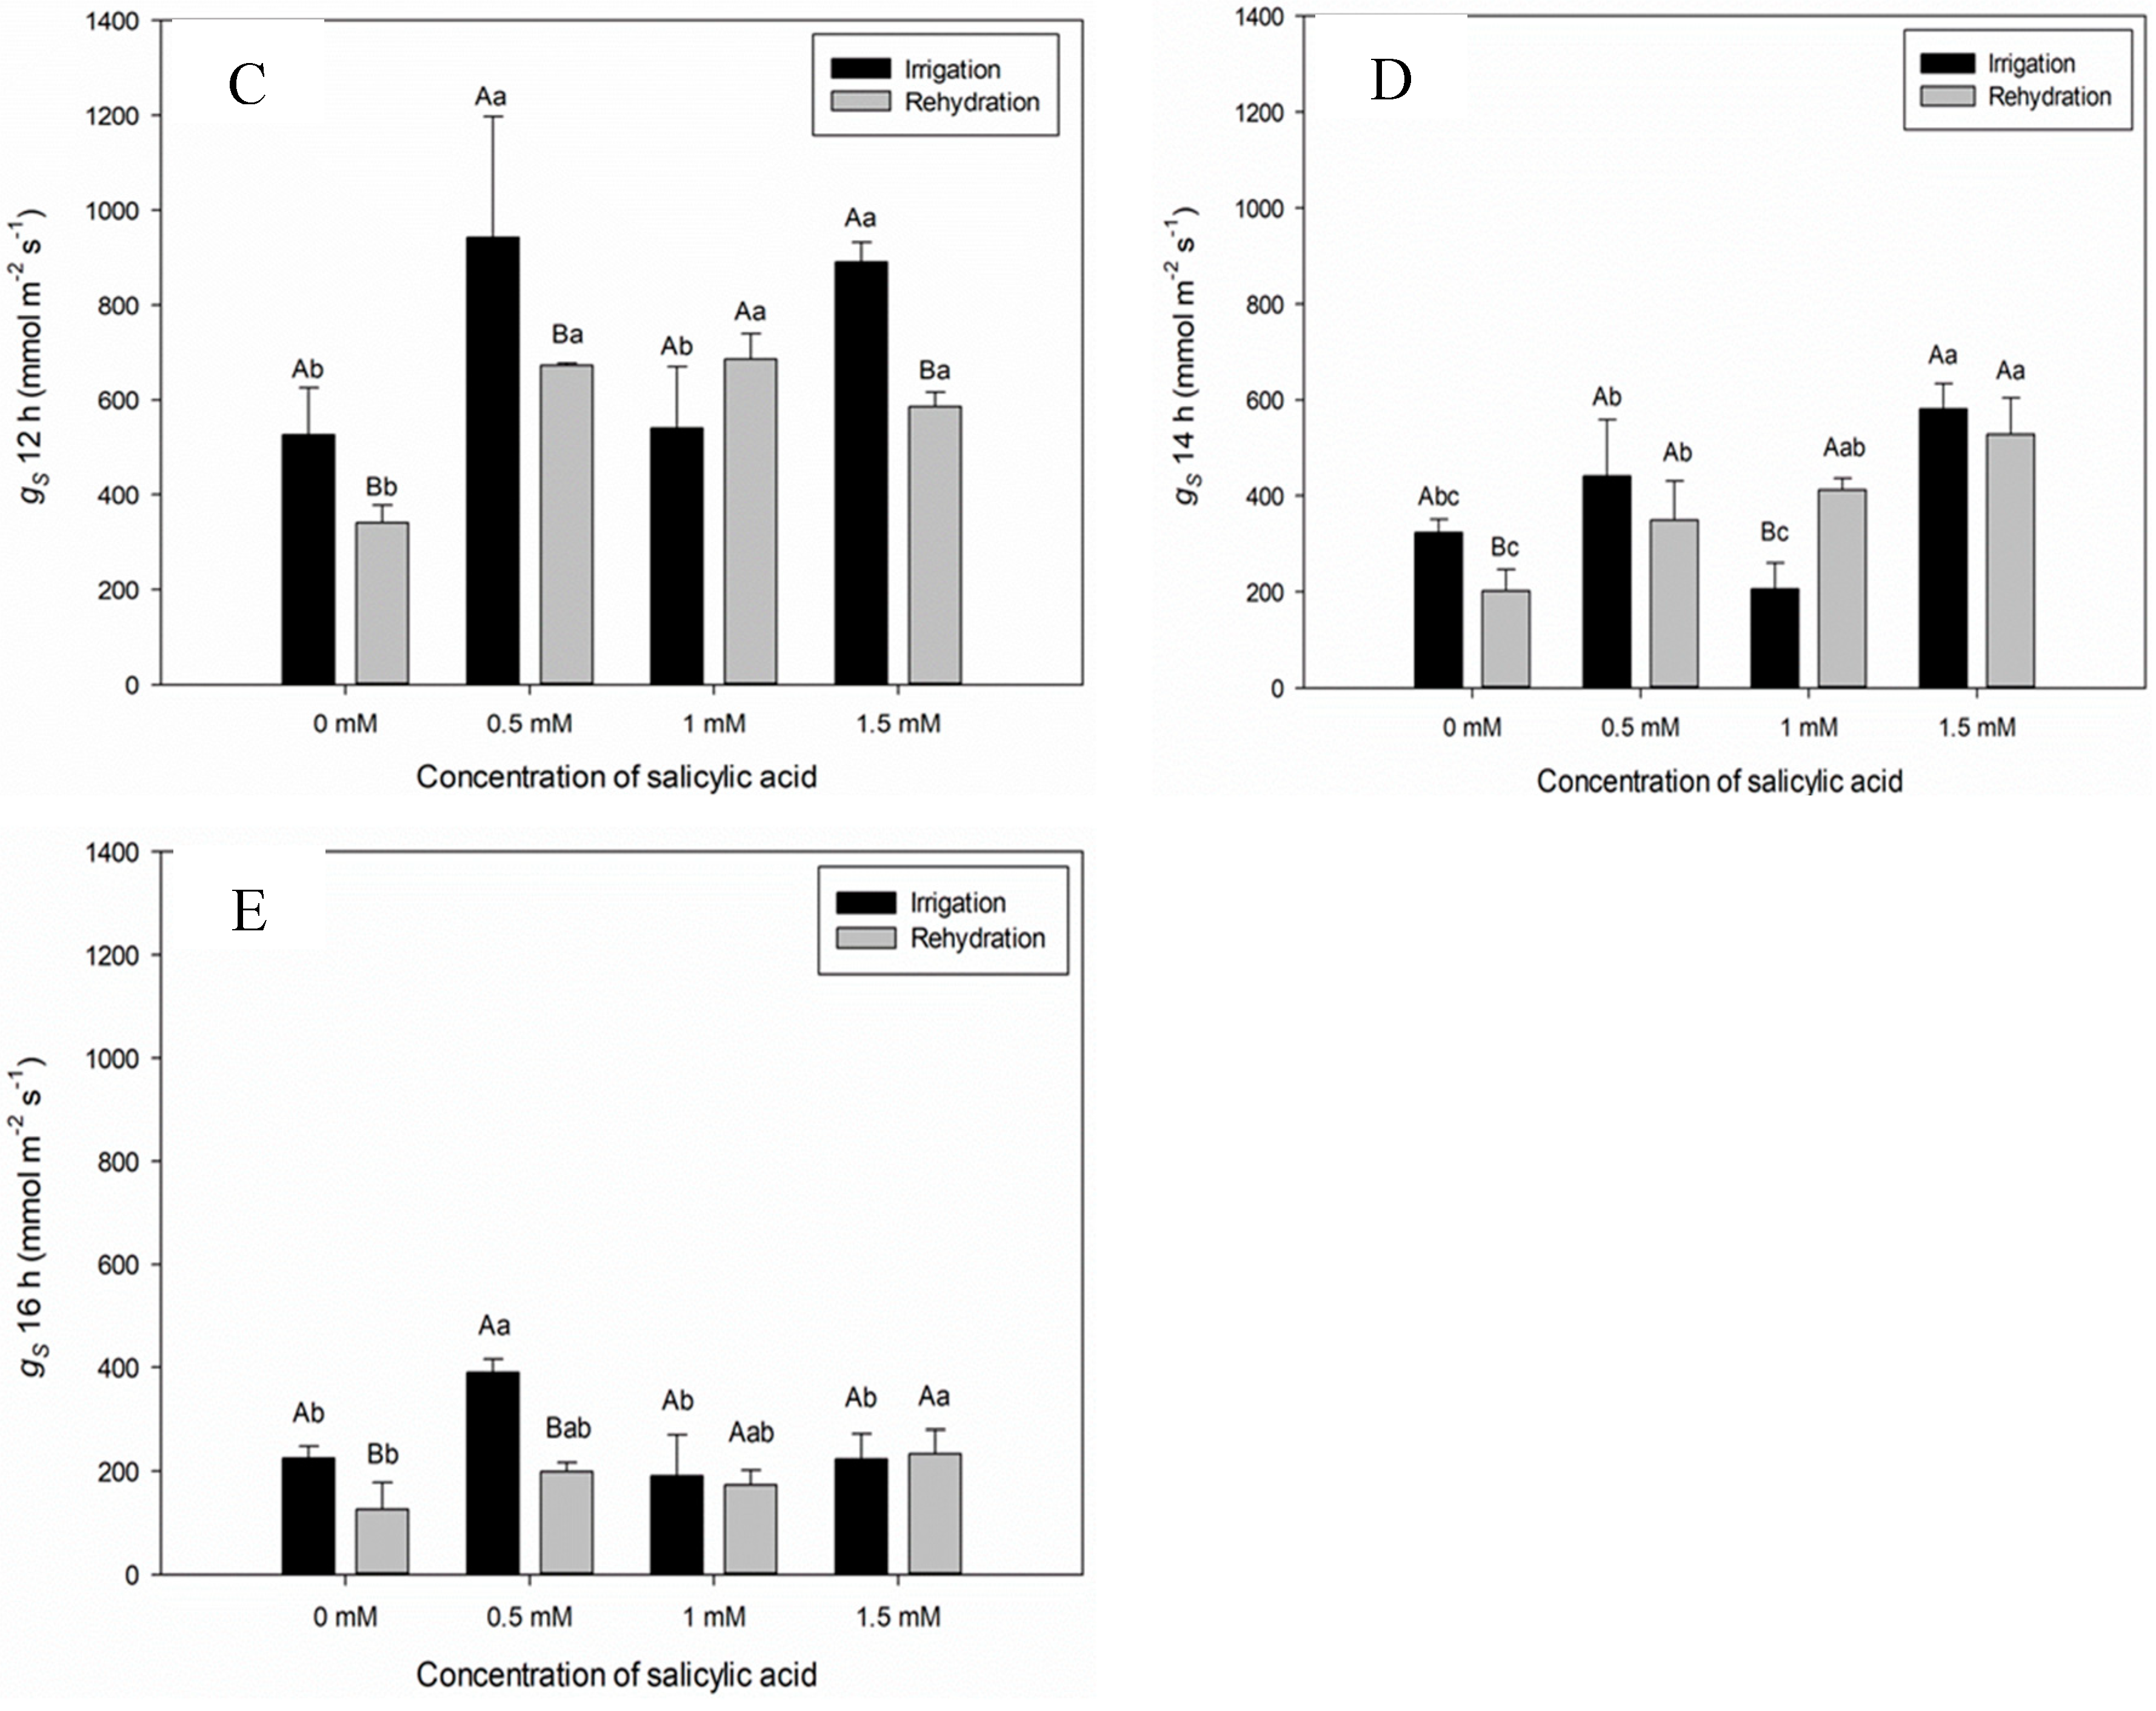
When analyzing the stomatal conductance (
gs) at seven DAAT, significant difference between plants of the Irrigation and Irrigation Suspension treatments was observed (
Figure 1D). Plants in the irrigated treatment showed higher conductance at 12:00 am (
Figure 1C). This behavior is due to the stomatal opening provided by light for CO
2 assimilation and photosynthesis. The
gs values of plants under irrigation suspension showed significant reduction in comparison with plants kept irrigated, since, under water deficit conditions, the low availability of water contributes to stomatal closure and reduction of
gs values (
Figure 1C and D).
The
gs values varied in plants submitted to different SA concentrations, both in the irrigated and in those submitted to water suspension, being able to recommend the lowest SA concentration (1 mM), which contributes to the increase in
gs values (
Figure 2 B,C and D).
The
gs values varied in plants submitted to different SA concentrations, and in the SA concentration of 1 mM, no statistical difference was verified between plants submitted to irrigation and rehydration treatments (
Figure 2B,D and E), being able to highlight the SA concentration of 1 mM under rehydration condition (
Figure 2B,C and D).
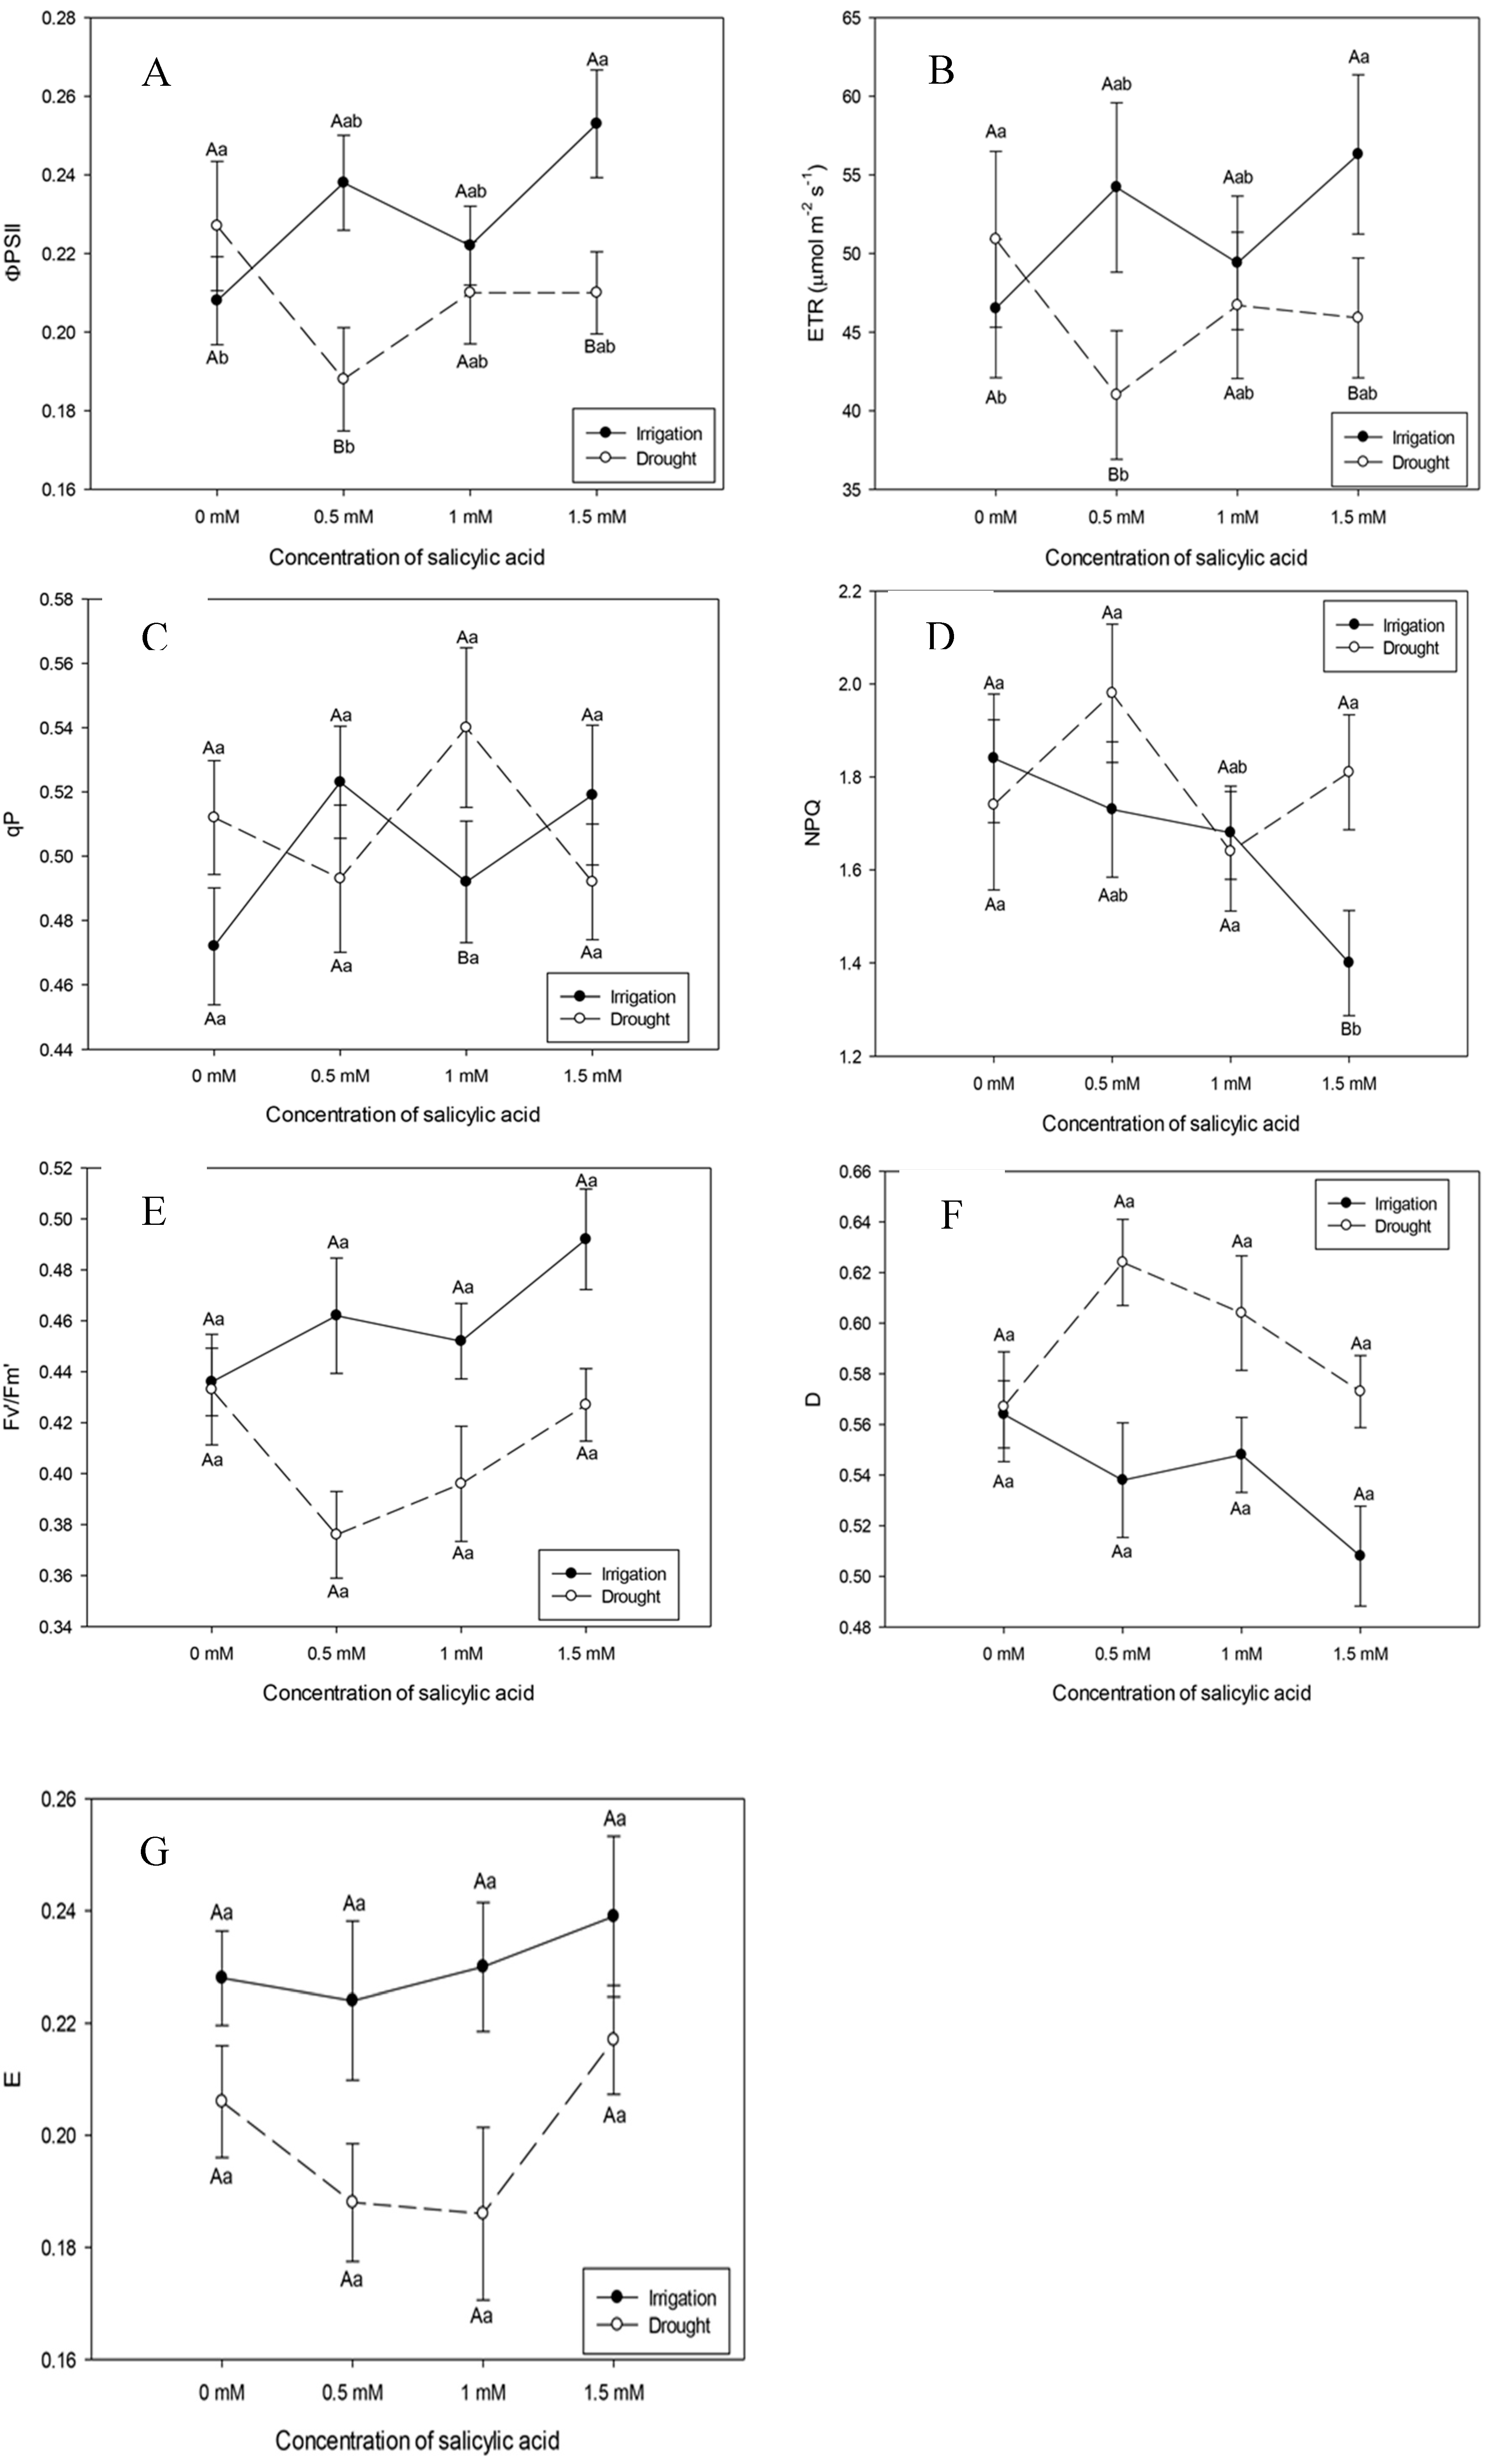
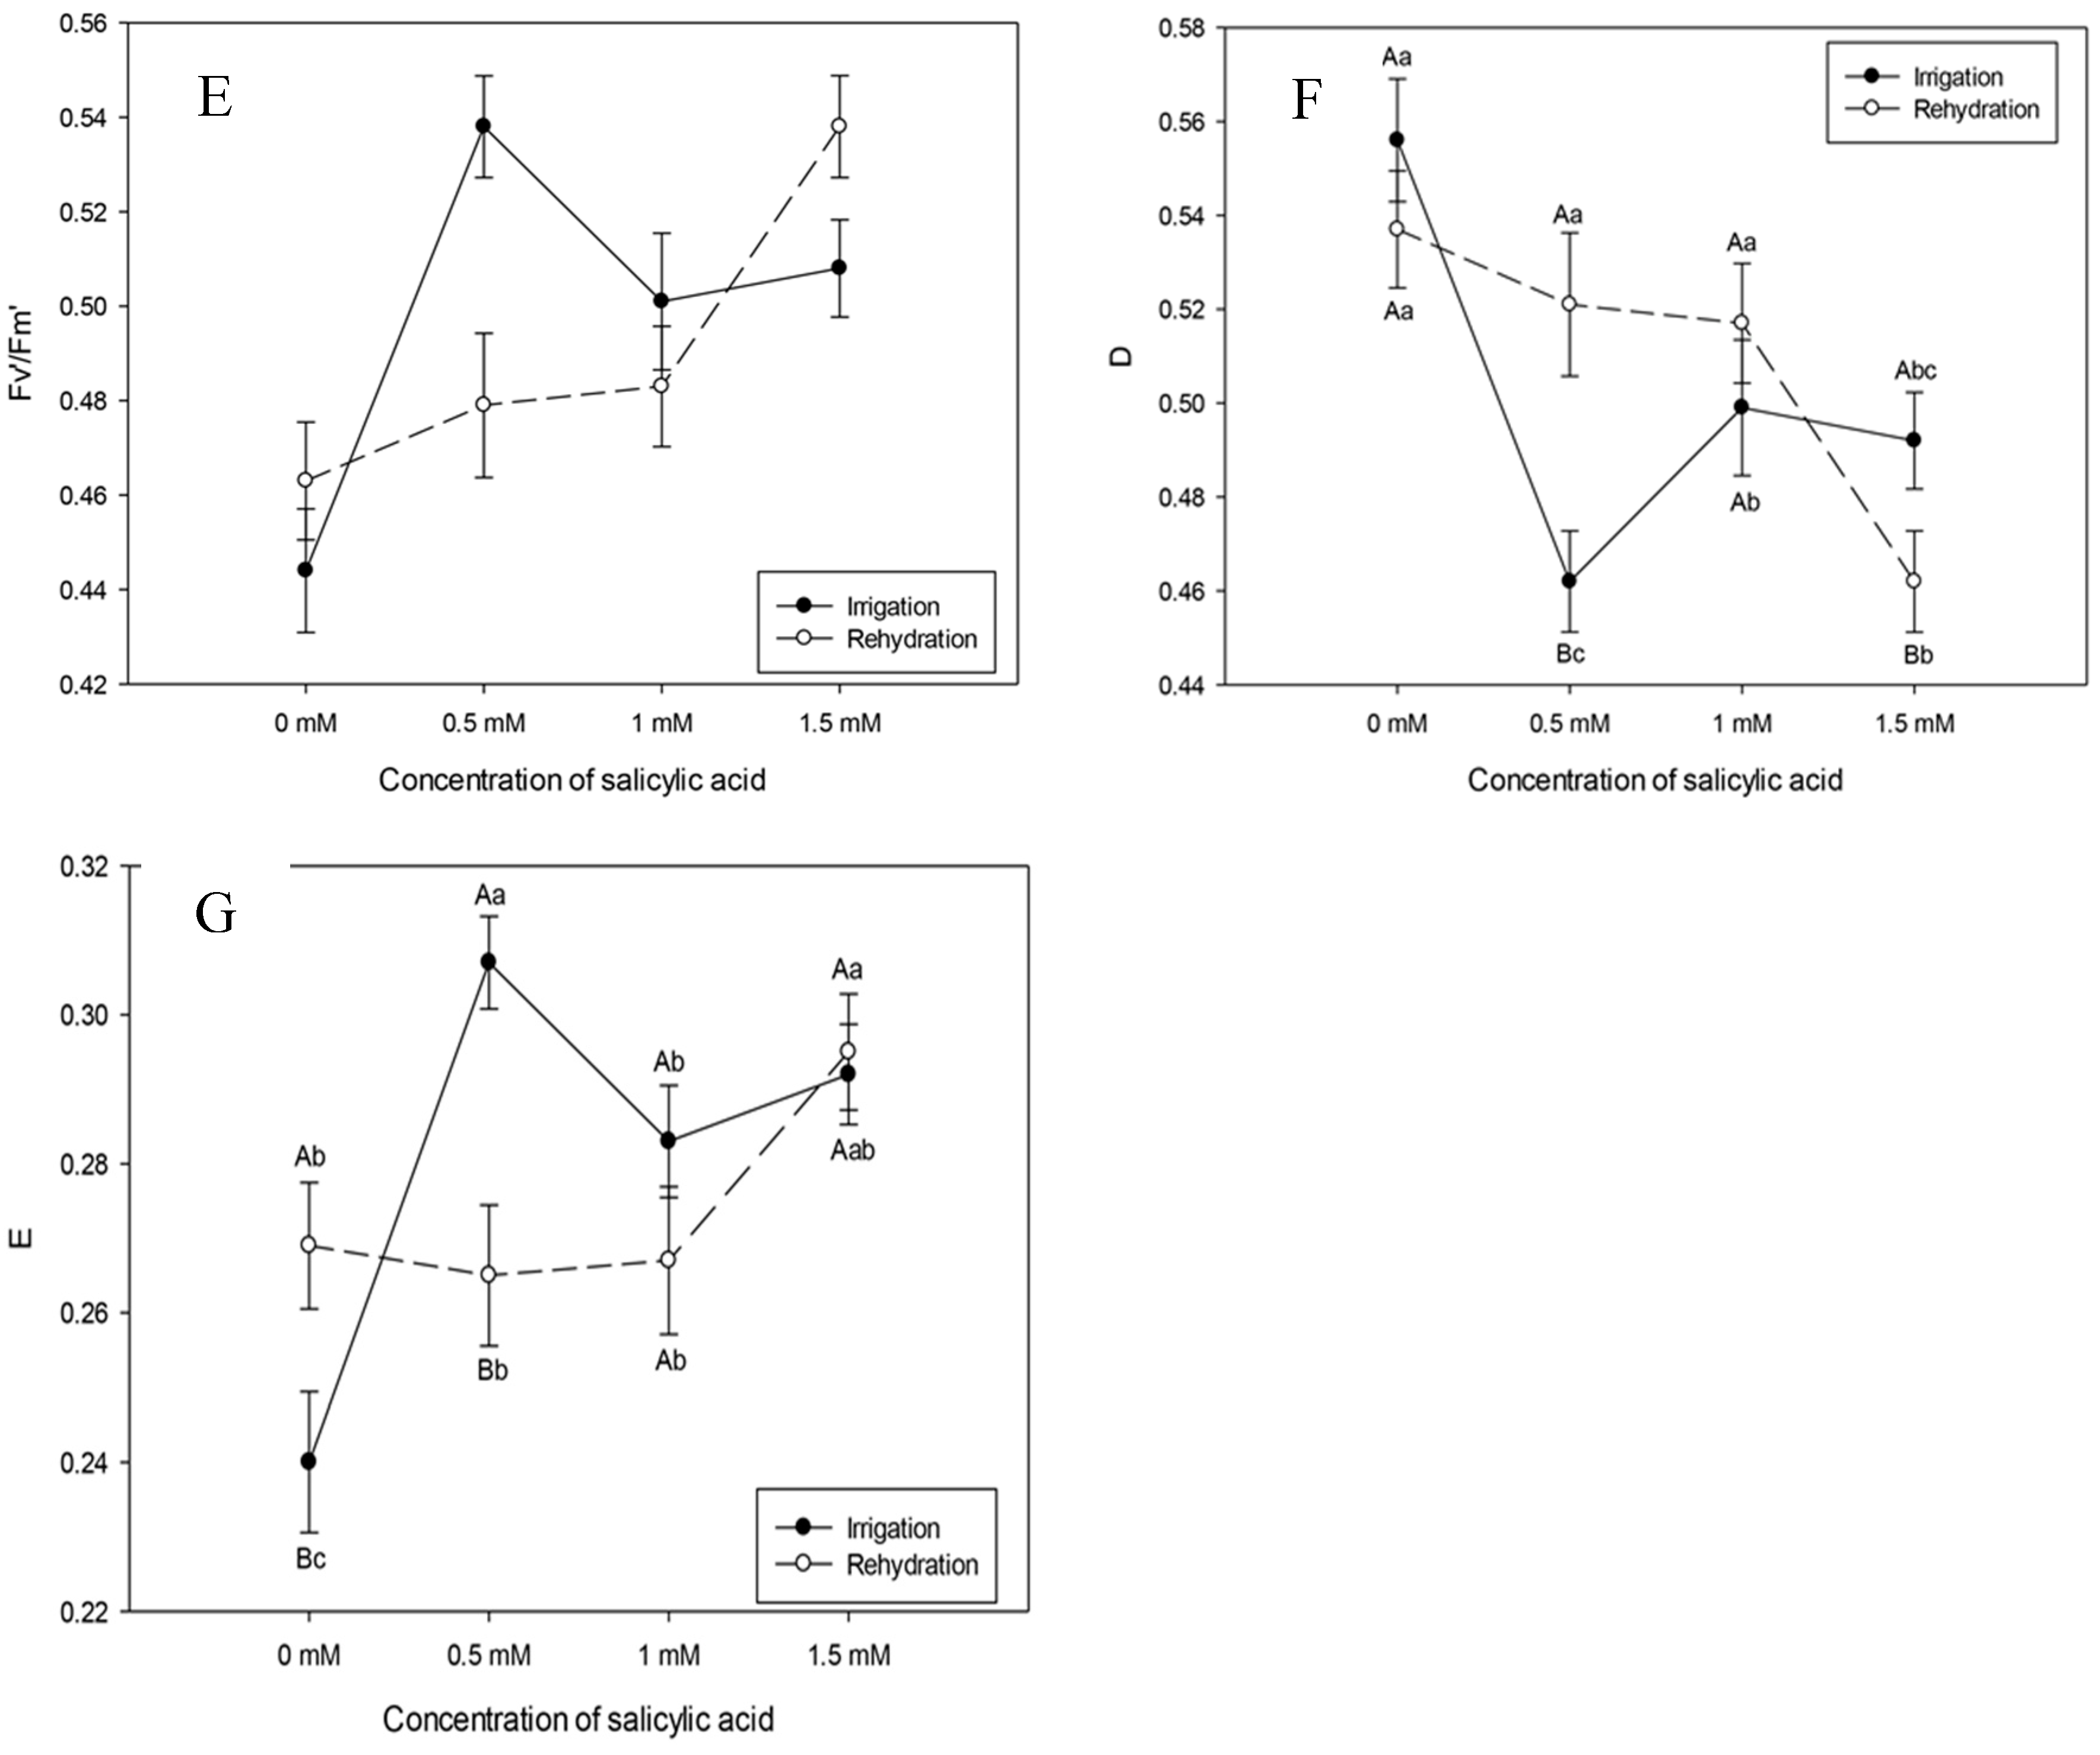
In general, effective quantum yield (ɸPSII), transport efficiency, maximum quantum yield (FV/FM), photochemical quenching (qP), non-photochemical quenching (NPQ), dissipation (D) and excess (E) of electrons of plants subjected to irrigation suspension showed the same behavior as plants irrigated at salicylic acid concentration of 1 mM (
Figure 3A,B,E,F and G).
The maximum quantum yield (FV/FM) in sweet pepper plants at seven DAAT did not differ in relation to the irrigated treatment and with irrigation suspension (
Figure 3E). The Fv/Fm ratio is used to indicate photoinhibitory damage in plants subjected to water stress. It was observed that the water suspension to which sweet pepper plants were subjected was not enough to cause photoinhibitory damage (
Figure 3E). The same behavior was observed for both dissipation (D) and excess (E) (
Figure 3F and G).
Non-photochemical quenching (NPQ) of plants submitted to irrigation suspension seven days after the application of treatments showed reduction in irrigated plants and with SA concentration (1.5 mM) resulting in less energy dissipation in the form of heat in plants under irrigation suspension (
Figure 3D).
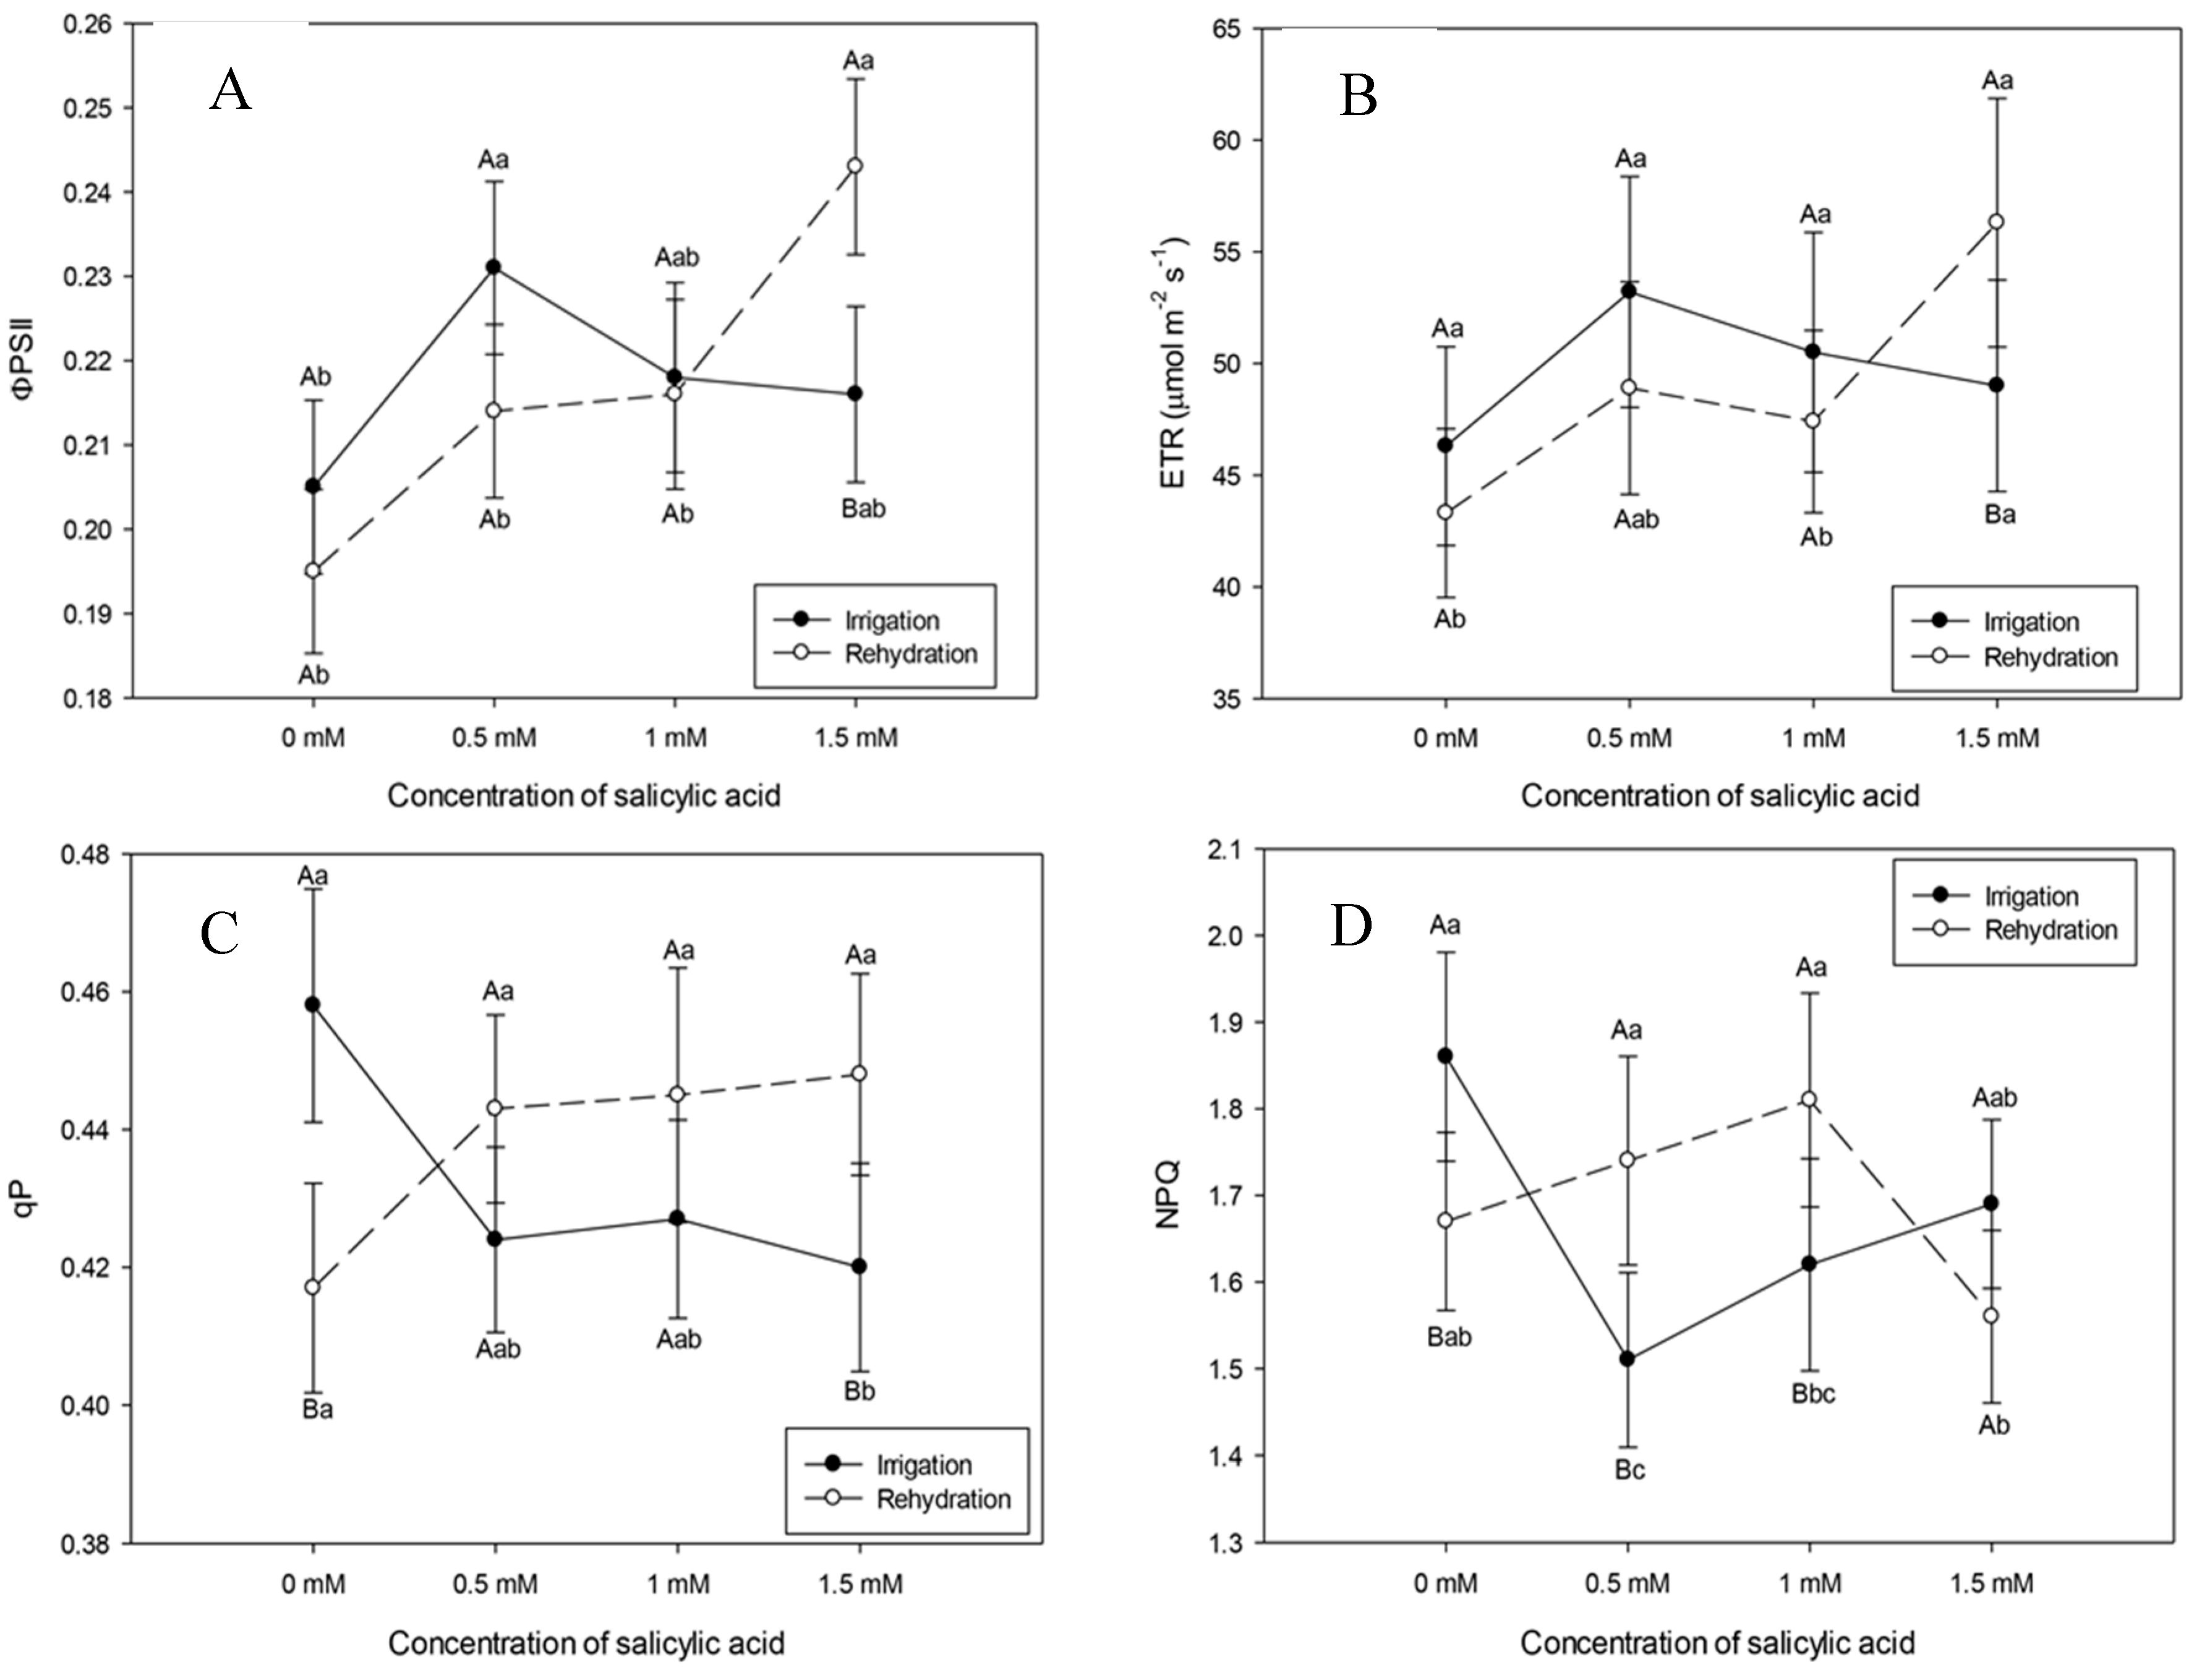
Plants subjected to irrigation suspension, rehydrated and at the highest SA concentration (1.5 mM) increased the effective quantum yield (ɸPSII) and the electron transport rate (ETR) (
Figure 4A and B).
Photochemical quenching (qP) showed reduction in irrigated plants submitted to the highest SA concentration (1.5 mM) (
Figure 4C). Even with this concentration, rehydrated plants increased qP (
Figure 4B). This result interferes with the photosynthetic carbon metabolism. Based on the results above, it could be inferred that the SA concentration of 1.5 mM helps to successfully complete the electron transport.
Irrigated plants showed reduction in non-photochemical quenching (NPQ), that is, decrease in energy dissipation in the form of heat with SA concentrations of 0.5 and 1 Mm (
Figure 4D).
There was no statistical difference in the maximum quantum yield between irrigated and rehydrated plants with values ranging, respectively, from 0.68 to 0.74, possibly demonstrating a non-stressful condition, since the FV/FM ratio is used as an indicator of stress conditions on the photosynthetic apparatus (
Figure 4E).
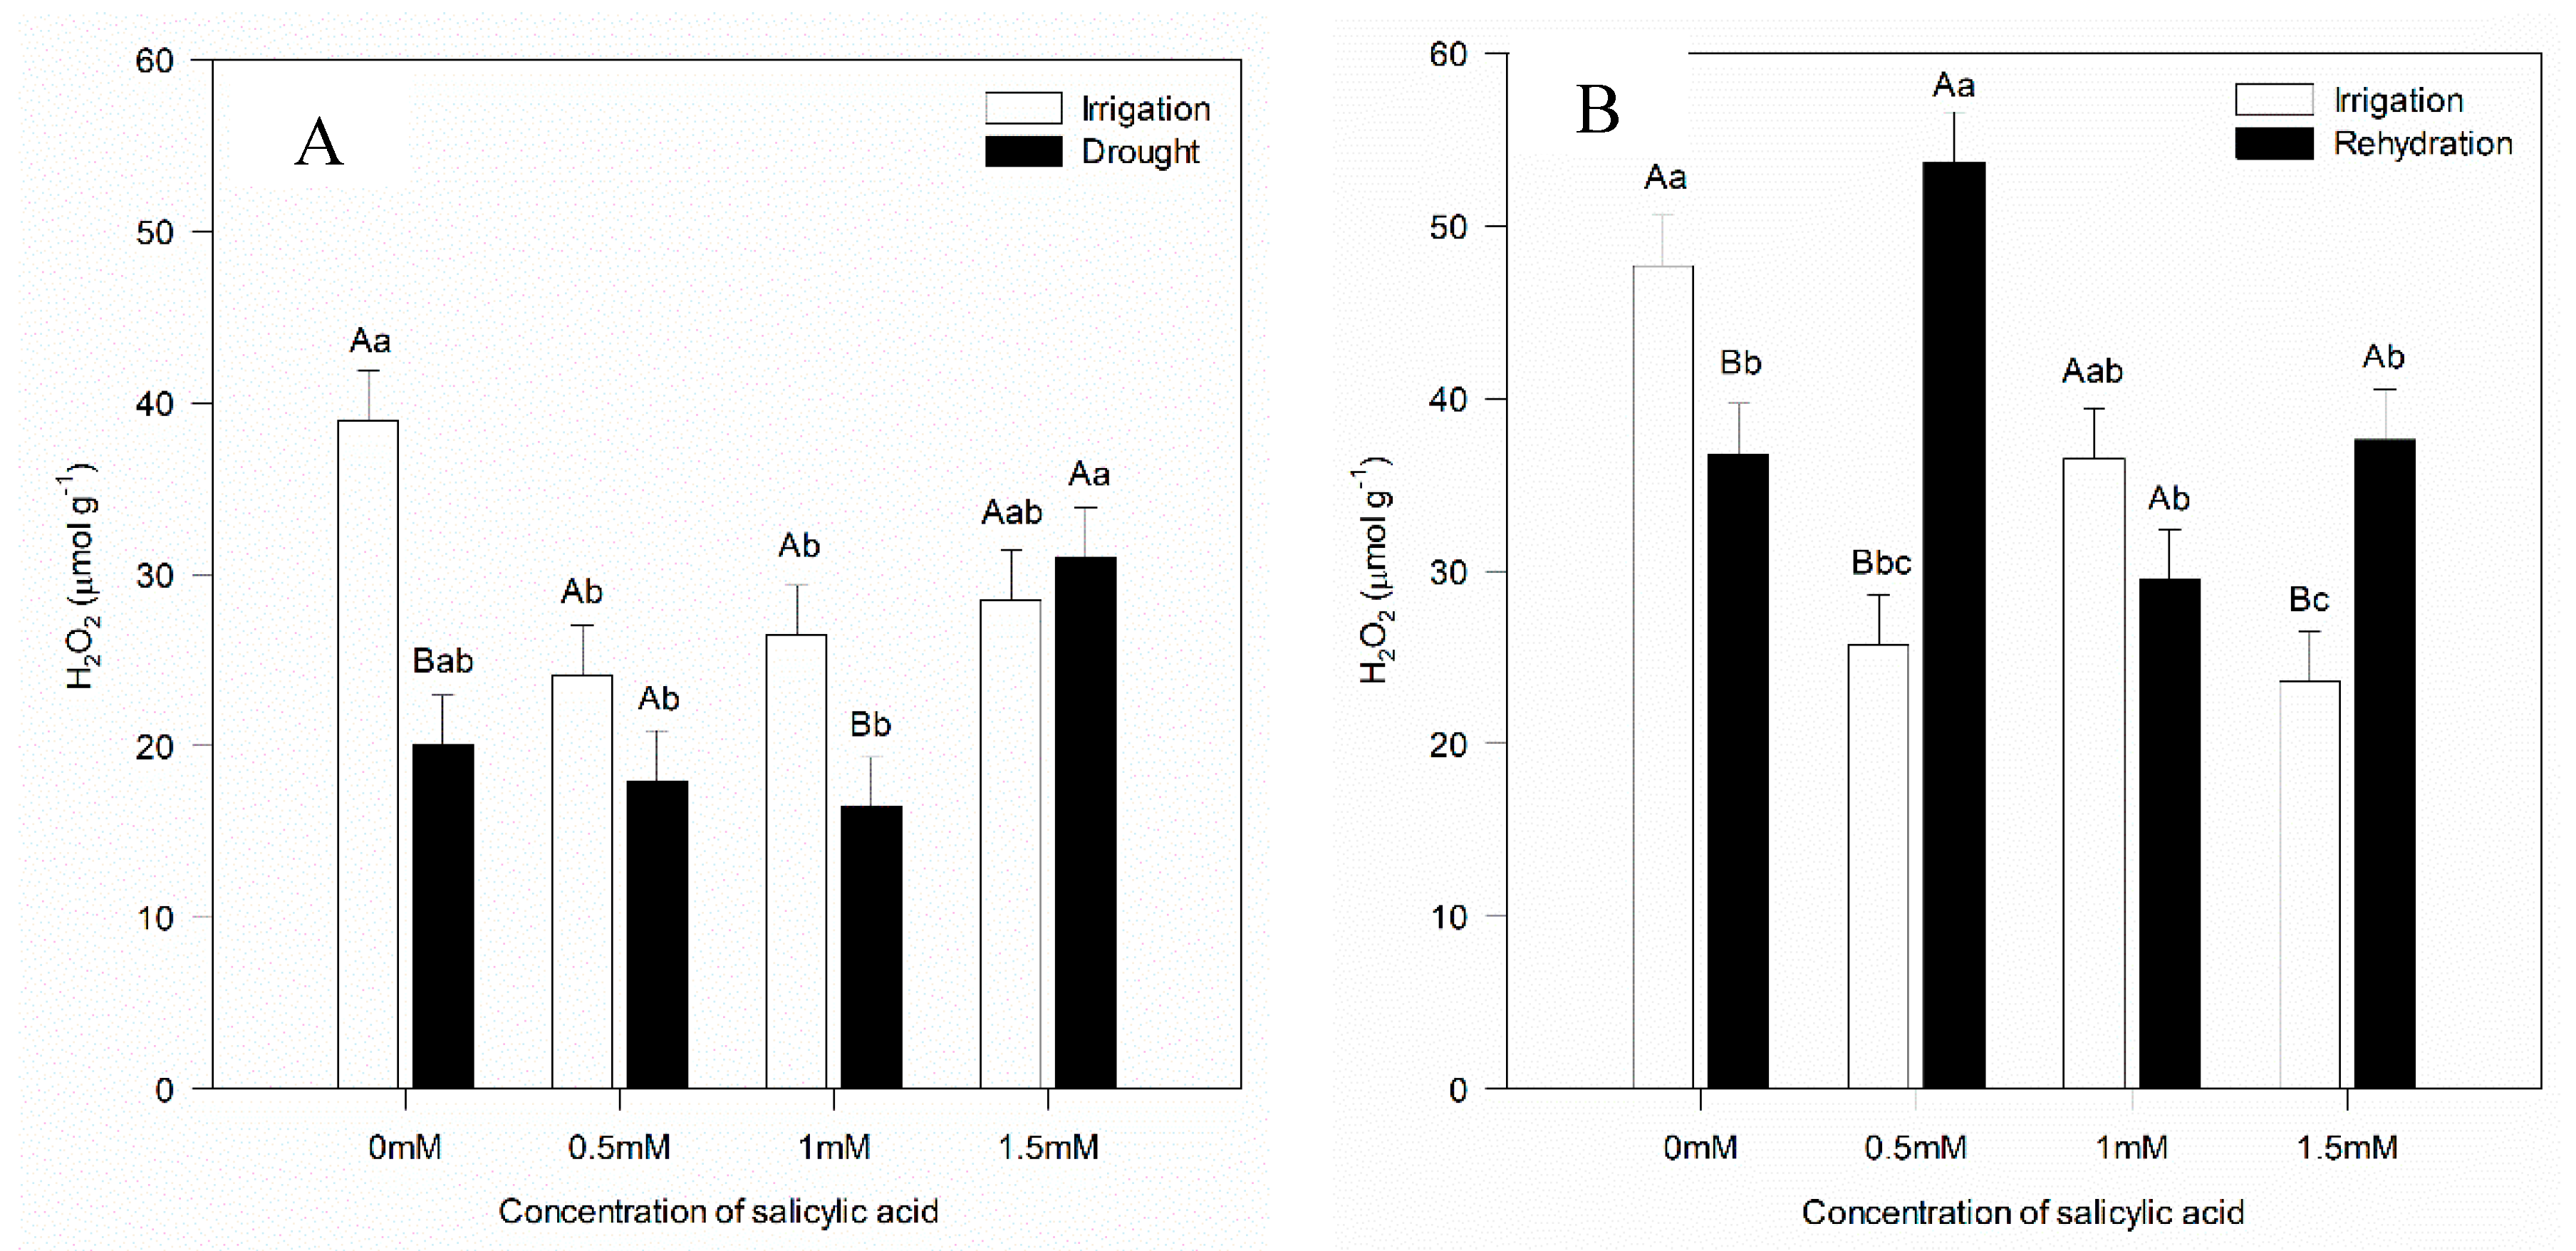
Figure 5A shows that plants without water deficit had higher H
2O
2 concentration in SA concentrations of 0 and 1 mM, while rehydrated plants showed higher H
2O
2 concentrations with SA concentrations of 0.5 and 1.5 mM (Figure 5B). SA application of 0.5 mM when applied exogenously acts by raising the level of reactive oxygen species under rehydration condition.
Figure 5.
Hydrogen peroxide concentrations seven and twelve days after the beginning of treatments. Black bars represent Irrigation treatment, white bars represent Rehydration treatment. Letters show the difference between treatments by the 5% Tukey's test. Values represent means ± standard deviation of 4 replicates. Capital letters compare means of water conditions and lowercase letters compare means of salicylic acid concentrations.
3. Discussion
The drop in the leaf moisture percentage from 74.2% to 70.2% at 12:00 pm and from 70.1% to 64.9% at 02:00 pm for plants under irrigation suspension reflected in the decrease of g
s values during these periods throughout the day (
Table 1,
Figure 1). In addition to suspending irrigation, environmental variation must be taken into account, which influences the water potential gradient between soil, plant and atmosphere. Thus, the lower water availability in the soil hinders its flow via the xylem, resulting in less water in leaves, especially at warmer times and with lower relative humidity, as observed between 12:00 am and 02:00 pm. Plants subjected to water deficit close their stomata to reduce water loss through transpiration. Sweet pepper plants kept with higher water potential in soil and leaves (Irrigation treatment) showed higher stomatal conductance values (
gs) when compared to those submitted to gradual increase in water stress (Irrigation Suspension treatment) (
Table 1,
Figure 1). Exogenous salicylic acid (SA) application acts as an important inducer in improving gas exchange indices, increasing
gs values, similarly to transpiration, reducing the internal CO
2 concentration, through the elevation of ribulose-1,5-bisphosphate carboxylase/oxygenase (RuBP), reflecting in lower water use efficiency [
29]. SA application at concentration of 0.5 mM contributes to the maintenance of
gs values in plants subjected to irrigation suspension (
Figure 1). Xu and Tian [
30] reported that SA acts as a secondary messenger involved in signal transduction in response to stress, inducing reactions that promote plant protection. Singh and Yasha [
31] reinforce that plants treated with SA generally have higher relative water content and higher activity of the ribulose-1,5-bisphosphate carboxylase/oxygenase enzyme.
Both the moisture percentage in leaves and the water potential did not differ between irrigated and rehydrated plants or those subjected to SA concentrations, demonstrating that the recovery of plant hydration does not depend on the use of the plant regulator (
Table 1). Non-application (0.0 mM) and the highest SA concentration (1.5 mM) reduced
gs values (
Figure 1). Probably, this concentration (1.5 mM) may have acted as a stressor. However, SA concentration equal to 1.0 mM contributed to the maintenance of
gs values in rehydrated plants similar to plants not subjected to stress (
Figure 2). As high SA concentrations (1.5 mM) can harm physiological processes, it is recommended the application of the plant regulator at low concentrations, which can promote the recovery of plants subjected to stress [
32,
33,
34]. Research shows that beneficial effects under stress conditions are possible at SA concentrations ranging from 0.05 to 0.5 mM [
35,
36]. Waseem
et al. [
37] reported that exogenous SA application can induce resistance to drought in wheat plants.
Although the beneficial effects of SA are described in literature, plant responses to the exogenous application of this resistance inducer are still controversial [
38,
39] and the authors reinforce that exogenous SA application can negatively influence the plant's defense processes, especially at high concentrations, as observed in the present research. Furthermore, the effective SA concentration strongly depends on the plant species, environmental conditions and stress level.
The pigment results revealed that the application of the highest SA concentration (1.5 mM) reduced chlorophyll
a and carotenoid contents, regardless of stress (
Table 2). SA application does not affect pigment production [
40]. However, this result is different from that obtained by Sayyari
et al. [
41], who observed that under drought conditions, photosynthetic pigments decreased considerably, while SA increased the carotenoid content in basil plants.
Under dry conditions, SA concentration of 1.5 mM increased the H
2O
2 content, in relation to the other concentrations (Figure 5A). In rehydration, higher H
2O
2 content was verified when SA concentration of 0.5 mM was applied (Figure 5B). Sahu
et al. [
42] observed that SA application (50 μM) in wheat plants did not change the H
2O
2 content. In the same study, the authors also observed that the highest SA concentration (1000 µM) increased the H
2O
2 level. Exogenous SA application acts as a potential inducer of the defense response, raising H
2O
2 levels in plants [
43], which was confirmed in the present study, in which plants not subjected to water stress had higher H
2O
2 concentrations than plants subjected to water deficit and those treated with 1 mM SA (Figure 5A). Increase in H
2O
2 content was also observed in the presence of SA concentration of 0.5 mM in plants submitted to drought and rehydration. Janda
et al. [
44] reinforce that SA can cause oxidative stress to plants, partly due to H
2O
2 accumulation.
In
Figure 3, it can be seen that the increase in SA concentrations resulted in decrease in maximum and effective quantum yields of PSII photochemistry and electron transport efficiency, respectively, Fv/Fm, ØPSII and ETR, in plants subjected to drought, corroborating results observed by Poo´r and Tari [
45] in tomato plants, in which SA application of 10
-3 M resulted in decrease in maximum and effective quantum yields of the PSII photochemistry, respectively, Fv/Fm and ɸPSII , and in the parameter of photochemical extinction in guard cells. However, in rehydrated plants, SA application increased Fv/Fm and ØPSII, demonstrating recovery of the photochemical apparatus (
Figure 4). Maximum quantum yield (FV/FM) is widely used to detect disturbances induced by stress in the photosynthetic apparatus [
46,
47].
Plants under dry conditions and rehydrated with SA application of 0.5 mM showed higher non-photochemical quenching (NPQ) values, demonstrating protection against damage resulting from water stress (
Figure 4). Janda
et al. [
48] found that tobacco plants that received SA application had limited energy dissipation capacity. Cao
et al. [
49] reinforce that NPQ contributed to protection against photodamage in tomato plants subjected to water stress.
It was also observed that plants subjected to drought and rehydrated with SA application of 0.5 mM showed greater photoprotective capacity (
Figure 4), acting as an important factor in mitigating the effects of water stress. In addition, this demonstrates that despite the increase in H
2O
2 levels, regardless of treatment and concentration, respectively, plants have defense capacity under drought and rehydration conditions (Figure 5,
Figure 3 and
Figure 4).
Exogenous SA application increases the tolerance of plants to abiotic stress, including water stress [
50]. War
et al. [
51] observed that SA application of 2.0 mM causes phytotoxicity and reduced peroxidase activity. However, the authors suggest SA concentration of 1.5 mM as inducer of plant defense mechanisms. The research managed to define the best management for the use of SA and should effectively contribute to reducing drought damage without risk to the environment and at a relatively low cost for the dose used and will have a strong impact on the sustainable cultivation of this vegetable that is grown in different regions of the world. The future perspective is that new studies will be carried out at the metabolomics level to better understand the genes that are activated by SA in improving the drought tolerance of crops.
4. Material and Methods
4.1. Experiment location
The experiment was carried out in greenhouse at the São Paulo State University, Botucatu, Brazil. The average temperature of the hottest month is greater than 22.0°C and that of the coldest month is 17.5°C, with average annual temperature of 21°C.
4.2. Environmental conditions
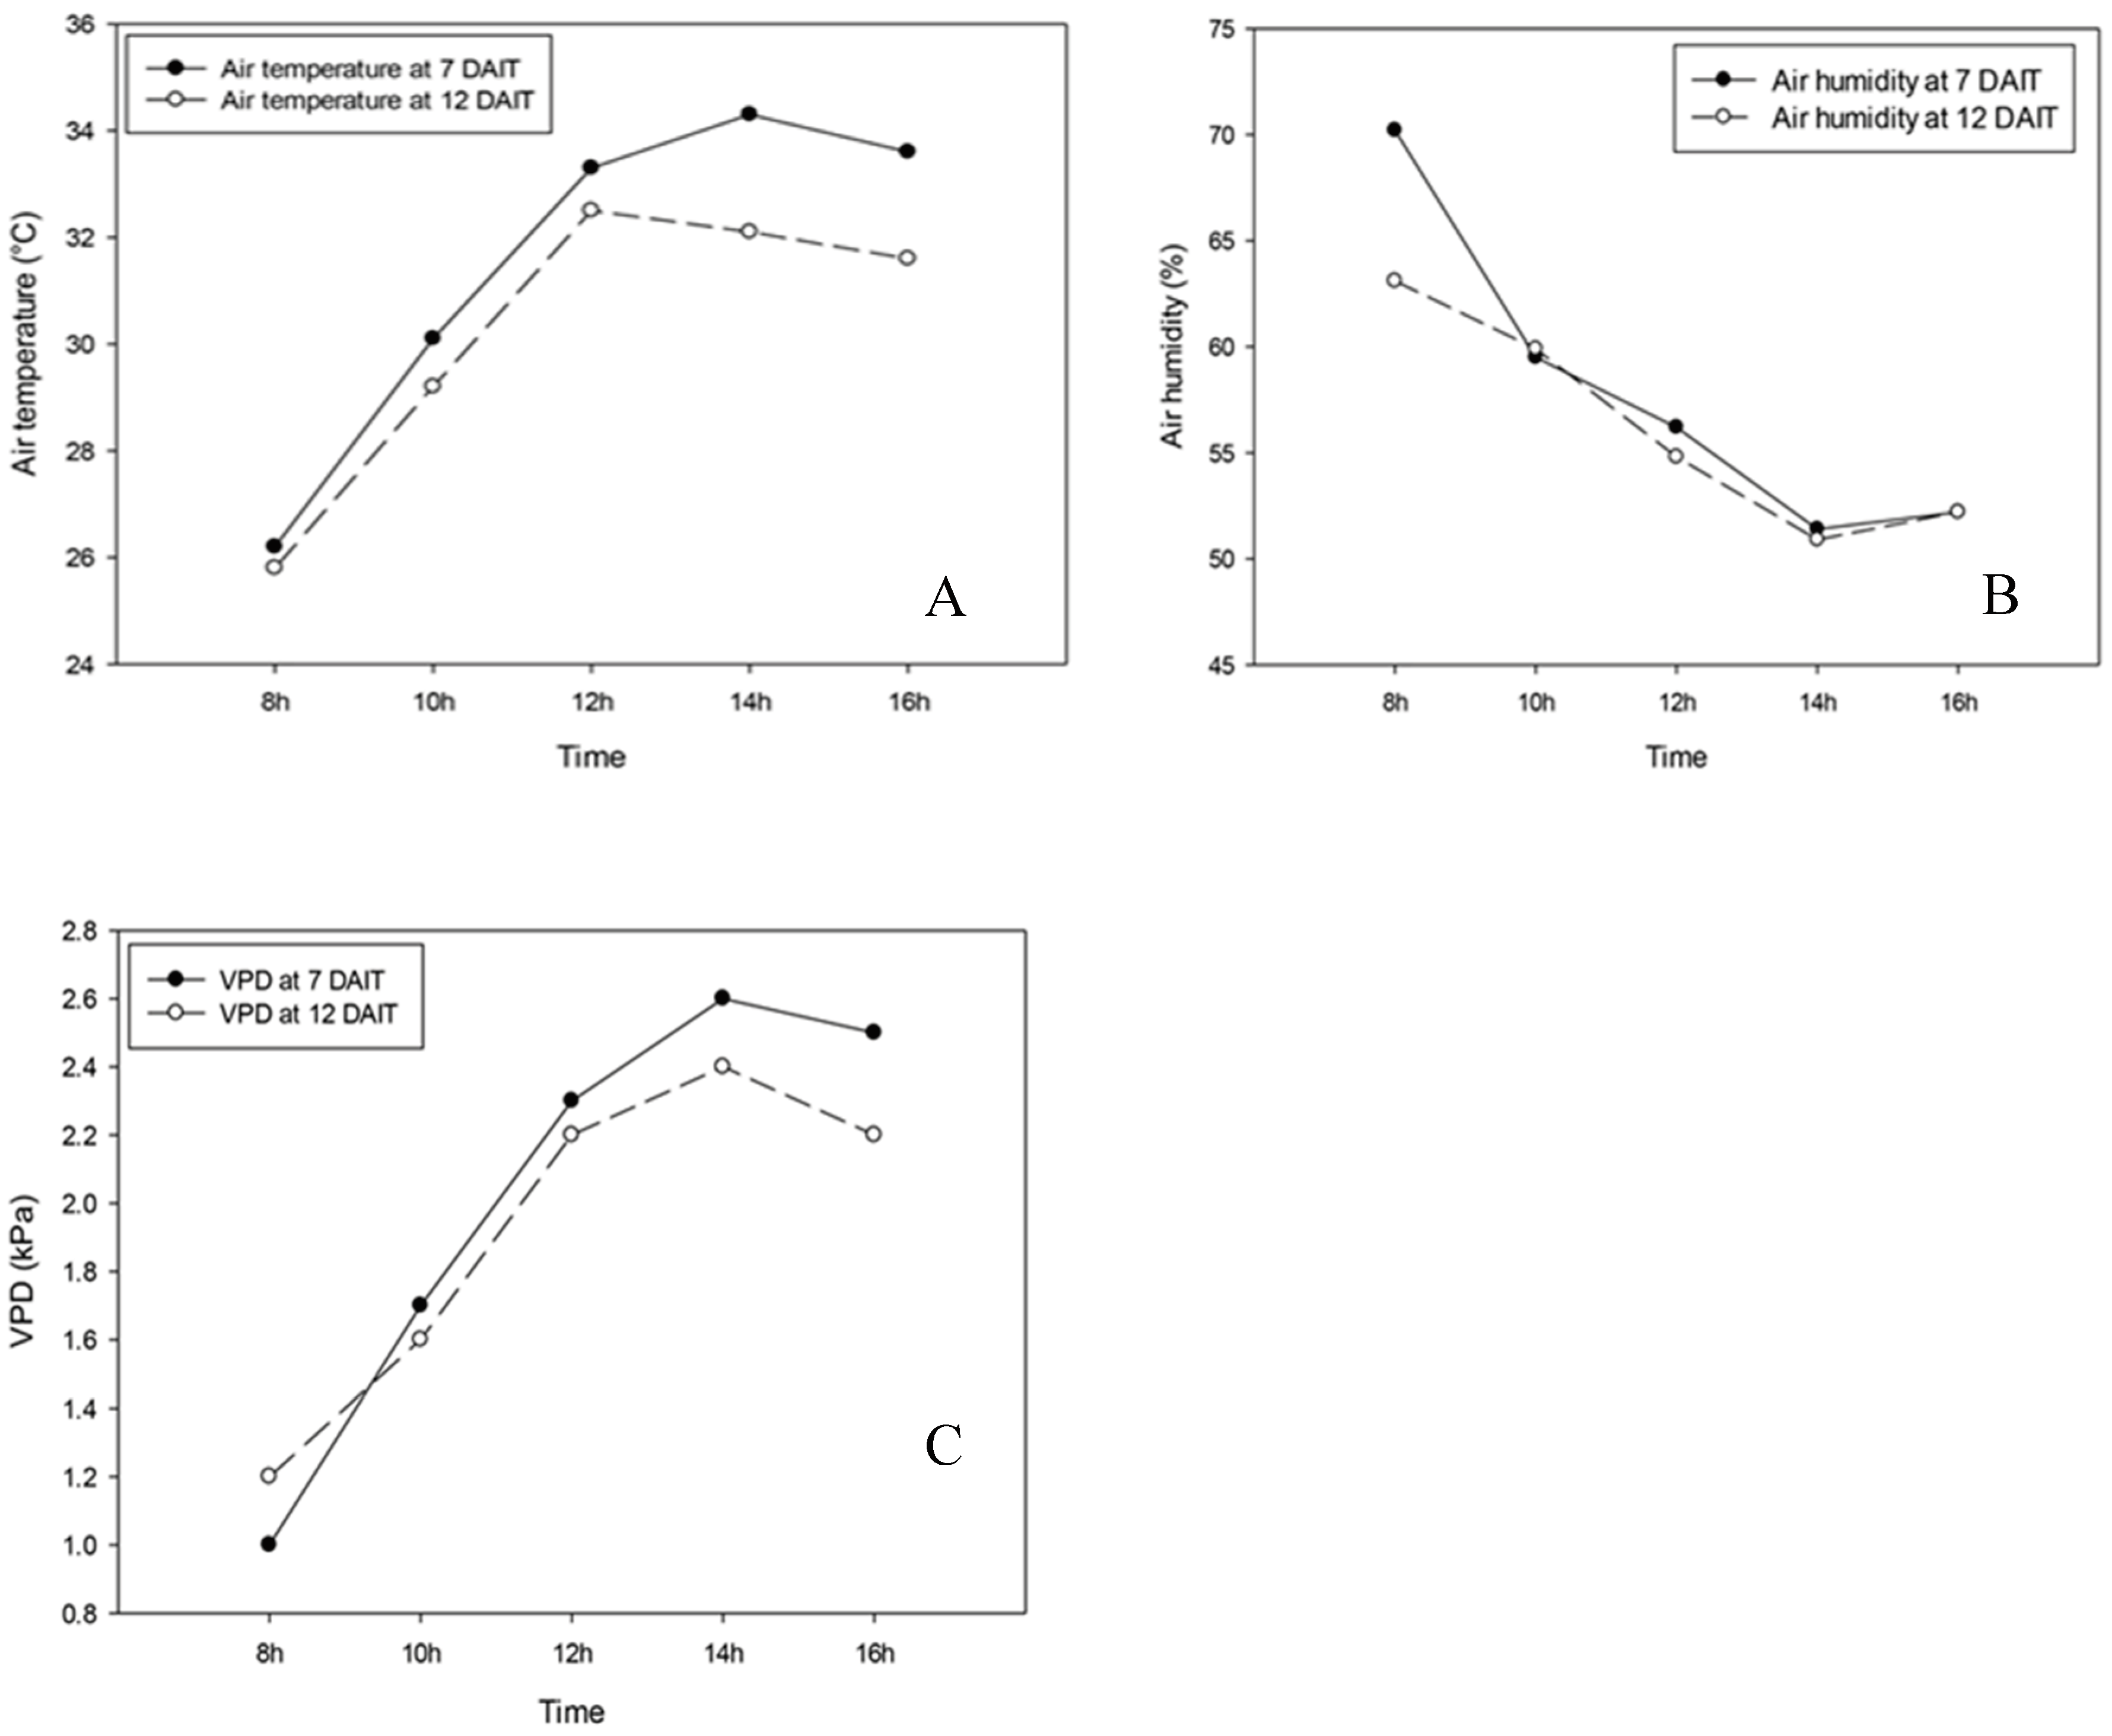
Temperature, relative humidity and air vapor pressure deficit measured using porometer (Decagon Devices) between 8:00 am and 4:00 pm are shown in Figure 5, and correspond to the averages of forty-eight readings performed at 7 am and 4 pm, 22 days after application of treatments on sweet pepper seedlings with water regime and salicylic acid (SA) variation.
Figure 5.
Temperature, relative humidity and air vapor pressure deficit. Average of 48 readings performed 7 and 22 days after application of treatments with water regime and salicylic acid variation.
Figure 5.
Temperature, relative humidity and air vapor pressure deficit. Average of 48 readings performed 7 and 22 days after application of treatments with water regime and salicylic acid variation.
4.3. Driving seedlings
The sowing of hybrid ‘Melina’ bell pepper (
Capsicum annum L.) was carried out in 128-cell polystyrene trays and after 45 days of emergence, seedlings with 8 cm in height and six pairs of definitive leaves were transplanted to plastic bags with volume of 400 mL, containing soil as substrate, with the following chemical characteristics: pH: 5.8; P: 84.0 mg dm
-3; K: 1.9 mmolc dm
-3; Ca: 21 mmolc dm
-3; Mg: 7.0 mmolc dm
-3; Al
3+: 0.8mmolc dm
-3; organic matter: 12 g dm
-3; H
++Al
3+: 13.0 mmolc dm
-3; S: 2.0 mg dm
-3; B: 0.27 mg dm
-3; Cu: 7.0 mg dm
-3; Fe: 54.0 mg dm
-3; Mn: 6.7 mg dm
-3; Zn: 3.5 mg dm
-3; SB: 30.0; CTC: 42.0 mmolc dm
-3; V: 70%. Daily irrigation was carried out for 13 days, keeping seedlings in plastic bags at field capacity. For this purpose, all bags were irrigated to maximum water holding capacity (100%) and kept without irrigation overnight to release excess water. During this period, the surfaces of bags were sealed with aluminum foil to prevent evaporation. The following morning, bags were weighed and their masses were used at the maximum water holding capacity (100%). The weighing of bags (g) throughout the experiment compared with their masses at maximum holding capacity (100%) was used to calculate the water content in the substrate (CAS) using the following formula: CAS=(MTreatment/M100% )*100, according to Varone et al. [
52]. This calculation allowed controlling and replenishing water to keep bags containing plants at their maximum holding capacity, which procedure was daily performed.
After 13 days of acclimatization, seedlings were subjected to treatments with water regime and SA variations.
4.4. Water Regime
Seedlings were subjected to three water regimes and, therefore, they were maintained at field capacity, in water deficit and in water deficit and rehydration. Changes in field capacity were monitored according to Thameur
et al. [
53]. Seedlings subjected to water deficit were not irrigated until leaves showed signs of wilting, when they showed lower water potential, stomatal conductance and water percentage. Water deficit was maintained for seven days before seedling evaluation. Then, rehydration was performed and seedlings were evaluated after four days at field capacity.
4.5. Salicylic acid
Seedlings were also subjected to SA variation. Thus, they were cultivated without water stress, drying and rehydration and without the addition of regulator (0) and with addition of regulator at concentrations of 0.5, 1 and 1.5 mM. SA was applied twice, half at 13 days after transplanting seedlings into plastic bags and the other, seven days after the first application.
4.6. Experimental design
Seedlings were cultivated in treatments with different water regimes and SA variation. The experimental design was randomized blocks, in a 3x4 factorial scheme, three water regimes and four SA concentrations, with 20 plants per treatment and four replicates.
4.7. Chlorophyll a, b and total carotenoid content
To determine the chlorophyll (
a and
b) and total carotenoid content, leaf discs from seedlings were collected and placed in test tubes containing 1mL of dimethylformamide reagent. Test tubes were covered with aluminum foil and stored in refrigeration at 4°C for 24 hours, after which the entire solution volume was transferred to a cuvette and reading was performed in spectrophotometer at wavelengths of 480, 646, 8 and 663.8 nm for determination of chlorophyll
a and
b and total carotenoid content. Pigments were determined according to Lee
et al. [
54].
Chlorophyll a: 12 x Absorbance at 663.8 nm – 3.11 x Absorbance at 646.8 nm.
Chlorophyll b: 20.78 x Absorbance at 646.8 nm – 4.88 x Absorbance at 663.8 nm.
Total carotenoids: (1000 x Absorbance a 480 – 1.12 x chlorophyll a – 34.07 x chlorophyll b)/245.
4.8. Leaf water potential (Ψw)
Leaf water potential (Ψw) was determined between 5:00 am and 6:00 am, using Scholander pressure pump [
55] PMS Instrument, model 600. Seedling stem fragments were separated and immediately placed in the pressure chamber, whose measurement was performed after immediate pressure application and liquid exudation [
56].
4.9. Stomatal conductance
To evaluate stomatal conductance (mmol. m-2 s-1), Porometer (Decagon Devices) was used. Readings were performed on completely expanded leaves of the middle part of seedlings at 8:00 am, 10:00 am, 12:00 pm, 2:00 pm and 4:00 pm.
4.10. Chlorophyll a fluorescence
Fluorescence was evaluated using pulse-modulated fluorometer (JUNIOR-PAM, Walz
®). Evaluations were performed at 5:00 am, 12:00 pm and 5:00 pm. With the exception of evaluations carried out at 5:00 am, leaves were acclimatized for a period of 30 minutes in the dark with aluminum foil. Then, saturation pulse of 10000 μmol m
-2s
-1 of photosynthetically active photon flux density (DFFFA) with 0.6s was applied to obtain Fm (maximum dark-adapted fluorescence) and Fm' (maximum light-adapted fluorescence). In addition to maximum light- and dark-adapted leaf fluorescence, Fo (minimum dark-adapted fluorescence) and Fo' (minimum light-adapted fluorescence) were also obtained. Between each saturation pulse, actinic light pulse of 1150 μmol m
-2 s
-1 of DFFFA of 15 seconds duration was performed. Using Fm, Fo, Fm' and Fo', maximum quantum yield (Fv/Fm) was calculated, which reflects the ability of PSII to oxido-reduce the primary QA acceptor (quinone A) [
57], yield effective quantum (ɸPSII), which corresponds to the energy fraction that is photochemically converted into photosystem II (PSII) [
58], photochemical quenching (qP), which reflects the photosynthetic carbon metabolism [
59], non-photochemical quenching (NPQ), which corresponds to photoprotection mechanisms [
60], electron transport rate, which corresponds to the transport of electrons between photosystems, considering that 84% of light is absorbed by chlorophyll, with 50% of photons activating photosystem II chlorophyll and 50% photosystem I [
61]. Fm, Fo measurements and Fv/Fm, ɸPSII, qP, ETR and NPQ determinations were represented by the mean of two leaves.
4.11. Determination of the hydrogen peroxide (H2O2) content
To determine the hydrogen peroxide (H
2O
2) content, the methodology by Alexieva
et al. [
62] was adopted. Samples of 0.1 - 0.25 g were homogenized in liquid nitrogen and 1mL of TCA 0.1% was added followed by vortexing. Subsequently, samples were centrifuged at 12,000 g for 15 minutes at 4°C.
For the reaction, 0.5 mL of extract + 0.5 mL of 0.1 M Phosphate Buffer (pH 7.0) + 2.0 mL of 1 M KI were used, with extract and reaction buffers kept in the dark for 1 hour. Readings were performed in spectrophotometer at 390 nm and the H2O2 concentration was calculated considering the curve (0-100 µM), measuring the ratio between H2O2 content and the dry mass of samples.
4.12. Statistical analysis
Physiological and biochemical variables were submitted to analysis of variance and means compared by the Tukey test at 5% significance level [
63].
5. Conclusions
Therefore, exogenous salicylic acid (SA) application minimizes the effects of water stress, especially in plants subjected to drought followed by rehydration.
In general, the lowest SA concentration allowed the maintenance of mechanisms in plants subjected to drought and recovery of rehydrated plants, evidenced by stomatal conductance, effective quantum yield, excess energy dissipation and maximum quantum yield data, in addition to minimizing possible damage of membranes.
Thus, photosynthetic pigments, stomatal conductance and fluorescence provide information for further studies in the elucidation of mechanisms of plants when subjected to drought followed by exogenous SA application and rehydration; above all, antioxidant system responses and membrane damage. SA can be more safely adopted as a technology in arid and semiarid regions, especially when applied with irrigation water.
Author Contributions
Conceptualization, F.C.d.M.G. and L.P.B.M.; methodology, L.P.B.M. and C.V.C.; validation, E.O.O., R.d.M.P. and C.S.F.B., formal analysis, L.P.B.M.; investigation, F.C.d.M.G., L.P.B.M. and N.d.S.P.; data curation, F.C.d.M.G.; writing-original draft preparation, F.C.d.M.G.; L.P.B.M. and C.V.C.; writing-review and editing, E.O.O., R.d.M.P., and C.S.F.B.; visualization, F.C.d.M.G., C.V.C., E.O.O., R.d.M.P. and C.S.F.B.; project administration, F.C.d.M.G., C.V.C. and C.S.F.B.; term, C.S.F.B., resources, L.F.R.d.A., C.S.F.B. and J.D.R.; supervision, C.S.F.B. All authors have read and agreed to the published version of the manuscript.
Figure 1.
Stomatal conductance (gs) over time (8, 10, 12, 14 and 16 h) for seven days after the beginning of treatments. Black bars represent Irrigation treatment, white bars represent Irrigation without treatment. Letters show difference between treatments, by the 5%Tukey's test. Values represent means ± standard deviation of 4 replicates. Capital letters compare means of water conditions and lowercase letters compare means of salicylic acid concentrations.
Figure 2.
Stomatal conductance (gs) over time (8, 10, 12, 14 and 16 h) during twelve days after the beginning of treatments. Black bars represent Irrigation treatment, white bars represent Rehydration treatment. Letters show the difference between treatments, by the 5%Tukey's test. Values represent means ± standard deviation of 4 replicates. Capital letters compare means of water conditions and lowercase letters compare means of salicylic acid concentrations.
Figure 3.
- Effective quantum yield (ɸPSII), electron transport efficiency (ETR), maximum quantum yield (FV/FM), photochemical quenching (qP), non-photochemical quenching (NPQ), dissipation (D) and excess (E) seven days after the beginning of treatments. Black bars represent Irrigation treatment, white bars represent Rehydration treatment. Letters show the difference between treatments, by the 5% Tukey's test. Values represent means ± standard deviation of 4 replicates. Capital letters compare means of water conditions and lowercase letters compare means of salicylic acid concentrations.
Figure 4.
Effective quantum yield (ɸPSII), electron transport efficiency (ETR), maximum quantum yield (FV/FM), photochemical quenching (qP), non-photochemical quenching (NPQ), dissipation (D) and excess (E) twelve days after the beginning of treatments. Black bars represent Irrigation treatment, white bars represent Rehydration treatment. Letters show the difference between treatments by the 5%Tukey's test. Values represent means ± standard deviation of 4 replicates. Capital letters compare means of water conditions and lowercase letters compare means of salicylic acid concentrations.
Table 1.
Leaf moisture percentage throughout the day in the Irrigated and Dry treatments, at 7 days after application of treatments (DAAT) and at 12 DAAT days after application of rehydration. Two-way ANOVA (two water conditions x four SA-salicylic acid concentrations). Average data.
Table 1.
Leaf moisture percentage throughout the day in the Irrigated and Dry treatments, at 7 days after application of treatments (DAAT) and at 12 DAAT days after application of rehydration. Two-way ANOVA (two water conditions x four SA-salicylic acid concentrations). Average data.
| Treatment |
08:00 am |
10:00 am |
12:00
Am |
02:00
pm |
04:00
Pm |
| 7 DAAT |
| Irrigated (%) |
74.000 |
70.400 |
74.244 a |
70.150 a |
66.619 |
| Dry (%) |
73.600 |
70.700 |
70.219 b |
64.919 b |
63.675 |
| Significance |
|
|
|
|
|
| Water condition |
n.s. |
n.s. |
P<0.01 |
P<0.05 |
n.s. |
| Concentration SA |
n.s. |
n.s. |
n.s. |
n.s. |
n.s. |
| Water condition X SA |
n.s. |
n.s. |
n.s. |
n.s. |
n.s. |
| 12 DAAT |
| Irrigated (%) |
69.875 |
74.681 |
74.181 |
69.037 |
68.119 |
| Rehydration (%) |
68.894 |
74.475 |
73.825 |
68.85 |
65.131 |
| Significance |
|
|
|
|
|
| Water condition |
n.s. |
n.s. |
n.s. |
n.s. |
n.s. |
| Concentration SA |
n.s. |
n.s. |
n.s. |
n.s. |
n.s. |
| Water condition X SA |
n.s. |
n.s. |
n.s. |
n.s. |
n.s. |
Table 2.
Water potential of shoots, chlorophyll a, b and carotenoid content of plants submitted to Irrigation and Dry treatments at 7 days after application of treatments (DAAT) and at 12 DAAT days after application of rehydration. Two-way ANOVA (two water conditions x four SA-salicylic acid concentrations). Average data.
| 7 DAAT |
| Treatment |
Aboveground water potential |
Chlorophyll a
|
Chlorophyll b
|
Carotenoids |
| Irrigated |
0.289 |
5.643 |
1.530 |
2.269 |
| Dry (%) |
0.297 |
5.620 |
1.539 |
2.434 |
Concentration
SA |
Aboveground water potential |
Chlorophyll a
|
Chlorophyll b
|
Carotenoids |
| 0mM |
0.285 |
6.424 a |
1.670 |
2.564 a |
| 0.5mM |
0.275 |
5.442 ab |
1.470 |
2.307 ab |
| 1mM |
0.315 |
5.524 ab |
1.563 |
2.357 ab |
| 1.5mM |
0.296 |
5.135 b |
1.434 |
2.177 b |
| Significance |
|
|
|
|
| Water condition |
n.s. |
n.s. |
n.s. |
n.s. |
| Concentration SA |
n.s. |
P<0.05 |
n.s. |
P<0.05 |
| Water condition X SA |
n.s. |
n.s. |
n.s. |
n.s. |
| 12 DAAT |
| Treatment |
Aboveground water potential |
Chlorophyll a
|
Chlorophyll b
|
Carotenoids |
| Irrigated |
0.244 |
5.416 |
1.526 |
2.331 |
| Rehydration |
0.271 |
5.906 |
1.587 |
2.496 |
Concentration
SA |
Aboveground water potential |
Chlorophyll a
|
Chlorophyll b
|
Carotenoids |
| 0mM |
0.310 |
6.227 |
1.918 |
2.520 |
| 0.5mM |
0.256 |
5.311 |
1.299 |
2.332 |
| 1mM |
0.225 |
5.489 |
1.500 |
2.372 |
| 1.5mM |
0.238 |
5.617 |
1.510 |
2.430 |
| Significance |
|
|
|
|
| Water condition |
n.s. |
n.s. |
n.s. |
n.s. |
| Concentration SA |
n.s. |
n.s. |
n.s. |
n.s. |
| Water condition X SA |
n.s. |
n.s. |
n.s. |
n.s. |
