1. Introduction
Virulence strategies employed by the encapsulated yeast
Cryptococcus neoformans encompass the capability to directly manipulate the host cell (Casadevall and Fang [
1]. This facultative intracellular organism has adapted to reside and replicate within the acidic phagosome and escape via a non-lytic process, called vomocytosis [
2]. All these mechanisms can be exploited by
C. neoformans to transverse the lung epithelial tissues and travel in the blood circulation to disseminate as a ‘Trojan horse’ to extrapulmonary organs, including the brain [
3].
C. neoformans is the leading cause of fungal meningitis [
4]. In response to this public health threat, this fungal pathogen was recently ranked as critically important by the World Health Organization [
5,
6].
C. neoformans is a eukaryotic pathogen that undergoes asymmetric division during replication, resulting in a phenotypic dichotomy between the aging mother cell and its newly budded daughter [
7]. Although labeled as 'old', these cells continue to exhibit fitness with unchanged doubling times, having lived only about a third of their life expectancy, and are far from senescence.
C. neoformans cells that lived 10 generation exhibit marked resistance to phagocytic killing [
8], increased melanin secretion [
9], a remodeled cell wall [
10] and higher tolerance to antifungals [
8]. We have proposed that the persistence of cryptococcal disease and treatment failure during chronic infection is driven by the selection and accumulation of old yeast cells, which can evade the host response [
8].
The arsenal of virulent factors employed by
C. neoformans to survive inside a host cell includes the release of capsular material and the secretion of enzymes, such as urease [
11,
12]. For instance, the cryptococcal polysaccharide capsule [
13] and unbudded cell cycle arrest [
14] have been linked to loss of phagosome membrane integrity, whereas urease activity affects fitness, increases phagosomal pH within the mammalian phagosome and promotes vomocytosis [
12].
Based on pivotal studies that characterized
C. neoformans interactions with macrophages [
15], we hypothesized that
C. neoformans phagosome interaction impose selection on the
C. neoformans population in the host. In this study, we investigated strategies used by old
C. neoformans to thrive inside host macrophages and characterized age-associated virulence factors that contribute to fungal intracellular survival.
4. Discussion
Interactions with macrophages play a crucial role during
C. neoformans infection [
29]. Phagosomal maturation involves fusion with lysosome with subsequent acidification. This process is determined by phagosomal cargo and is critical for the activation of mechanisms associated with antigen processing and presentation [
30]. The survival of intracellular cryptococci despite the acidic luminal pH involves multiple antioxidant tools such as expression of enzymes, pigment production [
31], and production of capsular polysaccharide [
27].
Previously, our lab showed that ten-generation old
C. neoformans cells are significantly more resistant to killing by macrophages than their daughter cells [
8,
32]. However, major selection pressure would have to be operative to privilege these relatively rare old
C. neoformans cells in the host environment. Accumulation of yeast cells with advanced generational age has been documented both for
C. neoformans and
Candida glabrata in several infection models [
33]. Advanced generational age of
C. neoformans cells is associated with increased melanin synthesis, reduced phagocytosis, and a thicker cell wall when compared to daughter cells [
8,
32]. Here we report that old
C. neoformans produce increased levels of urease and capsular GXM, as well as higher DNA content than young yeast cells.
Urease activity leads to ammonia production and elevation of phagosomal pH since phagosomes containing
C. neoformans (
ure1Δ ) lacking urease activity presented increased pH when compared to macrophages loaded with the wild-type strain [
12]. In association with this finding, previous report has shown that increasing the phagosomal pH with chloroquine is related to enhanced antifungal activity in macrophages infected with
C. neoformans [
34]. Our comparative analysis of phagosomal pH is compelling because although a higher percentage of macrophages exhibit acidic phagosomes after ingesting old
C. neoformans cells compared to those that phagocytose young
C. neoformans, the pH of the acidic phagolysosomes is significantly lower when loaded with young
C. neoformans (as shown in
Figure 6B and D). These data are consistent with published studies [
15], which have shown that
C. neoformans opposed to other phagocytosed yeasts has the unique ability to manipulate the acidification of their phagosomes. Studies with mutants have supported this concept that specific cryptococcal virulence factors such as polysaccharide capsule, and urease determine phagosomal dynamics. It is possible that augmented excretion of urease into the phagolysosome by old
C. neoformans leads to the higher phagosomal pH. Additionally, the finding that old cells produce more polysaccharides may enhance the ability of ingested
C. neoformans to better buffer phagosomal acidification [
13]. Expansion of the Golgi apparatus, and presence of GXM in vesicles in old
C. neoformans are consistent with the production of more polysaccharide and the expression of an enlarged polysaccharide capsule.
Lower pH was also associated with better
C. neoformans replication [
12]. Whether differences in phagosomal pH result is altered intracellular replication rates cannot be determined with the current experimental design, which only imaged up to 120 minutes. This technical limitation is because old
C. neoformans would start replicating and generate a mixed population of younger daughter cells and older mother cells, which would make it difficult to differentiate the impact of aging. For the same reason we did not assess intracellular replication rates.
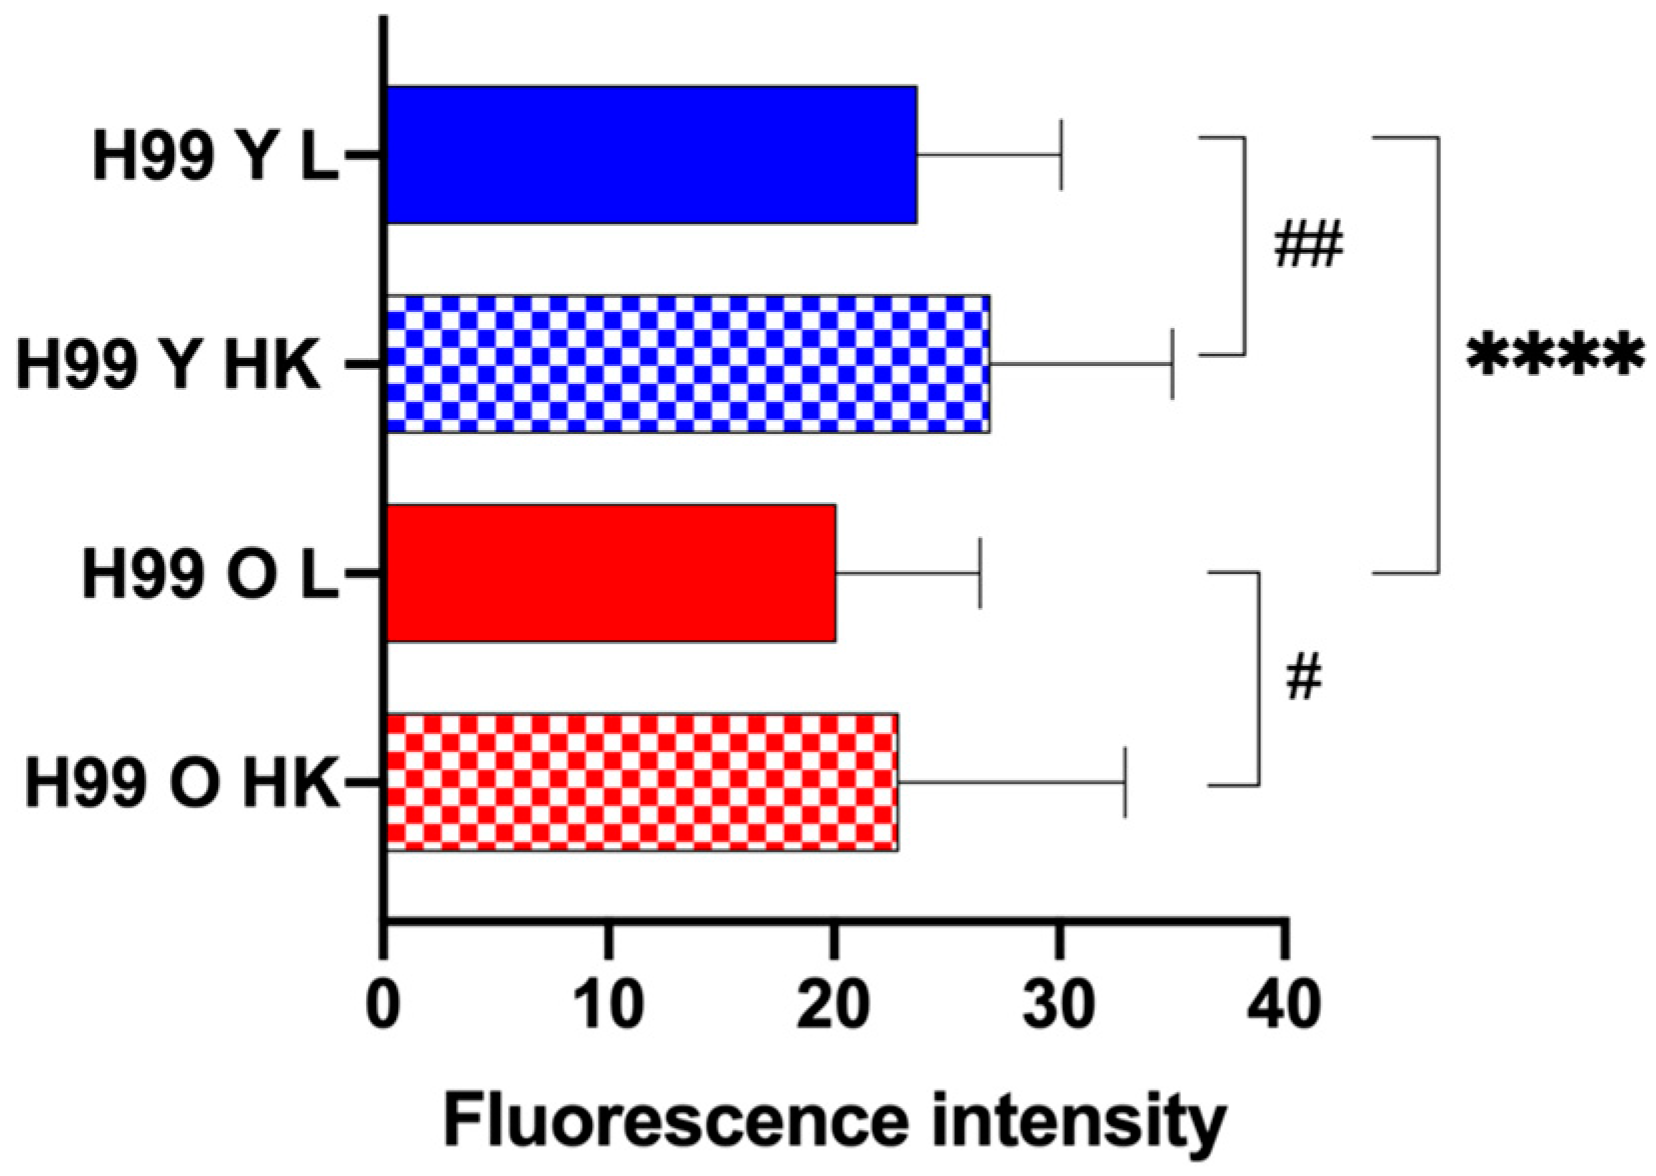
Our data demonstrates decreased lysotracker fluorescence in macrophages infected with old
C. neoformans. Loss of acidity in phagosome could also be the result of enhanced phagosomal membrane leakage, which was documented in macrophages two hours after phagocytosis of old yeast cells. The accumulation of infected macrophages with
C. neoformans has been shown to lead to rupture of the phagocytic cell [
35]. Furthermore, the physical stress on membranes from capsular enlargement has been also linked to phagosomal leakage [
13]. We have shown that aging results in GXM-containing vesicles [
10], cell and capsule enlargement [
7] all of which could be related to both the more pronounced loss of acidity as well as loss in phagosomal integrity in old cells.
Furthermore, unbudded G2 arrest has been associated with changes in
C. neoformans morphology, such as hyphal formation [
36]. We observed trimera-like old
C. neoformans cells, most likely because aging promotes G2 arrest. Since cell cycle arrest is also an important stress response mechanism in the murine pulmonary environment [
14], we hypothesized that these alterations in the morphology of old cells could also contribute to phagosomal integrity, resistance to phagocytic killing and even favor the rupture of the host phagocytic cells. Interestingly,
C. albicans exposed to fluconazole forms three-lobed trimeras. These trimeras produce genetically variable progeny with varying numbers of chromosomes, increasing the odds of creating a drug-resistant strain (REF). Our analysis by flow cytometry for DNA content of propidium iodide-stained cells is likely not sensitive enough to identify aneuploidies. Also, old
C. neoformans were not grown and isolated in the presence of fluconazole selection pressure [
37].
Lastly, phagosome membrane permeabilization in macrophages infected with
C. neoformans has been associated with a decrease in vomocytosis events [
13], as well as higher intracellular pH [
22]. Non-lytic expulsion can be facilitated from non-acidic phagosomes [
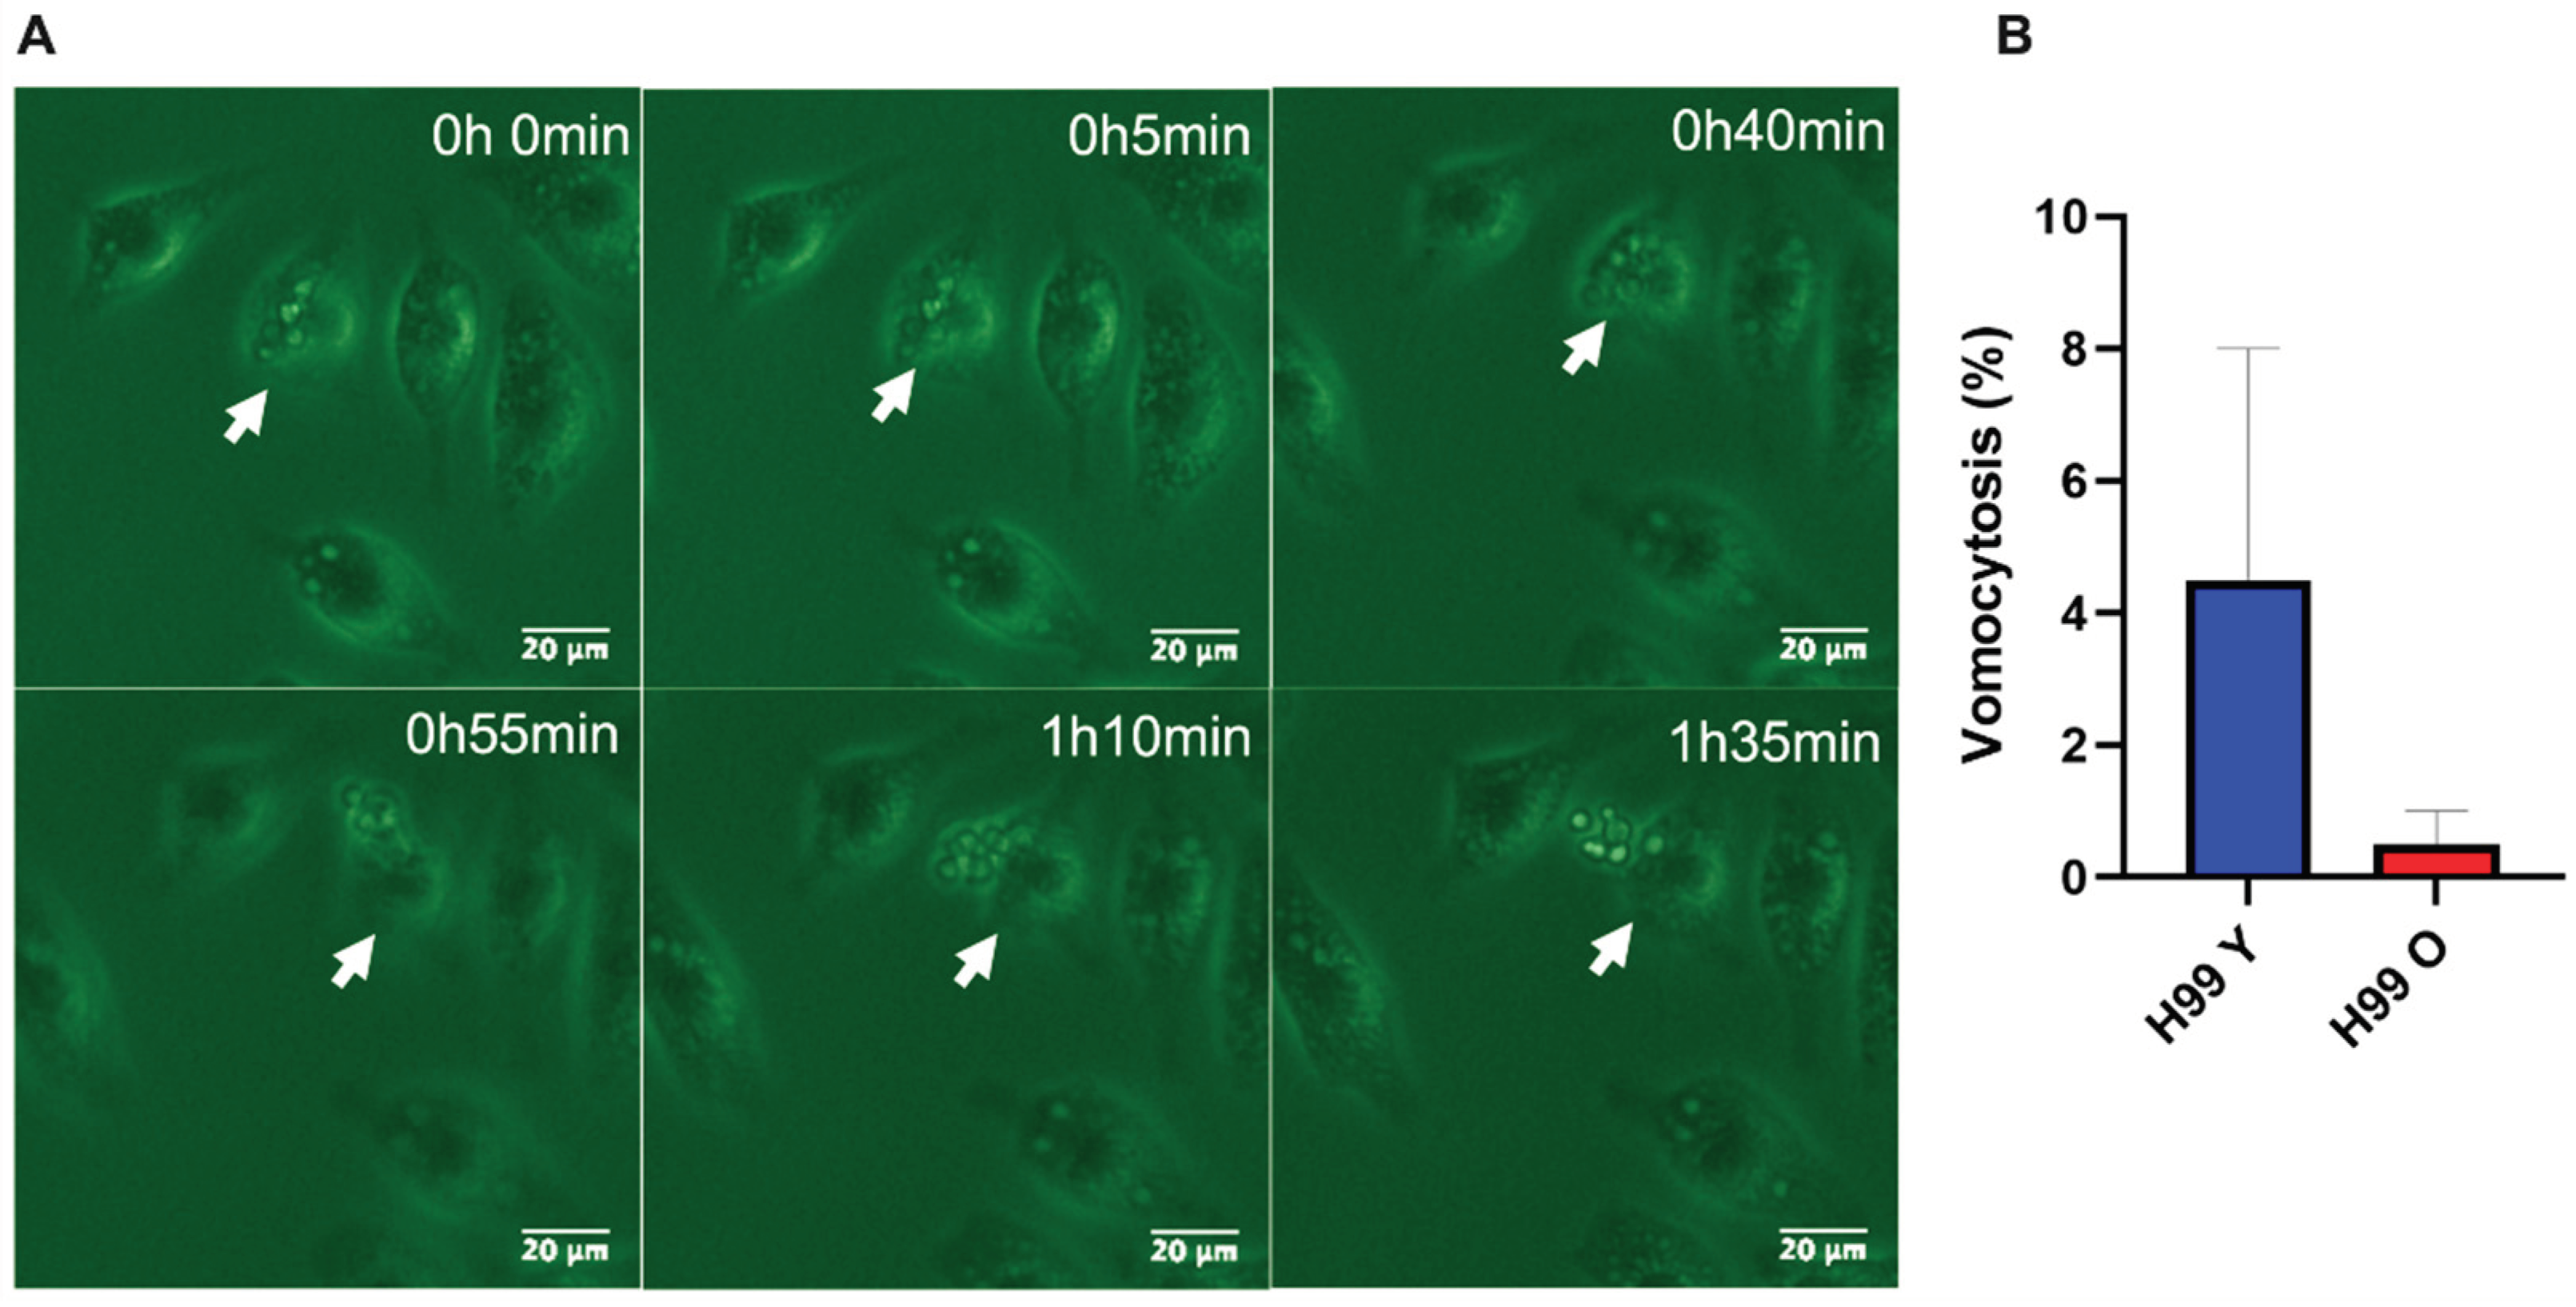
38], which explains why we find more vomocytosis in macrophages that phagocytosed young C
. neoformans cells, as they have a significantly higher percentage of non-acidified phagosomes. Longer live-imaging videos would likely have captured more vomocytosis events, majority of
C. neoformans are reported to exit via non lytic expulsion after six hours [
25]. Prolonged imaging and analysis of more infected phagocytic cells would also clarify if dragatocytosis (lateral transfer from one macrophage to subjacent macrophage) is enhanced in macrophages infected with old
C. neoformans. Previous studies have demonstrated that the actin flash formation may be a macrophage mechanism to avoid
C. neoformans escape by vomocytosis [
22]. Given that the size, capsule, and cell wall is markedly altered in old
C. neoformans it is conceivable that the actin flash formation also differs in macrophages infected with old
C. neoformans when compared to young
C. neoformans.
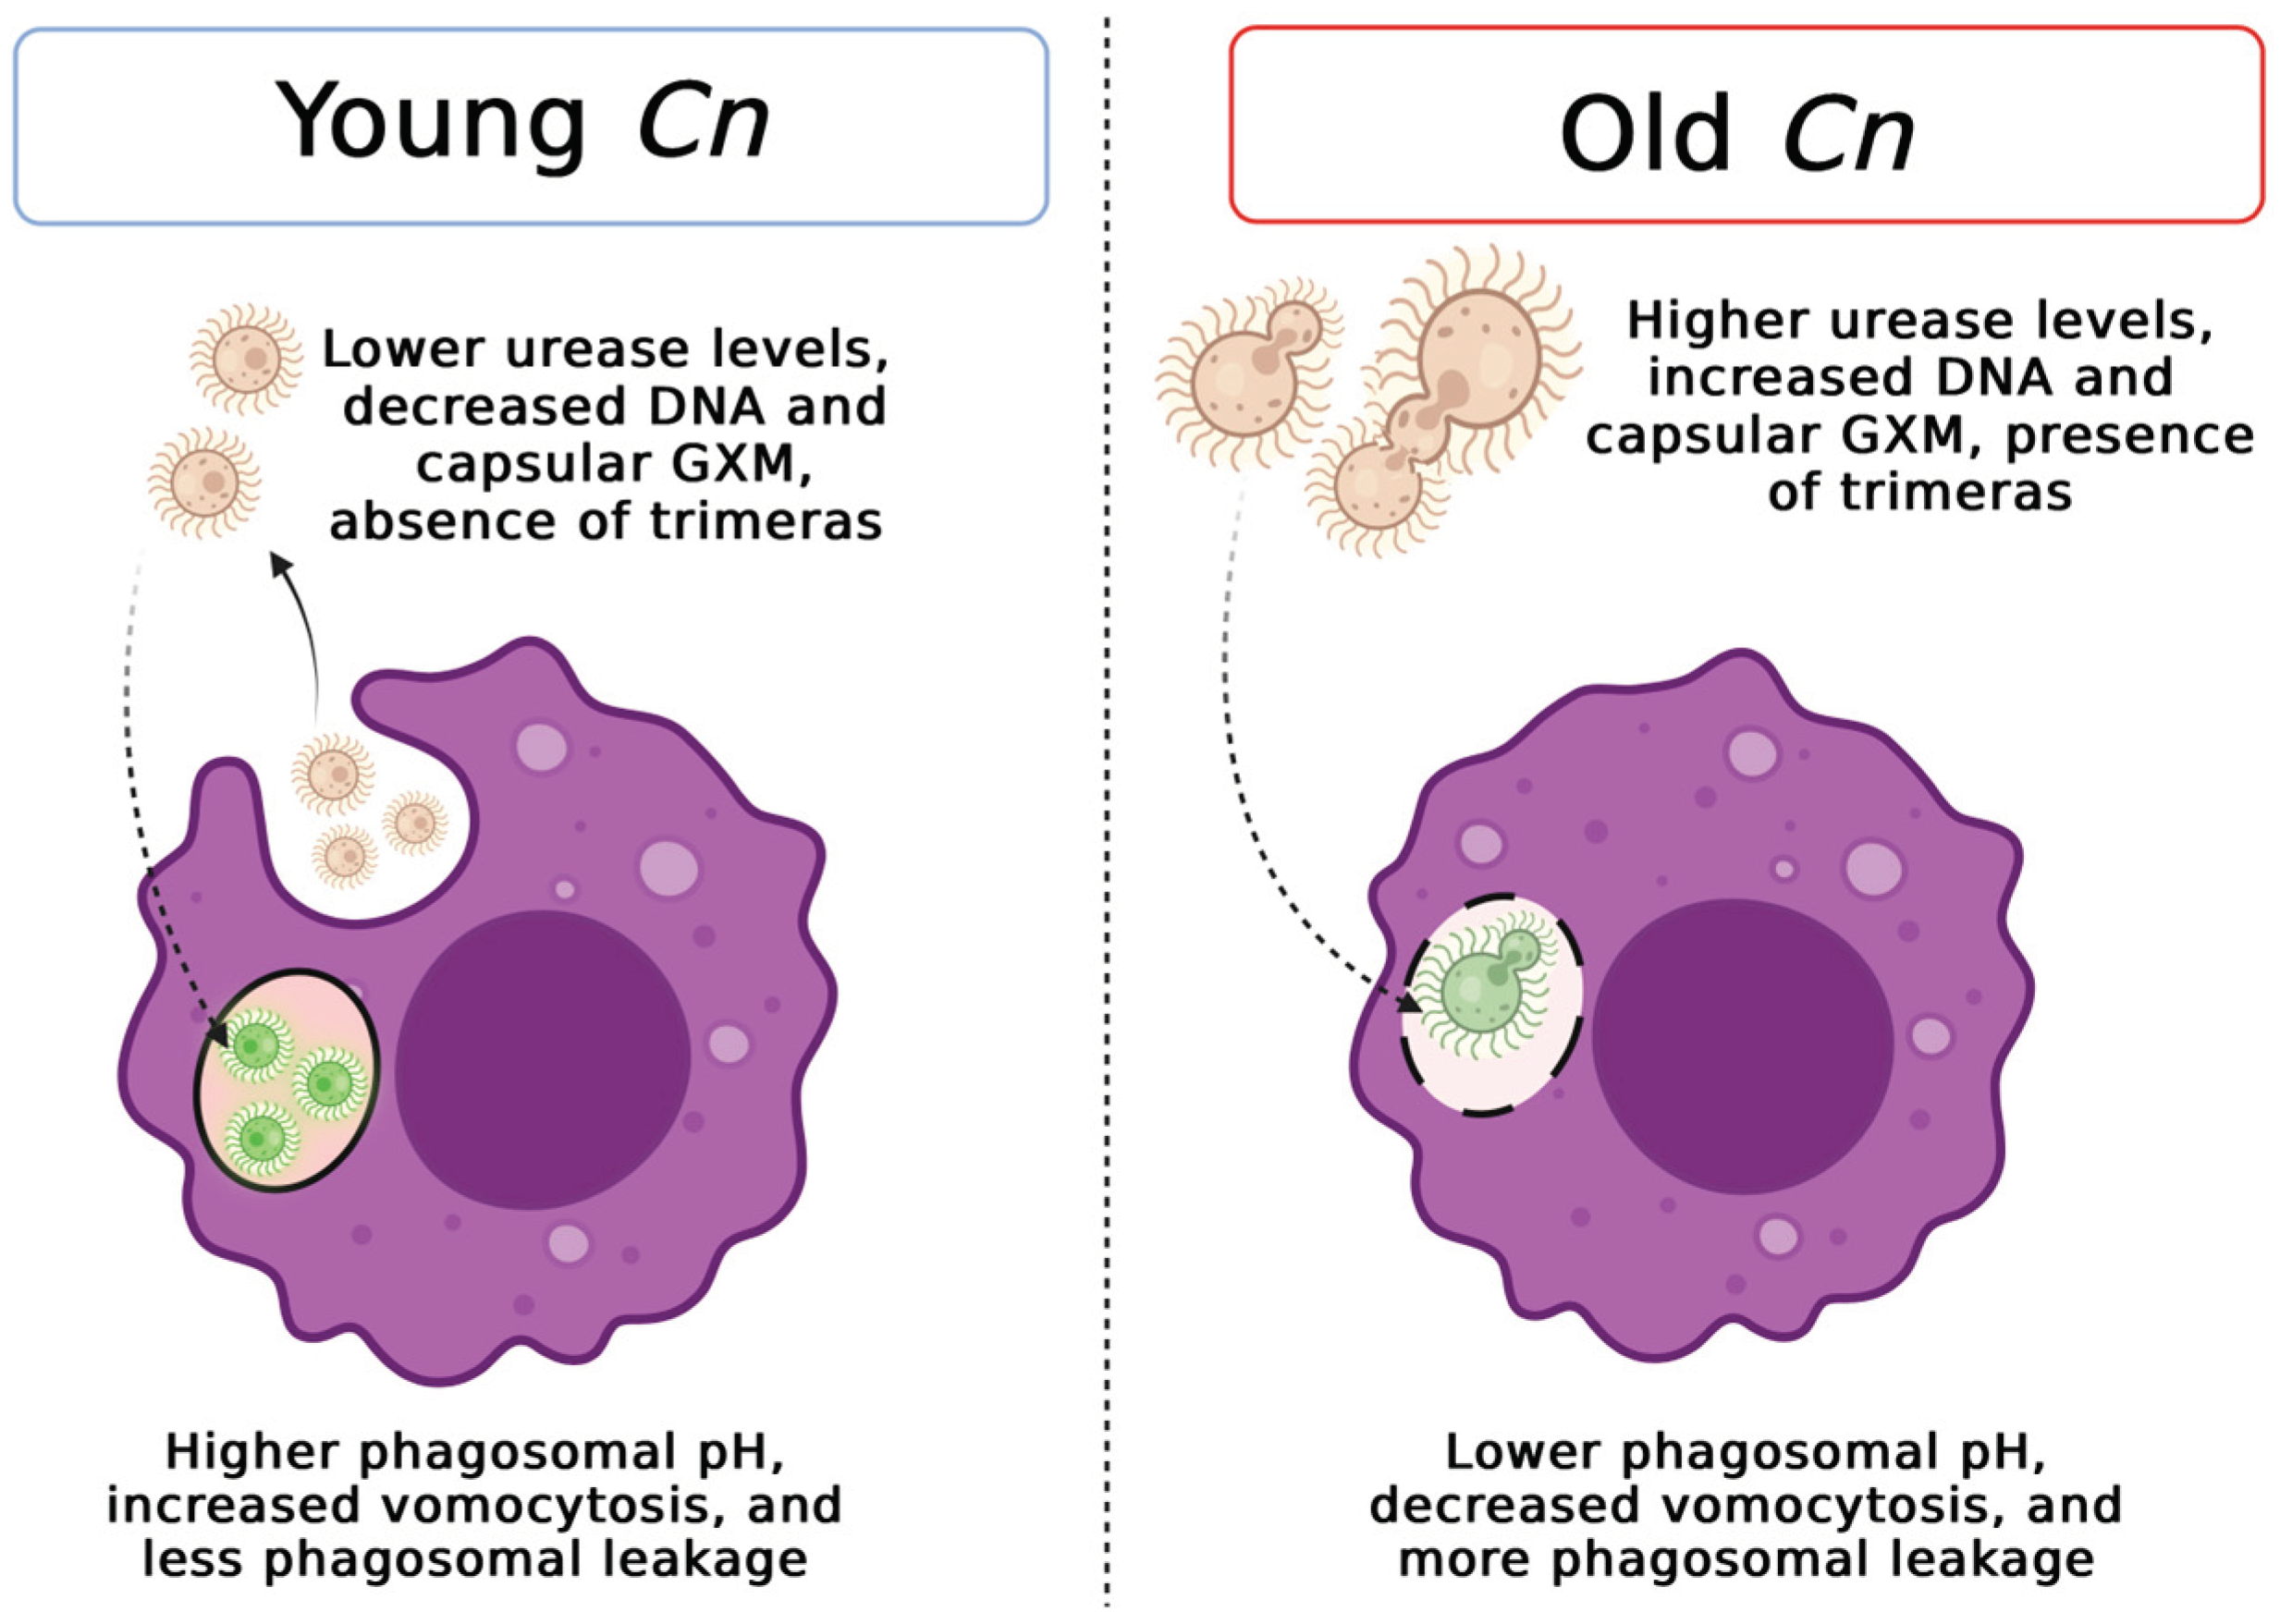
Taken together, our data suggest that aging of C. neoformans results in altered interactions with the phagolysosomes in macrophages, which supports our hypothesis that macrophages play a key role in the selection process of old C. neoformans during infection. Old C. neoformans prevail within acidic phagolysosomes and manipulate the phagosomal pH, both of which is consistent with their enhanced resistance to macrophage killing. Future experiments employing prolonged live imaging studies and aged urease and capsular mutants will help to further elucidate the effect of old C. neoformans on phagosomal interactions and intracellular fate. The comprehension of these essential host-pathogen interactions could further shed light on mechanisms that bring new insights for novel antifungal therapeutic design.
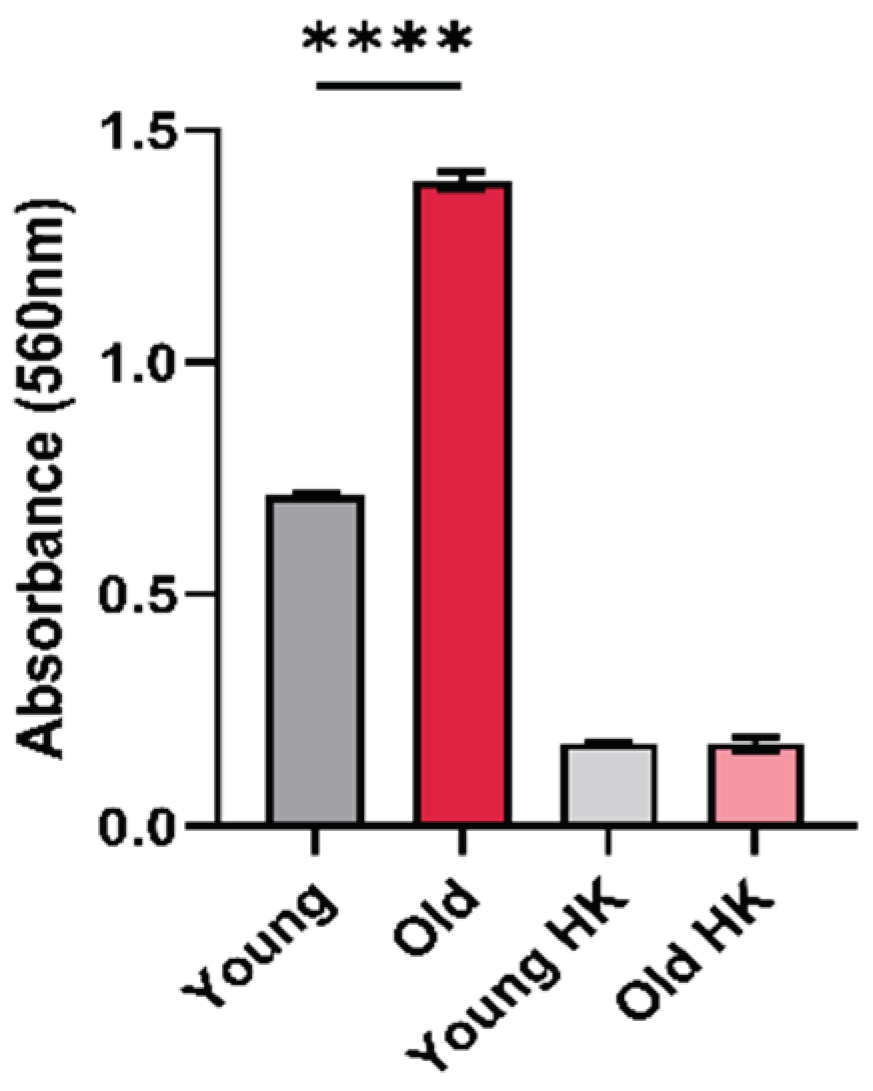
Figure 1.
Urease activity in young and old C. neoformans. Urease enzymatic activity levels are up in old C. neoformans cells in comparison with young C. neoformans (****, p < 0.001). Yeast cells were incubated at rapid urea broth for 3h at 37°C with agitation and optical Density (OD) was read (λ 560 nm). OD > 0.3 was considered positive and heat-killed (HK) cells were was used as a negative control. The graph represents one biological triplicates of three independent experiments with similar results.
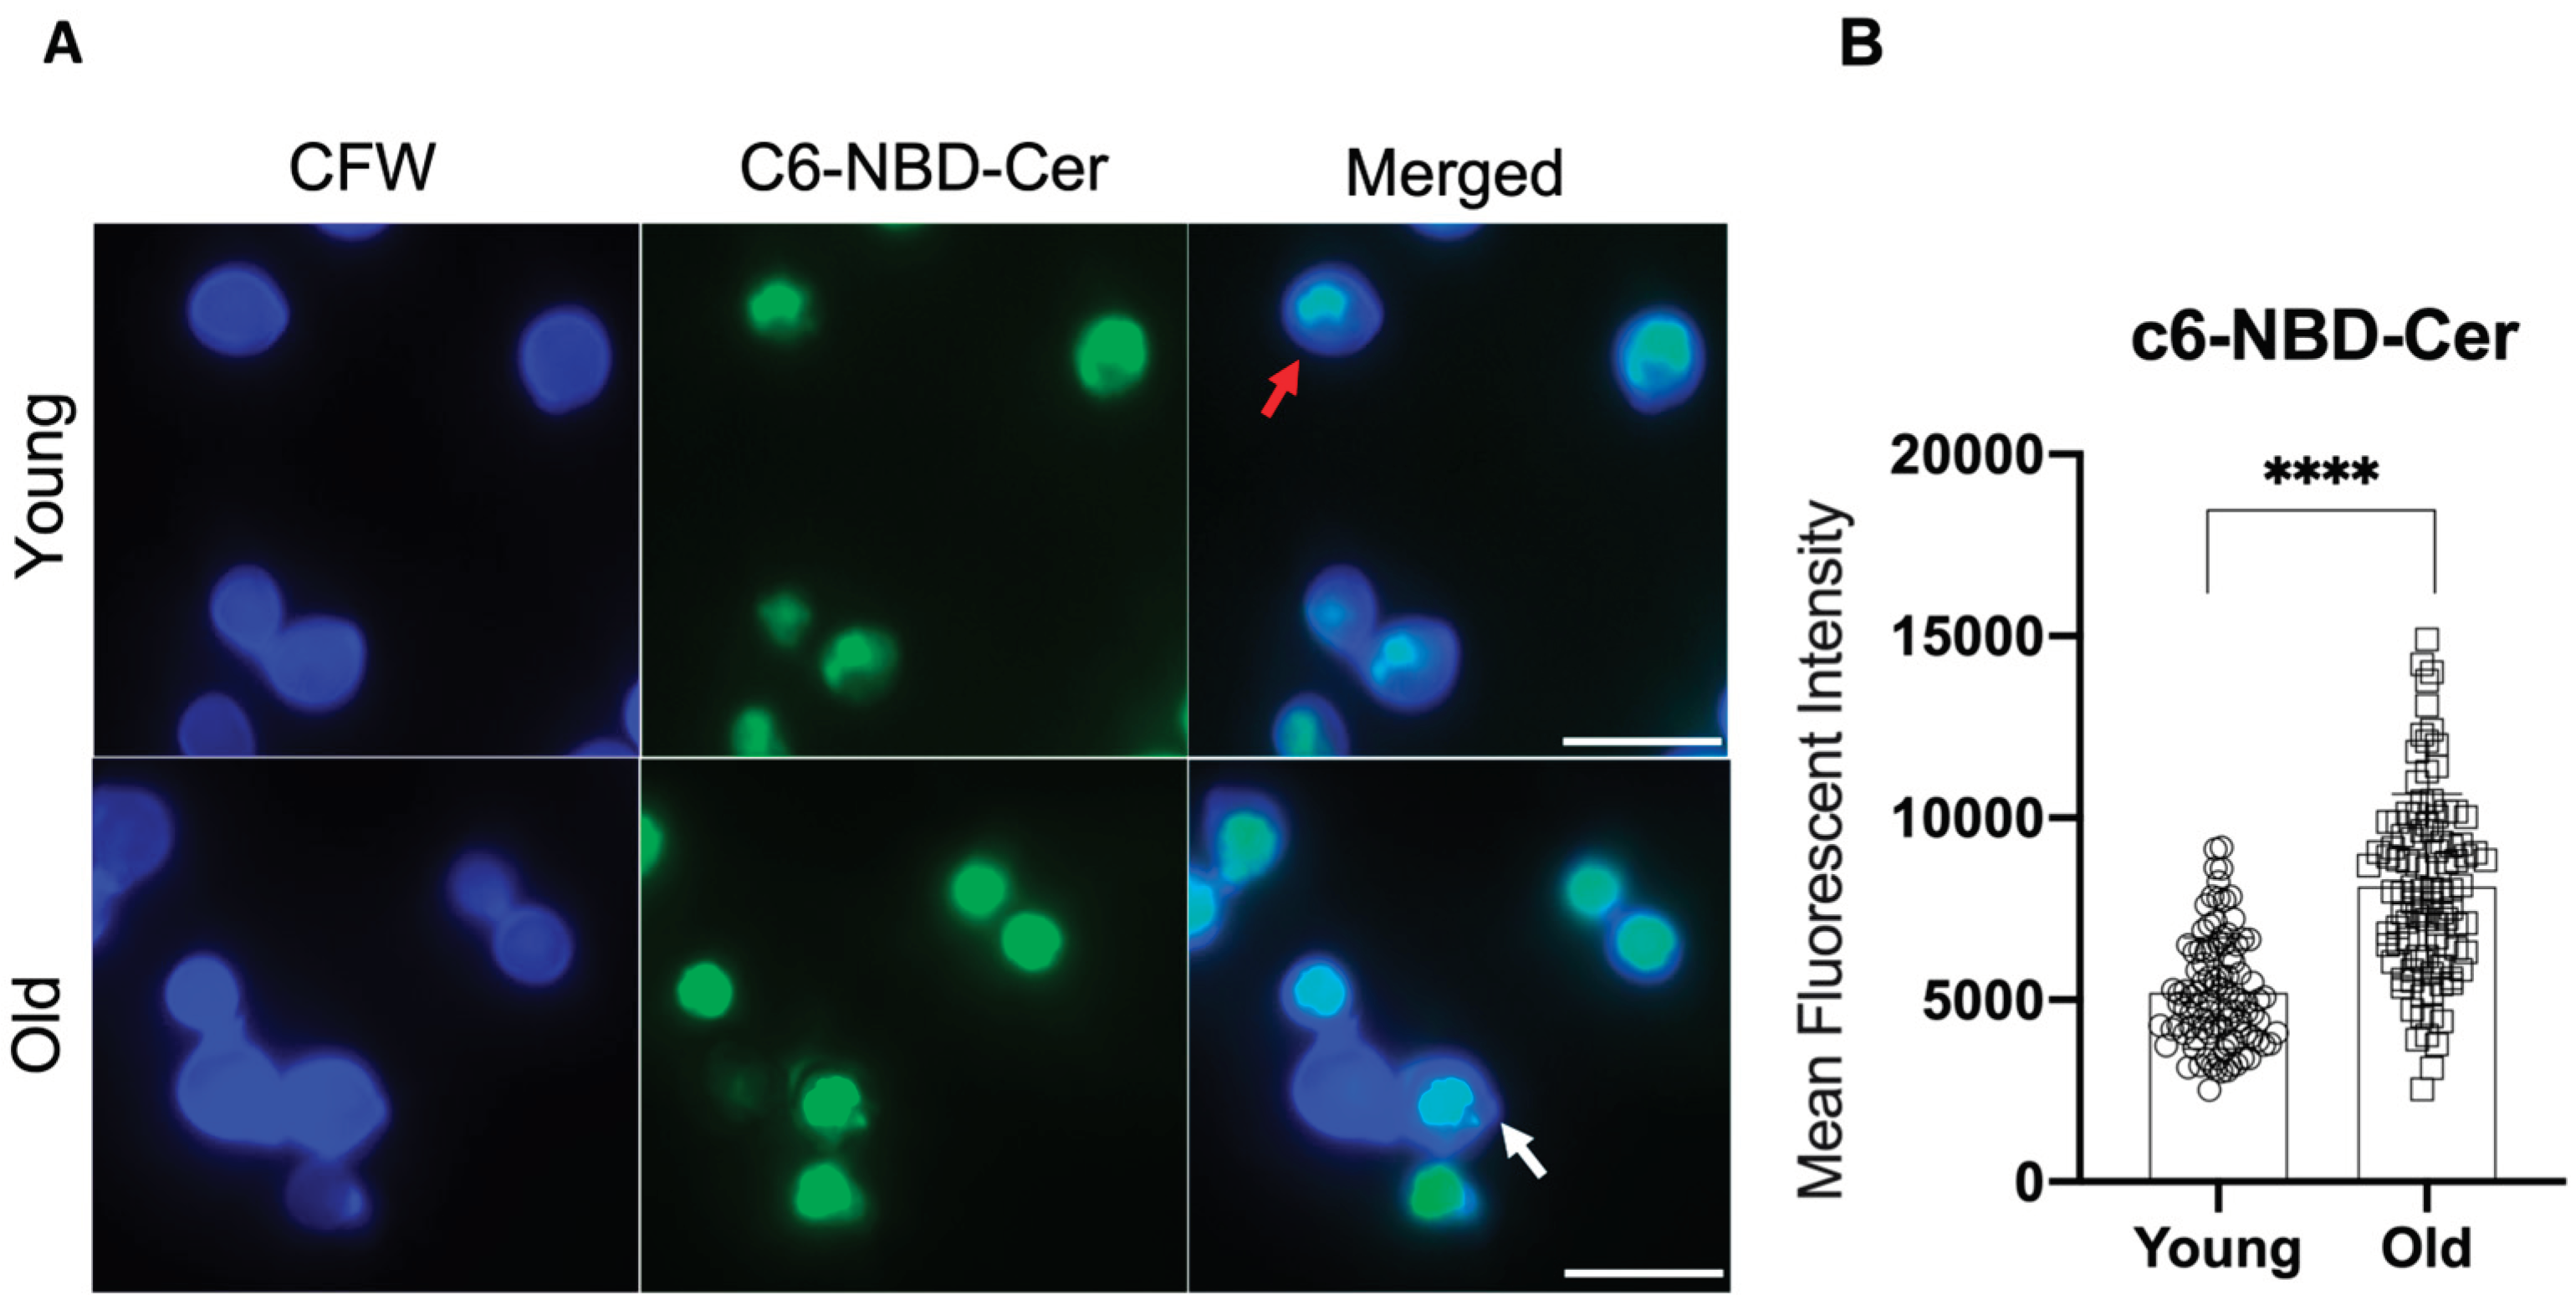
Figure 2.
Influence of replicative aging of C. neoformans in the Golgi apparatus morphological aspects. (A) Young (Y) and old (O) C. neoformans cells were labeled with C6-NBD-ceramide (green) and the cell wall was stained with calcofluor white (blue). Peripherical (red) or central (white) Golgi morphologies are indicated by the arrows. Scale bars represent 10 µm. Images were taken using a fluorescent microscope at 100x and analyzed using Image J software. (B) Quantitative analysis of the morphological profiles that predominated in young and old yeast cells. At least 100 cells per group were analyzed and statistical analyzes were performed using unpaired t-test with post-Welch’s correction (**** p < 0.0001).
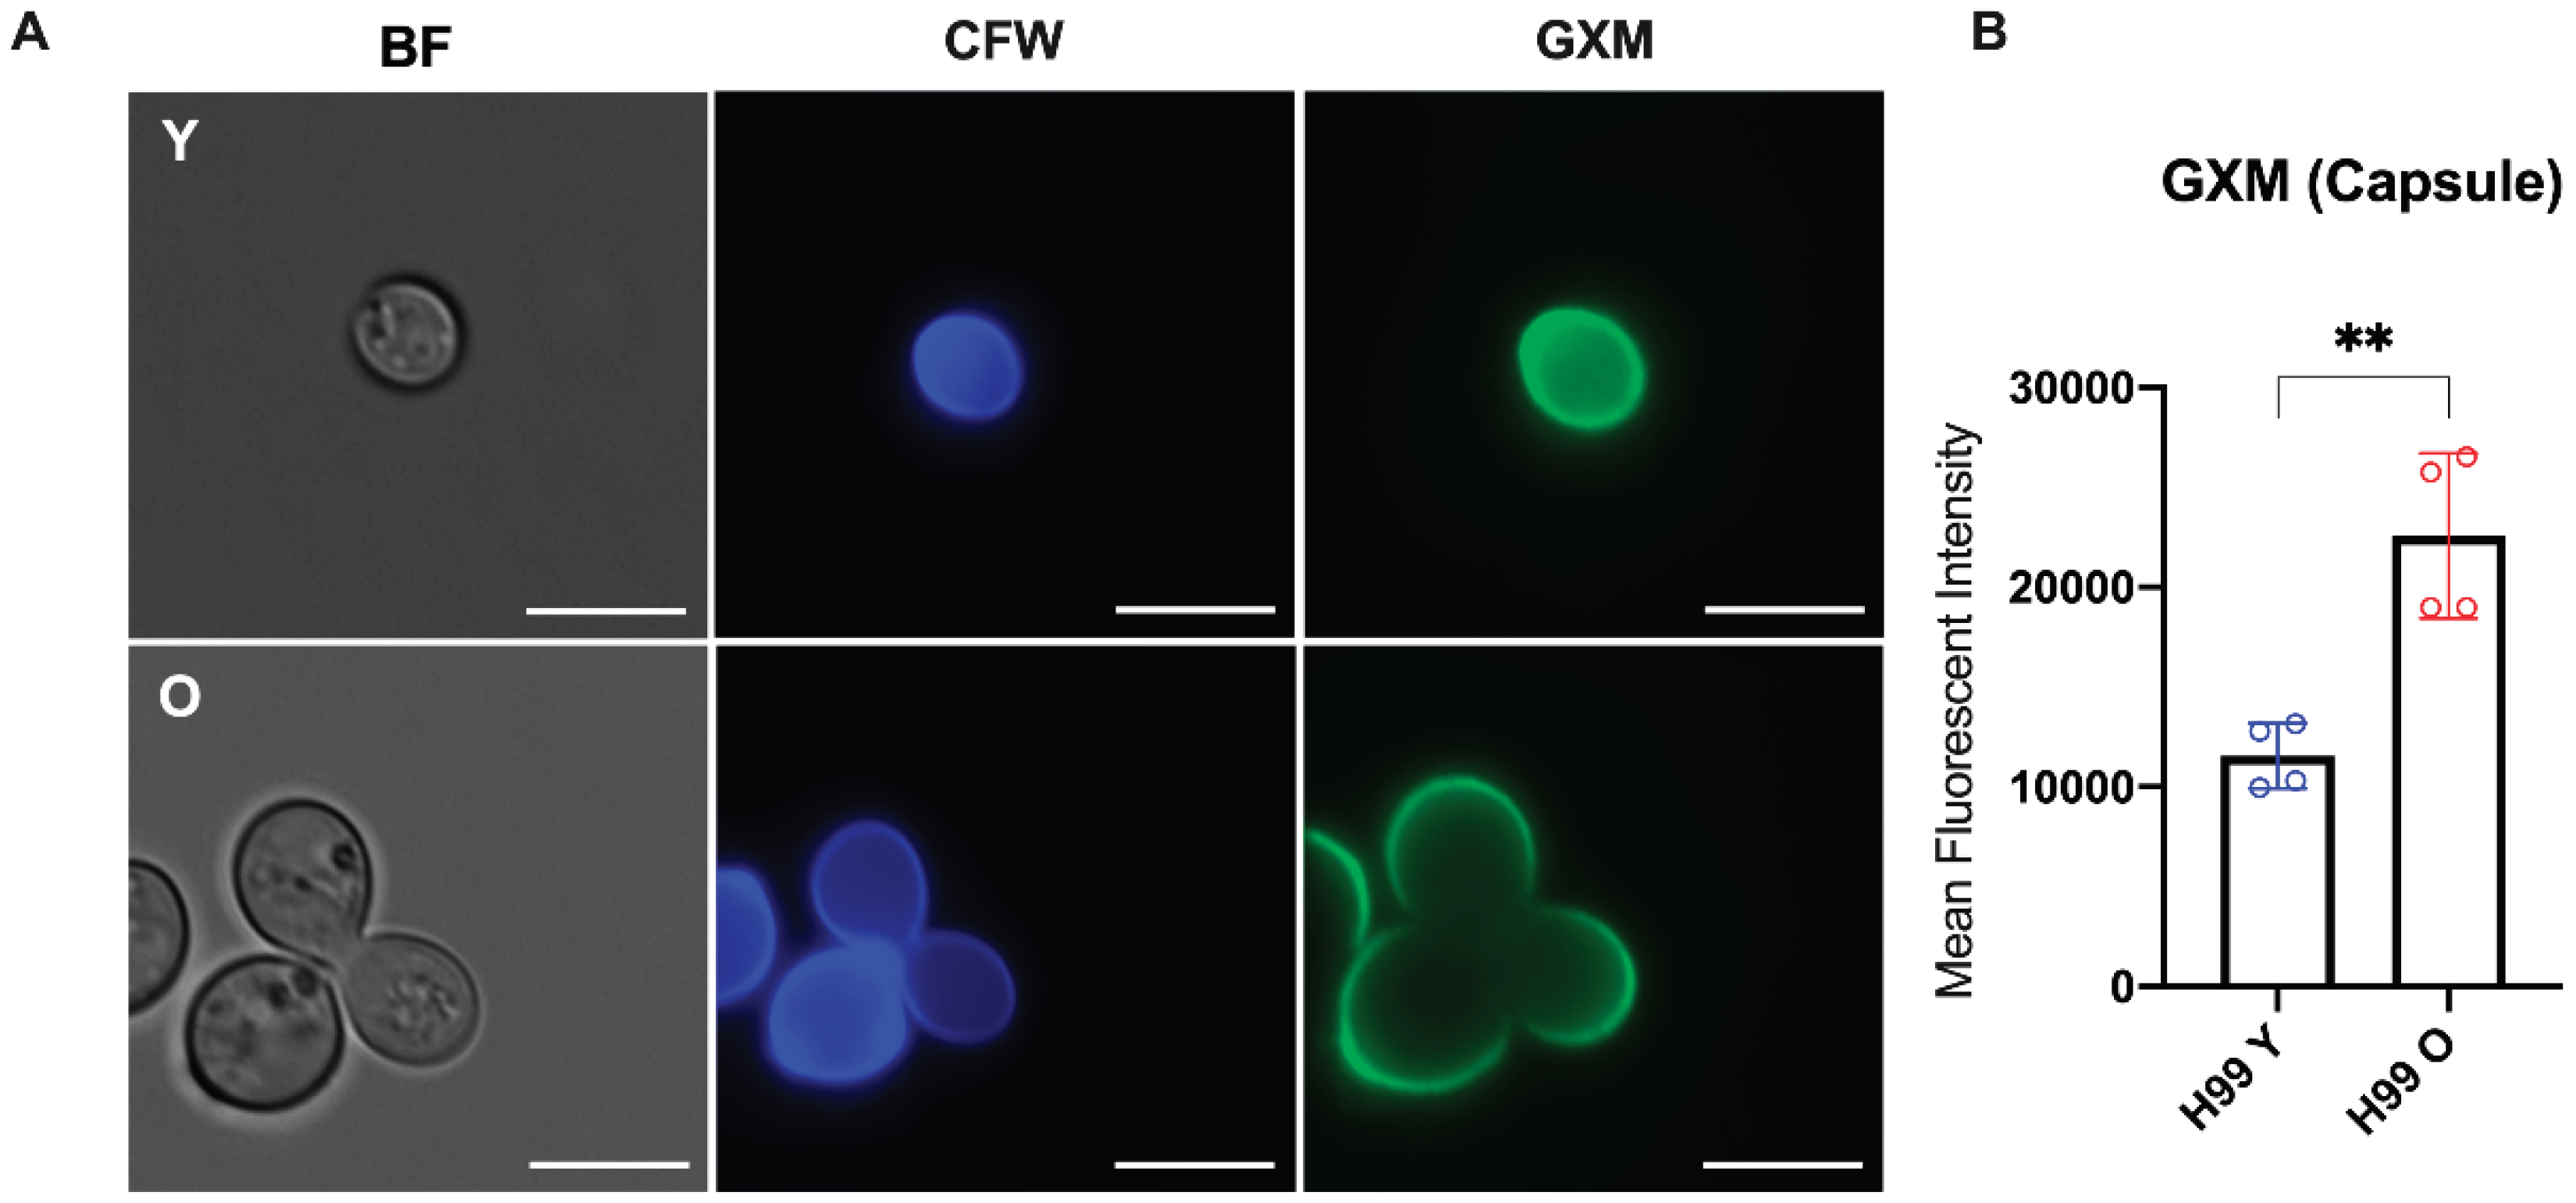
Figure 3.
Morphological capsule analysis of C. neoformans. (A) Representative images of young (Y) and old (O) yeast cells observed by fluorescence microscopy (GXM: green; Cell wall chitin: blue). Stained cells were imaged using a fluorescent microscope at 100 x magnification and the following channels: DAPI (CFW, calcofluor white and GFP (GXM, 18B7-IgG Alexa Fluor 488), BF (brightfield). The scales bar represents 10 µm. (B) Flow cytometry to quantify the capsular GXM levels showed significantly higher amounts of capsular GXM for old (red) than young (blue) C. neoformans (**, p < 0.001). Statistical analysis was performed by t-test with Welch’s correction from two biological replicates.
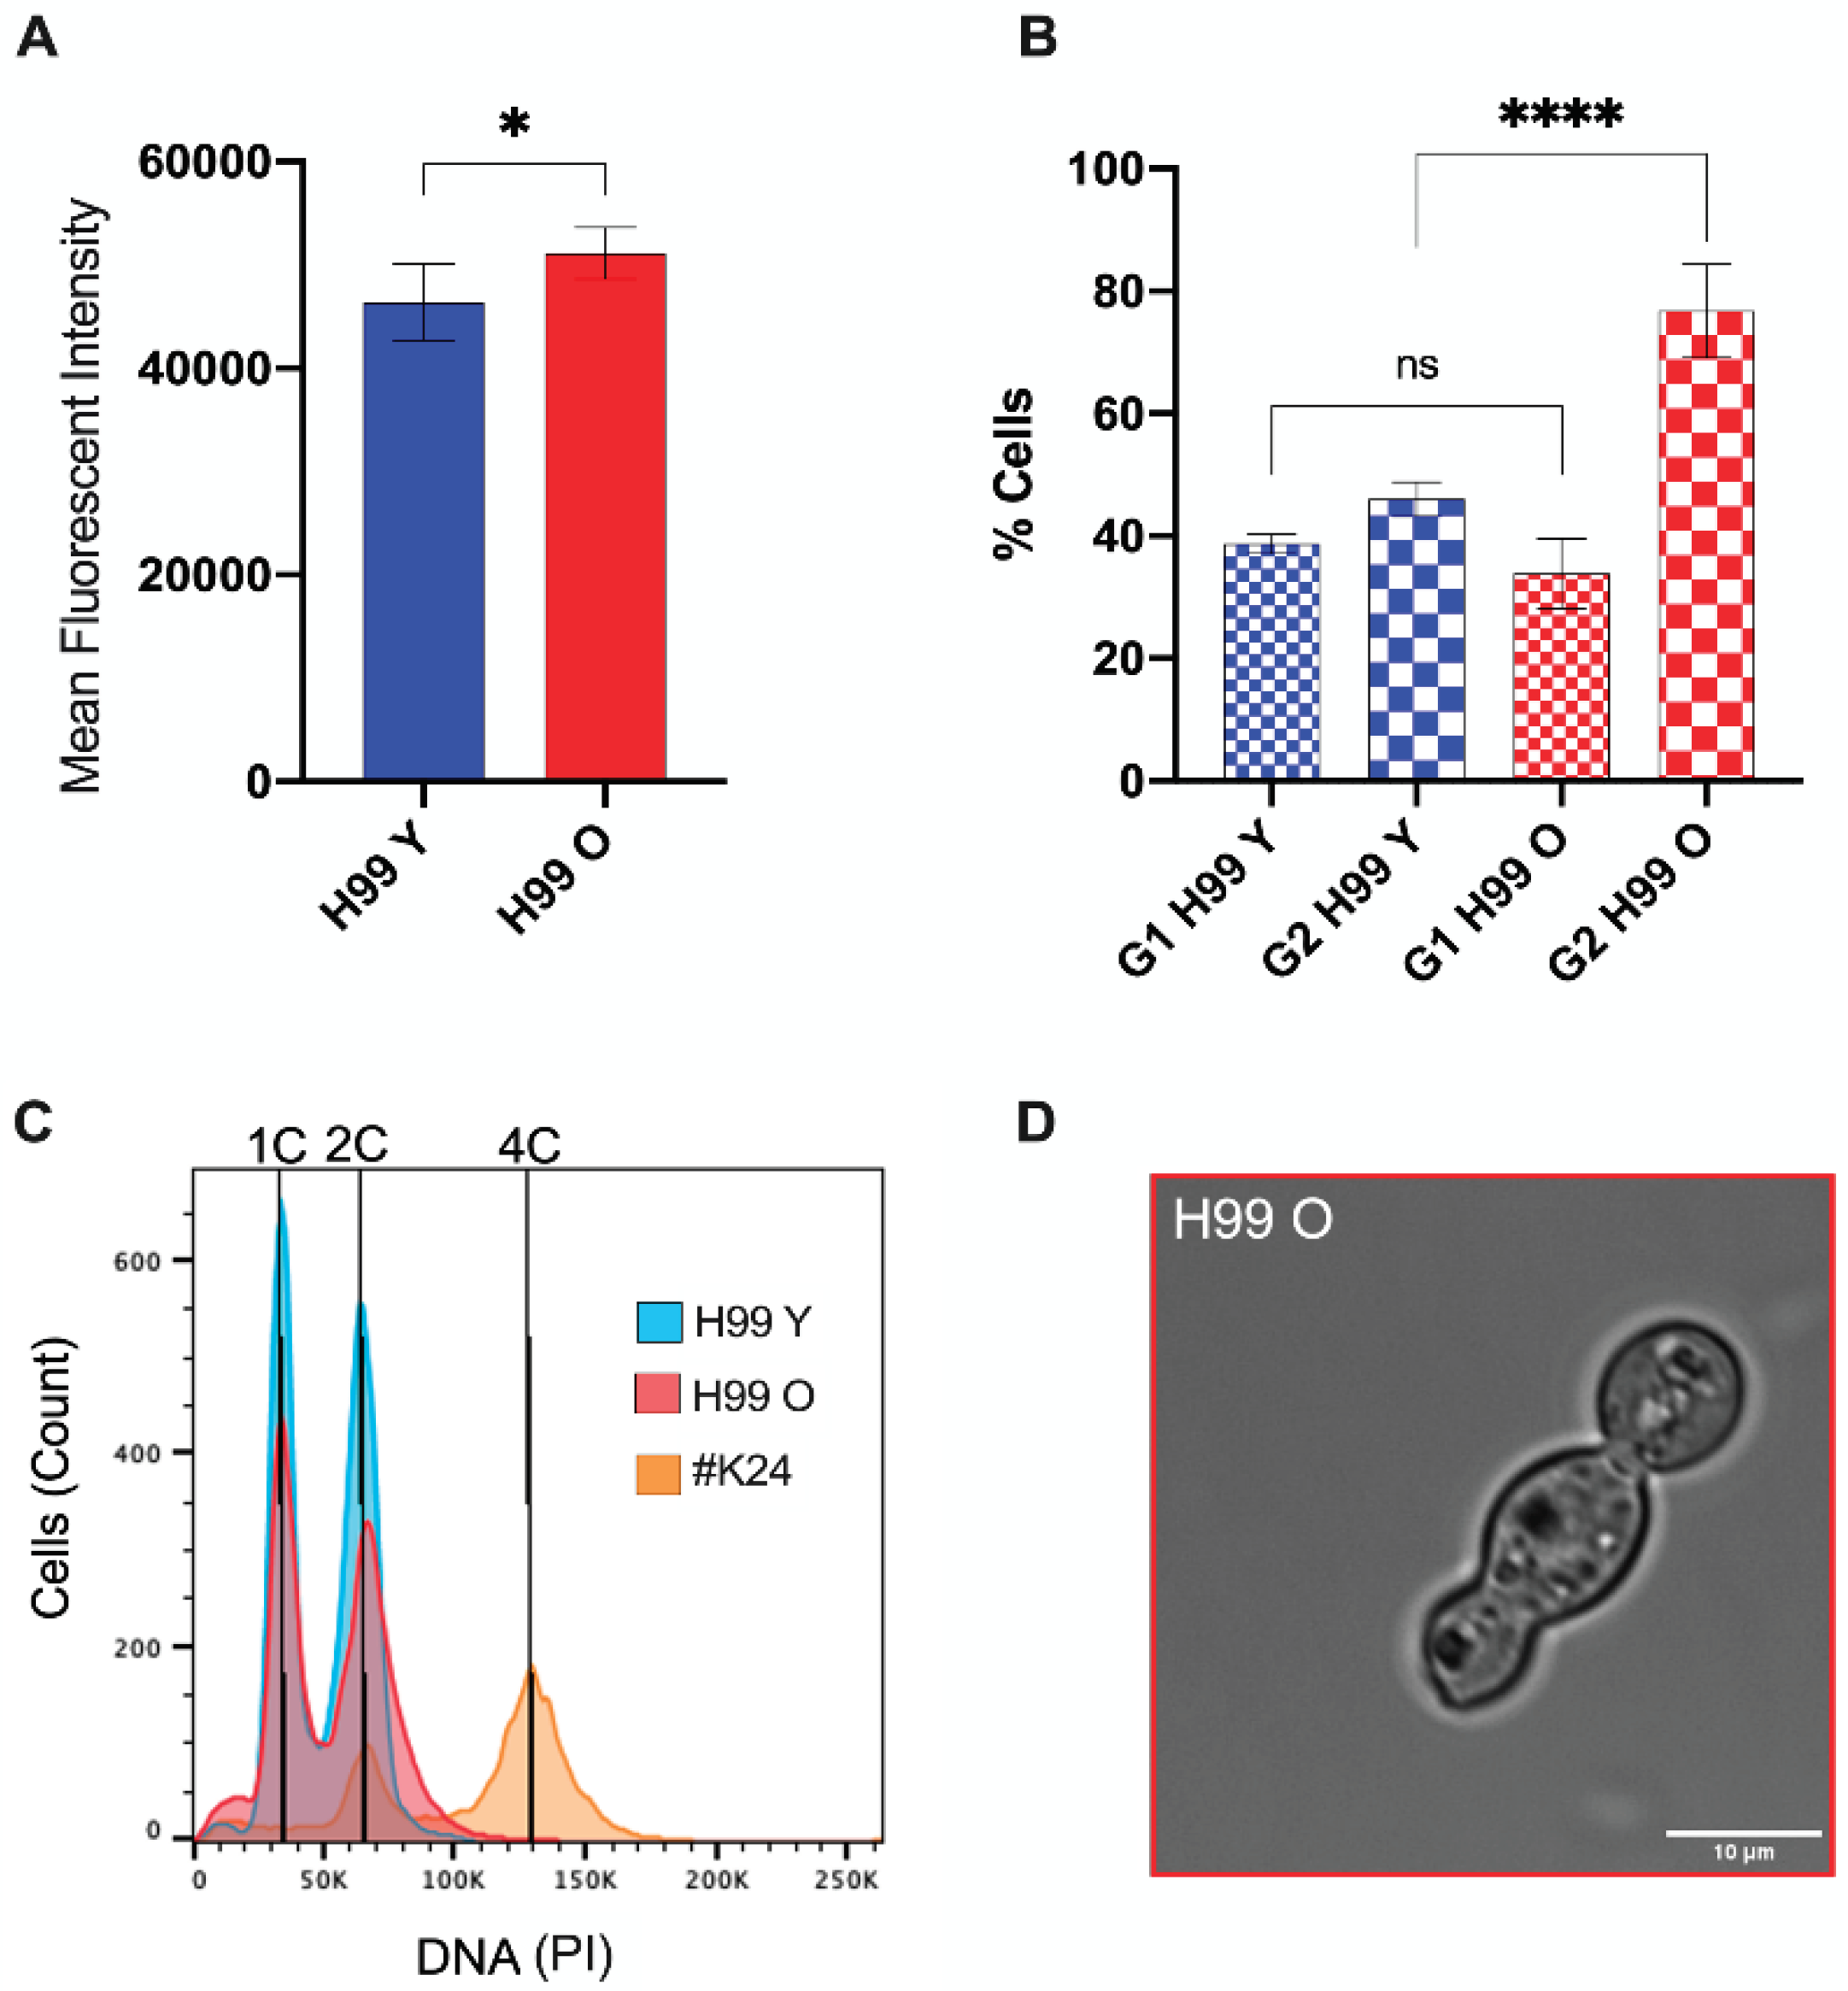
Figure 4.
Old generation C. neoformans cells presented G2 arrest. (A) C. neoformans cells were fixed, stained with propidium iodide, and analyzed by flow cytometry for DNA content levels of young (blue) and old (red) C. neoformans. (B) Percentages of G1 and G2 phases in C. neoformans young (blue) and old (red) yeast cells. Unpaired t-test with Welch’s correction was performed to compare young and the old groups (* p < 0.01, **** p < 0.0001, and ns: nonsignificant p = 0.2908). (C) Representative histograms to determine cell ploidies within the population showing peaks for C. neoformans cells of wild-type strain young (H99 Y) in blue, old in red (H99 O), and control diploid C. neoformans strain (#K24) in orange. (D) Brightfield image of the atypical elongated old C. neoformans cell, resembling trimera-like formation.
Figure 5.
Vomocytosis events in macrophages (J774.A1) infected with young (Y) and old (O) C. neoformans. (A) Representative real-time imaging of vomocytosis type II event (white arrow) for macrophages infected with young C. neoformans. (B) Time-lapse microscopy videos were manually scored for the vomocytosis of C. neoformans from at least 100 macrophages containing yeast cells for each group until two hours after the phagocytosis assay. The graph shows the percentage of C. neoformans-infected macrophages which have experienced at least one vomocytosis event. Data from two independent experiments is shown. Categorical vomocytosis data were analyzed by t-test followed by Welch's correction (p = 0.455).
Figure 6.
Effect of replicative aging on phagosomal maturation in macrophages containing C. neoformans. (A) Represented image of fluorescent microscopy of macrophage mouse cell line J774.A1 infected with previously pHrodo-labeled cryptococci young and old (MOI of 10) after phagocytosis, showing acidified phagosomes. Scale bar represents 20 μm. (B) Macrophages were cultured with pHrodo-labeled live (L) cryptococci (young or old) or given the respective heat-killed (HK) yeast cells (positive control). Time-lapse microscopy videos of two hours post phagocytosis were manually scored for the percent change in pHrodo+ macrophages. At least 100 infected macrophages for each group were observed and statistical analysis of two independent experiments was performed by t-test followed by post-Welch’s correction. The black line represents comparisons between young and old C. neoformans, the blue line between live and HK young C. neoformans, and the red line between live and HK old C. neoformans (** p< 0.01, *** p < 0.001). (C) Quantification of all behaviors of J774.A1 cells infected with C. neoformans (young and old) for up to two hours after phagocytosis (D) Quantification of Phrodo+ fluorescence intensity of macrophages ingested with either young (blue) or old (red), and their respective HK yeast cells (positive control). Images of at least 100 infected macrophages for each group were analyzed using ImageJ. Statistical analysis of two independent experiments was done using an unpaired t-test and with post-Welch’s correction to compare macrophages ingested with live young against live old C. neoformans (**** p < 0.0001). (E) Quantification of the number of yeast C. neoformans cells per acidic (Phrodo+, green) or non-acidic (Phrodo-, gray) macrophages. At least 100 macrophages infected with young (H99 Y) or old (H99 O) C. neoformans were analyzed. Comparison between groups of two independent experiments was performed by unpaired t-test and post-Welch’s correction (p = 0.2715).
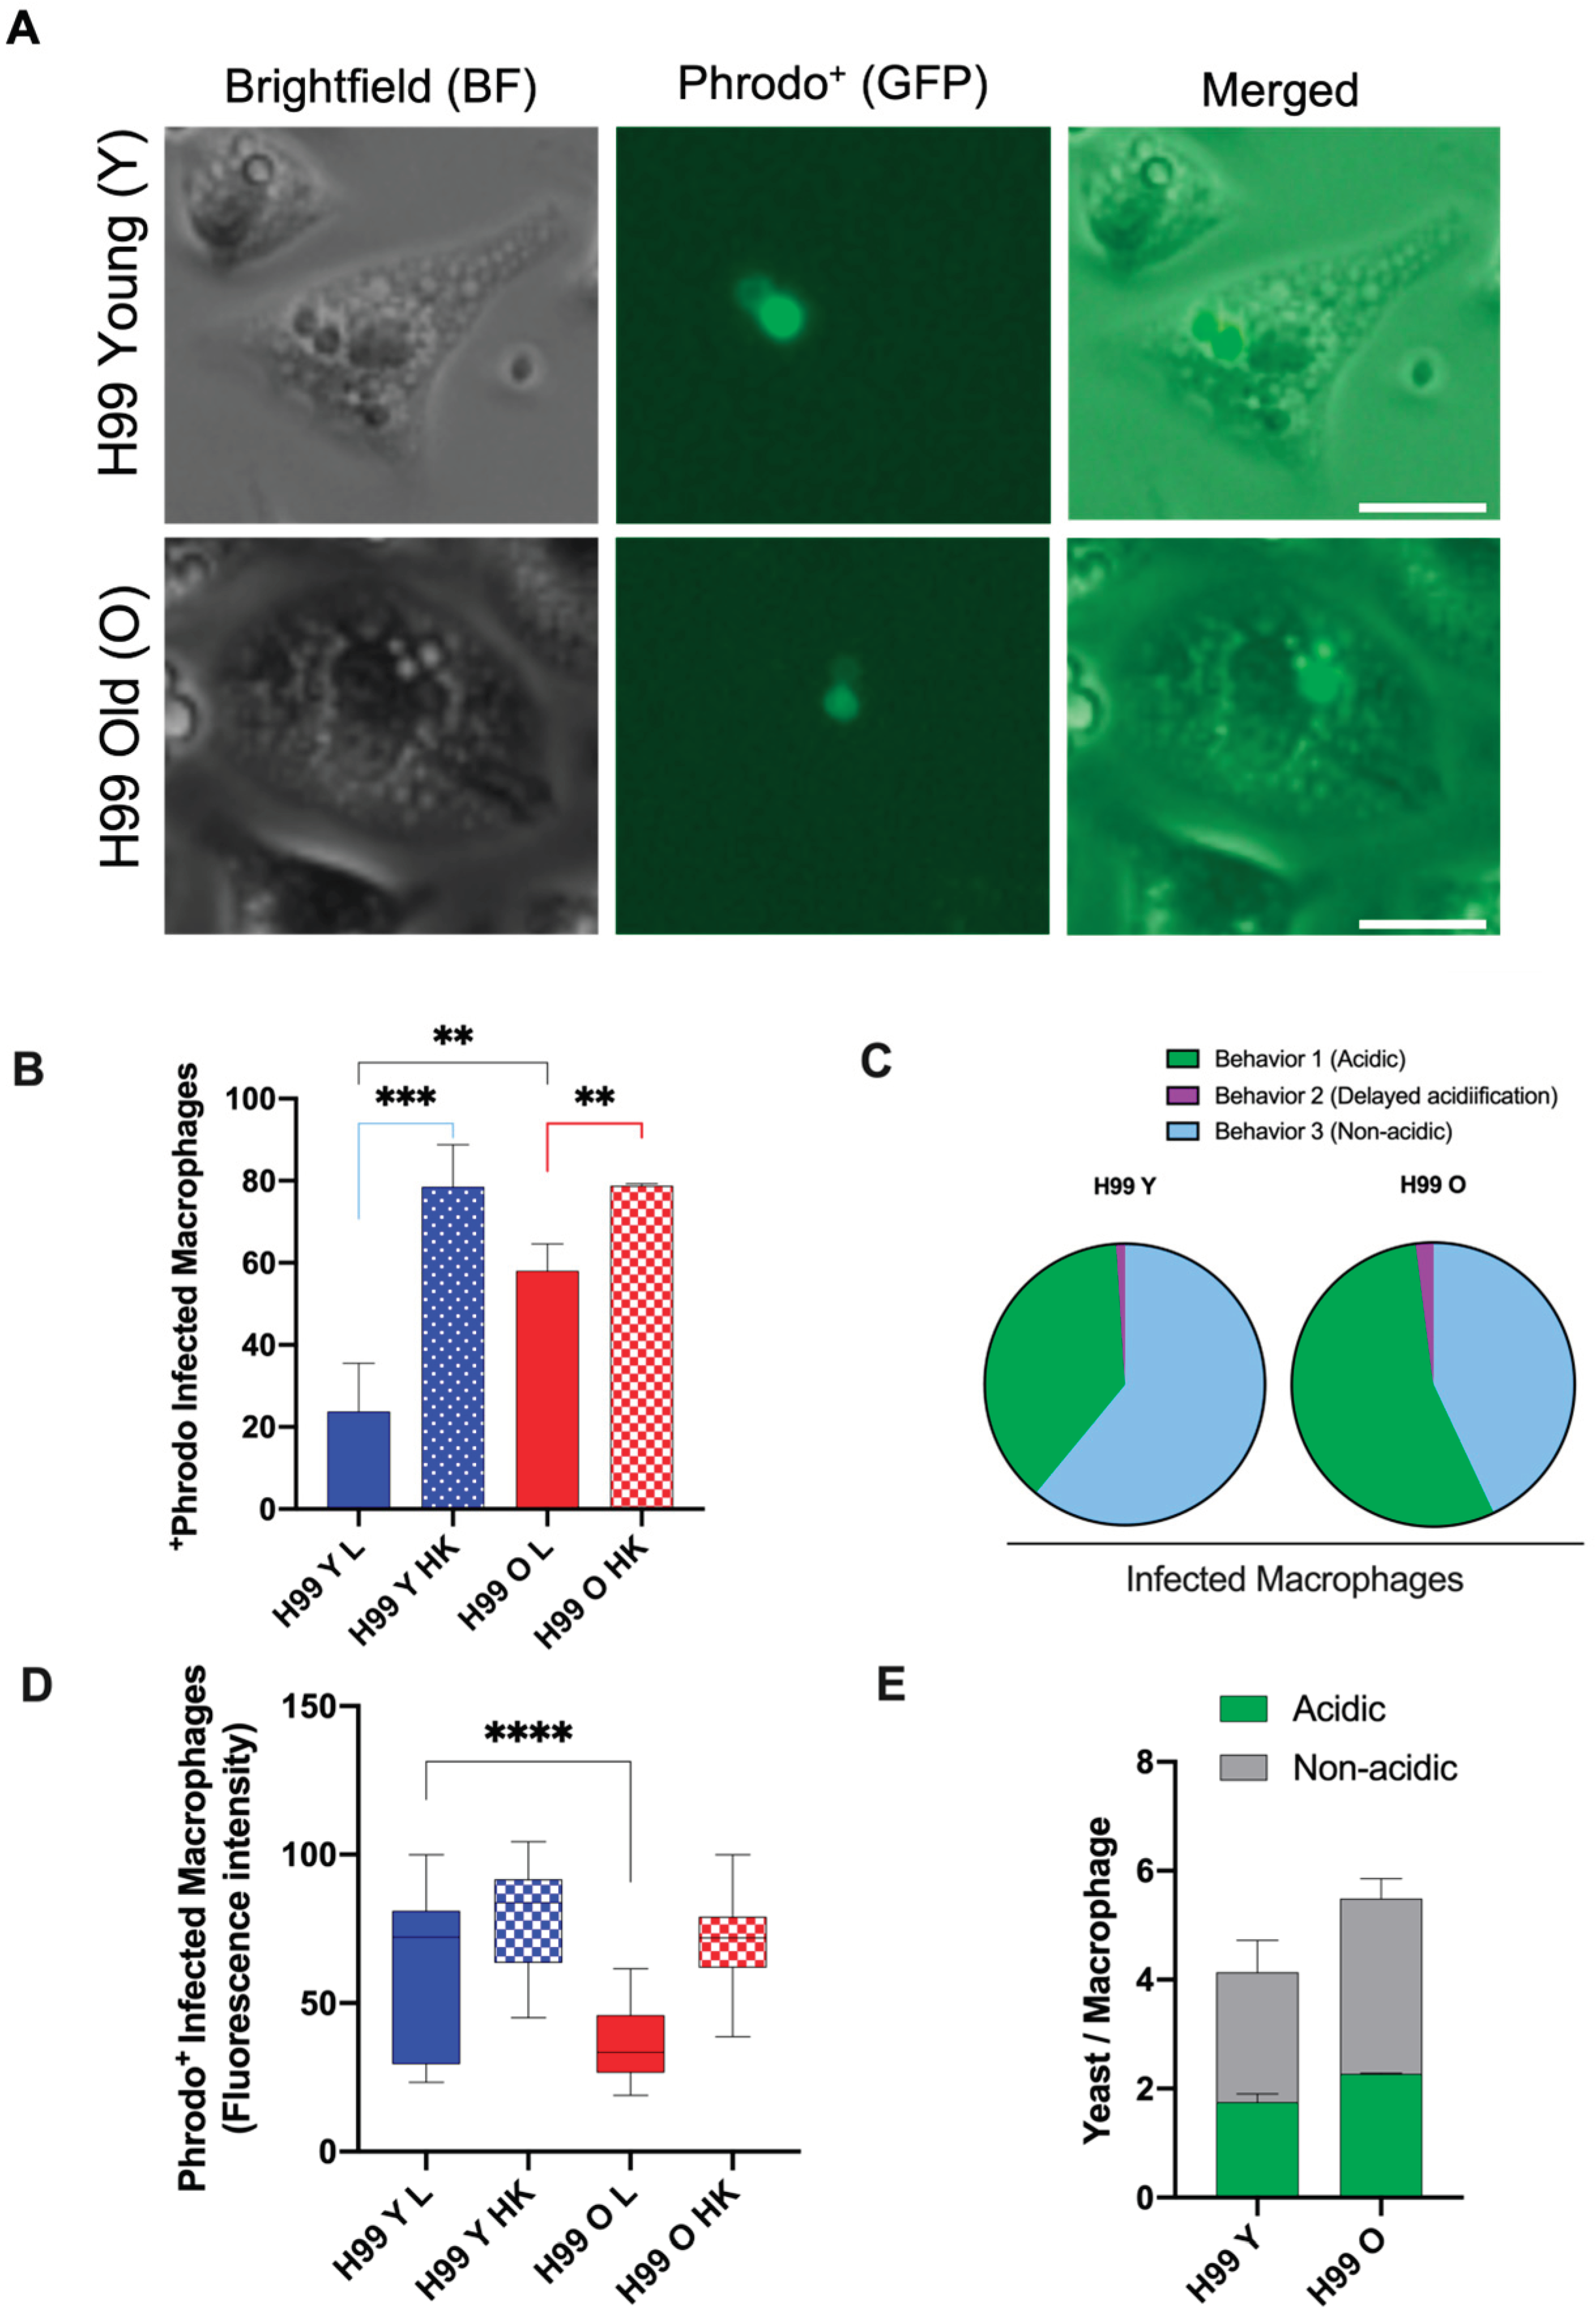
Figure 7.
Phagosomal permeability of macrophages infected with C. neoformans. The frequency of phagosomal membrane permeability of macrophages infected with live (L) young (H99 Y, blue) and old (H99 O, red) C. neoformans and, respective heat-killed (HK) controls, were measured using Lysotracker deep red staining. Macrophages with permeable phagosomes were determined by loss of Lysotracker deep red. The data shown is the quantification of loss of the staining intensity verified in 100 infected macrophages, for each group, using images acquired after two hours of infection. Images were taken using Nikon Ti2-E PFS and analyzed by ImageJ. The bar chart shows the comparison of macrophages containing young with old C. neoformans (asterisk symbols) and live with HK C. neoformans (hashtag symbols). P values by t-test with Welch's correction (**** p < 0.001, # p <0.05, ## p < 0.01).
Figure 8.
Schematic representation of replicative aging effects on the interactions of young and old C. neoformans (Cn) with host macrophage cells and fungal virulence-associated factors with intracellular persistence. This illustration was created using Biorender.
Figure 8.
Schematic representation of replicative aging effects on the interactions of young and old C. neoformans (Cn) with host macrophage cells and fungal virulence-associated factors with intracellular persistence. This illustration was created using Biorender.
Table 1.
Golgi morphologies pattern in young and old C. neoformans.
Table 1.
Golgi morphologies pattern in young and old C. neoformans.
| Golgi Morphology |
Young |
Old |
| Peripherical |
62.85% |
60% |
| Central |
37.15% |
40% |
