Submitted:
06 March 2024
Posted:
07 March 2024
You are already at the latest version
Abstract
Keywords:
1. Introduction
2. Materials and Methods
2.1. Sample and Isolate Collection
2.2. MIC Determination
2.3. Population Analysis Profiling (PAP) Assay
2.4. Whole Genome Sequencing
2.5. Statistical Analysis
3. Results
3.1. Population Analysis Profiling (PAP)
3.2. High Prevalence of Multi-Drug Resistant and Carbapenemase Producing Isolates
3.3. Analysis of Association between Colistin Resistant K. pneumoniae, ST Type, O-Antigen Type and K-Antigen Type
3.4. A Higher Proportion of CR among Specific ST Types Was Not Reflected in CHR Proportions
3.5. Analysis of Association between Colistin (Hetero)Resistance K. pneumoniae, Country, Intervention Strategy and MIC-Value
3.6. Colistin Resistance Mechanisms in Resistant Subpopulations
4. Discussion
Supplementary Materials
Author Contributions
Acknowledgments
Conflicts of Interest
References
- Roch, M., R. Sierra, and D. O. Andrey. "Antibiotic Heteroresistance in Eskape Pathogens, from Bench to Bedside." Clin Microbiol Infect (2022). [CrossRef]
- Della Rocca, M. T., F. Foglia, V. Crudele, G. Greco, A. De Filippis, G. Franci, E. Finamore, and M. Galdiero. "Antimicrobial Resistance Changing Trends of Klebsiella Pneumoniae Isolated over the Last 5 Years." New Microbiol 45, no. 4 (2022): 338-43.
- Mohd Asri, N. A., S. Ahmad, R. Mohamud, N. Mohd Hanafi, N. F. Mohd Zaidi, A. A. Irekeola, R. H. Shueb, L. C. Yee, N. Mohd Noor, F. H. Mustafa, C. Y. Yean, and N. Y. Yusof. "Global Prevalence of Nosocomial Multidrug-Resistant Klebsiella Pneumoniae: A Systematic Review and Meta-Analysis." Antibiotics (Basel) 10, no. 12 (2021). [CrossRef]
- Wang, M. G., M. Earley, L. Chen, B. M. Hanson, Y. S. Yu, Z. Y. Liu, S. Salcedo, E. Cober, L. J. Li, S. S. Kanj, H. Gao, J. M. Munita, K. Ordoñez, G. Weston, M. J. Satlin, S. L. Valderrama-Beltrán, K. Marimuthu, M. E. Stryjewski, L. Komarow, C. Luterbach, S. H. Marshall, S. D. Rudin, C. Manca, D. L. Paterson, J. Reyes, M. V. Villegas, S. Evans, C. Hill, R. Arias, K. Baum, B. C. Fries, Y. Doi, R. Patel, B. N. Kreiswirth, R. A. Bonomo, H. F. Chambers, VG Fowler, C. A. Arias, D. van Duin, and Multi-Drug Resistant. "Clinical Outcomes and Bacterial Characteristics of Carbapenem-Resistant Complex among Patients from Different Global Regions (Crackle-2): A Prospective, Multicentre, Cohort Study." Lancet Infectious Diseases 22, no. 3 (2022): 401-12. [CrossRef]
- Ah, Y. M., A. J. Kim, and J. Y. Lee. "Colistin Resistance in Klebsiella Pneumoniae." Int J Antimicrob Agents 44, no. 1 (2014): 8-15. [CrossRef]
- Ahmed, M. A. G. E. S., L. L. Zhong, C. Shen, Y. Q. Yang, Y. Doi, and G. B. Tian. "Colistin and Its Role in the Era of Antibiotic Resistance: An Extended Review (2000-2019)." Emerging Microbes & Infections 9, no. 1 (2020): 868-85. [CrossRef]
- Band, V. I., S. W. Satola, E. M. Burd, M. M. Farley, J. T. Jacob, and D. S. Weiss. "Carbapenem-Resistant Klebsiella Pneumoniae Exhibiting Clinically Undetected Colistin Heteroresistance Leads to Treatment Failure in a Murine Model of Infection." mBio 9, no. 2 (2018). [CrossRef]
- Moosavian, M., S. Shoja, R. Nashibi, N. Ebrahimi, M. A. Tabatabaiefar, S. Rostami, and A. Peymani. "Post Neurosurgical Meningitis Due to Colistin Heteroresistant Acinetobacter Baumannii." Jundishapur J Microbiol 7, no. 10 (2014): e12287. [CrossRef]
- Andersson, D. I., H. Nicoloff, and K. Hjort. "Mechanisms and Clinical Relevance of Bacterial Heteroresistance." Nature Reviews Microbiology 17, no. 8 (2019): 479-96. [CrossRef]
- Stojowska-Swedrzynska, K., A. Lupkowska, D. Kuczynska-Wisnik, and E. Laskowska. "Antibiotic Heteroresistance in Klebsiella Pneumoniae." Int J Mol Sci 23, no. 1 (2021). [CrossRef]
- Dewachter, L., M. Fauvart, and J. Michiels. "Bacterial Heterogeneity and Antibiotic Survival: Understanding and Combatting Persistence and Heteroresistance." Mol Cell 76, no. 2 (2019): 255-67. [CrossRef]
- Wittekamp, B. H., N. L. Plantinga, B. Cooper, J. Lopez-Contreras, P. Coll, J. Mancebo, M. P. Wise, M. P. G. Morgan, P. Depuydt, J. Boelens, T. Dugernier, V. Verbelen, P. G. Jorens, W. Verbrugghe, S. Malhotra-Kumar, P. Damas, C. Meex, K. Leleu, A. M. van den Abeele, A. F. G. P. de Matos, S. F. Mendez, A. V. Gomez, V. Tomic, F. Sifrer, E. Villarreal, J. R. Ramos, I. Aragao, C. Santos, R. H. M. Sperning, P. Coppadoro, G. Nardi, C. Brun-Buisson, and M. J. M. Bonten. "Decontamination Strategies and Bloodstream Infections with Antibiotic-Resistant Microorganisms in Ventilated Patients a Randomized Clinical Trial." Jama-Journal of the American Medical Association 320, no. 20 (2018): 2087-98. [CrossRef]
- European Committee on Antimicrobial Susceptibility Testing. "The European Committee on Antimicrobial Susceptibility Testing. Breakpoint Tables for Interpretation of Mics and Zone Diameters." https://www.eucast.org, 2023.
- Rajakani, S. G., B. B. Xavier, A. Sey, E. Mariem, C. Lammens, H. Goossens, Y. Glupczynski, and S. Malhotra-Kumar. "Insight into Antibiotic Synergy Combinations for Eliminating Colistin Heteroresistant." Genes 14, no. 7 (2023). [CrossRef]
- Band, V. I., D. A. Hufnagel, S. Jaggavarapu, E. X. Sherman, J. E. Wozniak, S. W. Satola, M. M. Farley, J. T. Jacob, E. M. Burd, and D. S. Weiss. "Antibiotic Combinations That Exploit Heteroresistance to Multiple Drugs Effectively Control Infection." Nature Microbiology 4, no. 10 (2019): 1627-35. [CrossRef]
- Xavier, B. B., M. Mysara, M. Bolzan, B. Ribeiro-Goncalves, B. T. F. Alako, P. Harrison, C. Lammens, S. Kumar-Singh, H. Goossens, J. A. Carrico, G. Cochrane, and S. Malhotra-Kumar. "Bacpipe: A Rapid, User-Friendly Whole-Genome Sequencing Pipeline for Clinical Diagnostic Bacteriology." iScience 23, no. 1 (2020): 100769. [CrossRef]
- Magiorakos, A. P., A. Srinivasan, R. B. Carey, Y. Carmeli, M. E. Falagas, C. G. Giske, S. Harbarth, J. F. Hindler, G. Kahlmeter, B. Olsson-Liljequist, D. L. Paterson, L. B. Rice, J. Stelling, M. J. Struelens, A. Vatopoulos, J. T. Weber, and D. L. Monnet. "Multidrug-Resistant, Extensively Drug-Resistant and Pandrug-Resistant Bacteria: An International Expert Proposal for Interim Standard Definitions for Acquired Resistance." Clin Microbiol Infect 18, no. 3 (2012): 268-81. [CrossRef]
- Juhasz, E., M. Ivan, E. Pinter, J. Pongracz, and K. Kristof. "Colistin Resistance among Blood Culture Isolates at a Tertiary Care Centre in Hungary." J Glob Antimicrob Resist 11 (2017): 167-70. [CrossRef]
- Sherman, E. X., J. E. Wozniak, and D. S. Weiss. "Methods to Evaluate Colistin Heteroresistance in Acinetobacter Baumannii." Methods Mol Biol 1946 (2019): 39-50. [CrossRef]
- Morales-Leon, F., C. A. Lima, G. Gonzalez-Rocha, A. Opazo-Capurro, and H. Bello-Toledo. "Colistin Heteroresistance among Extended Spectrum Beta-Lactamases-Producing Klebsiella Pneumoniae." Microorganisms 8, no. 9 (2020). [CrossRef]
- Band, V. I., S. W. Satola, R. D. Smith, D. A. Hufnagel, C. Bower, A. B. Conley, L. Rishishwar, S. E. Dale, D. J. Hardy, R. L. Vargas, G. Dumyati, M. A. Kainer, E. C. Phipps, R. Pierce, L. E. Wilson, M. Sorensen, E. Nilsson, I. K. Jordan, E. M. Burd, M. M. Farley, J. T. Jacob, R. K. Ernst, and D. S. Weiss. "Colistin Heteroresistance Is Largely Undetected among Carbapenem-Resistant Enterobacterales in the United States." mBio 12, no. 1 (2021). [CrossRef]
- Kon, H., A. Hameir, A. Nutman, E. Temkin, A. Keren Paz, J. Lellouche, D. Schwartz, D. S. Weiss, K. S. Kaye, G. L. Daikos, A. Skiada, E. Durante-Mangoni, Y. Dishon Benattar, D. Yahav, V. Daitch, M. Bernardo, D. Iossa, L. E. Friberg, U. Theuretzbacher, L. Leibovici, Y. Dickstein, D. Pollak, S. Mendelsohn, M. Paul, and Y. Carmeli. "Prevalence and Clinical Consequences of Colistin Heteroresistance and Evolution into Full Resistance in Carbapenem-Resistant Acinetobacter Baumannii." Microbiol Spectr (2023): e0509322. [CrossRef]
- Howard-Anderson, J., M. Davis, A. M. Page, C. W. Bower, G. Smith, J. T. Jacob, D. I. Andersson, D. S. Weiss, and S. W. Satola. "Prevalence of Colistin Heteroresistance in Carbapenem-Resistant Pseudomonas Aeruginosa and Association with Clinical Outcomes in Patients: An Observational Study." J Antimicrob Chemother 77, no. 3 (2022): 793-98. [CrossRef]
- European Centre for Disease Prevention Control. "Antimicrobial Consumption in the Eu/Eea (Esac-Net) - Annual Epidemiological Report 2021." https://www.ecdc.europa.eu/, 2022.
- Bialek-Davenet, S., A. Criscuolo, F. Ailloud, V. Passet, L. Jones, A. S. Delannoy-Vieillard, B. Garin, S. Le Hello, G. Arlet, M. H. Nicolas-Chanoine, D. Decre, and S. Brisse. "Genomic Definition of Hypervirulent and Multidrug-Resistant Klebsiella Pneumoniae Clonal Groups." Emerg Infect Dis 20, no. 11 (2014): 1812-20. [CrossRef]
- Peirano, G., L. Chen, B. N. Kreiswirth, and J. D. D. Pitout. "Emerging Antimicrobial-Resistant High-Risk Klebsiella Pneumoniae Clones St307 and St147." Antimicrob Agents Chemother 64, no. 10 (2020). [CrossRef]
- Rodrigues, C., S. Desai, V. Passet, D. Gajjar, and S. Brisse. "Genomic Evolution of the Globally Disseminated Multidrug-Resistant Klebsiella Pneumoniae Clonal Group 147." Microb Genom 8, no. 1 (2022). [CrossRef]
- Sanchez-Leon, I., E. Perez-Nadales, J. A. Marin-Sanz, T. Garcia-Martinez, and L. Martinez-Martinez. "Heteroresistance to Colistin in Wild-Type Klebsiella Pneumoniae Isolates from Clinical Origin." Microbiol Spectr 11, no. 6 (2023): e0223823. [CrossRef]
- Luo, Q., L. Xu, Y. Wang, H. Fu, T. Xiao, W. Yu, W. Zhou, K. Zhang, J. Shen, J. Ji, C. Ying, and Y. Xiao. "Clinical Relevance, Mechanisms and Evolution of Polymyxin B Heteroresistance Carbapenem-Resistant Klebsiella Pneumoniae: A Genomic, Retrospective Cohort Study." Clin Microbiol Infect (2024). [CrossRef]
- El-Halfawy, O. M. , and M. A. Valvano. "Antimicrobial Heteroresistance: An Emerging Field in Need of Clarity." Clin Microbiol Rev 28, no. 1 (2015): 191-207. [CrossRef]
| Observed results | No. of isolates | |
|---|---|---|
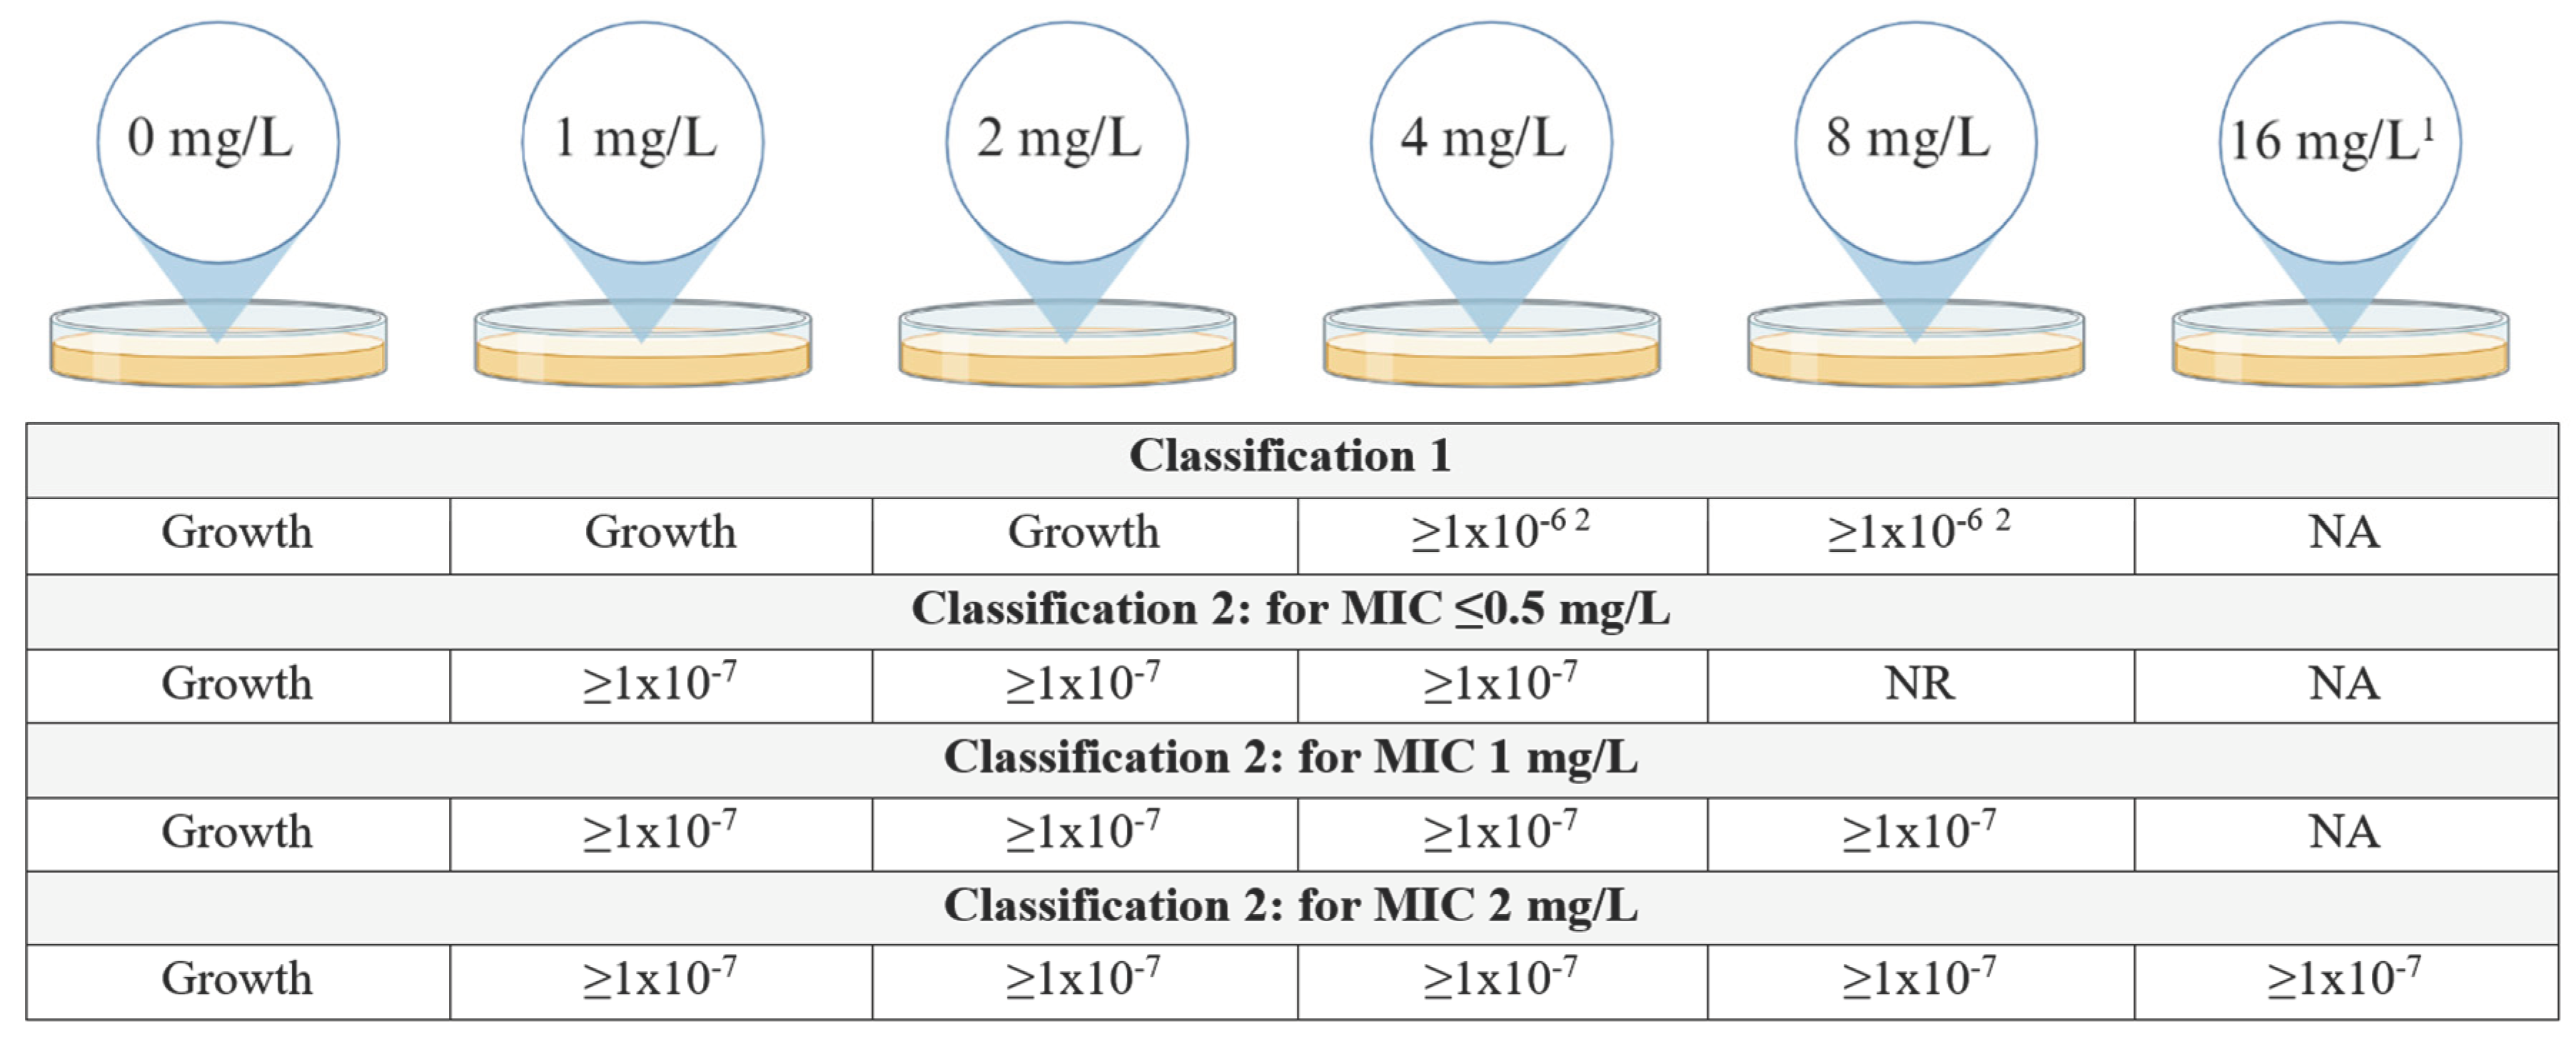
| Fulfilling classification 1 | Growth on the plates containing 4 and/or 8 mg/L of colistin with a frequency of at least 1•10-6 | 25 |
| Fulfilling only classification 2 | Growth on at least all the plates containing colistin at a concentration up to and including 8-fold the MIC of the isolate at a frequency of minimally 1•10-7, minimum concentration at which there should be growth was 4 mg/L | 83 |
| Not fulfilling either classification but growth >2 mg/L | Growth on 4 and/or 8 mg/L plate but frequency <1•10-7 | 45 |
| For MIC 0.0625-0.5 mg/L: growth with frequency ≥1•10-7 on 8 mg/L plate but <1•10-7 on 4 mg/L plate | 8 | |
| For MIC 1-2 mg/L: growth with frequency ≥1•10-7 on 4 and/or 8 mg/L plate but <1•10-7 on plates ≥8-fold the MIC | 30 | |
| Growth with frequency ≥1•10-7 on plates ≥8-fold the MIC but frequency of 1•10-7 not reached on all plates <8-fold the MIC | 19 | |
| No growth at 4 and 8 mg/L | 71 | |
| No growth at 1, 2, 4 and 8 mg/L | 7 | |
| Isolate ID | MIC(mg/L) | ST type | PAP assay plate conc. (mg/L) | Mutations in mgrB | Other mutations |
|---|---|---|---|---|---|
| IT0307CP(CR) | 128 | ST409 | IS1R of IS1 family interruption at nt 107 | ||
| IT0636C(CR) | 128 | ST409 | ISKpn34 of IS3 family interruption at nt 46 | ||
| IT0915C(CR) | 64 | ST409 | IS903B of IS5 family interruption at nt 34 | ||
| IT0244CP(CHR1st PAP) | 0.5 | ST409 | 2 | ISKpn34 of IS3 family interruption at promoter | |
| 8 | IS903B of IS5 family interruption at nt 117 | ||||
| 16 | IS1S of IS1 family interruption at promoter | ||||
| IT0244CP(CHR3rd PAP) | 0.5 | ST409 | 2 | IS1X2 of IS1 family interruption at nt 123 | |
| AN1505CP2(CHR1st PAP) | 1 | ST323 | 4 | Deleted | |
| 8 | IS903B of IS5 family interruption at nt 70 | ||||
| AN1505CP2(CHR2nd PAP) | 1 | ST323 | 8 | pmrB: T157P | |
| AN1505CP2(CHR3rd PAP) | 1 | ST323 | 8 | Q30X | |
| 16 | Deleted |
Disclaimer/Publisher’s Note: The statements, opinions and data contained in all publications are solely those of the individual author(s) and contributor(s) and not of MDPI and/or the editor(s). MDPI and/or the editor(s) disclaim responsibility for any injury to people or property resulting from any ideas, methods, instructions or products referred to in the content. |
© 2024 by the authors. Licensee MDPI, Basel, Switzerland. This article is an open access article distributed under the terms and conditions of the Creative Commons Attribution (CC BY) license (http://creativecommons.org/licenses/by/4.0/).


