1. Introduction
Recent advances in medical and biomedical engineering fields have led to a surge of research in non-invasive measurement techniques, capable of determining physiological states without reliance on surgical or invasive diagnostics [
1].
Among these, the use of Functional Near-Infrared Spectroscopy (fNIRS) in neuroscience has gained prominence for understanding cognitive and emotional states of the brain, and for health monitoring [
2].
fNIRS, a method indirectly measuring brain activity through changes in blood oxygen saturation, is acknowledged as a valuable tool for detecting functional operations of the brain [
3]. This technology utilizes optical properties to observe changes in concentrations of oxygenated and deoxygenated hemoglobin, offering a significant advantage of providing a non-invasive measurement method [
4].
The potential applications of fNIRS extend to the measurement of physiological signals related to cardiac and respiratory activities, which are considered one of its significant values [
5,
6]. fNIRS boasts advantages of being non-invasive, cost-effective, and portable, making it feasible for real-time heart rate measurement and stress condition assessment using cerebral blood flow changes [
7].
However, physiological signals like heartbeats, which exhibit peak intervals or periodicity, present the challenge of reliable measurement due to external factors such as noise [
8,
9].
fNIRS data typically contain artifacts classified into two categories: external and physiological interference [
10]. External interference primarily arises from environmental factors or participant movement, with motion artifacts, induced by head movements of the participant causing abrupt signal changes, being a prime example [
11].
In contrast, physiological interference originates from the participant's bodily activities, with heart rate, blood pressure, Mayer waves (natural variations in blood pressure), and respiration acting as the primary causes [
12]. Despite the challenge of physiological interference, methods have been developed to interpolate the desired signal by identifying noisy channels, filtering out high-frequency components, and curve fitting [
13].
Indeed, due to the inherent physiological interferences and the unique characteristics of fNIRS, the extraction of the CBI from the heart rate remains a significant challenge [
14]. This complexity arises from the potential distortion of signals caused by a variety of intricate factors, including cerebral blood flow. Such obstacles underline the need for advanced and precise methodologies to accurately interpret fNIRS data in the context of heart rate monitoring [
15].
This paper proposes a Signal Integration Reconstruction Peak Detection (SIRPD) algorithm that enables reliable Cardiac Beat Interval (CBI) measurement of the heart using fNIRS signals. This algorithm is based on the hypothesis that a regular waveform exists due to changes in heart blood flow, which can be reproduced even with significant noise through signal reconstruction. The algorithm is designed to integrate various signal processing techniques and is implemented to suit real-time monitoring, allowing for Cardiac Beat Interval (CBI) detection regardless of the number of input data points and channels. This effort includes attempts to overcome the limitations of existing measurement methods.
2. Materials and Methods
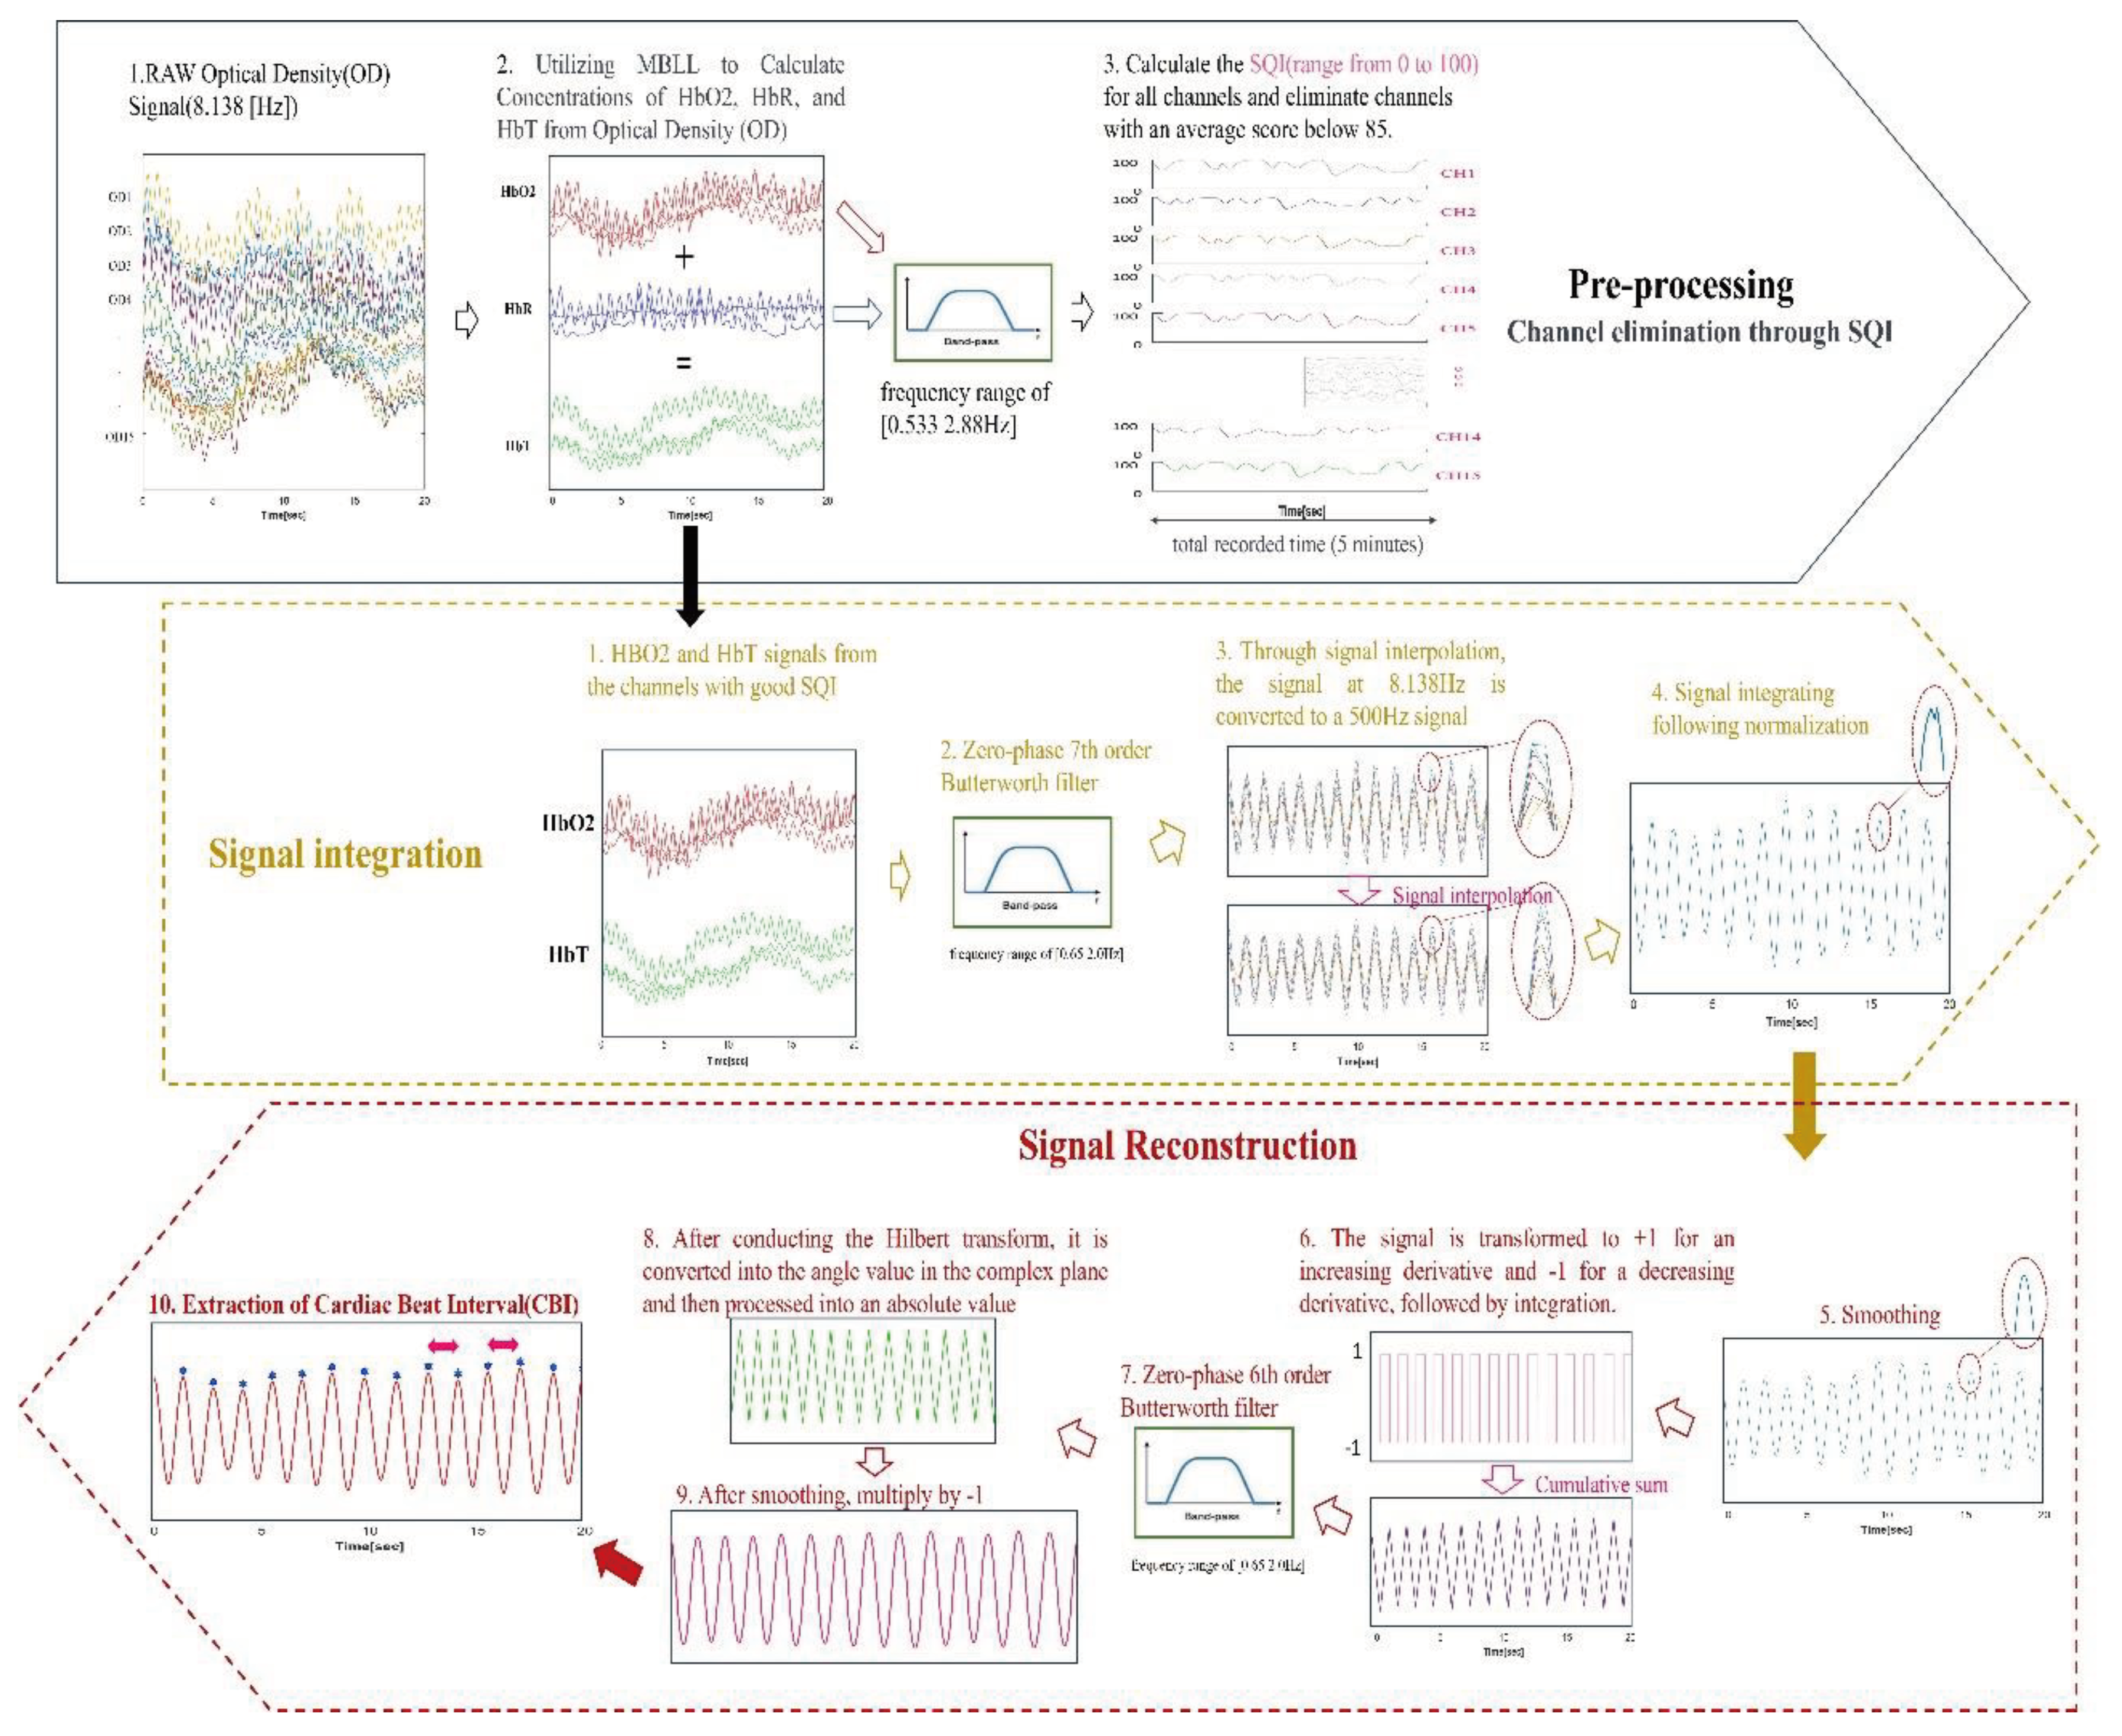
The SIRPD algorithm, specifically designed for detecting the Cardiac Beat Interval (CBI) from fNIRS signals, is delineated through a block diagram, as seen in
Figure 1. The process primarily consists of stages including preprocessing, signal integration, and signal reconstruction. The final stage is dedicated to the extraction of CBI time series data. Subsequent sections will elaborate on the preprocessing and algorithm development in detail.
2.1. Pre-processing: Channel Selection Using the Signal Quality Index (SQI)
The wearable fNIRS device used for the analysis necessitates the omission of data from any channels if the signal quality is compromised due to equipment shake resulting from user movement. To address this, we employed the Signal Quality Index (SQI) algorithm [
16]. This algorithm quantitatively assesses the fNIRS data, assigning a quality score on a scale from 0 (indicating very low quality) to 100 (indicating very high quality). The calculation of the SQI involves two key steps.
Firstly, the cleaned optical density signals were transformed into relative concentration change signals of oxyhemoglobin (HbO2) and deoxyhemoglobin (HbR). This transformation was based on the modified Beer-Lambert law [
17,
18], utilizing differential path length factors (DPF) of 6.08 at 780 nm and 5.09 at 850 nm [
19]. The DPF values were determined based on the average age of the participants.
Secondly, an Infinite Impulse Response (IIR) zero-phase band-pass filter with a frequency range of [0.533 2.88Hz] was applied to the optical density signals at 780 nm and 850 nm, measured at a 30mm distance [
20,
21]. The same filter was also applied to the HbO2 and HbR values calculated through the Modified Beer-Lambert Law (MBLL). The total hemoglobin concentration (HbT) has been calculated by summing the oxyhemoglobin (HbO2) and deoxyhemoglobin (HbR) due to its sensitivity to physiological signals, rendering it a valuable tool for monitoring intrabody state changes [
22].
Finally, the SQI was calculated for the converted signals. The SQI was designed to gradually decrement from 100 if the calculated standard deviation of the autocorrelation differences of the optical density signals at 780 nm and 850 nm within a 5-second window, and the standard deviation of the HbO2/HbR ratio, among other factors, exceeded a set threshold.
During the measurement period, we selected channels that maintained an average SQI of 85 or above. The SQI, calculated based on a 5-second window, is adept at detecting instantaneous noise and facilitates the evaluation of the average signal state. It's noteworthy that channels with highly regular signals exhibit robust resistance to issues such as poor contact, user movement, and equipment shaking.
2.2. SIRPD Algorithm
The SIRPD algorithm evaluates the Signal Quality Index (SQI) for each channel, subsequently discarding signals originating from dysfunctional channels. The algorithm then focuses on the signals of oxygenated hemoglobin (HbO2) and total hemoglobin (HbT) concentrations. These signals undergo an interpolation process, enhancing their resolution and culminating in their integration into a singular, high-resolution channel. This integrated and smoothed signal then undergoes a transformation process aimed at identifying the most significant periodic waveform. By extracting the time interval between peak-peak in the sine wave form, the CBI can be reliably extracted.
2.2.1. Signal Integration
In the development of the SIRPD algorithm, we utilized MATLAB as our primary computational tool. For filtering, we employed the "butter" and "filtfilt" functions, while for signal interpolation, we used the "makima" function. We performed standardization using the "normalize" function, and for signal integration, we utilized the "quantile" function.
The first step in signal integration involves collecting oxygenated hemoglobin (HbO2) and total hemoglobin (HbT) signals from channels with a high Signal Quality Index (SQI). These collected signals are padded on both ends and passed through a zero-phase 7th order Butterworth bandpass filter(0.6-2.0Hz) to exclude heart band signals. Then, we used signal interpolation techniques to convert the original 8.138Hz signal to a 500Hz signal, enhancing the temporal resolution. Each channel undergoes normalization, and then we extract the 25th percentile values for each data point using the percentile function.
2.2.2. Signal Reconstruction.
The functions used for signal reconstruction were as follows: The smoothing functions employed were the "loess" and "gausian" techniques of "smoothdata", while "diff", "sign", "cumsum", ”angle”, "hilbert", and "findpeaks" were utilized for signal reconstruction and CBI extraction.
Our goal is to enhance the accuracy of data related to cardiac activity through signal reconstruction. Signal processing begins with a smoothing stage, where each increasing gradient is transformed to +1, and each decreasing gradient to -1. Through this process, we represent the signal's changing characteristics in a simplified form, eliminating signals with abnormal, rapidly increasing patterns to discern the most common changes. The transformed signal then undergoes a process of cumulative summation to be re-constructed into a waveform with a regular pattern.In cases of data with many abnormal signal fluctuations, a trend occurs below or above, hence we apply a zero-phase 6th order Butterworth filter(0.6-2.0Hz) to remove the trend from the signal. This methodology allows for the extraction of a more polished signal. Post filtration, the signal undergoes a Hilbert transformation, enabling its conversion into an angular value within the complex plane. Following this, an absolute value processing is performed, outputting the signal as a triangular waveform. To prevent any delay phenomena in the triangular waveform, the signal is smoothed using a local regression technique and subsequently multiplied by -1, thereby finalizing the waveform. This multiplication by -1 is a corrective measure for the 180-degree delay that occurs during the Hilbert transformation, phase transformation, and the conversion to a triangular waveform via absolute value.
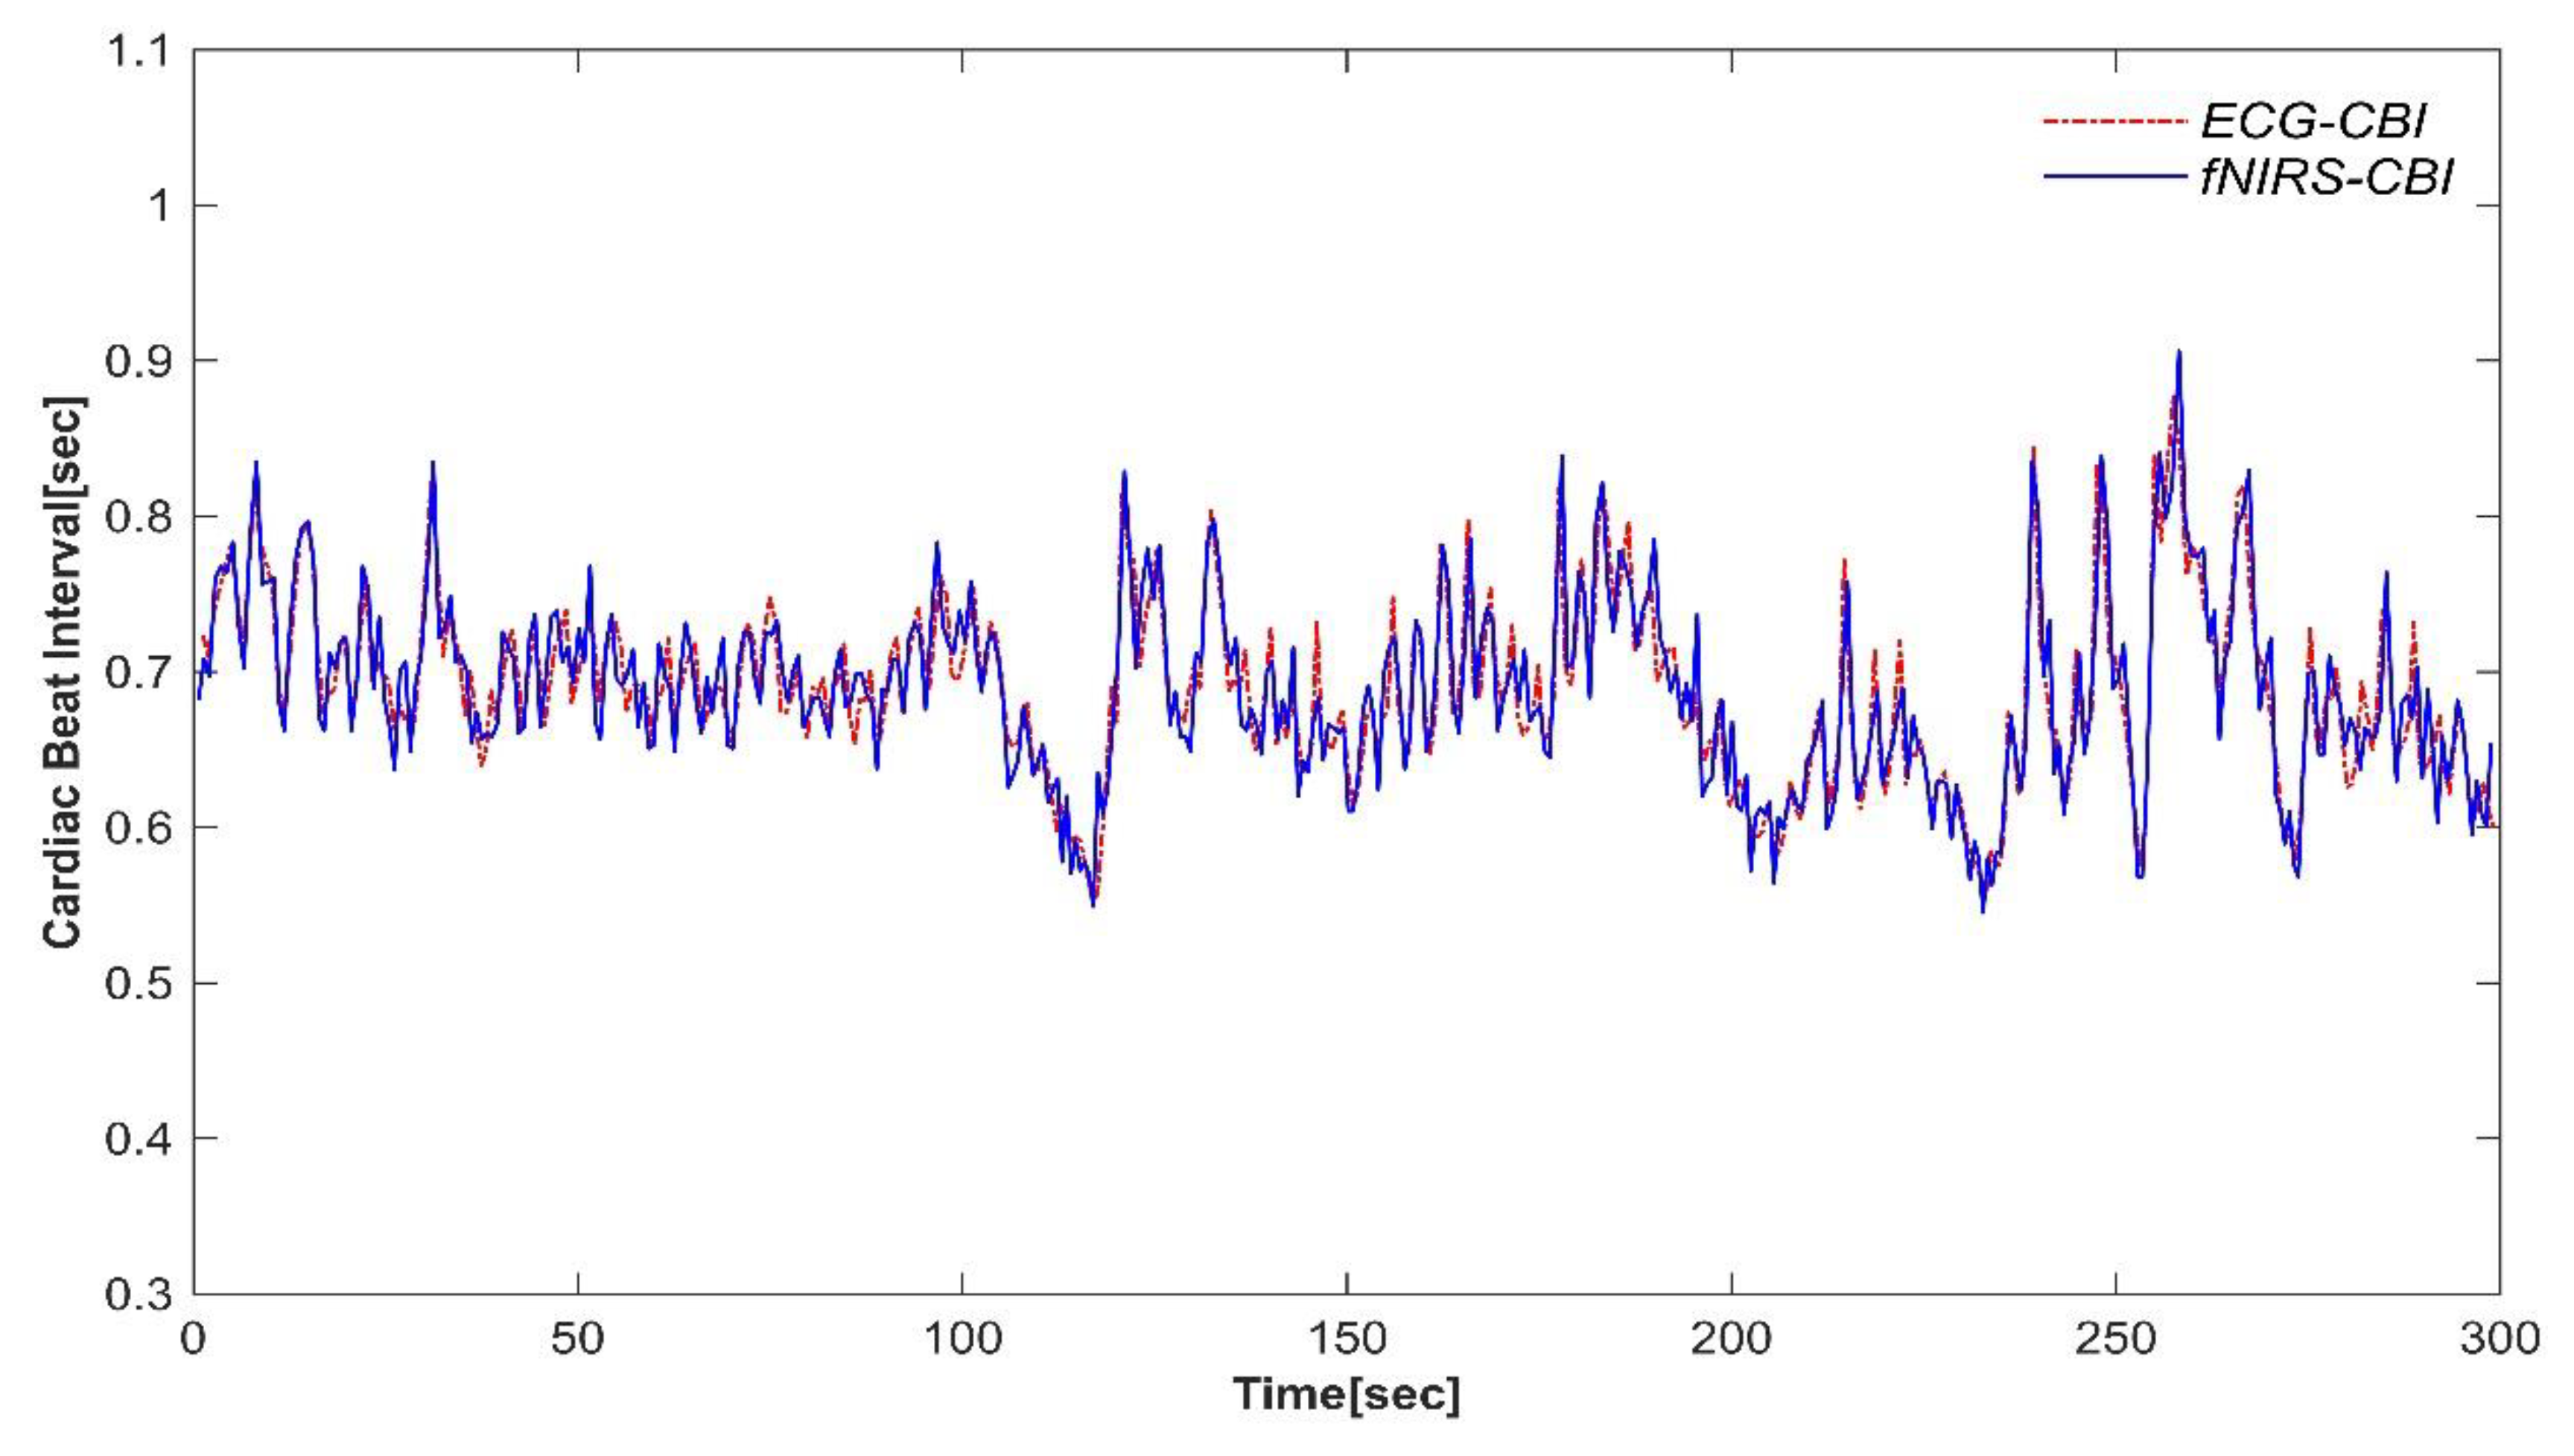
Finally, from the reconstructed signal which now has a regular sinusoidal waveform, we extract the time intervals between peaks as time-series data, yielding a reliable CBI. To visualize the effectiveness of the algorithms, we compared the results of CBI derived from ECG and CBI derived from fNIRS via the Signal Integration Reconstruction Peak Detection (SIRPD) algorithm. The cardiac beat interval time-series data of a representative subject is presented in
Figure 2.
2.3. DATA
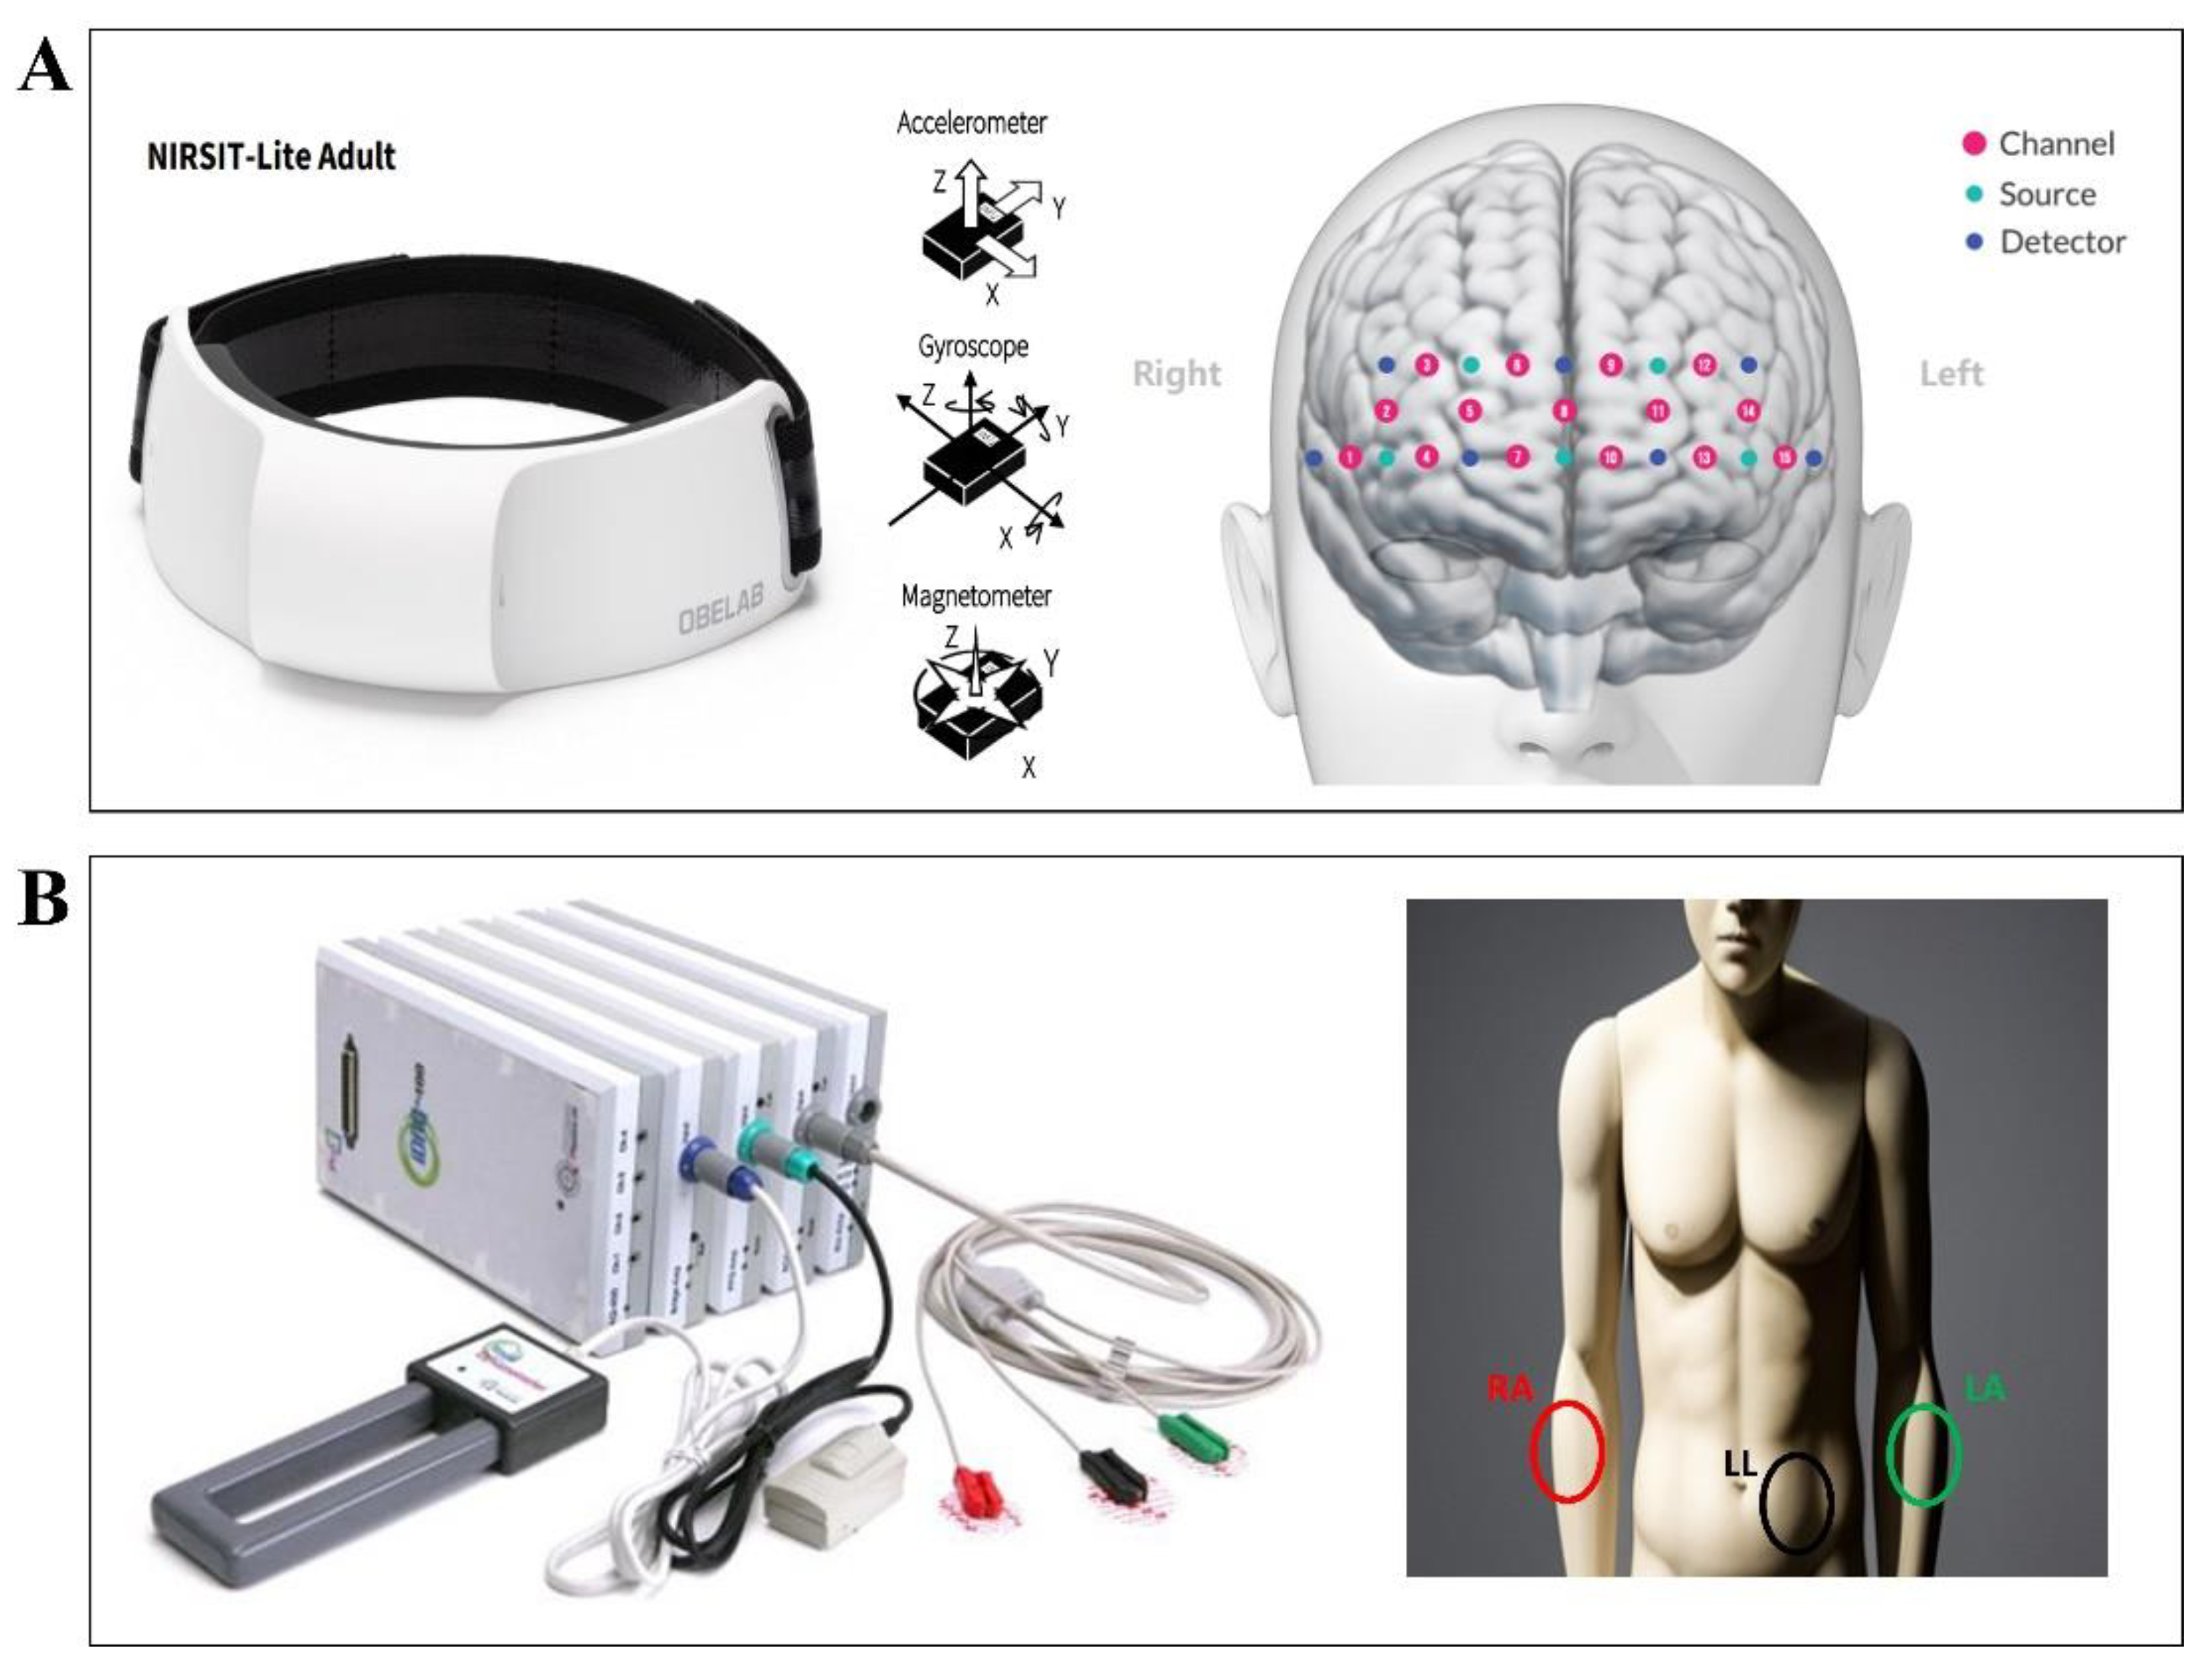
We utilized a portable fNIRS device, the NIRSIT LITE Adult (OBELAB Inc., Seoul, Republic of Korea), to gather hemodynamic responses from the participants' brains. The device's sensor array is composed of seven photodetectors and five dual-wavelength light emitting diodes operating at 780 and 850 nm. This architecture forms 15 channels with a 30 mm source-detector distance, providing coverage of the forehead area (
Figure 3A). The optical signals procured from each channel were sampled at a frequency of 8.138 Hz. For ECG data collection, we utilized the P400 device (PhysioLab Inc., Busan, Republic of Korea). This device recorded ECG signals using three Ag/AgCl electrodes positioned on the RA, LA, and LL sites, with a sampling rate of 500 Hz(
Figure 3B).
2.3.1. Participants
In this study, we simultaneously recorded fNIRS and ECG signals from 20 healthy adults, comprising 7 males and 13 females (average age 23.35 ± 1.68). Based on the participants' self-reports, none had any cardiovascular or neurological diseases, nor were they on any specific medication. All procedures were conducted in accordance with the approval of the Institutional Review Board at Yonsei University, and explicit consent was obtained from all participants.
2.3.2. Data Acquisition Protocol
During a five-minute resting-state scan, we simultaneously gathered fNIRS and ECG data. Participants were comfortably seated and directed to concentrate on a centrally displayed '+' symbol throughout this scan. Prior to the data collection, we provided a comprehensive explanation of the fNIRS and ECG signal acquisition processes to ensure participant understanding.
2.4. Validation and Statistical Analysis
We conducted a comparative validation of the Cardiac Beat Intervals (CBI) extracted from ECG and those derived from fNIRS through the application of the SIRPD algorithm. The preprocessing of the ECG signal was executed using MATLAB (version 2023a, MathWorks, Massachusetts, US). Initially, we eliminated artifacts, noise, and unrelated frequency components employing a zero-phase Butterworth band-pass filter with a cutoff frequency range of 0.65 Hz - 20 Hz. In instances where sudden large signals were observed in the ECG signal, the “filloutliers” function from MATLAB's statistical machine learning toolbox was utilized for signal reconstruction, specifying 'clip' in the details and setting a threshold of 1.5. Following signal filtering, we proceeded with the detection of R-peaks in the ECG signal and the acquisition of CBI time series data. For this process, we employed the open-source neurophysiological signal processing toolbox, NeuroKit2 in Python (version 3.7.1; Neurotoolkit2, version 0.2.5), which utilizes an algorithm based on the slope of the absolute gradient of the ECG signal [
23].
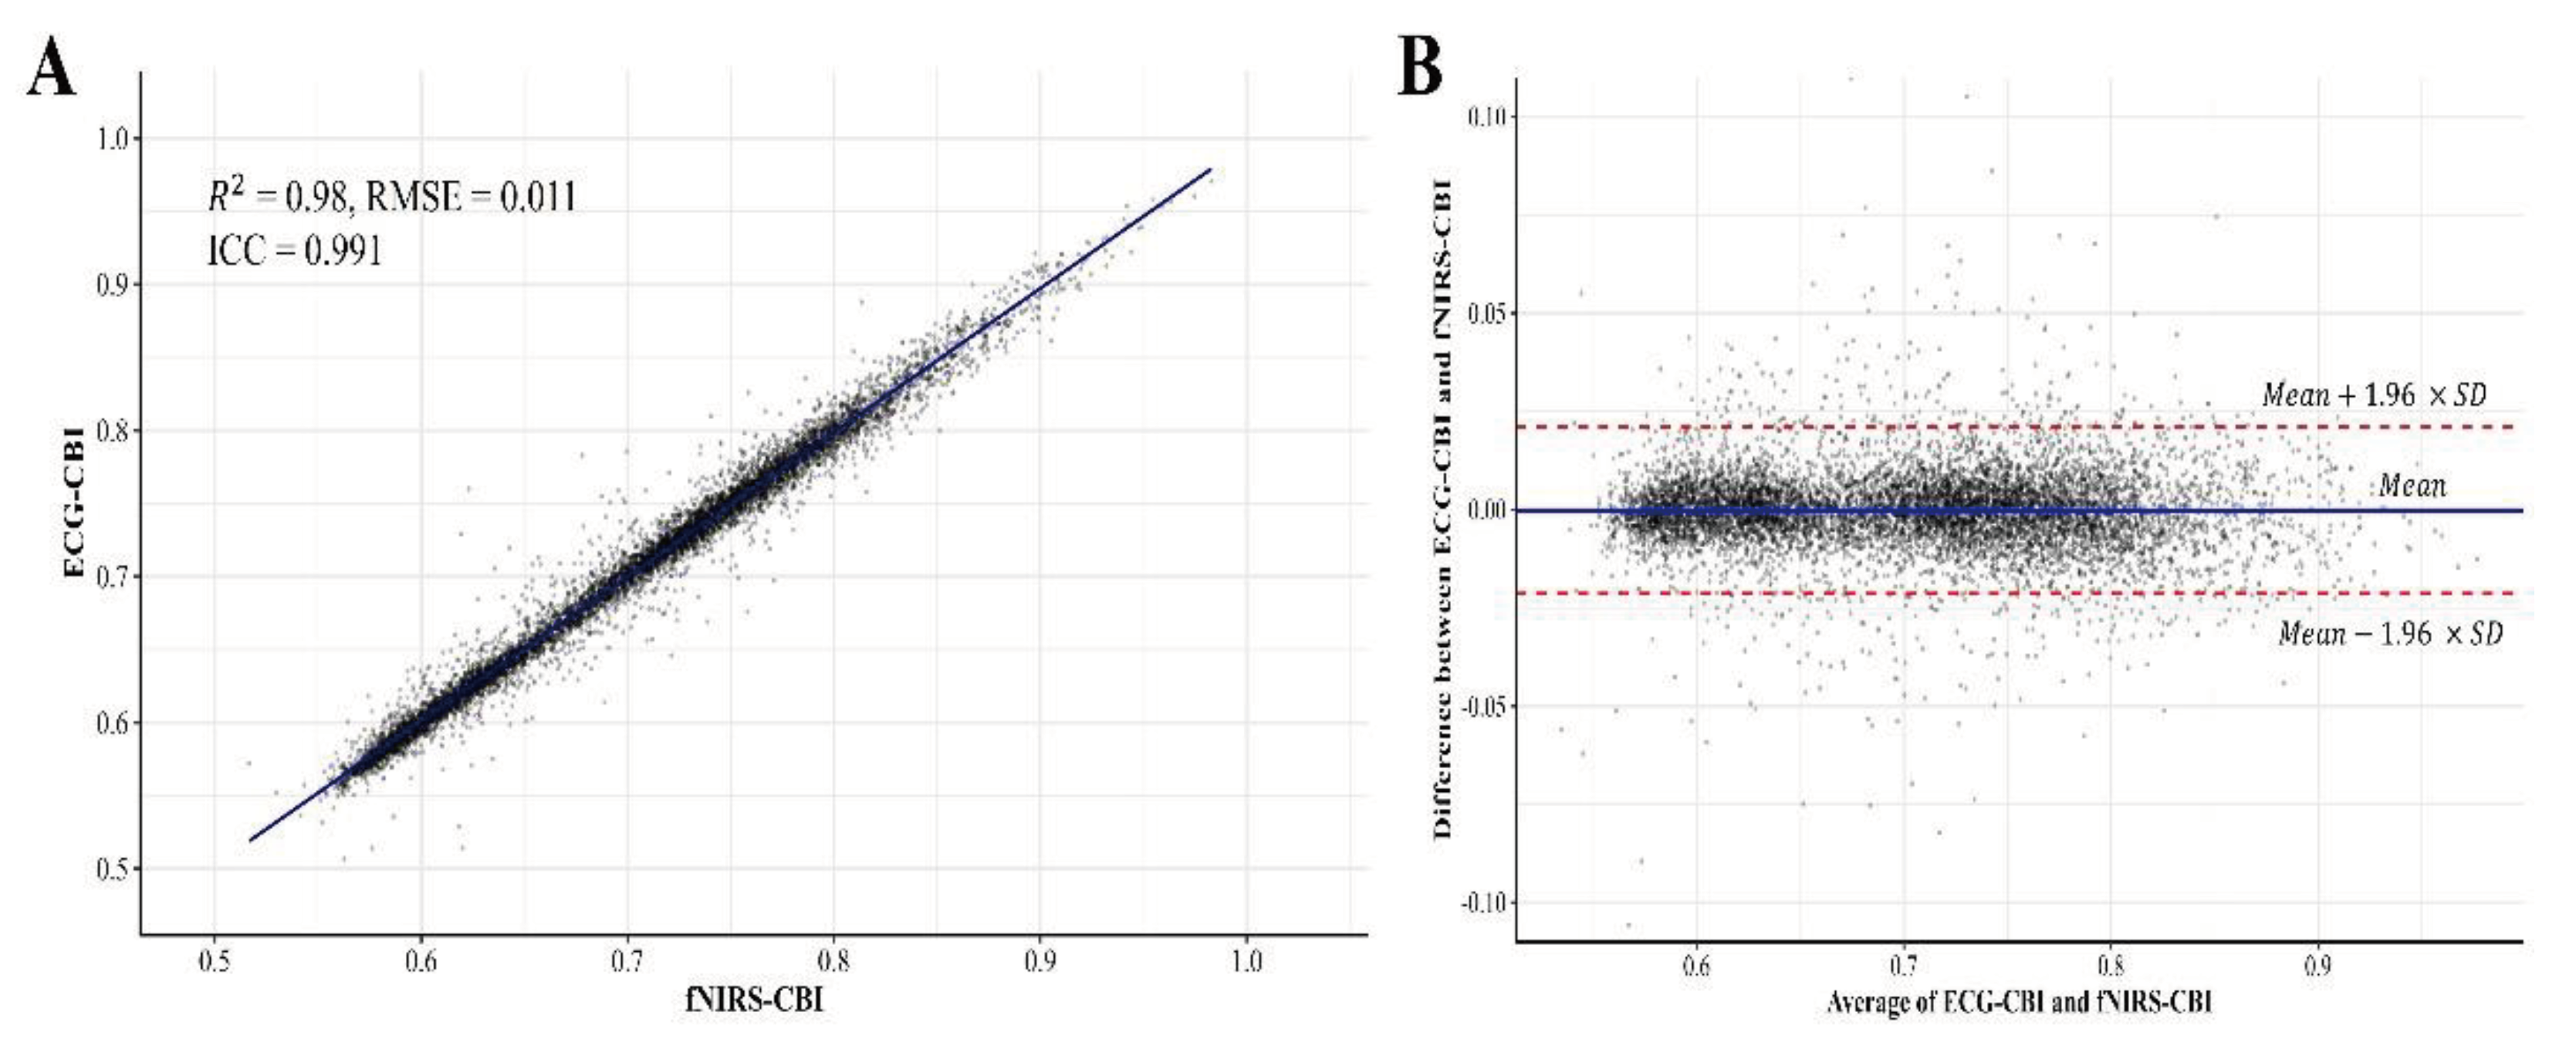
To assess the similarity between the cardiac beat intervals extracted using the widely accepted method from ECG and those derived from fNIRS via the SIRPD algorithm, we conducted an Intraclass Correlation Coefficient (ICC) analysis, correlation analysis, and Bland-Altman plot analysis across all participants' intervals obtained from both devices. Both correlation analysis and Bland-Altman plot analysis utilized all calculated CBI point values from the participants. The ICC estimate was derived using a two-way random-effects model with single rating unit and absolute agreement. An ICC exceeding 0.90 signifies excellent agreement, values ranging between 0.75 to 0.90 denote good agreement, values from 0.50 to 0.75 indicate moderate agreement, and values below 0.50 suggest poor agreement [
24].
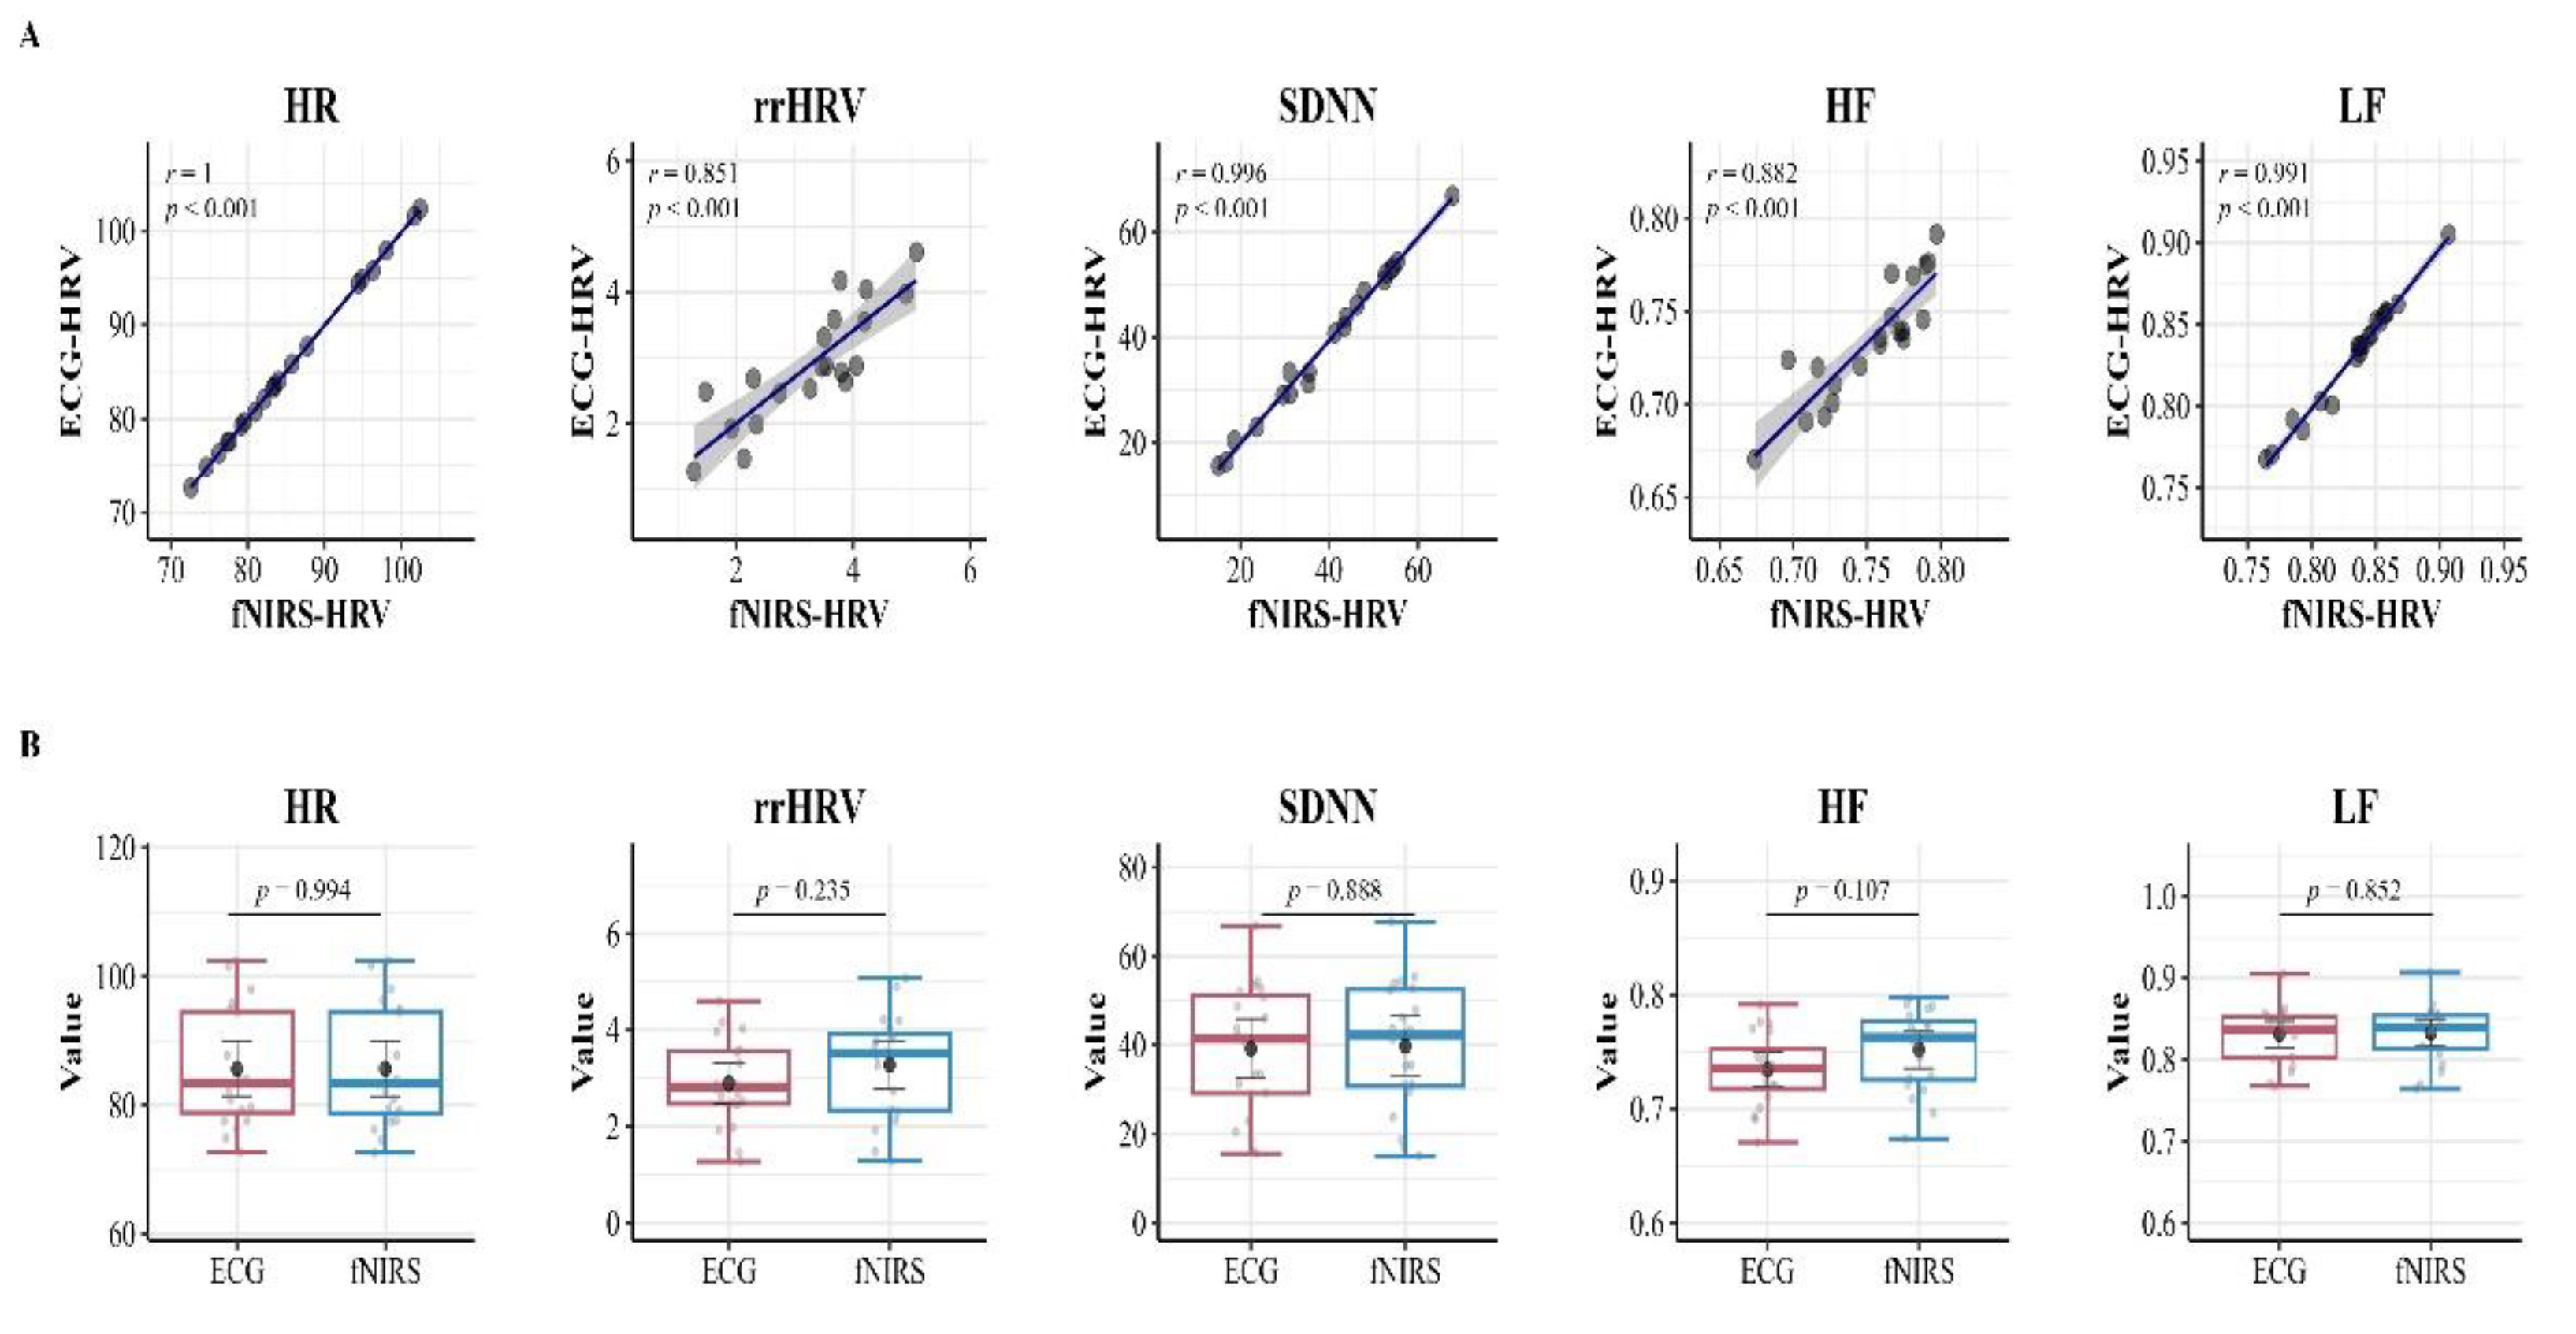
For additional statistical validation of the CBI extracted from ECG and fNIRS, we computed five Heart Rate Variability (HRV) features for 20 participants. The HRV extraction and statistical analysis of HRV features were performed using MATLAB and R (version 4.3.1). The features included heart rate (HR), time-domain features of the difference of consecutive relative cardiac beat intervals weighted by their mean (rrHRV) and standard deviation of cardiac beat intervals (SDNN), and frequency-domain features of Low-Frequency Power (LF) and High-Frequency Power (HF) indices [
25]. Independent samples t-tests were conducted for the five HRV features of the two devices to investigate any significant differences between the HRV feature values of the two groups. Additionally, Pearson correlation coefficient was calculated to evaluate whether the extracted HRV features showed consistent tendencies.
3. Results
For the evaluation and verification of the algorithm's performance, this study juxtaposed the ECG data with the heartbeat detection capability via the algorithm. By accurately extracting the cardiac beat interval and deriving Heart Rate Variability (HRV) characteristics based on time-series data, we conducted comparative validation between different devices. Essentially, we analyzed the detection performance of the algorithm that could potentially replace ECG under various experimental conditions.
The analysis results of this study were carried out on all CBI data points for 5 minutes from 20 clinical volunteers. We evaluated the equivalence between the CBI derived from ECG and the CBI calculated by applying the SIRPD algorithm to the fNIRS signals, using all the time-series data (
Figure 4). In the similarity analysis of the heartbeat interval data obtained from both devices, an R-squared value of 0.98 and an RMSE of 0.011 were presented, indicating a very high correlation. Additionally, the ICC analysis result displayed a high degree of concordance at 0.991 (95% confidence interval: 0.991 - 0.992), suggesting excellent agreement.
Furthermore, we evaluated the clinical applicability of our approach in the context of cardiac activity monitoring. Our primary focus was to assess the equivalence and reliability of heart rate variability (HRV) features obtained from two different devices. Consequently, our systematic approach included the evaluation of HRV feature derived from the time series data of cardiac beat intervals (CBI) recorded by the devices.
Table 1 outlines the descriptive statistics of HRV features, and inferential statistics provide insights from independent t-tests and Pearson correlation coefficient analyses, explaining the potential utility of fNIRS. An independent samples t-test was conducted for each HRV parameter, revealing no significant differences across the HRV features assessed by both the ECG and fNIRS devices. Specifically, all p-values were greater than 0.05. This result suggests promising potential for clinically substituting ECG.
Additionally, to visually represent the comparison of HRV attributes, detailed scatter plots and box plots are presented in
Figure 5. These plots explicitly illustrate the distribution and relationship of HRV features between the mentioned devices. In an interesting contrast to the t-test results, the Pearson correlation coefficient analysis discovered strong and highly significant positive correlations for each HRV feature when compared between the ECG and fNIRS measurements. Specifically, the correlation was r = 1.00 for HR, r = .863 for rrHRV, r = .993 for SDNN, r = 0.893 for HF, and r = .991 for LF.
Importantly, these correlation values are statistically significant with p-values less than 0.05, emphasizing the high consistency and agreement in HRV measurements between the devices.
These findings provide insight into the robustness of the cardiac monitoring algorithms. They confirm the high level of equivalence maintained by the technologies used for HRV feature extraction, namely ECG and fNIRS, thus suggesting various potential applications of the devices for heart rate variability analysis in our study.
4. Discussion
Signal processing and feature extraction techniques using fNIRS have always been a pivotal task and a subject of research in this field. In our study, we extensively explored the methodology of developing an algorithm capable of detecting heartbeats using fNIRS.
Through our developed SIRPD algorithm, we have confirmed that the Cardiac Beat Intervals (CBI) extracted from raw fNIRS data exhibit the same effects as those derived from ECG, substantiating its robust superiority through ICC testing and correlation analysis.
Furthermore, we evaluated its potential for clinical application by extracting Heart Rate Variability (HRV) features. The rationale behind conducting measurements on 20 healthy adults in their twenties was that the discrepancy between cardiovascular information measured from the heart and that measured from the prefrontal cerebral blood flow wave is bound to be less than in the elderly population.
In our study, the necessity for simultaneous measurements led us to utilize a mobile fNIRS, prized for its mobility, and a wired ECG device, renowned for its high accuracy. There was no significant intergroup difference found in the HRV features evaluated between the two devices. Regrettably, although no significant difference was found between the groups in the time-series signal characteristic rrHRV and the frequency characteristic HF, we couldn't assert a 100% match. This challenge arose from attempting to align the raw fNIRS signal, which was smoothed and interpolated at an 8Hz sampling rate across multiple channels, with the high-resolution 500HZ of the ECG, even after up-sampling. This suggests that the low sampling speed of the original data inherently poses difficulty in achieving a flawless restoration. Therefore, by improving the device specifications and increasing the sampling speed of the original data, we anticipate the development of a more efficient algorithm.
Surprisingly, the SIRPD algorithm, despite being utilized on a device with a low sampling speed for extracting CBI and HRV features, found no significant discrepancies across all HRV features. Additionally, it revealed an almost perfect correlation close to 1 in the Heart Rate (HR) itself, indicating a range of potential possibilities.
Scientists are investigating various methods to reduce physiological noise in signals and more accurately identify genuine brain activity. Various filtering techniques developed for this purpose are essential for intuitively understanding the activities of specific parts of the brain or developing specialized heartbeat detection algorithms [
26,
27]. In fact, various studies are conducting in-depth analyses of physiological and cardiovascular wave extraction, which can be applied to heartbeat detection [
4,
27,
28].
Typically, physiological noises such as Mayer waves, heart rate signals, and respiratory rhythms are removed from the signal via preprocessing methods like band-pass filters to separate data related to cognitive function. However, these preprocessing procedures may not eliminate noise. To address this issue, in this study, we propose an integrated signal processing methodology that improves accuracy by finding the most regular and strong waveforms from signals where waveforms of various frequencies overlap.
The method of directly detecting heart-related waves recommends using external devices such as ECG or PPG in combination with fNIRS signals. This method can provide additional information about a participant's personal characteristics [
27].
However, in experimental environments were using multiple sensors simultaneously imposes a burden on participants, this approach of identifying the characteristics of heartbeats using only fNIRS data becomes more useful. This method allows for easy extraction of heartbeat information from participants and reduces inaccurate measurements due to movement.
The newly developed alternative algorithm shows improved results in many ways compared to previous methods. Firstly, it can obtain reliable signals while enhancing participant comfort and reducing the complexity of the experimental environment. Secondly, it has the potential to assess cognitive function and cardiovascular health concurrently. Yet, it needs to continue to evolve through an in-depth analysis of signal processing methods. These advanced methodologies can capture various associated cardiac features that ECG signals can provide and can also suggest feasible solutions that can be implemented without ECG [
27,
29].
By using the algorithm proposed in this study, it is possible to identify heartbeat signals more clearly with fNIRS and help track cognitive function, stress levels, and age-related changes [
30]. This can be used as auxiliary indicators that can be referenced physiologically and neurologically in the clinical environment and provide a more insightful approach in the development of a big data platform.
Future research opens the possibility of developing more advanced methodologies that can practically apply the advantages of this algorithm to platforms for monitoring individual health status or early diagnosis. Through this, it may be possible to set a new reference standard for concurrently evaluating cardiovascular health status and cognitive function.
5. Conclusions
In our study, we proposed a method for detecting cardiac beat intervals (CBI) that is minimally affected by noise, achieved by integrating and reconstructing signals of oxyhemoglobin and total hemoglobin variations. The performance of this method was evaluated using a dataset simultaneously collected from ECG and fNIRS. Through the comparison of analysis results, the enhanced robustness of our proposed method was confirmed, which carries great significance for practical applications. A breakthrough of this study is the consideration of cardiac signals from fNIRS not as a source of artifacts, but as a reference point from which additional information can be obtained. The proposed method can be used in conjunction with brain activity analysis, allowing for the detection of cardiac beat intervals from cerebral blood flow oscillations, thereby paving the way for the application of fNIRS as a supplementary indicator related to various cardiovascular factors.
Author Contributions
“Conceptualization, K.S KIM, methodology, K.S KIM; validation, K.S KIM and T.H KIM ; formal analysis, K.S KIM and T.H KIM; investigation, K.S KIM.,T.H KIM and J.H CHA; resources, K.S KIM and J.H CHA data curation, K.S KIM and T.H KIM; writing—original draft preparation, K.S KIM; writing—review and editing, K.S KIM visualization, K.S KIM and T.H KIM; project administration, K.S KIM; All authors have read and agreed to the published version of the manuscript.
Funding
This work was supported by the Korea Medical Device Development Fund grant funded by the Korea government (the Ministry of Science and ICT, the Ministry of Trade, Industry and Energy, the Ministry of Health & Welfare, Republic of Korea, the Ministry of Food and Drug Safety) (Project Number: RS-2020-KD000169, KMDF_PR_20200901_0169)
Institutional Review Board Statement
The procedures were conducted in accordance with the institutional review board approval at Yonsei University, and explicit consent was obtained from the participants.
Informed Consent Statement
Informed consent was obtained from all subjects involved in the study.
Data Availability Statement
Conflicts of Interest
The authors have no relevant financial interests in this article and no potential conflicts of interest to disclose.
References
- Ferrari, M.; Quaresima, V. A Brief Review on the History of Human Functional Near-Infrared Spectroscopy (FNIRS) Development and Fields of Application. Neuroimage 2012, 63, 921–935. [Google Scholar] [CrossRef] [PubMed]
- Perdue, K.L.; Westerlund, A.; McCormick, S.A.; Nelson, C.A. Extraction of Heart Rate from Functional Near-Infrared Spectroscopy in Infants. J Biomed Opt 2014, 19, 067010. [Google Scholar] [CrossRef] [PubMed]
- Almajidy, R.K.; Mankodiya, K.; Abtahi, M.; Hofmann, U.G. A Newcomer’s Guide to Functional near Infrared Spectroscopy Experiments. IEEE Rev Biomed Eng 2020, 13, 292–308. [Google Scholar] [CrossRef] [PubMed]
- Mirbagheri, M.; Hakimi, N.; Ebrahimzadeh, E.; Setarehdan, S.K. Quality Analysis of Heart Rate Derived from Functional Near-Infrared Spectroscopy in Stress Assessment. Inform Med Unlocked 2020, 18. [Google Scholar] [CrossRef]
- Shahbakhti, M.; Hakimi, N.; Horschig, J.M.; Floor-Westerdijk, M.; Claassen, J.; Colier, W.N.J.M. Estimation of Respiratory Rate during Biking with a Single Sensor Functional Near-Infrared Spectroscopy (FNIRS) System. Sensors 2023, 23. [Google Scholar] [CrossRef] [PubMed]
- Hakimi, N.; Shahbakhti, M.; Sappia, S.; Horschig, J.M.; Bronkhorst, M.; Floor-Westerdijk, M.; Valenza, G.; Dudink, J.; Colier, W.N.J.M. Estimation of Respiratory Rate from Functional Near-Infrared Spectroscopy (FNIRS): A New Perspective on Respiratory Interference. Biosensors (Basel) 2022, 12. [Google Scholar] [CrossRef] [PubMed]
- Stress Assessment by Means of Heart Rate Derived from Functional Near-Infrared Spectroscopy. J Biomed Opt 2018, 23, 1. [CrossRef]
- Bizzego, A.; Esposito, G. Performance Assessment of Heartbeat Detection Algorithms on Photoplethysmograph and Functional NearInfrared Spectroscopy Signals. Sensors 2023, 23. [Google Scholar] [CrossRef]
- Scholkmann, F.; Boss, J.; Wolf, M. An Efficient Algorithm for Automatic Peak Detection in Noisy Periodic and Quasi-Periodic Signals. Algorithms 2012, 5, 588–603. [Google Scholar] [CrossRef]
- Tachtsidis, I.; Scholkmann, F. False Positives and False Negatives in Functional Near-Infrared Spectroscopy: Issues, Challenges, and the Way Forward. Neurophotonics 2016, 3, 031405. [Google Scholar] [CrossRef]
- Huang, R.; Hong, K.S.; Yang, D.; Huang, G. Motion Artifacts Removal and Evaluation Techniques for Functional Near-Infrared Spectroscopy Signals: A Review. Front Neurosci 2022, 16. [Google Scholar] [CrossRef]
- Zhang, F.; Cheong, D.; Khan, A.F.; Chen, Y.; Ding, L.; Yuan, H. Correcting Physiological Noise in Whole-Head Functional near-Infrared Spectroscopy. J Neurosci Methods 2021, 360. [Google Scholar] [CrossRef]
- Patashov, D.; Menahem, Y.; Gurevitch, G.; Kameda, Y.; Goldstein, D.; Balberg, M. FNIRS: Non-Stationary Preprocessing Methods. Biomed Signal Process Control 2023, 79. [Google Scholar] [CrossRef]
- Raggam, P.; Bauernfeind, G.; Wriessnegger, S.C. NICA: A Novel Toolbox for Near-Infrared Spectroscopy Calculations and Analyses. Front Neuroinform 2020, 14. [Google Scholar] [CrossRef]
- Yücel, M.A.; Lühmann, A. v.; Scholkmann, F.; Gervain, J.; Dan, I.; Ayaz, H.; Boas, D.; Cooper, R.J.; Culver, J.; Elwell, C.E.; et al. Best Practices for FNIRS Publications. Neurophotonics 2021, 8. [Google Scholar] [CrossRef]
- Sappia, M.S.; Hakimi, N.; Colier, W.N.J.M.; Horschig, J.M. Signal Quality Index: An Algorithm for Quantitative Assessment of Functional near Infrared Spectroscopy Signal Quality. Biomed Opt Express 2020, 11, 6732. [Google Scholar] [CrossRef]
- Cope, M. THE DEVELOPMENT OF A NEAR INFRARED SPECTROSCOPY SYSTEM AND ITS APPLICATION FOR NON INVASWE MONITORING OF CEREBRAL BLOOD AND TISSUE OXYGENATION IN THE NEWBORN INFANT 5; 1991.
- Delpy, D.T.; Cope, M.; Van Der Zee, P.; Arridge, S.; Wrayt, S.; Wyatt, J. Estimation of Optical Pathlength through Tissue from Direct Time of Flight Measurement; 1988; Vol. 33. [CrossRef]
- Scholkmann, F.; Wolf, M. General Equation for the Differential Pathlength Factor of the Frontal Human Head Depending on Wavelength and Age. J Biomed Opt 2013, 18, 105004. [Google Scholar] [CrossRef]
- Khan, R.A.; Naseer, N.; Saleem, S.; Qureshi, N.K.; Noori, F.M.; Khan, M.J. Cortical Tasks-Based Optimal Filter Selection: An FNIRS Study. J Healthc Eng 2020, 2020. [Google Scholar] [CrossRef]
- Tak, S.; Jang, K.E.; Jung, J.; Jang, J.; Jeong, Y.; Ye, J.C. NIRS-SPM: Statistical Parametric Mapping for near Infrared Spectroscopy. In Proceedings of the Multimodal Biomedical Imaging III; SPIE, February 7 2008; Vol. 6850, p. 68500T.
- Takahashi, S.; Sakurai, N.; Kasai, S.; Kodama, N. Stress Evaluation by Hemoglobin Concentration Change Using Mobile NIRS. Brain Sci 2022, 12. [Google Scholar] [CrossRef] [PubMed]
- Makowski, D.; Pham, T.; Lau, Z.J.; Brammer, J.C.; Lespinasse, F.; Pham, H.; Schölzel, C.; Chen, S.H.A. NeuroKit2: A Python Toolbox for Neurophysiological Signal Processing. Behav Res Methods 2021, 53, 1689–1696. [Google Scholar] [CrossRef] [PubMed]
- Koo, T.K.; Li, M.Y. A Guideline of Selecting and Reporting Intraclass Correlation Coefficients for Reliability Research. J Chiropr Med 2016, 15, 155–163. [Google Scholar] [CrossRef] [PubMed]
- Vollmer, M. A Robust, Simple and Reliable Measure of Heart Rate Variability Using Relative RR Intervals. [CrossRef]
- Eastmond, C.; Subedi, A.; De, S.; Intes, X. Deep Learning in FNIRS: A Review. Neurophotonics 2022, 9. [Google Scholar] [CrossRef] [PubMed]
- Hong, K.S.; Khan, M.J.; Hong, M.J. Feature Extraction and Classification Methods for Hybrid FNIRS-EEG Brain-Computer Interfaces. Front Hum Neurosci 2018, 12. [Google Scholar] [CrossRef] [PubMed]
- Vollmer, M. A Robust, Simple and Reliable Measure of Heart Rate Variability Using Relative RR Intervals. [CrossRef]
- Sunwoo, J.; Shah, P.; Thuptimdang, W.; Khaleel, M.; Chalacheva, P.; Kato, R.M.; Coates, T.D.; Khoo, M.C.K. Functional Near-Infrared Spectroscopy-Based Prefrontal Cortex Oxygenation during Working Memory Tasks in Sickle Cell Disease. Neurophotonics 2023, 10. [Google Scholar] [CrossRef]
- Chen, C.H.; Shyu, K.K.; Lu, C.K.; Jao, C.W.; Lee, P.L. Classification of Prefrontal Cortex Activity Based on Functional Near-Infrared Spectroscopy Data upon Olfactory Stimulation. Brain Sci 2021, 11. [Google Scholar] [CrossRef]
|
Disclaimer/Publisher’s Note: The statements, opinions and data contained in all publications are solely those of the individual author(s) and contributor(s) and not of MDPI and/or the editor(s). MDPI and/or the editor(s) disclaim responsibility for any injury to people or property resulting from any ideas, methods, instructions or products referred to in the content. |
© 2024 by the authors. Licensee MDPI, Basel, Switzerland. This article is an open access article distributed under the terms and conditions of the Creative Commons Attribution (CC BY) license (http://creativecommons.org/licenses/by/4.0/).
