Submitted:
07 March 2024
Posted:
08 March 2024
You are already at the latest version
Abstract
Keywords:
1. Introduction
2. Results
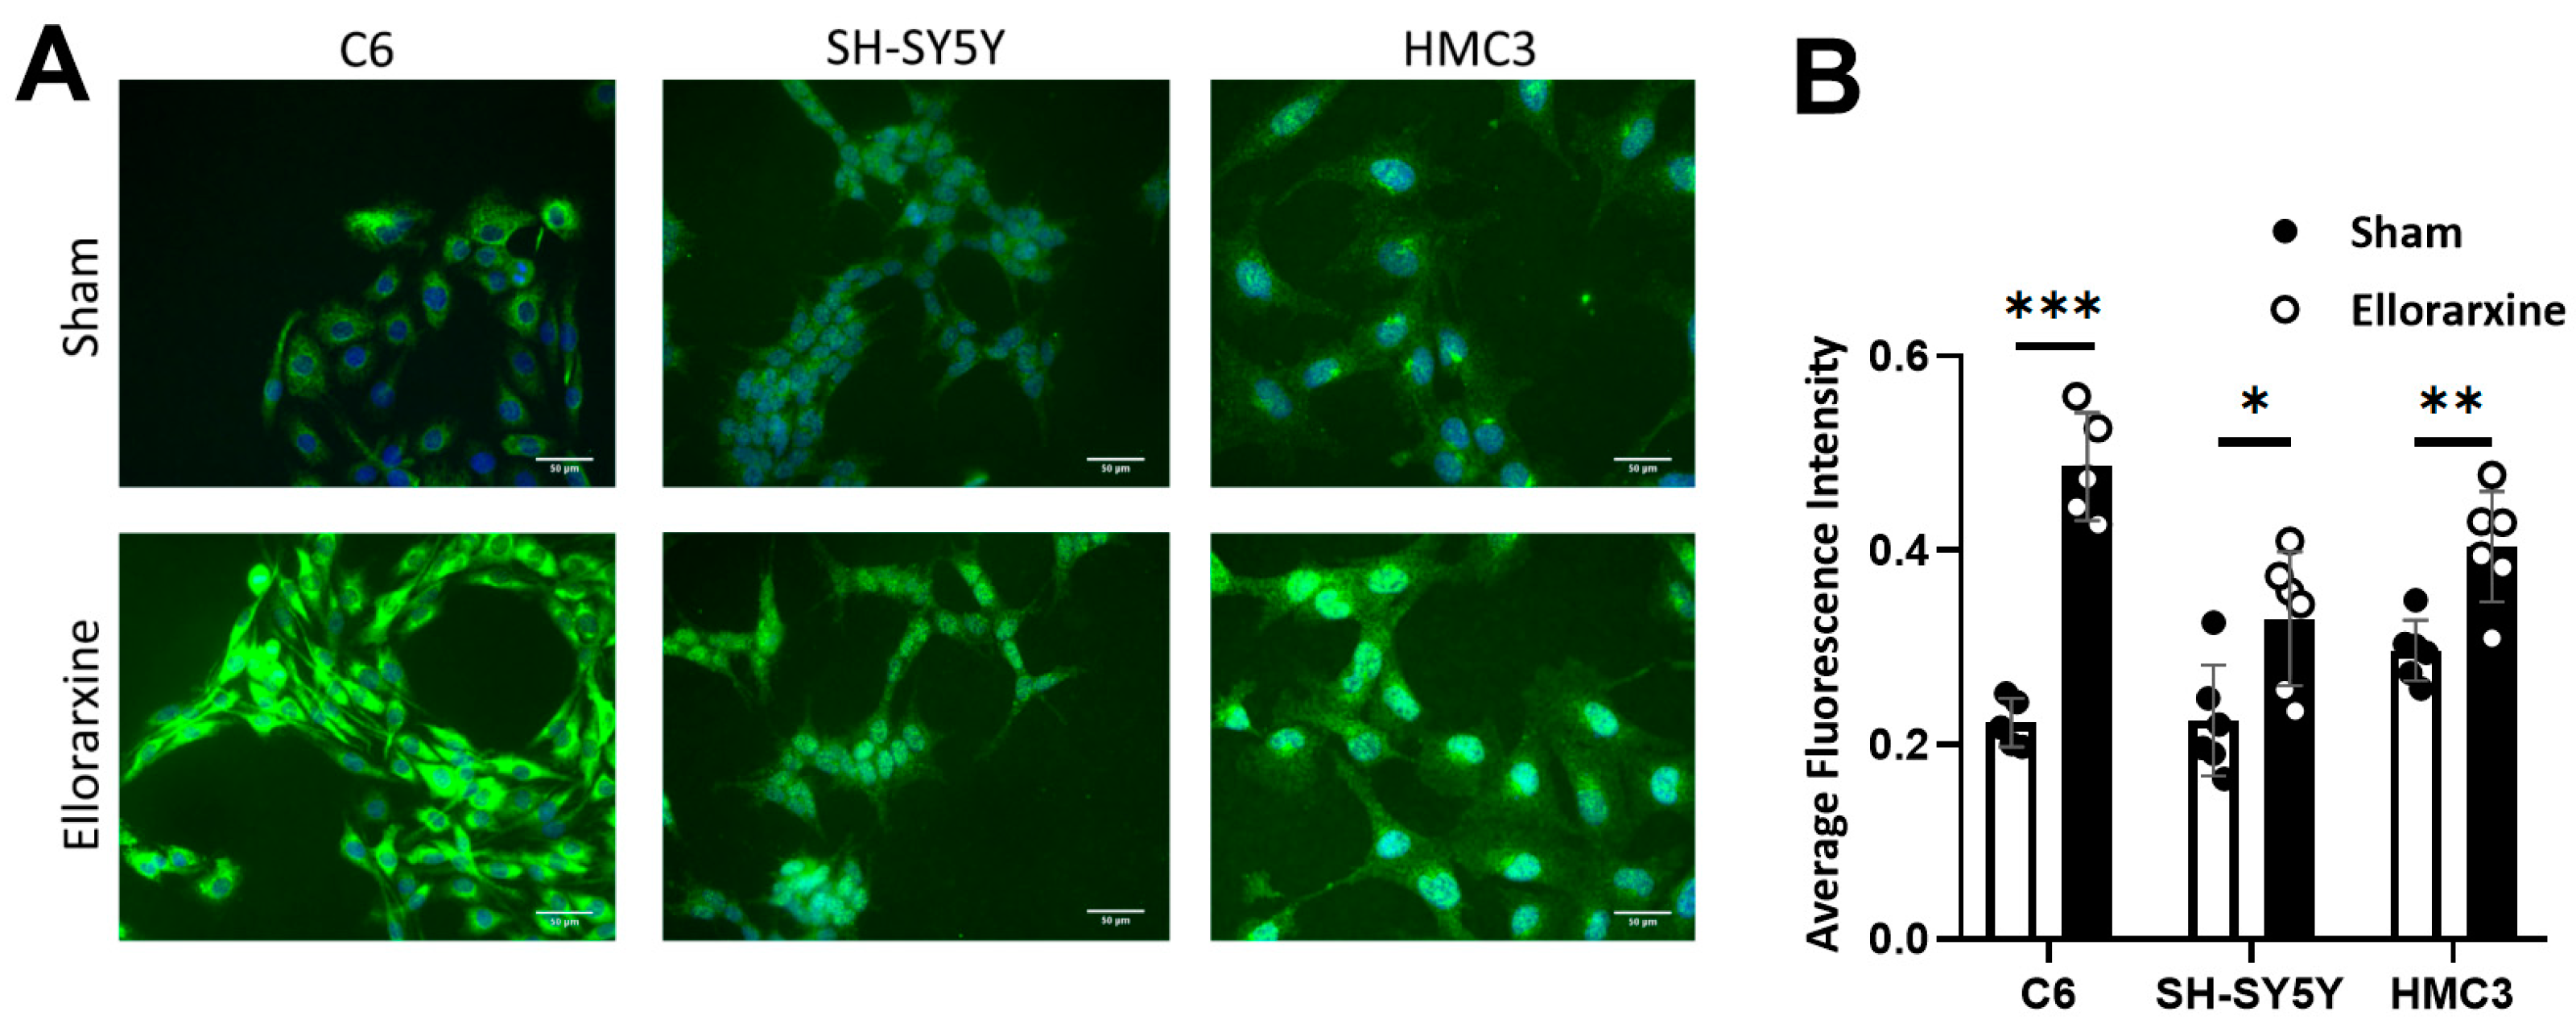
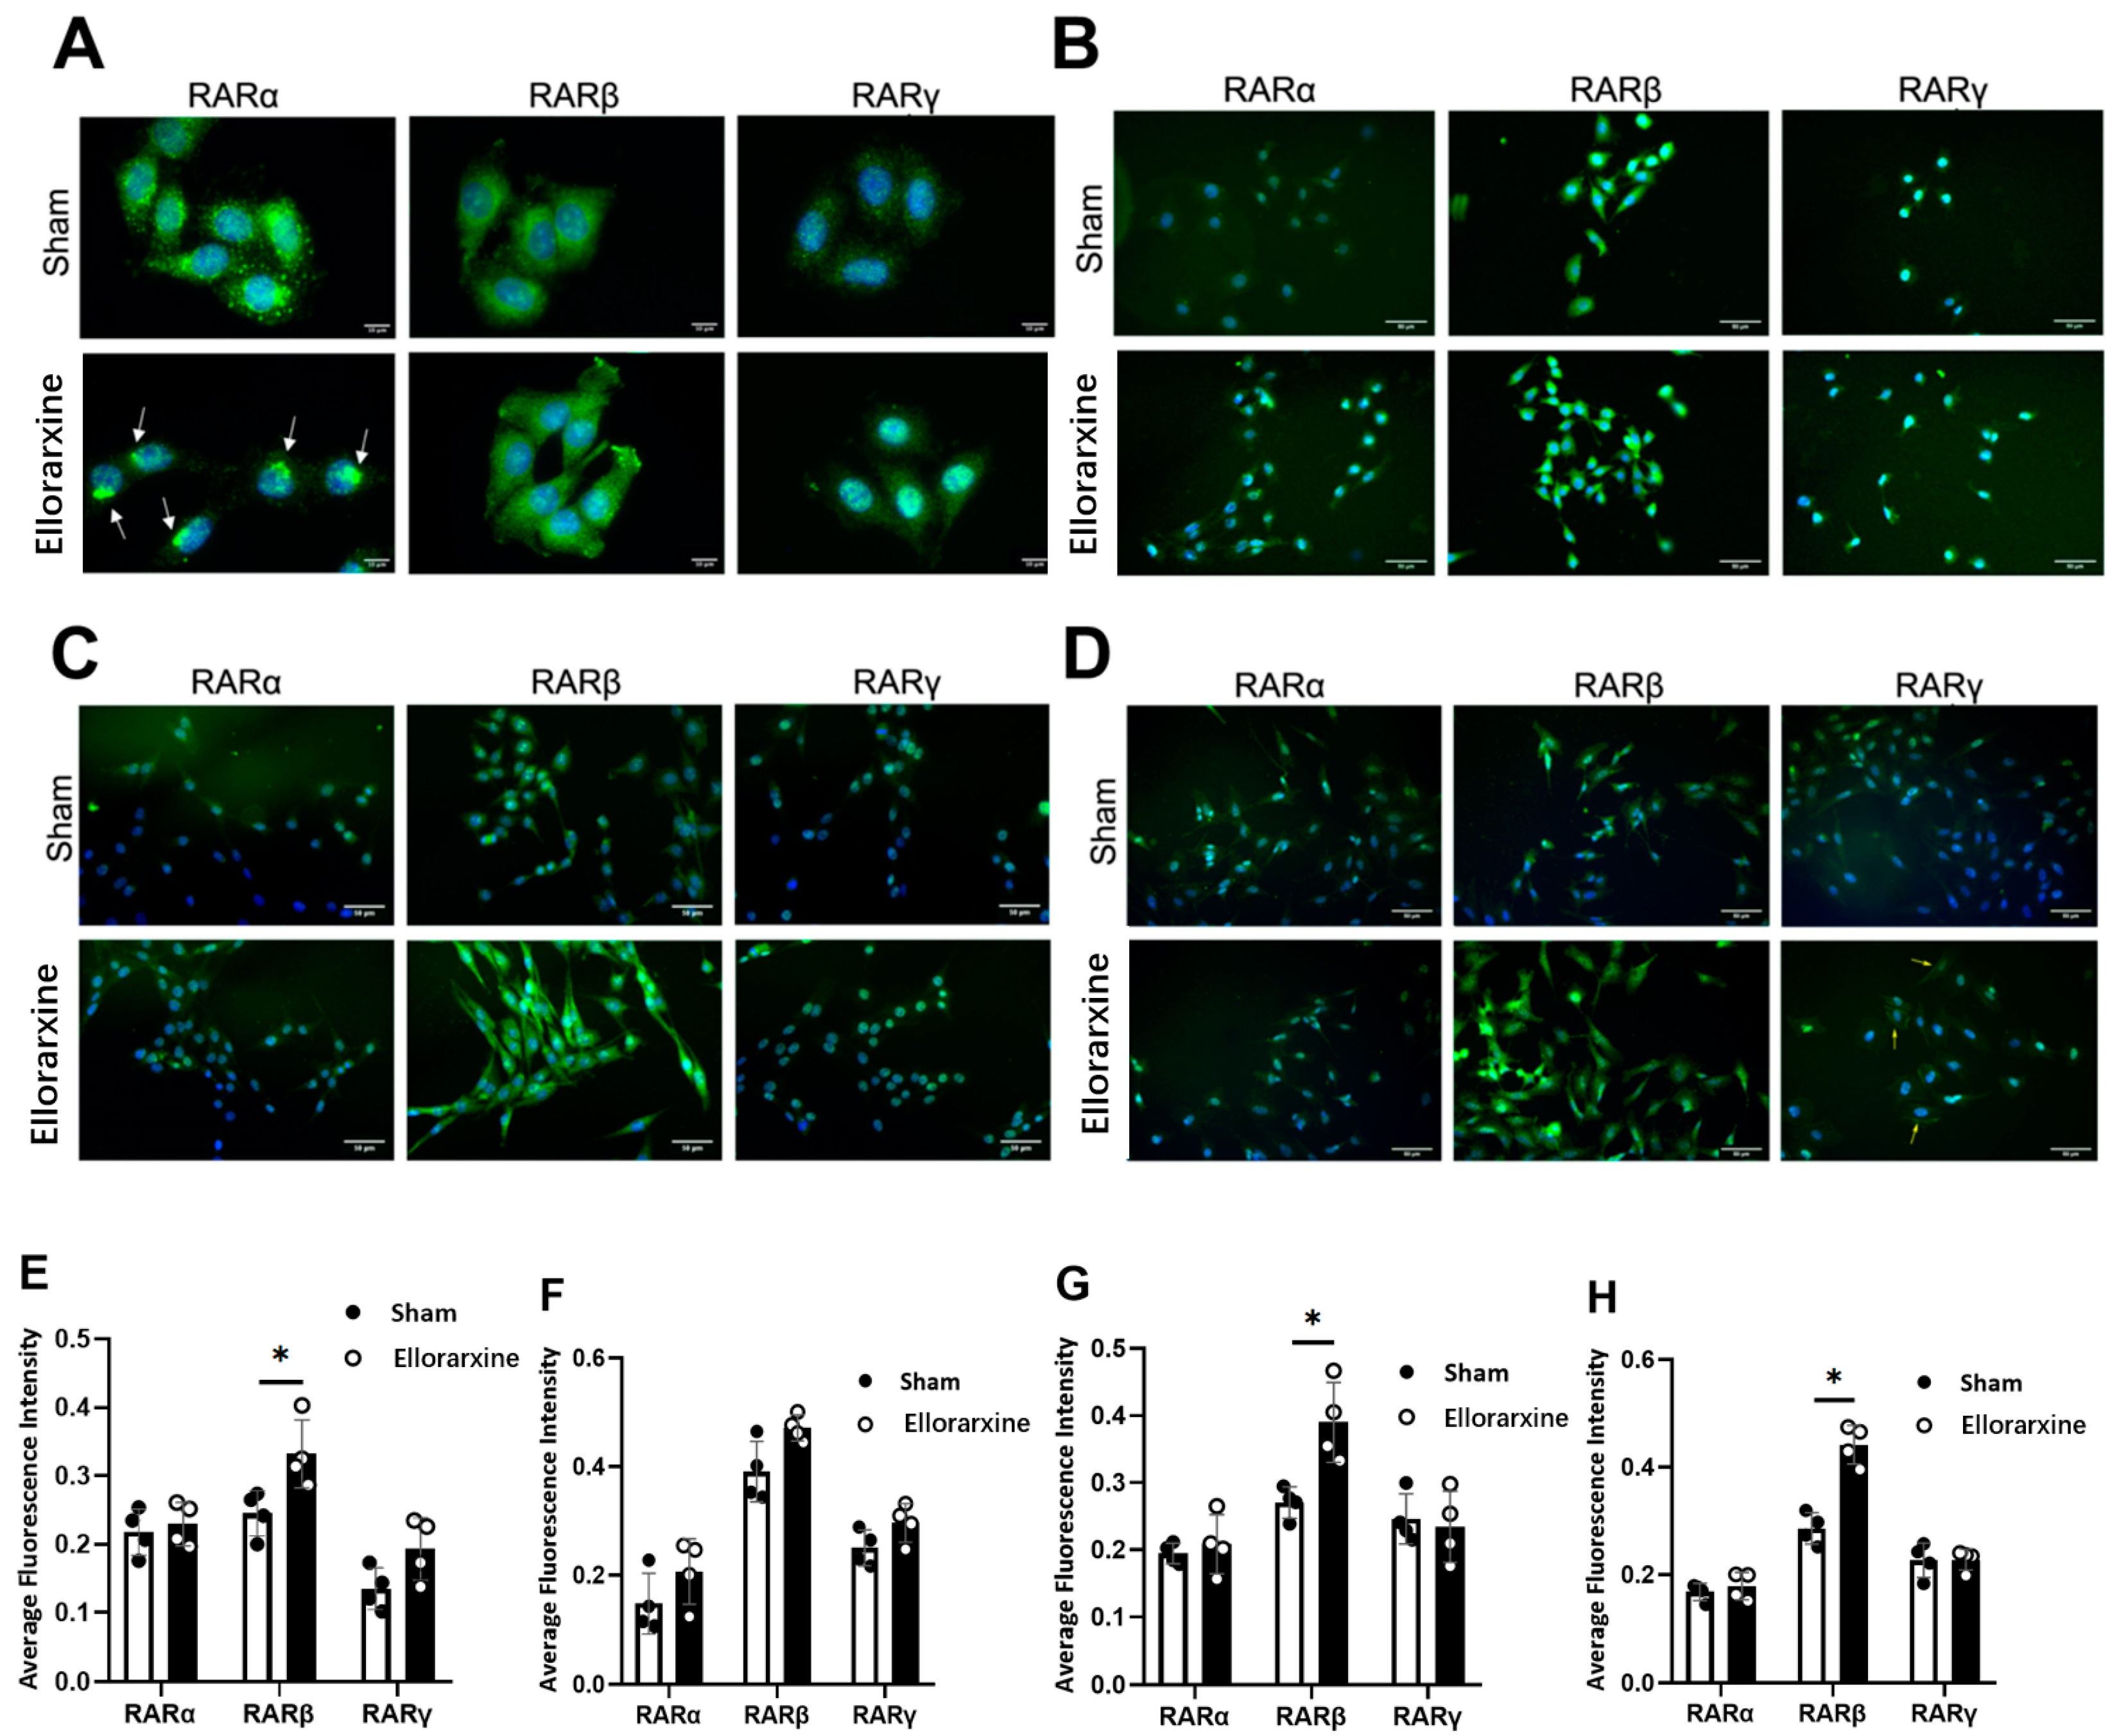
2.1. Ellorarxine Upregulates the Expression of Cyp26b1 and RARβ
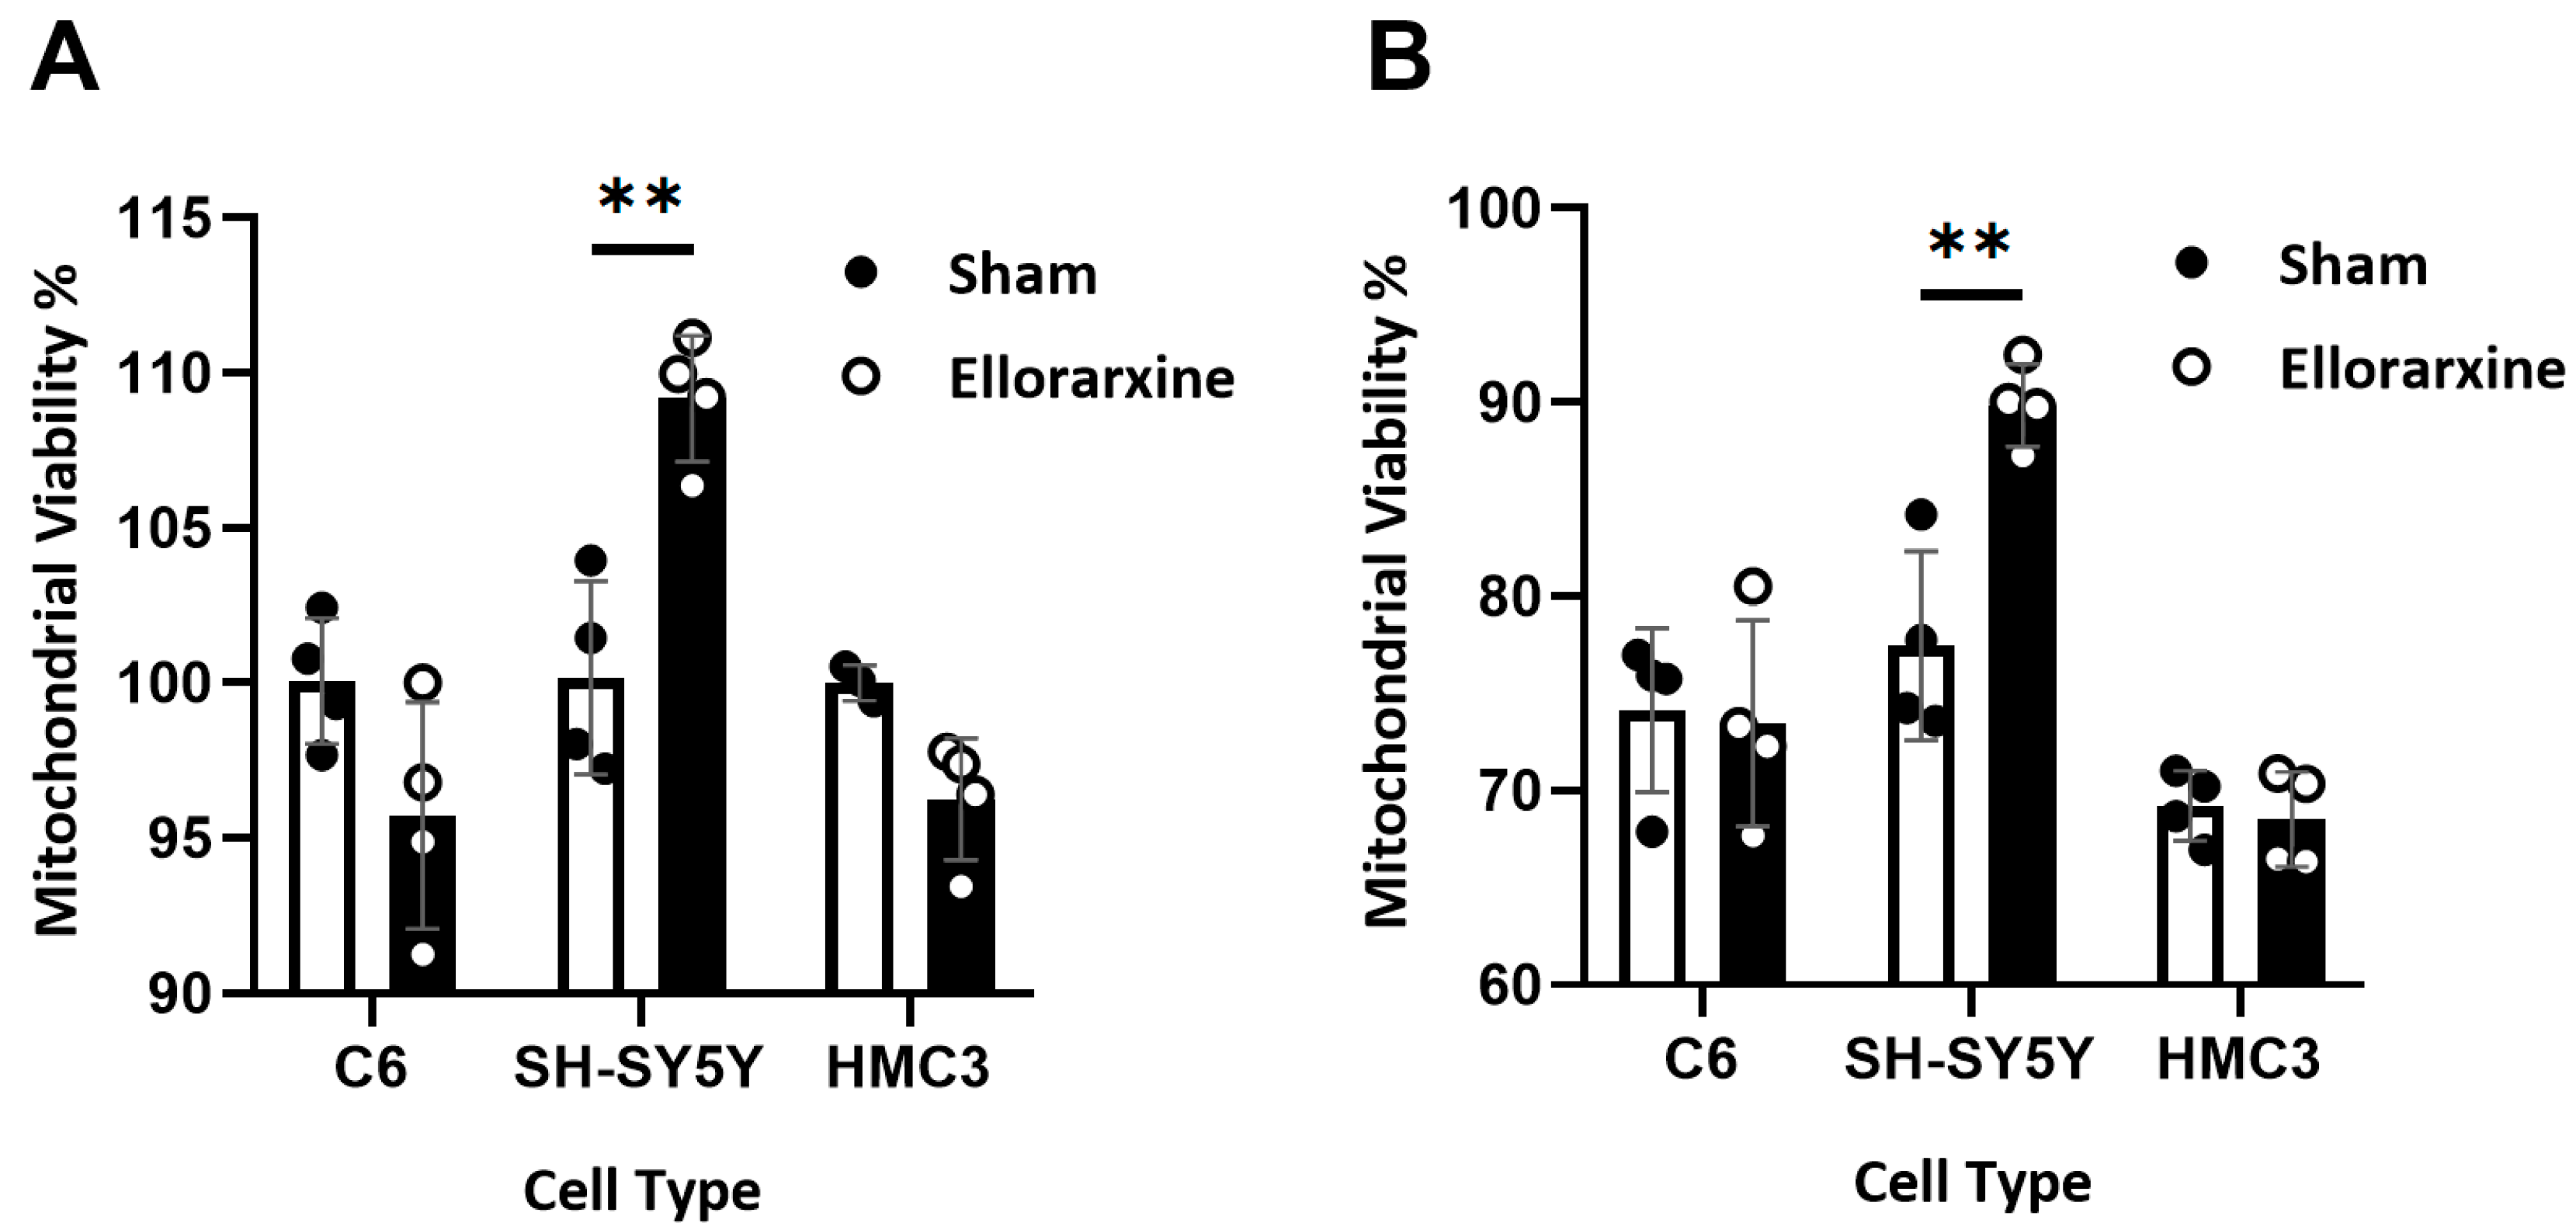
2.2. Ellorarxine Pretreatment Alleviates Mitochondrial Dysfunction
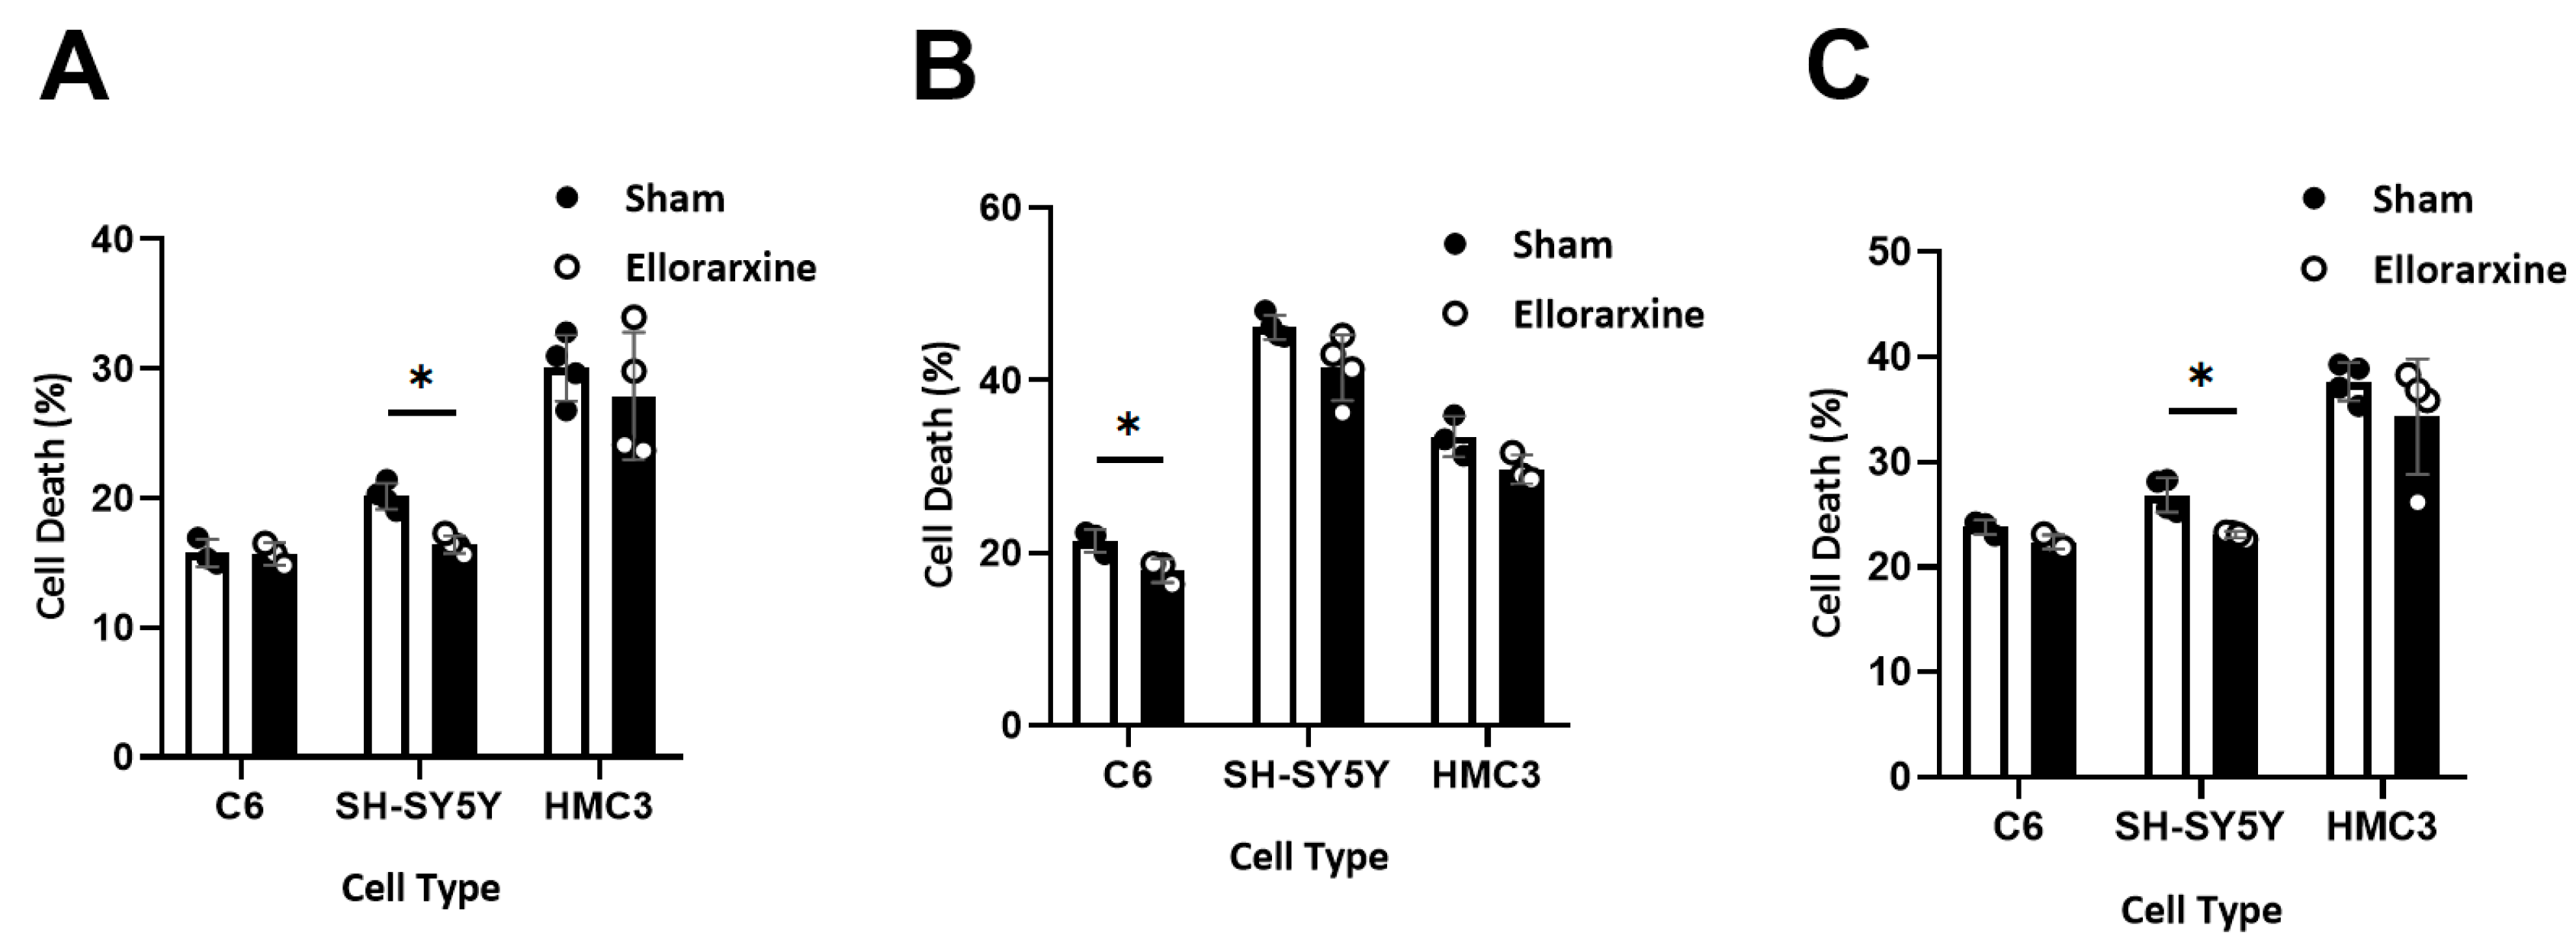
2.3. Ellorarxine Pretreatment Reduced Cell Death
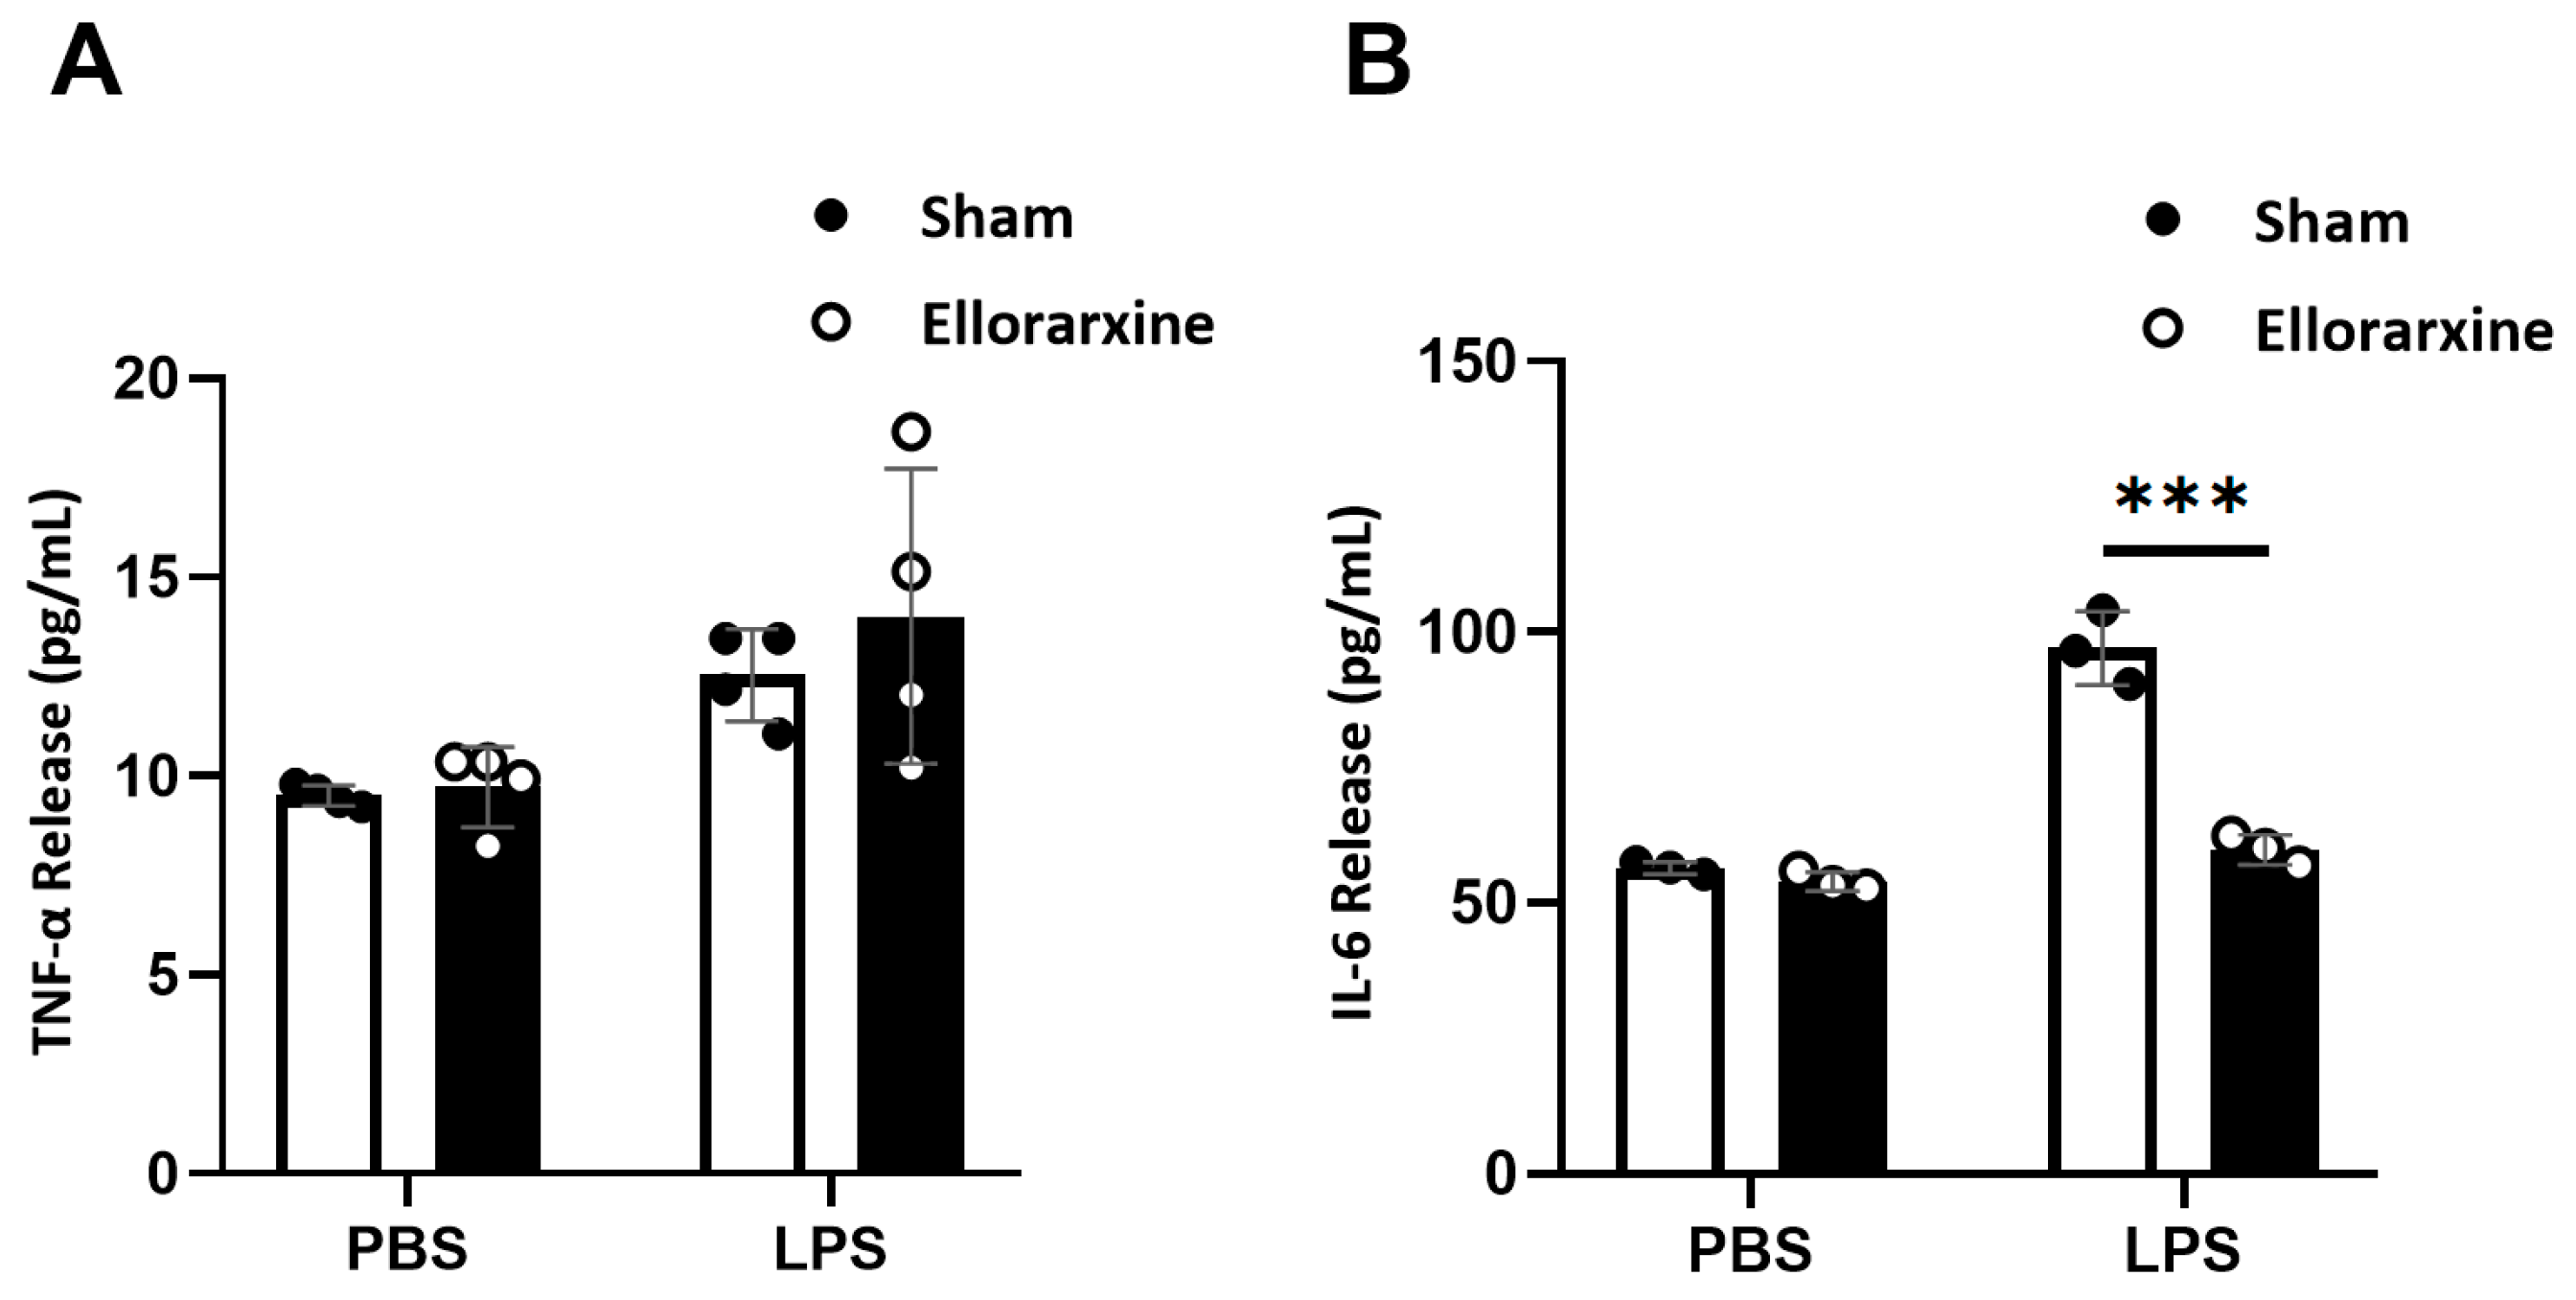
2.4. Ellorarxine Pretreatment Modulated Inflammatory Cytokine Release
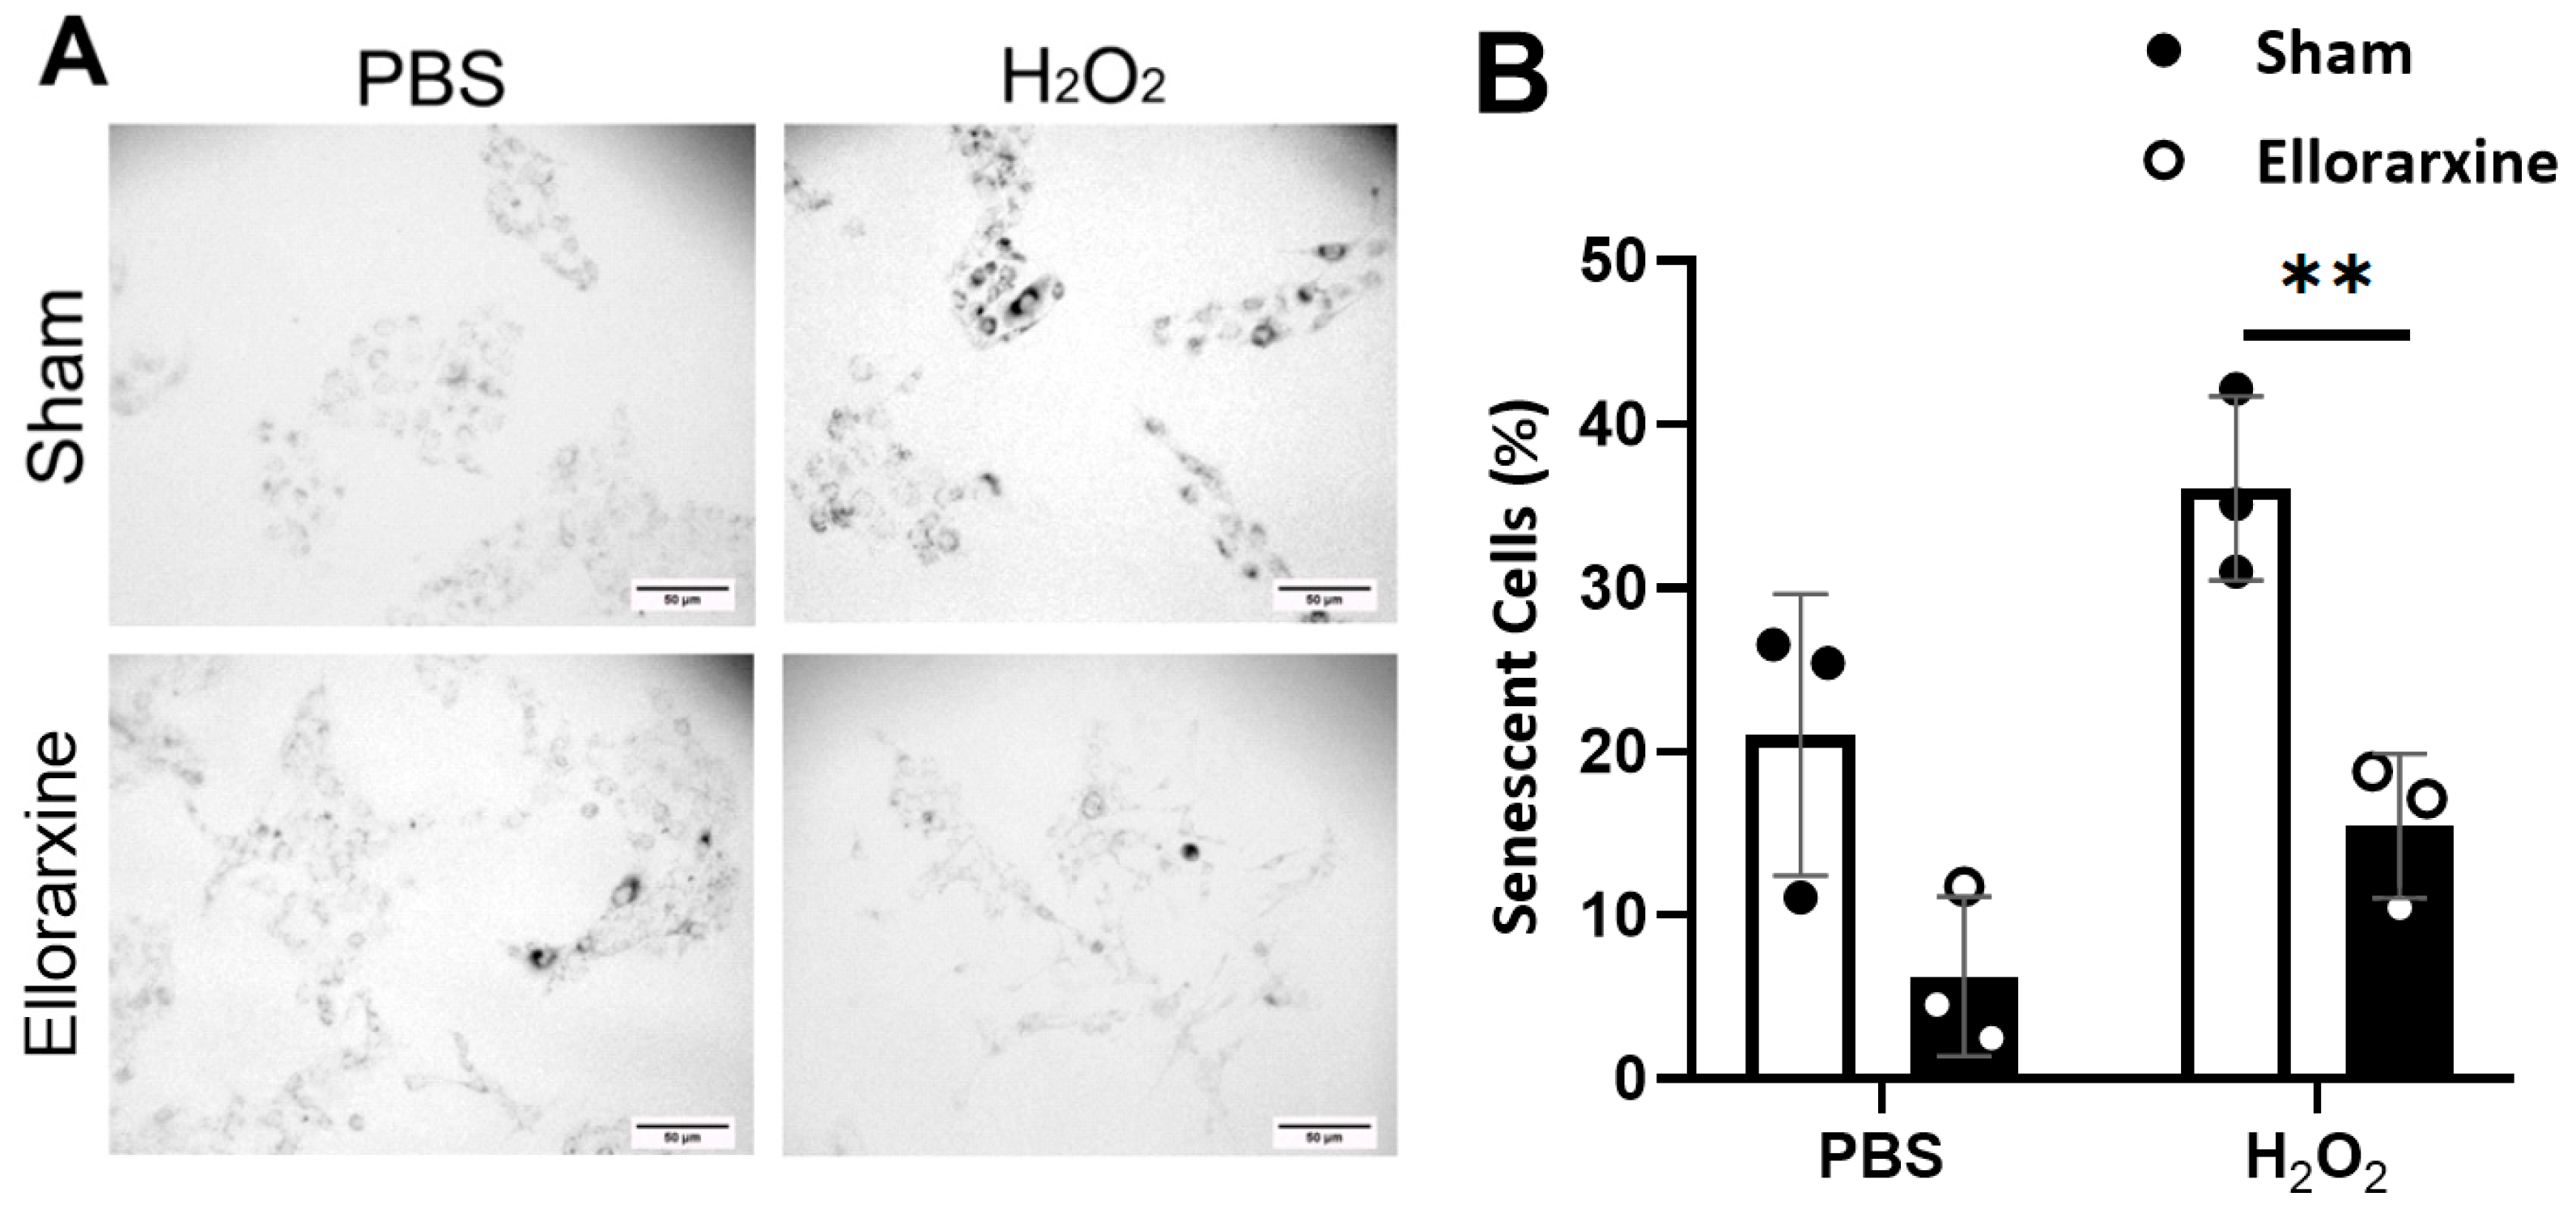
2.5. Ellorarxine Treatment Reduced the Number of Senescent Cells
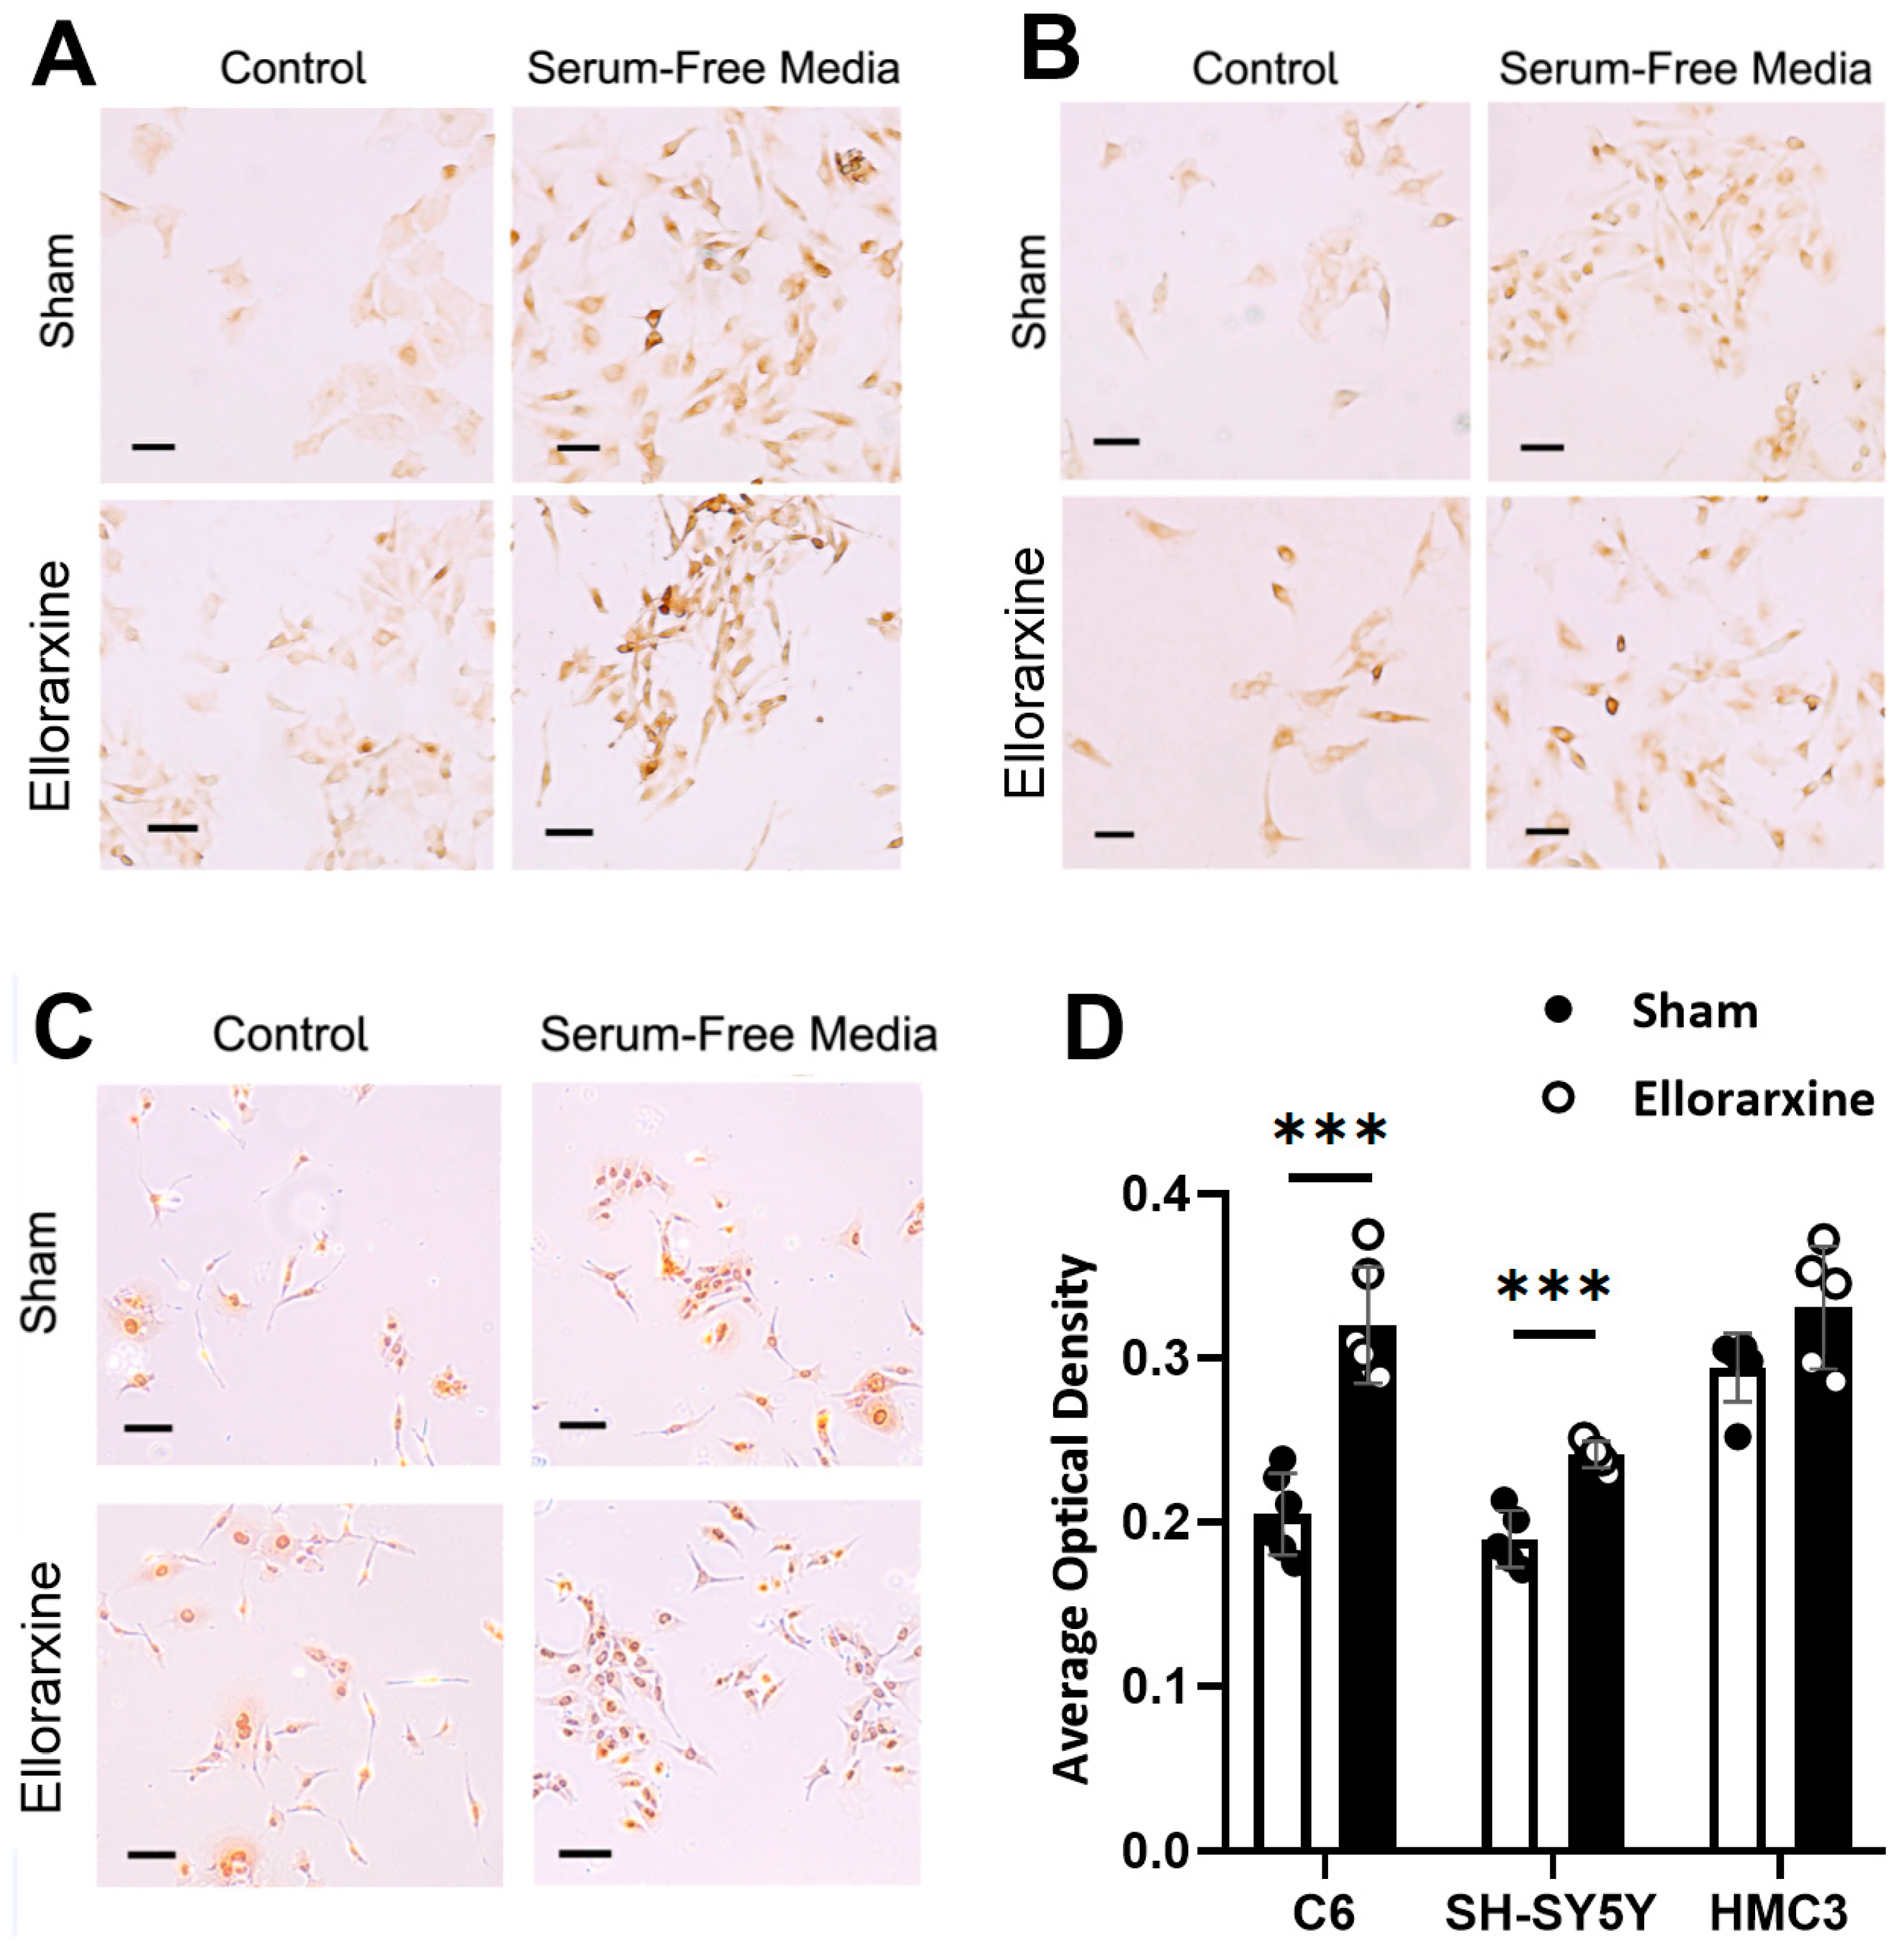
2.6. Ellorarxine Treatment Regulated Cellular Autophagy
3. Discussion
4. Materials and Methods
4.1. Reagent and Resources
| REAGENT or RESOURCE | SOURCE | IDENTIFIER |
| Antibodies | ||
| Recombinant Anti-Retinoic Acid Receptor alpha antibody [EPR23871-271] (ab275745) | Abcam | https://www.abcam.com/products/primary-antibodies/retinoic-acid-receptor-alpha-antibody-epr23871-271-ab275745.html |
| Anti-Retinoic Acid Receptor beta antibody (ab5792) | Abcam | https://www.abcam.com/products/primary-antibodies/retinoic-acid-receptor-beta-antibody-ab5792.html |
| Anti-Retinoic Acid Receptor gamma antibody (ab97569) | Abcam | https://www.abcam.com/products/primary-antibodies/retinoic-acid-receptor-gamma-antibody-ab97569.html |
| Anti-Cyp26B1 antibody (ab113236) | Abcam | https://www.abcam.com/products/primary-antibodies/cyp26b1-antibody-ab113236.html |
| Goat Anti-Mouse IgG H&L (Alexa Fluor® 488) (ab150113) | Abcam | https://www.abcam.com/products/secondary-antibodies/goat-mouse-igg-hl-alexa-fluor-488-ab150113.html |
| Chemicals, peptides, and recombinant proteins | ||
| Phosphate buffered saline (P5368-10pak) | Sigma-Aldrich | https://www.sigmaaldrich.com/GB/en/search/p5368-10pak?focus=products&page=1&perpage=30&sort=relevance&term=p5368-10pak&type=product |
| Triton X-100 | ||
| BSA | ||
| Tween 20 | ||
| Thiazolyl Blue Tetrazolium Bromide | Sigma-Aldrich | https://www.sigmaaldrich.com/GB/en/search/m2128?focus=products&page=1&perpage=30&sort=relevance&term=m2128&type=product |
| H2O2 | ||
| LPS | ||
| Critical commercial assays | ||
| CytoTox 96® Non-Radioactive Cytotoxicity Assay | Promega | https://www.promega.co.uk/products/cell-health-assays/cell-viability-and-cytotoxicity-assays/cytotox-96-non_radioactive-cytotoxicity-assay/?catNum=G1780 |
| Human IL-6 ELISA Kit (ab178013) | Abcam | https://www.abcam.com/products/elisa/human-il-6-elisa-kit-ab178013.html |
| Human TNF alpha ELISA Kit (ab46087) | Abcam | https://www.abcam.com/products/elisa/human-tnf-alpha-elisa-kit-ab46087.html |
| Senescence Cells Histochemical Staining Kit | Sigma-Aldrich | https://www.sigmaaldrich.com/GB/en/search/cs0030-1kt?focus=products&page=1&perpage=30&sort=relevance&term=cs0030-1kt&type=product |
| VECTASTAIN® Elite® ABC-HRP Kit (Peroxidase, Universal) (PK-6200) | VECTASTAIN | https://vectorlabs.com/products/vectastain-elite-abc-hrp-kit-universal |
| ImmPACT® DAB Substrate Kit, Peroxidase (HRP) (SK-4105) | VECTASTAIN | https://vectorlabs.com/products/immpact-dab-hrp-substrate |
| Experimental models: Cell lines | ||
| Rat glioma C6 cells | ||
| Human neuroblastoma SH-SY5Y cells | ||
| Human microglia clone 3 HMC3 cells | ||
| Software and algorithms | ||
| ZEN software | Zeiss | https://www.zeiss.com/microscopy/en/products/software/zeiss-zen.html |
| Prism8 | GraphPad | https://www.graphpad.com/ |
| ImageJ | LOCI | https://imagej.net/ |
4.2. Cell Lines and Culture
4.3. Cell Differentiation
4.4. Preparation of Ellorarxine
4.5. Pre-Treatments
4.6. Methyl Thiazolyl-Diphenyl-Tetrazolium Bromide (MTT) Assay
4.7. Lactate Dehydrogenase (LDH) Release Assay
4.8. Enzyme-Linked Immunosorbent Assay (ELISA)
4.9. Senescence-Associated β-Galactosidase (SA-β-Gal) Staining
4.10. Immunocytochemistry Staining
4.11. Immunofluorescence Staining
4.12. Quantification and Statistical Analysis
5. Patents
Supplementary Materials
Author Contributions
Institutional Review Board Statement
Informed Consent Statement
Data Availability Statement
Conflicts of Interest
References
- Lane, M.A.; Bailey, S.J. Role of Retinoid Signalling in the Adult Brain. Prog. Neurobiol. 2005, 75. [Google Scholar] [CrossRef] [PubMed]
- Janesick, A.; Wu, S.C.; Blumberg, B. Retinoic Acid Signaling and Neuronal Differentiation. Cell. Mol. Life Sci. 2015, 72. [Google Scholar] [CrossRef] [PubMed]
- Riancho, J.; Berciano, M.T.; Ruiz-Soto, M.; Berciano, J.; Landreth, G.; Lafarga, M. Retinoids and Motor Neuron Disease: Potential Role in Amyotrophic Lateral Sclerosis. J. Neurol. Sci. 2016, 360. [Google Scholar] [CrossRef] [PubMed]
- Gürbüz, M.; Aktaç, Ş. Understanding the Role of Vitamin A and Its Precursors in the Immune System. Nutr. Clin. Et. Metab. 2022, 36. [Google Scholar] [CrossRef]
- McCaffery, P.J.; Adams, J.; Maden, M.; Rosa-Molinar, E. Too Much of a Good Thing: Retinoic Acid as an Endogenous Regulator of Neural Differentiation and Exogenous Teratogen. Eur. J. Neurosci. 2003, 18. [Google Scholar] [CrossRef] [PubMed]
- Giguère, V. Retinoic Acid Receptors and Cellular Retinoid Binding Proteins: Complex Interplay in Retinoid Signaling. Endocr. Rev. 1994, 15. [Google Scholar] [CrossRef]
- Lavudi, K.; Nuguri, S.M.; Olverson, Z.; Dhanabalan, A.K.; Patnaik, S.; Kokkanti, R.R. Targeting the Retinoic Acid Signaling Pathway as a Modern Precision Therapy against Cancers. Front. Cell Dev. Biol. 2023, 11. [Google Scholar] [CrossRef]
- Li, B.; Cai, S.Y.; Boyer, J.L. The Role of the Retinoid Receptor, RAR/RXR Heterodimer, in Liver Physiology. Biochim. Biophys. Acta Mol. Basis Dis. 2021, 1867. [Google Scholar] [CrossRef]
- Liao, Y.P.; Ho, S.Y.; Liou, J.C. Non-Genomic Regulation of Transmitter Release by Retinoic Acid at Developing Motoneurons in Xenopus Cell Culture. J. Cell Sci. 2004, 117. [Google Scholar] [CrossRef]
- Chen, L.; Lau, A.G.; Sarti, F. Synaptic Retinoic Acid Signaling and Homeostatic Synaptic Plasticity. Neuropharmacology 2014, 78. [Google Scholar] [CrossRef]
- Corcoran, J.P.T.; Po, L.S.; Maden, M. Disruption of the Retinoid Signalling Pathway Causes a Deposition of Amyloid β in the Adult Rat Brain. Eur. J. Neurosci. 2004, 20. [Google Scholar] [CrossRef]
- Etchamendy, N.; Enderlin, V.; Marighetto, A.; Pallet, V.; Higueret, P.; Jaffard, R. Vitamin A Deficiency and Relational Memory Deficit in Adult Mice: Relationships with Changes in Brain Retinoid Signalling. Behav. Brain Res. 2003, 145. [Google Scholar] [CrossRef]
- Ciancia, M.; Rataj-Baniowska, M.; Zinter, N.; Baldassarro, V.A.; Fraulob, V.; Charles, A.L.; Alvarez, R.; Muramatsu, S. ichi; de Lera, A.R.; Geny, B.; et al. Retinoic Acid Receptor Beta Protects Striatopallidal Medium Spiny Neurons from Mitochondrial Dysfunction and Neurodegeneration. Prog. Neurobiol. 2022, 212. [Google Scholar] [CrossRef]
- Chiang, M.Y.; Misner, D.; Kempermann, G.; Schikorski, T.; Giguère, V.; Sucov, H.M.; Gage, F.H.; Stevens, C.F.; Evans, R.M. An Essential Role for Retinoid Receptors RARβ and RXRγ in Long-Term Potentiation and Depression. Neuron 1998, 21. [Google Scholar] [CrossRef] [PubMed]
- Roberts, C. Regulating Retinoic Acid Availability during Development and Regeneration: The Role of the CYP26 Enzymes. J. Dev. Biol. 2020, 8. [Google Scholar] [CrossRef]
- Walters, B.J.; Josselyn, S.A. Retinoic Acid Receptor Plays Both Sides of Homeostatic Plasticity. Proc. Natl. Acad. Sci. USA 2019, 116. [Google Scholar] [CrossRef]
- Sanjay, *!!! REPLACE !!!*; Kim, J.Y. Anti-Inflammatory Effects of 9-Cis-Retinoic Acid on β-Amyloid Treated Human Microglial Cells. Eur. J. Inflamm. 2022, 20. [Google Scholar] [CrossRef]
- Magalingam, K.B.; Somanath, S.D.; Md, S.; Haleagrahara, N.; Fu, J.Y.; Selvaduray, K.R.; Radhakrishnan, A.K. Tocotrienols Protect Differentiated SH-SY5Y Human Neuroblastoma Cells against 6-Hydroxydopamine-Induced Cytotoxicity by Ameliorating Dopamine Biosynthesis and Dopamine Receptor D2 Gene Expression. Nutr. Res. 2022, 98. [Google Scholar] [CrossRef]
- Pedersen, W.A.; Berse, B.; Schüler, U.; Wainer, B.H.; Blusztajn, J.K. All-trans- and 9-cis-Retinoic Acid Enhance the Cholinergic Properties of a Murine Septal Cell Line: Evidence That the Effects Are Mediated by Activation of Retinoic Acid Receptor-α. J. Neurochem. 1995, 65. [Google Scholar] [CrossRef] [PubMed]
- Lee, H.P.; Casadesus, G.; Zhu, X.; Lee, H.G.; Perry, G.; Smith, M.A.; Gustaw-Rothenberg, K.; Lerner, A. All-Trans Retinoic Acid as a Novel Therapeutic Strategy for Alzheimer’s Disease. Expert. Rev. Neurother. 2009, 9. [Google Scholar] [CrossRef] [PubMed]
- Fukasawa, H.; Nakagomi, M.; Yamagata, N.; Katsuki, H.; Kawahara, K.; Kitaoka, K.; Miki, T.; Shudo, K. Tamibarotene: A Candidate Retinoid Drug for Alzheimer’s Disease. Biol. Pharm. Bull. 2012, 35. [Google Scholar] [CrossRef]
- Zhang, X.; Subbanna, S.; Williams, C.R.O.; Canals-Baker, S.; Smiley, J.F.; Wilson, D.A.; Das, B.C.; Saito, M. Anti-Inflammatory Action of BT75, a Novel RARα Agonist, in Cultured Microglia and in an Experimental Mouse Model of Alzheimer’s Disease. Neurochem. Res. 2023, 48. [Google Scholar] [CrossRef]
- le Maire, A.; Alvarez, S.; Shankaranarayanan, P.; R de Lera, A.; Bourguet, W.; Gronemeyer, H. Retinoid Receptors and Therapeutic Applications of RAR/RXR Modulators. Curr. Top. Med. Chem. 2012, 12. [Google Scholar] [CrossRef]
- Galland, F.; Seady, M.; Taday, J.; Smaili, S.S.; Gonçalves, C.A.; Leite, M.C. Astrocyte Culture Models: Molecular and Function Characterization of Primary Culture, Immortalized Astrocytes and C6 Glioma Cells. Neurochem. Int. 2019, 131. [Google Scholar] [CrossRef]
- Shipley, M.M.; Mangold, C.A.; Szpara, M.L. Differentiation of the SH-SY5Y Human Neuroblastoma Cell Line. J. Vis. Exp. 2016, 2016. [Google Scholar] [CrossRef]
- Xu, L.; He, D.; Bai, Y. Microglia-Mediated Inflammation and Neurodegenerative Disease. Mol. Neurobiol. 2016, 53. [Google Scholar] [CrossRef] [PubMed]
- Lepiarz, I.; Olajide, O. The Human Microglia (HMC-3) as a Cellular Model of Neuroinflammation. IBRO Rep. 2019, 6. [Google Scholar] [CrossRef]
- Hewson, Q.C.; Lovat, P.E.; Pearson, A.D.J.; Redfern, C.P.F. Retinoid Signalling and Gene Expression in Neuroblastoma Cells: RXR Agonist and Antagonist Effects on CRABP-II and RARβ Expression. J. Cell Biochem. 2002, 87. [Google Scholar] [CrossRef] [PubMed]
- Huang, P.; Chandra, V.; Rastinejad, F. Retinoic Acid Actions through Mammalian Nuclear Receptors. Chem. Rev. 2014, 114. [Google Scholar] [CrossRef] [PubMed]
- Xu, J.; Storer, P.D.; Chavis, J.A.; Racke, M.K.; Drew, P.D. Agonists for the Peroxisome Proliferator-Activated Receptor-α and the Retinoid X Receptor Inhibit Inflammatory Responses of Microglia. J. Neurosci. Res. 2005, 81. [Google Scholar] [CrossRef]
- Fontenete, S.; Carvalho, D.; Lourenço, A.; Guimarães, N.; Madureira, P.; Figueiredo, C.; Azevedo, N.F. FISHji: New ImageJ Macros for the Quantification of Fluorescence in Epifluorescence Images. Biochem. Eng. J. 2016, 112. [Google Scholar] [CrossRef]
- Surin, A.M.; Sharipov, R.R.; Krasil’nikova, I.A.; Boyarkin, D.P.; Lisina, O.Y.; Gorbacheva, L.R.; Avetisyan, A. V.; Pinelis, V.G. Disruption of Functional Activity of Mitochondria during MTT Assay of Viability of Cultured Neurons. Biochemistry 2017, 82. [Google Scholar] [CrossRef] [PubMed]
- Lobner, D. Comparison of the LDH and MTT Assays for Quantifying Cell Death: Validity for Neuronal Apoptosis? J. Neurosci. Methods 2000, 96. [Google Scholar] [CrossRef] [PubMed]
- Leng, S.X.; McElhaney, J.E.; Walston, J.D.; Xie, D.; Fedarko, N.S.; Kuchel, G.A. ELISA and Multiplex Technologies for Cytokine Measurement in Inflammation and Aging Research. J. Gerontol. Ser. A Biol. Sci. Med. Sci. 2008, 63. [Google Scholar] [CrossRef]
- Geng, Y.Q.; Guan, J.T.; Xu, X.H.; Fu, Y.C. Senescence-Associated Beta-Galactosidase Activity Expression in Aging Hippocampal Neurons. Biochem. Biophys. Res. Commun. 2010, 396. [Google Scholar] [CrossRef] [PubMed]
- Struewing, I.T.; Durham, S.N.; Barnett, C.D.; Mao, C.D. Enhanced Endothelial Cell Senescence by Lithium-Induced Matrix Metalloproteinase-1 Expression. J. Biol. Chem. 2009, 284. [Google Scholar] [CrossRef]
- Hwang, H.J.; Kim, Y.K. The Role of LC3B in Autophagy as an RNA-Binding Protein. Autophagy 2023, 19. [Google Scholar] [CrossRef]
- Nabors, L.B.; Songu-Mize, E.; Mize, R.R. Quantitative Immunocytochemistry Using an Image Analyzer. II. Concentration Standards for Transmitter Immunocytochemistry. J. Neurosci. Methods 1988, 26. [Google Scholar] [CrossRef]
- Angelova, P.R.; Abramov, A.Y. Role of Mitochondrial ROS in the Brain: From Physiology to Neurodegeneration. FEBS Lett. 2018, 592. [Google Scholar] [CrossRef]
- Dey, K.; Bazala, M.A.; Kuznicki, J. Targeting Mitochondrial Calcium Pathways as a Potential Treatment against Parkinson’s Disease. Cell Calcium 2020, 89. [Google Scholar] [CrossRef]
- Catanesi, M.; D’angelo, M.; Tupone, M.G.; Benedetti, E.; Giordano, A.; Castelli, V.; Cimini, A. Micrornas Dysregulation and Mitochondrial Dysfunction in Neurodegenerative Diseases. Int. J. Mol. Sci. 2020, 21. [Google Scholar] [CrossRef]
- Niewiadomska-Cimicka, A.; Krzyżosiak, A.; Ye, T.; Podleśny-Drabiniok, A.; Dembélé, D.; Dollé, P.; Krężel, W. Genome-Wide Analysis of RARβ Transcriptional Targets in Mouse Striatum Links Retinoic Acid Signaling with Huntington’s Disease and Other Neurodegenerative Disorders. Mol. Neurobiol. 2017, 54. [Google Scholar] [CrossRef]
- Marie, A.; Darricau, M.; Touyarot, K.; Parr-Brownlie, L.C.; Bosch-Bouju, C. Role and Mechanism of Vitamin A Metabolism in the Pathophysiology of Parkinson’s Disease. J. Park. Dis. 2021, 11. [Google Scholar] [CrossRef]
- Dheen, S.T.; Jun, Y.; Yan, Z.; Tay, S.S.W.; Ling, E.A. Retinoic Acid Inhibits Expression of TNF-α and INOS in Activated Rat Microglia. Glia 2005, 50. [Google Scholar] [CrossRef]
- Almaguer, J.; Hindle, A.; Lawrence, J.J. The Contribution of Hippocampal All-Trans Retinoic Acid (ATRA) Deficiency to Alzheimer’s Disease: A Narrative Overview of ATRA-Dependent Gene Expression in Post-Mortem Hippocampal Tissue. Antioxidants 2023, 12. [Google Scholar] [CrossRef]
- Kolarcik, C.L.; Bowser, R. Retinoid Signaling Alterations in Amyotrophic Lateral Sclerosis. Am. J. Neurodegener. Dis. 2012, 1. [Google Scholar] [CrossRef]
- Medina, D.X.; Chung, E.P.; Teague, C.D.; Bowser, R.; Sirianni, R.W. Intravenously Administered, Retinoid Activating Nanoparticles Increase Lifespan and Reduce Neurodegeneration in the SOD1G93A Mouse Model of ALS. Front. Bioeng. Biotechnol. 2020, 8. [Google Scholar] [CrossRef] [PubMed]
- Riancho, J.; Ruiz-Soto, M.; Berciano, M.T.; Berciano, J.; Lafarga, M. Neuroprotective Effect of Bexarotene in the SOD1G93A Mouse Model of Amyotrophic Lateral Sclerosis. Front. Cell Neurosci. 2015, 9. [Google Scholar] [CrossRef] [PubMed]
- Isoherranen, N.; Zhong, G. Biochemical and Physiological Importance of the CYP26 Retinoic Acid Hydroxylases. Pharmacol. Ther. 2019, 204. [Google Scholar] [CrossRef] [PubMed]
- Okano, J.; Lichti, U.; Mamiya, S.; Aronova, M.; Zhang, G.; Yuspa, S.H.; Hamada, H.; Sakai, Y.; Morasso, M.I. Increased Retinoic Acid Levels through Ablation of Cyp26b1 Determine the Processes of Embryonic Skin Barrier Formation and Peridermal Development. J. Cell Sci. 2012, 125. [Google Scholar] [CrossRef]
- Topletz, A.R.; Thatcher, J.E.; Zelter, A.; Lutz, J.D.; Tay, S.; Nelson, W.L.; Isoherranen, N. Comparison of the Function and Expression of CYP26A1 and CYP26B1, the Two Retinoic Acid Hydroxylases. Biochem. Pharmacol. 2012, 83. [Google Scholar] [CrossRef] [PubMed]
- Spoorendonk, K.M.; Peterson-Maduro, J.; Renn, J.; Trowe, T.; Kranenbarg, S.; Winkler, C.; Schulte-Merker, S. Retinoic Acid and Cyp26b1 Are Critical Regulators of Osteogenesis in the Axial Skeleton. Development 2008, 135. [Google Scholar] [CrossRef]
- Stevison, F.; Jing, J.; Tripathy, S.; Isoherranen, N. Role of Retinoic Acid-Metabolizing Cytochrome P450s, CYP26, in Inflammation and Cancer. In Advances in Pharmacology; 2015; Volume 74.
- Obrador, E.; Salvador-Palmer, R.; López-Blanch, R.; Jihad-Jebbar, A.; Vallés, S.L.; Estrela, J.M. The Link between Oxidative Stress, Redox Status, Bioenergetics and Mitochondria in the Pathophysiology of Als. Int. J. Mol. Sci. 2021, 22. [Google Scholar] [CrossRef]
- Dorszewska, J.; Kowalska, M.; Prendecki, M.; Piekut, T.; Kozłowska, J.; Kozubski, W. Oxidative Stress Factors in Parkinson’s Disease. Neural Regen. Res. 2021, 16. [Google Scholar] [CrossRef]
- Rummel, N.G.; Butterfield, D.A. Altered Metabolism in Alzheimer Disease Brain: Role of Oxidative Stress. Antioxid. Redox Signal 2022, 36. [Google Scholar] [CrossRef]
- Jomova, K.; Raptova, R.; Alomar, S.Y.; Alwasel, S.H.; Nepovimova, E.; Kuca, K.; Valko, M. Reactive Oxygen Species, Toxicity, Oxidative Stress, and Antioxidants: Chronic Diseases and Aging. Arch. Toxicol. 2023, 97. [Google Scholar] [CrossRef] [PubMed]
- Poh Loh, K.; Hong Huang, S.; De Silva, R.H.; Tan, B.; Zhun Zhu, Y. Oxidative Stress: Apoptosis in Neuronal Injury. Curr. Alzheimer Res. 2006, 3. [Google Scholar] [CrossRef] [PubMed]
- Sastre, J.; Pallardö, F. V.; Viña, J. Mitochondrial Oxidative Stress Plays a Key Role in Aging and Apoptosis. IUBMB Life 2000, 49. [Google Scholar] [CrossRef]
- Kang, J. Bin; Park, D.J.; Shah, M.A.; Koh, P.O. Retinoic Acid Exerts Neuroprotective Effects against Focal Cerebral Ischemia by Preventing Apoptotic Cell Death. Neurosci. Lett. 2021, 757. [Google Scholar] [CrossRef]
- Ahlemeyer, B.; Bauerbach, E.; Plath, M.; Steuber, M.; Heers, C.; Tegtmeier, F.; Krieglstein, J. Retinoic Acid Reduces Apoptosis and Oxidative Stress by Preservation of SOD Protein Level. Free Radic. Biol. Med. 2001, 30. [Google Scholar] [CrossRef]
- Xu, Q.; Konta, T.; Kitamura, M. Retinoic Acid Regulation of Mesangial Cell Apoptosis. Exp. Nephrol. 2002, 10. [Google Scholar] [CrossRef] [PubMed]
- Kitamura, M.; Ishikawa, Y.; Moreno-Manzano, V.; Xu, Q.; Konta, T.; Lucio-Cazana, J.; Furusu, A.; Nakayama, K. Intervention by Retinoic Acid in Oxidative Stress-Induced Apoptosis. Nephrol. Dial. Transplant. 2002, 17. [Google Scholar] [CrossRef] [PubMed]
- Rea, I.M.; Gibson, D.S.; McGilligan, V.; McNerlan, S.E.; Denis Alexander, H.; Ross, O.A. Age and Age-Related Diseases: Role of Inflammation Triggers and Cytokines. Front. Immunol. 2018, 9. [Google Scholar] [CrossRef] [PubMed]
- Kevin Howcroft, T.; Campisi, J.; Louis, G.B.; Smith, M.T.; Wise, B.; Wyss-Coray, T.; Augustine, A.D.; McElhaney, J.E.; Kohanski, R.; Sierra, F. The Role of Inflammation in Age-Related Disease. Aging 2013, 5. [Google Scholar] [CrossRef]
- Du, L.; Zhang, Y.; Chen, Y.; Zhu, J.; Yang, Y.; Zhang, H.L. Role of Microglia in Neurological Disorders and Their Potentials as a Therapeutic Target. Mol. Neurobiol. 2017, 54. [Google Scholar] [CrossRef] [PubMed]
- An, J.; Chen, B.; Kang, X.; Zhang, R.; Guo, Y.; Zhao, J.; Yang, H. Neuroprotective Effects of Natural Compounds on LPS-Induced Inflammatory Responses in Microglia. Am. J. Transl. Res. 2020, 12. [Google Scholar]
- Tian, Y.; Liu, B.; Li, Y.; Zhang, Y.; Shao, J.; Wu, P.; Xu, C.; Chen, G.; Shi, H. Activation of RARα Receptor Attenuates Neuroinflammation After SAH via Promoting M1-to-M2 Phenotypic Polarization of Microglia and Regulating Mafb/Msr1/PI3K-Akt/NF-ΚB Pathway. Front. Immunol. 2022, 13. [Google Scholar] [CrossRef]
- Takaoka, Y.; Takahashi, M.; Kurauchi, Y.; Hisatsune, A.; Seki, T.; Shudo, K.; Katsuki, H. Retinoic Acid Receptor Agonist Am80 Inhibits CXCL2 Production from Microglial BV-2 Cells via Attenuation of NF-ΚB Signaling. Int. Immunopharmacol. 2016, 38. [Google Scholar] [CrossRef]
- Nixon, R.A. The Role of Autophagy in Neurodegenerative Disease. Nat. Med. 2013, 19. [Google Scholar] [CrossRef]
- Takalo, M.; Salminen, A.; Soininen, H.; Hiltunen, M.; Haapasalo, A. Protein Aggregation and Degradation Mechanisms in Neurodegenerative Diseases. Am. J. Neurodegener. Dis. 2013, 2. [Google Scholar]
- Lin, M.; Yu, H.; Xie, Q.; Xu, Z.; Shang, P. Role of Microglia Autophagy and Mitophagy in Age-Related Neurodegenerative Diseases. Front. Aging Neurosci. 2022, 14. [Google Scholar] [CrossRef] [PubMed]
- Visnjic, D.; Dembitz, V.; Lalic, H. The Role of AMPK/MTOR Modulators in the Therapy of Acute Myeloid Leukemia. Curr. Med. Chem. 2018, 26. [Google Scholar] [CrossRef]
- Long, C.; Zhou, Y.; Shen, L.; Yu, Y.; Hu, D.; Liu, X.; Lin, T.; He, D.; Xu, T.; Zhang, D.; et al. Retinoic Acid Can Improve Autophagy through Depression of the PI3K-Akt-MTOR Signaling Pathway via RARα to Restore Spermatogenesis in Cryptorchid Infertile Rats. Genes. Dis. 2022, 9. [Google Scholar] [CrossRef]
- Cascella, R.; Cecchi, C. Calcium Dyshomeostasis in Alzheimer’s Disease Pathogenesis. Int. J. Mol. Sci. 2021, 22. [Google Scholar] [CrossRef]
- Ochneva, A.; Zorkina, Y.; Abramova, O.; Pavlova, O.; Ushakova, V.; Morozova, A.; Zubkov, E.; Pavlov, K.; Gurina, O.; Chekhonin, V. Protein Misfolding and Aggregation in the Brain: Common Pathogenetic Pathways in Neurodegenerative and Mental Disorders. Int. J. Mol. Sci. 2022, 23. [Google Scholar] [CrossRef] [PubMed]
- Kritsilis, M.; Rizou, S. V.; Koutsoudaki, P.N.; Evangelou, K.; Gorgoulis, V.G.; Papadopoulos, D. Ageing, Cellular Senescence and Neurodegenerative Disease. Int. J. Mol. Sci. 2018, 19. [Google Scholar] [CrossRef]
- Masaldan, S.; Belaidi, A.A.; Ayton, S.; Bush, A.I. Cellular Senescence and Iron Dyshomeostasis in Alzheimer’s Disease. Pharmaceuticals 2019, 12. [Google Scholar] [CrossRef] [PubMed]
- Baker, D.J.; Petersen, R.C. Cellular Senescence in Brain Aging and Neurodegenerative Diseases: Evidence and Perspectives. J. Clin. Investig. 2018, 128. [Google Scholar] [CrossRef]
- Chaib, S.; Tchkonia, T.; Kirkland, J.L. Cellular Senescence and Senolytics: The Path to the Clinic. Nat. Med. 2022, 28. [Google Scholar] [CrossRef]
- Zhang, L.; Pitcher, L.E.; Prahalad, V.; Niedernhofer, L.J.; Robbins, P.D. Targeting Cellular Senescence with Senotherapeutics: Senolytics and Senomorphics. FEBS J. 2023, 290. [Google Scholar] [CrossRef]
Disclaimer/Publisher’s Note: The statements, opinions and data contained in all publications are solely those of the individual author(s) and contributor(s) and not of MDPI and/or the editor(s). MDPI and/or the editor(s) disclaim responsibility for any injury to people or property resulting from any ideas, methods, instructions or products referred to in the content. |
© 2024 by the authors. Licensee MDPI, Basel, Switzerland. This article is an open access article distributed under the terms and conditions of the Creative Commons Attribution (CC BY) license (http://creativecommons.org/licenses/by/4.0/).


