Preprint
Article

Vision Systems for a UR5 Cobot on a Quality Control Robotic Station

Altmetrics

Downloads

185

Views

227

Comments

0

A peer-reviewed article of this preprint also exists.

This version is not peer-reviewed

Submitted:

07 March 2024

Posted:

08 March 2024

You are already at the latest version

Alerts
Abstract
The paper delineates the developed vision system of the UR5 cobot and the operating algorithm of the robotic quality control station. The hardware-software architecture of the developed robotic station was shown, consisting of a UR5 cobot equipped with a web camera and a stationary industrial camera with a lighting system. Image processing and analysis algorithms were described, the method of control and communication between the station components was discussed, and two operating scenarios were presented as a single robotic station and a robotic line. Based on the results obtained, the level of measurement noise, accuracy, and repeatability of the developed vision system were estimated.
Keywords: 
Subject: Computer Science and Mathematics  -   Robotics

1. Introduction

Vision systems are one of the critical elements of modern automation and robotization processes. They have gained great recognition due to their significant capabilities in collecting and analyzing process data. The process of collecting and exchanging data between devices is the basic assumption of the concept of industry 4.0. together with integrating various systems based on recent achievements in many areas of science and technology, such as robotics, vision systems, machine learning, deep learning, and data processing [1,2]. Vision systems, robots/cobots and autonomous mobile robots constitute essential components of the Industry 4.0 paradigm and smart manufacturing and point out its future [3,4,5].
In general, vision system consists of following components: illumination system, lens, cameras, optionally video signal acquisition card ( frame-grabbers) , computer with appropriate software, communication systems with peripheral devices, and additional sensors.
Vision technology (2D) available in the market can be categorized based on the type of devices utilized and the specific requirements [6]:
Vision sensors are characterized by their ease of use and flexibility, serving as an integrated image processing system combined with optical components and lighting. Additionally, they are equipped with various communication interfaces enabling data exchange with external devices. They are primarily used for low-complexity image analysis tasks.
Smart cameras integrate CPU and image sensor functions with their own operating systems, enabling onboard image processing. They are primarily used for object localization, character recognition, and reading one- and two-dimensional barcodes. Smart cameras are often classified as the type of vision sensors with a limited and defined capacity range. They are also more flexible and equipped with software tools offering numerous processing and image analysis algorithms. Their processing units can be equipped with Intel or Motorola microprocessors, DSP signal processors, FPGA devices, or combinations. They are also provided with serial interfaces and digital in/out cards.
Embedded vision systems are furnished with specialized libraries for real-time image analysis, predominantly engineered and deployed based on FPGA and DSP architectures. Embedded vision systems are equipped with specialized libraries for real-time image analysis. They are designed and implemented primarily using FPGA and DSP devices. These systems offer high computation speed, ease of use, and low cost. They typically include libraries of basic algorithms dedicated to real-time image processing and video data manipulation. While they offer limited flexibility due to their application-specific nature, embedded vision systems are increasingly utilized in autonomous vehicles, drones, smart traffic devices, and IoT devices. They allow autonomous decision-making based on vision data by integrating image processing and recognition algorithms within these devices. This is made possible by integrating embedded cameras (e.g., equipped with MIPI , GMSL interfaces) with high-end processors like NVIDIA Jetson, NXP i.MX8, Raspberry Pi 4, Google coral, Xilinx , etc.
PC-based vision systems offer an independent selection of optimal elements for the implemented process, providing greater flexibility and the ability to utilize multiple cameras and complex image analysis algorithms. They distinguish themselves from smart camera vision sensors by allowing exploiting more than one camera and providing higher computational power for sophisticated vision algorithms (especially when equipped with a high performance industrial computer).
PC-based vision systems are suitable for a wide range of applications, including those requiring complex tasks such as system calibration, optical character recognition, code reading, counting and measuring, gauging and metrology, and object recognition based on deep learning.
In a broader sense, vision systems belong to the interdisciplinary field of science and technology because they encompass optics, photography, electronics, mathematics, computer technology, computer science, and artificial intelligence. In the manufacturing and automation process, they are widely tailored to various robot tasks/applications, allowing the robot to analyze, make decisions, and interact with the environment effectively.
Designing a vision system within a robotic station is related to several important areas of knowledge in image processing, such as camera calibration, camera calibration with a robot, image preprocessing, image segmentation, analysis and recognition, shape detection, and vision-based measurements.
The main purpose of the camera calibration process is to determine the internal and external parameters of the camera [8,9,10,11,12]. The need to carry out the calibration process is mainly related to the necessity to remove distortions introduced by the camera’s optical path, the possibility of measurements in SI units, and to obtain the model and position of the camera with reference to the given coordinate system [8,9,10,11,13]. System calibration is the most crucial step in a vision-based measurement system and is essential when metric data is required [10,14]. Calibration of a camera with a robot [11,12,13,15] can be classified into Eye-to-hand (camera placed on the station) and Eye-in-hand (camera mounted on the robot). As a result of the calibration procedure, a transformation is obtained that maps the system from the camera’s image space to the coordinate system associated with the robot [11,12,13,15].
Image segmentation is aimed at dividing the image into subareas with similar features. These subareas enable, at a later stage, the extraction and isolation of various structures and objects in the image [16,17,18].
Recognition of image objects is a field dominated in recent years by deep learning algorithms. However, initially, three basic strategies were commonly used: SIFT, SURF, and BRIEF. In the works [19,20], the authors compared the basic algorithms for detecting and matching features available in the OpenCV libraries. In the first case, as part of experimental research, and in the second, as one of the tasks performed by a robotic station.
Vision measurements enable the determination of objects’ geometric features [14,21,22,23,24]. In the field of image processing, one can find many works showing the practical use of the discussed issues. An example of such applications in identifying image features is presented [25], where an original algorithm based on the ORB algorithm concerning image processing on FPGA systems is discussed. Another work [26] focuses on assessing using SIFT and SURF feature detectors for analyzing underwater images. The work [27] addresses using Fast R-CNN fast convolutional networks to develop a waste identification system in a garbage sorting plant. The system is complemented by a robotic line that performs the sorting process. The area of application of vision systems in robotics employing image processing methods is the automated identification of positions of workcell components with Aruco markers and OpenCV library [28]. Another group of works covering the issue of using vision systems in robotics are applications built based on the ROS (Robot Operating System) environment engaging OpenCV libraries and C++ or Pyhton languages [29,30,31,32].
Combining vision techniques with a robot means equipping the robot with a complex sensor mechanism that allows intelligent reactions to events occurring in the machine’s surroundings. The employment of vision systems and other sensors is caused by a constant need to increase flexibility, improve production quality and efficiency of production processes, and increase the application range in robotics. According to market report [60], the most often application of robotic vision systems, besides measurement, inspection and testing encompass: material handling; welding and soldering; assembling and disassembling; packaging and palletizing; painting; cutting, pressing, griding, and deburring. MRFR forecasts point out the global robotic vision market will attain USD 9 billion and grow at CAGR of 12% in the period 2020-2027 [60].
Robot vision is a process of extracting, identifying, and interpreting the information obtained from a 3D scene. Two- and three-dimensional robot vision systems belong to standard non-contact measurement systems for object localization and identification in the robot workspace. It provides accurate information about parts’ position, orientation, and location changes [32,33,34] as well as the robot’s location [35,36] . The main merit of robot vision systems is their ability to intelligently locate and recognize parts in 3D space by means of one or more cameras. Cameras can be installed either stationary (permanently mounted above the robot workspace) or mobile - installed on the robot arm. Thus, the calibration of the vision system with a robot becomes a key element [10,11,12,13,15]. Therefore, two types of robot vision systems are to be distinguished: dedicated to the specific robot type (i.e., Omron/ACE Sight [37], Fanuc/iRVision [38]) and of general use (i.e., Cognex, Keyence, Omorn, Matrox, National Instruments, Stemmer-Imaging, Sick, etc.). In the case of dedicated systems embedded in the robot controller, calibration takes place in one operating system and programming environment reserved to a given robot manufacturer ( i.e., ACE Sight[37], iRVision[38]). Meanwhile, for general-purpose systems, the calibration procedure is performed by the software modules of the vision system in the robot’s programming environment through special software equipped with user-friendly interfaces, installed on the robot controller, or installed on an external computer. For instance, Cognex vision URCap packages are software extensions for the Universal Robot system and integrate into PolyScope, the graphical programming interface of Universal Robots. URCaps packages aim to extend any Universal Robot seamlessly with customized functionality [39] .
Vision systems allow to perform complex tasks that accompany mobile robots, and they perform those tasks with a high level of autonomy, reliability of performed operations, and interaction with the operator [40,41].They enable dynamic environment exploration, navigation/guiding [42], map building [43], and vision control of various tracking systems [44].
Employment of vision systems enables the detection of product flaws in the initial production stage, while identification of their cause eliminates defective products on the spot. In the realm of industrial automation, vision systems are most commonly used in the verification and quality control of various products for instance, in measurement, shape control and product sorting food products [45,46], control of the surface flatness of welded aluminum bodies [46], quality inspection of slate slabs involving detection of surface defects [48], quality control of clutch friction disc by detection flaws [49], quality control of bearing by inspection of bearing surfaces and defect detection [50] , inspection of dimensions and material defects on the wood surface [51], developing vision system for measurement and inspection of bolt employing CNN [52], surface quality inspection of mobile phone back glass based on Deep Learning framework [53], in an automatic method of positioning a vision system for quality control of washing machine parts on production line[54], in yarn quality control identifying yarn defect called nep as an example of application in wider yarn spinning industry[55], inspection a hole in industrial robot satellite assembly systems [56]. A comprehensive review of vision systems applications for product quality control is presented in [57,58].
As mentioned above, in industrial robotic stations, vision systems are mainly used to determine the position and orientation of objects in the robot’s working space. The hardware and software architecture proposed in this paper, and the developed algorithms extend existing quality control applications with the process of analysis of moving objects, detection based on shape, and measurement of fundamental geometric quantities in the working space of the UR5 cobot equipped with a vision system consisting of two different and independent cameras based on a PC implemented in Python using OpenCV libraries.
The paper aims to present the developed vision system and work algorithm for a robotic quality control station based on the UR5 CB2 collaborative robot from Universal Robots, integrated with the SAVIO CAK-01 web camera and the Mako G-125B stationary industrial camera. The developed algorithms for the software part of the vision system were based on the openCV library and, together with the control algorithm and the communication module between the cobot, the SCARA robot, and the mobile autonomous robot, were implemented in Python and the PolyScope environment. The level of measurement noise, accuracy, and repeatability of the developed vision system were estimated and analyzed. The final part of the article briefly discusses the methodologies for integrating the developed application with a robotic station and a robotic line . The proposed hardware and software architecture of the robotic station, consisting of the UR5 cobot, the SCARA i4 - 550L industrial robot, and the Omron LD90 autonomous mobile robot, was presented, and an additional robotic line was briefly discussed.

2. Methodology-Image Processing Algorithms

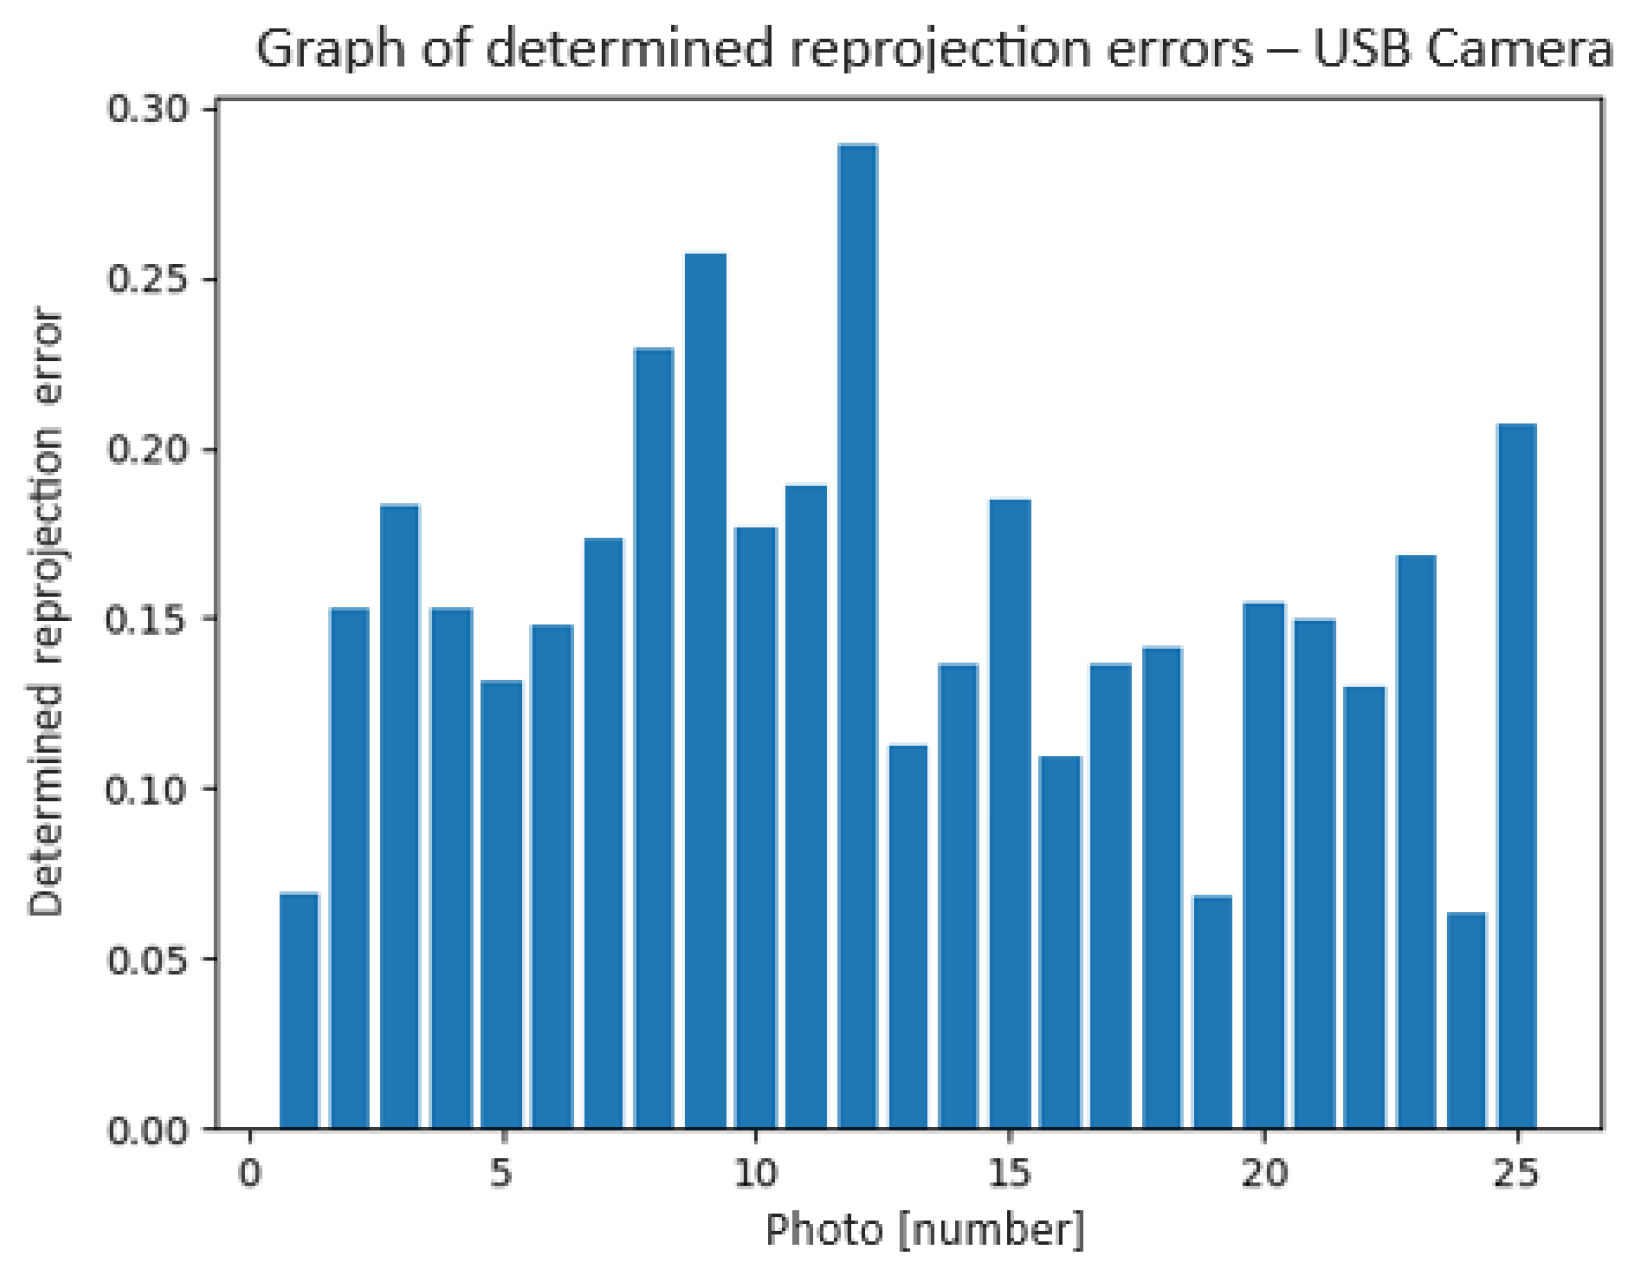
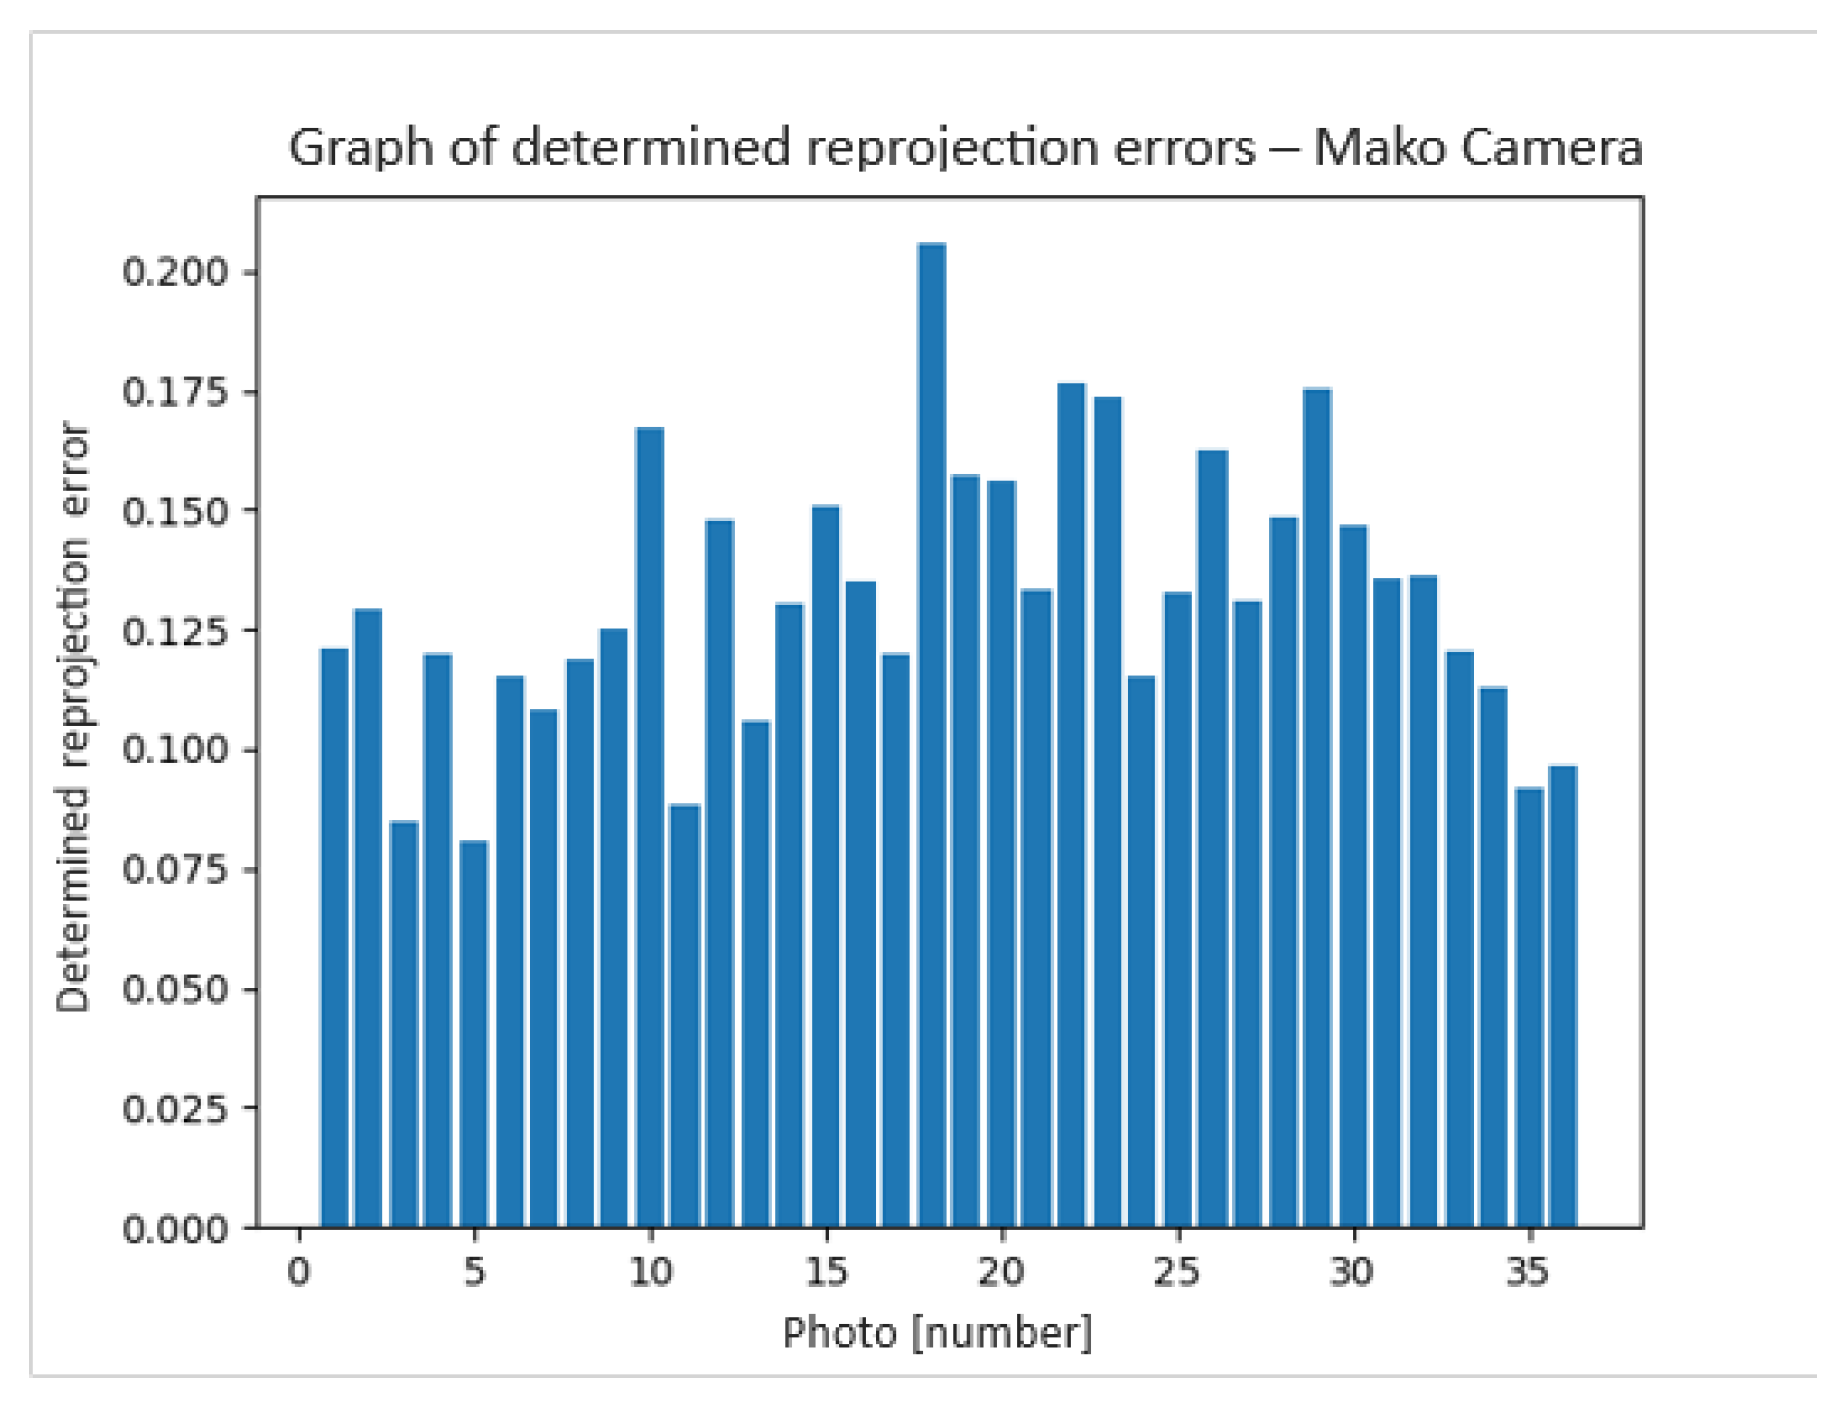
The first step before the image analysis is the camera calibration process to remove image distortions introduced by the optical path. For this purpose, a function cv.calibrateCamera() available from the OpenCV [7,61,62] libraries was used. For calibration, a chessboard-type calibration board was provided with the following dimensions: for the USB camera – 270×240mm for the Mako camera – 150×150mm. Below (Error! Reference source not found. – Figure 1), the determined values of reprojection errors for individual calibration photos are presented. On this basis, photos that did not meet the assumed reprojection error threshold were rejected, and the matrices of internal and external parameters were recalculated. The determined matrices, camera, and distortion vector values for both cameras are presented below (Error! Reference source not found.. – Error! Reference source not found..).
Table 1. Mako camera – values of the estimated camera matrices and distortion vector (radial and tangential).
Distortion Coefficients = [-0.27496, 4.08649, -0.00045, -0.00277, -0.00043] (1)
Camera Matrix = 4862.88707 0 592.17219 0 4858.84719 437.38086 0 0 1 (2)
Table 2. Savio camera – values of estimated camera matrices and distortion vector (radial and tangential).
Distortion Coefficients = [-0.37186, 0.13426, -0.00247, -0.0007, -0.02940] (3)
Camera Matrix = 502.57943 0 313.29807 0 502.95521 196.46255 0 0 1 (4)
Figure 1. Graph of calculated reprojection errors for a USB camera.
Preprints 100865 g001
Figure 1. Graph of calculated reprojection errors for the Mako camera.
Preprints 100865 g002
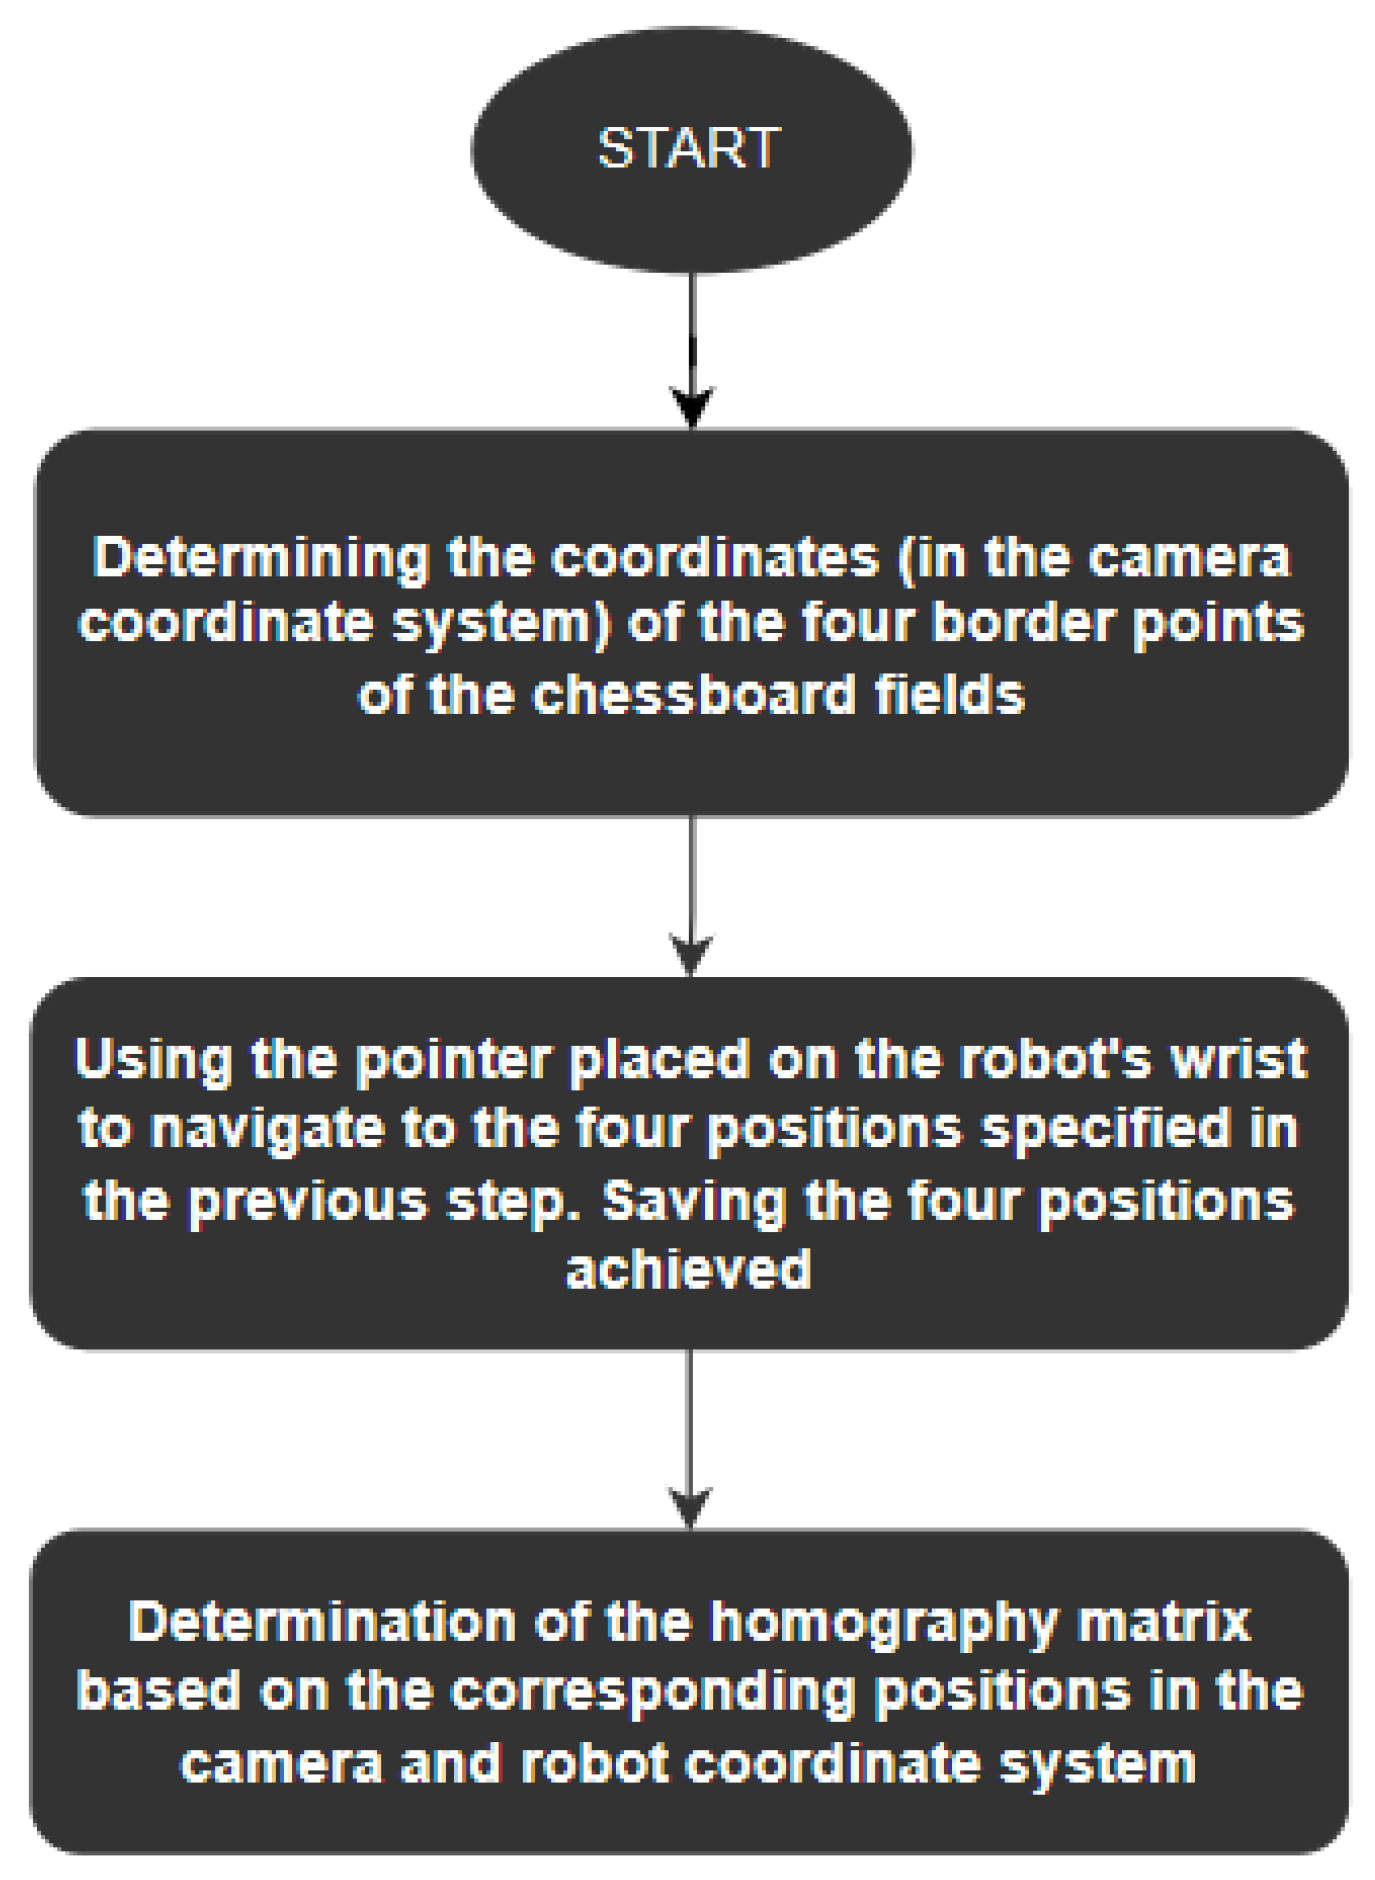
While the station is operating, two vision sequences (algorithms) are performed; the first involves determining the position and orientation of details placed in the cobot’s picking zone. The latter deals with the detection of details and basic measurements of quantities such as width, height, diameter (in the case of circular objects), and surface area, taking into account the internal contours of the details. For the developed algorithms a robot-camera calibration process was necessary. As a result of the calibration procedure, a homographic transformation is obtained, mapping the system from the camera’s image plane to the coordinate system associated with the robot. Below is a schematic diagram of the calibration process (Error! Reference source not found.).
Figure 3. Sequence diagram for determining the homography matrix.
Preprints 100865 g003
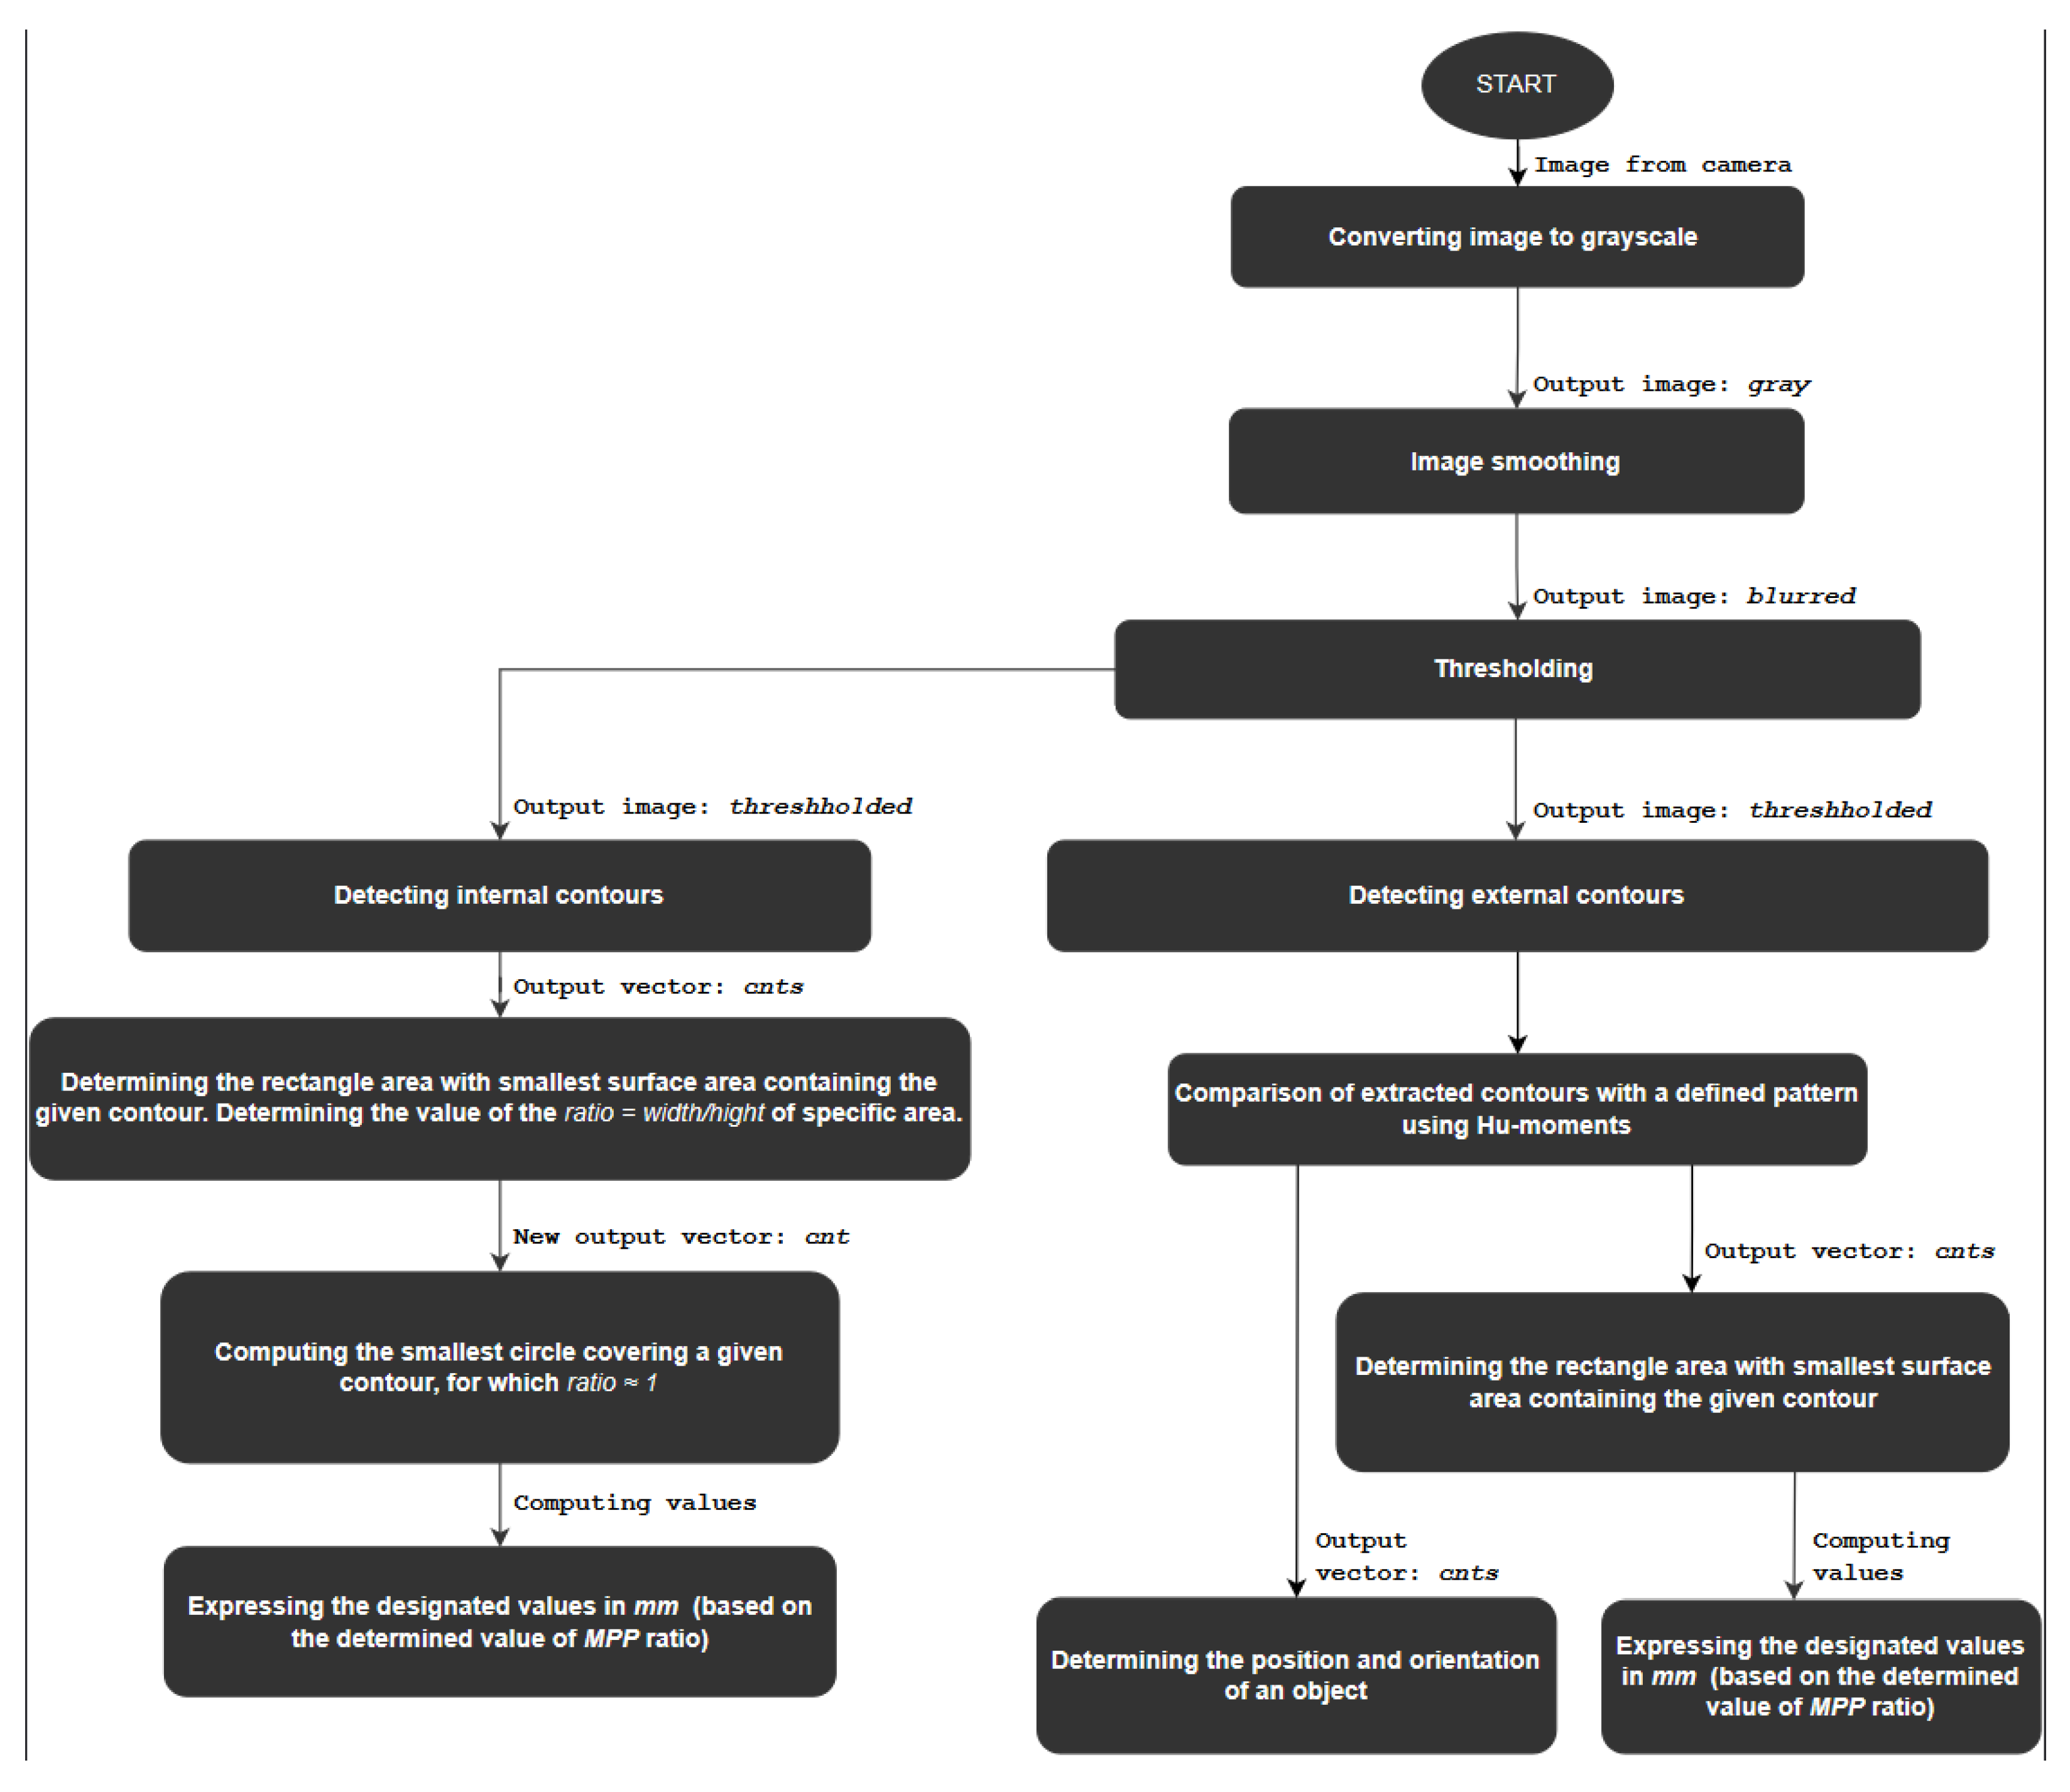
In the case of both vision sequences, the process of image preprocessing is similar (image conversion to grayscale, thresholding, detection of contours in the binary image). The diagram below (Error! Reference source not found..) shows the subsequent steps of the algorithm implementing the process of determining position and orientation and measuring fundamental geometric quantities. The results of vision measurements are carried out using sub-pixel methods. The conversion of the obtained values to SI units mm is the final process of a given sequence.
Figure 4. Developed algorithm implementing vision measurements based on openCV libraries [7,61,62].
Preprints 100865 g004
(The first vision algorithm) Vision sequence responsible for determining position and orientation:
Step 1 – image preprocessing before contour detection; include conversion to grayscale in the case of a color image, smoothing using a Gaussian filter, thresholding, and bit negation for contour detection,
Step 2 – detection of external contours in a binary image using the cv.findContours() function (topological structural analysis is applied to detect contours),
Step 3 – elimination of contours that do not meet the adopted parameters for the extracted image features,
Step 4 – comparison of extracted contours with a defined pattern using Hu-moments (cv.matchShapes()),
Step 5 – determination of the centroid and orientation angle based on first- and second-order moment methods,
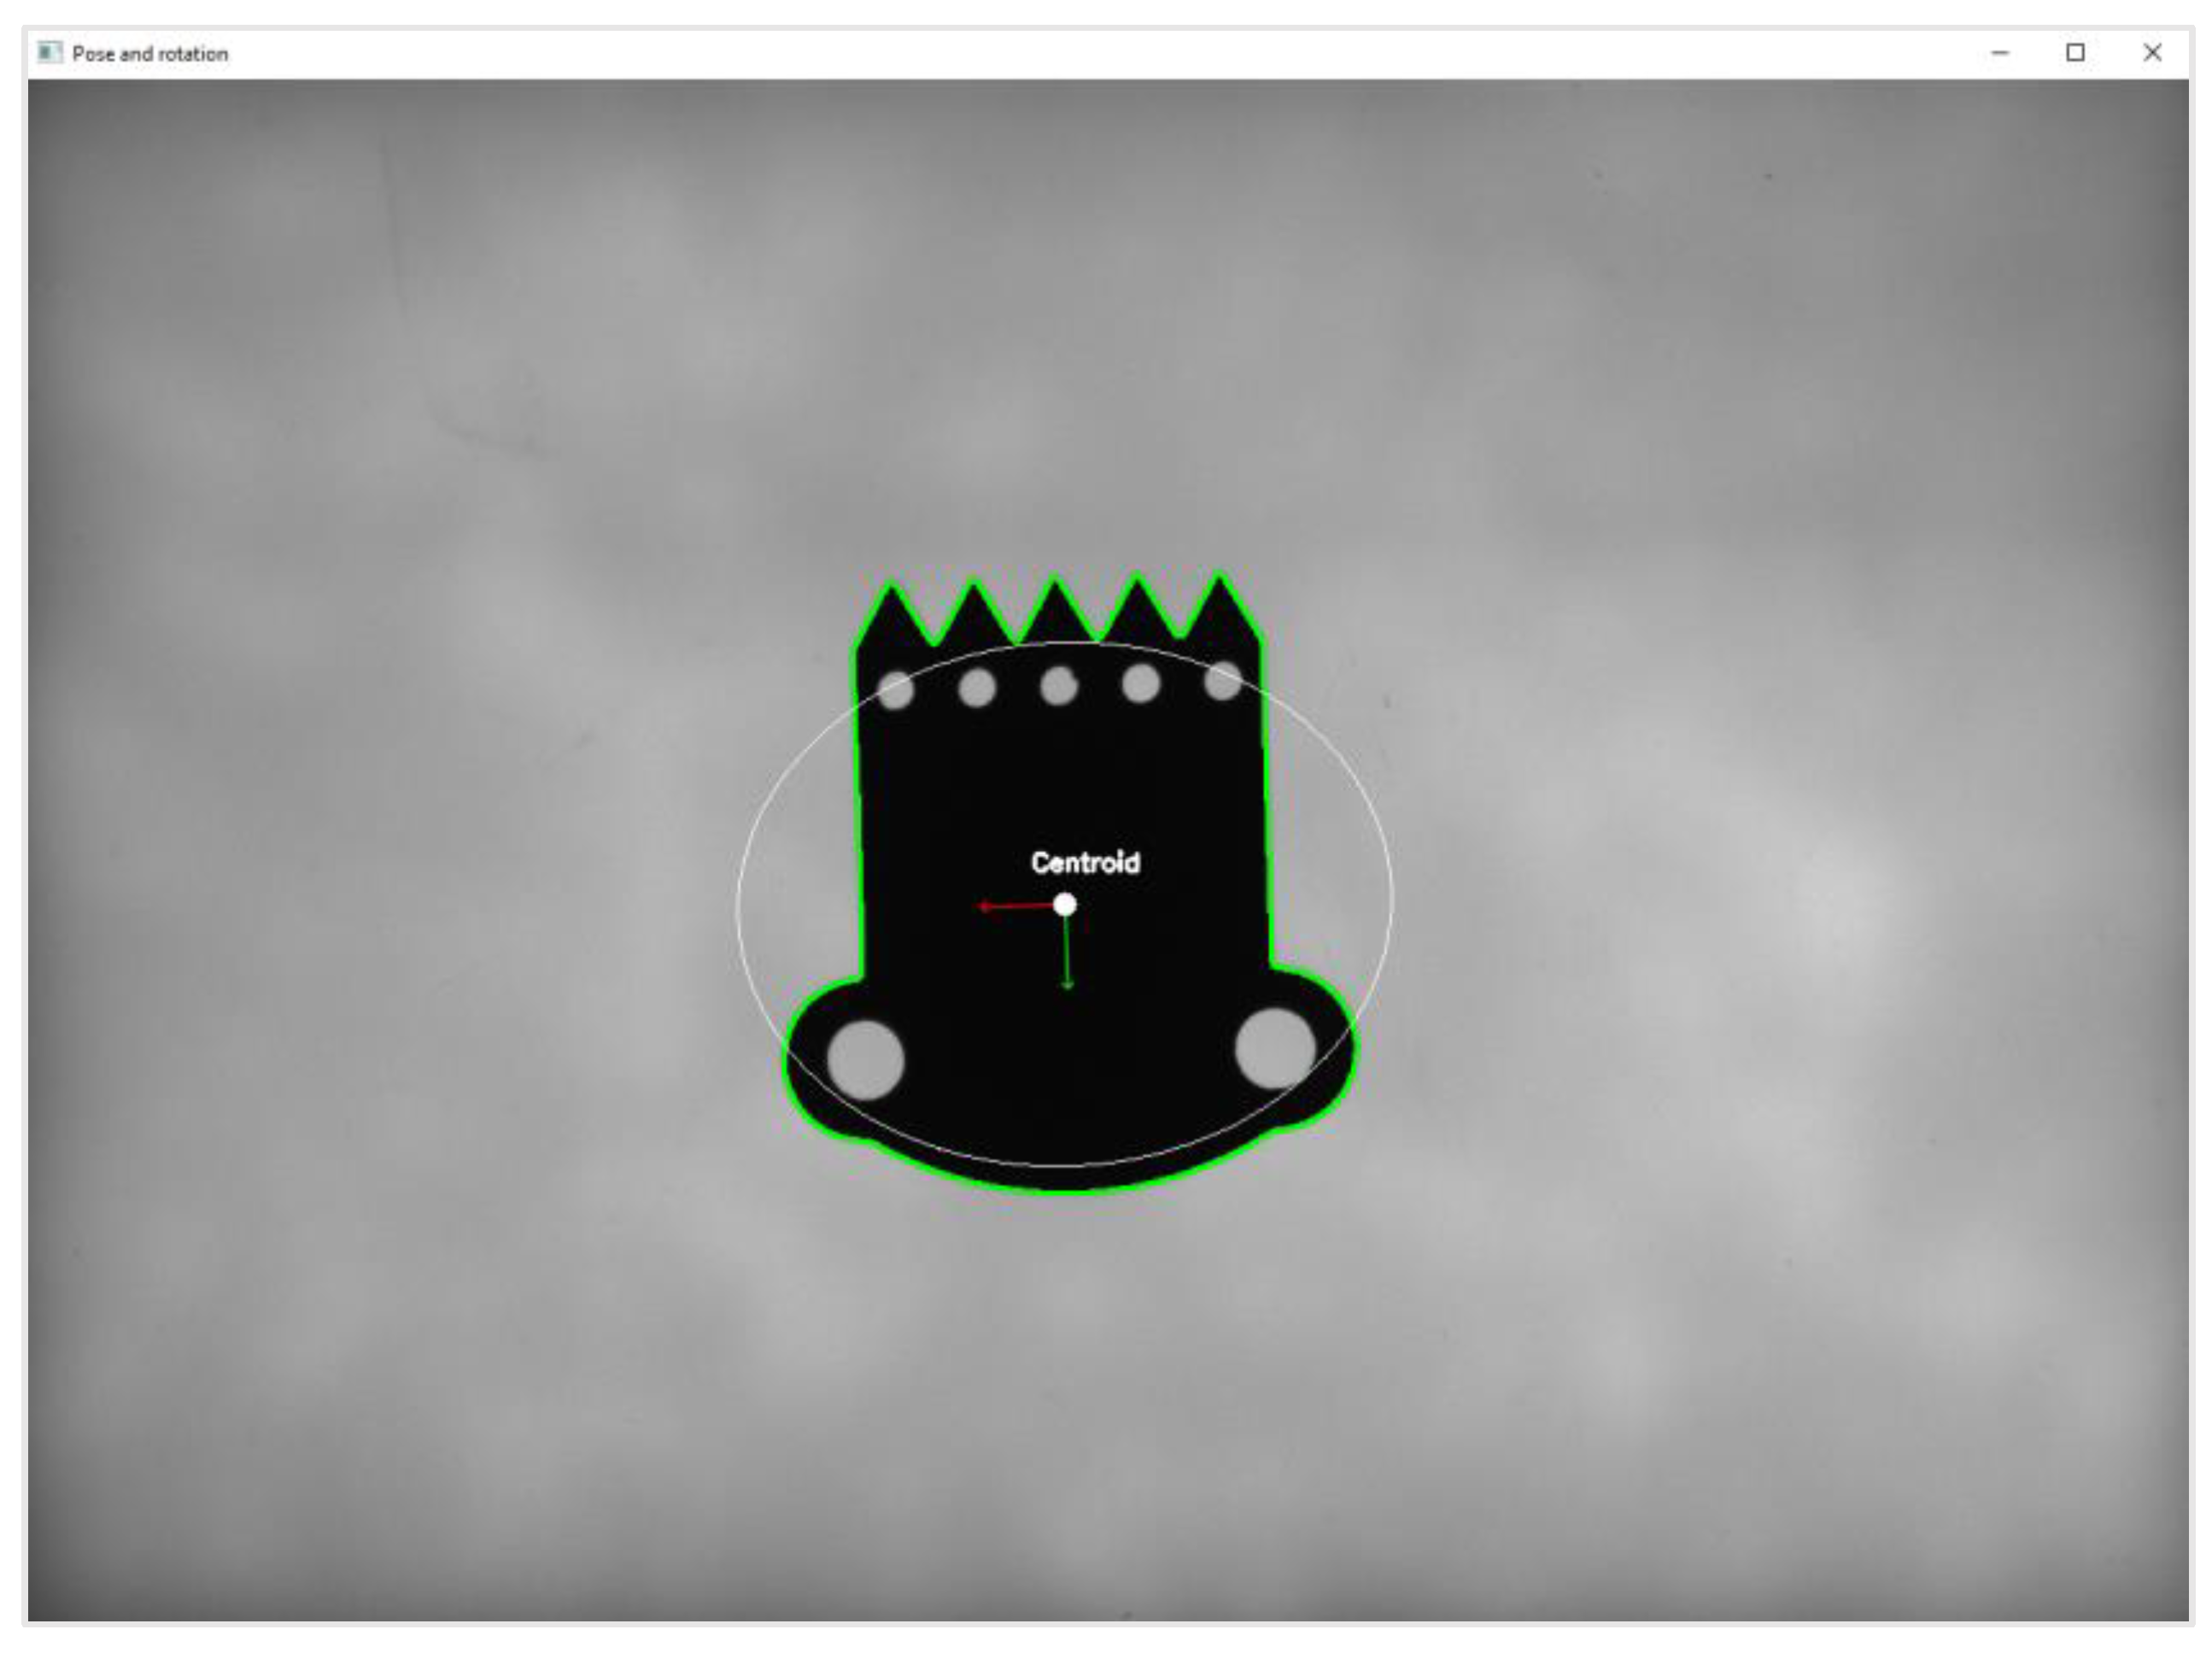
Below is an example of the operation of the described video sequence( Error! Reference source not found.).
Figure 5. The result of the vision sequence determines the position and orientation of the detail, with the center point and the X (red) and Y (green) axes marked.
Preprints 100865 g005
(The second vision algorithm) The vision sequence responsible for measuring the basic geometric features of details:
  • Step 1 – image preprocessing (conversion to grayscale, image smoothing - Gaussian filtering, thresholding, bit negation) and detection of external contours using the cv.findContours() function,
  • Step 2 – detection of internal contours in a group of areas separated from the image in the previous operation (Error! Reference source not found..),
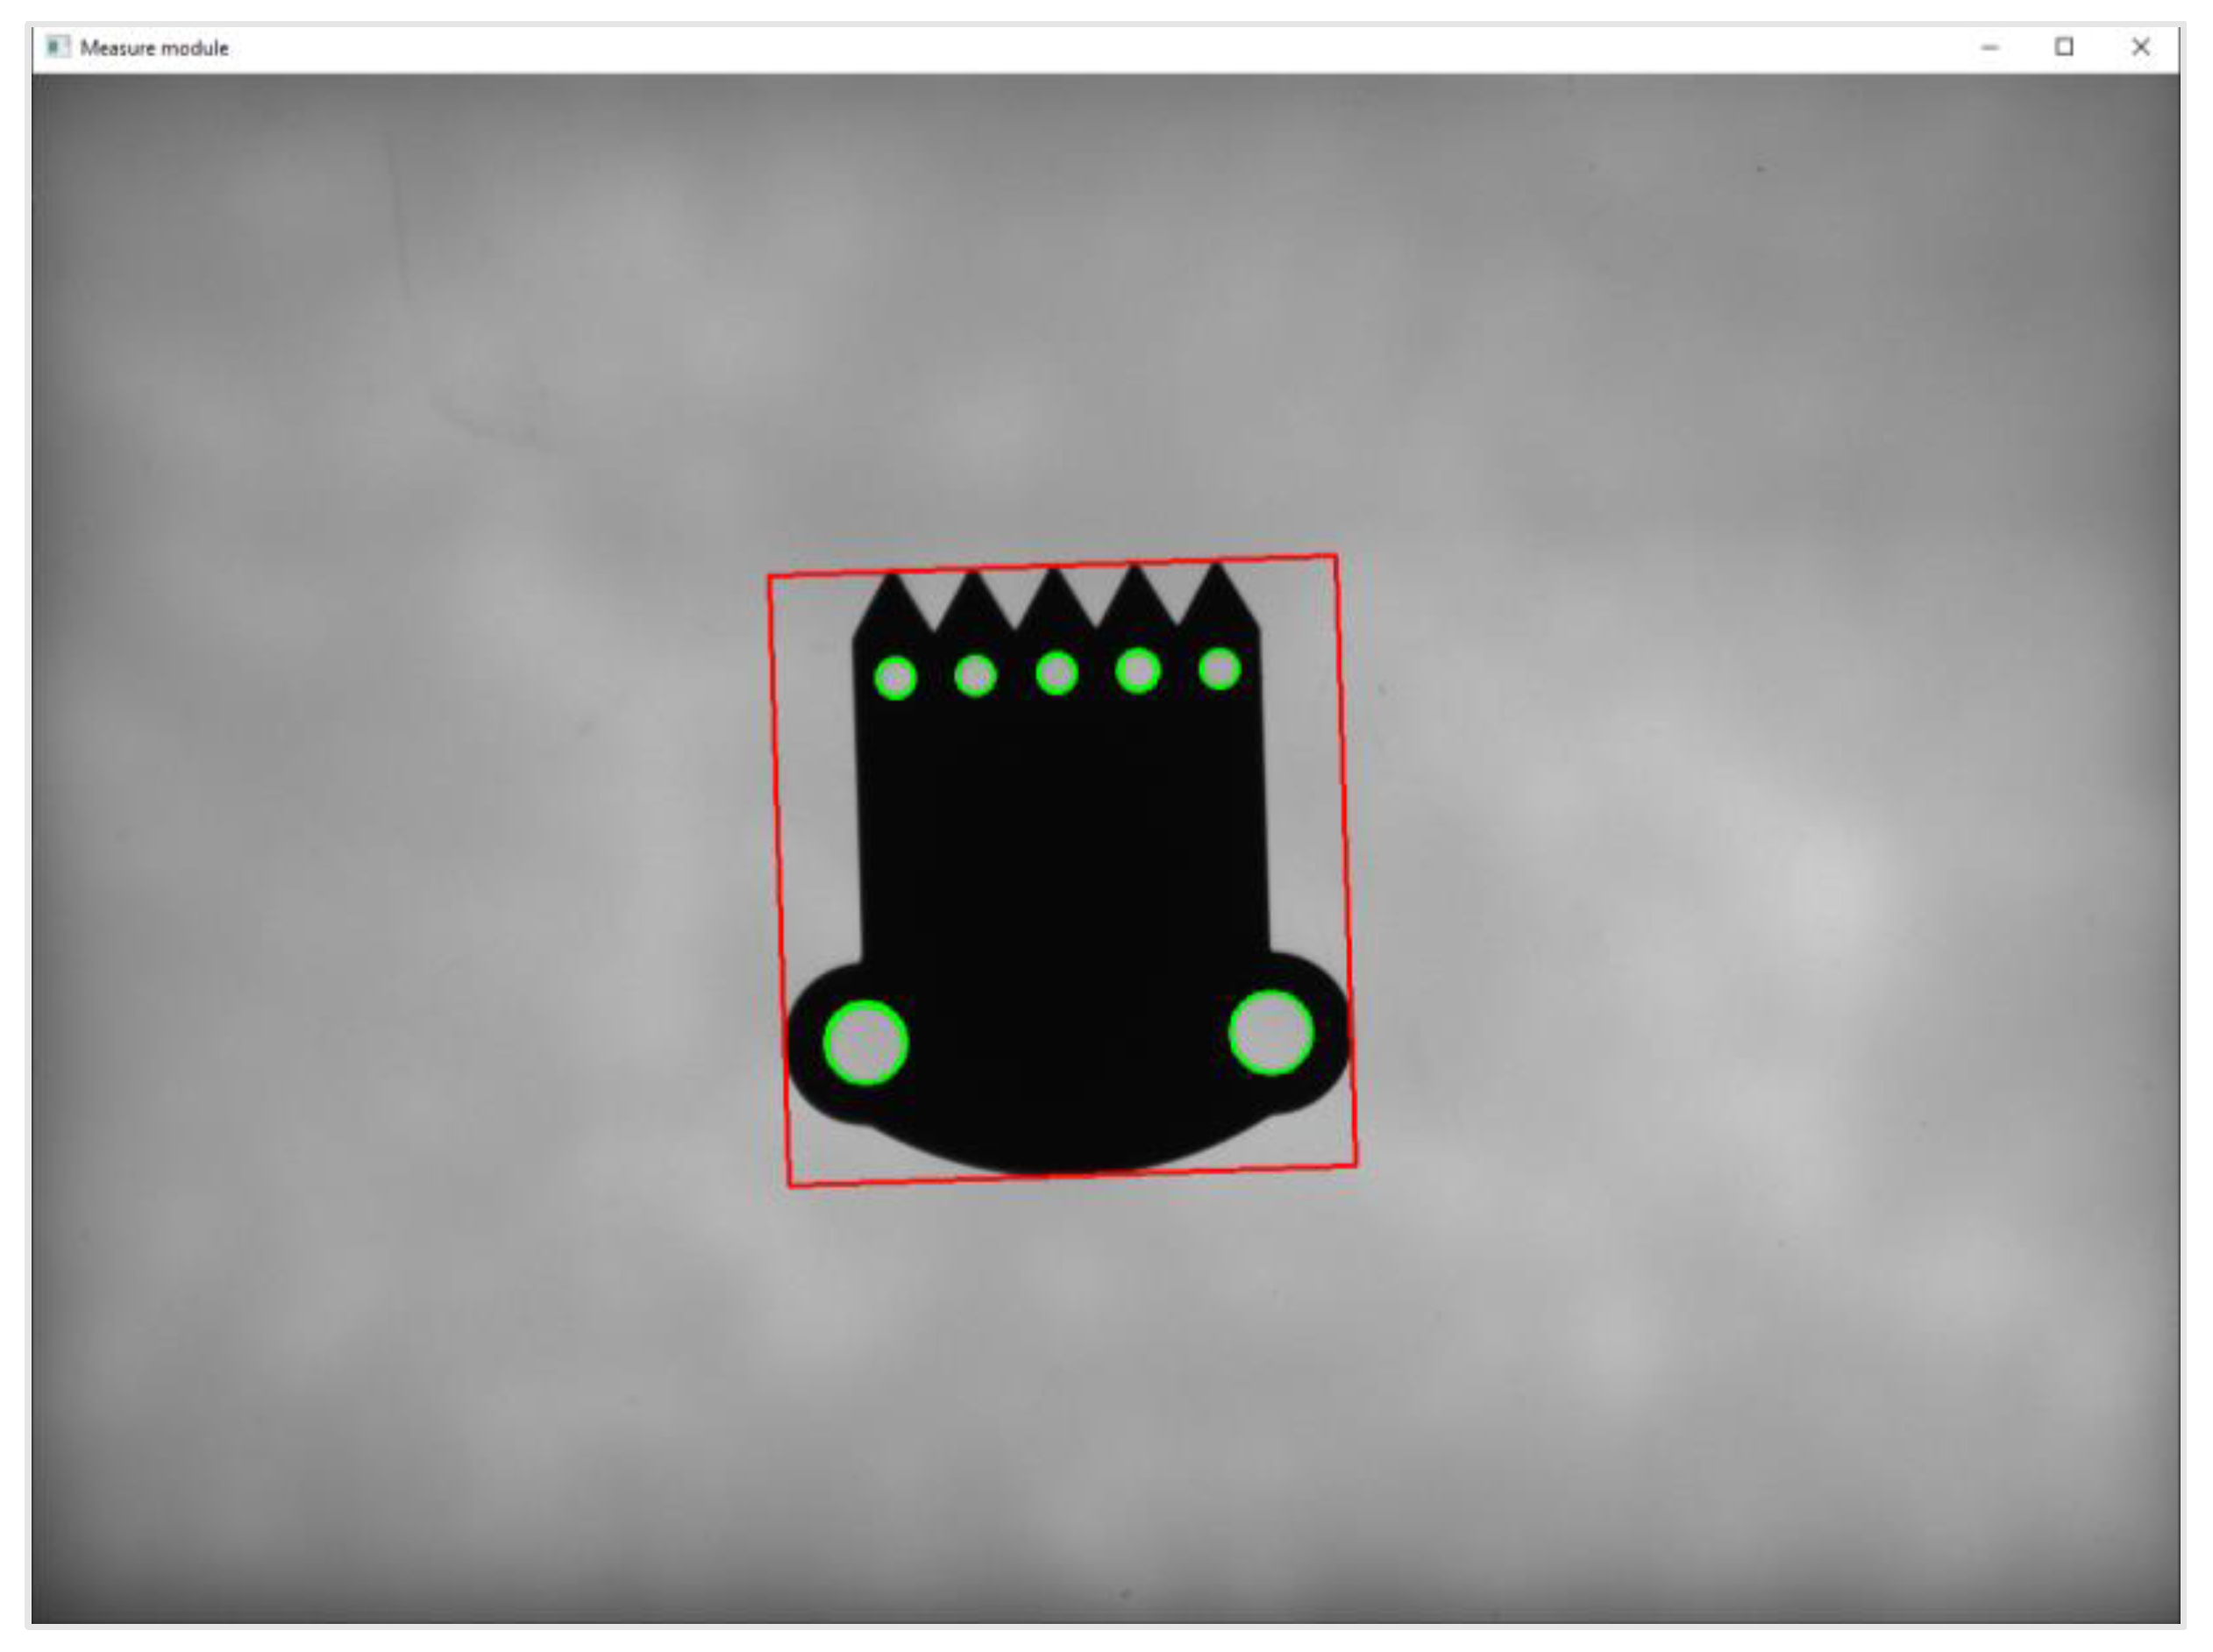
Figure 6. The result of the measuring tool, with internal contours (holes) and a rectangular area covering the external contour of the object (representing the overall dimensions: width, height).
Preprints 100865 g006
  • Step 3 – determination of the basic values of the detected geometric features,
  • Step 4 – conversion of obtained sizes expressed in pixel units into SI units in mm,

3. System Architecture

The designed and constructed robotic stand is equipped with:
  • Cobot UR5 CB2 with the piCOBOT vacuum ejector from Piab,
  • Mako G-125B camera (CCD, 1292×964) with a 16mm Computar lens,
  • Savio CAK-01 USB webcam (CMOS, 1920×1080),
  • Illumination system (backlight) for the Mako camera. In the case of a camera placed on the robot, the use of lighting installed in the room was limited.
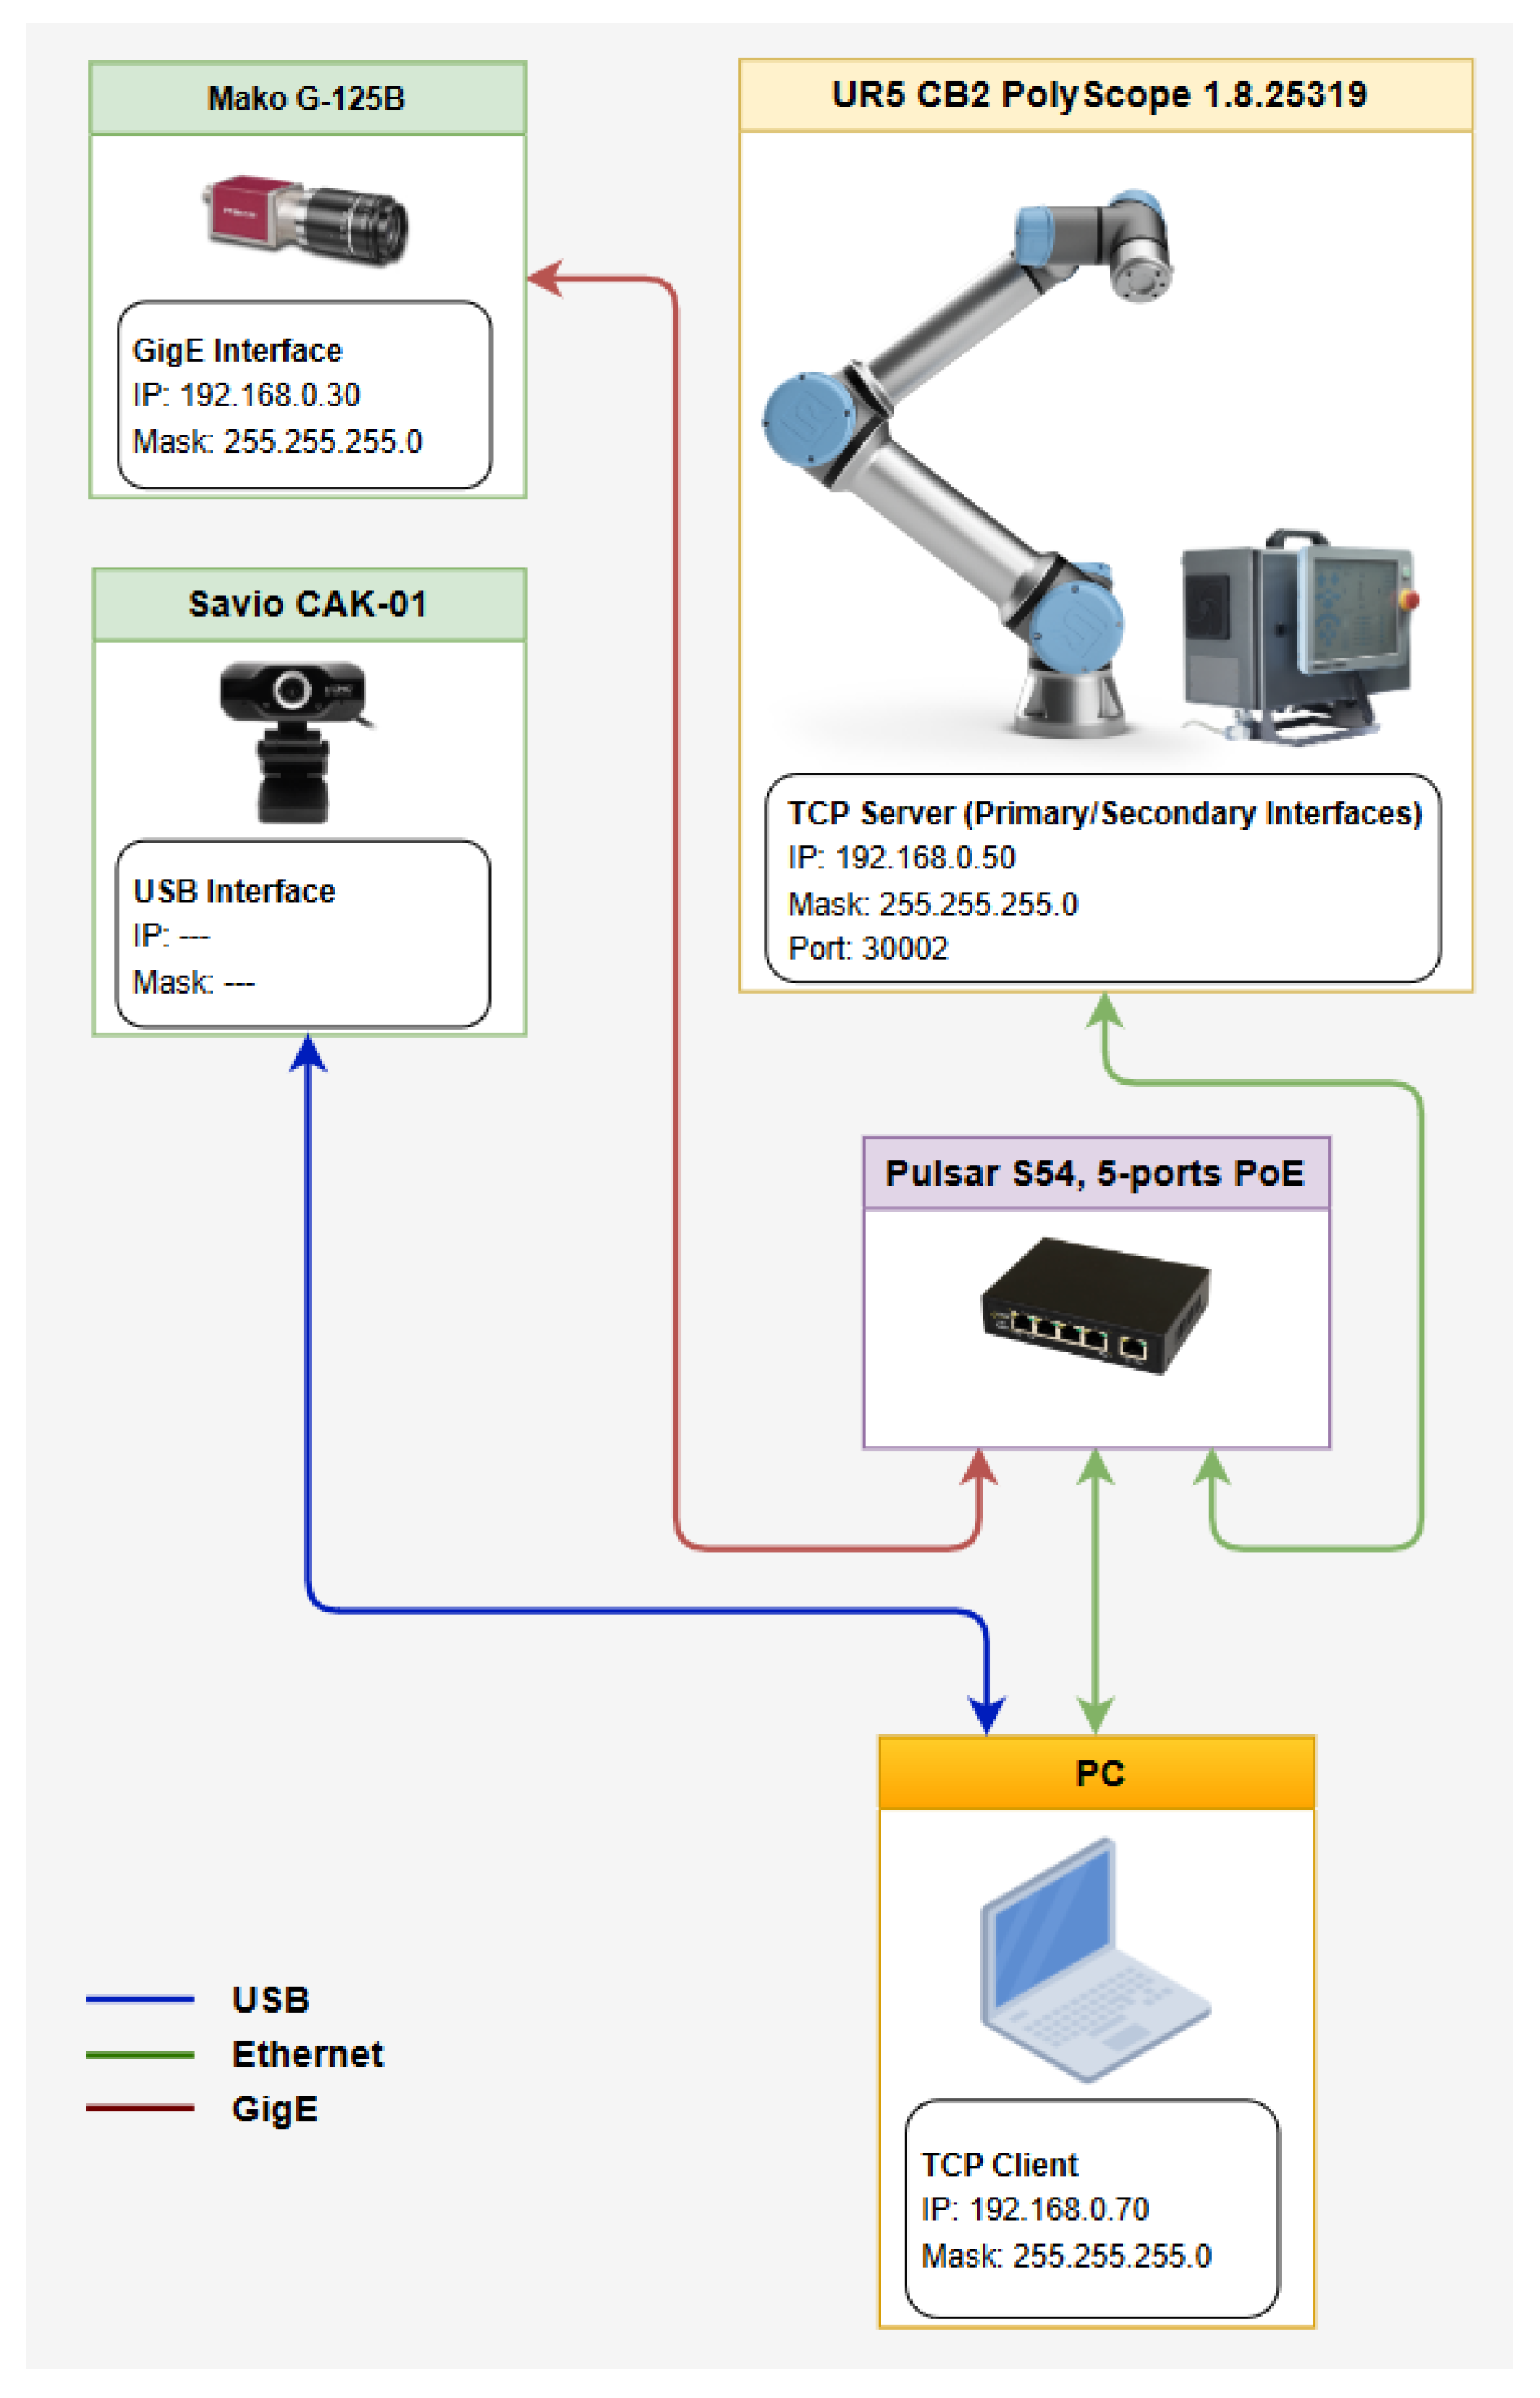
When comparing the parameters of the stationary cameras, it was decided to use the Mako G-125 B industrial camera to carry out the measurement sequence. This camera was permanently attached to the supporting structure of the station, while the second camera, Savio CAK-01, was mounted to the robot’s flange. The arrangement of individual components of the station is depicted in Error! Reference source not found..
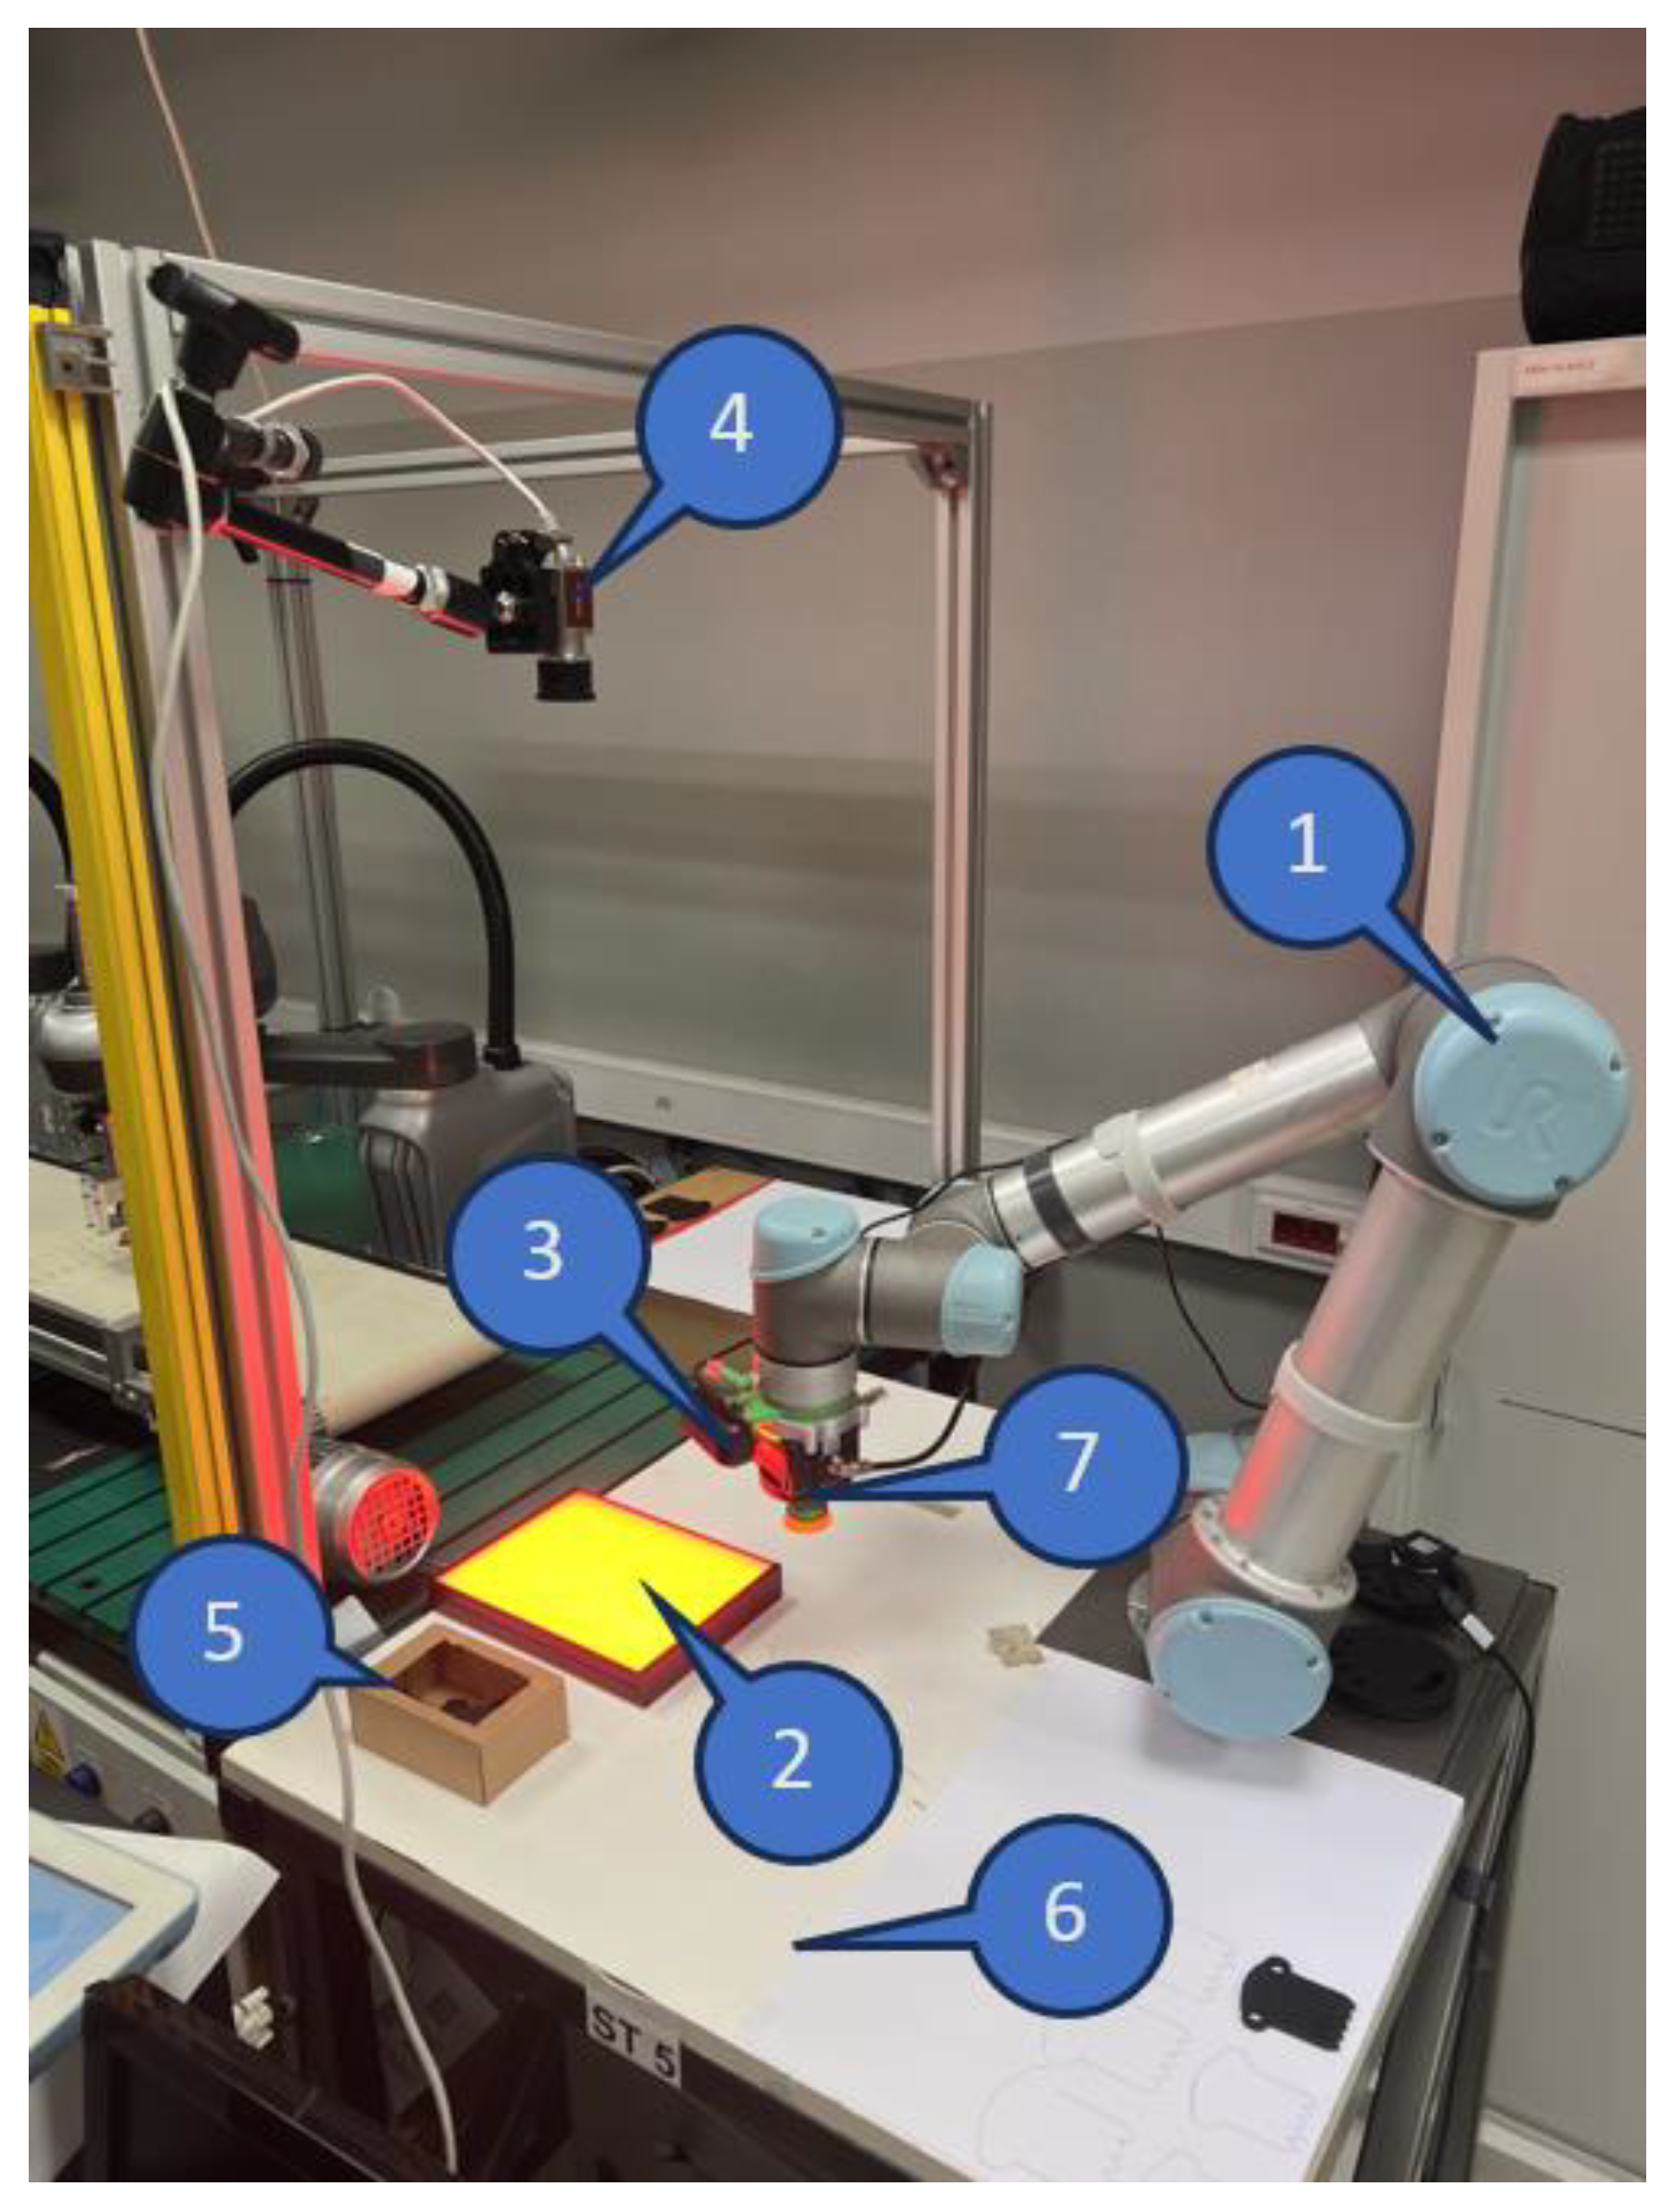
The second camera affixed on the robot’s flange was connected directly to the PC (by a USB cable). Considering that the Mako camera supports the PoE network function, it was decided to use the Pulsar s54 - PoE network switch and connect the remaining architectural elements in a star topology. Below is a detailed diagram of the described communication model (Error! Reference source not found..) and a view of the actual cobot’s station, with its essential elements marked (Error! Reference source not found..).
Figure 7. Communication diagram of the robotic station.
Preprints 100865 g007
Figure 8. Layout of the cobot station 1 – UR5 CB2 cobot, 2 – illuminator (backlight lighting), 3 – Savio CAK-01 USB webcam camera, 4 – Mako G-125B camera, 5 – container where defective details are rejected, 6 – space warehouse, 7 – piCOBOT vacuum ejector from Piab.
Preprints 100865 g008
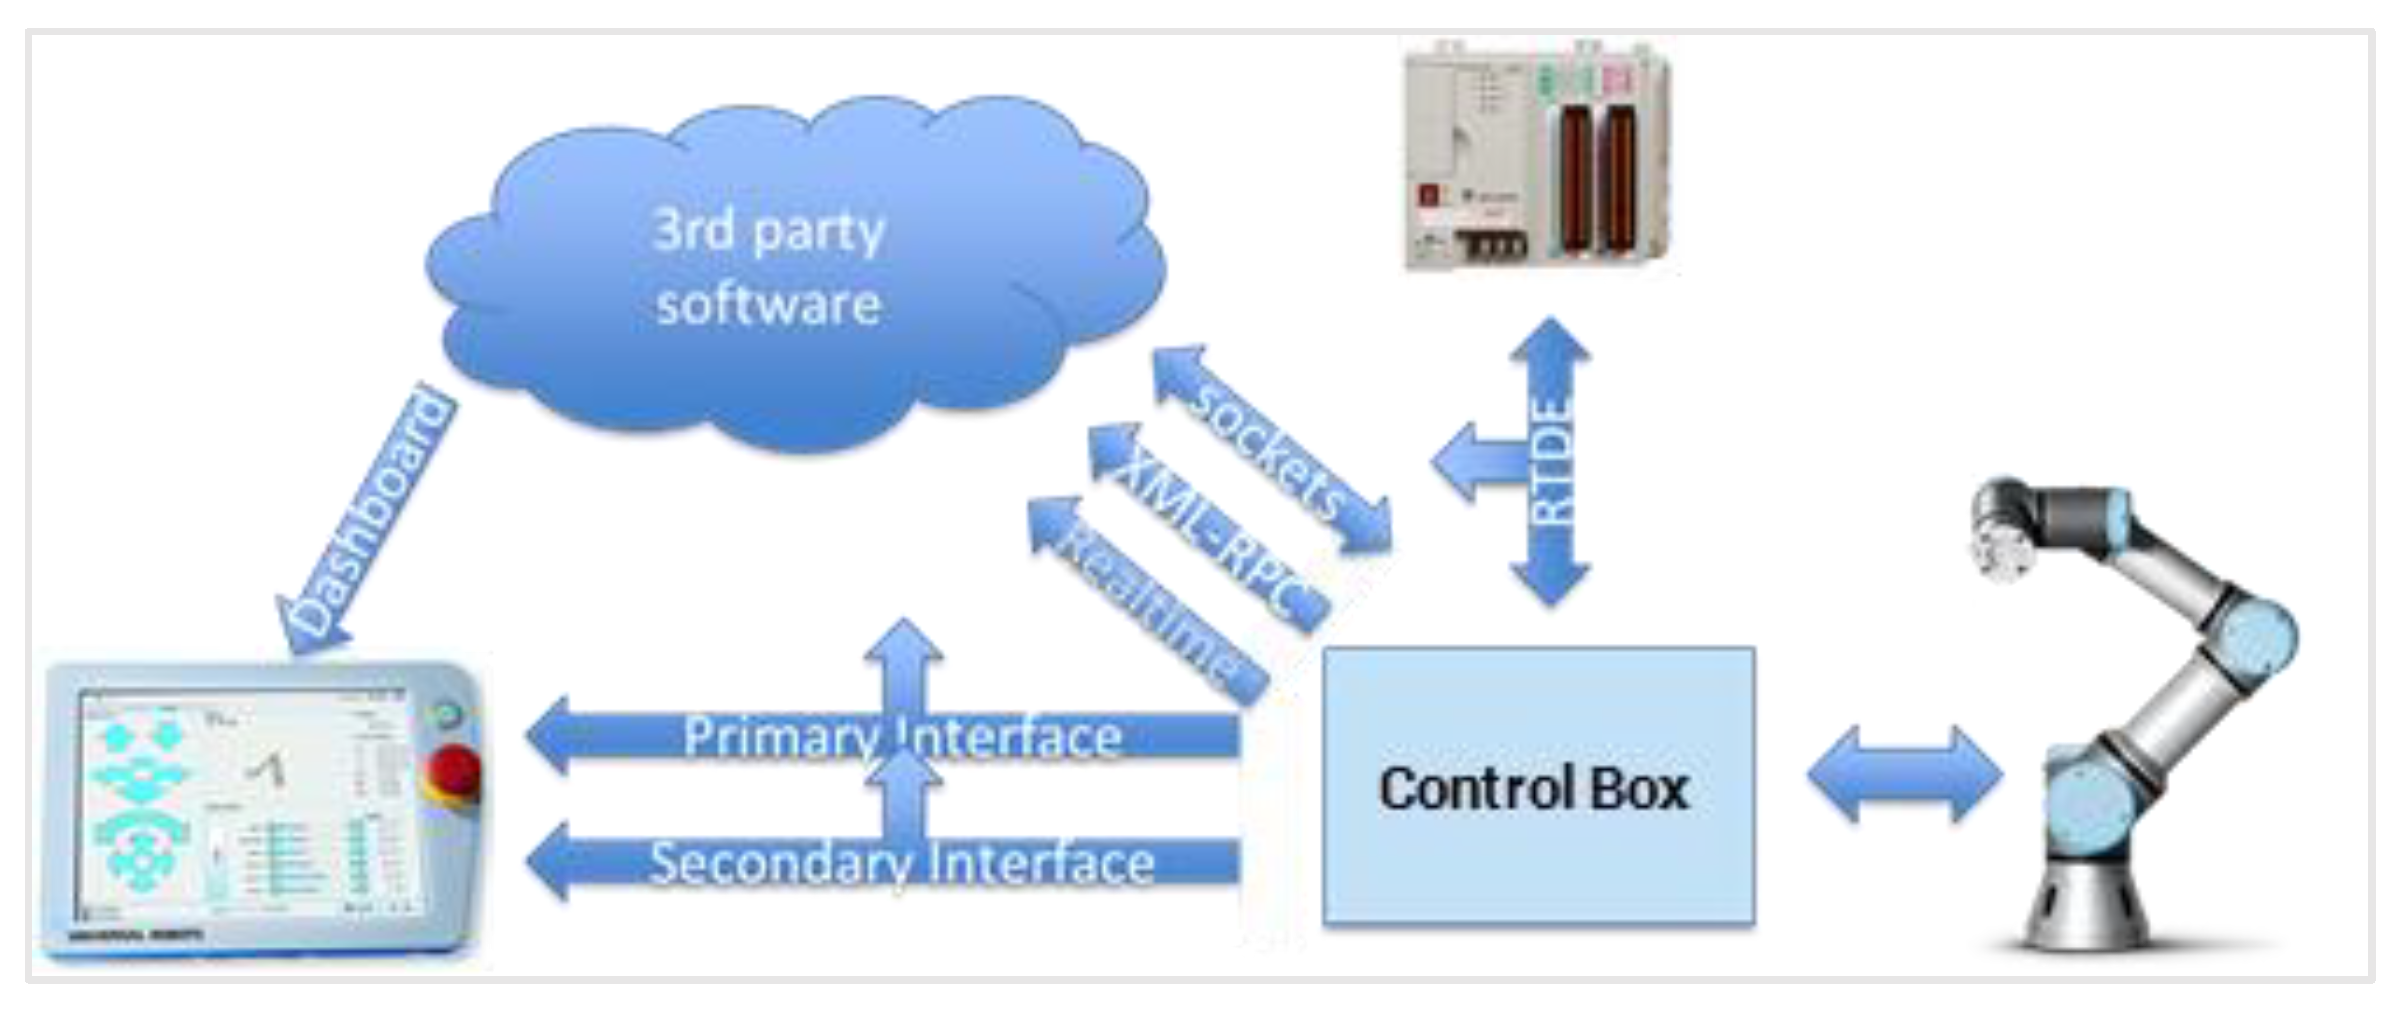
In the software layer, for communication at the PC←→UR5 level, the Primary/Secondary and Real-Time Interface interfaces were used (provided by the server implemented in the robot controller). The server supports the URScript interpreter and broadcasts basic data about the robot’s state (position of connectors , supply voltage of individual drives, etc.) (Error! Reference source not found.., Error! Reference source not found..).
For the purposes of communication and control of the cobot, proprietary libraries were developed in Python, based on the URScript language. For instance, functions have been implemented to control the movement of the cobot, enabling the execution of the manipulator’s movement in joint and linear interpolation (equivalents of the MoveJ and MoveL commands). In the case of PC←→Mako G-125B communication, the Python programming interface (API) provided by Allied Vision as part of the Vimba software was applied (Vimba Python API). In the case of PC←→Savio CAK-01 connection, the mechanism for capturing system USB interfaces available in the OpenCV libraries was employed.
Figure 9. Schematic diagram showing the available communication interfaces of Universal Robots [59].
Preprints 100865 g009
During the station’s operation, the cameras’ image acquisition processes and the cobot’s data exchange processes must work independently of the main program loop, which is why they are launched as independent threads.

4. Robotic Workstation

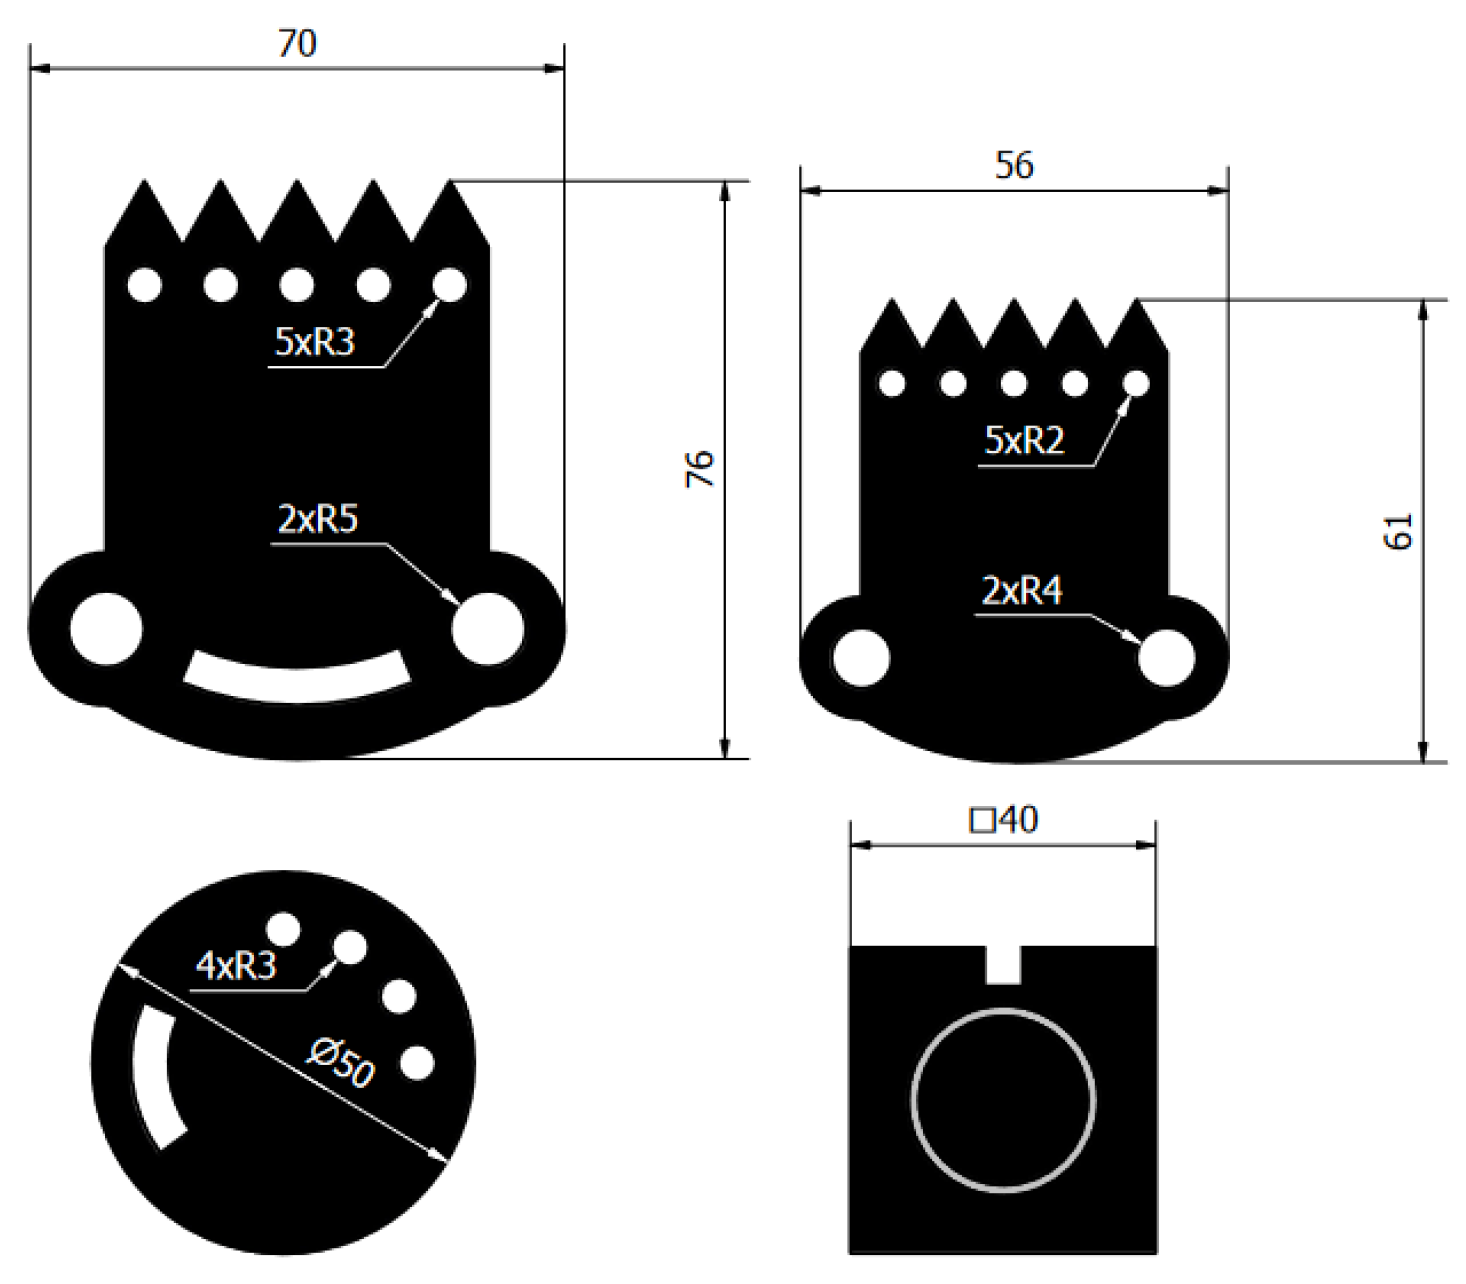
The main purpose of the robotic station is to carry out the task of moving details and performing a series of measurements of basic geometric quantities (employing the developed vision and communication libraries). A group of details was developed to carry out functional tests (Error! Reference source not found..) differing in shape and dimensions. A detailed description of the basic geometric dimensions of the details is presented in Error! Reference source not found.. A symmetrical dimensional deviation of ±0.5mm was assumed for the overall dimensions and ±0.3mm for the radii of the internal holes.
Figure 10. Details developed for the purposes of functional testing of the stand (with reference dimensions marked during the stand’s operation).
Preprints 100865 g010
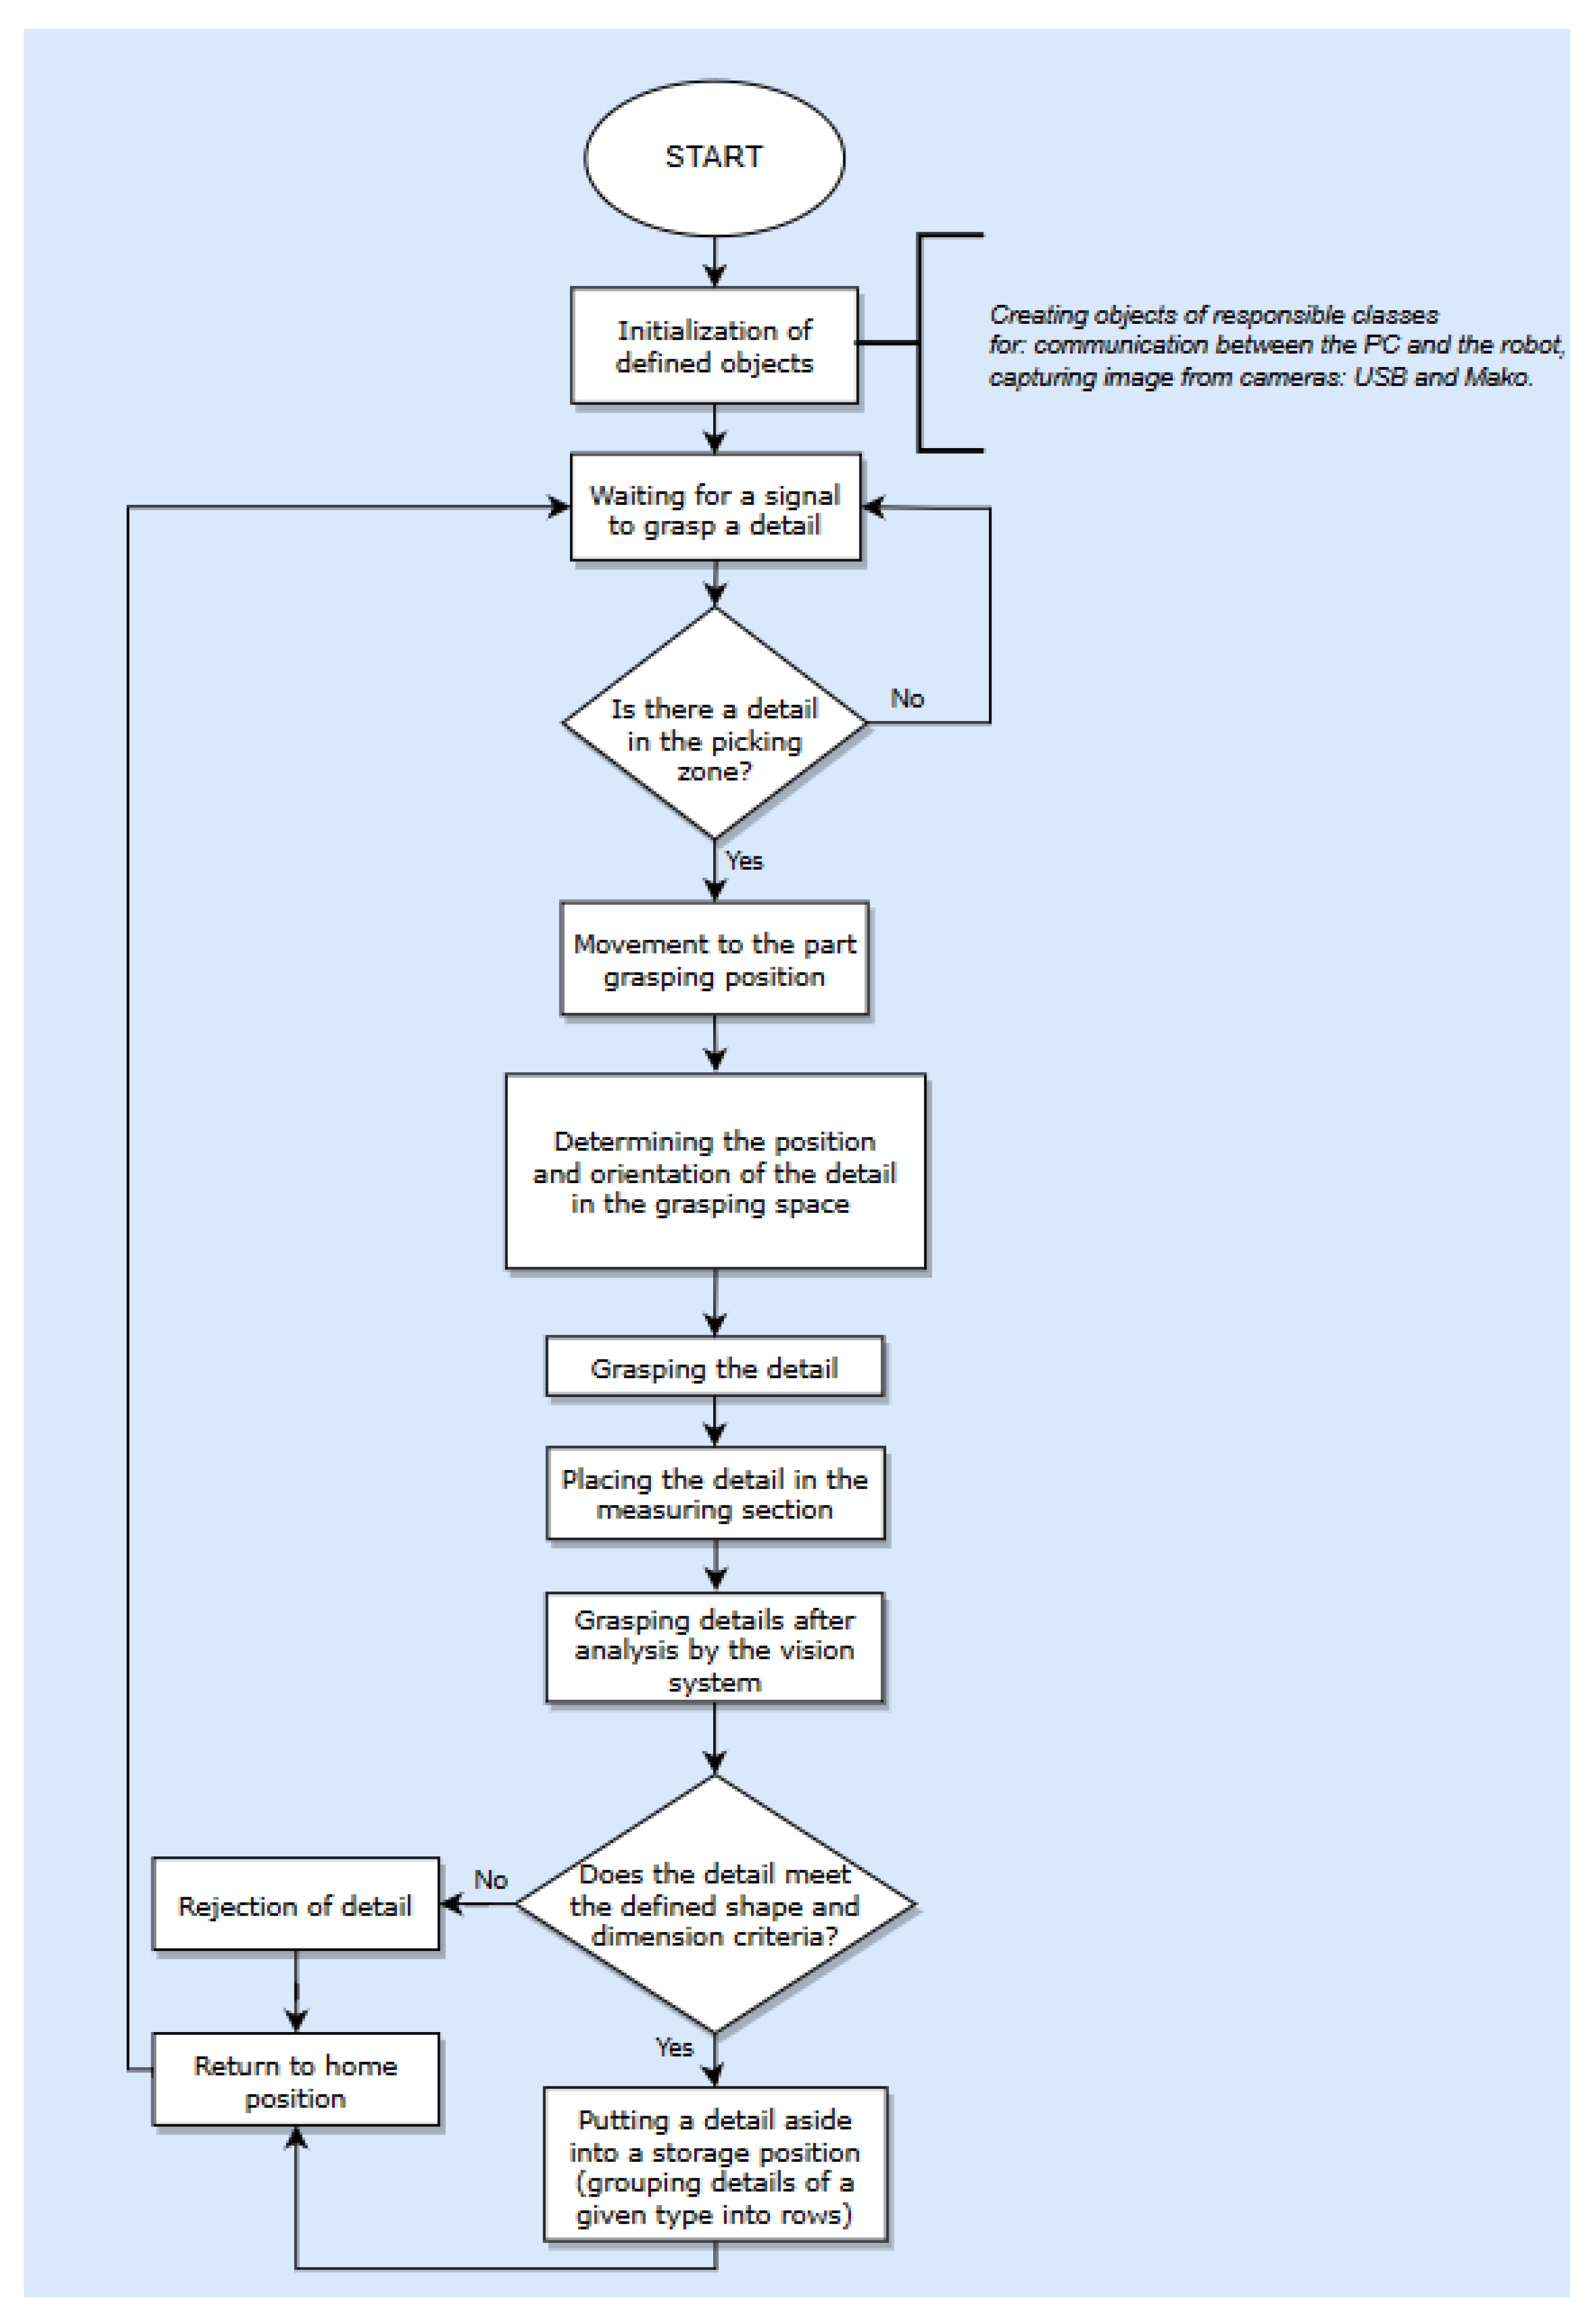
Figure 11. Block diagram of the designed sequence (algorithm) of the robotic control quality station.
Preprints 100865 g011
Below a description of the next steps in the working algorithm of the designed station is shown (Error! Reference source not found..):
  • Step 1 – waiting for the signal to pick up the part (true value on digital_in0)
  • Step 2 – after receiving the signal (digital_in0), details are grasped by the UR5 cobot (the position and orientation of objects are determined based on the image from the camera placed on the robot’s flage (Error! Reference source not found..) and transferred to the measuring section.
Figure 12. Detecting details and determining position and orientation.
Preprints 100865 g012
  • Step 3 – in the measurement section, based on the image from the Mako G-125B camera, the detail is detected, and its dimensions (width and height) and the radius of internal holes are measured. Sample analysis results are presented below (Error! Reference source not found..)(the dimensions of internal holes are ordered relative to the designated X and Y coordinates of their center in descending order, and external dimensions are presented as width and height).
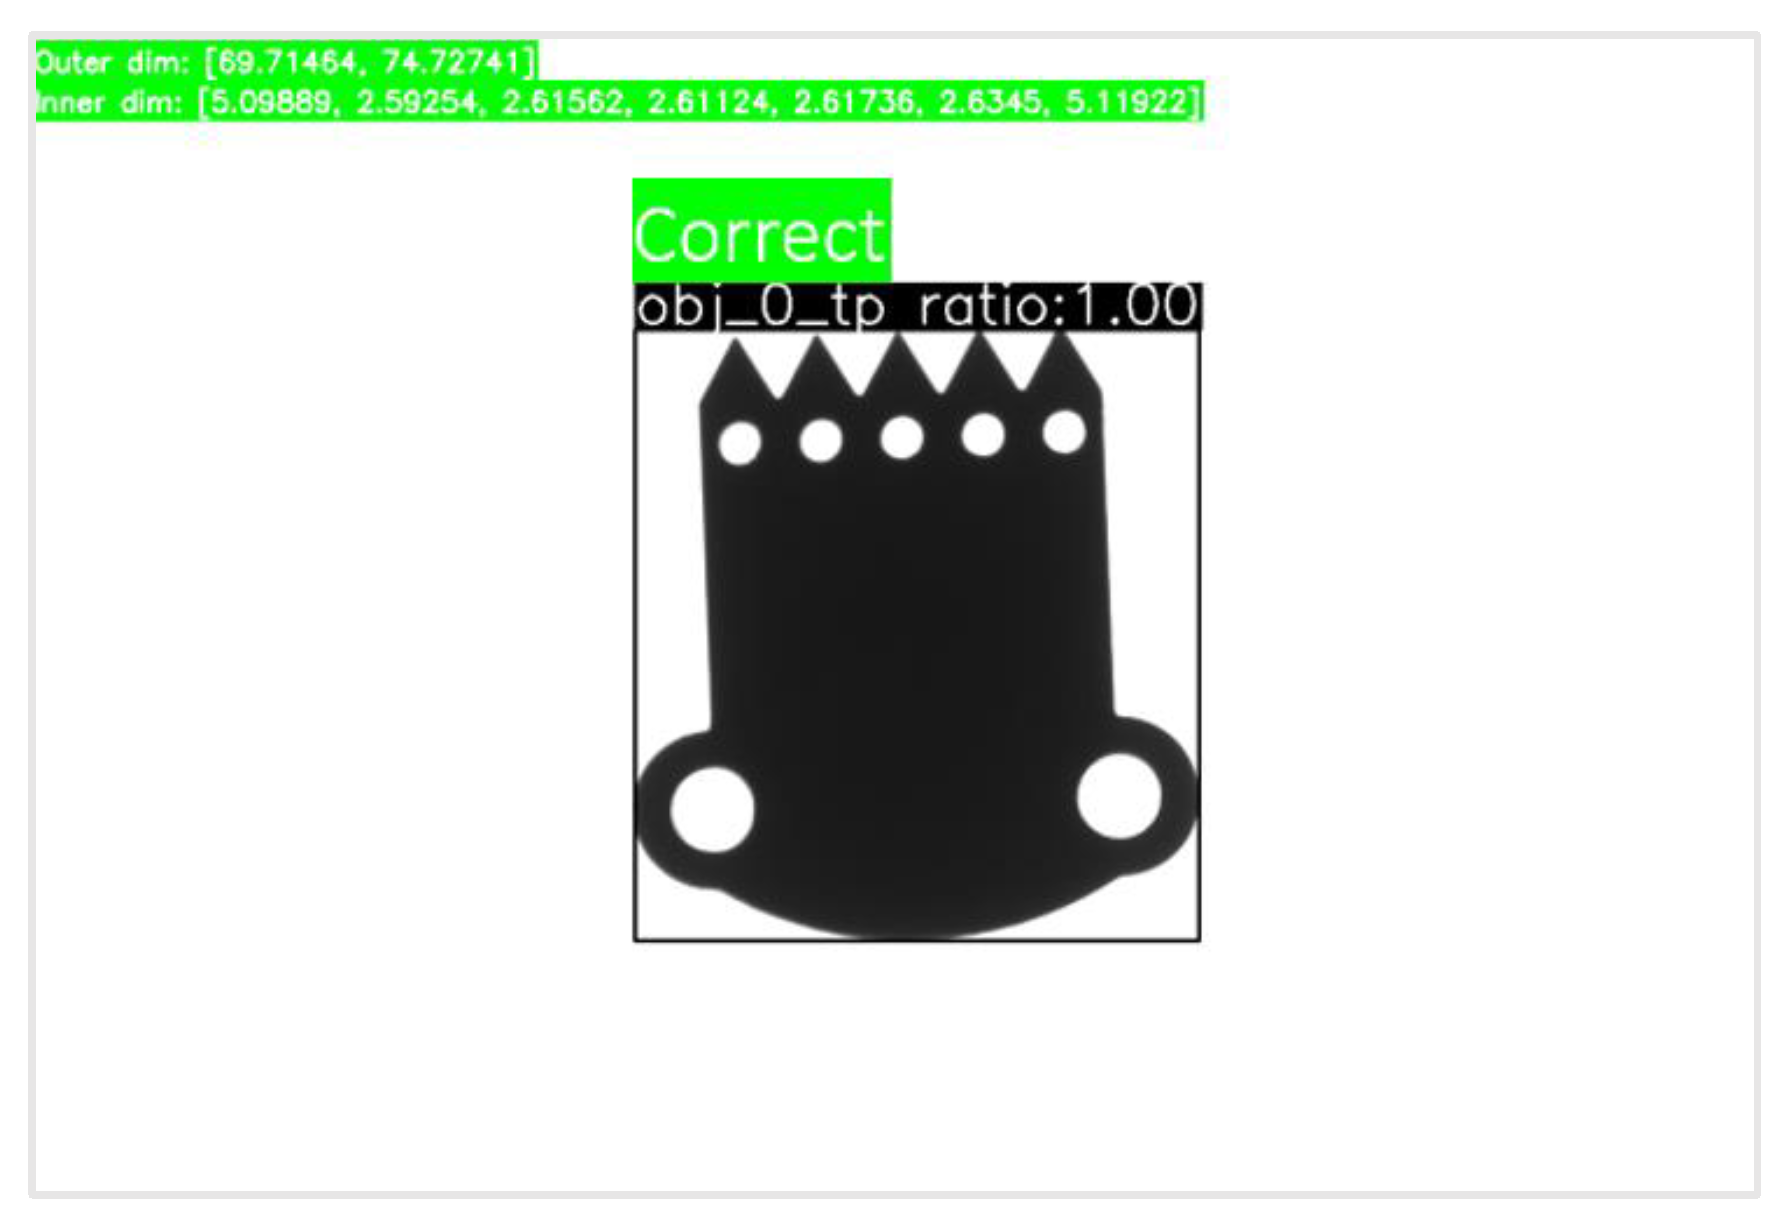
Figure 2. The result of the developed vision measurement tool. The detail meets all the criteria, the object has been recognized, all dimensions are within the accepted tolerances.
Preprints 100865 g013
  • Step 4 – details that do not meet the requirements regarding shape (Error! Reference source not found..)( the shape of the analyzed detail is not included in the database of defined patterns or the detail has a defect) and dimension (at least one of the dimensions does not fit within the assumed dimensional tolerance) are rejected (Error! Reference source not found. ‘5’). However, details that meet the assumed dimensional criteria for overall dimensions, namely width, height, and internal hole diameter values are transferred to the storage section (Error! Reference source not found. ‘6’). A symmetrical dimensional deviation of ±0.5 mm was assumed for overall dimensions, and for the diameter of internal holes ±0.3 mm.
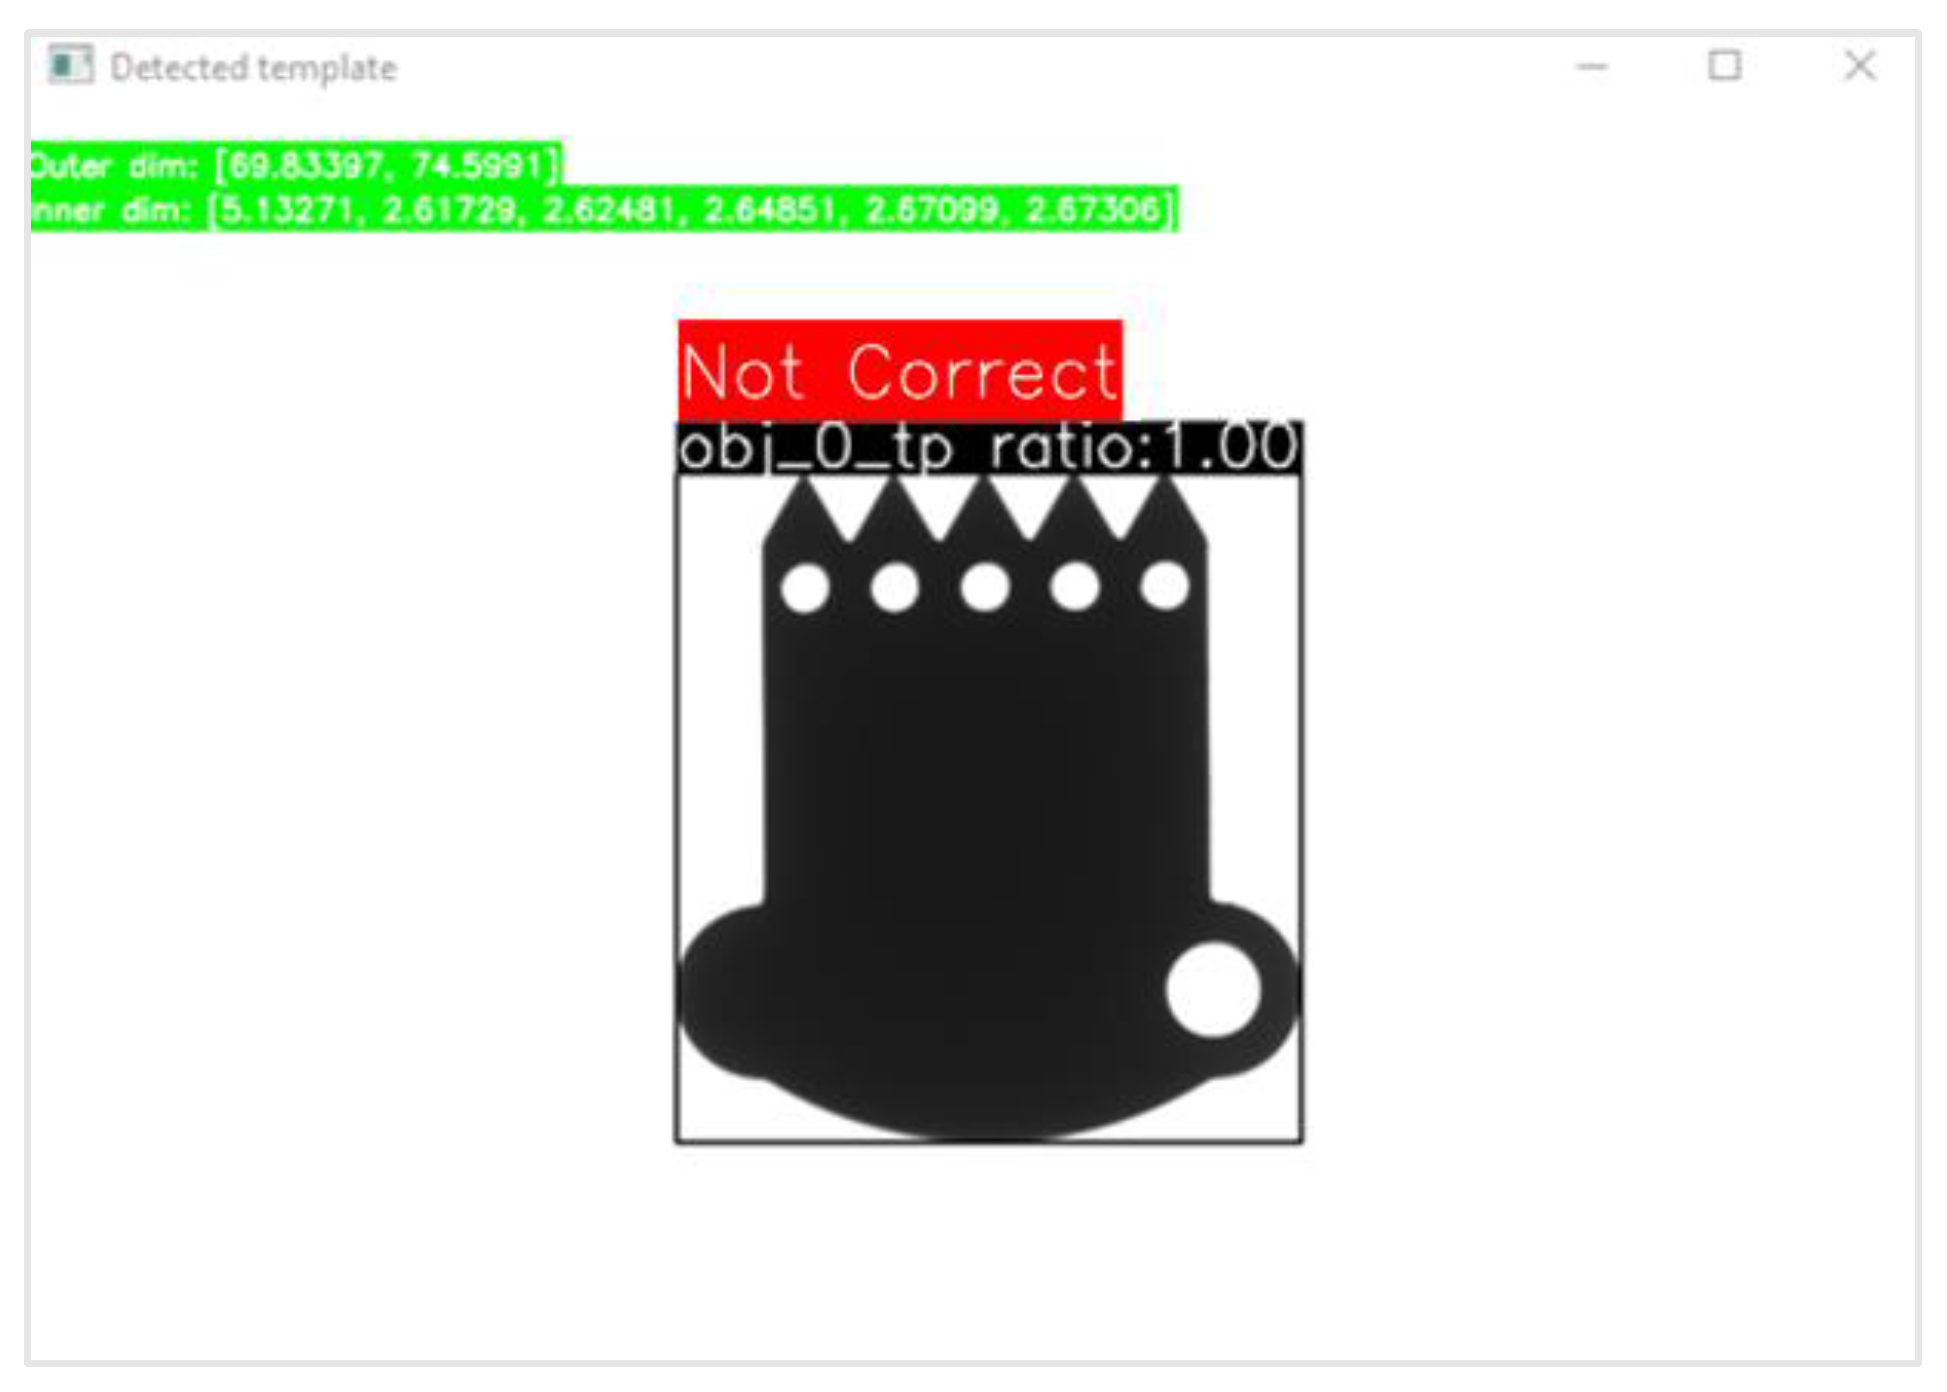
Figure 14. The detail does not meet the accepted criteria, the object has been recognized, the dimensions are within the accepted tolerances, but one of the holes is missing.
Preprints 100865 g014
  • Step 5 – returning to the home position and waiting for the signal to pick up the part.

5. Experimental Setup and Results
The chapter presents an analysis of the results of a series of measurements carried out to determine the level of measurement noise, accuracy, and repeatability of the developed vision system.
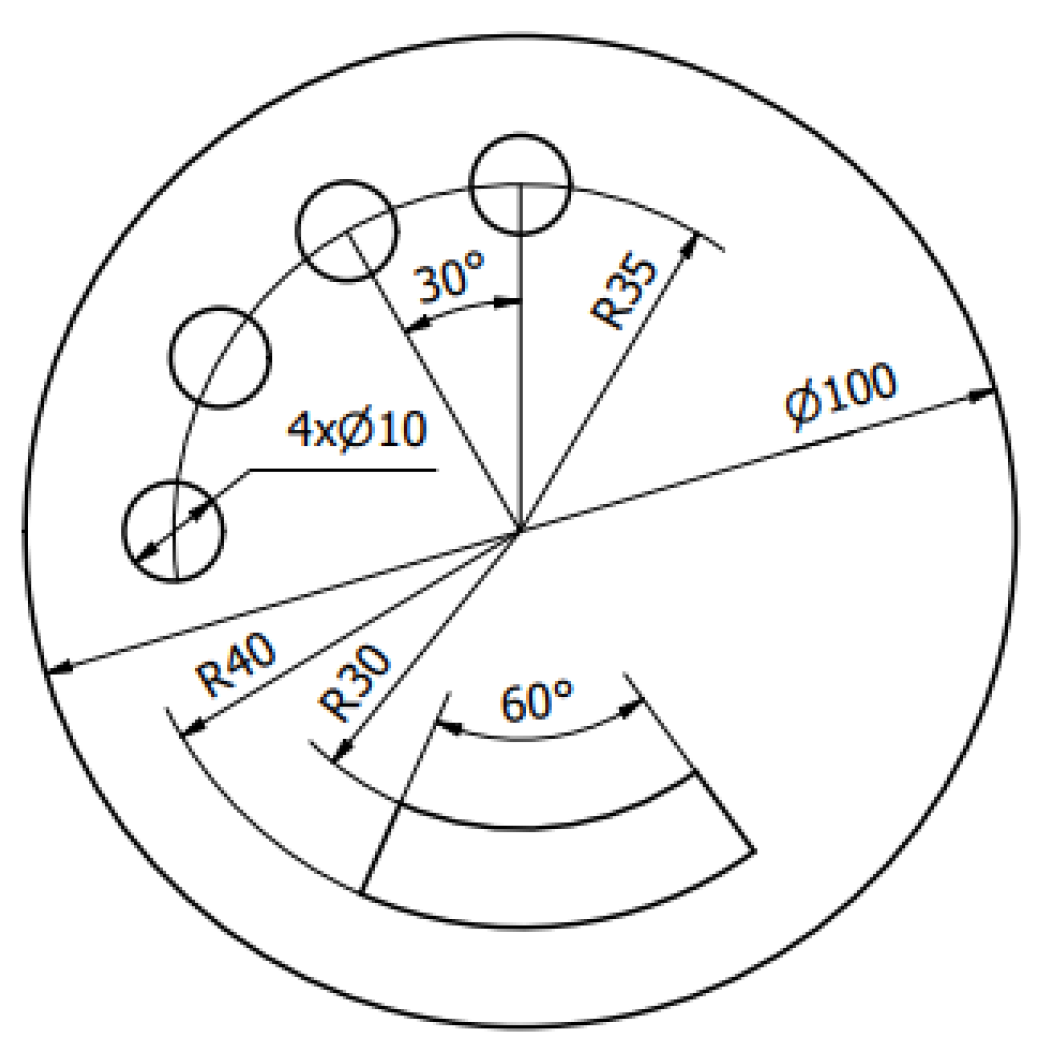
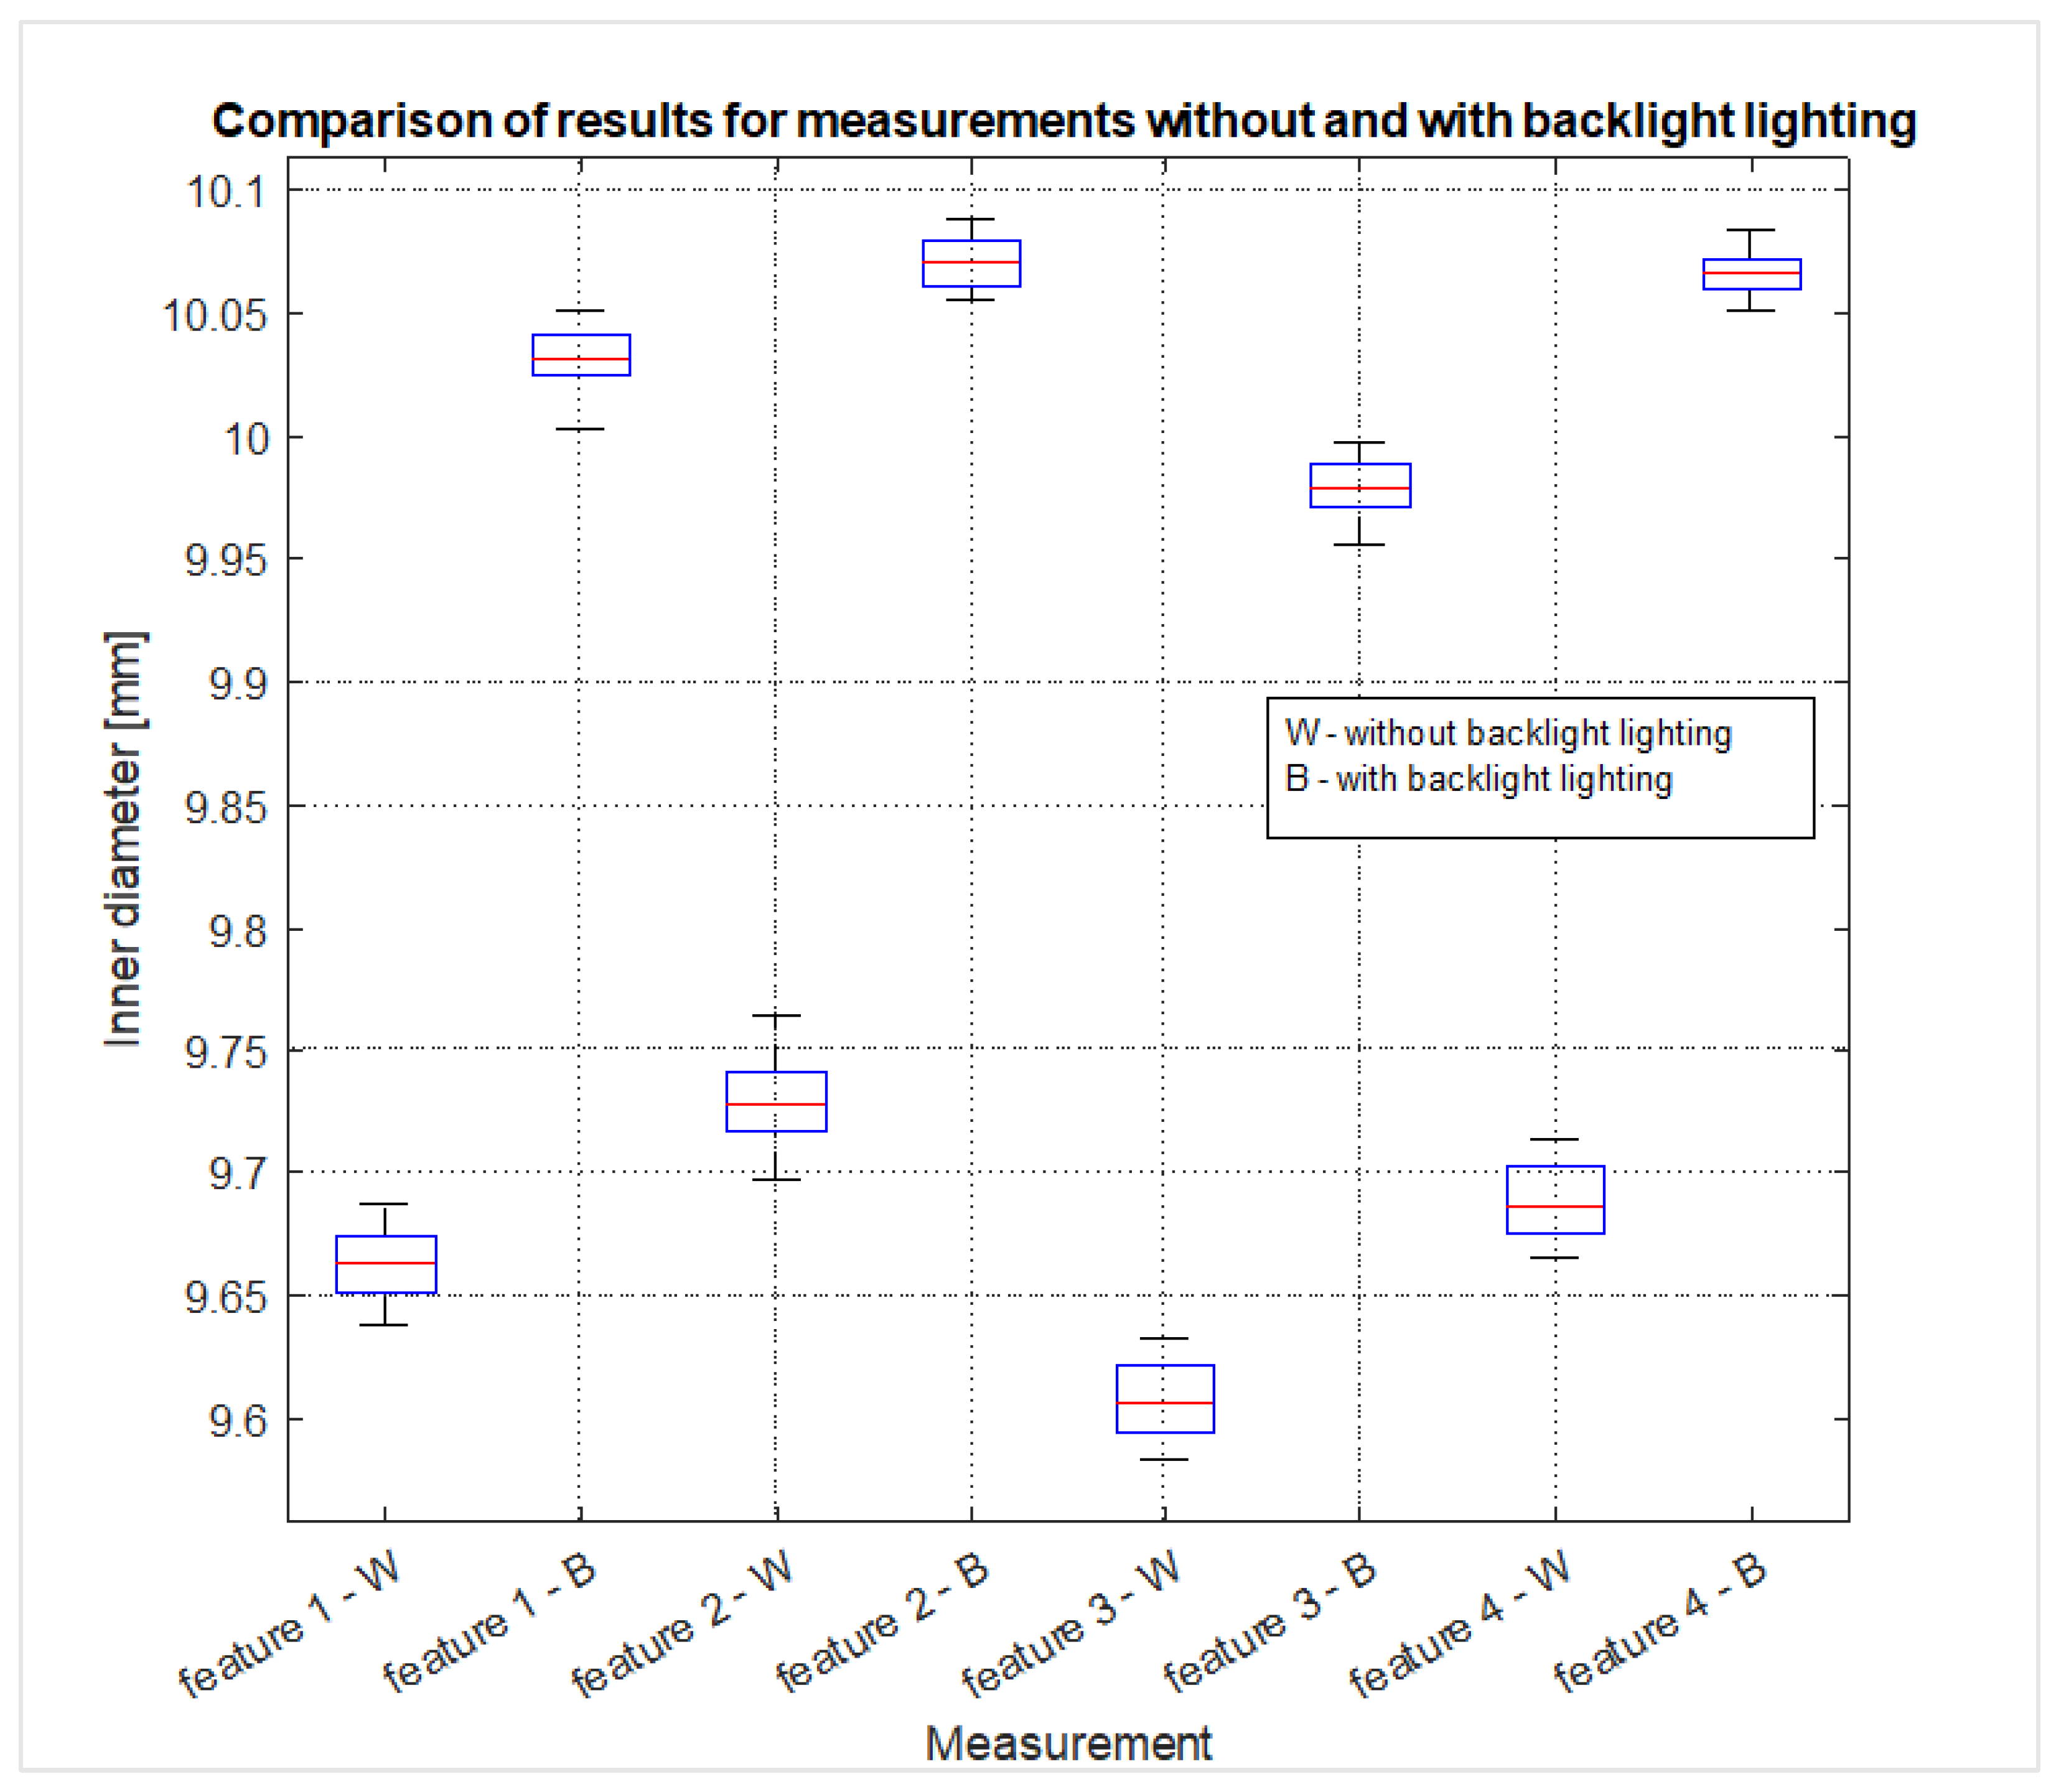
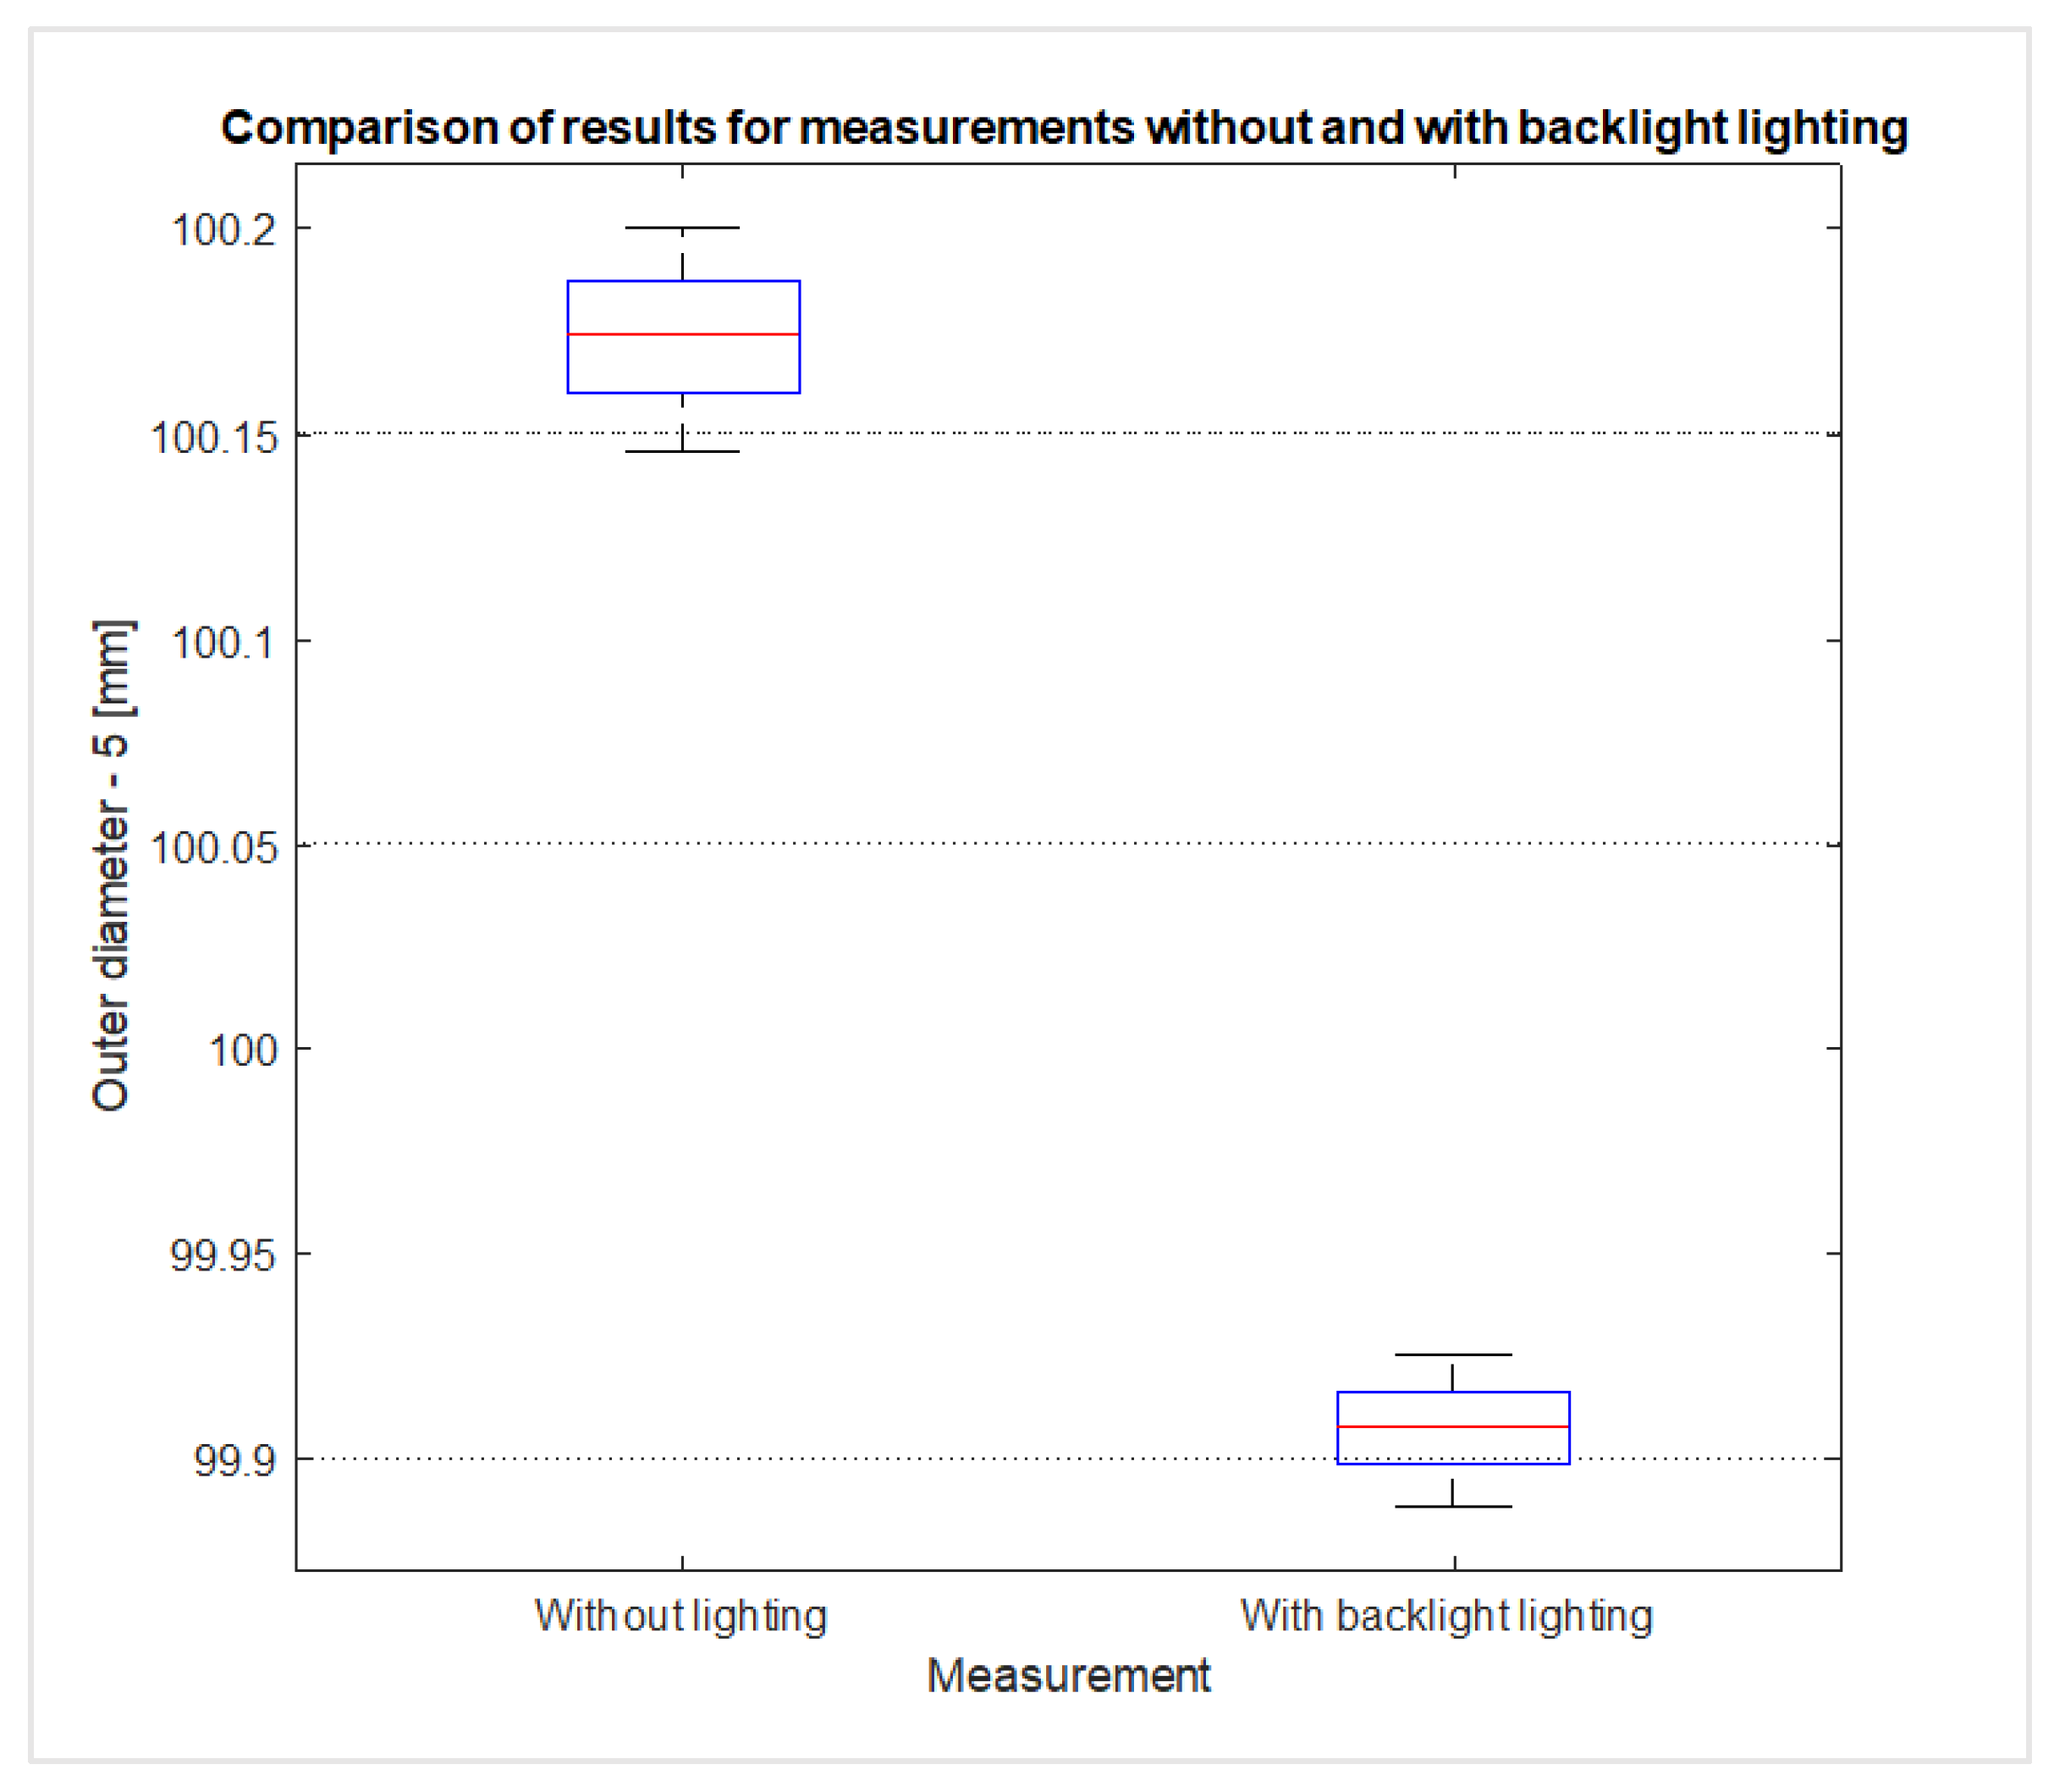
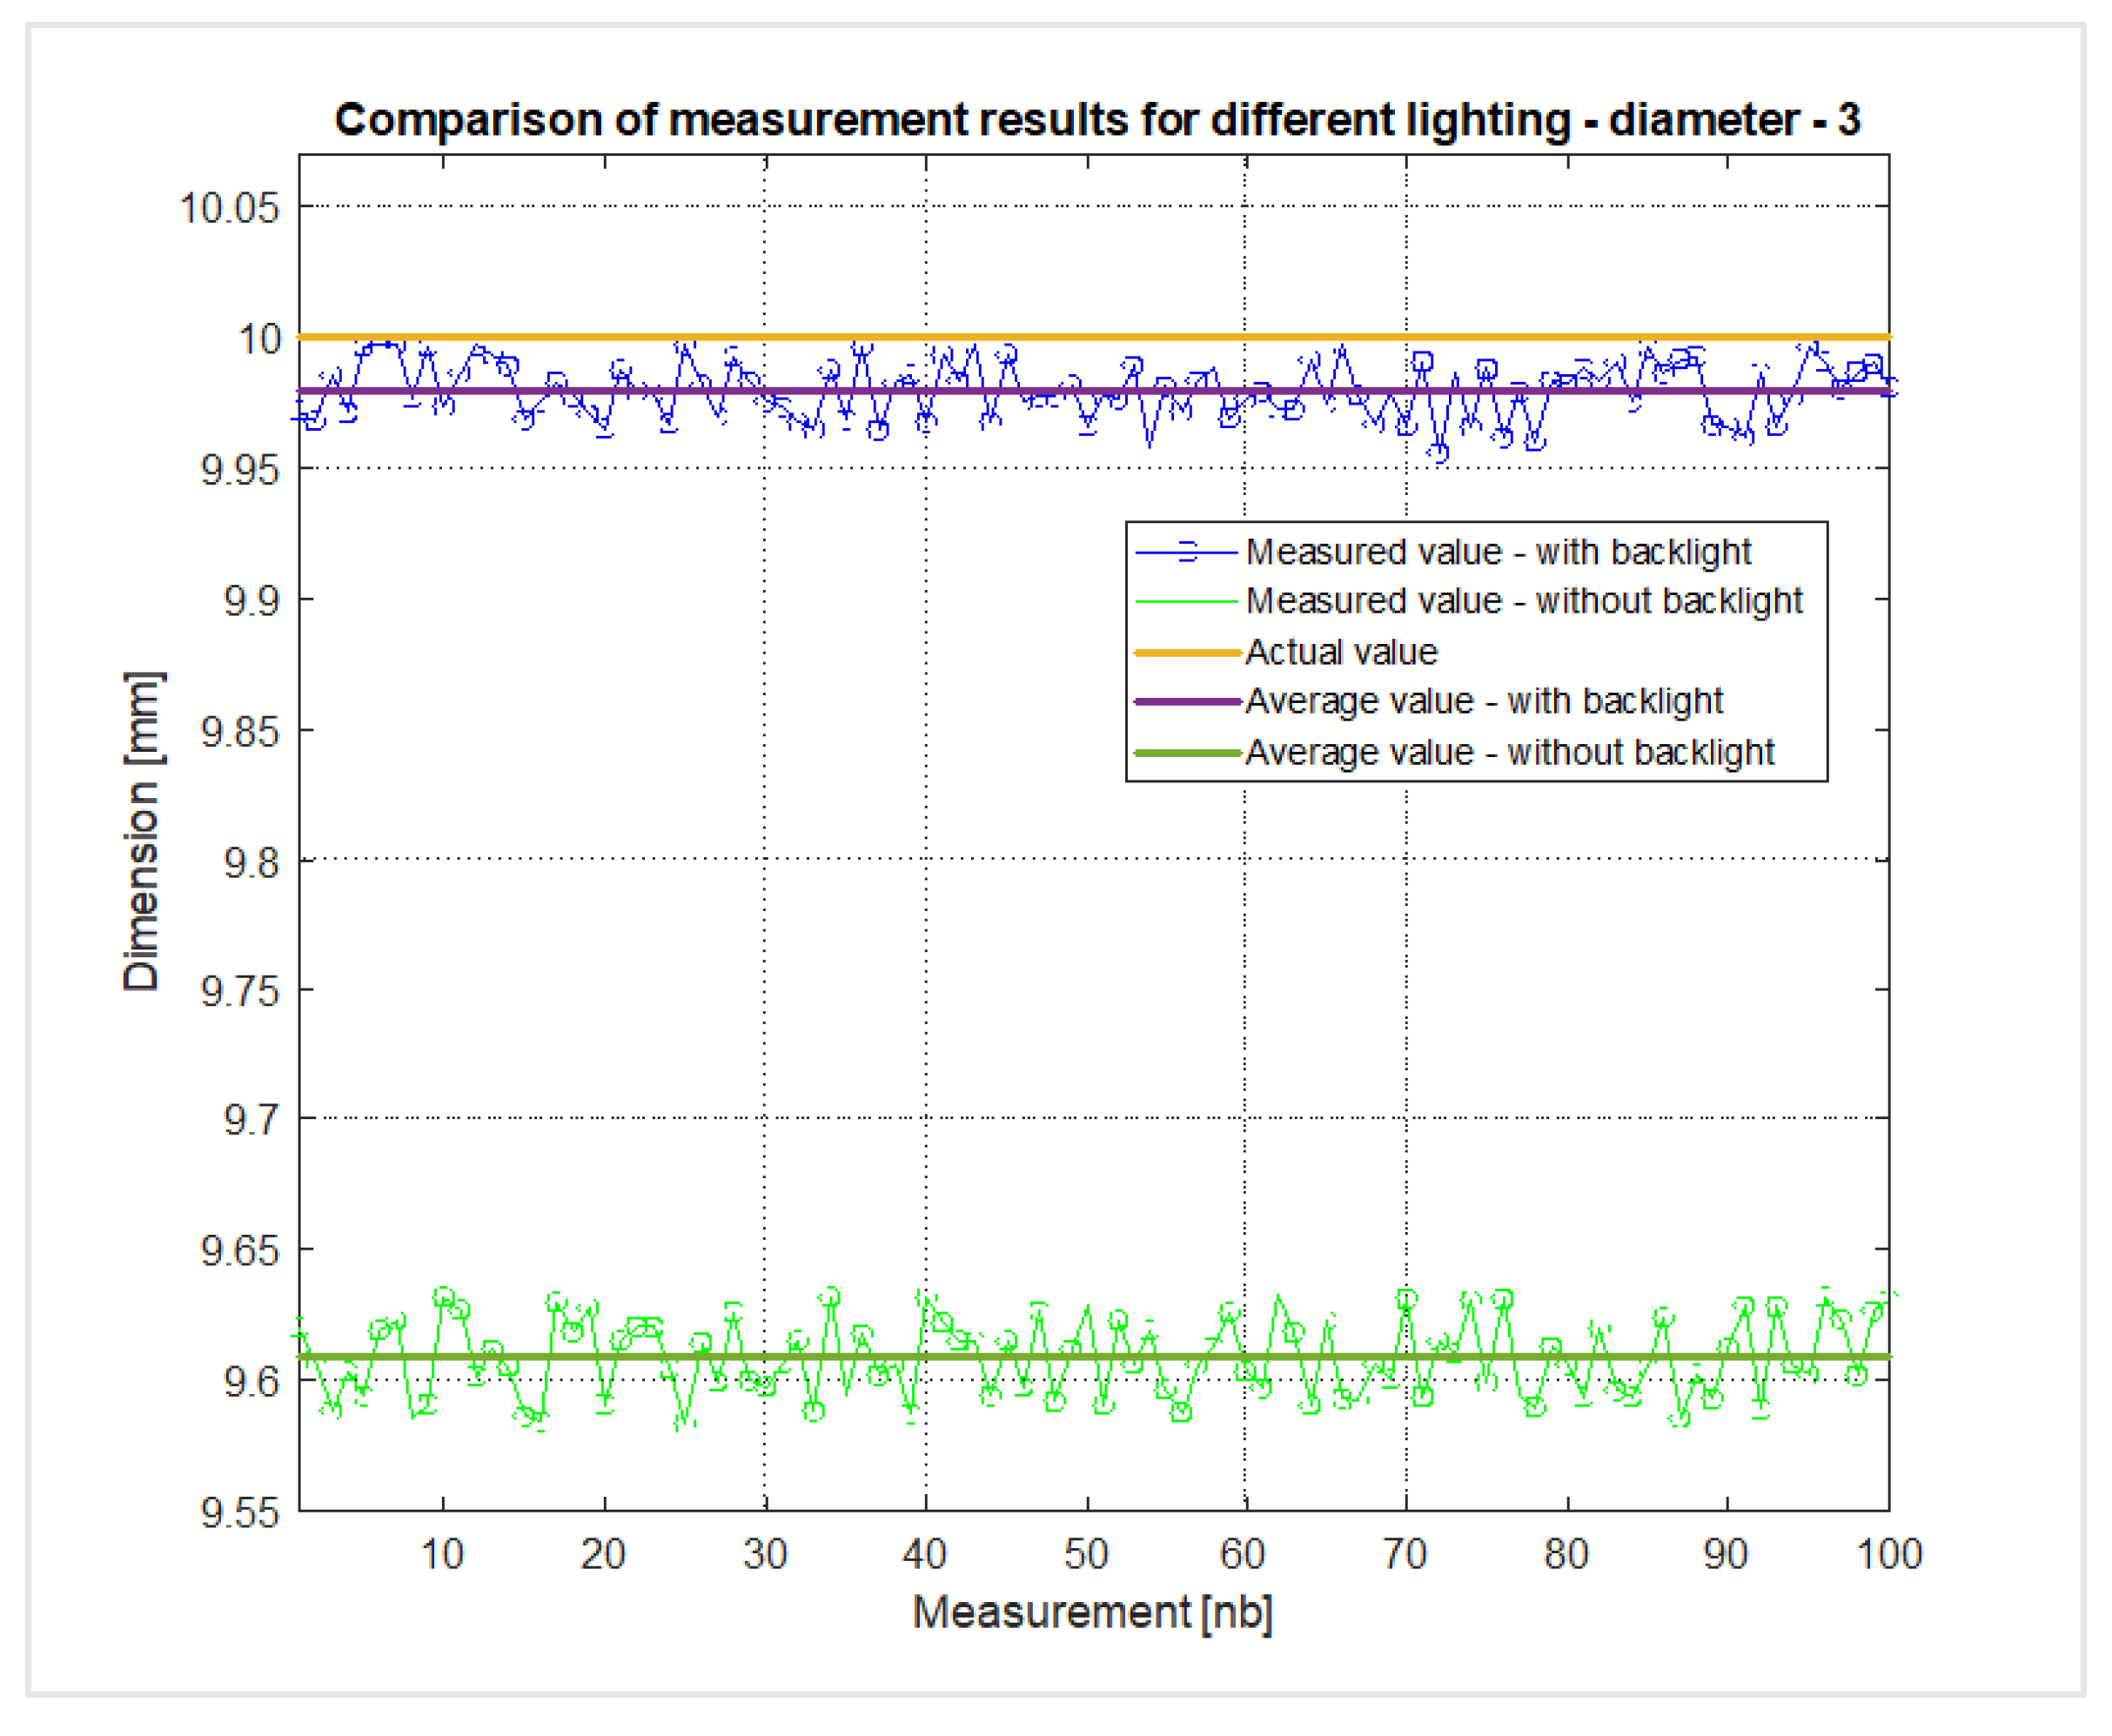
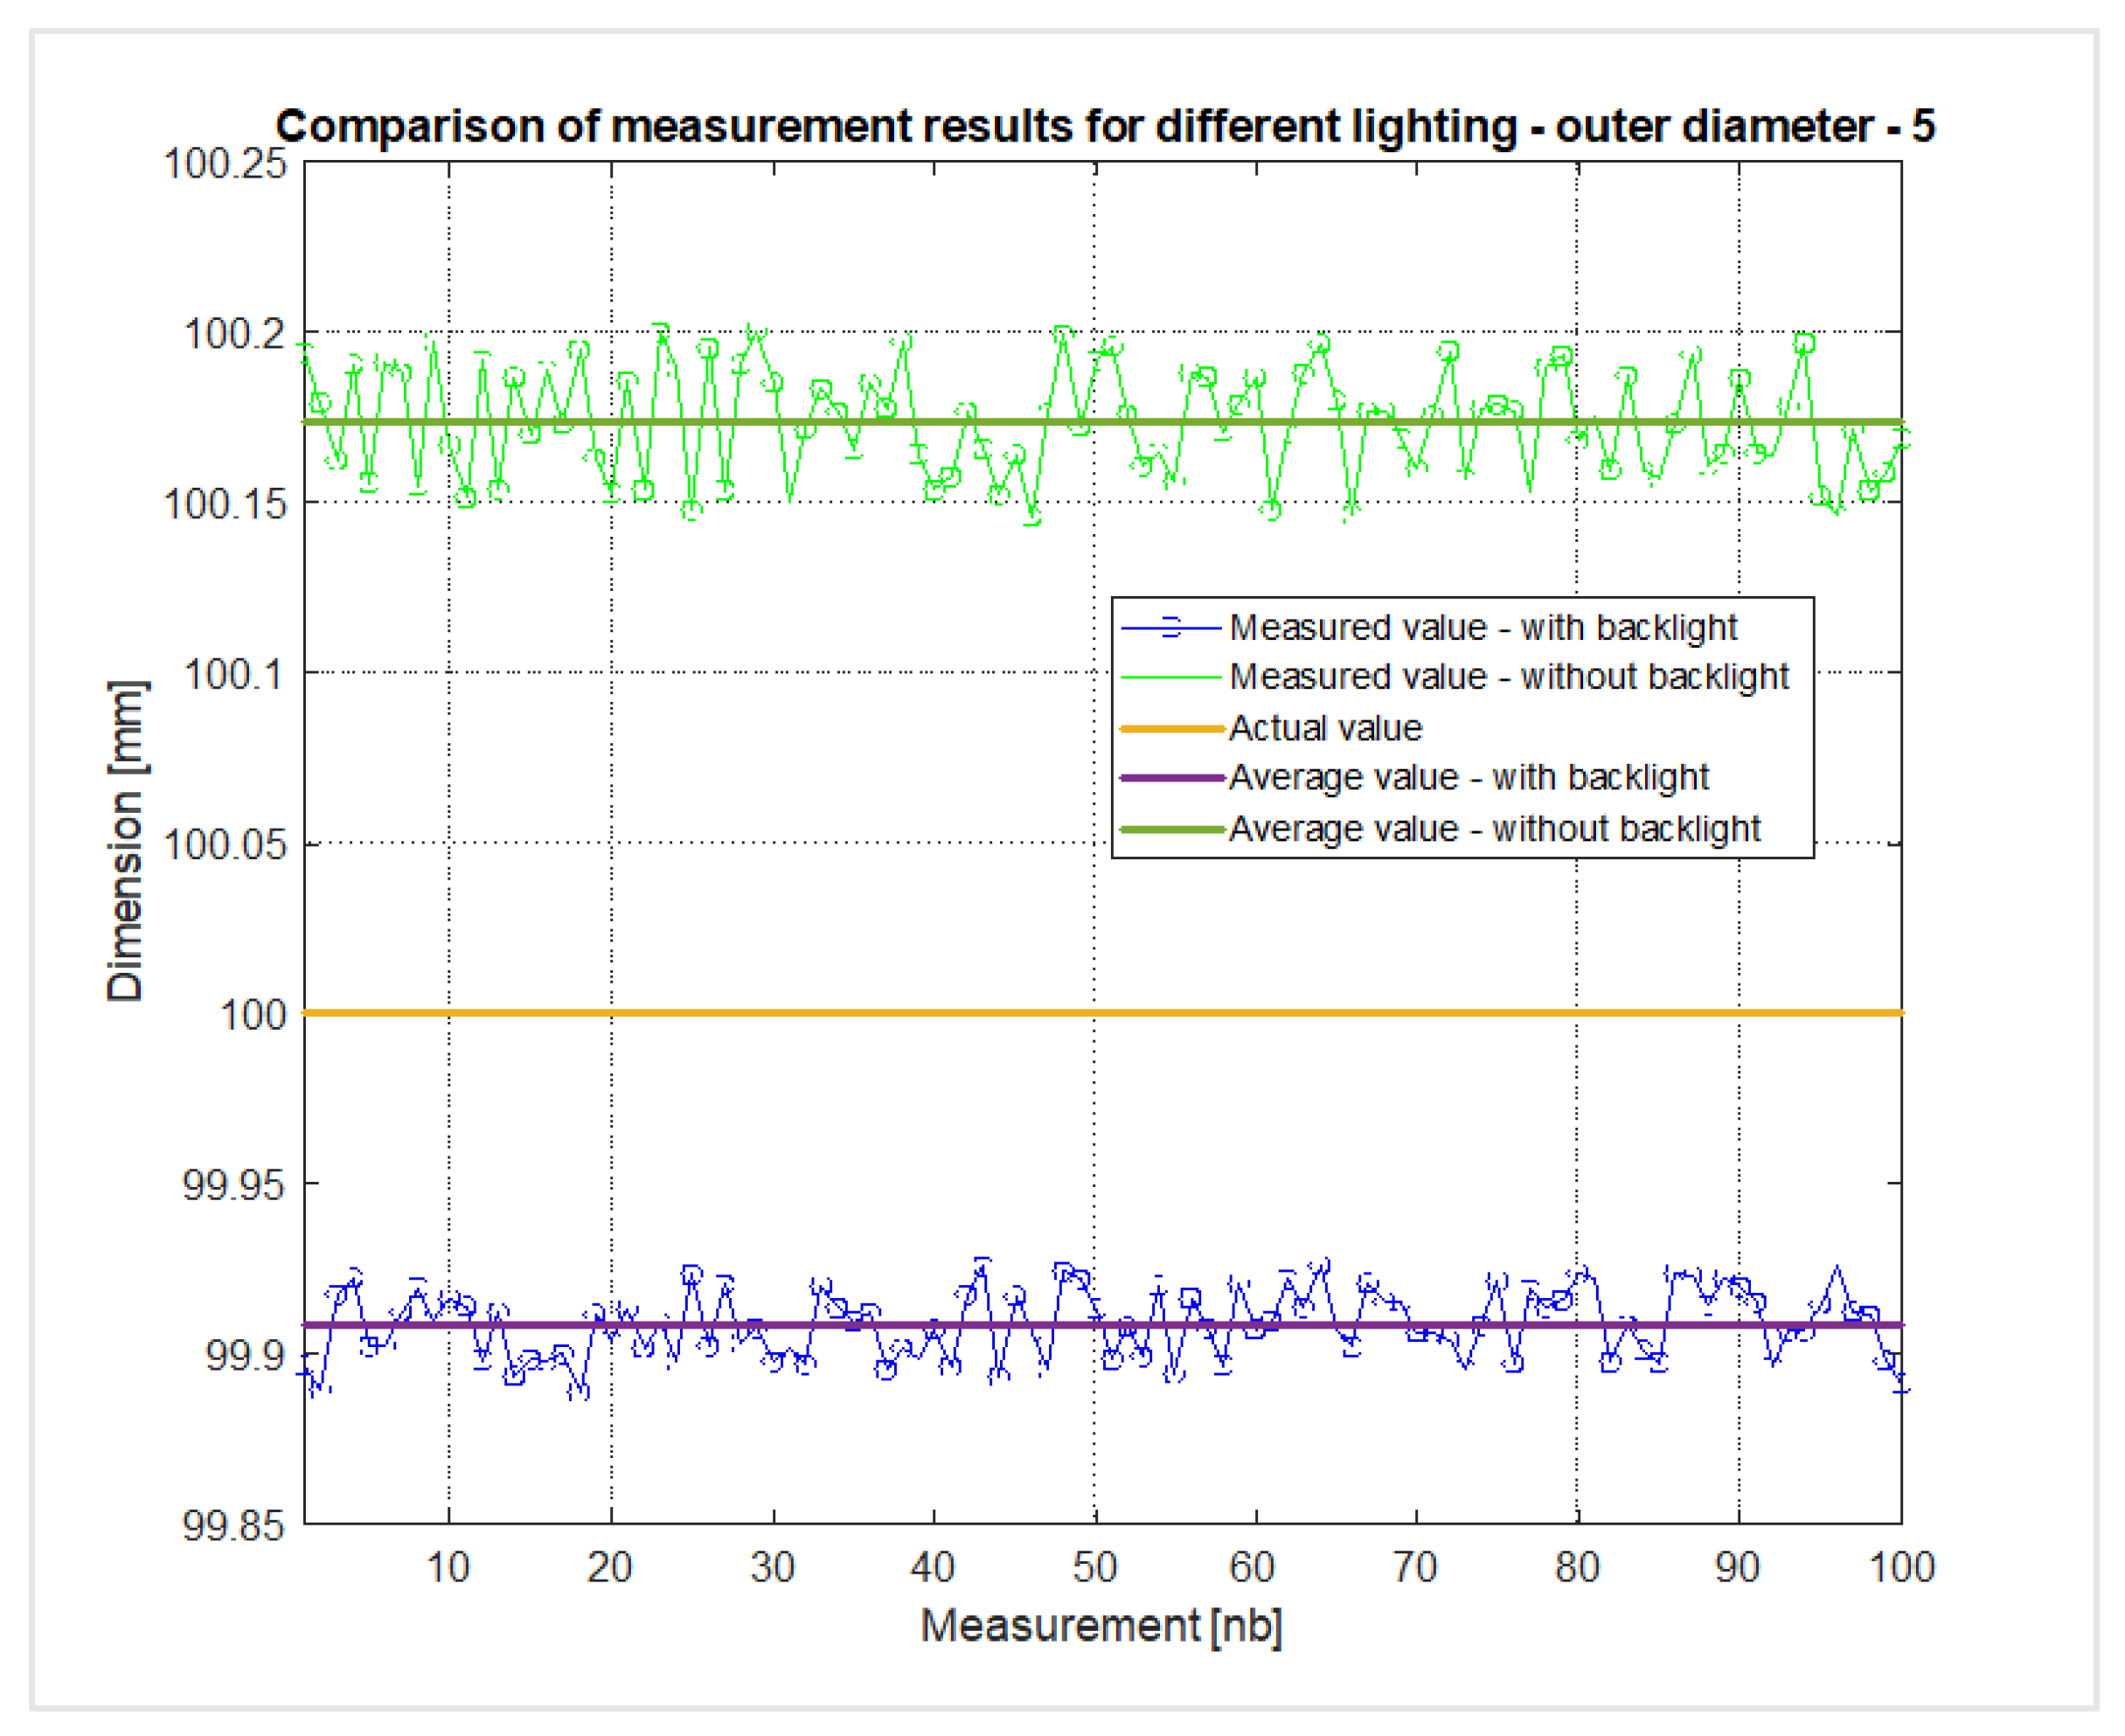
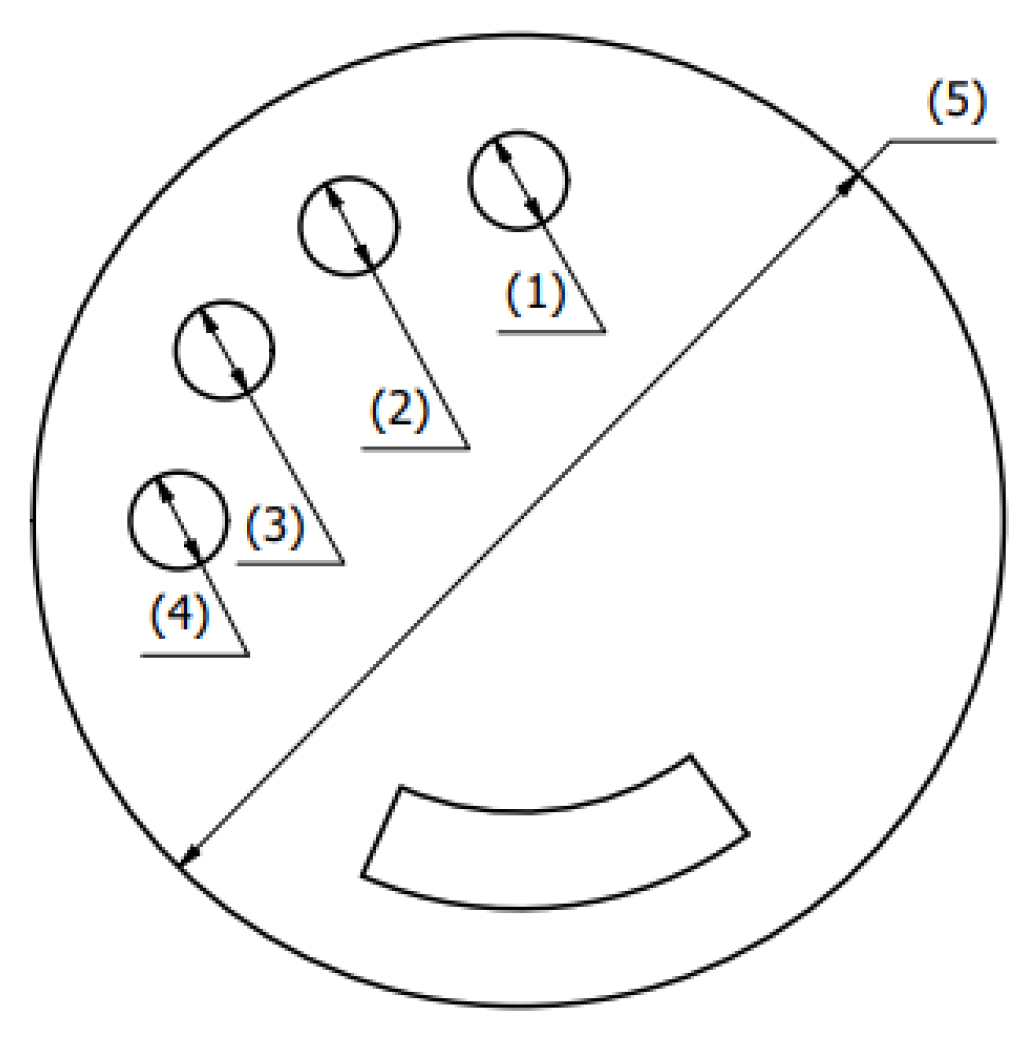
An object (Error! Reference source not found.., Error! Reference source not found..) with an irregular shape, made using 3D printing technology, was designed to carry out a series of measurements. The measurement sequence’s first stage involves taking 100 photos (in the optimal position of the camera’s field of view, which is the center of the optical axis), in identical lighting conditions and system configuration. In the next step, the location and diameter of the internal holes (1-4) (Error! Reference source not found..) and the external diameter (5) (Error! Reference source not found..) of the prepared detail are computed. A series of measurements were carried out for the case without and using backlight lighting.
Figure 3. Features of the detail analyzed during measurements 1-4 hole diameters, 5 - outer diameter of the detail.
Preprints 100865 g015
Figure 4. Developed measuring detail with marked dimensions.The obtained results are presented below (Error! Reference source not found..)(Error! Reference source not found.Error! Reference source not found..), including a comparison of the following values: standard deviation, standard uncertainty, relative error, absolute error, and mean value.
Preprints 100865 g016
Table 3. Comparison of the results obtained for measurements without and with backlight.
Without backlight lighting
Feature Mean value [mm] Standard deviation [mm] Standard uncertainty [mm] Average absolute error [mm] Medium relative error [%]
1 9.66331 0.01419 0.00142 0.33669 3.36700
2 9.72947 0.01649 0.00165 0.27053 2.70500
3 9.60860 0.01471 0.00147 0.39140 3.91400
4 9.68782 0.01498 0.00150 0.31218 3.12200
5 100.17344 0.01559 0.00156 0.17344 0.17300
With backlight lighting
1 10.03240 0.01141 0.00114 0.03240 0.32400
2 10.07091 0.01023 0.00102 0.07091 0.70900
3 9.97986 0.01084 0.00108 0.02014 0.20100
4 10.06637 0.00866 0.00087 0.06637 0.66400
5 99.90848 0.00992 0.00099 0.09152 0.09200
Figure 5. Comparison of results for measurements without lighting and with backlight lighting - hole diameters - 1-4.
Preprints 100865 g017
Figure 6. Comparison of results for measurements without lighting and with backlight lighting - hole diameter - 5.
Preprints 100865 g018
Figure 7. Comparison of results for measurements without lighting and with backlight lighting - hole diameter - 3.
Preprints 100865 g019
Figure 8. Comparison of results for measurements without lighting and with backlight lighting - outer diameter of the detail - 5.
Preprints 100865 g020
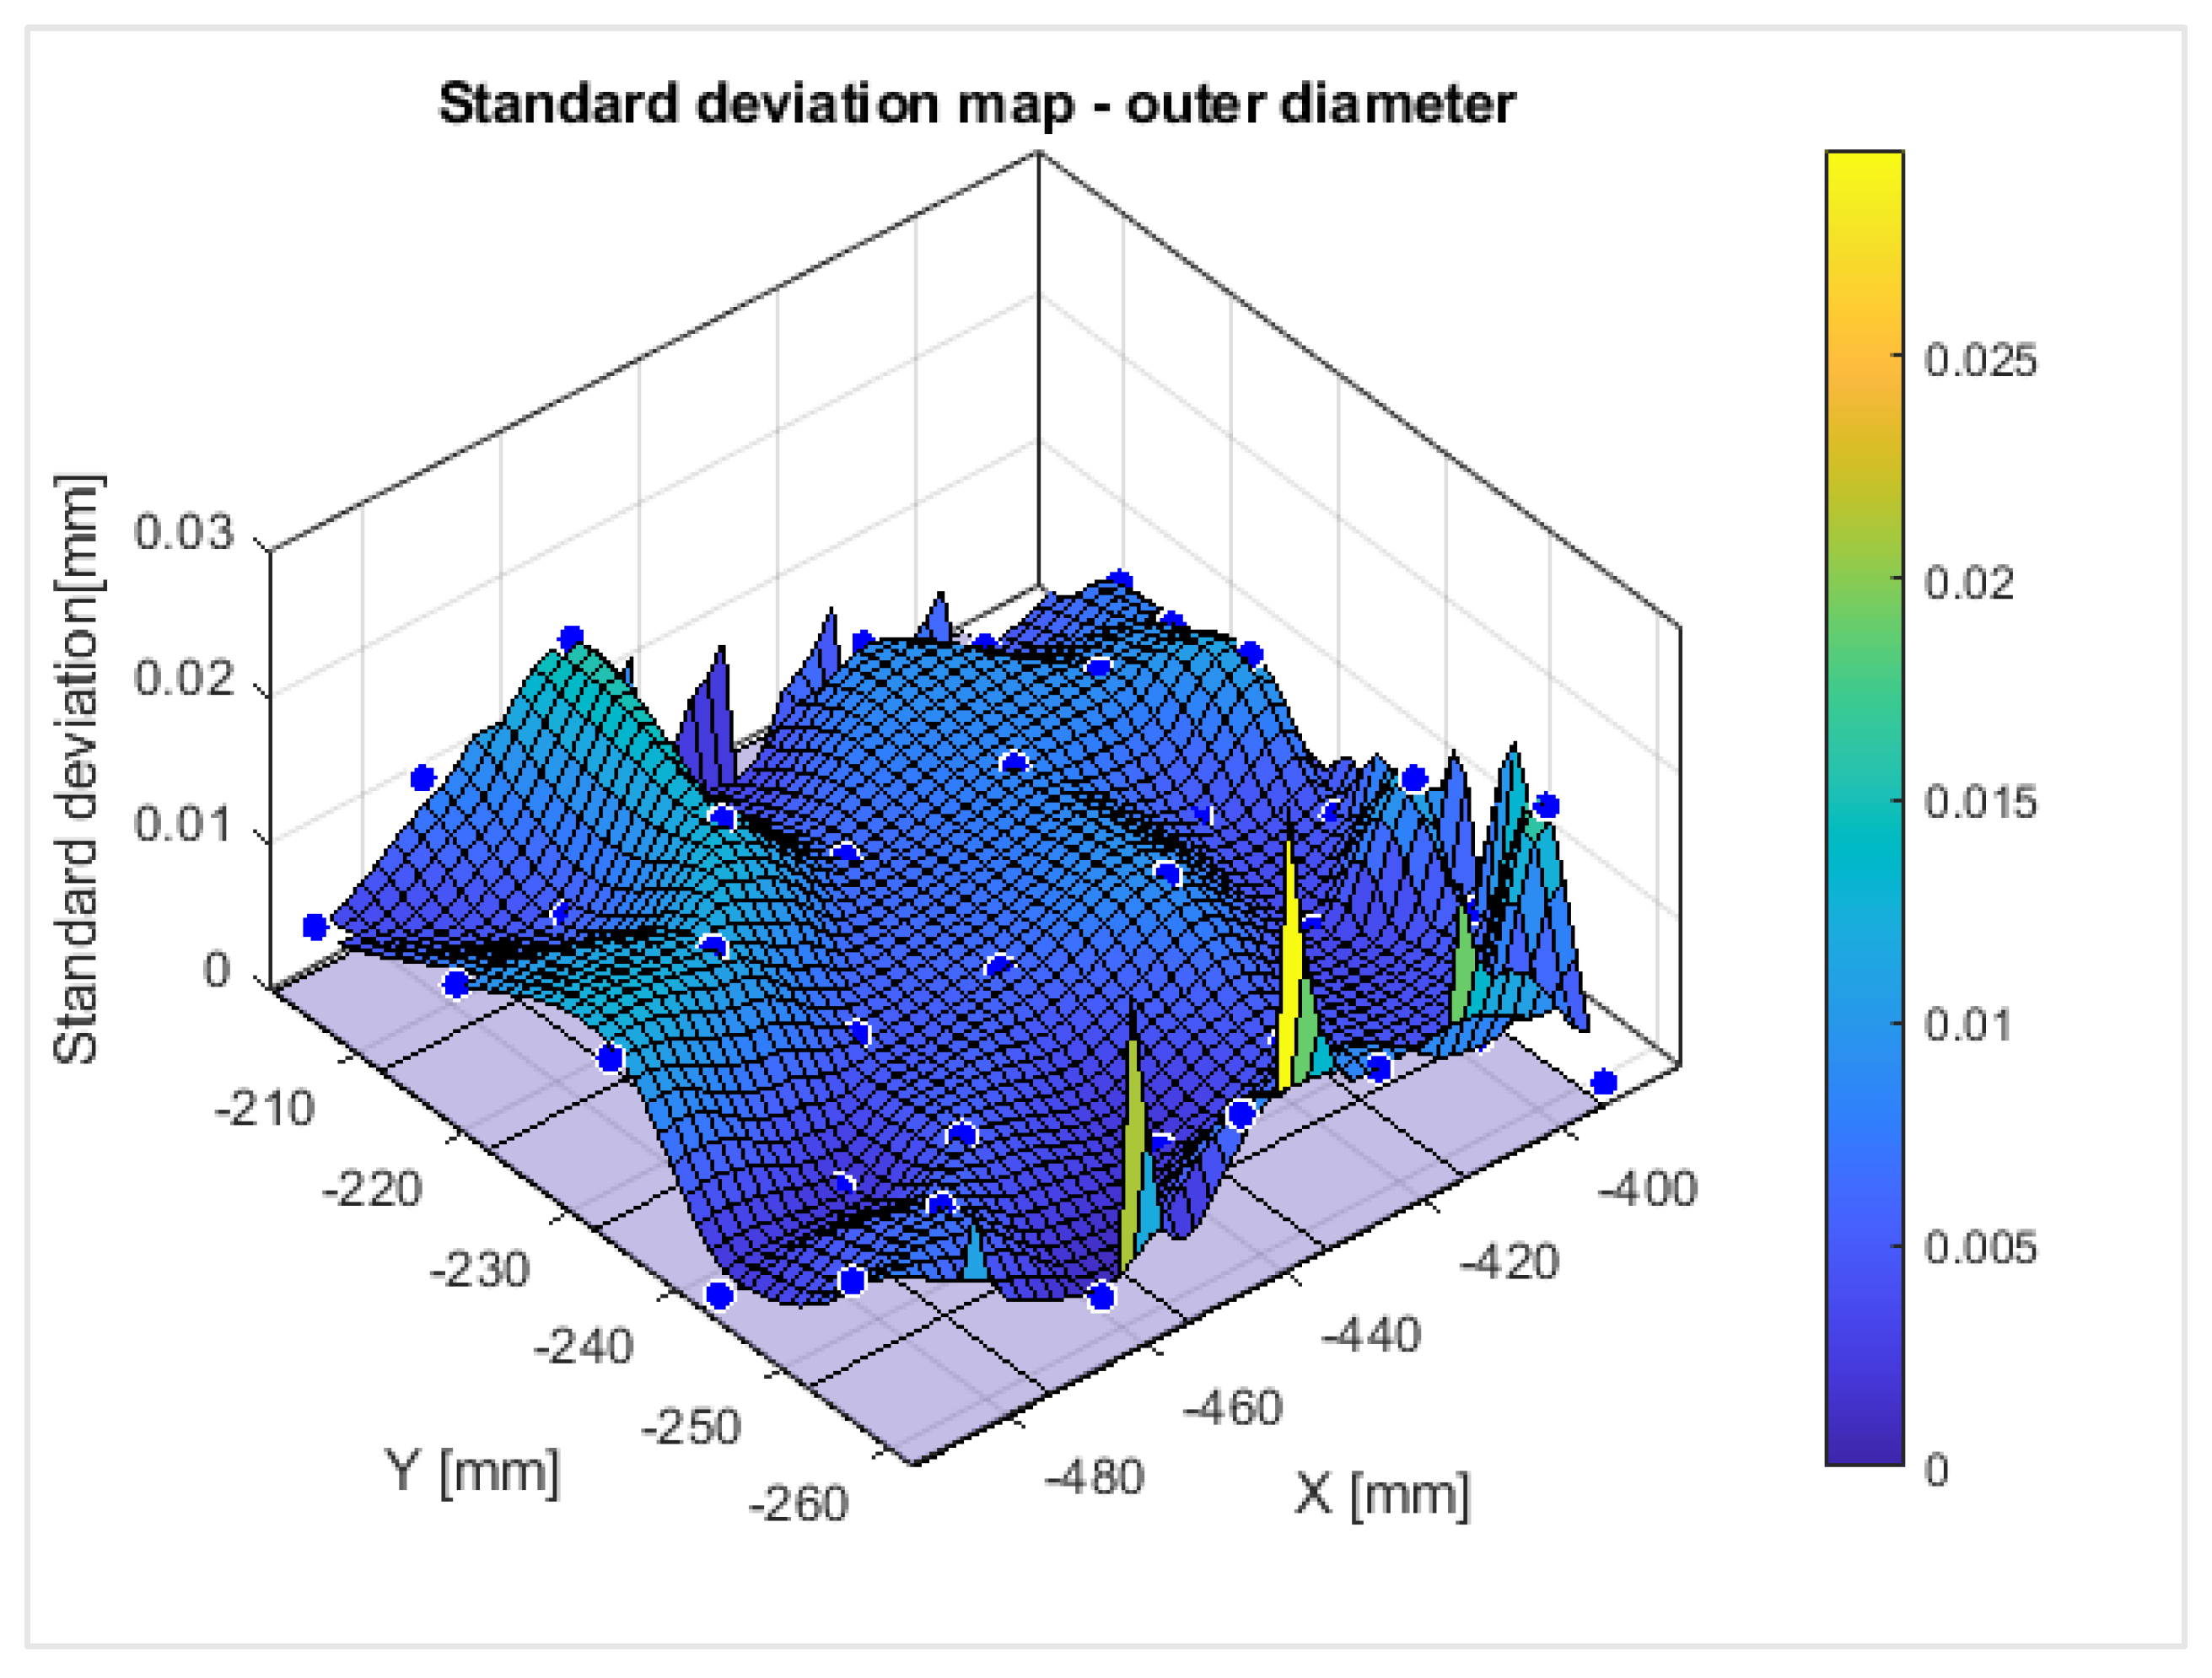
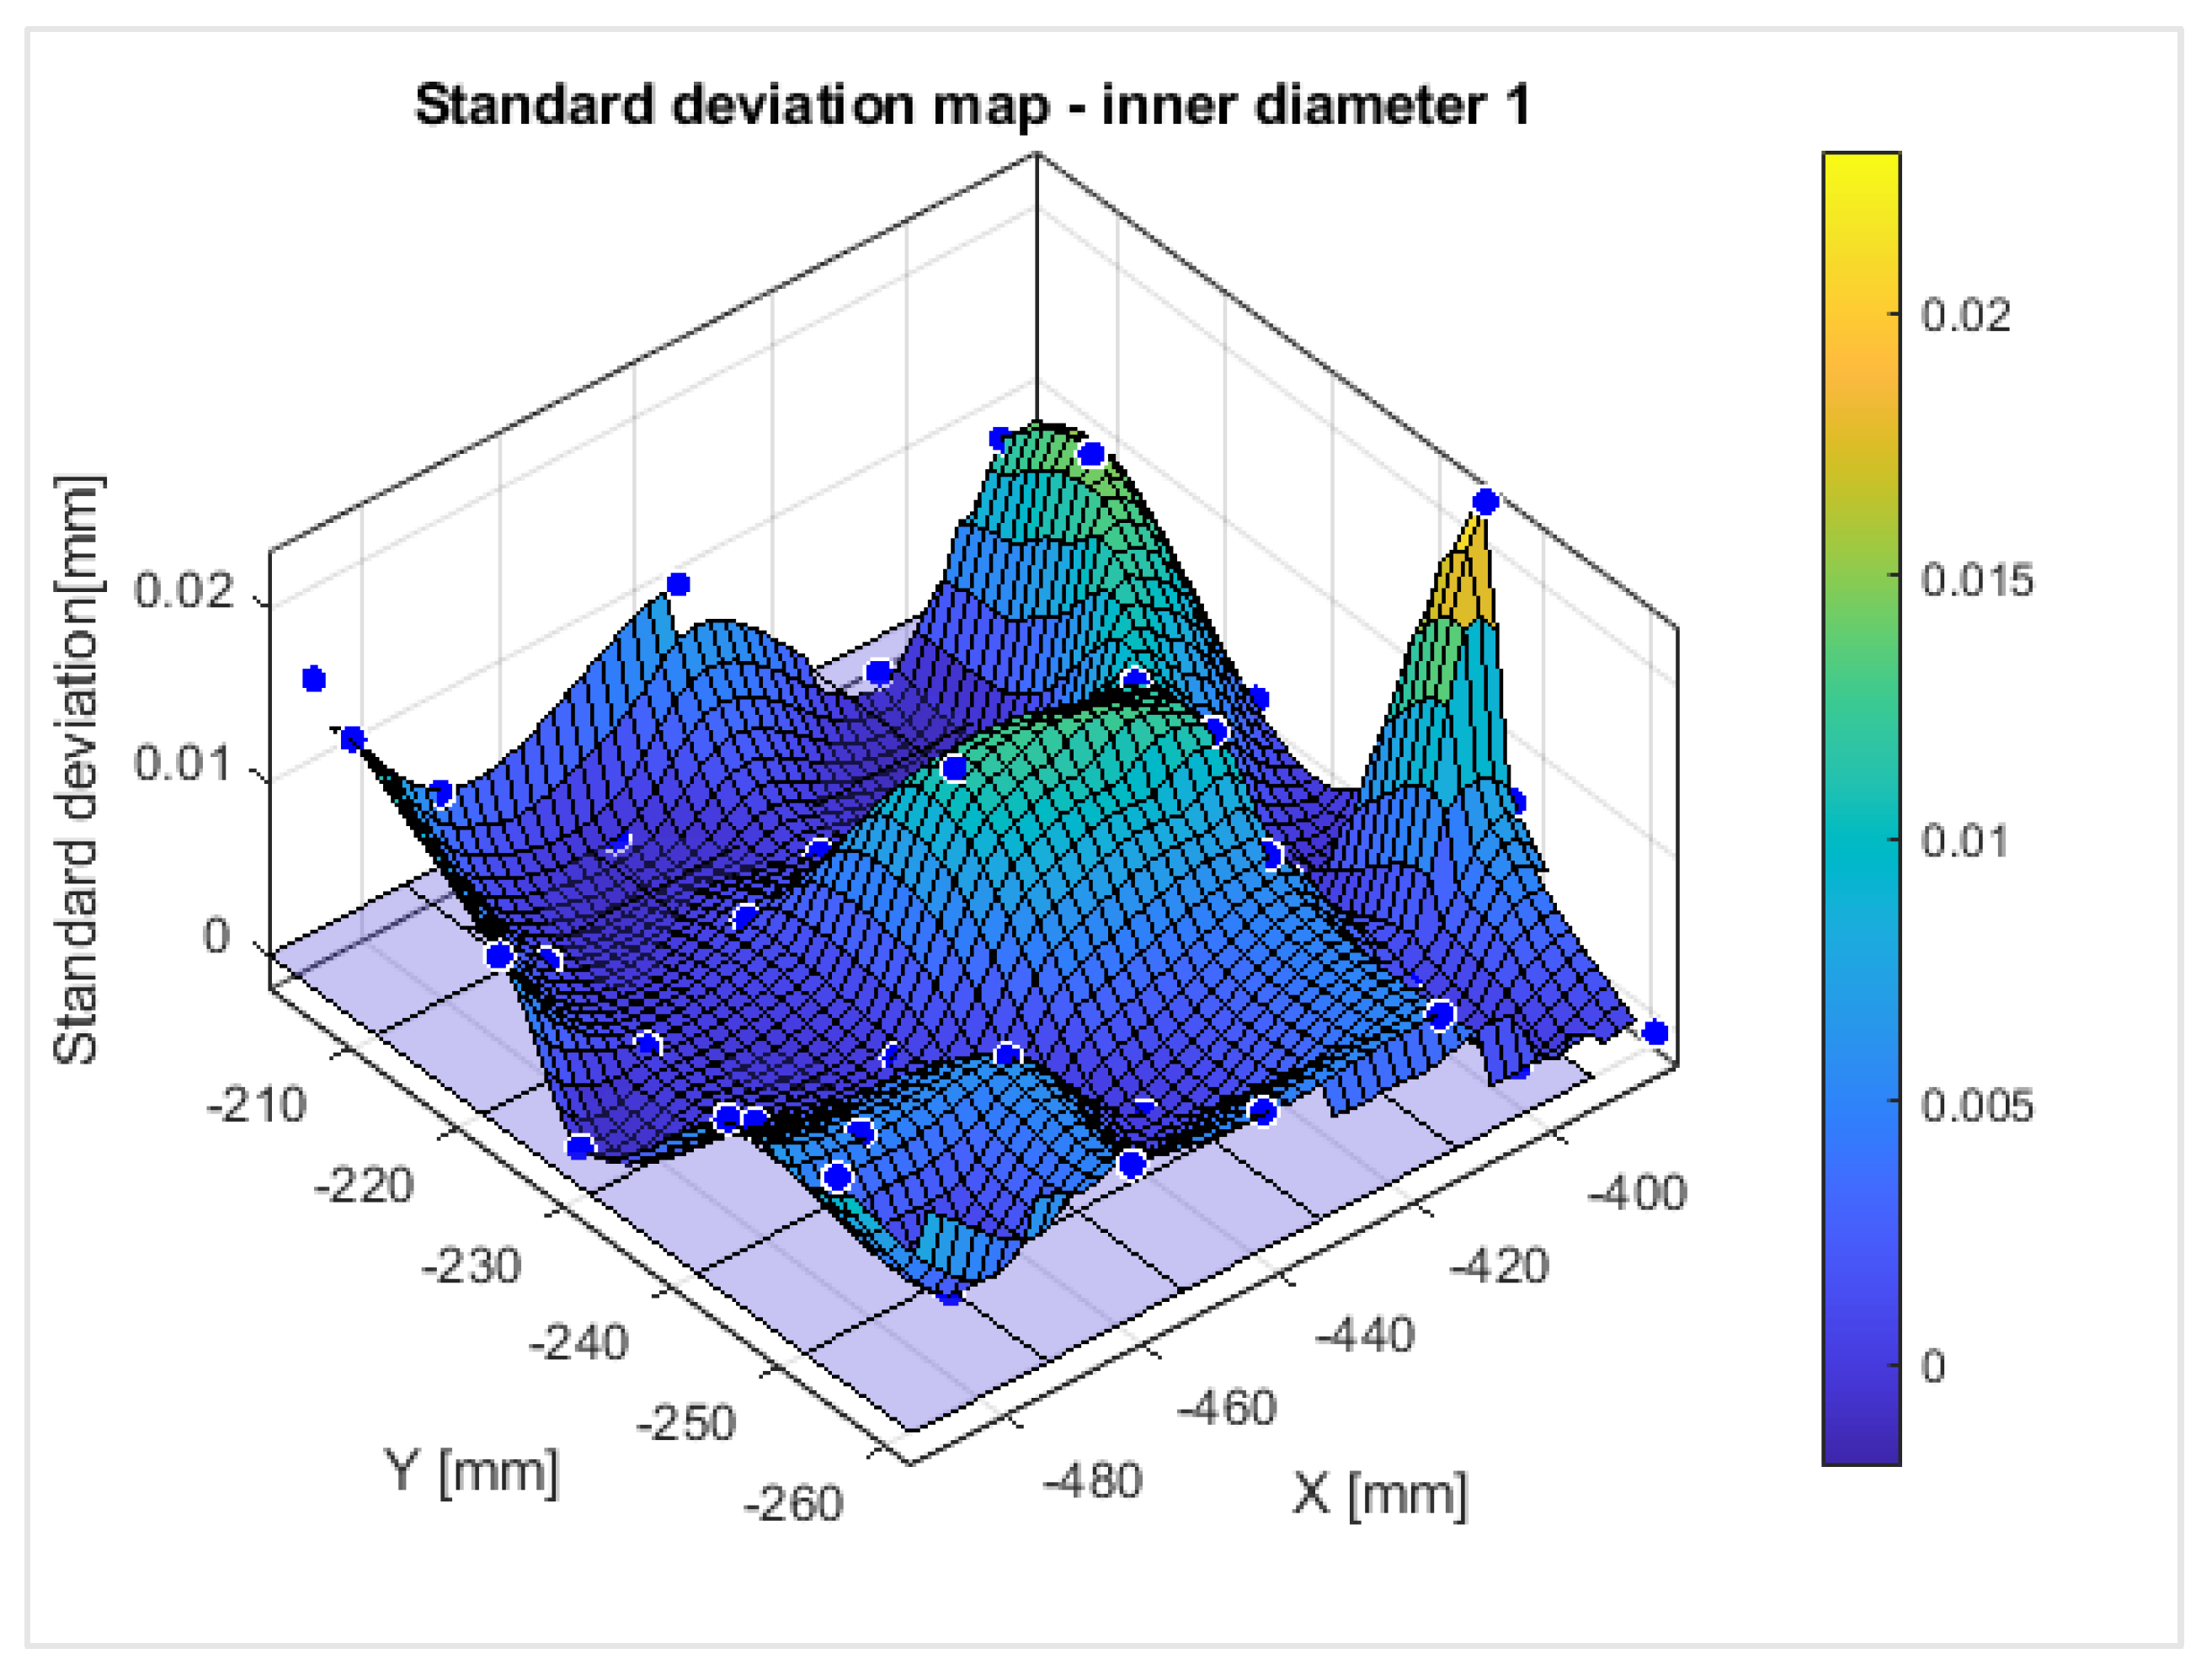
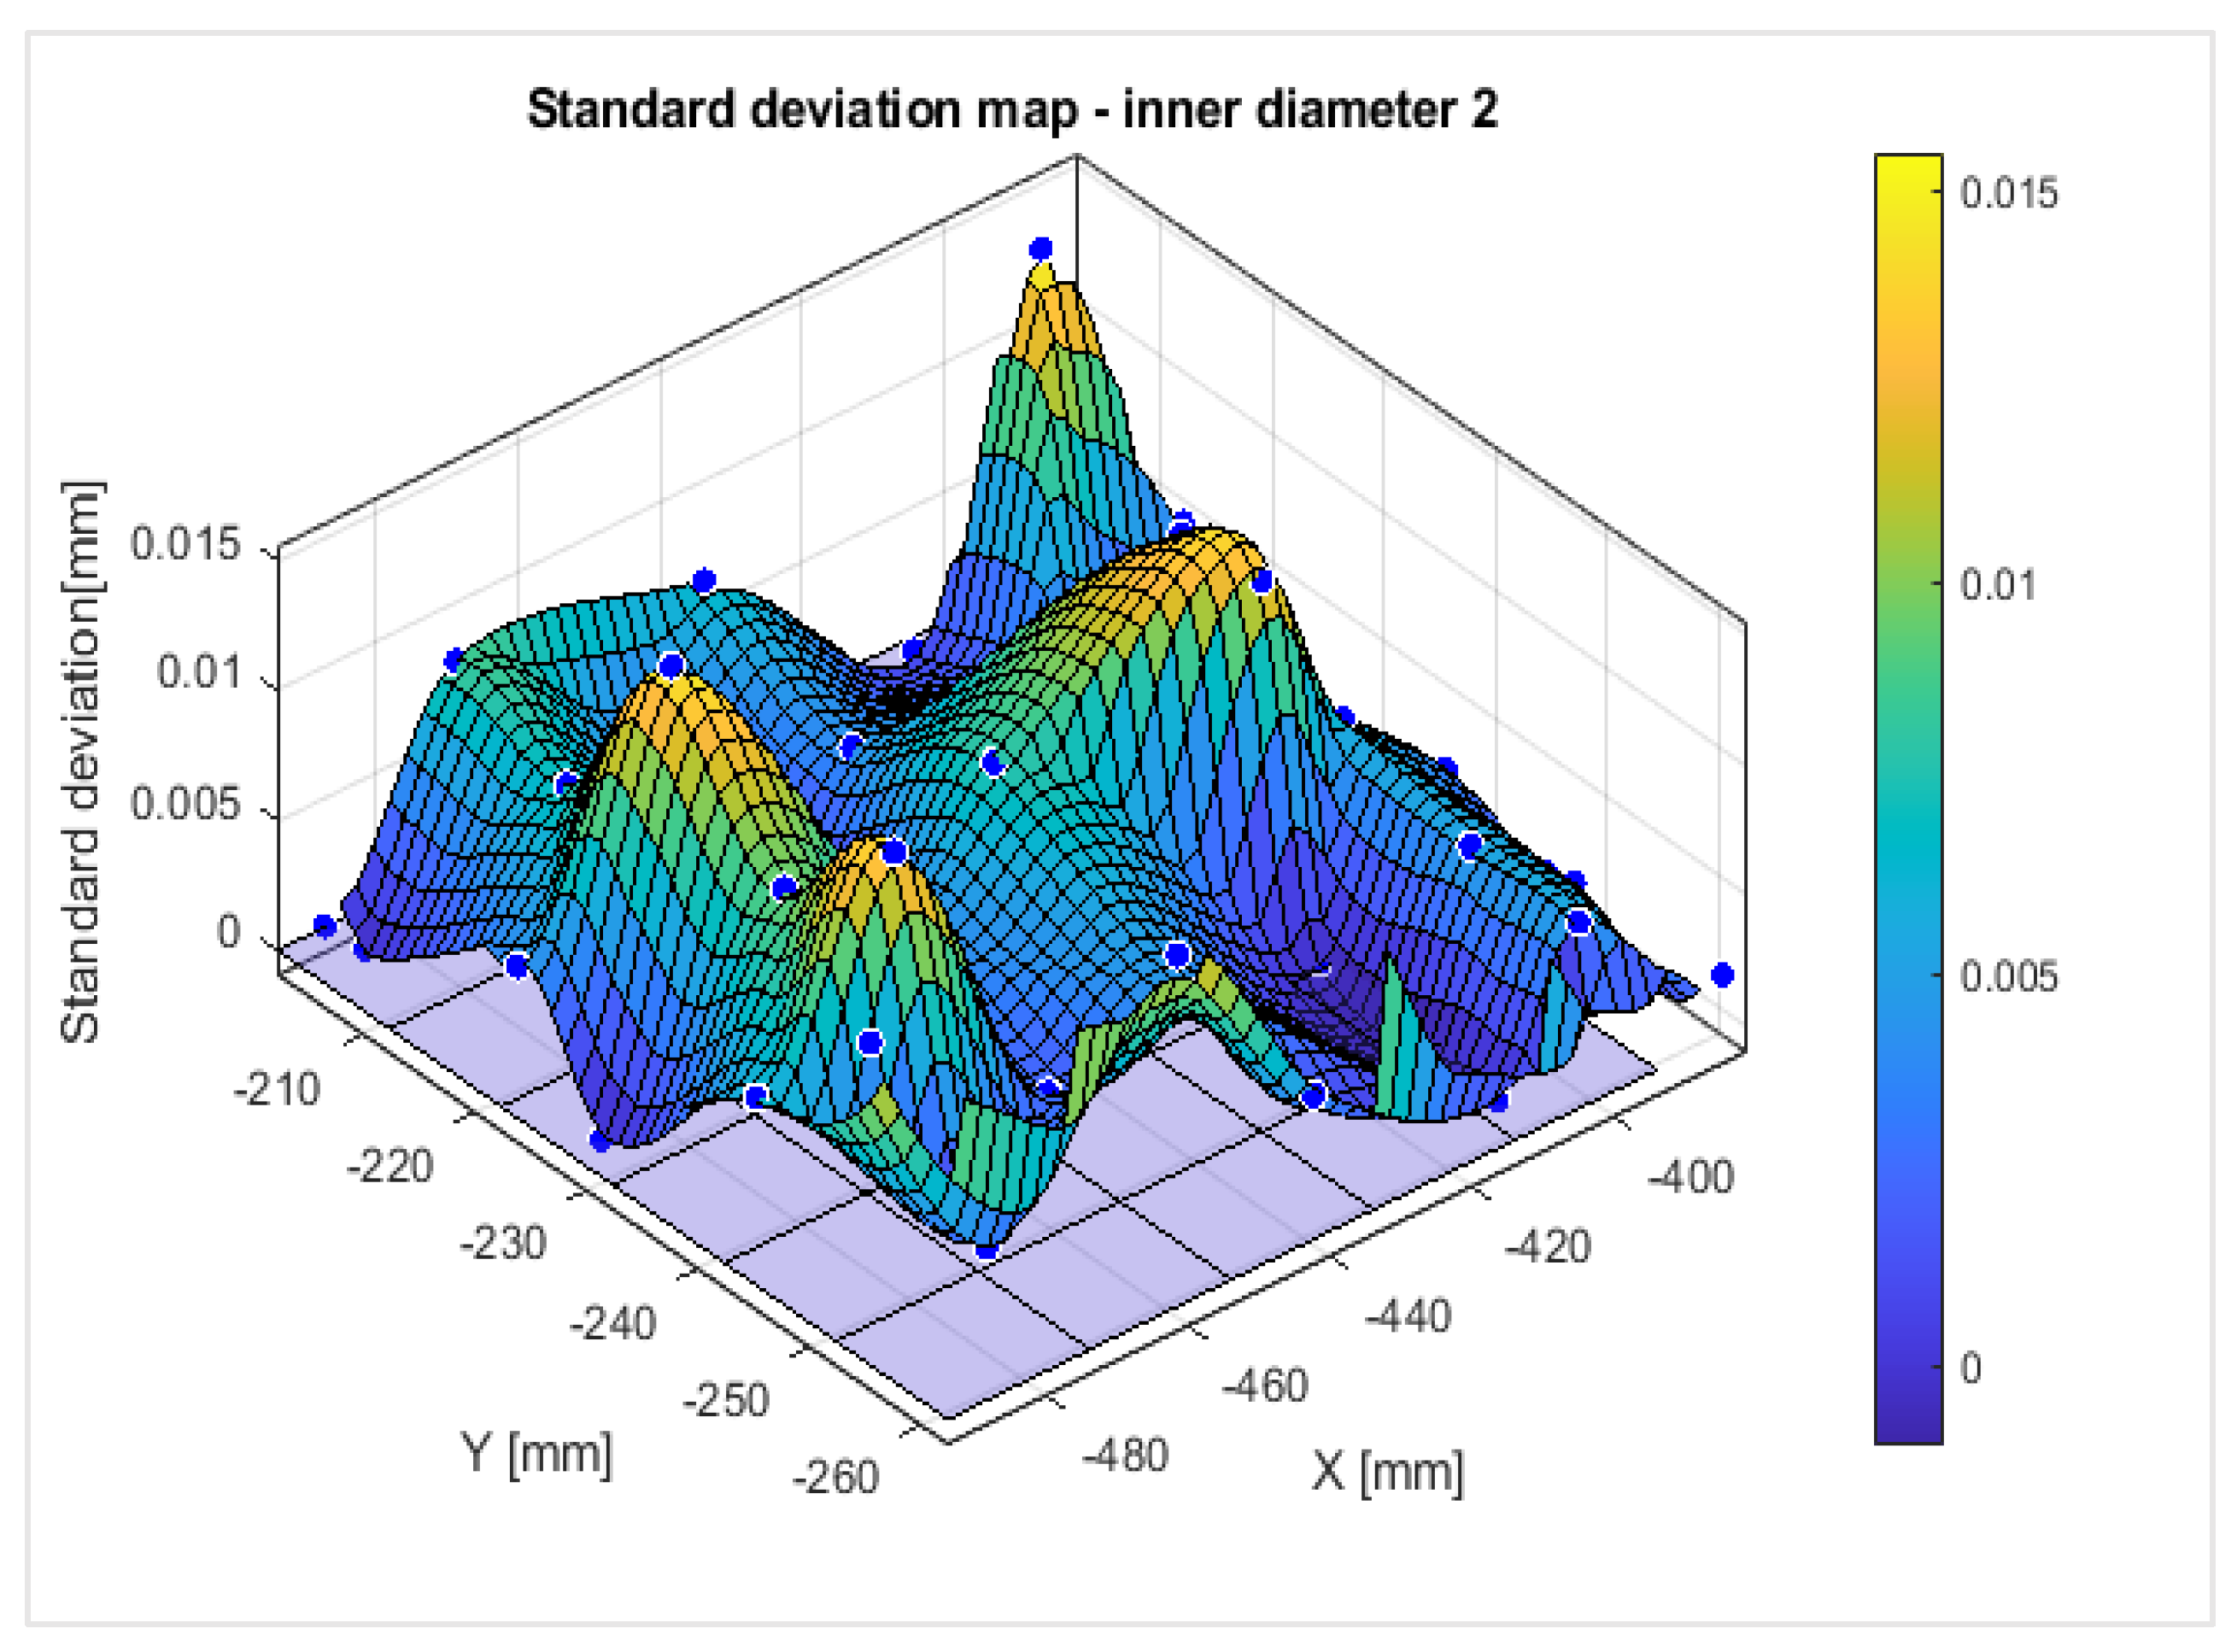
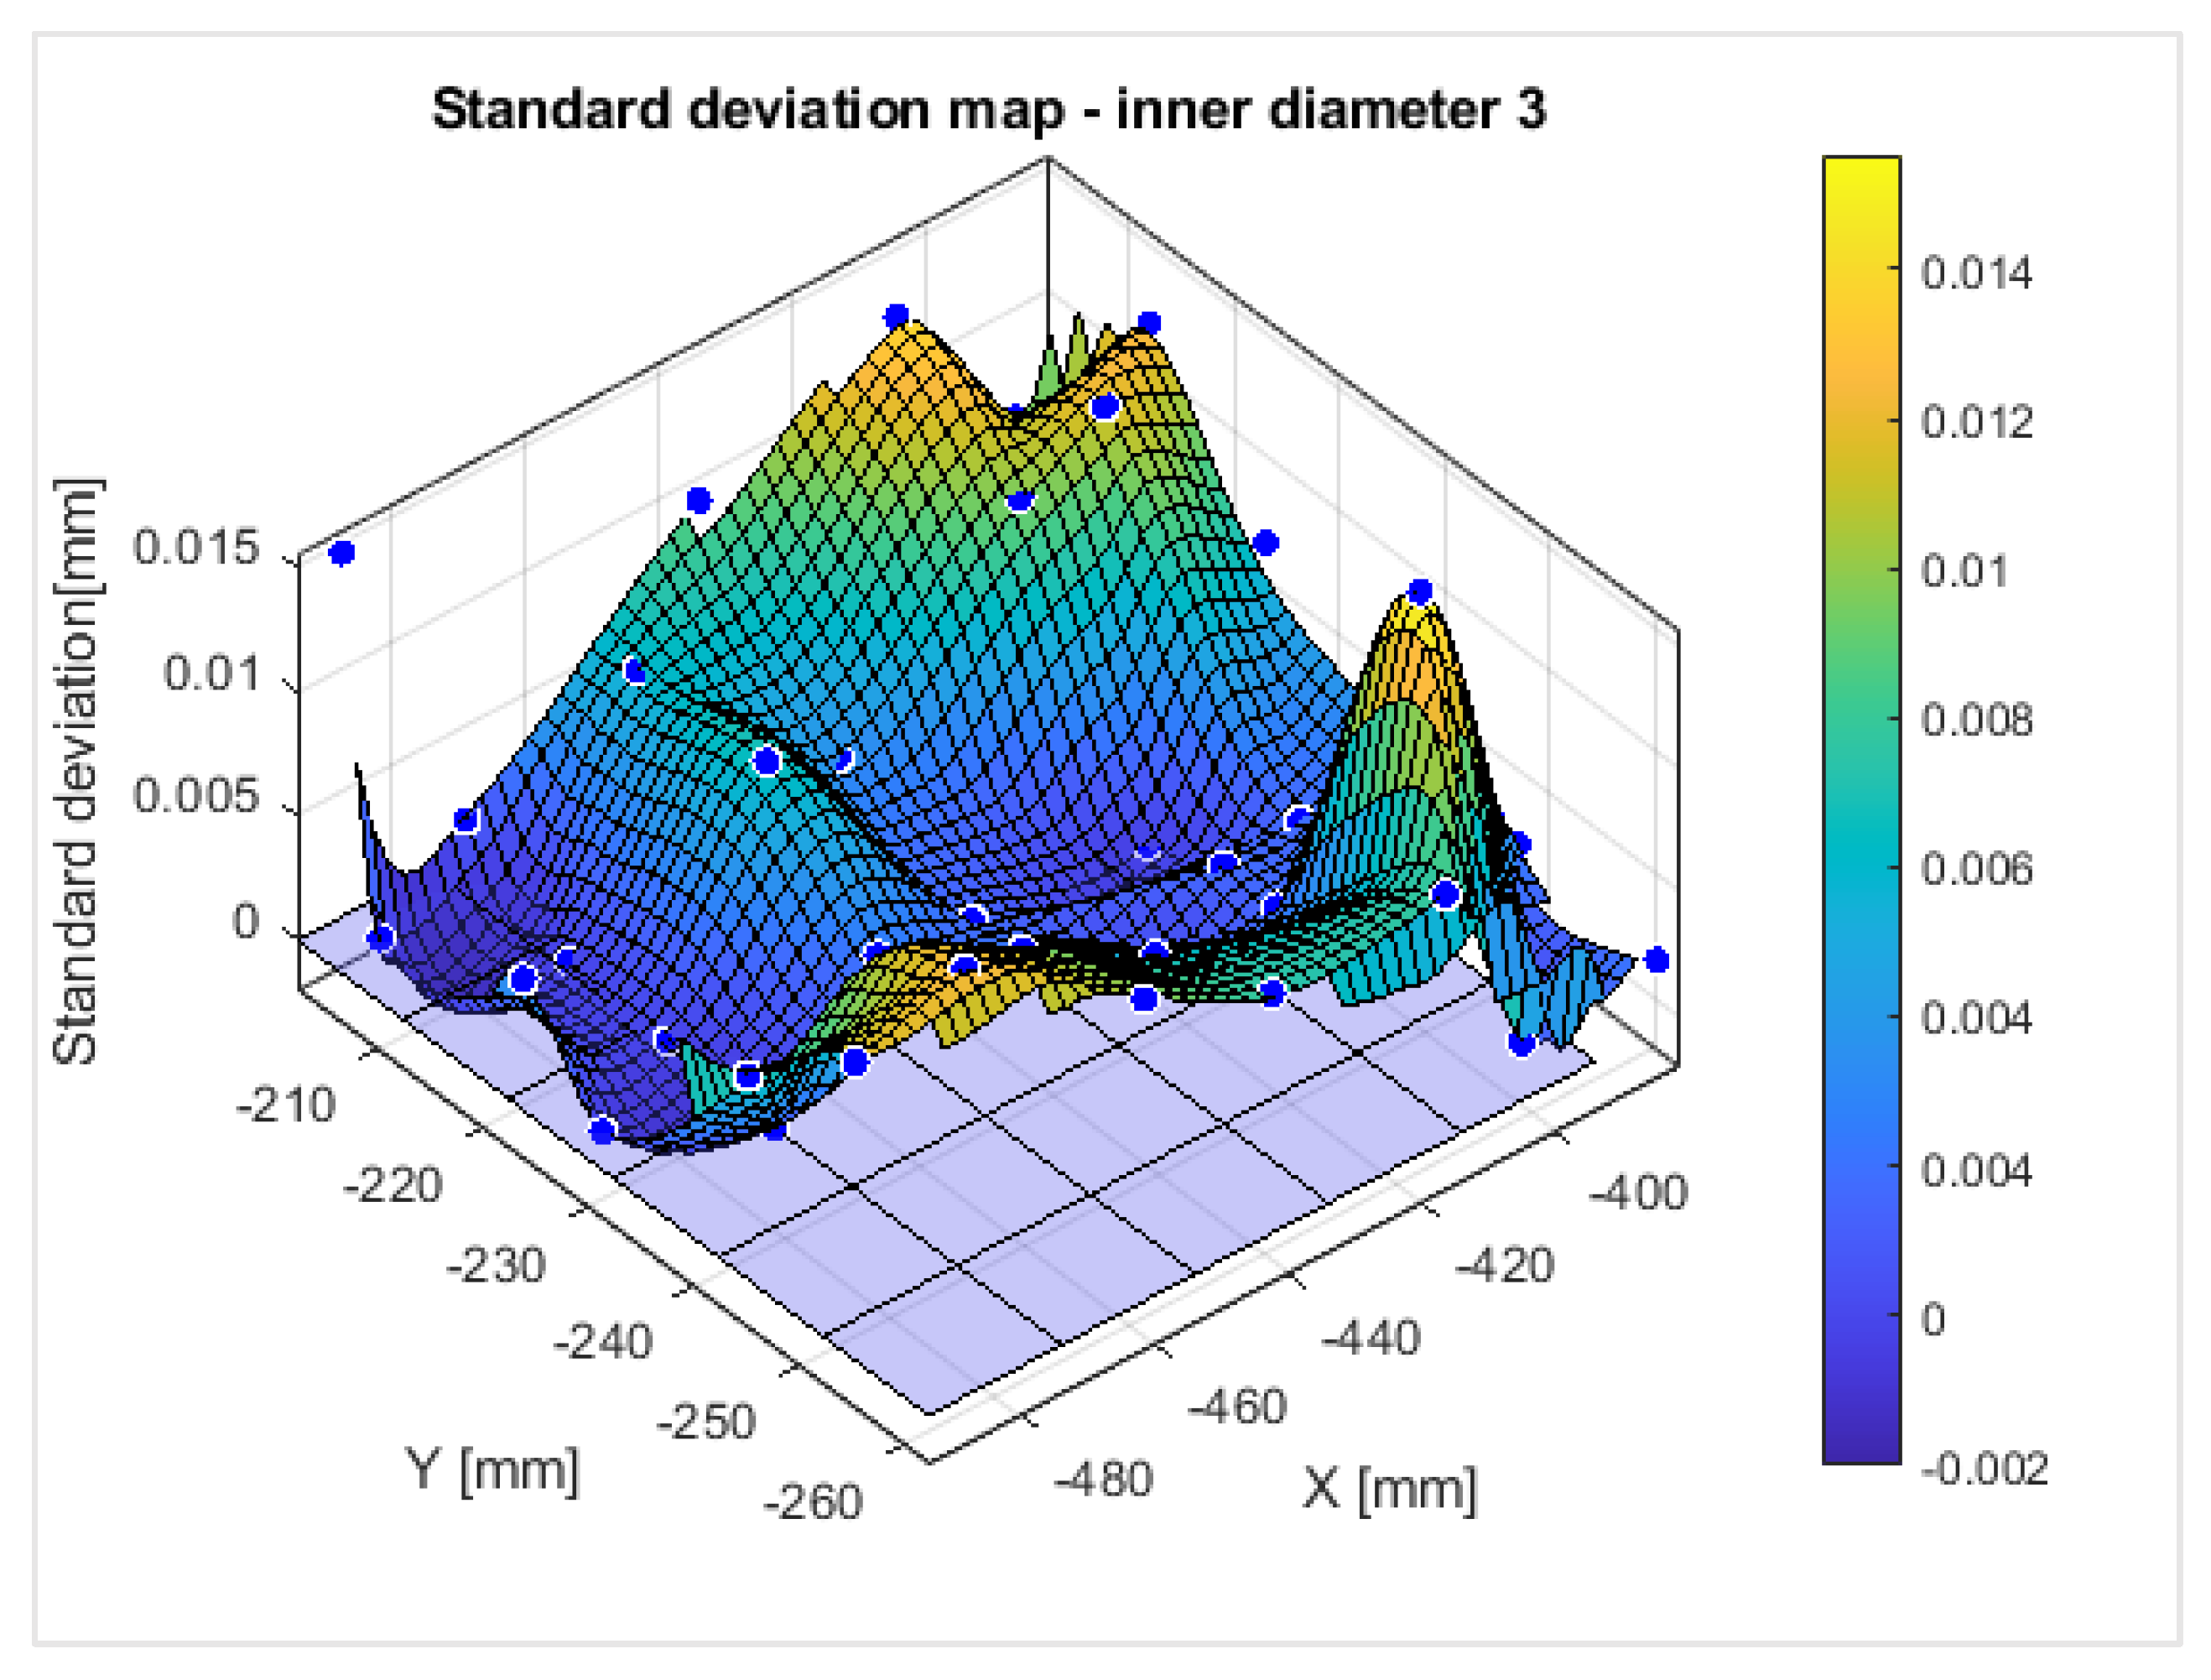
The next series of measurements concerns determining the accuracy and repeatability of the developed vision system. The collected data will also make it possible to draw a map of measurement error variability, the analysis of which will allow determining the camera’s image space where the measurement accuracy is the highest.
The described measurement sequence involves taking a series of 50 photos, in each of 40 positions, in the camera’s field of view (the photos were taken for the case without and with backlight lighting). The next step is, similarly to the first measurement sequence, determining the basic geometric dimensions of the detail(Error! Reference source not found.., Error! Reference source not found..) The results are presented below (Error! Reference source not found.. – Error! Reference source not found..), (Error! Reference source not found.. – Error! Reference source not found..) including maps standard deviation.
Table 4. Outer diameter and inner diameter measurement results (without backlight lighting).
Feature Mean value [mm] Average absolute error [mm] Medium relative error [%] Standard deviation [mm] Standard uncertainty [mm]
1 9.68237 0.31763 3.17600 0.04030 0.00637
2 9.67630 0.32370 3.23700 0.03887 0.00615
3 9.64648 0.35352 3.53500 0.04122 0.00652
4 9.69851 0.30149 3.01500 0.03845 0.00608
5 100.33039 0.33039 0.33000 0.34381 0.05436
Figure 9. Hole diameter standard deviation map – 1 (without backlight lighting).
Preprints 100865 g021
Figure 10. Hole diameter standard deviation map – 2 (without backlight lighting).
Preprints 100865 g022
Figure 11. Hole diameter standard deviation map – 3 (without backlight lighting).
Preprints 100865 g023
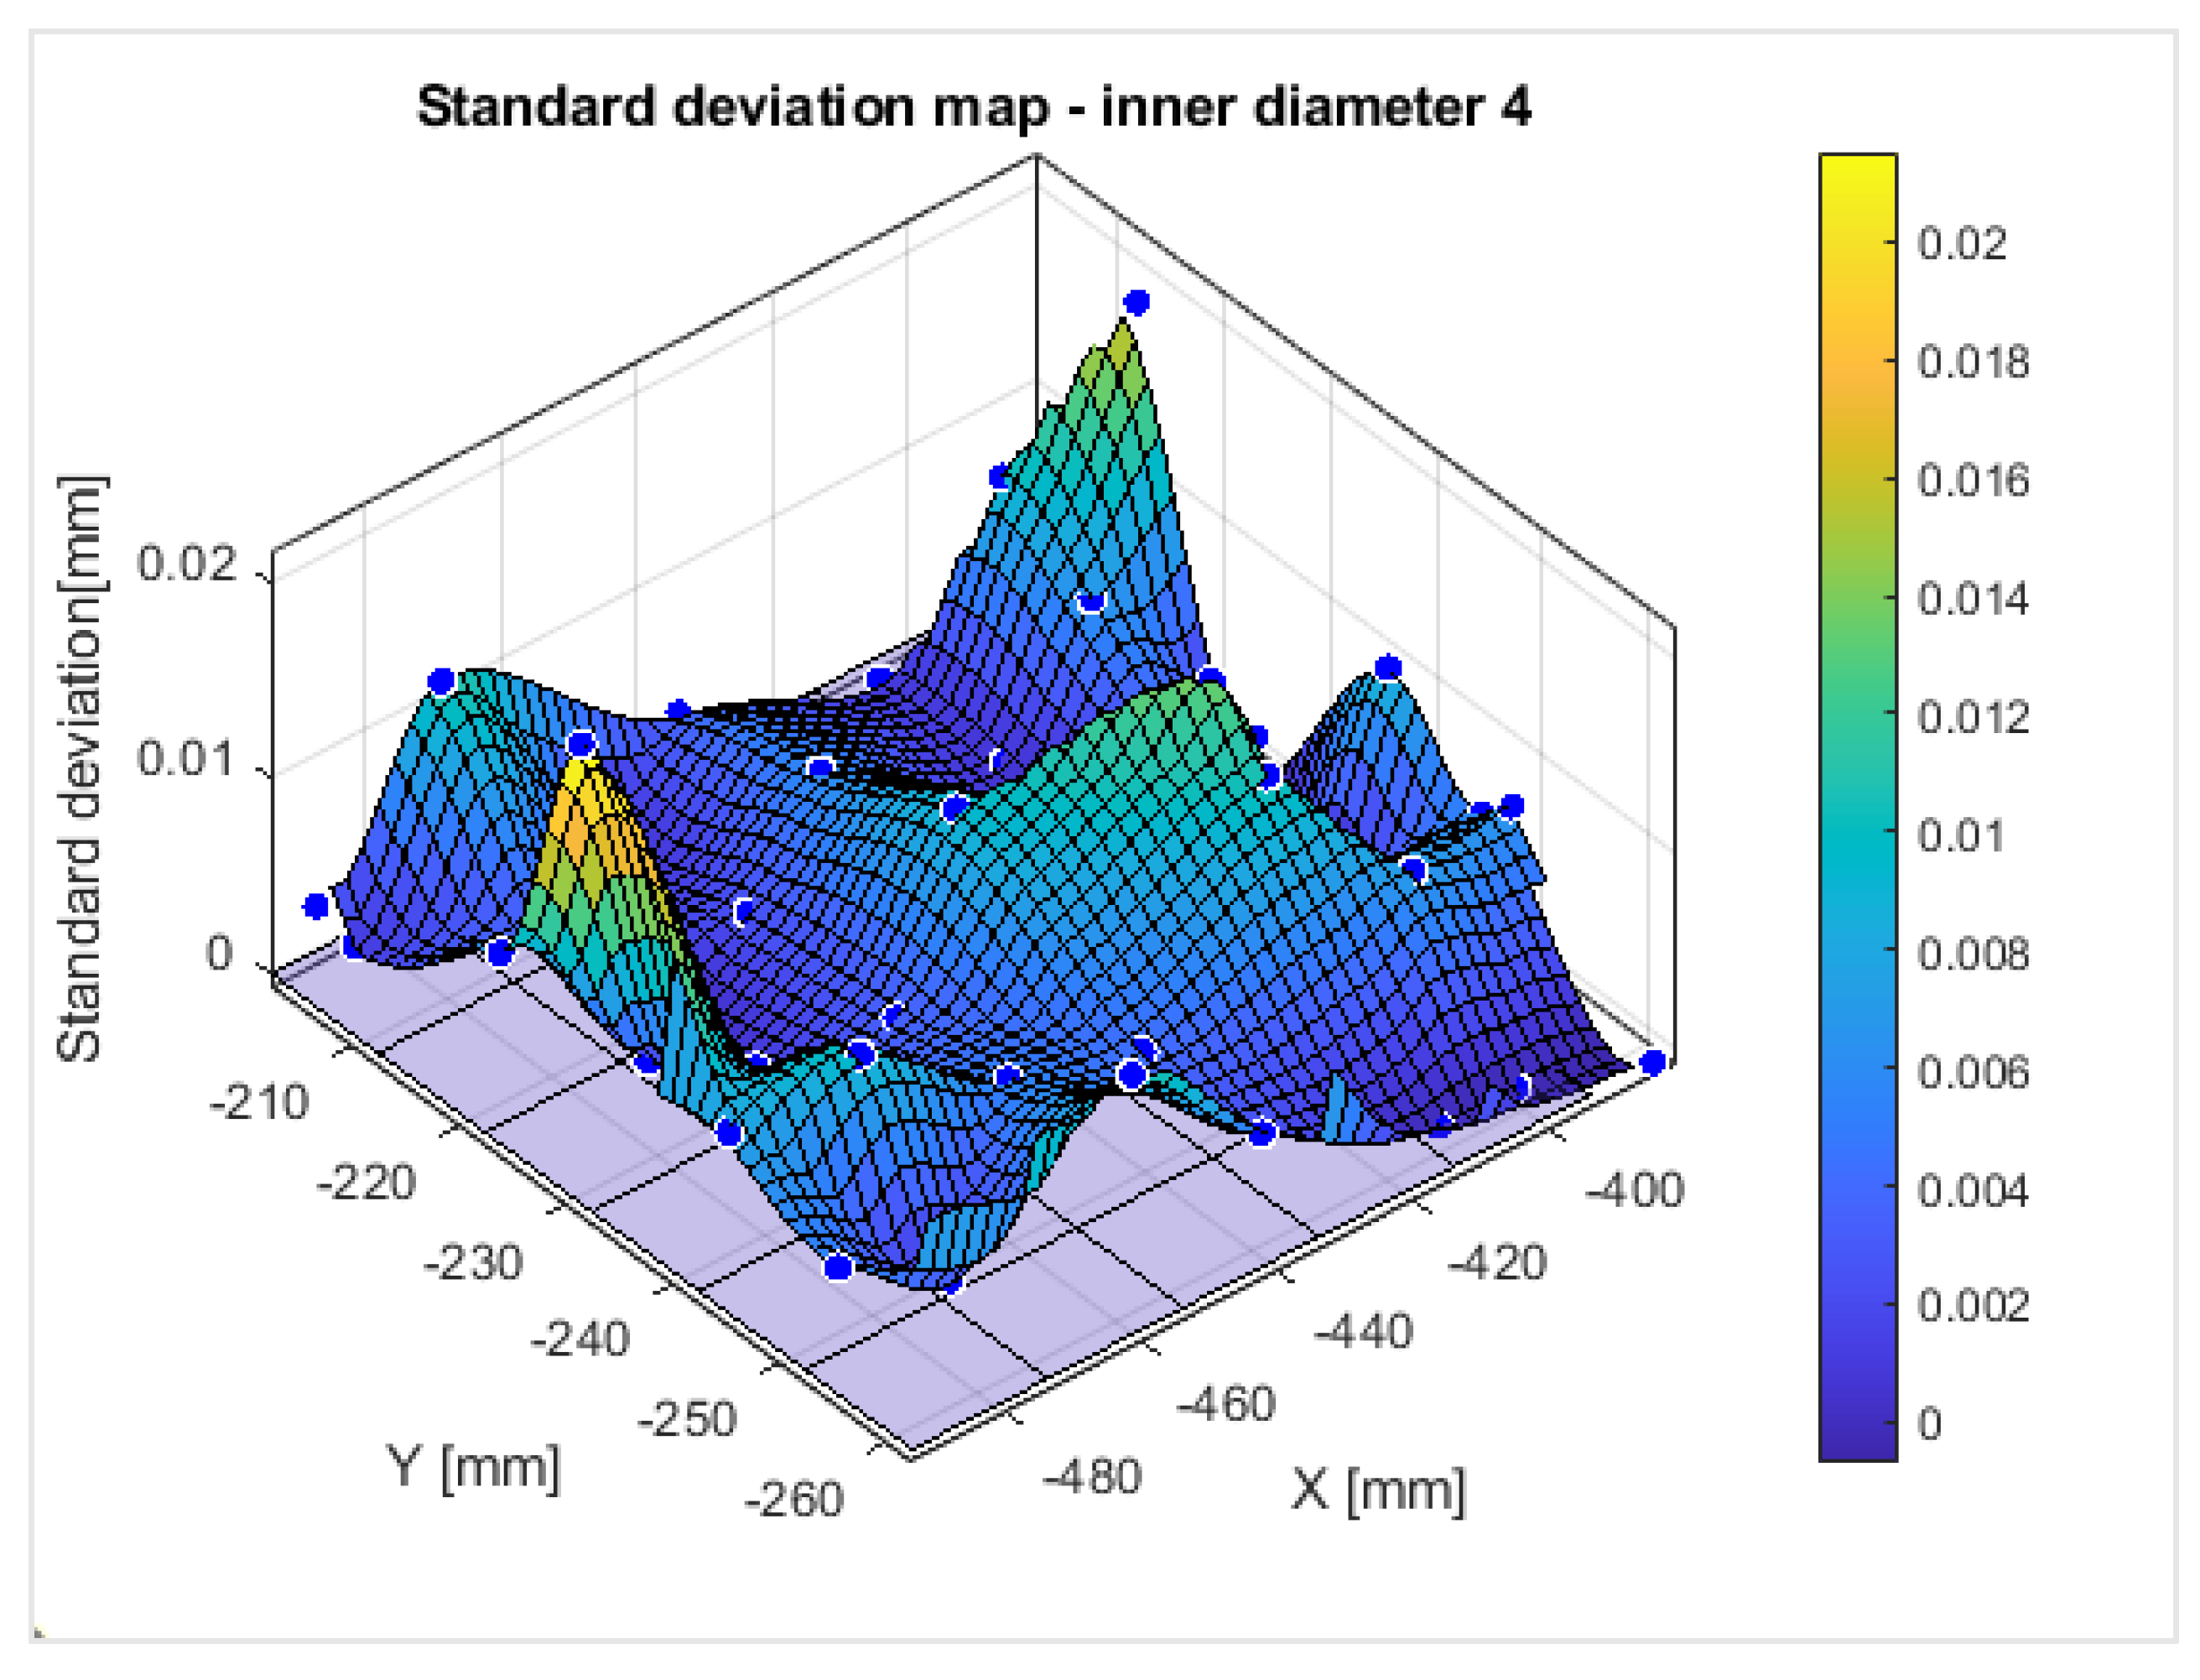
Figure 12. Hole diameter standard deviation map – 4 (without backlight lighting).
Preprints 100865 g024
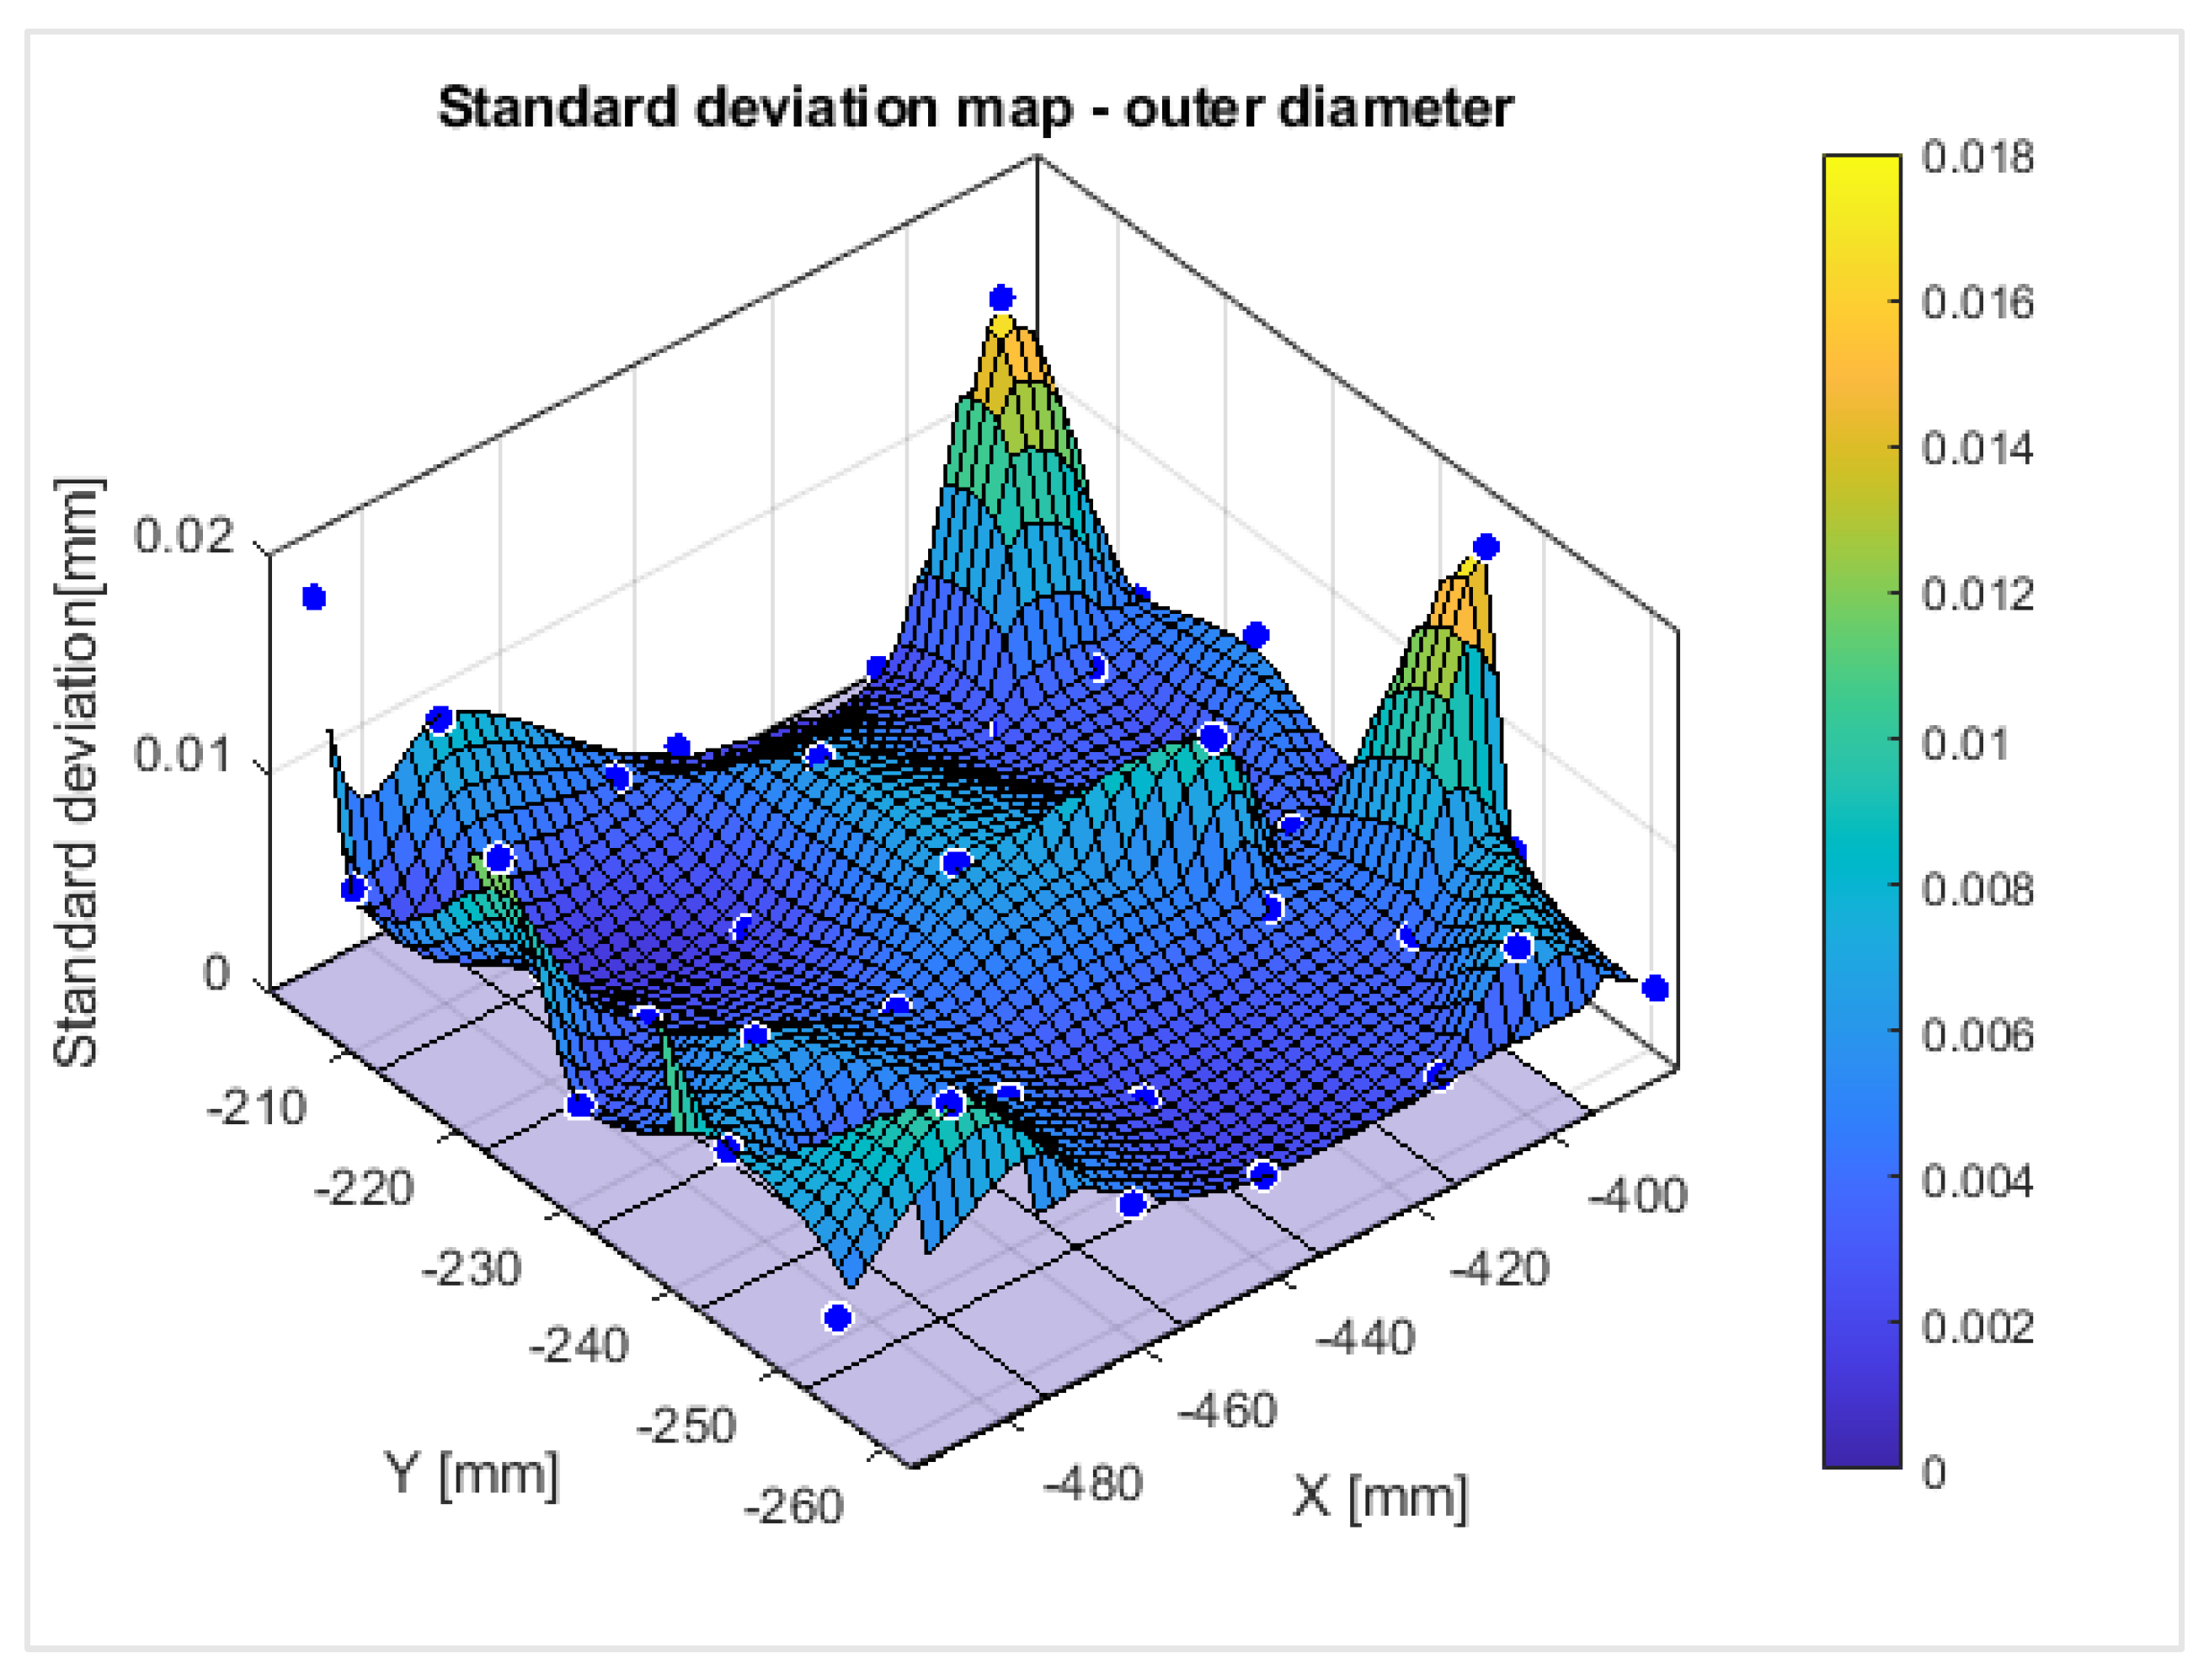
Figure 13. Map of the standard deviation of the outer diameter of the workpiece (without baklight lighting).
Preprints 100865 g025
Table 5. Results of measurements of the external diameter of the detail and the diameters of internal holes (with backlight lighting).
Feature Mean value [mm] Average absolute error [mm] Medium relative error [%] Standard deviation [mm] Standard uncertainty [mm]
1 10.01346 0.01346 0.13500 0.04093 0.00647
2 10.00943 0.00943 0.09400 0.04007 0.00634
3 9.99865 0.00135 0.01400 0.04293 0.00679
4 10.02750 0.02750 0.27500 0.03953 0.00625
5 100.10132 0.10132 0.10100 0.40595 0.06419
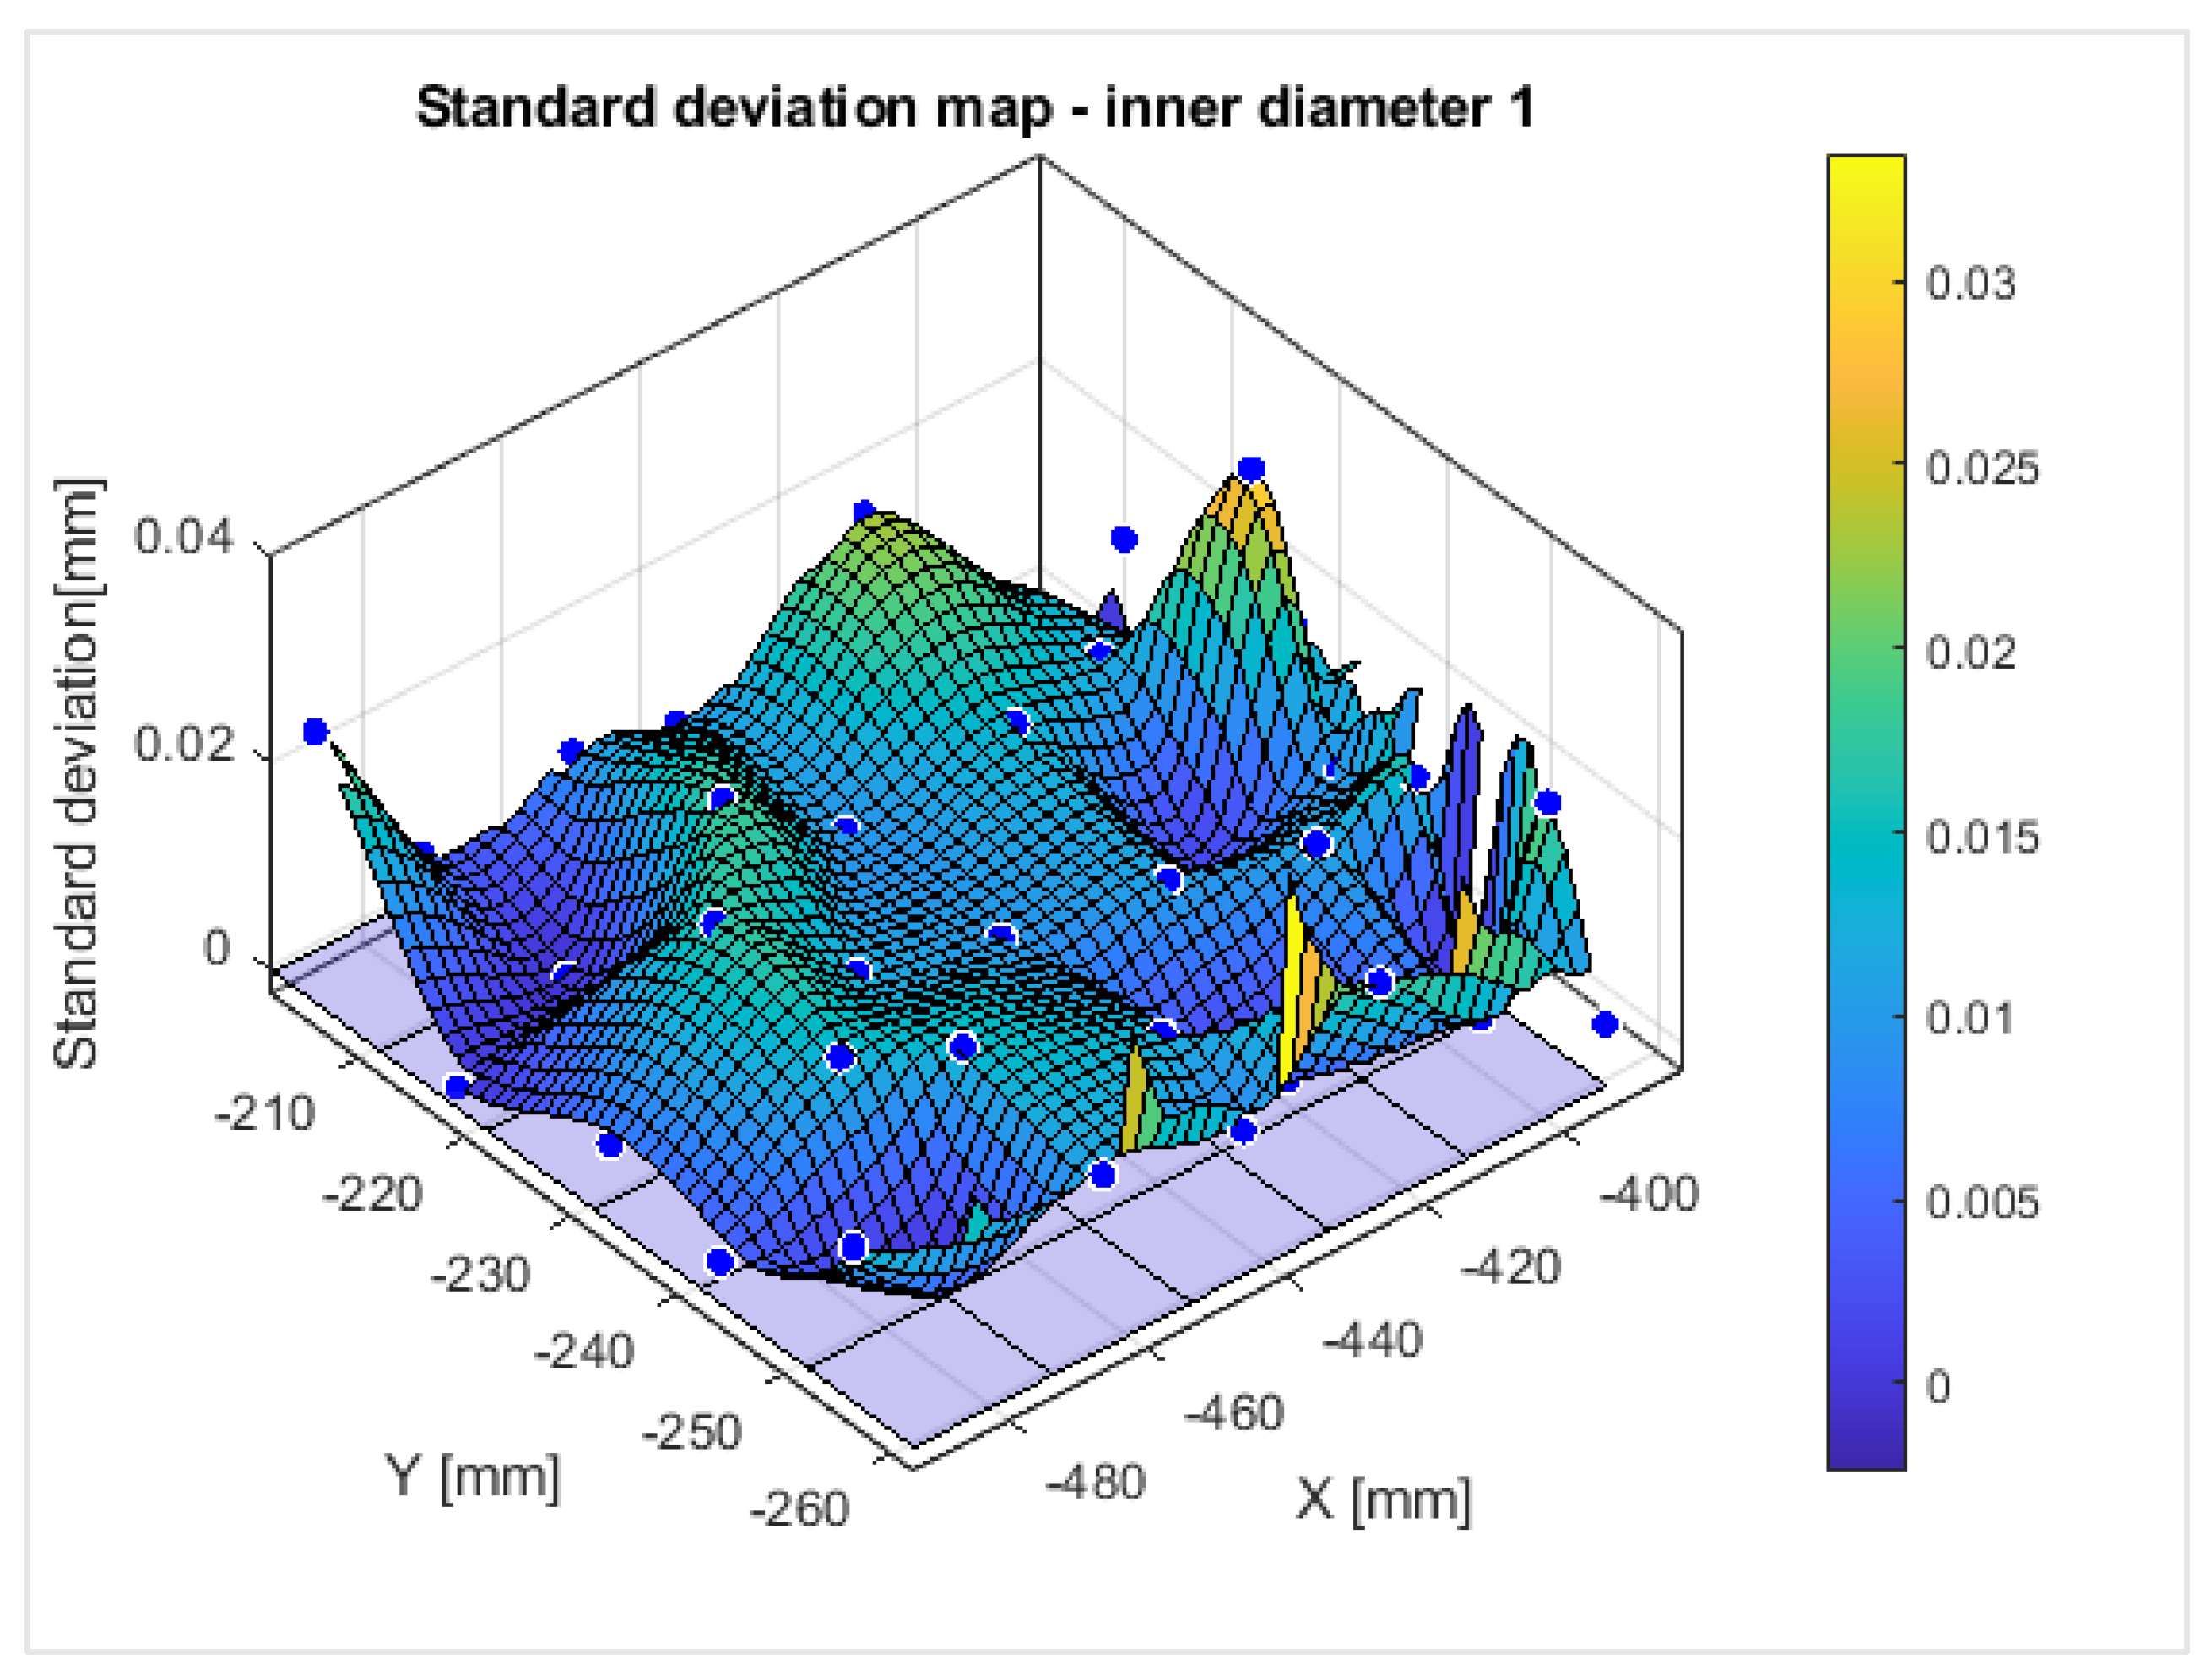
Figure 14. Hole diameter standard deviation map – 1 (backlight lighting).
Preprints 100865 g026
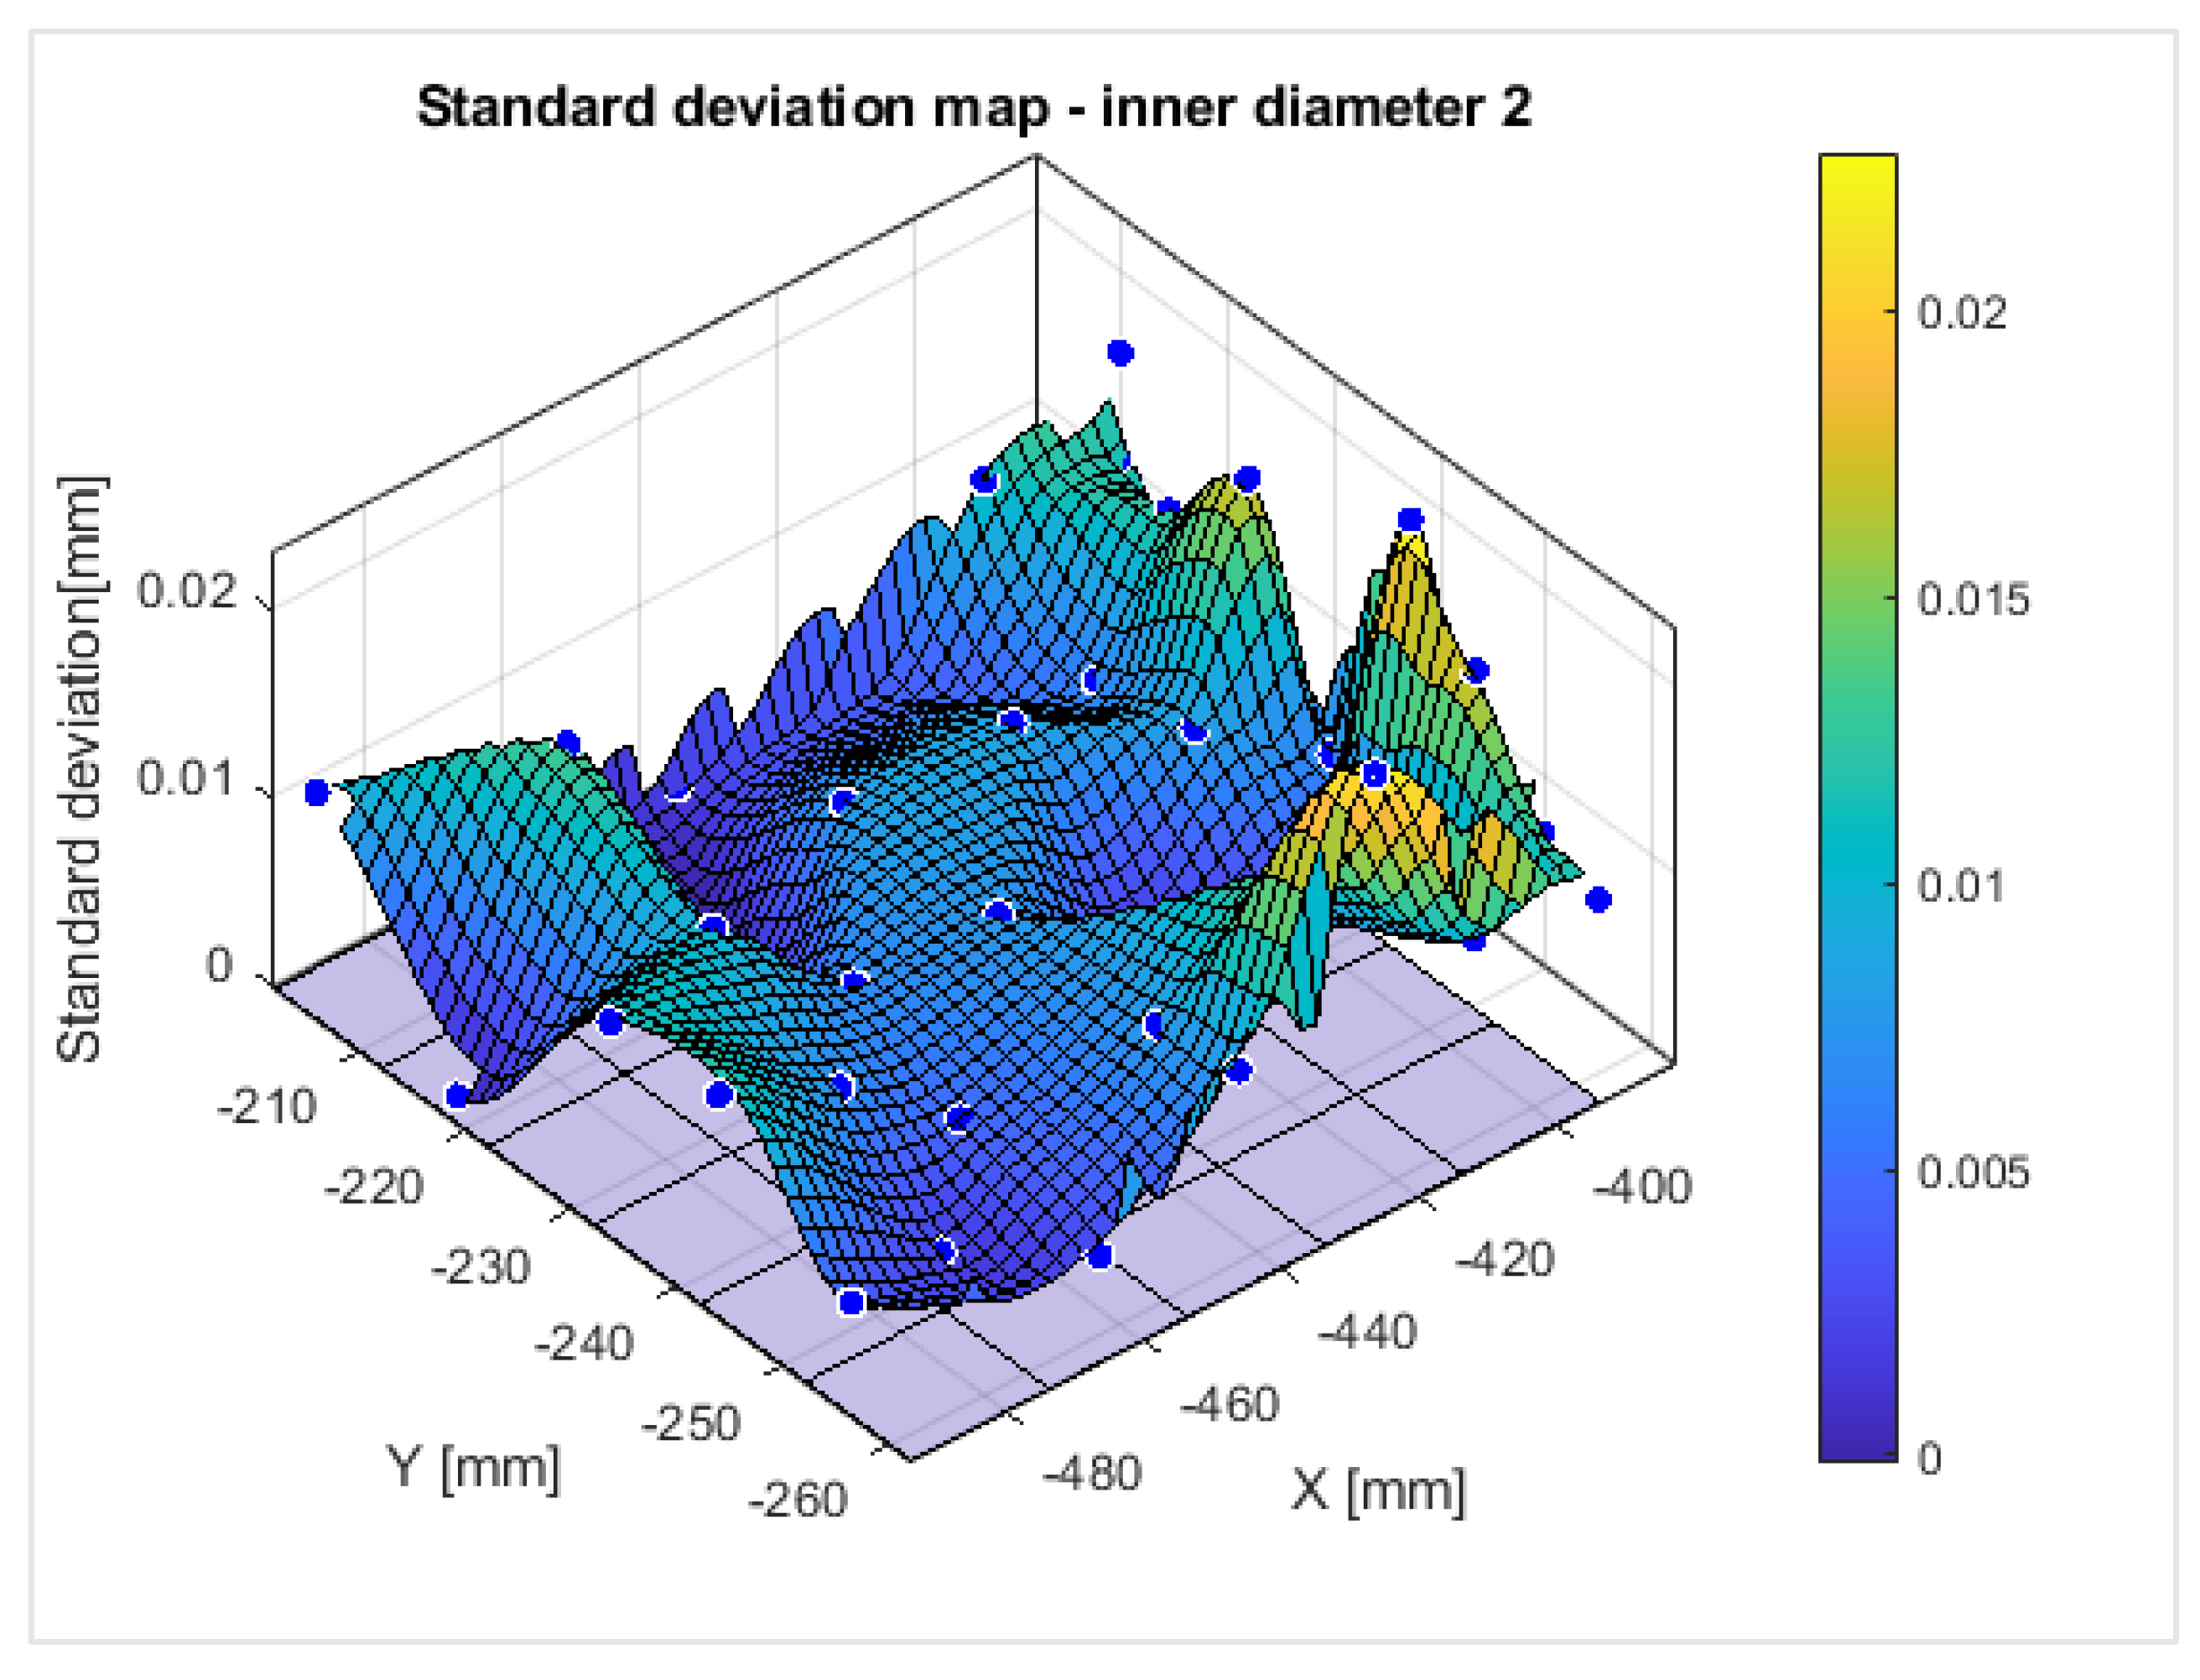
Figure 15. Hole diameter standard deviation map – 2 (backlight lighting).
Preprints 100865 g027
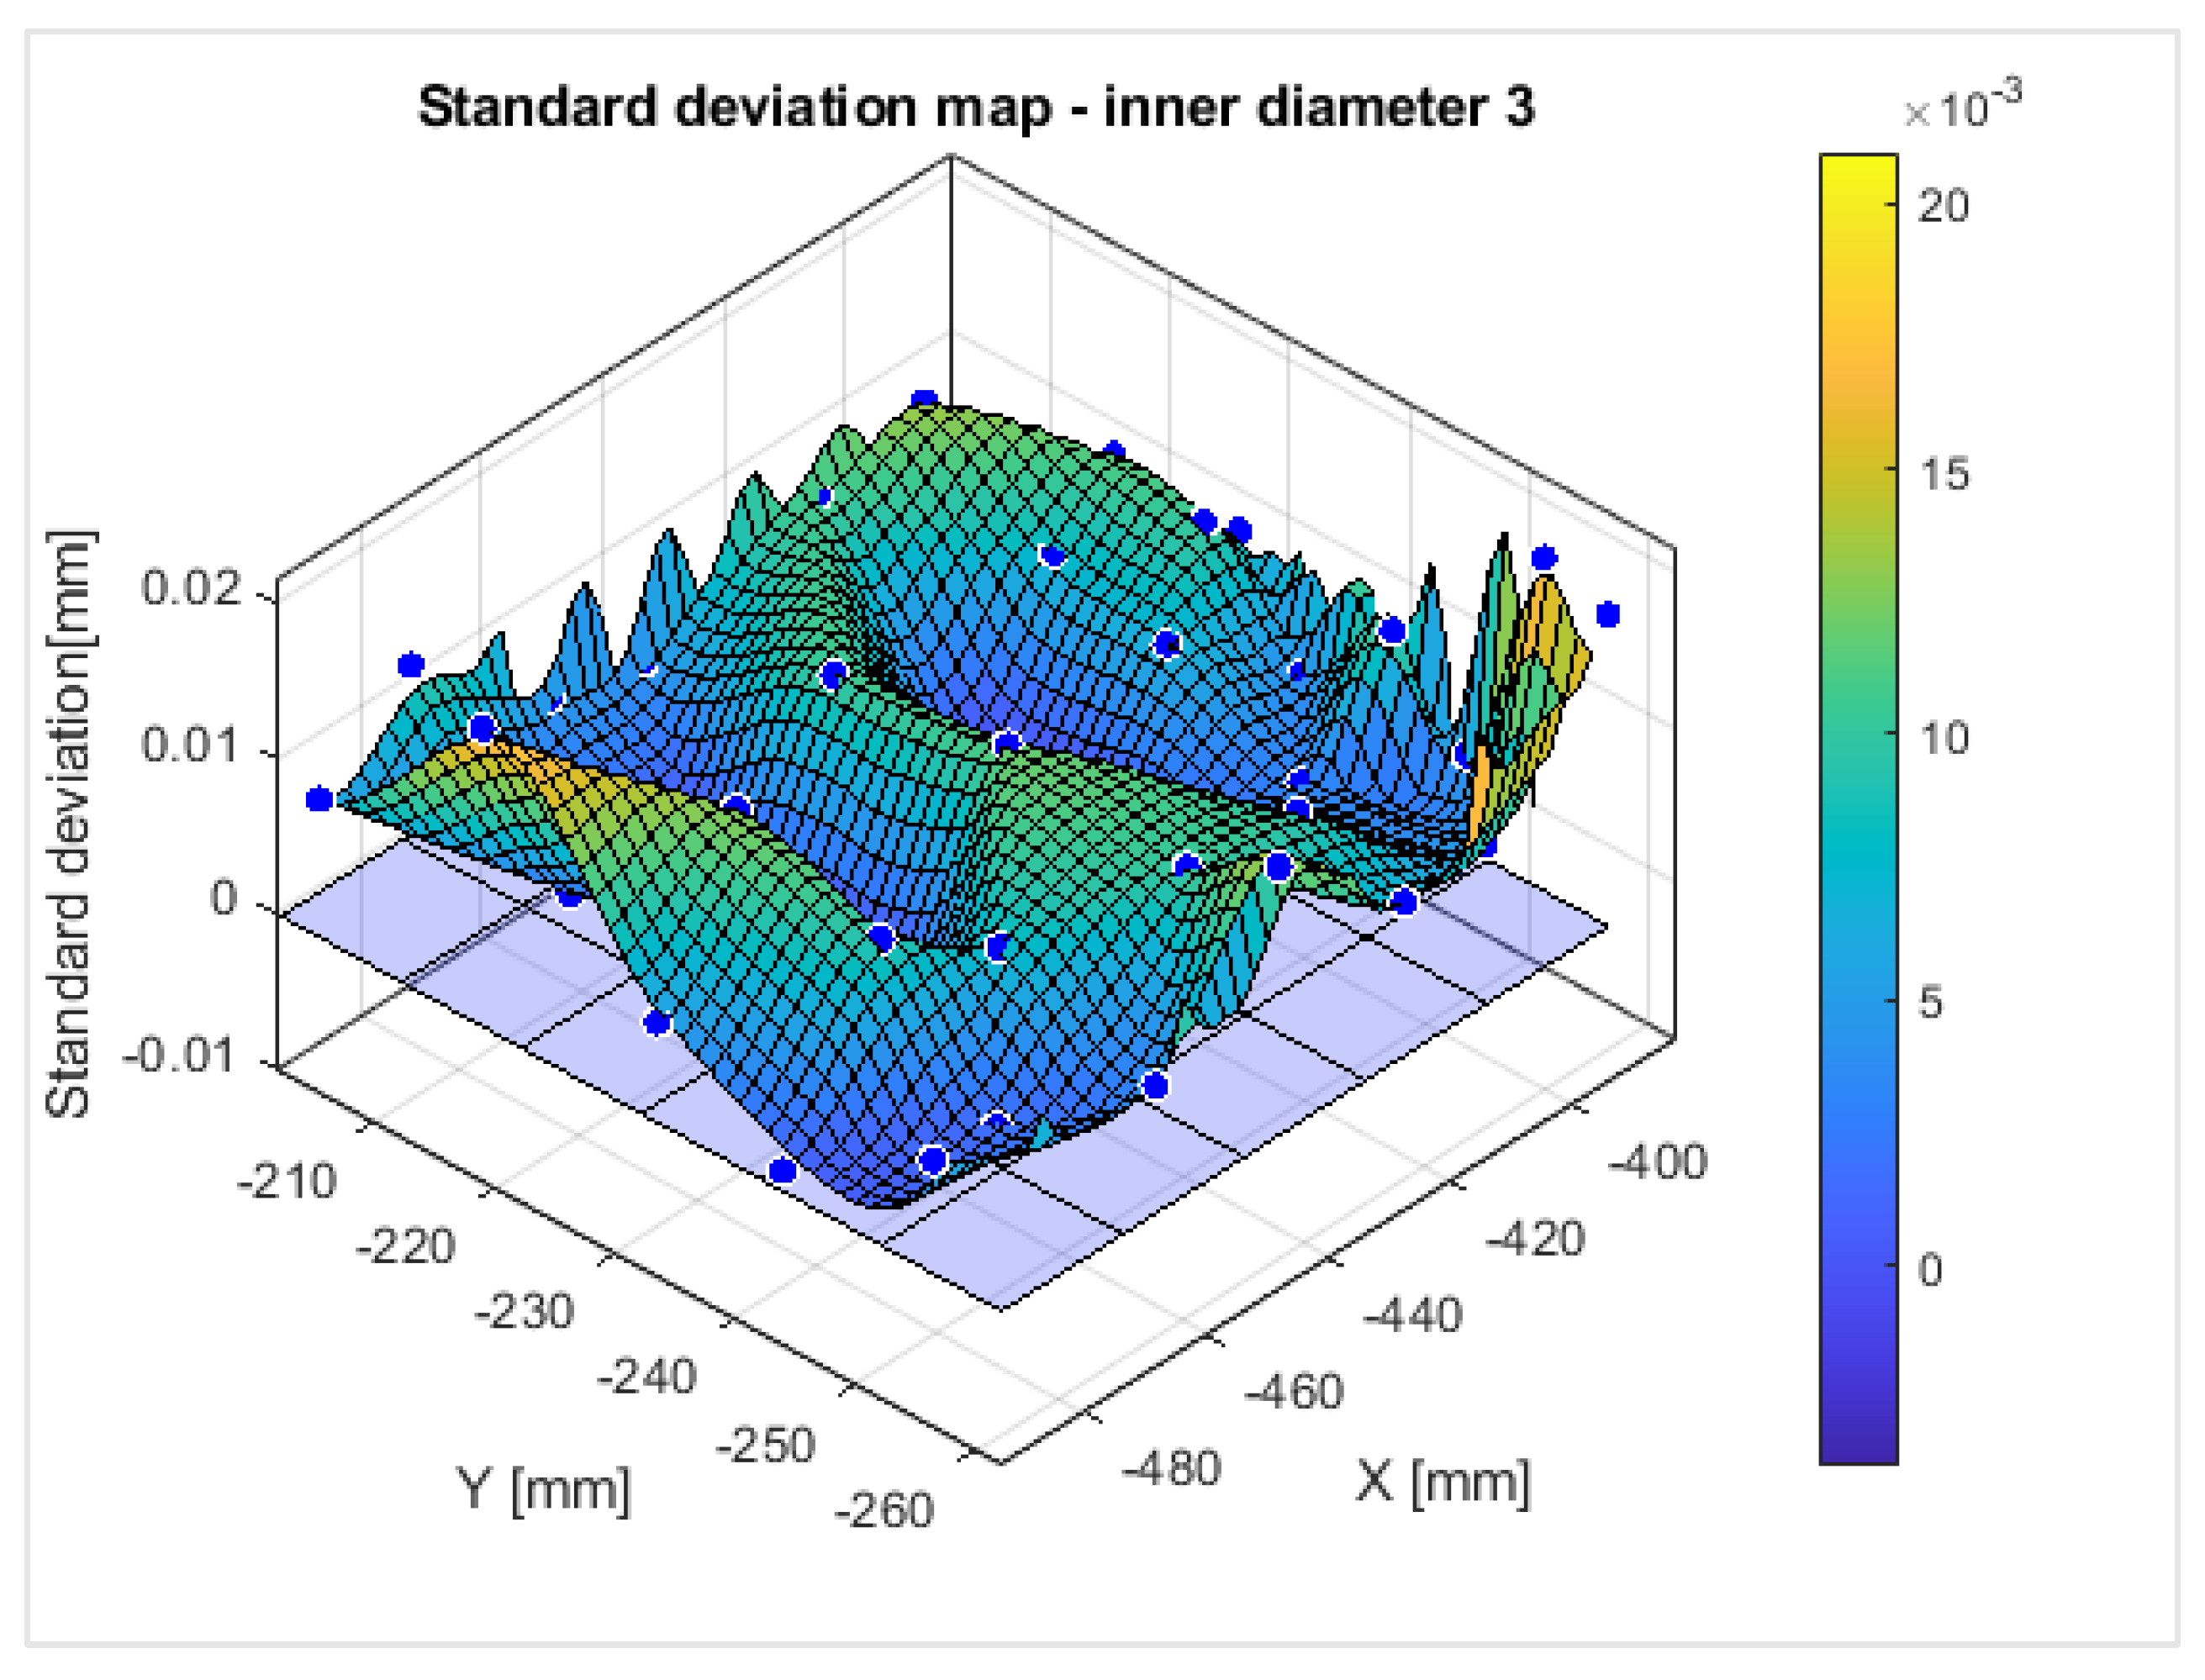
Figure 16. Hole diameter standard deviation map – 3 (backlight lighting).
Preprints 100865 g028
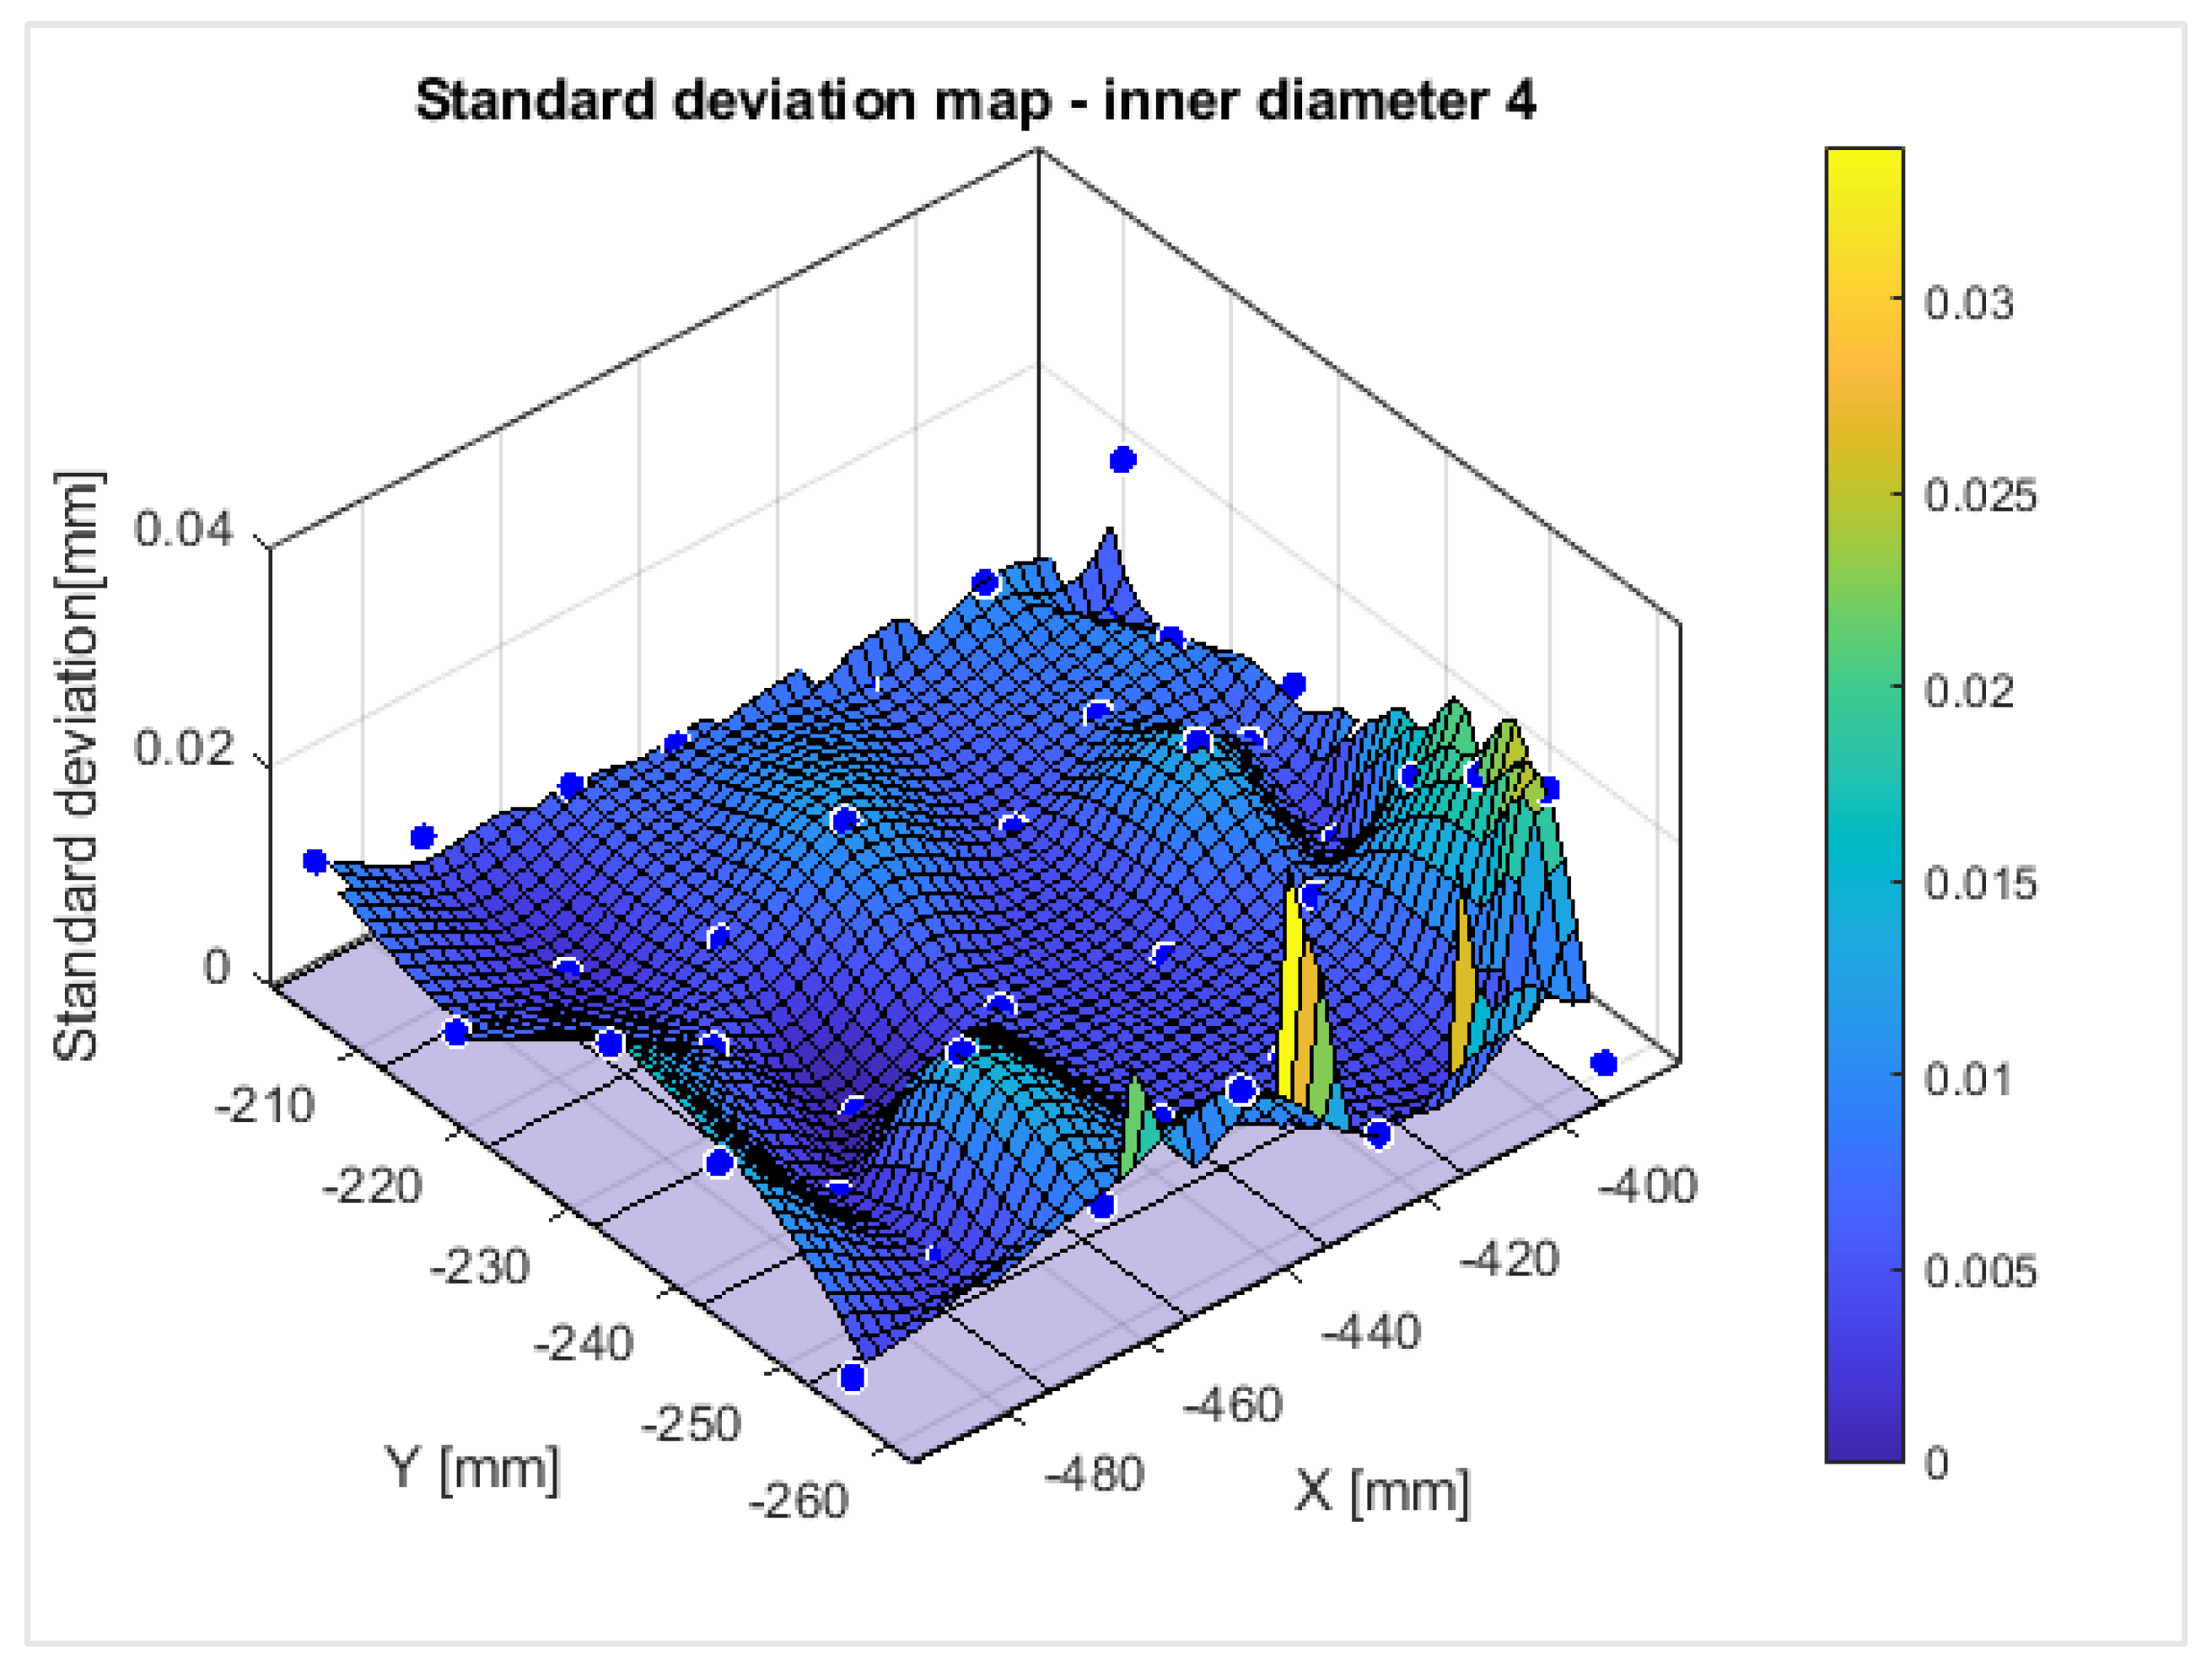
Figure 17. Hole diameter standard deviation map – 4 (backlight lighting).
Preprints 100865 g029
Figure 18. Standard deviation map of workpiece outer diameter (backlight lighting).
Preprints 100865 g030
Analyzing the obtained results (Error! Reference source not found.. – Error! Reference source not found..) it can be seen that additional (backlight) lighting significantly improved the average accuracy and repeatability of the vision system, whereas in the case of no lighting, the average accuracy is estimated at the level of 0.325 mm, and for backlight – 0.031mm.

6. Integration of the Developed System

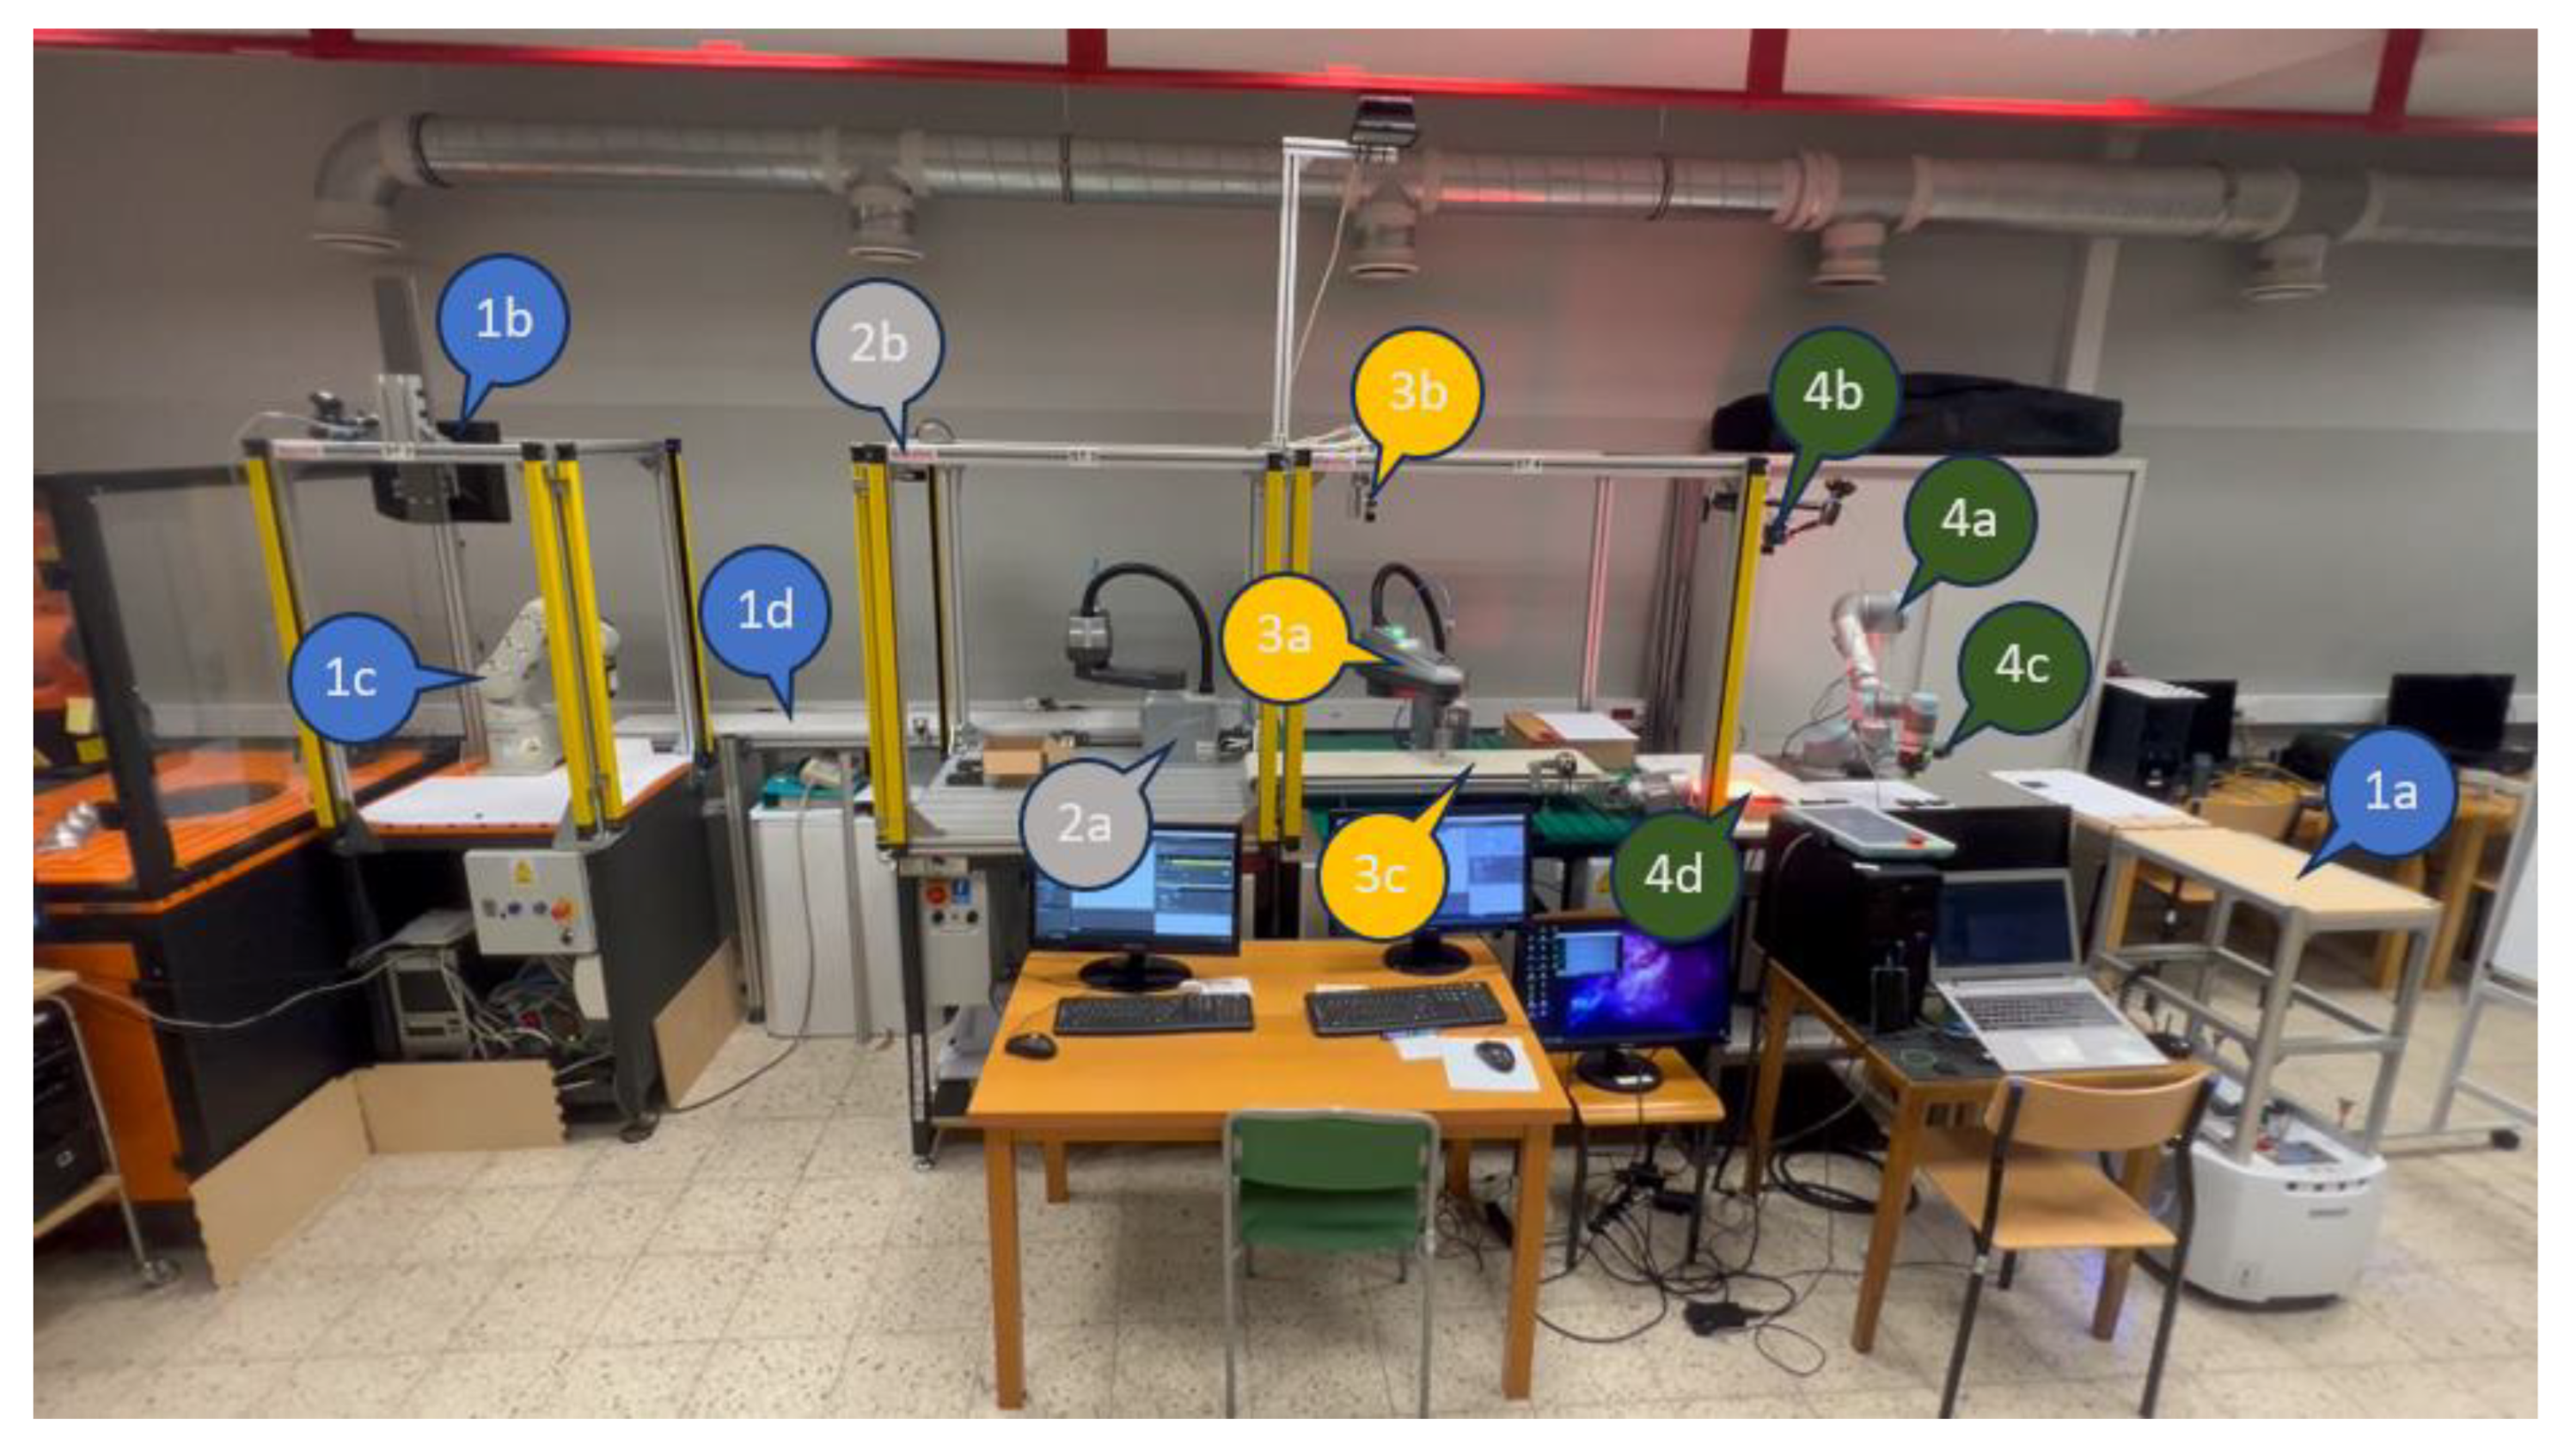
The chapter briefly describes the components of individual stations that make up the robotic line. The communication model between stations adjacent to the integrated Cobot station is described, and a view of the actual line with an indication of the crucial components is illustrated.
The analyzed robotic line is built on the basis of four robotic stations:
  • Station I
  • The stand is equipped with:
    • OMRON LD-90 mobile robot
    • Scorpion 3D Stinger stereo vision system
    • Mitsubishi RV-2AJ stationary robot
    • a conveyor belt constituting a transport route between stations Ι and ΙΙ
  • Station II
  • The stand is equipped with:
    • SCARA robot, OMRON i4-550L,
    • Basler acA1600-60gm camera
    • bright field lighting.
  • Station III
  • The stand is equipped with:
    • SCARA robot OMRON i4-550L,
    • Basler acA1300-60gm camera
    • a conveyor belt.
  • Station IV
A detailed description of the position is included in Chapter 4. (4. System architecture)
Within the framework of the integration of the described station with neighboring stations, in the case of the SCARA robot (i4-550L, Figure 31 and Figure 32 ‘3a’), a wired Ethernet connection between robot controllers and a connection of individual inputs/outputs of robot controllers (digital_in0, digital_out0, on the side of the UR5 robot controller) were provided. As part of the Ethernet connection, the TCP/IP protocol was employed to exchange data regarding subsequent items from the unloading section and digital inputs/outputs to manage access to the collision zone. In the case of the mobile robot, a wireless connection was deployed using the WiFi protocol through distributed WiFi I/O modules connecting the inputs/outputs of robot controllers (digital_in2, digital_out1, on the side of the UR5 robot controller). The previously mentioned enabled the synchronization of the part loading process.
Below is a schematic diagram of the developed communication model Error! Reference source not found., and a view of the actual robotic line, with descriptions of the individual components Error! Reference source not found..
Figure 19. Communication diagram, for integration of station IV (UR5).
Preprints 100865 g031
Figure 20. View of the actual robotic line. 1a - OMRON LD-90, 1b - Scorpion Stinger 3D, 1c - Mitsubishi RV-2AJ, 1d – conveyor belt, 2a - OMRON i4-550L, 2b - Basler acA1600-60gm camera and bright field illuminator, 3a - OMRON i4-550L, 3b – Basler acA1300-60gm camera, 3c- conveyor belt, 4a – UR5 CB2, 4b – Mako G-125B, 4c – SAVIO CAK-01, 4d – backlight.
Preprints 100865 g032
The robotic line operation algorithm assumes the implementation of the task in two iterations of a closed work cycle, during which specific groups of details are rejected at each station (each station is responsible for analyzing one of the geometric features of the detail). As part of cooperation with neighboring stations, the designed Cobot station performed the following tasks:
  • transporting elements from the storage area of the third station and, after completing the visual analysis process, placing them in the local storage area.
  • transporting elements from the local warehouse area to the LD-90 mobile robot. From where the details go back to the beginning of the line.
  • handling the collision zone occurring in the area of collecting elements from the SCARA robot.

7. Conclusion

The paper delineates a robotic quality control station and the hardware-software architecture of the UR5 cobot vision system based on a PC, Python language, and OpenCV libraries. The proposed solution based on the UR cobot’s vision system with two independent and different cameras (one permanently mounted and the other in the cobot flange) broadens existing robotic quality control applications.
The plotted error maps reveal that the error distribution is not constant throughout the camera’s field of view. The values of the determined relative and absolute errors, standard deviation estimators, and measurement uncertainties showed the influence of the detail’s location on the accuracy and repeatability of the measurements.
Comparing the results obtained for the case of using backlight lighting and its absence, a significant improvement in measurement accuracy can be noticed. For the case of no backlight lighting, the average accuracy is estimated at 0.325 mm, for backlight - 0.031 mm.
The results confirm that measurements of objects located closest to the camera’s optical axis have the smallest errors. This may be caused by camera calibration errors and distortions (image distortions introduced by the optical path).
Functional tests of the developed vision algorithms and communication libraries did not uncover any disturbances or problems in operation. The results obtained during a series of measurements did not reveal any deviations from the accepted tolerances. Tests of the integrated robotic line also did not manifest any problems in operation, both in the designed communication and software layers.

Author Contributions

Conceptualization, P.K.; methodology, P.K. and K.S.; software, K.S.; validation, P.K. and K.S.; formal analysis, P.K. and K.S.; investigation, K.S. and P.K; writing—original draft preparation, P.K. and K.S.; writing—review and editing P.K. and K.S.; visualization, K.S.; supervision, P.K. All authors have read and agreed to the published version of the manuscript.

Funding

The work was carried out as part of research conducted at the Robotic Laboratory, Department of Robotics and Mechatronics, Faculty of Mechanical Engineering and Robotics, AGH University of Krakow.

Institutional Review Board Statement

Not applicable.

Informed Consent Statement

Not applicable.

Data Availability Statement

The data presented in this study are available on request from the corresponding author

Conflicts of Interest

The authors declare no conflicts of interest

References

  1. Rad, F.F.; Oghazi, P.; Palmié, M.; Chirumalla, K.; Pashkevich, N.; Patel, P.C.; Sattari, S. Industry 4.0 and supply chain performance: A systematic literature review of the benefits, challenges, and critical success factors of 11 core technologies. Ind. Market. Manag. 2022, 105, 268–293. [CrossRef]
  2. Cohen, Y.; Shoval, S.; Faccio, M.; Minto, R. Deploying cobots in collaborative systems: major considerations and productivity analysis. Int. J. Prod. Res. 2022, 60, 1815–1831. [CrossRef]
  3. Tsolakis, N.; Bechtsis, D.; Srai, J.S. Intelligent autonomous vehicles in digital supply chains: From conceptualisation, to simulation modelling, to real-world operations. Busin. Proc. Manag. J. 2019, 25, 414–437. [Google Scholar] [CrossRef]
  4. Weiss, A.; Wortmeier, A.K.; Kubicek, B. Cobots in Industry 4.0: A Roadmap for Future Practice Studies on Human-Robot Collaboration. IEEE Trans. Hum.-Mach. Sys. 2021, 51, 335–345. [Google Scholar] [CrossRef]
  5. El Zaatari, S.; Marei, M. , Li, W.; Usman, Z. Cobot programming for collaborative industrial tasks: An overview. Rob. Auton. Sys. 2019, 116, 162–180. [Google Scholar] [CrossRef]
  6. Kohut, P. Kohut, P. Metody wizyjne w robotyce (cz.I). Przeg. Spaw.-Weld. Tech. Rew. 2008, 80, 21–25. [Google Scholar]
  7. Gollapudi, S. Learn Computer Vision Using OpenCV with Deep Learning CNNs and RNNs; Springer: Berlin/Heidelberg, Germany, 2019; pp. 31–50. [Google Scholar]
  8. Zhang, Z. A Flexible New Technique for Camera Calibration. IEEE Trans. Pat. Analys. Mach. Intel. 2000, 22, 1330–1334. [Google Scholar] [CrossRef]
  9. Heikkila, J.; Silven, O. A Four-step Camera Calibration Procedure with Implicit Image Correction. In Proceedings of the IEEE International Conference on Computer Vision and Pattern Recognition; 1997; pp. 1106–1112. [Google Scholar]
  10. Salvi, J.; Armangué, X.; Batlle, J. A comparative review of camera calibrating methods with accuracy evaluation. Pat. Rec. 2002, 35, 1617–1635. [Google Scholar] [CrossRef]
  11. Wen-Long, L.; He, X.; Gang, Z.; Si-Jie, Y.; Zhou-Ping, Y. Hand–Eye Calibration in Visually-Guided Robot Grinding. IEEE Trans Cyb. 2016, 46, 2634–2642. [Google Scholar]
  12. Driels, M.R.; Swayze, W.; Potter, S. Full-pose calibration of a robot manipulator using a coordinate-measuring machine. Int. J. Adv. Manuf. Technol. 1993, 8, 34–41. [Google Scholar] [CrossRef]
  13. Amy, T.; Khalil, M.A.Y. Solving the Robot-World Hand-Eye(s) Calibration Problem with Iterative Methods. Mach. Vis. App. 2017, 28, 569–590. [Google Scholar]
  14. Sładek, J.; Ostrowska, K.; Kohut, P.; Holak, K.; Gąska, A.; Uhl, T. Development of a vision based deflection measurement system and its accuracy assessment. Measure 2013, 46, 1237–1249. [Google Scholar] [CrossRef]
  15. Zhang, Z.; Gao, H.; Han, Q.; Huang, R.; Rong, J.; Wang, Y. Hand-eye calibration in robot welding of Aero tube. J. Shanghai Jiaotong Univ. 2015, 49, 392–394. [Google Scholar]
  16. Sakshi, Vinay, K. Segmentation and Contour Detection for handwritten mathematical expressions using OpenCV. In Proceedings of the 2022 International Conference on Decision Aid Sciences and Applications (DASA); 2022; 56, pp. 7047–7135.
  17. Raymond, J.M.; Alexa, R.F.; Armil, M.; Jonrey, R.; Apduhan, J.C. Blood Cells Counting using Python OpenCV. In Proceedings of the 2018 14th IEEE International Conference on Signal Processing (ICSP); 2019; pp. 50–53. [Google Scholar]
  18. Antoine Manzanera1; Thanh Phuong Nguyen; Xiaolei Xu. Line and circle detection using dense one-to-one Hough transforms on greyscale images. EURASIP J. Image Video Process. 2016, 34, 1773.
  19. Frazer, K.N. Comparison of OpenCV’s feature detectors and feature matchers. In Proceedings of the 23rd International Conference on Mechatronics and Machine Vision in Practice (M2VIP); 2016; pp. 1–6. [Google Scholar]
  20. Cagri Kaymak; Aysegul Ucar. Implementation of Object Detection and Recognition Algorithms on a Robotic Arm Platform Using Raspberry Pi. In Proceedings of the International Conference on Artificial Intelligence and Data Processing (IDAP); 2018; pp. 1–8.
  21. Basavaraj, M.U.; Raghuram, H. Real Time Object Distance and Dimension Measurement using Deep Learning and OpenCV. In Proceedings of the Third International Conference on Artificial Intelligence and Smart; 2023; pp. 929–932. [Google Scholar]
  22. Chaohui Lü, Xi Wang; Yinghua Shen. A stereo vision measurement system Based on OpenCV. In Proceedings of the 6th International Congress on Image and Signal Processing (CISP); 2016; 2, pp. 718–722.
  23. Korta, J.; Kohut, P.; Uhl, T. OpenCV based vision system for industrial robot-based assembly station: calibration and testing. Pom. Aut. Kont. 2014, 60, 35–38. [Google Scholar]
  24. Kohut, P.; Holak, K.; Martowicz, A.; Uhl, T. Experimental assessment of rectification algorithm in vision-based deflection measurement system, Nondest. Test. Eval. 2017, 32, 200–226. [Google Scholar] [CrossRef]
  25. Taksaporn, I.; Suree, P. Feature Detection and Description based on ORB Algorithm for FPGA-based Image Processing. In Proceedings of the 9th International Electrical Engineering Congress (iEECON); 2021; pp. 420–423. [Google Scholar]
  26. Sadaf, A. A Review on SIFT and SURF for Underwater Image Feature Detection and Matching. In Proceedings of the IEEE International Conference on Electrical, Computer and Communication Technologies (ICECCT); 2019; pp. 1–4. [Google Scholar]
  27. Chen Zhihong; Zou Hebin; Wang Yanbo; Liang Binyan; Liao Yu. A Vision-based Robotic Grasping System Using Deep Learning for Garbage Sorting. In Proceedings of the 36th Chinese Control Conference (CCC); 2017; pp. 11223–11226.
  28. Huczala, D.; Ošcádal, P.; Spurný, T.; Vysocký, A.; Vocetka, M.; Bobovský, Z. Camera-Based Method for Identification of the Layout of a Robotic Workcell. App. Sci. 2020, 10, 7679. [Google Scholar] [CrossRef]
  29. Cañas, J.M.; Perdices, E.; García-Pérez, L.; Fernández-Conde, J. A ROS-based open tool for intelligent robotics education. Appl. Sci. 2020, 10, 1–20. [Google Scholar] [CrossRef]
  30. Vivas, V.; Sabater, J.M. UR5 Robot Manipulation using Matlab/Simulink and ROS. In Proceedings of the IEEE International Conference on Mechatronics and Automation (ICMA); 2021; pp. 338–343. [Google Scholar]
  31. Prezas, L.; Michalos, G.; Arkouli, Z.; Katsikarelis, A.; Makris, S. AI-enhanced vision system for dispensing process monitoring and quality control in manufacturing of large parts. Procedia CIRP 2022, 107, 1275–1280. [Google Scholar] [CrossRef]
  32. Rokhim, I.; Ramadhan, N.J.; Rusdiana, T. Image Processing based UR5E Manipulator Robot Control in Pick and Place Application for Random Position and Orientation of Object. In Proceedings of the International Symposium on Material and Electrical Engineering Conference (ISMEE); 2021; pp. 124–130. [Google Scholar]
  33. Albert Olesen; Benedek Gergaly; Emil Ryberg; Mads Thomsen; Dimitrios Chrysostomou. A Collaborative Robot Cell for Random Bin-Picking Based on Deep Learning Policies and a Multi-Gripper Switching Strategy. In Proceedings of the 30th International Conference on Flexible Automation and Intelligent Manufacturing (FAIM2021); 2021; 51, pp. 3–10.
  34. Sijin Luo; Yu Liang, Zhehao Luo; Guoyuan Liang; Can Wang, Xinyu Wu. Vision-Guided Object Recognition and 6D Pose Estimation System Based on Deep Neural. Network for Unmanned Aerial Vehicles towards Intelligent Logistics. App. Sci. 2022, 13, 115. [CrossRef]
  35. Lisowski, W.; Kohut, P. A Low-Cost Vision System in Determination of a Robot End-Effector’s Positions. Pom Aut. Rob. 2017, 21, 5–13. [Google Scholar] [CrossRef]
  36. Holak, K.; Cieslak, P.; Kohut, P.; Giergiel, M. A vision system for pose estimation of an underwater robot. J Mar. Eng. Tech. 2022, 21, 234–248. [Google Scholar] [CrossRef]
  37. OMRON Automation. Available online: https://automation.omron.com (accessed on 22 February 2024).
  38. FANUC | The Factory Automation Company. Available online: https://www.fanuc.eu (accessed on 22 February 2024).
  39. COGNEX - In-Sight 2D Robot Guidance for Universal Robots. Available online: https://www.cognex.com/programs/urcap-solution (accessed on 22 February 2024).
  40. Comari, S.; Di Leva, R.; Carricato, M.; Badini, S.; Carapia, A.; Collepalumbo, G.; Gentili, A.; Mazzotti, C.; Staglianò, K.; Rea, D. Mobile cobots for autonomous raw-material feeding of automatic packaging machines. J. Manufac. Sys. 2022, 64, 211–224. [Google Scholar] [CrossRef]
  41. Ramasubramanian, A.K.; Papakostas, N. Operator - Mobile robot collaboration for synchronized part movement. Procedia CIRP 2020, 97, 217–223. [Google Scholar] [CrossRef]
  42. Feng, C.; Xiao, Y.; Willette, A.; McGee, W.; Kamat, V.R. Vision guided autonomous robotic assembly and as-built scanning on unstructured construction sites. Autom. Constr. 2015, 59, 128–138. [Google Scholar] [CrossRef]
  43. Yousif, K.; Bab-Hadiashar, A.; Hoseinnezhad, R. An Overview to Visual Odometry and Visual SLAM: Applications to Mobile Robotics. Intellig. Ind. Sys. 2015, 1, 289–311. [Google Scholar] [CrossRef]
  44. Shahzad, A.; Gao, X.; Yasin, A.; Javed, K.; Anwar, S.M. A vision-based path planning and object tracking framework for 6-DOF robotic manipulator. IEEE Acc. 2020, 8, 203158–203167. [Google Scholar] [CrossRef]
  45. Nitka, A.; Sioma, A. Design of an automated rice grain sorting system using a vision system. In Proceedings of the Photonics Applications in Astronomy, Communications, Industry, and High-Energy Physics Experiments 2018; Romaniuk, R.S., Linczuk, M., Eds.; SPIE: Bellingham, WA, USA, 2018. [Google Scholar]
  46. Parkot, K.; Sioma, A. In: Photonics applications in astronomy, communications, industry, and high-energy physics experiments, In Proceedings of the Photonics Applications in Astronomy, Communications, Industry, and High-Energy Physics Experiments 2018; Romaniuk, R.S., Linczuk, M., Eds. SPIE: Bellingham, WA, USA, 2018.
  47. Sioma, A.; Karwat, B. The use of 3D imaging in surface flatness control operations. Adv Sci. Techn. Res. J. 2023, 17, 335–344. [Google Scholar] [CrossRef]
  48. Iglesias, C.; Martínez, J.; Taboada, J. Automated vision system for quality inspection of slate slabs. Comp. Ind. 2018, 99, 119–129. [Google Scholar] [CrossRef]
  49. Kaushik, S.; Jain, A.; Chaudhary, T.; Chauhan, N.R. Machine vision based automated inspection approach for clutch friction disc (CFD). Mat.Tod. Proc. 2022, 62, 151–157. [Google Scholar] [CrossRef]
  50. Shen, H.; Li, S.; Gu, D.; Chang, H. Bearing defect inspection based on machine vision. Meas.: J. Inter. Meas. Confed. 2012, 45, 719–733. [Google Scholar] [CrossRef]
  51. Cinal, M.; Sioma, A.; Lenty, B. The quality control system of planks using machine vision. App. Sci. 2023, 13, 1–17. [Google Scholar] [CrossRef]
  52. John Rajan, A.; Jayakrishna, K.; Vignesh, T.; Chandradass, J.; Kannan, T.T.M. Development of computer vision for inspection of bolt using convolutional neural network. Mat.Tod. Proc. 2020, 45, 6931–6935. [Google Scholar] [CrossRef]
  53. Jiang, J.; Cao, P.; Lu, Z.; Lou, W.; Yang, Y. Surface defect detection for mobile phone back glass based on symmetric convolutional neural network deep learning. Appl. Sci. 2020, 10, 3621. [Google Scholar] [CrossRef]
  54. Montironi, M.A.; Castellini, P.; Stroppa, L.; Paone, N. Adaptive autonomous positioning of a robot vision system: Application to quality control on production lines. Rob. Comp.-Integ. Man. 2014, 30, 489–498. [Google Scholar] [CrossRef]
  55. Haleem, N.; Bustreo, M.; Del Bue, A. A computer vision based online quality control system for textile yarns. Comp. Ind. 2021, 133, 103550. [Google Scholar] [CrossRef]
  56. Wang, Z.; Li, P.; Zhang, H.; Zhang, Q.; Ye, C.; Han, W.; Tian, W. A binocular vision method for precise hole recognition in satellite assembly systems. Meas. 2023, 221, 113455. [Google Scholar] [CrossRef]
  57. Wu, D.; Sun, D.W. Colour measurements by computer vision for food quality control - A review. Trends Food Sci. Tech., 2013, 29, 5–20. [Google Scholar] [CrossRef]
  58. Sioma, A. Vision System in Product Quality Control Systems. Appl. Sci. 2023, 13, 751. [Google Scholar] [CrossRef]
  59. Universal Robots Support Website. Available online: https://www.universal-robots.com/articles/ur/interface-communication/overview-of-client-interfaces/ (accessed on 22 February 2024).
  60. Market Research Fature. Available online: https://www.marketresearchfuture.com (accessed on 22 February 2024).
  61. Bradski, G.; Kaehler, A. Learning OpenCV: Computer Vision with the OpenCV Library, O’Reilly Media, Inc. 2008. [Google Scholar]
  62. OpenCV - Open Computer Vision Library. Available online: https://opencv.org/ (accessed on 22 February 2024).
Disclaimer/Publisher’s Note: The statements, opinions and data contained in all publications are solely those of the individual author(s) and contributor(s) and not of MDPI and/or the editor(s). MDPI and/or the editor(s) disclaim responsibility for any injury to people or property resulting from any ideas, methods, instructions or products referred to in the content.
Copyright: This open access article is published under a Creative Commons CC BY 4.0 license, which permit the free download, distribution, and reuse, provided that the author and preprint are cited in any reuse.
Prerpints.org logo

Preprints.org is a free preprint server supported by MDPI in Basel, Switzerland.

Subscribe

© 2024 MDPI (Basel, Switzerland) unless otherwise stated