3.1. Single Tracks
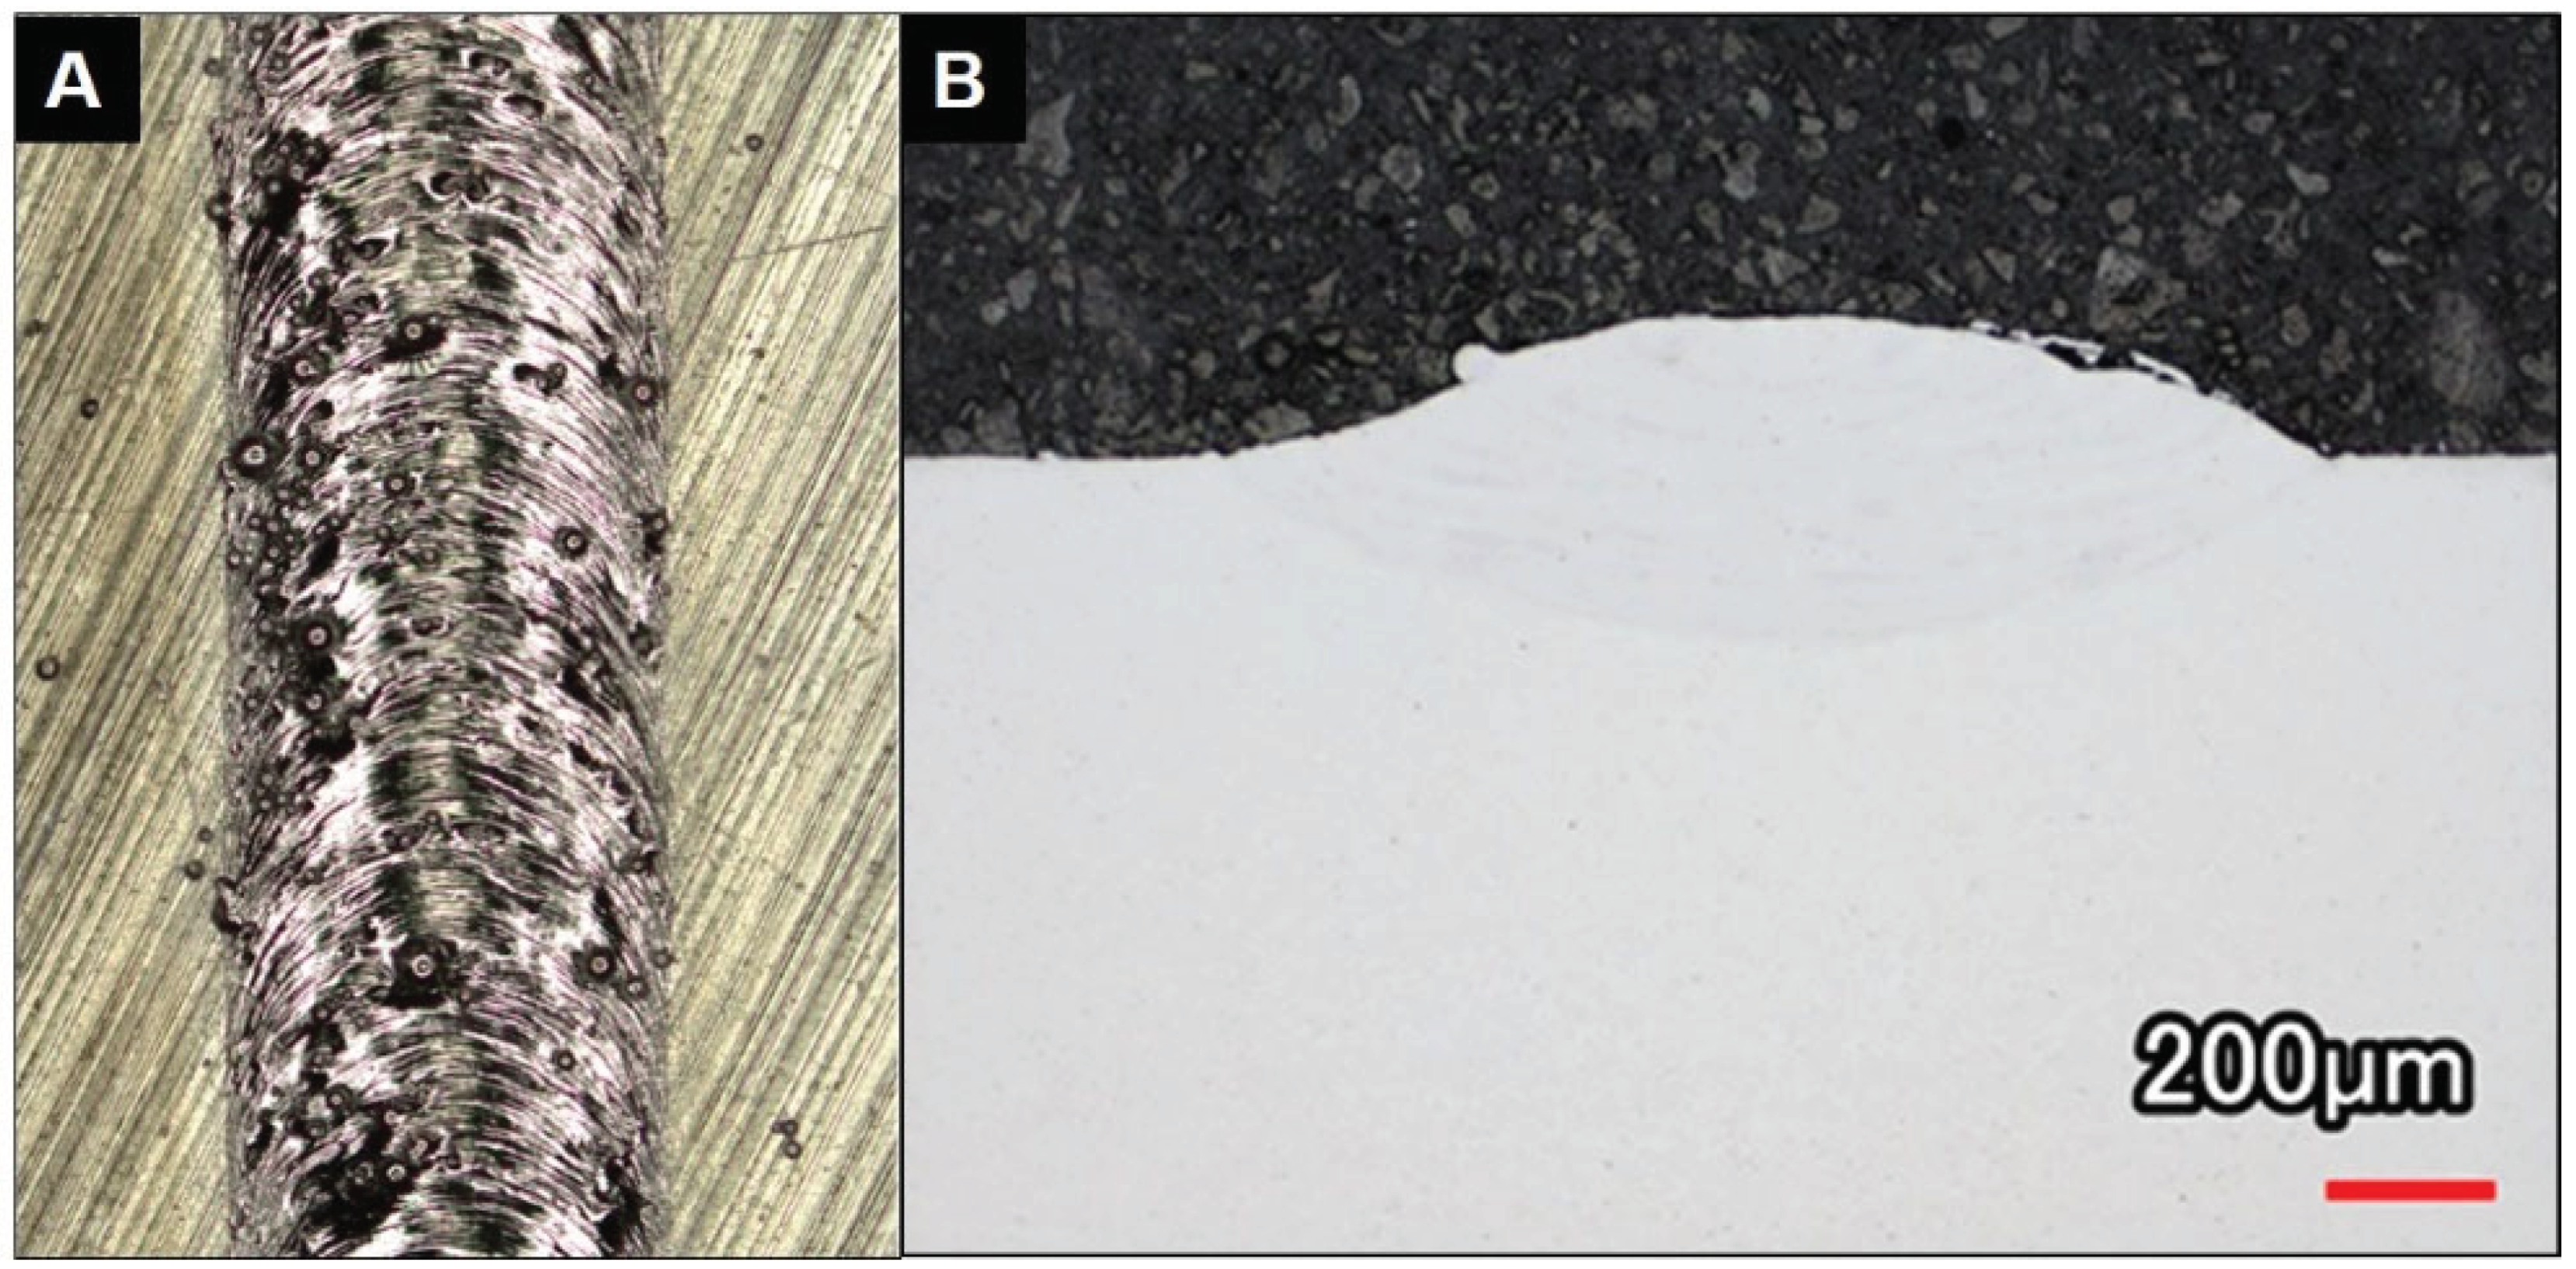
The top view and a polished cross section of a representative single track from the first CCD are presented in
Figure 2A and 2B, respectively. Polished cross sections of the single tracks were analyzed using optical microscopy to identify any visible deposition defects (i.e., pores, lack of fusion, cracks, etc.) and characterize the amount of dilution. Track 20, shown in
Figure 2, contained no internal defects and had approximately 50% dilution (where dilution is the ratio of the depth of penetration to the depth of penetration plus the bead height [
3]). The topography of each track was analyzed using laser confocal microscopy to determine the bead geometry and cross-sectional area. For the track presented in
Figure 2, the bead width and height were found to be 1360µm and 181µm, respectively, while the cross-sectional area was 147000 µm
2.
The cross sectional area was used to calculate the capture efficiency and effective deposition rate for each single track deposit via Equations 1 and 2. Note that a 100% capture efficiency refers to all blown powder being captured in the deposited bead.
The capture efficiency and effective deposition rates were determined for each track and used to rank the associated parameter sets as shown in
Table 4. Single tracks which contained defects were not selected for further evaluation. Both tracks 4 and 14 achieved the highest ranking followed by track 9. These tracks had capture efficiencies above 34% and deposition rates above 0.5 g/min. Track 5 was identified as the best low power candidate, having a similarly high capture efficiency to tracks 4, 14, and 9, but a slower deposition rate. Despite tracks 4 and 14 both being ranked highest, only track 4 was selected for further testing due to its significantly higher deposition rate and lower power. Based on this ranking, parameter sets for tracks 4, 5, and 9 were selected for testing in a second CCD of cube deposits.
The effects and interaction effects of the single track parameters (laser power, traverse rate, powder feed rate) on the capture efficiency and deposition rate were modeled using Minitab and analyzed by ANOVA. A stepwise approach was employed and a level of significance of 0.05 was used to test individual terms, their squares, and their interactions. Low p-values (p
< 0.001) and insignificant lack-of-fit tests (p
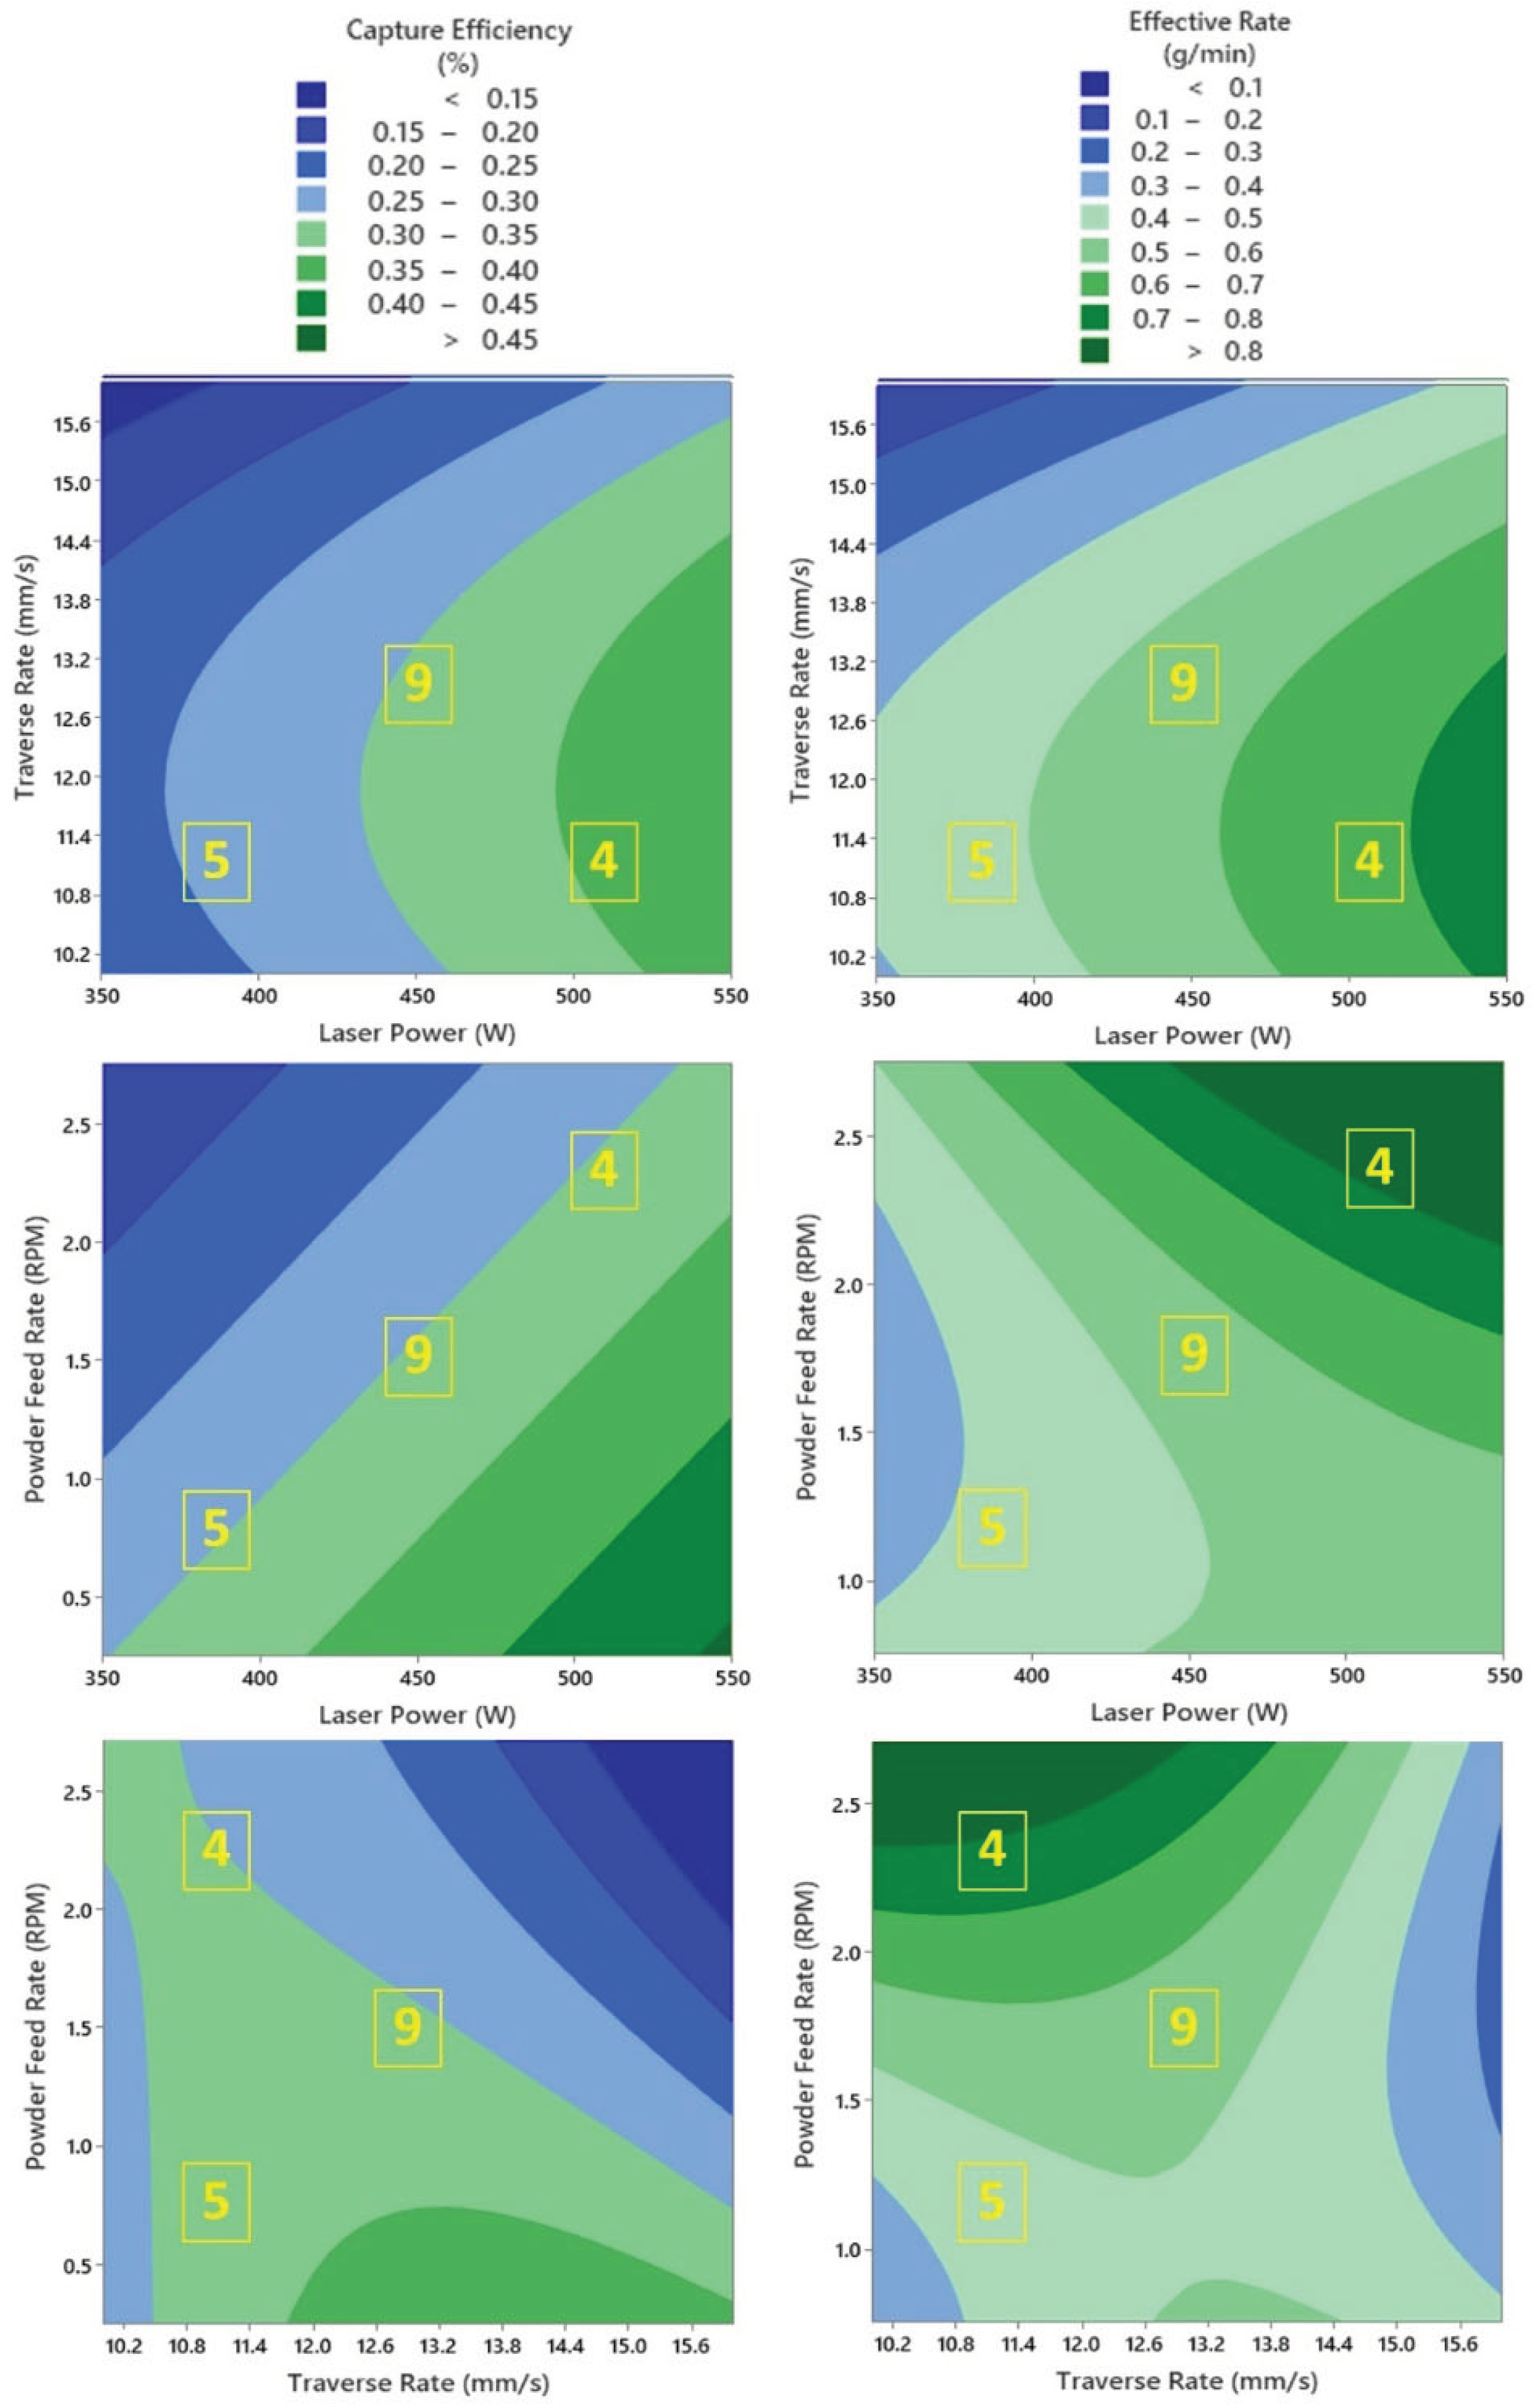
> 0.05) in both cases suggested the models were statistically suitable to predict the deposition response for single tracks. The adjusted R-sq values were 68.0% and 78.2% for the capture efficiency and deposition rate models, respectively. Contour plots of the modeled single track deposition behaviour are presented in
Figure 3. The capture efficiency plots (left column,
Figure 3) indicated that higher laser powers and lower powder feed rates led to higher capture efficiencies. Mid-range traverse rates also appeared to provide higher capture efficiency at low laser powers and high powder feed rates, but traverse rate became less important as the laser power was increased. The deposition rate followed similar behaviour to the capture efficiency, however the deposition rate increased as the powder feed was increased. The selected tracks (4, 5, 9) had predicted deposition rates between 0.4-0.8 g/min while the capture efficiency predictions were confined to a mid-range of 25-35%. Note that these contour plots do not provide any information about how the tested machine parameters influence the density of the deposited beads.
3.2. Solid Cube Characterization
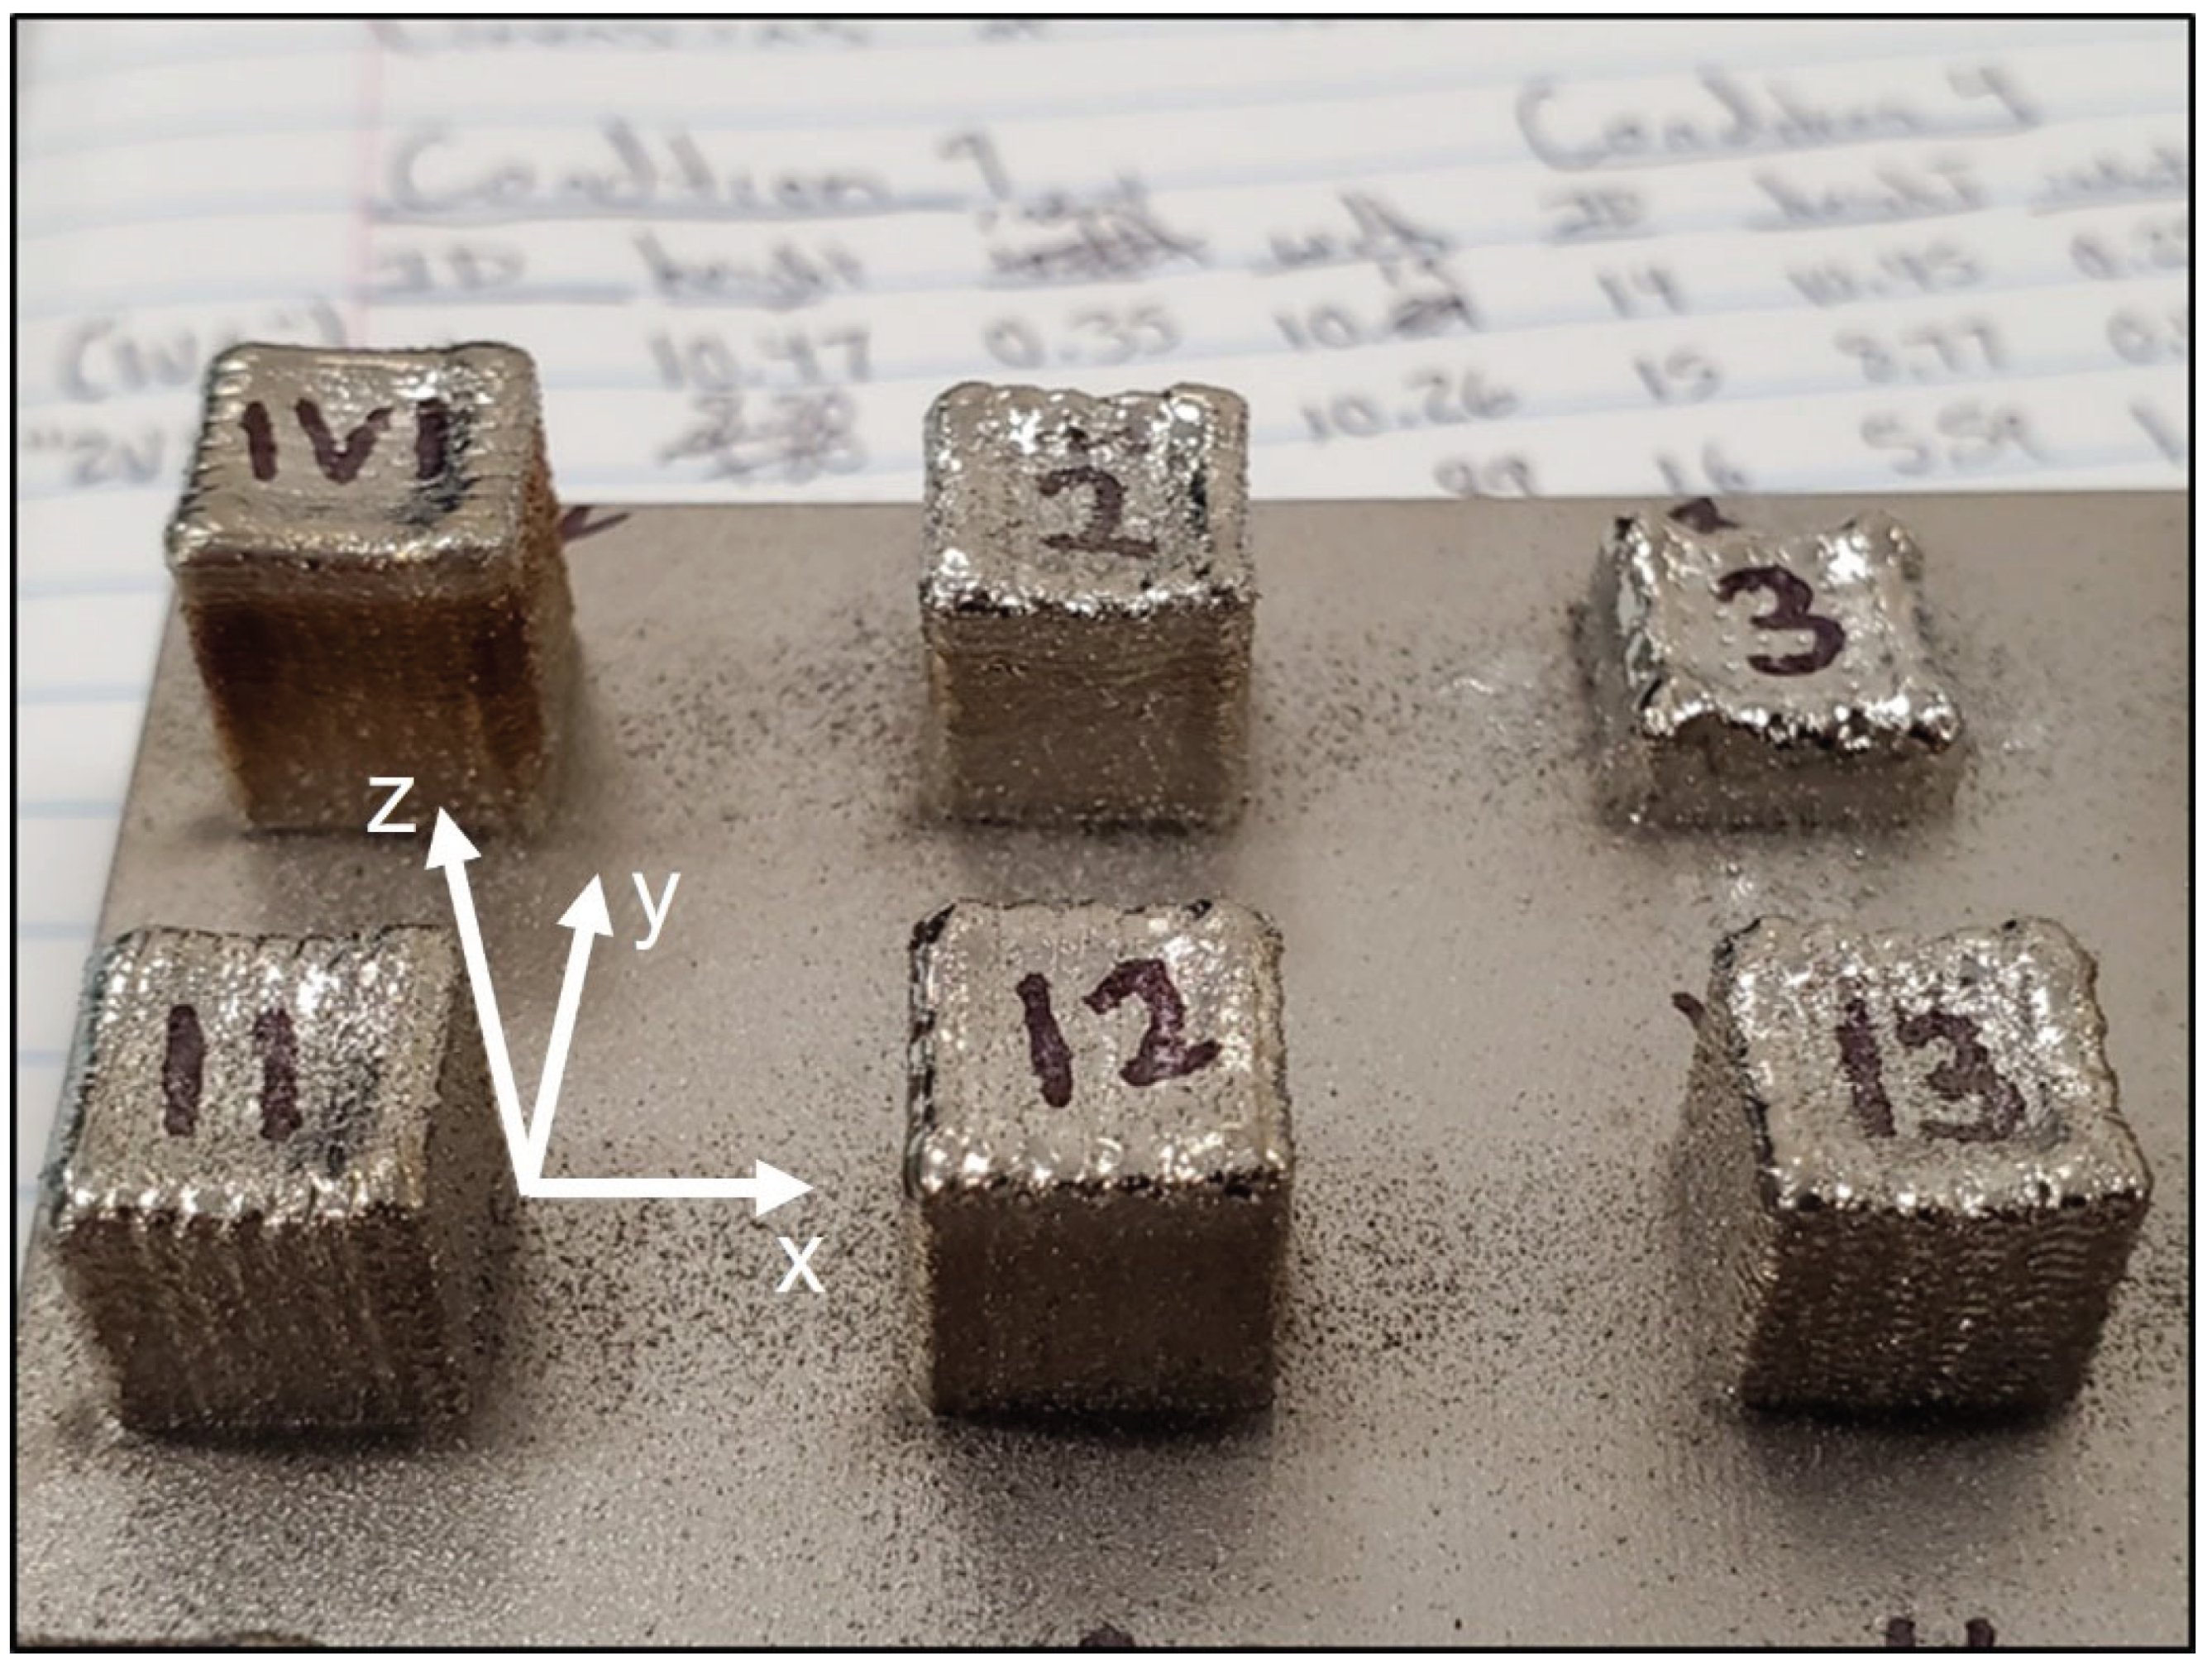
Solid cubes with different X-Y and Z-overlaps were built in a second CCD according to
Table 3 using the selected machine parameters from the single track CCD (conditions 4, 5, and 9). The density and microstructure of the cube specimens were analyzed and compared against a full theoretical density of 4.642 g/cm
3 for Ti-55511. As-deposited cubes of Ti-55511 are shown in
Figure 4.
AM parameters are commonly simplified into a singular energy input parameter such as linear heat input [
1]. However, this approach only considers the ratio of the laser power to the scan speed and does not capture the hatch spacing or layer thickness. Instead, DED machine parameters were simplified using a volumetric energy density which can be calculated according to Equation 3 [
39]:
where ED is the energy density, L
P is the laser power, T
R is the traverse rate, H
S is the spacing of adjacent laser passes (xy-step size), and Z
S is the layer thickness (z-step size). Note that the powder feed rate (P
F), an important parameter in DED, is not accounted for in this ED calculation. Within the solid cube CCDs, the ED varied from 93 J/mm
3 to 1204 J/mm
3.
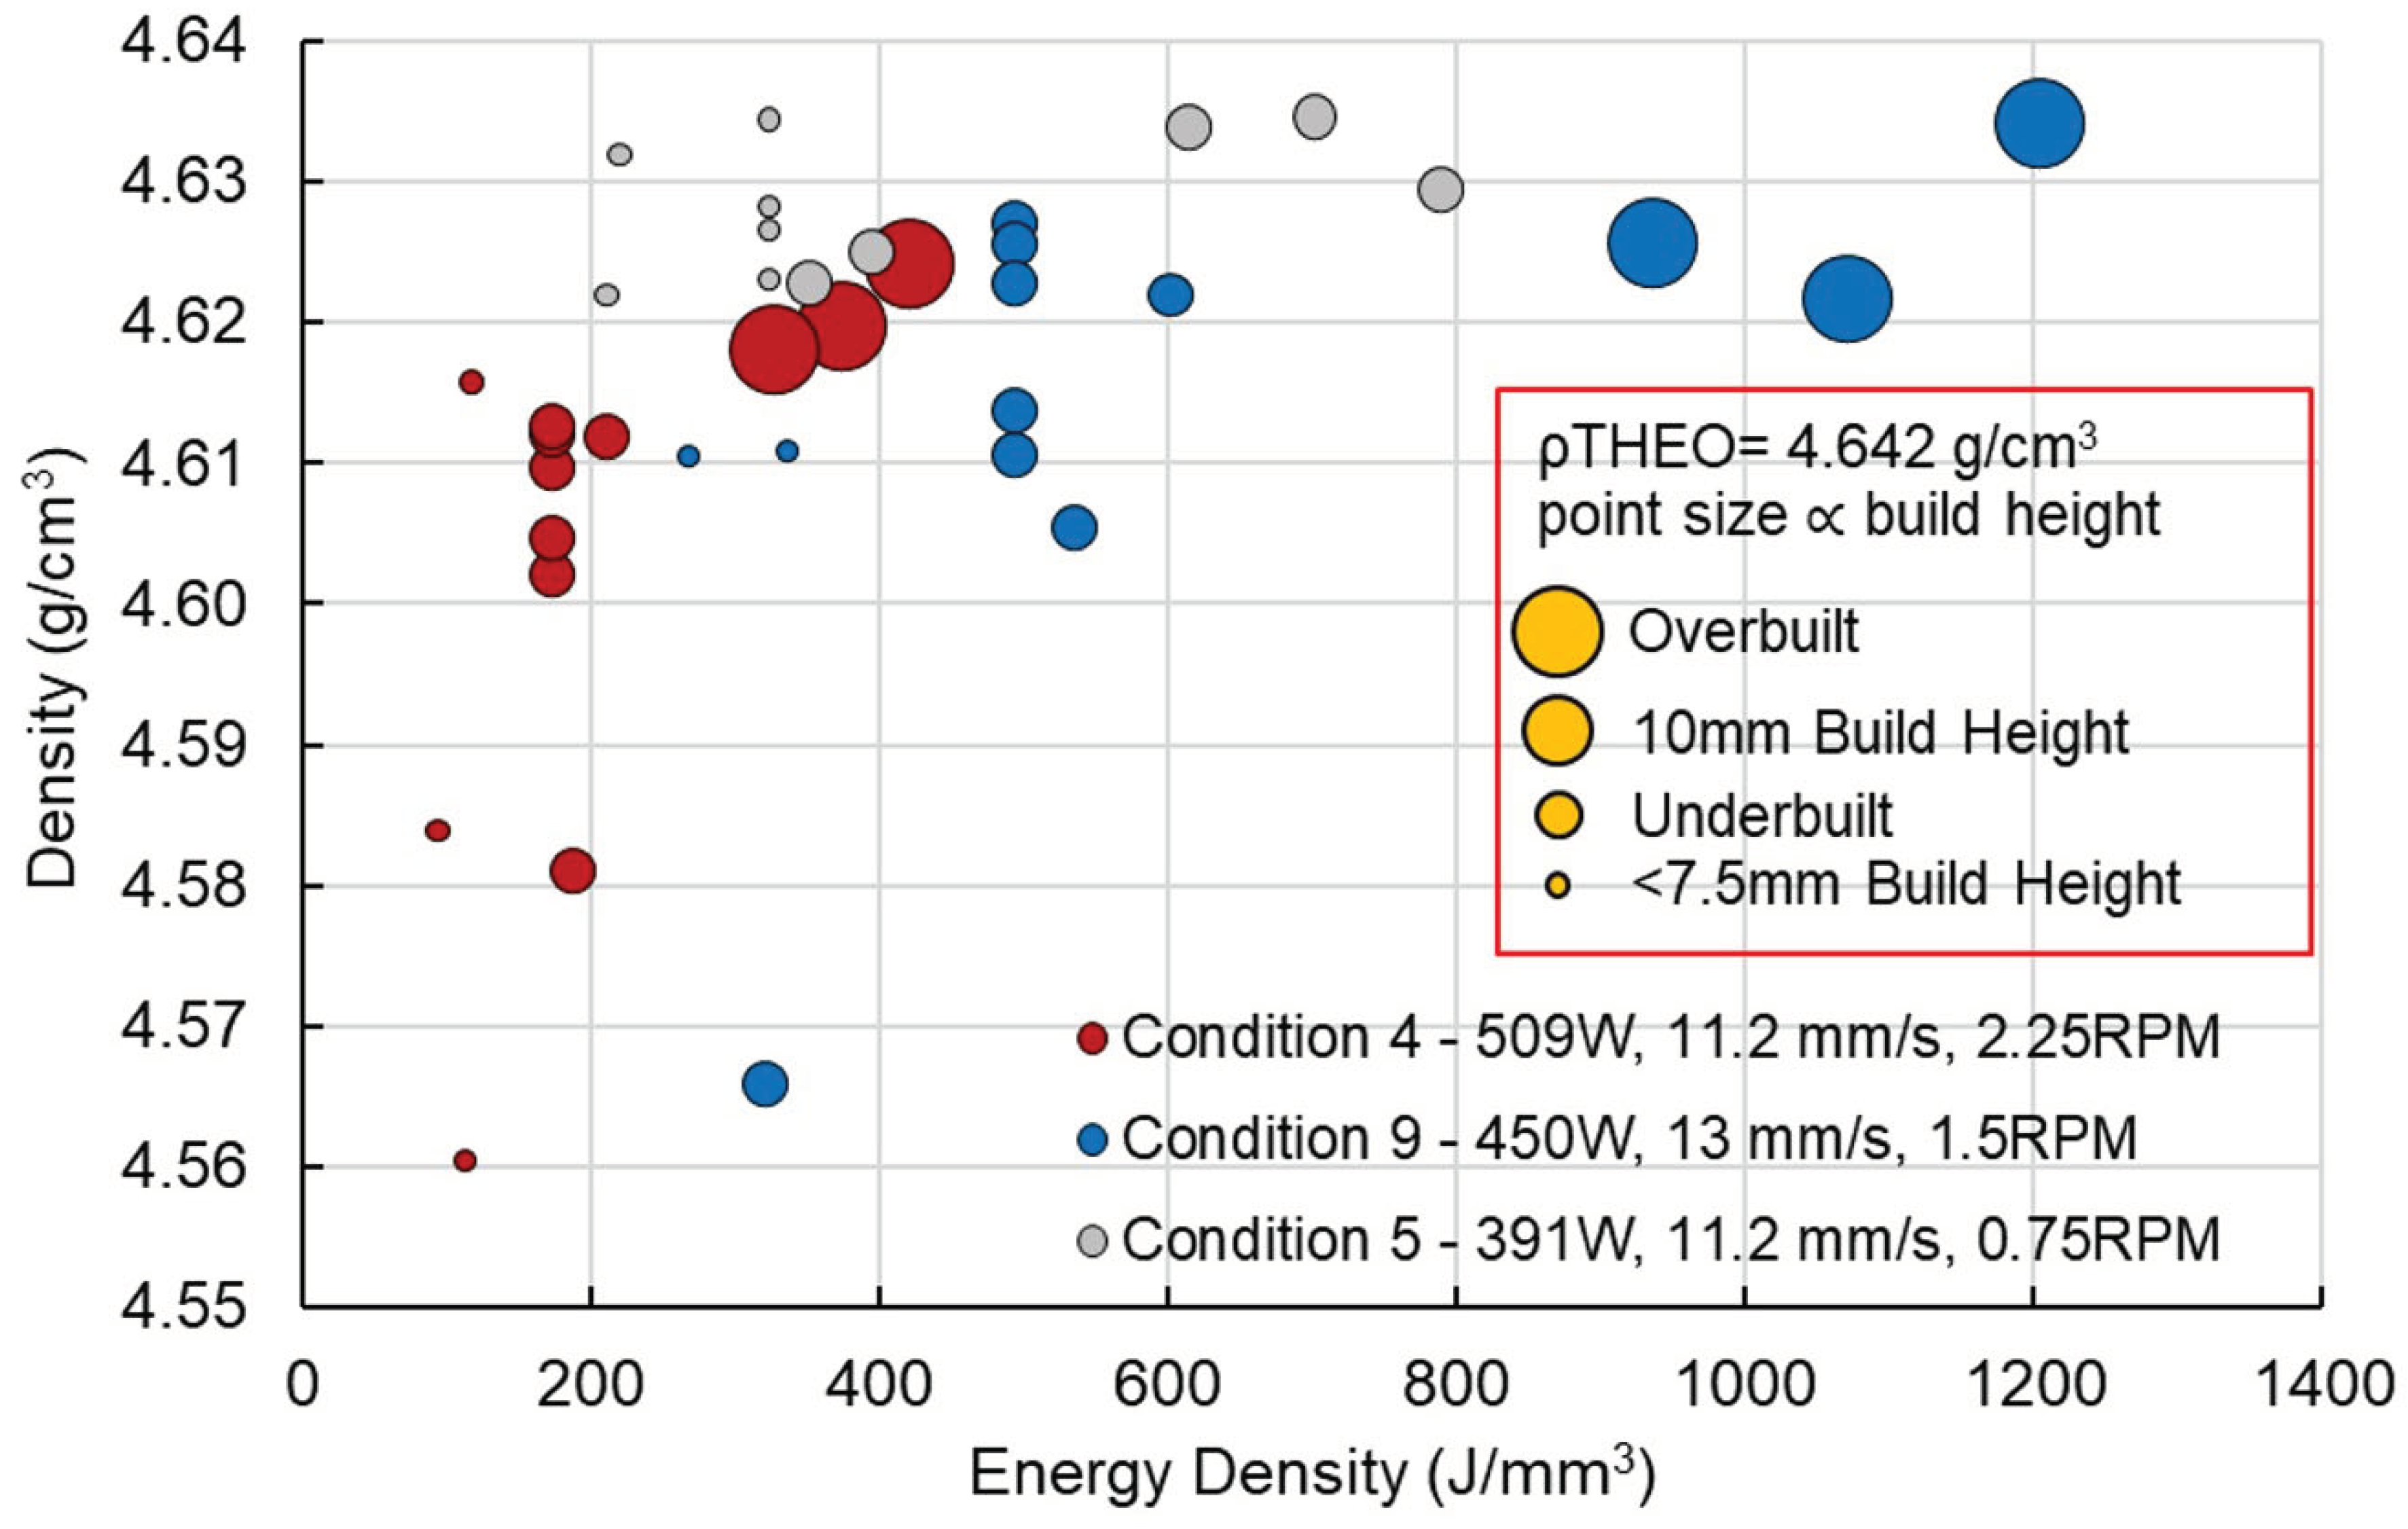
The effect of ED on specimen density is presented in
Figure 5 where it is apparent that this trait improved with increasing EDs between 100-450 J/mm
3. Above 500 J/mm
3 there was minimal improvement in density and the data exhibited an asymptotic trend. Due to the formation of keyhole porosity, decreases in specimen density are commonly observed following a peak in density with ED [
1]. This was not the case for Ti-55511 as high densities were achieved for specimens between 300-1200 J/mm
3.
The point sizes in
Figure 5 are proportional to the build height of the cubes (i.e., small points represent under-building while large points represent over-building of the programmed height). The distribution of point sizes shows the general amount of underbuilding and overbuilding, with the majority of cube building successfully and only select samples failing to build at all (i.e., cube # 3 shown in
Figure 4.).
Figure 5 also demonstrates that all cube specimens exhibited relative densities above 98% (4.55g/cm
3). Energy densities above 300J/mm
3 were required to achieve densities above 99.5% (4.62g/cm
3). A maximum density of 99.8% (4.633g/cm
3) was achieved in conditions 5 and 9 while condition 4 exhibited a maximum density of 99.6% (4.624g/cm
3). An energy density above 330J/mm
3 was required to avoid significant underbuilding, though some lower energy density specimens in condition 4 exhibited no underbuilding. Dense specimens (>99.5% density) with no underbuilding were deposited under each of the selected DED conditions implying that Ti55511 has a relatively wide DED processing window.
Although the specimen density appeared to trend with ED, variances in the density data were not entirely explained by the singular ED parameter. For example, cube 10 (ED = 321J/mm3 and ρ = 98.4%) and cube 33 (ED = 324J/mm3 and ρ = 99.8%) were deposited using similar ED, but employed unique LP, PF, and overlap parameters. Despite comparable ED, the lower laser power, powder feed rate and XY-overlap resulted in a higher density. This inferred that certain machine parameters, including PF (which is not included in the ED model), may interact with one another, and influence Ti-55511 density.
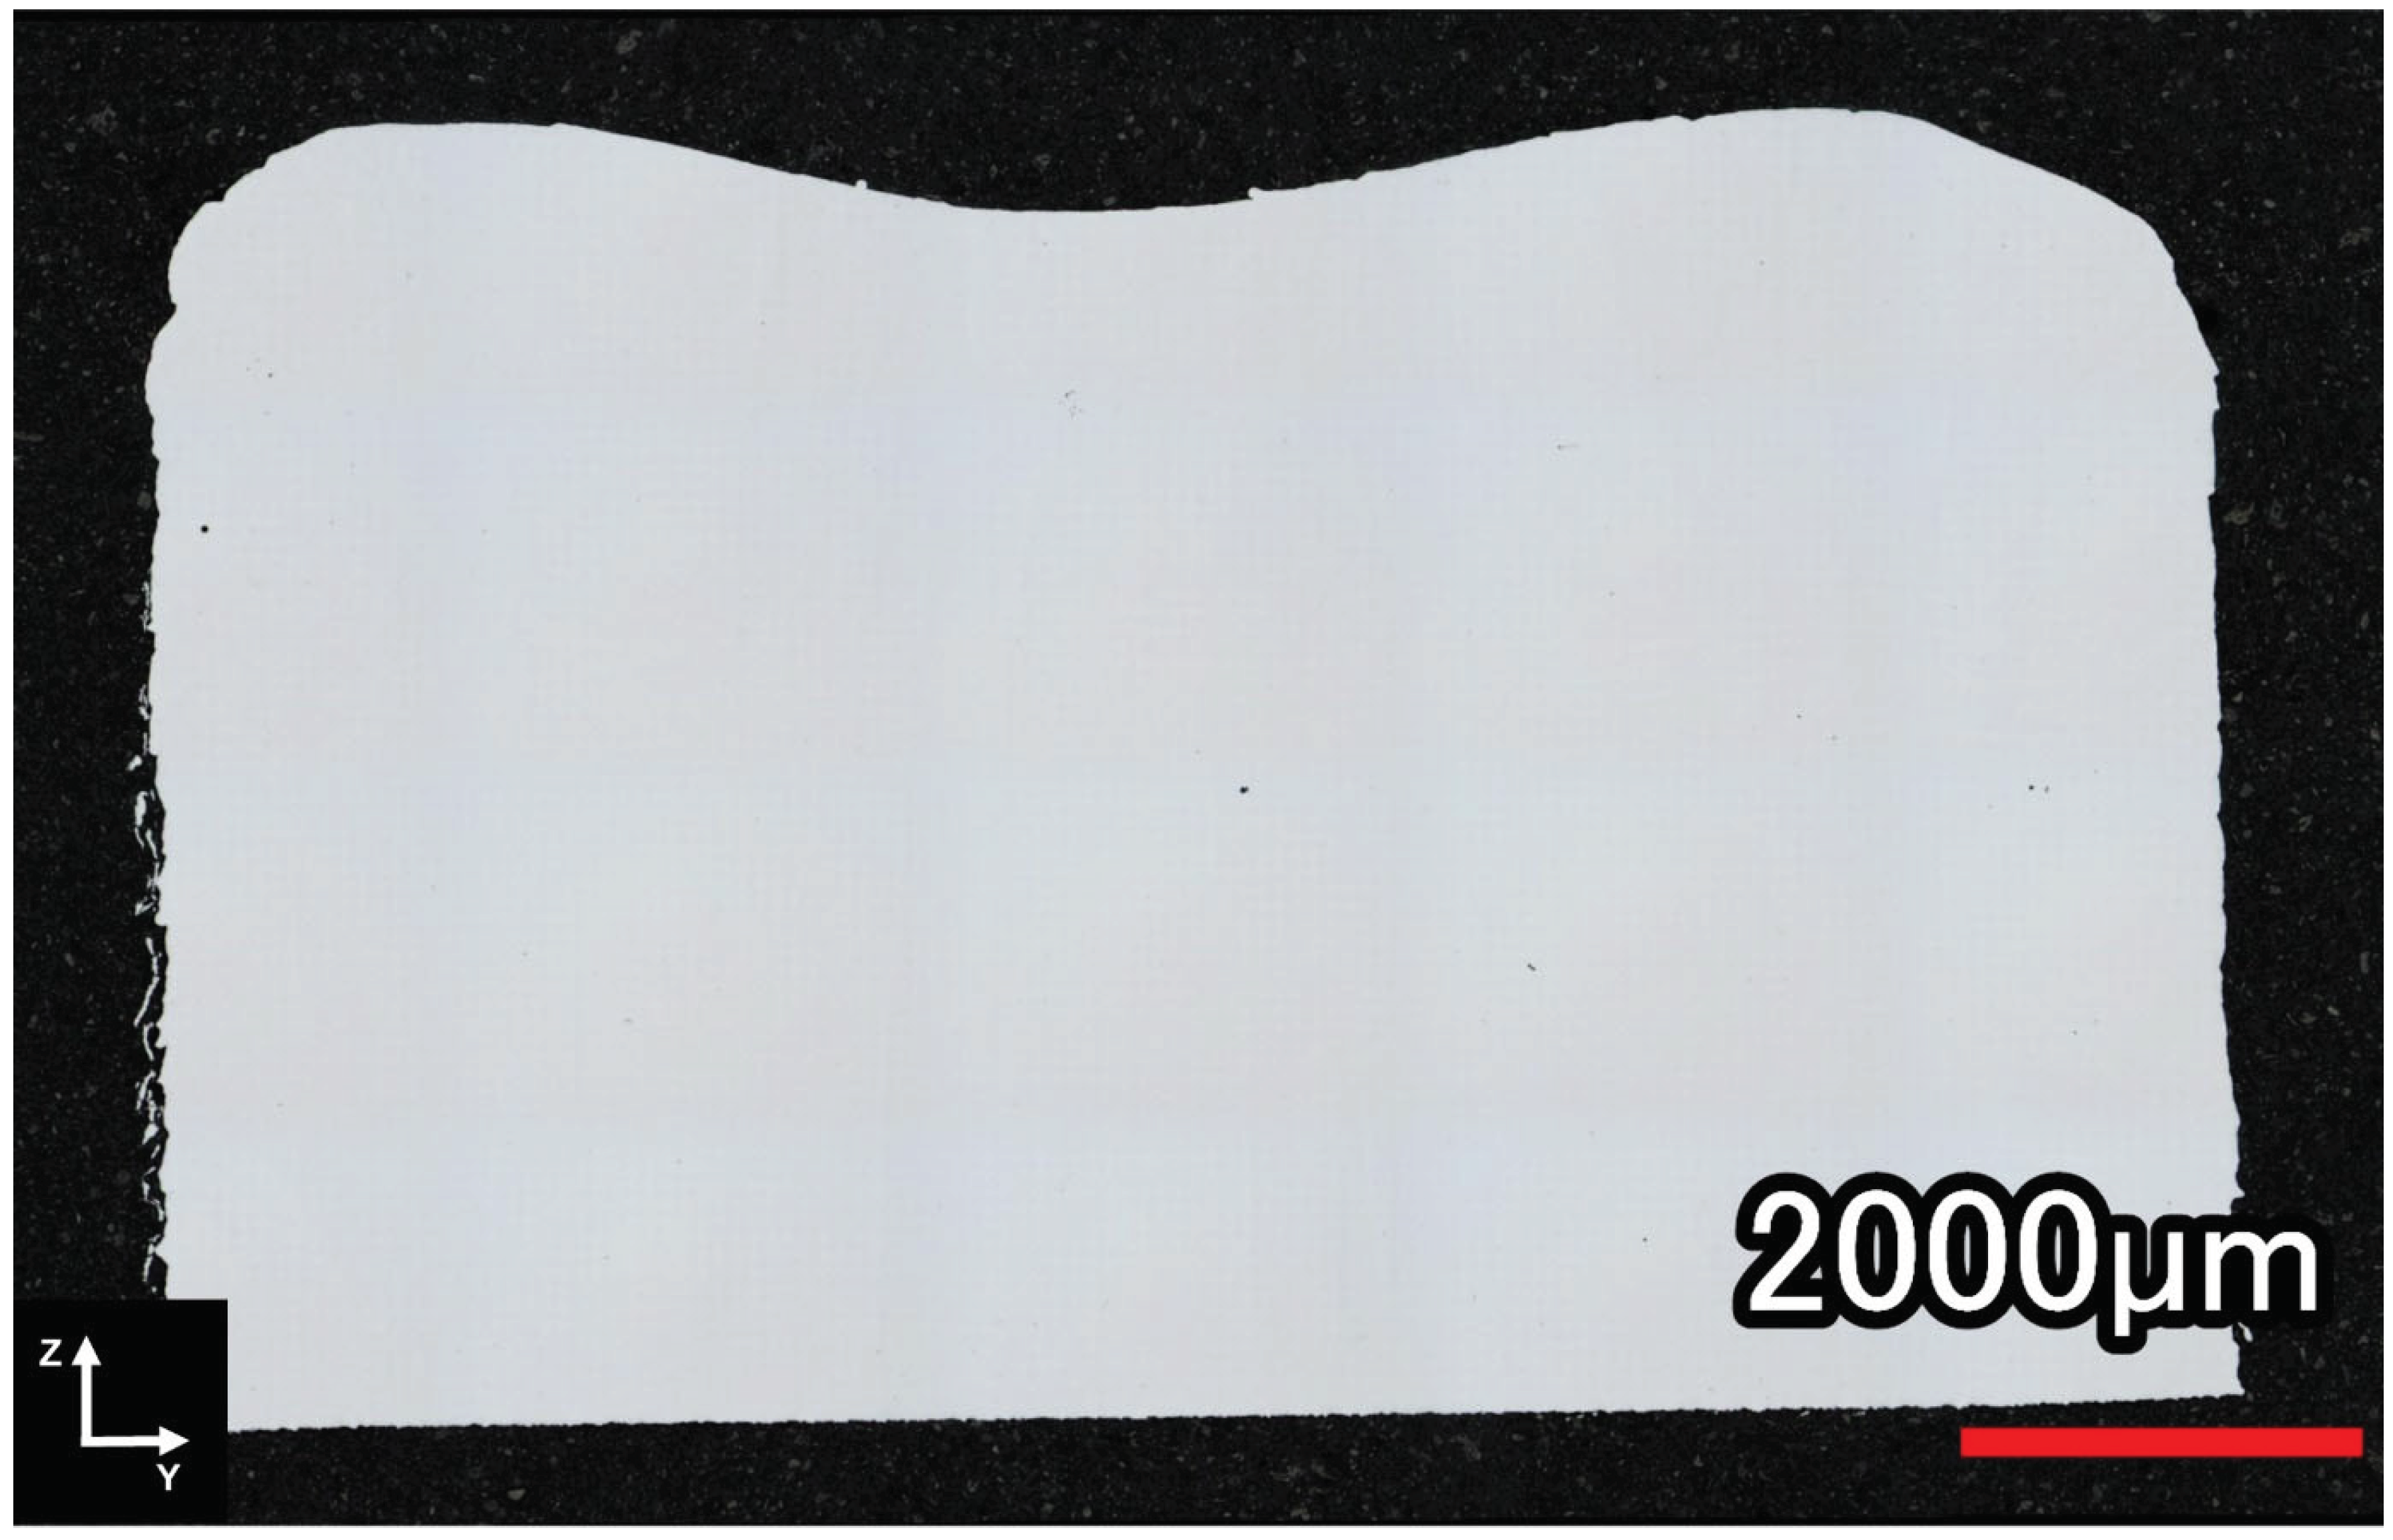
The polished cross section of condition 5 (391 W, 11.2 mm/s, 0.75 RPM) printed with an X-Y overlap of 35% and Z-overlap of 10% (the CCD center point parameters) is shown in
Figure 6. Few pores were visible in the cross section which supported the high measured density of 99.84% (4.634 g/cm
3).
Each print condition was modeled individually to analyze the effects of the X-Y and Z-overlaps on the density of Ti-55511 deposits. An outlier printed with an X-Y overlap of 10% and Z-overlap of -20% was removed from condition 5 (391 W, 11.2 mm/s, 0.75 RPM) due to significant underbuilding and a 100% density measurement. A stepwise approach and a level of significance of 0.05 was used to test individual terms, their squares, and their interactions. Low p-values (p
< 0.001) and insignificant lack-of-fit tests (p
> 0.05) in conditions 4 and 9 suggested the models were statistically suitable to predict the density of cube deposits. The adjusted R-sq values were 93.0% and 64.0% for conditions 4 and 9, respectively. ANOVA for condition 5 returned high p-values, indicating that the variation in density was not attributable to the controlled parameters. This result makes sense because condition 5 had very little variation in density for different overlaps compared to the other two conditions (see
Figure 5).
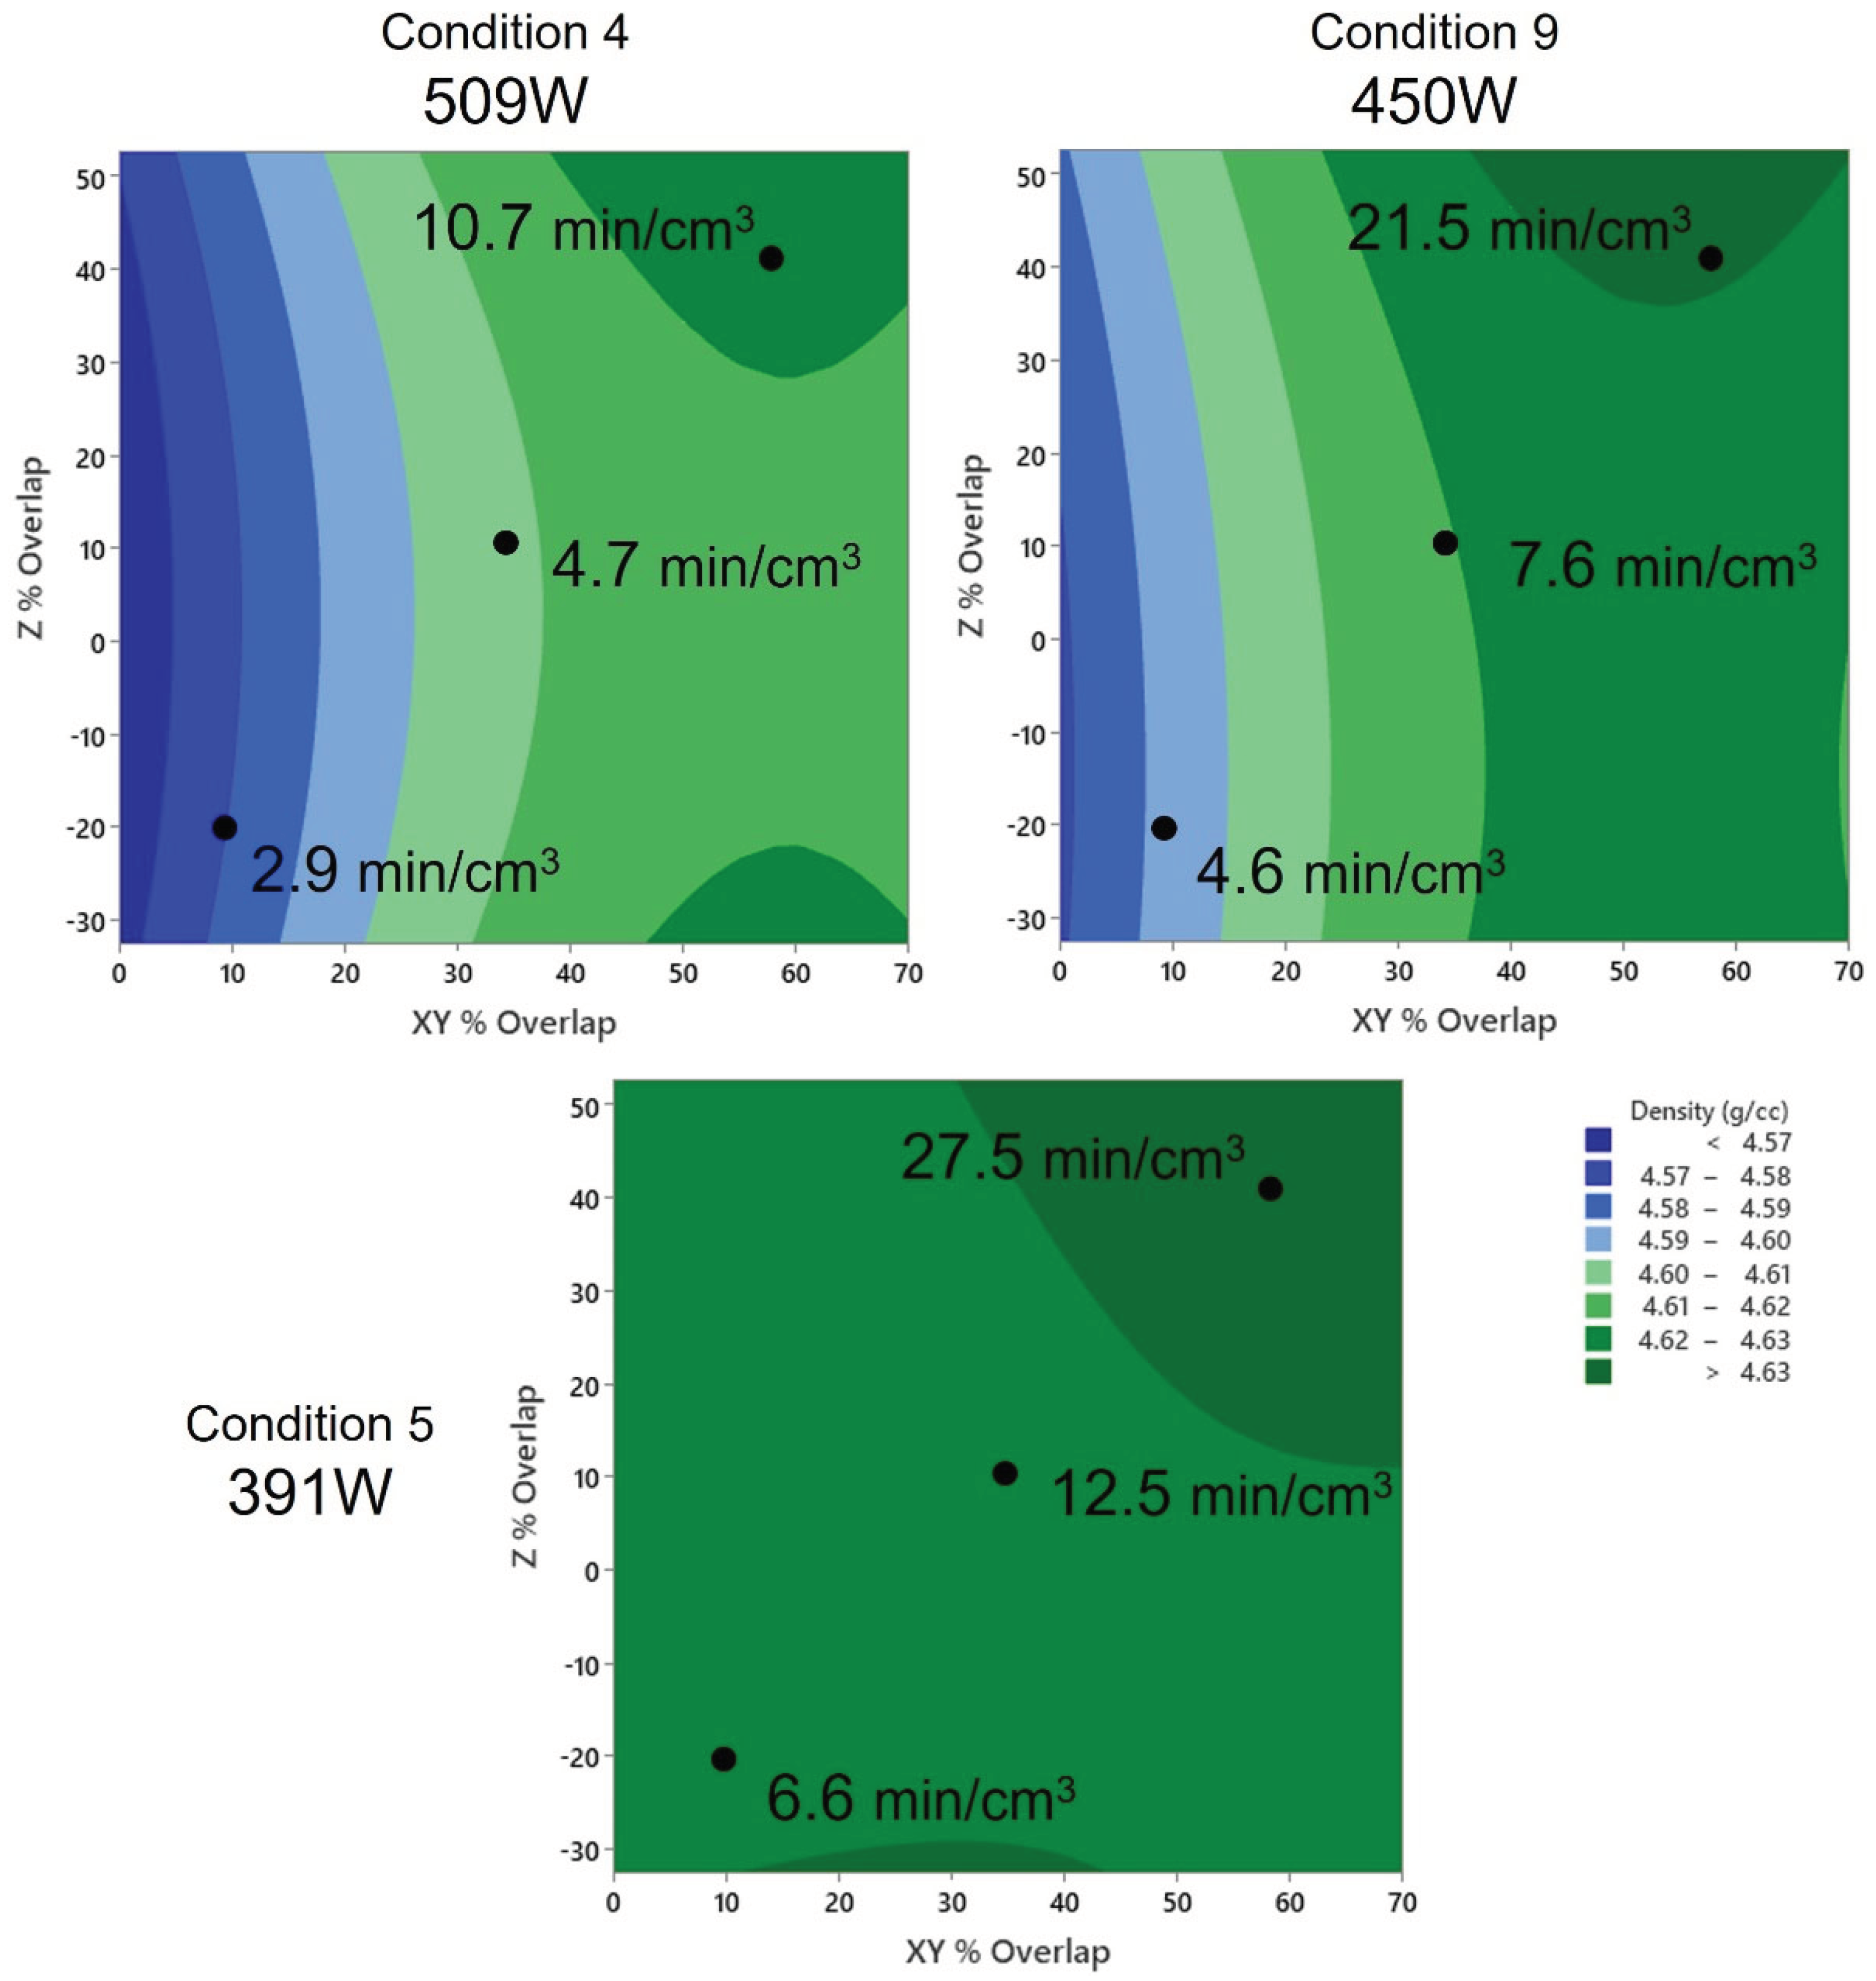
Statistical contour plots for the three build conditions with respect to the effective build rate are presented in
Figure 7. The contour plots demonstrate that specimen density was proportional to the effective build rate across all three tested conditions. Specimen density increased with lower build rates while small X-Y overlaps, which have lower ED, resulted in lower densities. Specimen density was also more sensitive to the X-Y and Z overlap at the higher laser powers with condition 4 (509 W) exhibiting the largest range in densities (<4.57-4.63 g/cm
3). Larger X-Y overlaps have higher ED, increasing dilution and the ability to correct porosity in previously deposited layers. Condition 5 offered the lowest density variation over the range of effective build rates, inferring that lower powers can produce highly dense deposits with relatively low build times.
All cube density data was combined, and a statistical model was fitted to evaluate the effect of all tested factors (laser power, traverse rate, powder feed rate, hatch spacing, and layer thickness). There were 13 individual data points for hatch spacing and layer thickness (including repeat center points) for each condition. In contrast, there were only 3 tested levels for the laser power, traverse rate, and powder feed rate, limiting the accuracy of their modeled effects due to the small sample size. Regardless, these parameters were included in the model as they could potentially provide useful information about the general behaviour of Ti-55511 deposition.
A backwards elimination stepwise approach was employed on all terms, their squares, and their interactions. The model had an adjusted R-sq value of 84%. Low p-values (<0.005) and insignificant lack-of-fit test (>0.05) showed that the model was statistically suitable. Hatch spacing and its square term were the only statistically significant terms in the resulting model (p-values of 0.002 and 0.000, respectively). ZS was the next most significant term with a p-value = 0.013, followed by the interaction between HS and ZS. Parameters LP and TR as well as the interaction terms LP*HS, and HS*ZS, remained in the model but had p-values >0.005. The powder feed rate and remaining interactions either could not be estimated and were removed or were eliminated from the model having an alpha value >0.1. Given the limited test points for LP, TR, and PF, it is not surprising that the most significant parameters in the model were those with the most data, HS and ZS. As expected, LP, TR, and PF, and their interactions could not be attributed to variations in Ti-55511 density due to their limited sample size.
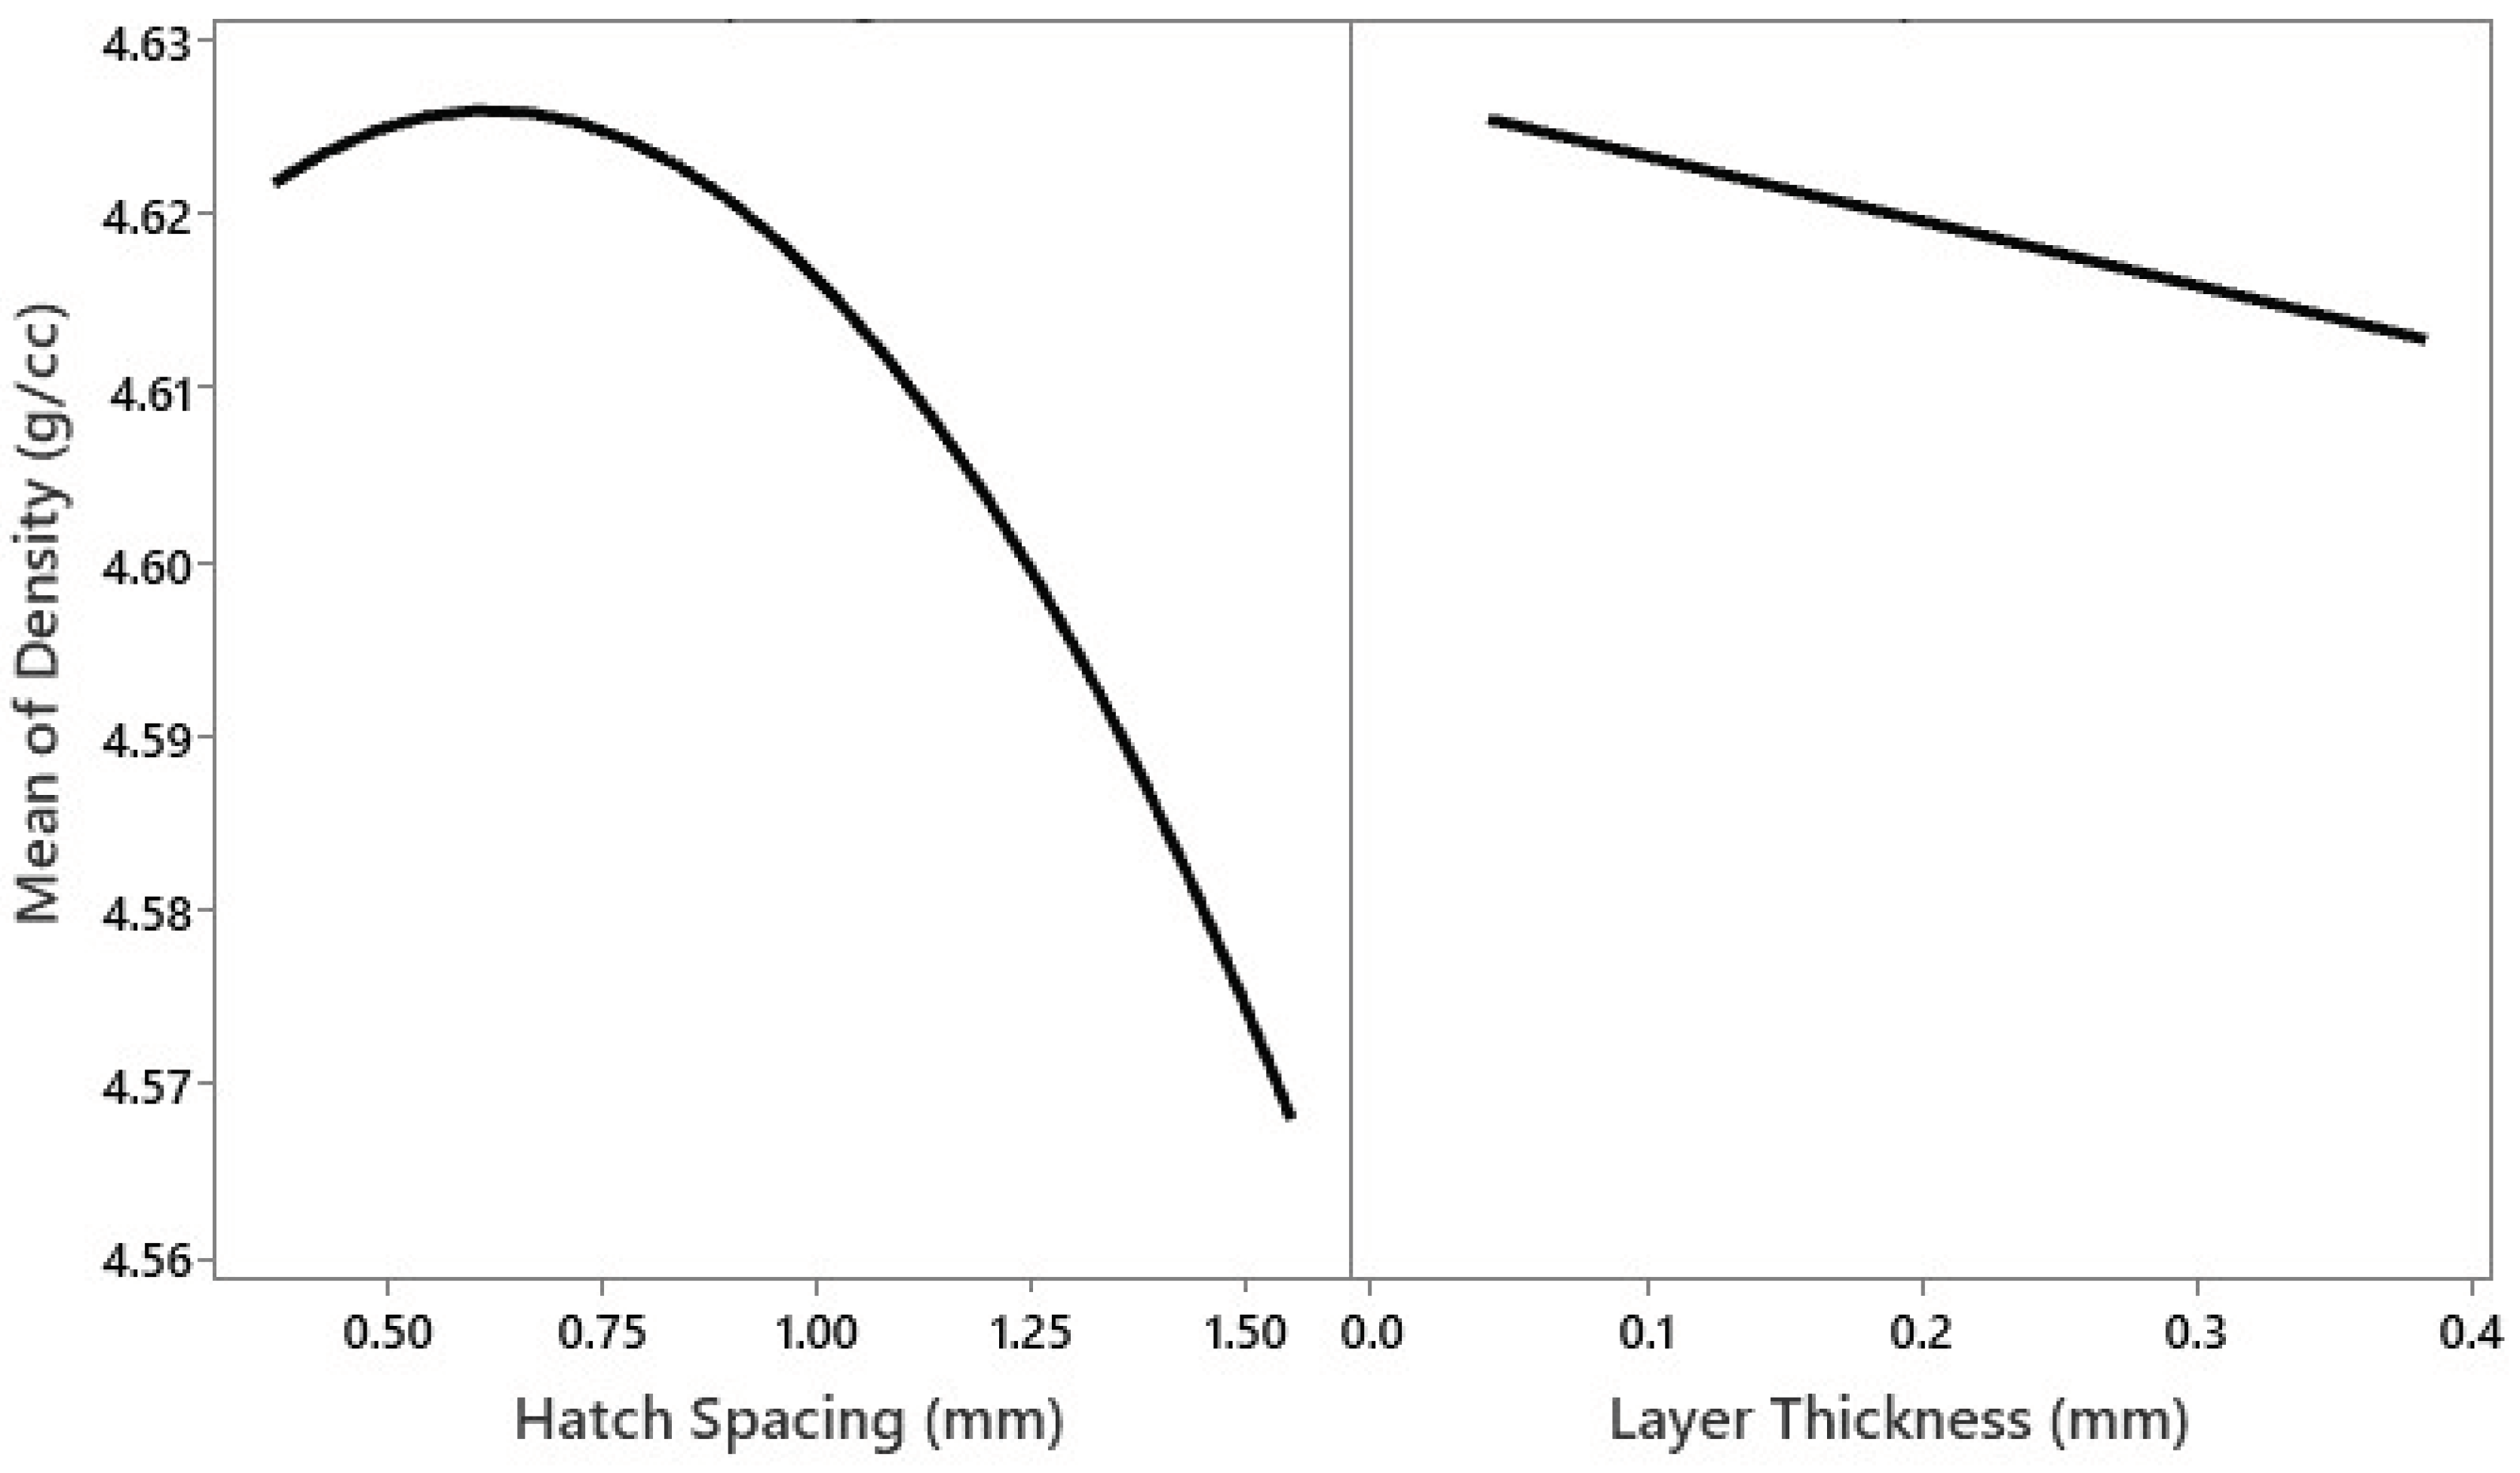
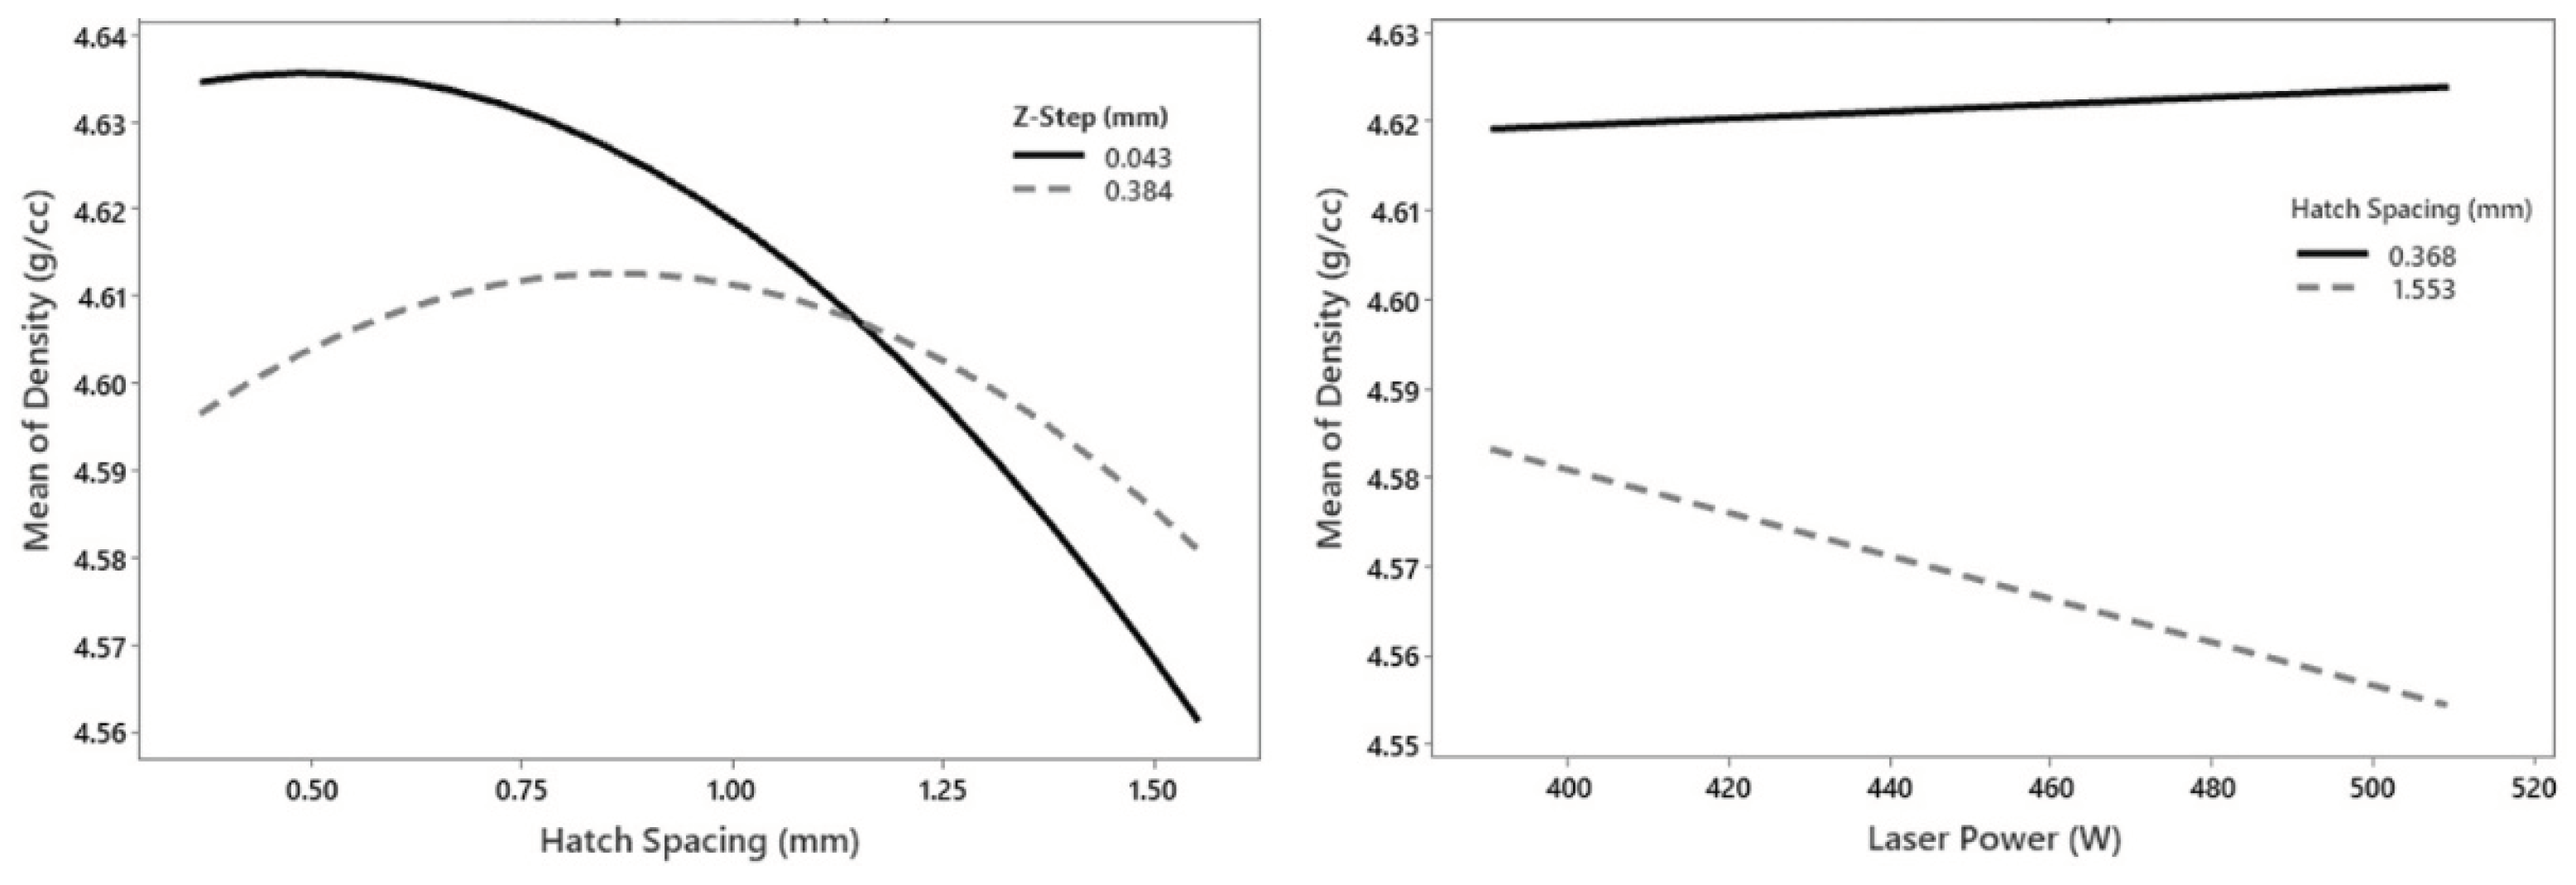
The modeled effects of hatch spacing and layer thickness on Ti-55511 specimen density are presented in
Figure 8. L
P, T
R, and Z
S had minimal effects on density (F-values of 1.23, 4.94, and 7.04, respectively) while the hatch spacing proved to have the largest effect (F-value=26.23).
The model suggested that the hatch spacing was attributable to variations in density. Hatch spacing had a parabolic relationship with density which exhibited a maximum between 0.5-0.75mm. Specimen density quickly deteriorated to a minimum of 4.560g/cm
3 (98.24%) as the hatch spacing was increased beyond 1mm. This result agrees with the measured density data where all densities above 4.633g/cm
3 (>99.80%) were achieved using low hatch spacings between 0.37mm and 0.80mm (corresponding to XY-overlaps of 35-70%). Similarly, all densities above 4.633g/cm
3 (>99.80%) were achieved with layer thicknesses below 0.2mm, which agrees with the predicted effect of layer thickness shown in
Figure 8. The main effects of these parameters are aligned with the previously observed trends in the energy density data (see
Figure 5). Small hatch spacings and layer thicknesses (high X-Y and Z-overlaps) increase energy density, which generally resulted in higher densities. In contrast, low laser powers decrease energy density, which resulted in lower densities except for the lowest power CCD (condition 5; 391W). Condition 5 had the highest densities, least variance, and was not explained by a statistical model. However, the model also suggested that the hatch spacing interacted with both laser power and layer thickness to influence specimen density. The interaction effects of hatch spacing with both layer thickness and hatch spacing are presented in
Figure 9.
There was a clear interaction effect between the hatch spacing and layer thickness. Hatch spacing had a more dramatic effect on specimen density when a small layer thickness was employed, reaching high densities at low HS values, and rapidly deteriorating as HS was increased. In contrast, HS had less influence on density at larger layer thicknesses. Laser power also interacted with hatch spacing, exhibiting more sensitivity to laser power at larger hatch spacings with high laser powers resulting in lower densities. At low hatch spacings (high XY-overlap), high densities could be achieved across the tested laser power range. The interaction between these parameters demonstrates that low HS and ZS can interact to achieve high densities while laser power is less critical at small HS.
The powder feed rate is an important parameter not accounted for in the ED calculation (Equation 3). All specimens deposited when the powder feed rate was 0.75 RPM had > 99.5% density, suggesting that low powder feed rates generally help promote high densities in Ti-55511. Higher powder feed rates, which were employed at both higher laser power levels, were associated with lower densities. In a similar study on DED of dual phase steel, Sweet et al., also noted a decreased density with increased mass inputs (powder feed rates) [
18]. This effect was attributed to an increase in the energy lost by the powder stream by either reflection, evaporation, or heating of unfused powder [
18,
40]. In DED, the presence of powder in the laser path can also intercept the energy input and shadow the substrate, contributing to the energy lost by the powder stream [
40]. Similar to Sweet et al.’s work, the fraction of powder input to the system that absorbed energy but did not fuse to the substrate was increased at high powder feed rates, effectively reducing the energy input to the substrate and deposited powder. This theory is supported by the single track results shown in
Table 3 where all powder feed rates ≤0.75 RPM exhibited >30% capture efficiency while higher powder feed rates generally exhibited <30% capture efficiency. This likely resulted in the reduced densities observed at both higher powder feed rate settings.
3.3. Microstructural Evaluation
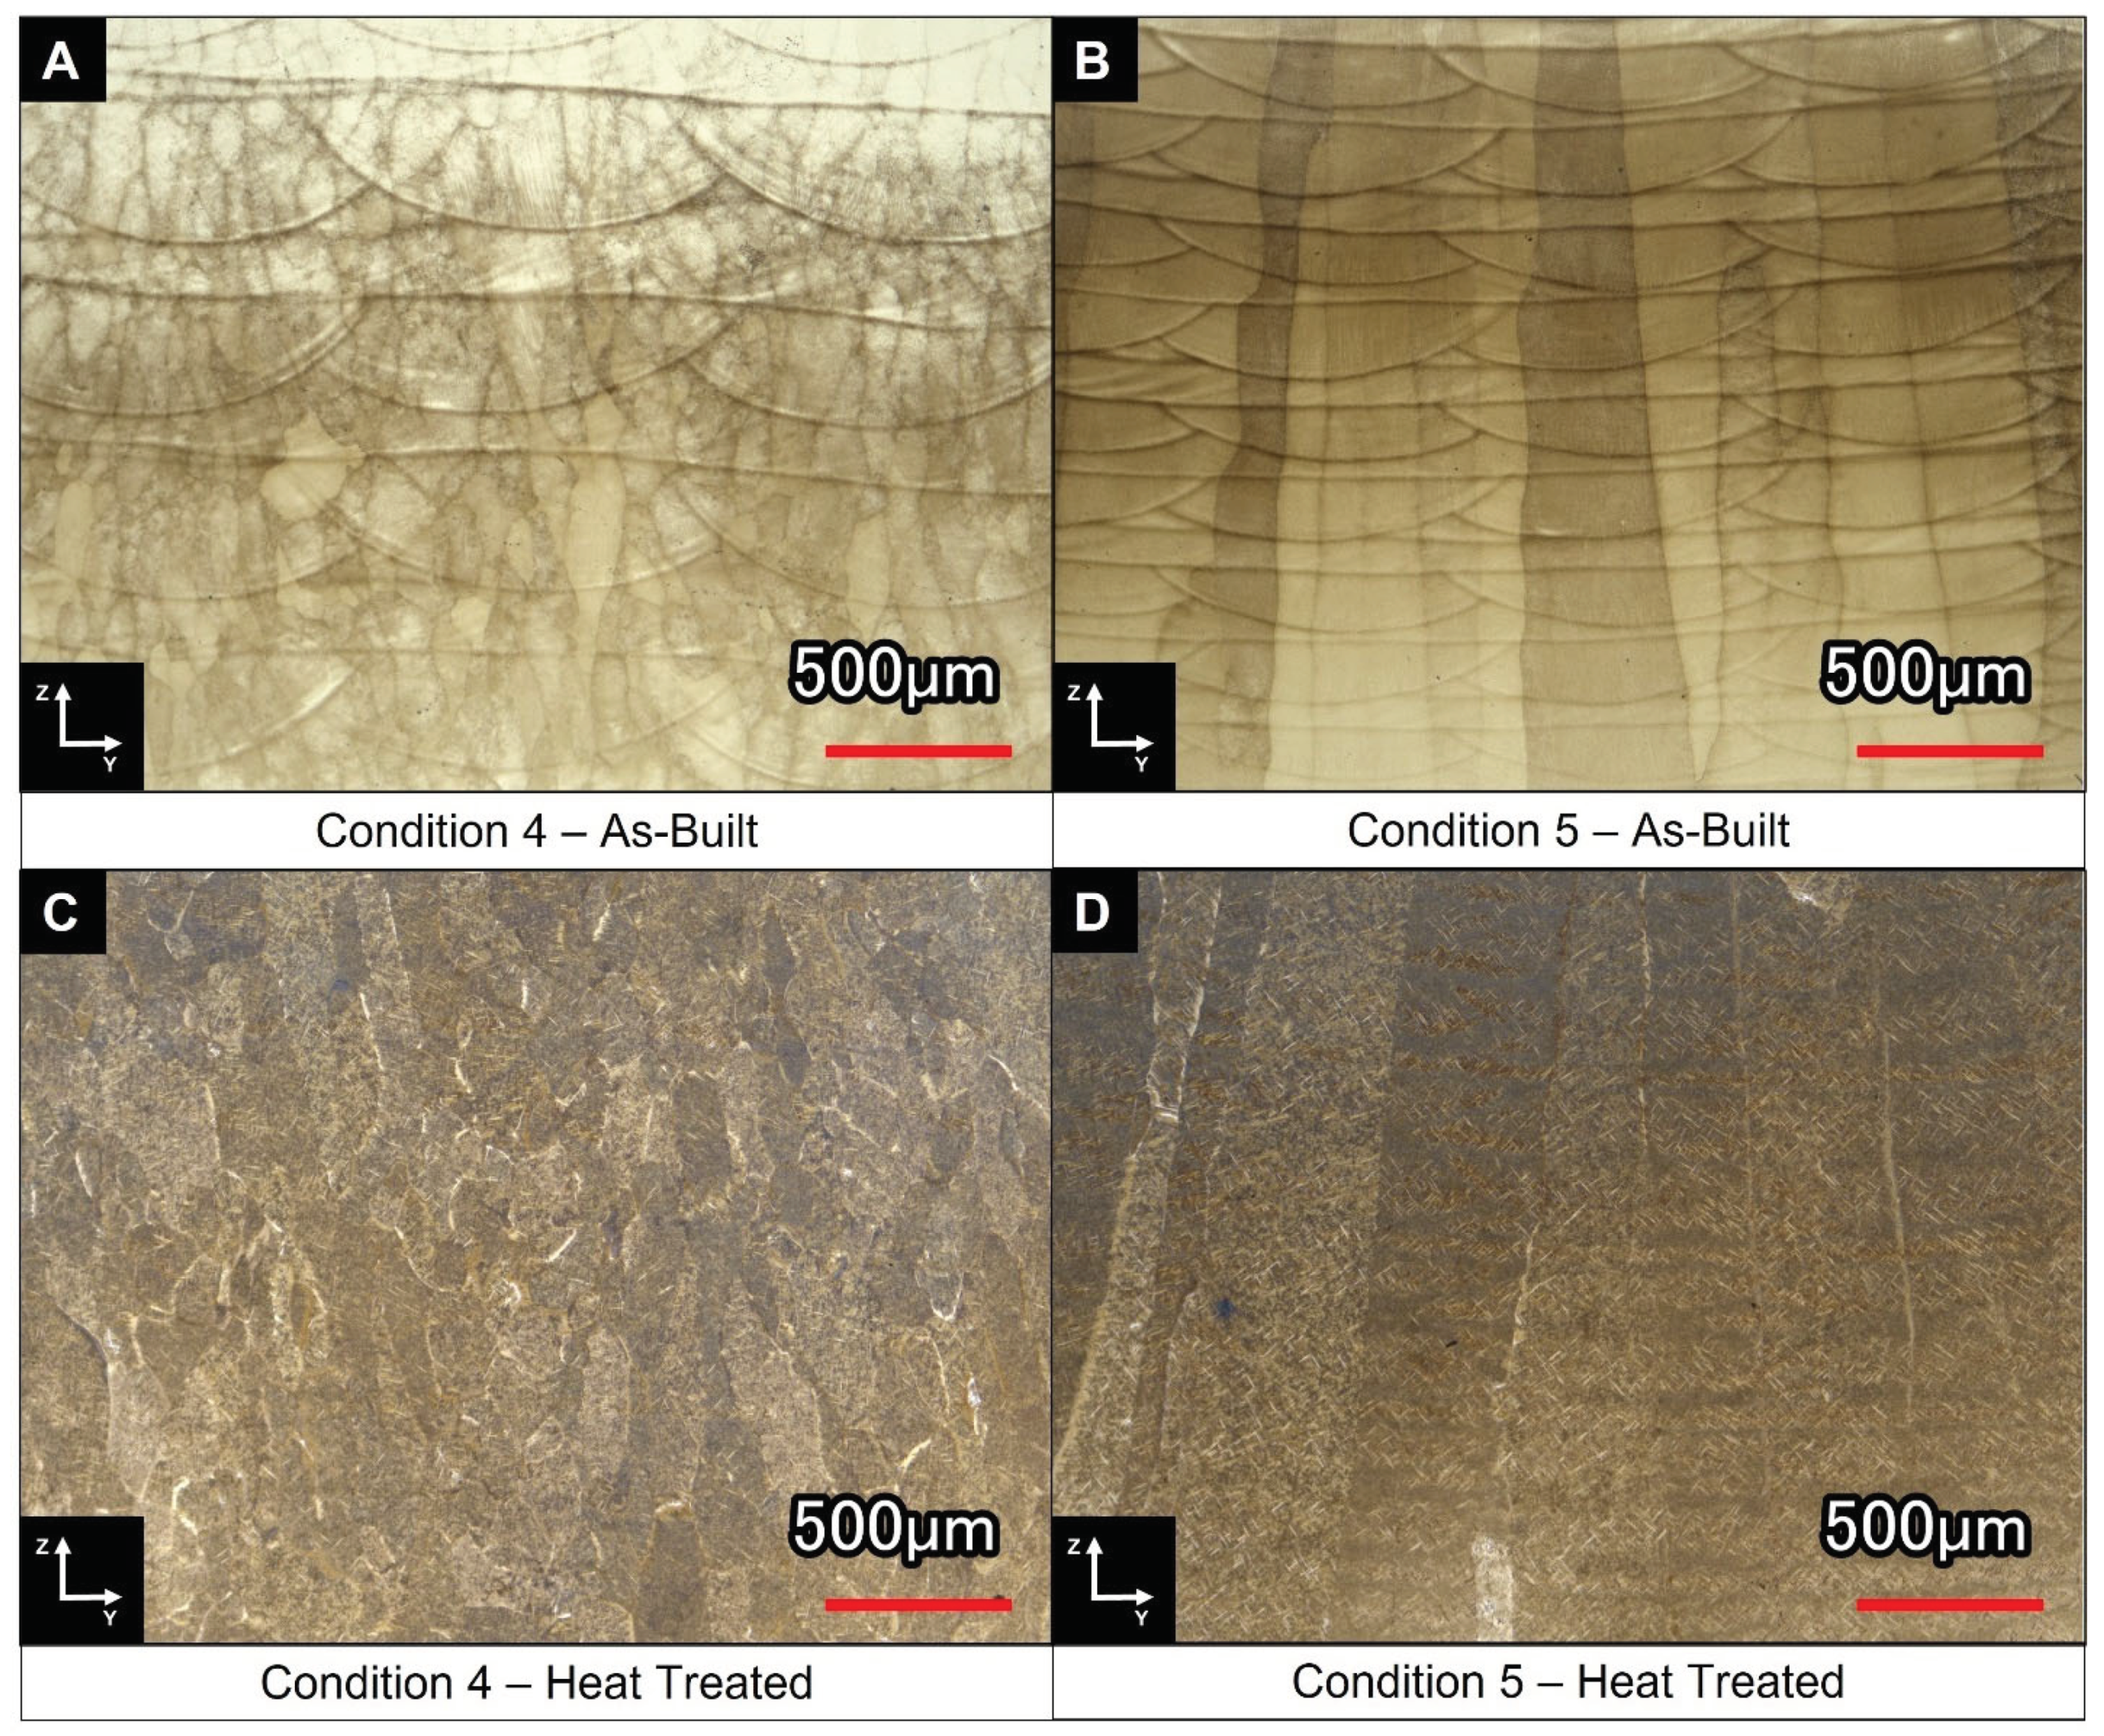
Cube specimens printed under build conditions 4 and 5 were mounted and polished for metallurgical examination. Cross sections of as-built and stress relieved specimens printed under identical parameters are presented in
Figure 10 for samples representing the center point of the CCDs (the condition to which the significance of changes was tested). The resulting as-built grain structures (
Figure 10a,b) were quite different. Condition 4 (ED = 173 J/mm
3, 509 W, 11.2 mm/s, 2.25 RPM, H
S = 1.010 mm, Z
S = 0.261 mm) exhibited a nominally equiaxed grain structure while condition 5 (ED = 324 J/mm3, 391 W, 11.2 mm/s, 0.75 RPM, H
S = 0.796 mm, Z
S = 0.135 mm) manifested a highly columnar grain structure that extended through numerous build layers. Etching of the samples (Kroll’s reagent) revealed the grain boundaries, alpha and beta phase contrast, and melt-track details. The bead size and layer thickness were notably larger in the higher power condition (509W, Condition 4), which is consistent with the single track bead height and width measurements. Samples stress relieved at 960°C for 1hr under high vacuum (
Figure 10c,d) did not exhibit any obvious recrystallization or grain growth.
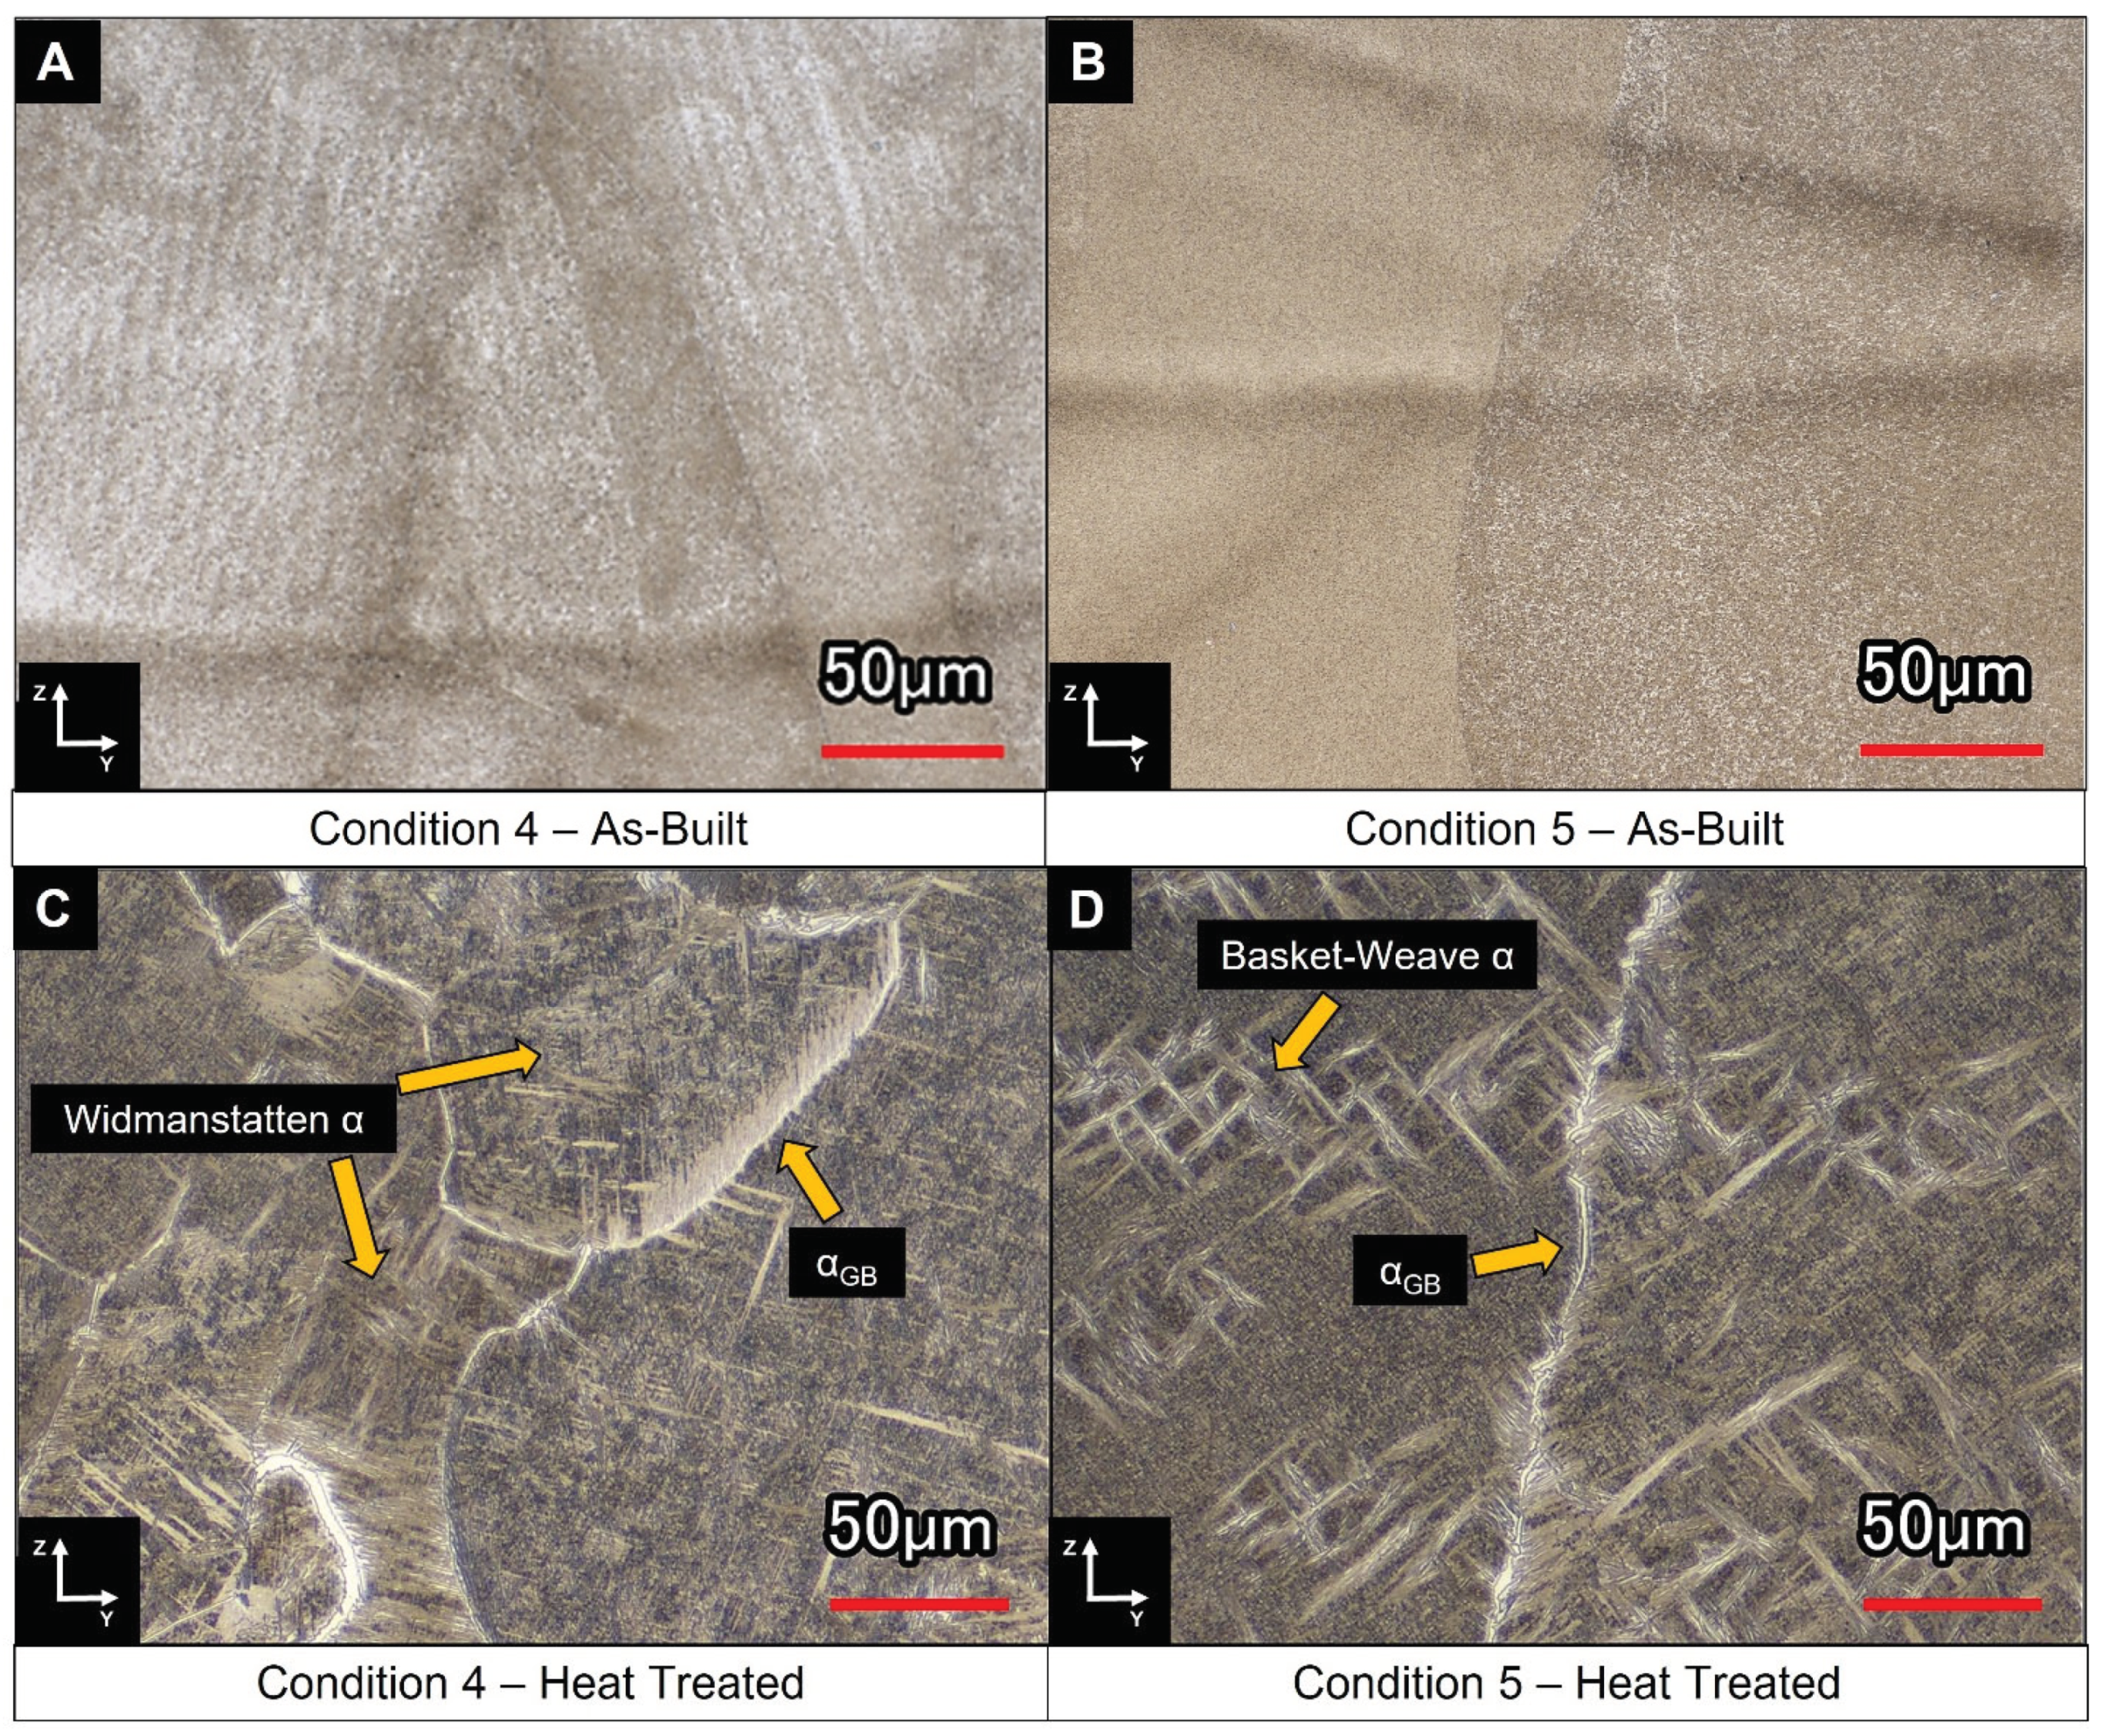
Higher magnification images of the as-built and stress relieved microstructures are presented in
Figure 11. Areas of Widmanstatten and basket-weave type alpha phase are present under both conditions post-stress relieving, though condition 5 appeared to experience a higher degree of alpha phase coarsening and contained bands of basket-weave alpha. Grain boundary alpha was also observed in the stress relieved microstructures.
A. Dass et al. described how DED process parameters influence the deposited microstructure [
1]. Increases in T
R and P
F and decreases in L
P lead to lower thermal gradients, G (K/cm), between the melt pool and the solidified material. Lower thermal gradients give rise to higher solidification front velocities, R (cm/s), which result in higher degrees of nucleation and equiaxed microstructures [
1]. The contrary promotes columnar growth due to less nucleation and a lower cooling rate while a mixed region exists between both regimes which contains a combination of equiaxed and columnar growth. The clear difference in grain structure between conditions 4 and 5 point to these deposition processes operating within two different grain structure regimes.
C. Liu et al. observed a mixed mode grain structure in laser melting deposition (LMD) processed Ti-55511 [
6]. In their work, epitaxial growth occurred at the bottom of the melt pool due to heterogeneous nucleation promoted by the previously deposited layer. Equiaxed growth occurred at the top of the melt pool due to higher nucleation from the powder feed and the columnar to equiaxed transition (CET) caused by constitutional supercooling from solute segregation. As a result, each layer consisted of columnar grains at the bottom and equiaxed grains at the top in a bamboo-like morphology.
Figure 10a,b exhibited entirely equiaxed and columnar structures, respectively. Although there was some localized evidence of epitaxial growth between successive layers in condition 4 (
Figure 10a), the bulk of the deposited material had an equiaxed grain structure. Condition 5 (
Figure 10b) was entirely columnar and showed no evidence of a CET.
Conditions 4 and 5 employed different L
P, P
F, H
S, and Z
S. Condition 4 used a high L
P and P
F which produced an equiaxed structure, suggesting that the high P
F promoted high nucleation and equiaxed growth despite a high laser energy input. Condition 4 also used relatively large H
S and Z
S (low X-Y and Z overlap), decreasing ED which manifested a lower thermal gradient and equiaxed structure. In contrast, condition 5 used a low L
P and P
F which produced a columnar structure, despite the use of a relatively low laser energy input. Condition 5 also employed a small H
S and Z
S (large X-Y and Z overlap), increasing ED which led to a higher thermal gradient and enhanced propensity for the observed columnar structure. Apparently, there is a change in the deposited structure over a small ED range (173-324 J/mm
3). This is consistent with the interaction effects of H
S and Z
S on the deposition process (see
Figure 9) where small H
S and Z
S (higher ED) caused a different density response than large H
S and Z
S (lower ED). It is also important to highlight that the columnar structure was produced using a higher energy density (324 J/mm
3) than the equiaxed structure (173 J/mm
3).
In condition 4, the higher LP was required to compensate for the additional powder mass flow and lower overlaps (higher HS and ZS). As a result, the overall ED is lower compared to condition 5, which used a lower laser power to account for a low powder mass flow and high heat accumulation in the deposited layer due to the higher overlaps. In either case, PF evidently influences the deposited structure and, likely, specimen density in a similar manner as LP.
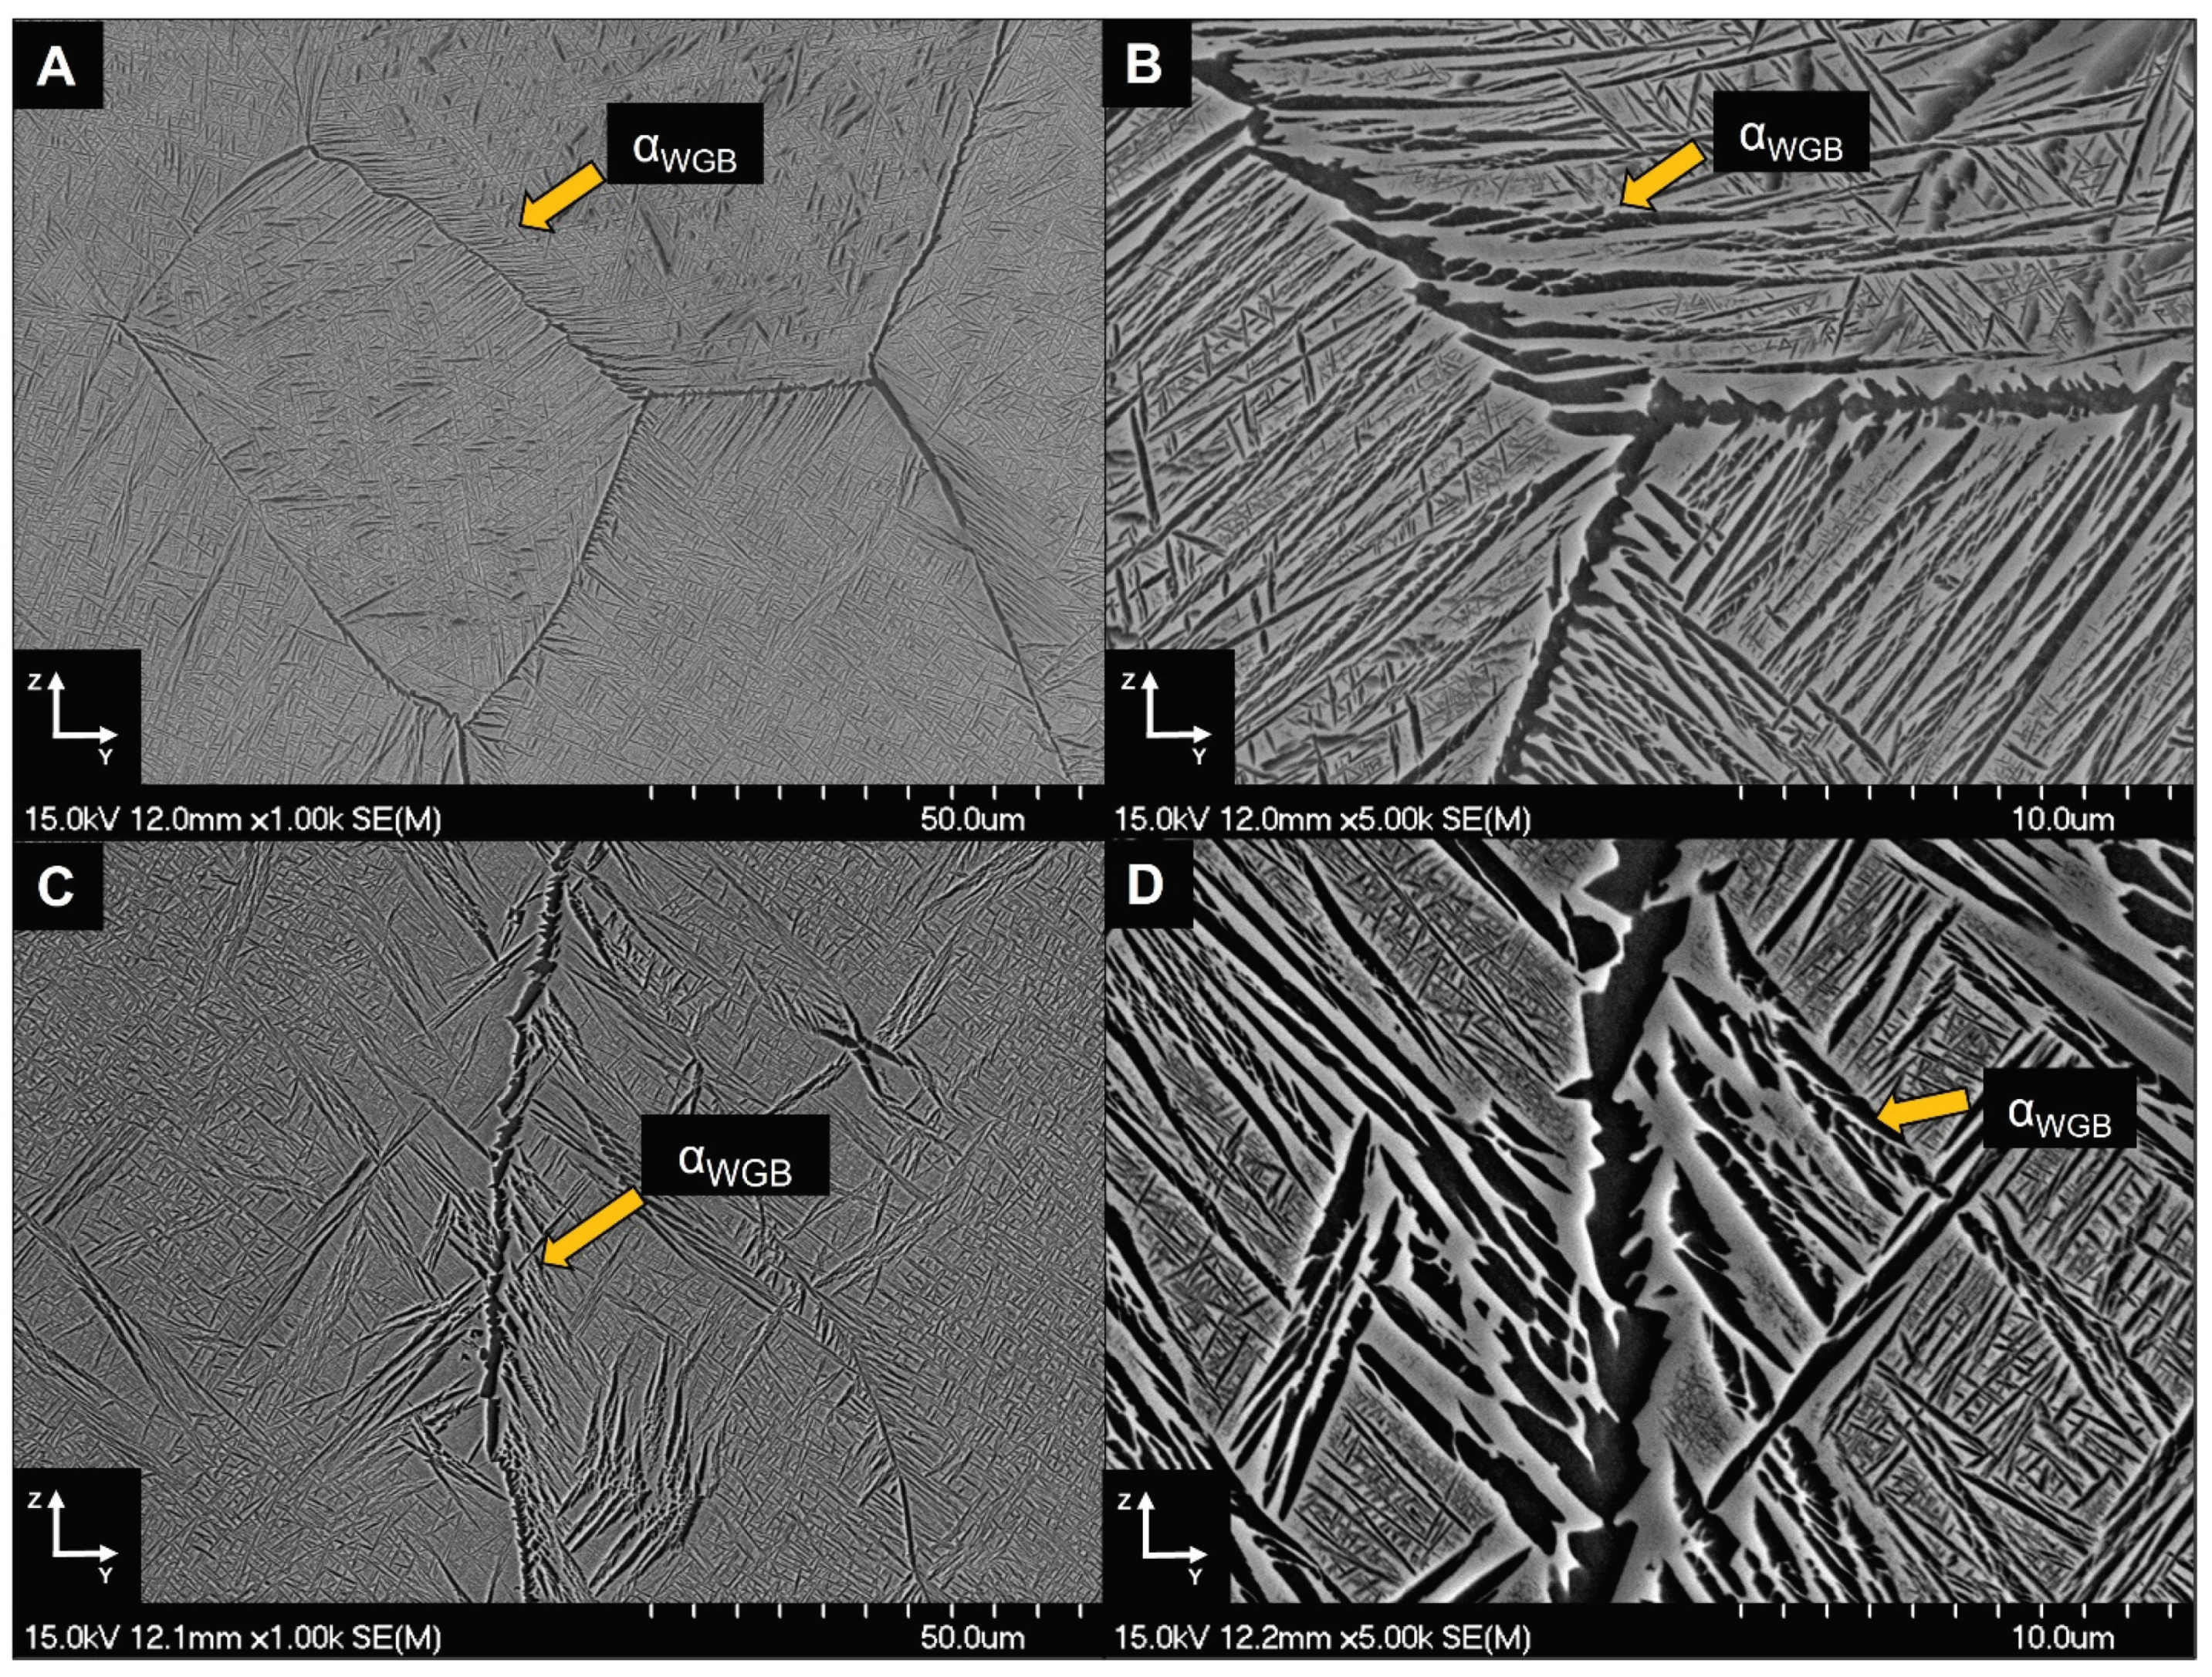
Post-heat treatment microstructures of deposition conditions 4 and 5 are shown in
Figure 12. Grain boundary alpha (α
GB) was present throughout both specimens and exhibited continuous and discontinuous features. Colonies of widmanstatten grain boundary alpha (α
WGB) were found throughout both deposition conditions. A basket weave microstructure of primary (α
P) and secondary (α
S) alpha was prominent within the beta grains. A thin precipitate free zone (PFZ) was also observed between the α
GB/α
WGB and the α
P/α
S regions.
The microstructures observed are consistent with the work of Liu et al., who studied the beta heat treatment of LMD Ti-55511 [
5]. Their work demonstrated that as-printed Ti-55511 specimens contained linear grain boundary alpha (α
LGB) because of the complex thermal cycling during deposition. The presence of continuous films of α
LGB in as-printed Ti-55511 allowed intergranular crack propagation through the PFZs and resulted in low ductility (<5%). In contrast, the formation of herringbone and Widmanstatten alpha phase morphologies, α
WGB, which forms upon cooling from the β phase field, breaks up the PFZs and limits crack propagation, increasing the ductility. Therefore, a β heat treatment (above the β transus temperature, T
β = 880°C, for Ti-55511 [
5]) is required to transform the retained α
LGB to α
WGB and improve the ductility of the material. The microstructures in
Figure 12 were heat treated above the β transus (T
HT = 960°C) and exhibit the discontinuous grain boundary morphologies reported by Liu et al. which can lead to superior ductility.
3.4. Mechanical Properties
Tensile properties for specimens printed under conditions 4 and 5 are presented in
Table 4. These two deposition conditions were selected for tensile testing due to their differing grain structures (see
Figure 11). The presented data are an average of 2 or more individual tests and all specimens were tested in the stress-relieved condition (960°C for 1hr under high vacuum). Each deposition condition was printed utilizing both recycled argon (Recycled Ar) and a direct purge of argon (Direct Ar) to shield the melt pool. In the direct purge (Direct Ar) set-up, high purity Ar gas (99.999% Ar) was drawn directly from the compressed gas bank to supply the shield gas and powder feeder carrier gas. This approach ensures that high-purity Ar gas is being used to shield the melt pool during the printing process to minimize contamination. However, it is more economical to recycle the Ar shield gas using an argon recirculation system. By printing under both recycled Ar and direct Ar shield gas conditions, the impact of shield gas impurity content in the recycled Ar process could be assessed.
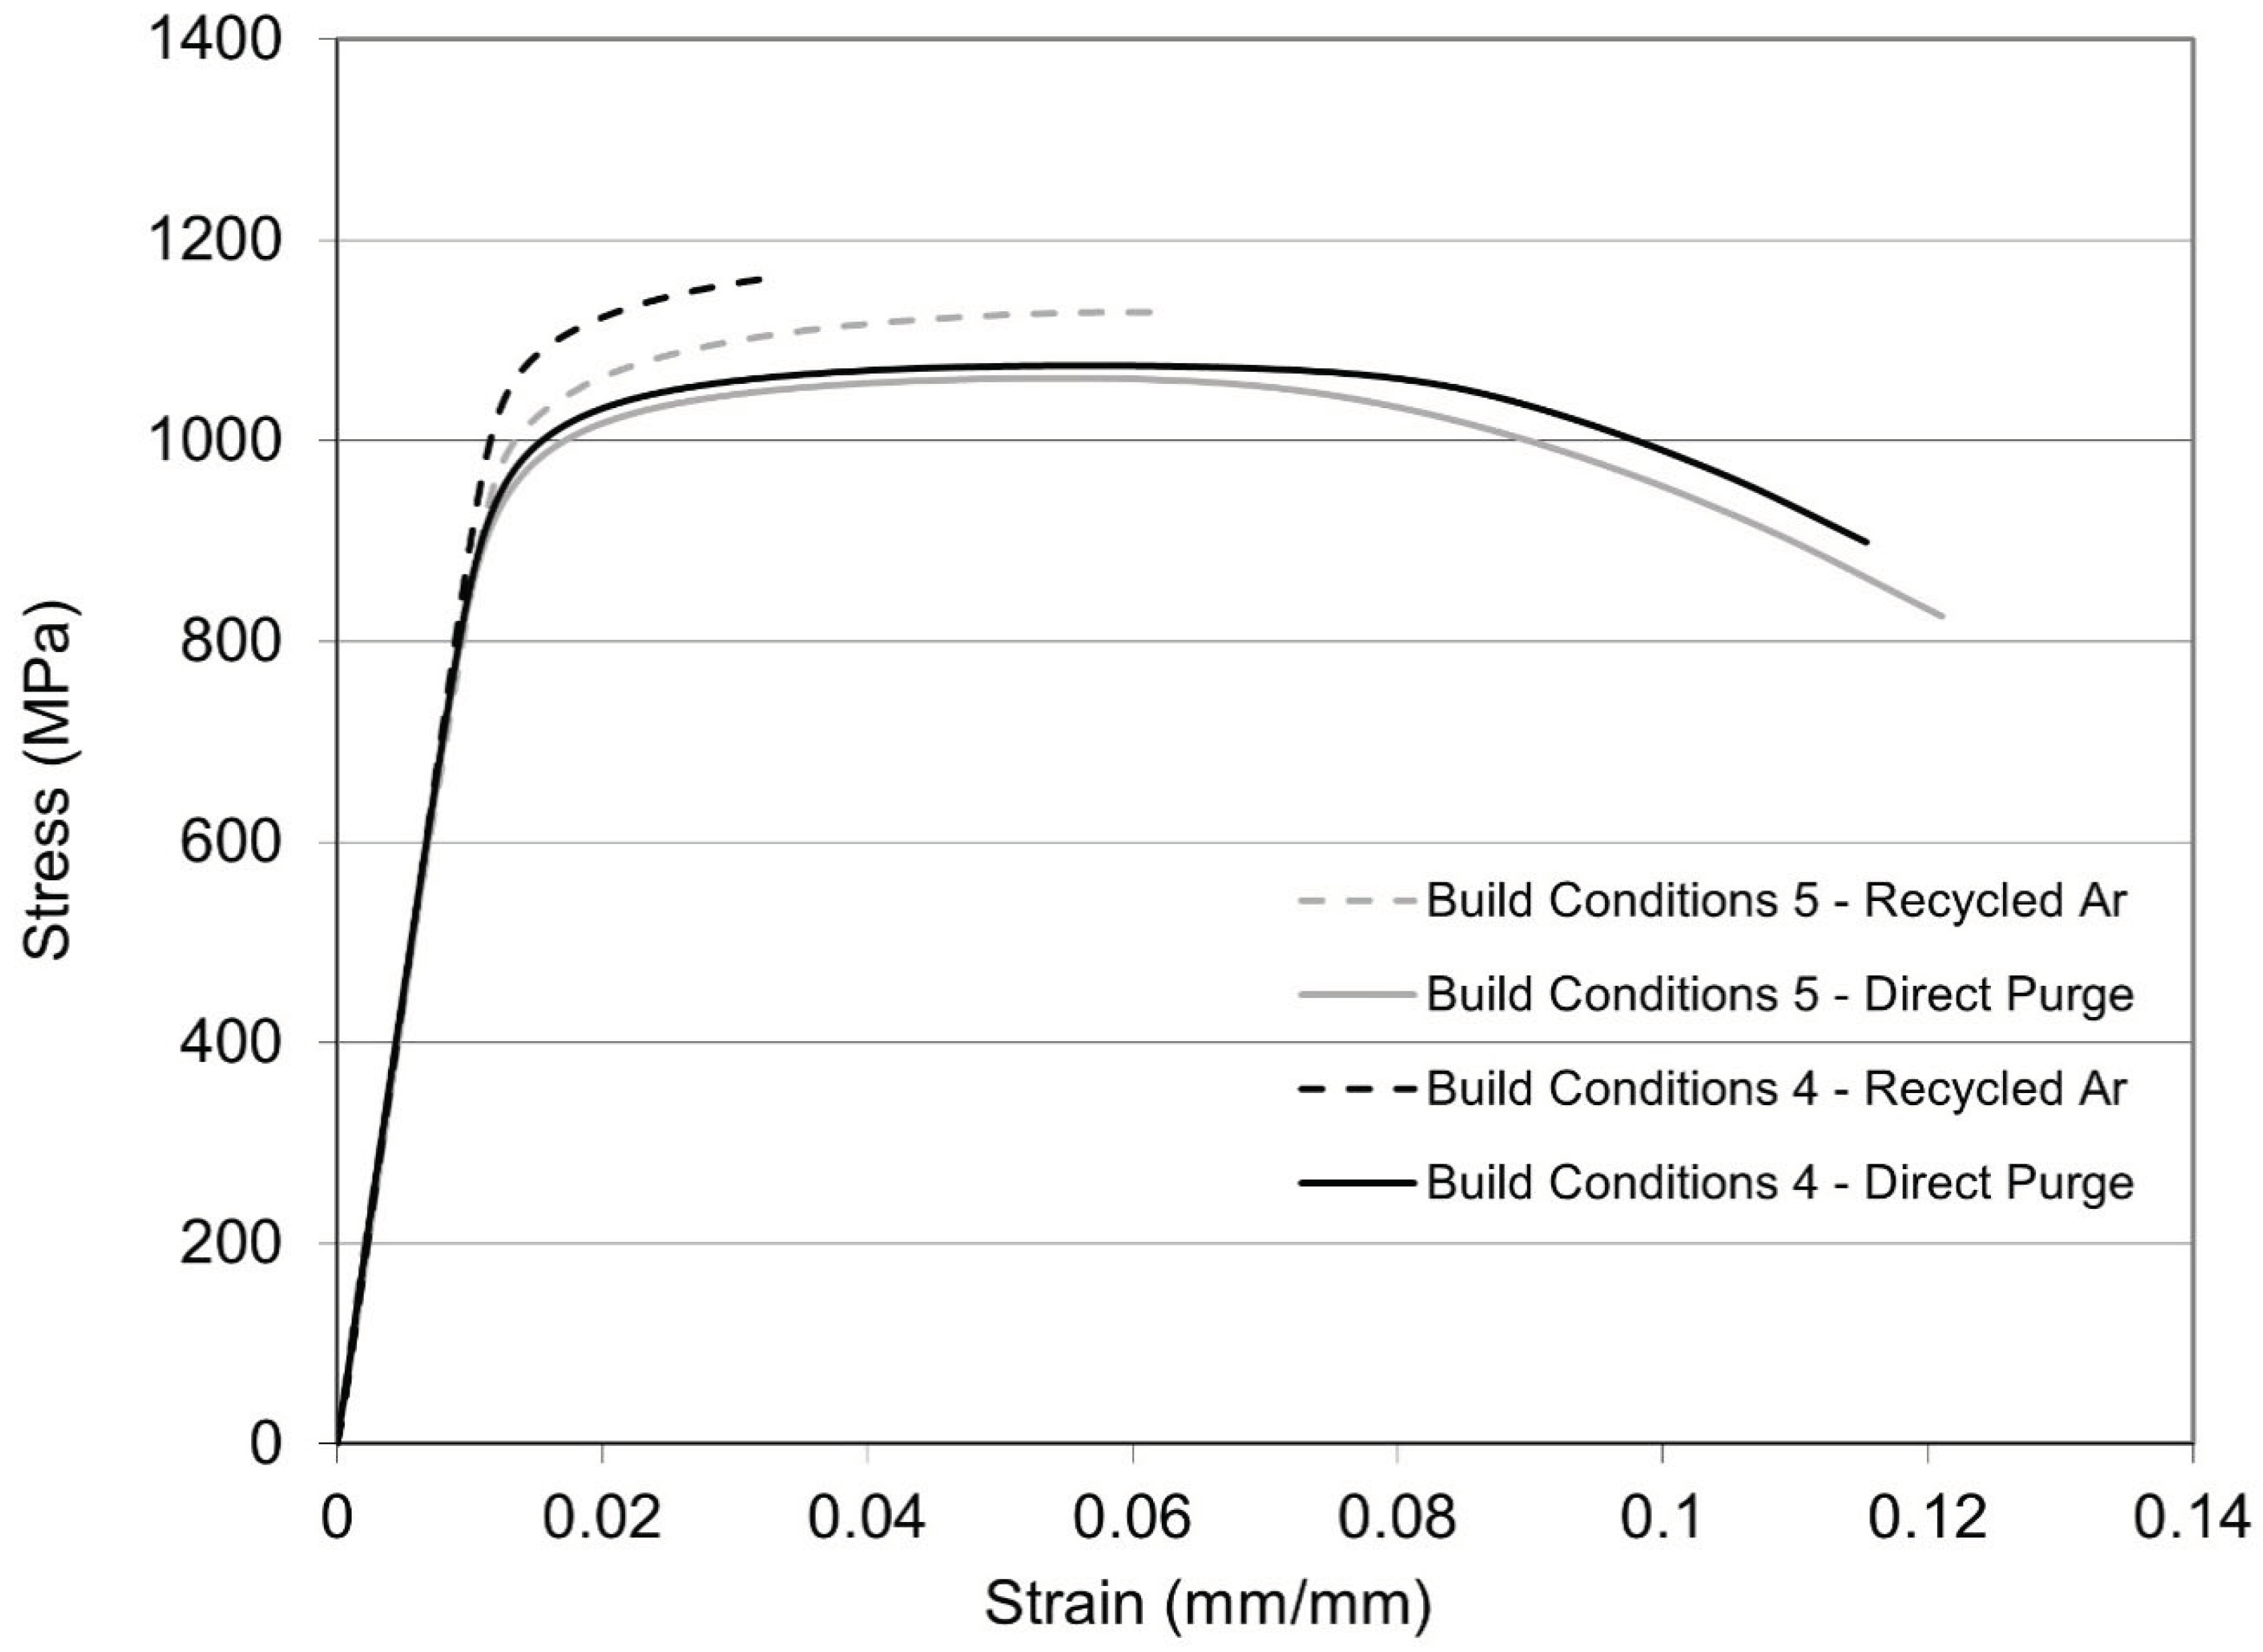
Specimens printed while continually recycling argon through the chamber, process shield gas, and powder feed exhibited acceptable ultimate tensile strength (UTS) and yield strength (YS) but poor ductility when compared with literature values [
5,
6]. The percent elongation for condition 4 was 2.7% while condition 5 had a higher ductility at 6.2%. The inferior ductility exhibited by condition 4 could be caused by a slightly lower density. Under the direct Ar condition, the specimens had lower UTS and YS, but were substantially more ductile and exceeded the elongation requirement in the literature [
5,
6]. The difference in elongation between the recycled Ar and direct Ar processing conditions is evident in the stress-strain curves presented in
Figure 13. In general, specimen printed using recycled Ar had inferior ductility to those printed under direct purge conditions regardless of the print parameter set employed.
Table 4.
Tensile properties for stress relieved specimens printed under conditions 4 (509W) and 5 (391W) using different shield gas sources.
Table 4.
Tensile properties for stress relieved specimens printed under conditions 4 (509W) and 5 (391W) using different shield gas sources.
| Condition |
Purge Gas Type |
E (GPa) |
Yield (MPa) |
UTS (MPa) |
EL (%) |
| 4 |
Recycled Ar |
92 |
1092 |
1167 |
2.7 ± 0.9 |
| 4 |
Direct Ar |
88 |
960 |
1062 |
9.7 ± 1.8 |
| 5 |
Recycled Ar |
84 |
1022 |
1138 |
6.2 ± 1.0 |
| 5 |
Direct Ar |
86 |
952 |
1056 |
12.2 ± 0.0 |
| [5,6] |
N/A |
- |
≥1010 |
1080-1280 |
≥8 |
Titanium has a high affinity to oxygen, nitrogen, and carbon. These elements diffuse interstitially through the microstructure and can negatively impact the ductility [
34,
41]. Rousseau et al., highlighted that by increasing the oxygen content in Ti-6Al-4V up to a limit of 2000 ppm O
2, the tensile strength could be improved without negatively impacting the ductility [
42]. However, controlling the impurity content during printing is critical because the interstitial content can cause embrittlement [
43]. Generally, when high ductility and toughness are required, as is the case in most Ti-alloy aerospace applications, the interstitial content must be kept to acceptably low levels to prevent embrittlement [
43].
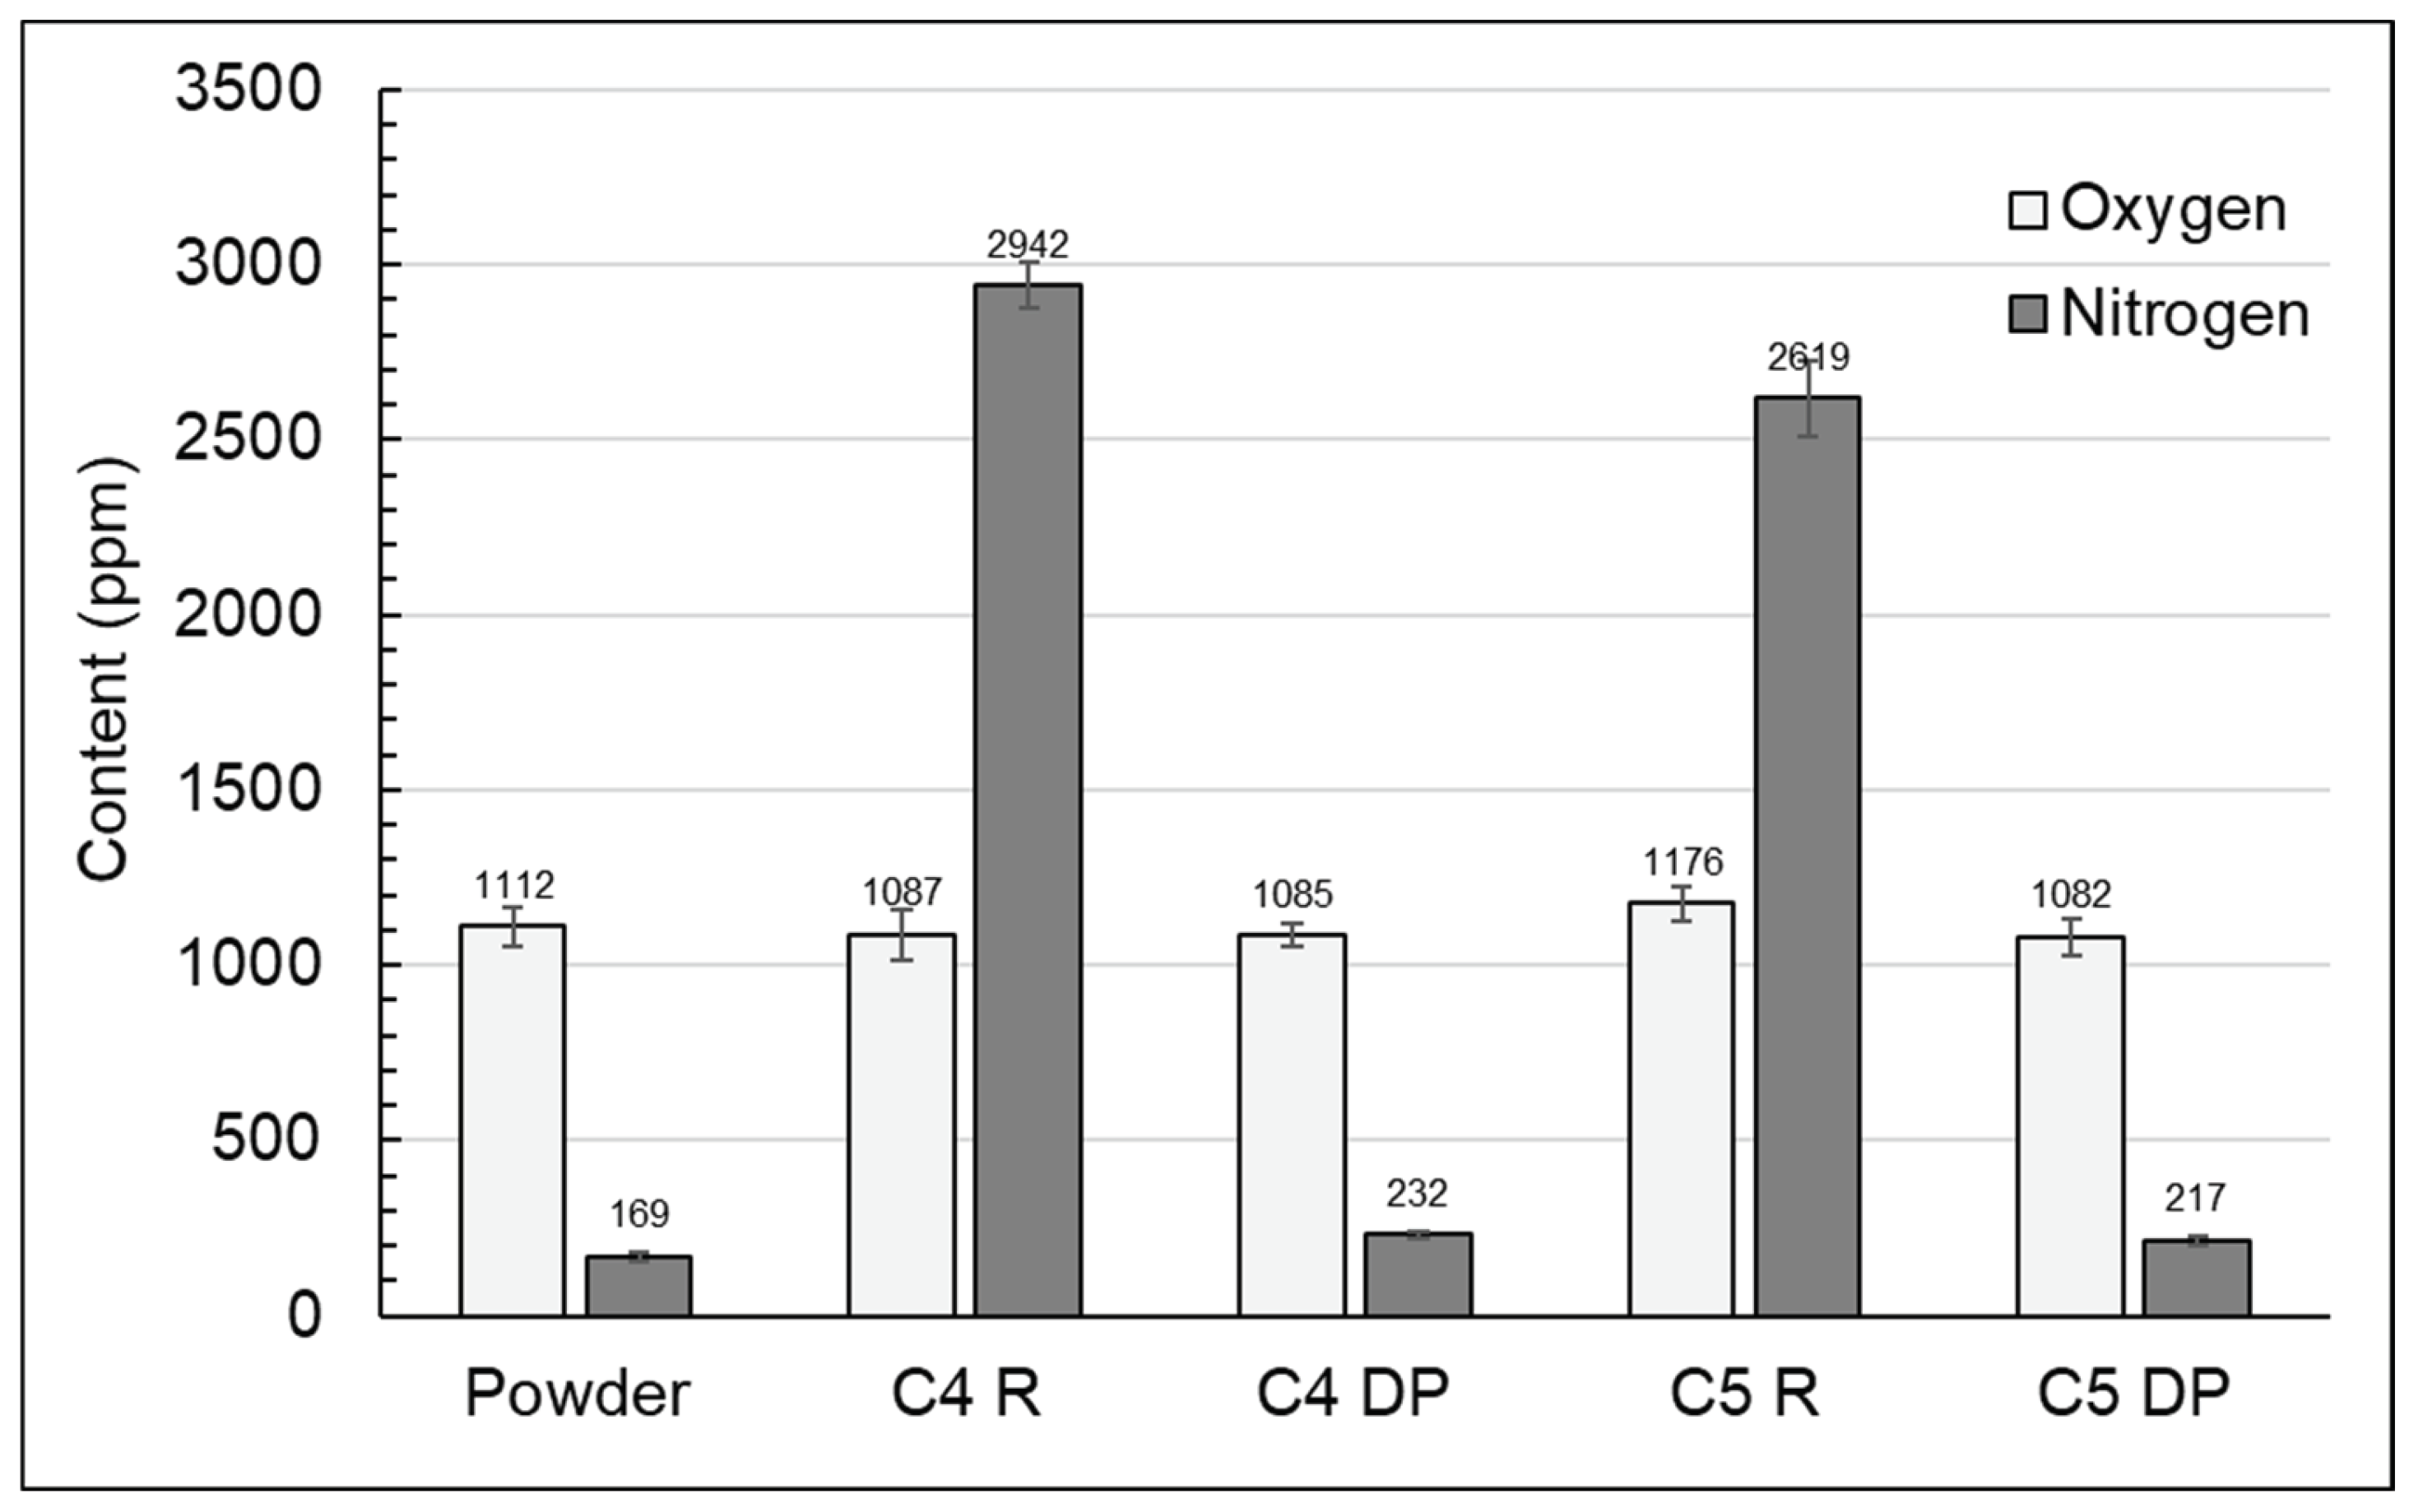
The oxygen and nitrogen (ON) contents of the tensile specimens were measured to quantify and compare the impurity level imparted by the recycled and direct Ar process conditions. The results, presented in
Figure 14, demonstrate that there was a significant amount of nitrogen pick-up during the deposition process when the argon purge gas was continually recycled. The Ti-55511 powder feedstock had 169 ppm N
2, but processing using the recycled Ar gas caused an increase to over 2500 ppm N
2. In contrast, the oxygen content was consistently 1100 ppm O
2 for the powder feedstock and all deposition conditions. The ductility achieved under the direct Ar purge condition is aligned with the results reported by Rousseau et al., where ductility could be maintained in Ti-6Al-4V with oxygen levels below 2000 ppm O
2 [
42]. In the recycled Ar case, the accumulation of N
2 in the deposited Ti-55511 clearly caused embrittlement. Although this result may not be surprising, it highlights the importance of monitoring O and N impurity levels in the DED process environment for Ti alloys.
The tensile specimen printed using recycled Ar exhibited elevated N
2 contents, but their O
2 contents were consistent with the level measured for the as-received Ti-55511 powder. Tensile specimen printed with the direct Ar showed no significant change in O or N content from the as-received powder. This result implies that the source of the N
2 contamination was in the Ar recirculation system. However, an air leak in the Ar recirculation system would have imparted both O
2 and N
2 to the material. Therefore, an alternate source of N
2 in the Ar recirculation system must have existed. To further investigate the source of the N
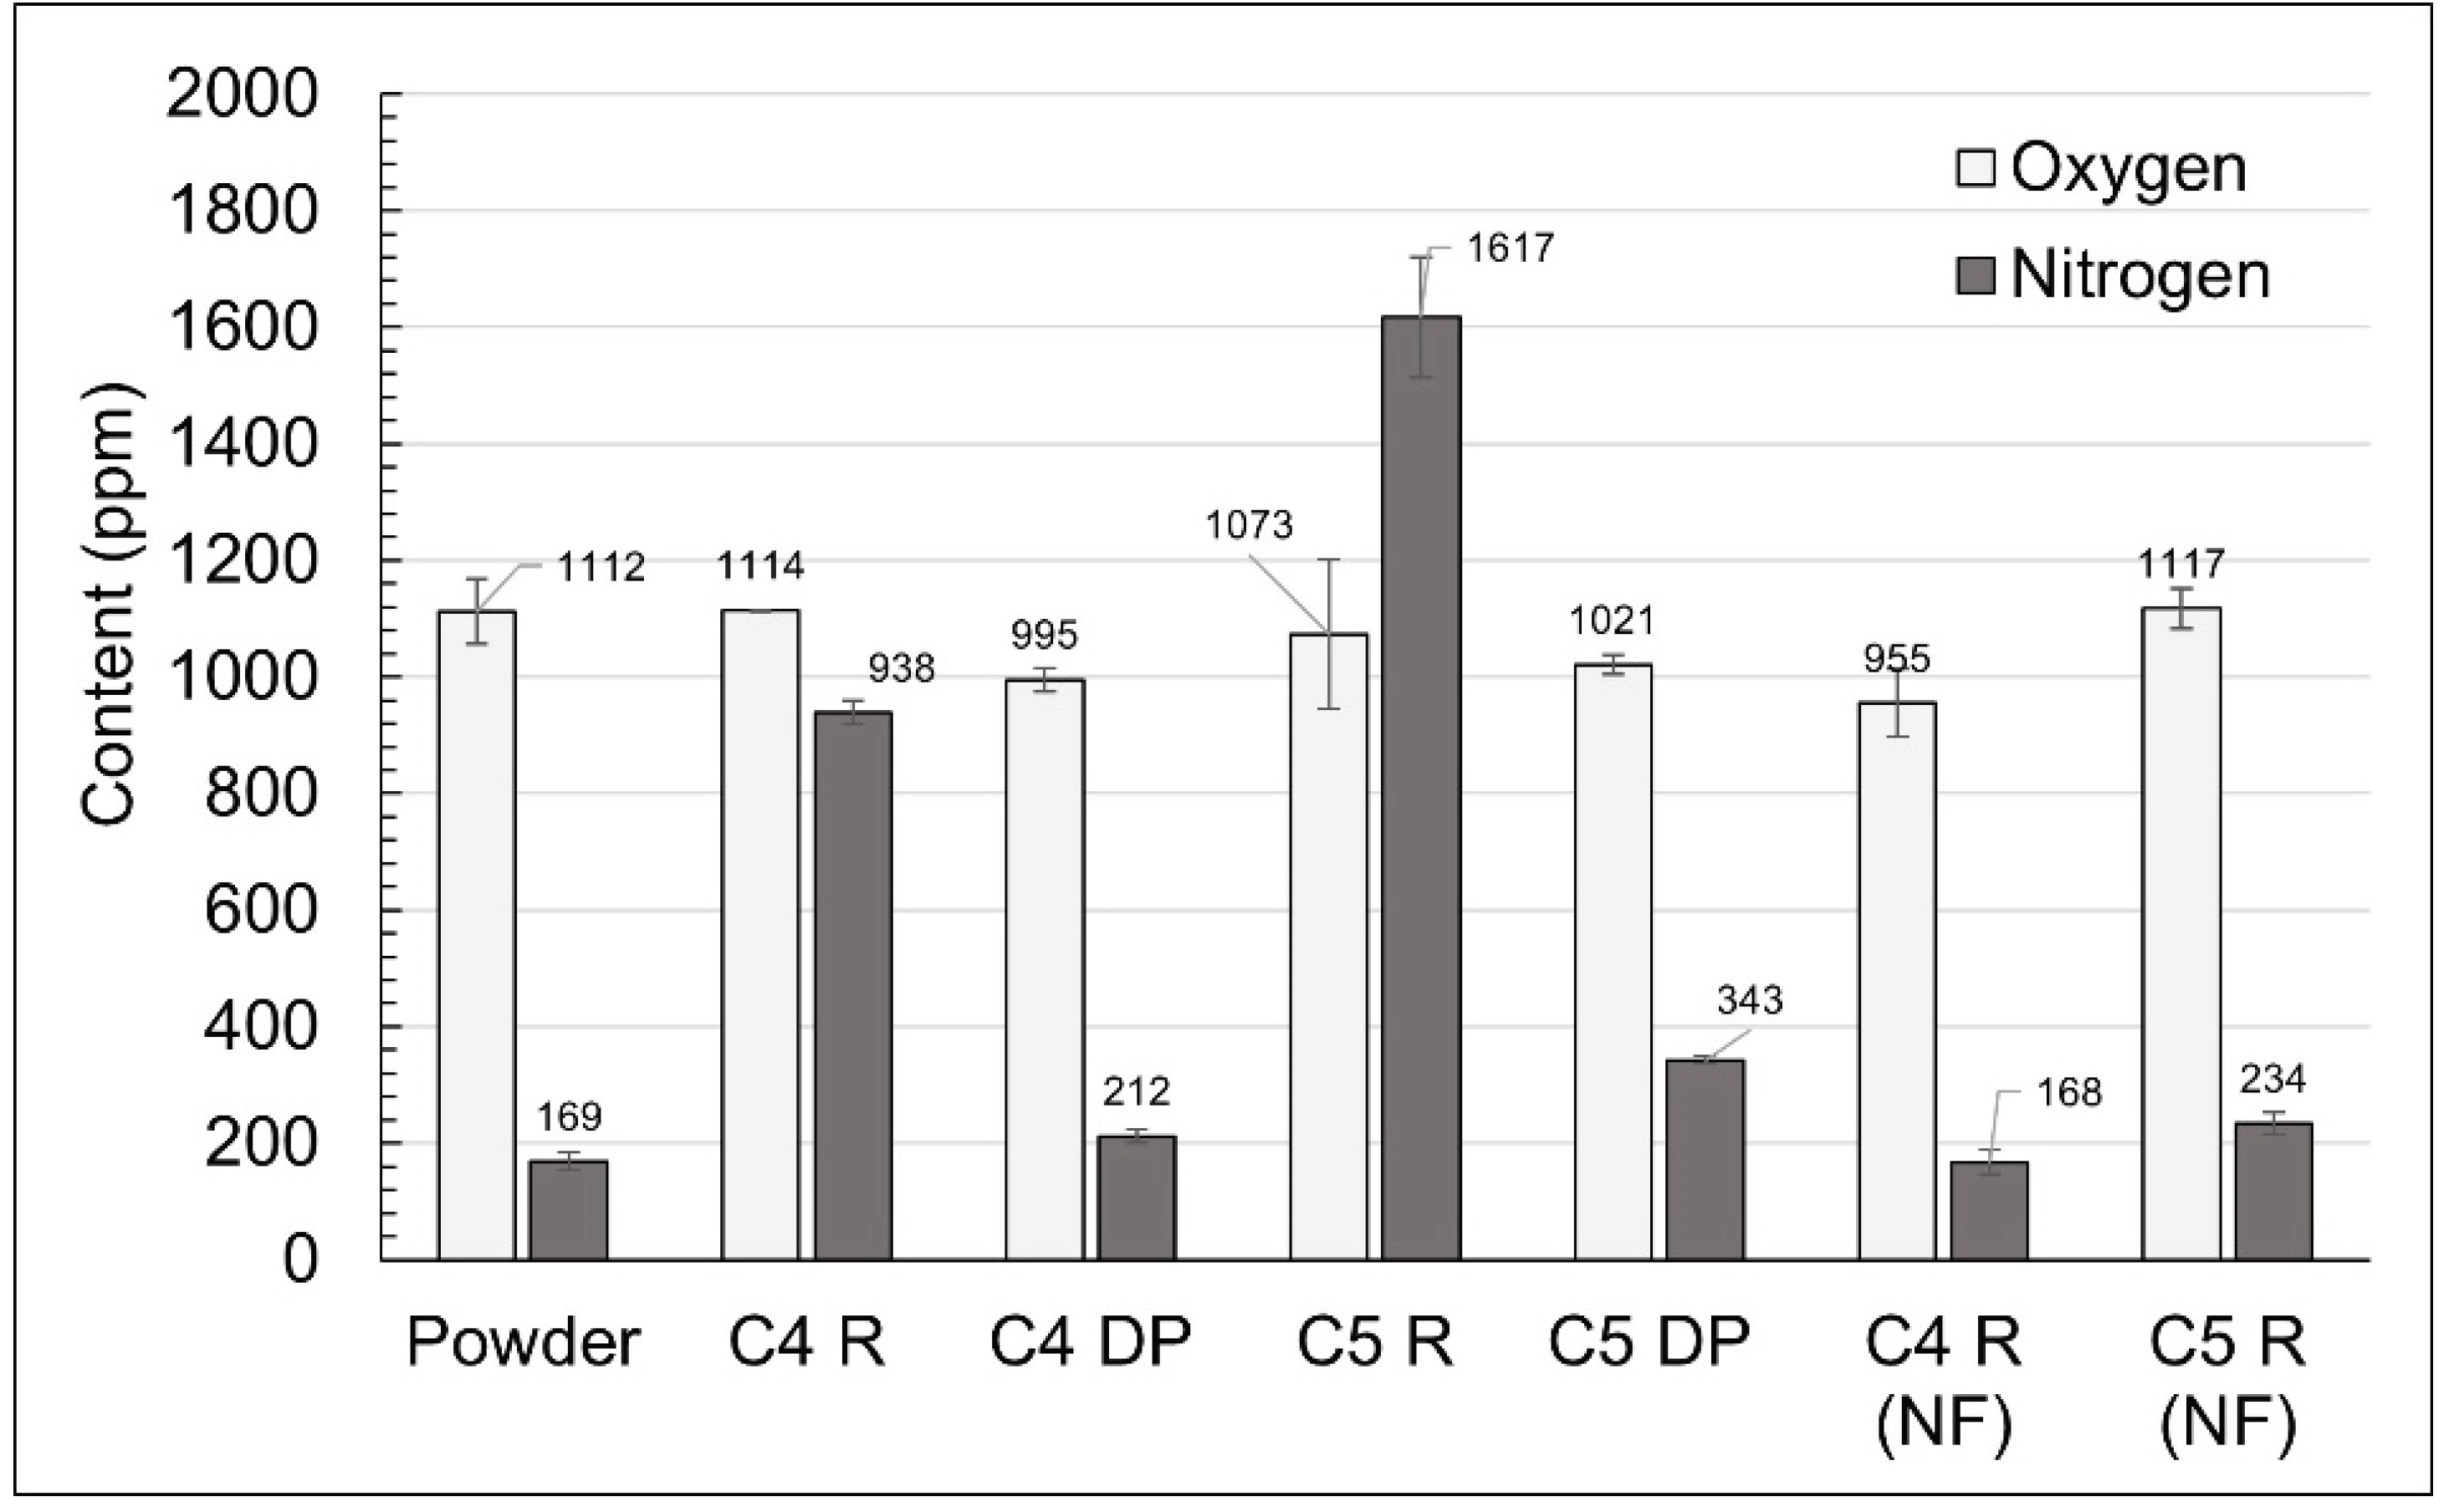
2 contamination, additional ON test pins were printed using deposition conditions 4 and 5 with both the recycled and direct purge Ar. Following these additional prints, the particulate filter in the Ar recirculation system was replaced and an additional set of ON test pins were printed using deposition conditions 4 and 5 with the recycled Ar. The ON results for these test pins are compared in
Figure 15.
The ON results from the Ti55511 test pins demonstrated that the N
2 pick-up observed in the tensile specimens (
Figure 14) was repeatable and that the same trend was present in the ON test pins (
Figure 15). Ti55511 pins printed using recycled Ar showed increased N
2 content while specimen printed with direct Ar showed no significant ON pick-up. When the particulate filter in the Ar recirculation system was replaced prior to printing, test pins printed with the recycled Ar no longer exhibited significant ON pick-up. Evidently, the observed N
2 pick-up was effectively mitigated by employing a new filter in the Ar recirculation system. The filter in the Ar recirculation system captures metal particulate formed during printing operations. It is postulated that accumulated metal particulate in the filter off-gassed N
2 into the recirculating Ar purge gas, causing the shield gas for the melt pool to contain elevated levels of N
2 which then contaminated the Ti55511 during printing.
The chemical composition of samples printed under DED conditions 4 and 5 are presented in
Table 5. The compositions were nearly identical under both processing conditions and were within the acceptable compositional range. The composition of the printed material was also very similar to the as-received powder composition, exhibiting no major loss of alloying additions during the DED process or subsequent heat treatment.
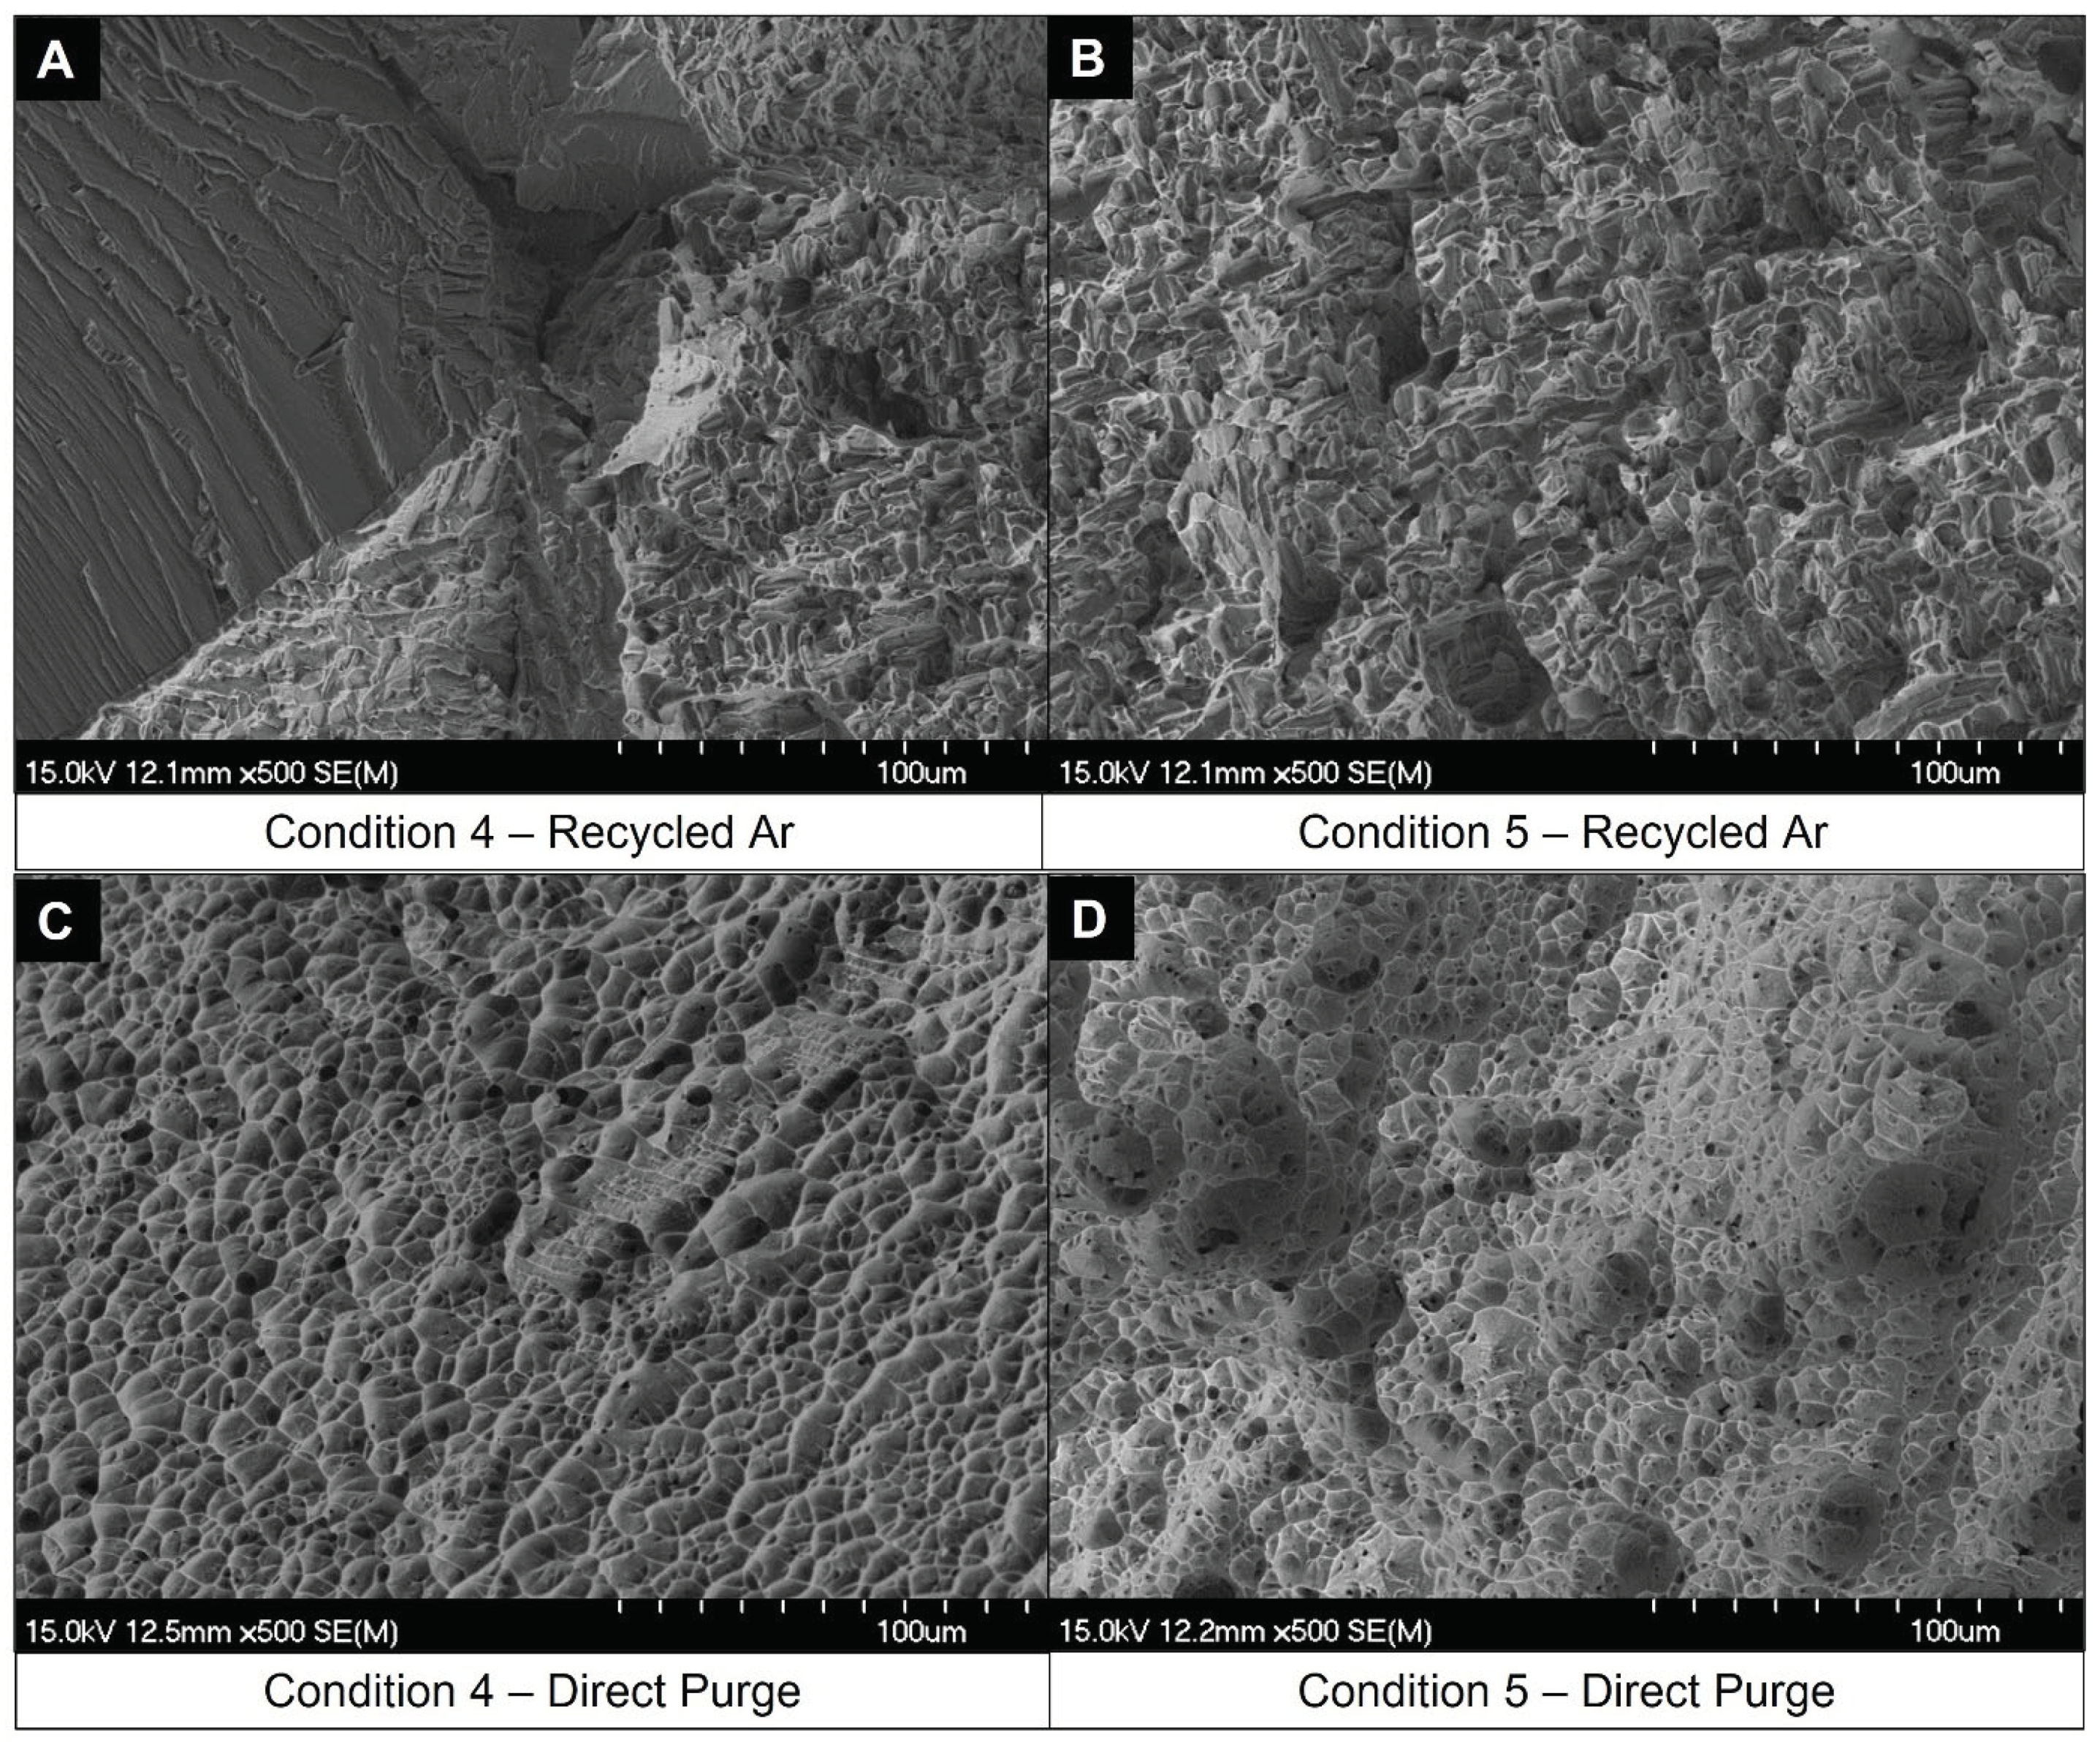
Fracture surfaces of the four different tensile specimens are presented in
Figure 16. The specimens printed using the recycled Ar process gas (
Figure 16a,b) exhibited brittle, intergranular fractures while the direct Ar (
Figure 16c,d) displayed a ductile, trans-granular fracture mode. The fracture surfaces for condition 4 and 5 were very similar under each processing gas set-up.
The tensile specimens in this work were stress relieved above the beta transus temperature (β heat treatment). The specimens which were processed under the direct Ar process gas formed the beneficial α
WGB phase in the grain boundaries (see
Figure 12) and displayed high ductility (See
Table 4 and
Figure 13). Liu et al. concluded that DED Ti-55511 required an intermediate heat treatment following the initial stress relieving/β heat treatment to coarsen the α
WGB phase and avoid an intergranular mode of fracture which would decrease the ductility [
5]. By applying additional heat treatments, Liu et al. achieved 11% elongation in DED Ti-55511, which exceeds the requirements outlined in the literature [
5]. In the present study, so long as the interstitial content was minimized, elongations between 10-12% were achieved after a single β heat treatment step above the β transus temperature. However, the UTS and YS were lower than those reported for DED Ti-55511 with additional heat treatment steps beyond the initial β heat treatment step. Additional aging steps at 750°C and 600°C promote the development of beneficially α
P and α
S, which increase strength by resisting dislocation motion and limiting crack propagation. Therefore, the development of α
P and α
S through subsequent aging treatments increases strength but is not detrimental to the ductility.
