Preprint
Article

Pressure-Driven Responses in Cd2SiO4 and Hg2GeO4 Minerals: A Comparative Study

Altmetrics

Downloads

90

Views

30

Comments

0

A peer-reviewed article of this preprint also exists.

Submitted:

08 March 2024

Posted:

08 March 2024

You are already at the latest version

Alerts
Abstract
The structural, elastic, and electronic properties of orthorhombic Cd2SiO4 and Hg2GeO4 were examined under varying pressure conditions using first-principles calculations based on densi-ty-functional theory employing the projector augmented wave method. The obtained cell pa-rameters at 0 GPa were found to align well with existing experimental data. We delved into the pressure-dependence of normalized lattice parameters and elastic constants. In Cd2SiO4, all lat-tice constants decreased as pressure increased, whereas in Hg2GeO4, parameters a and b de-creased while parameter c increased under pressure. Employing the Hill average method, we calculated the elastic moduli and Poisson’s ratio up to 10 GPa, noting an increase with pressure. Evaluation of ductility/brittleness under pressure indicated both compounds remained ductile throughout. We also estimated elastic anisotropy and Debye temperature under varying pres-sures. Cd2SiO4 and Hg2GeO4 were identified as indirect band gap insulators, with estimated band gaps of 3.34 eV and 2.09 eV, respectively. Interestingly, Cd2SiO4 exhibited a significant increase in band gap with increasing pressure, whereas the band gap of Hg2GeO4 decreased under pres-sure, revealing distinct structural and electronic responses despite their similar structures.
Keywords: 
Subject: Physical Sciences  -   Condensed Matter Physics

1. Introduction

Thenardite is a mineral consisting of anhydrous sodium sulfate and is commonly found in dry evaporite environments. Gmelin [1] identifies eight distinct anhydrous phases of sodium sulfate. The phase commonly referred to as thenardite, named after the mineral, is designated as Na2SO4(V). It is documented to exhibit stability within the temperature range of 32°C to approximately 180°C. The thenardite mineral crystallizes in an orthorhombic structure with Fddd space group. The atomic arrangement in ternary compounds of the AB2O4 type is known to be influenced by the relative sizes of the A and B cations. Muller and Roy [2] demonstrated that the stability of the structure type relies on the comparative sizes of these cations. They found that within silicate and germanate compounds, the olivine structure type can accommodate a wider spectrum of octahedral cation sizes in contrast to other structure types. Despite earlier expectations from cation radius assessments indicating that chromous orthosilicate would adopt the olivine structure, Cr2SiO4 was observed to crystallize in the thenardite-type structure instead [3,4,5]. Typically, the latter is associated with cations that are larger than those present in silicates and germanates exhibiting the olivine structure type. Mercury orthogermanate, Hg2GeO4 [6], and cadmium orthosilicate, Cd2SiO4 [7], represent the sole other known compounds featuring this particular structure type.
Mehrotra et al. [5] conducted a comprehensive review of compounds exhibiting isomorphism with thenardite in 1978. Apart from Na2SO4 and Na2SeO4, the structural configuration resembling thenardite is also observed in Ag2SO4, various mixed phosphates and arsenates (such as AgHgPO4, NaCdAsO4, AgCdAsO4). In such materials, non-tetrahedral elements (Na, Ag, Cd, Hg) are situated close to the centres of distorted six-cornered polyhedra, maintaining significant separation. Cr2SiO4 exhibits the Fddd space group, akin cell dimensions, and comparable oxygen atomic coordinates. The primary distinction lies in the z coordinate of Cr in contrast to that of Na, Ag, Hg, or Cd atoms. In Na2SO4, Na atoms within highly distorted octahedra are spaced 3.60 Å apart. Contrastingly, in the comparable observation of Cr2SiO4, the movement of O atoms, notably the displacement of the Cr atom along the c axis, results in (1) flattening one side of the octahedron to form a (distorted) equatorial plane, and (2) relocating the Cr atom from its position near the midpoint of the octahedron to the face of the equatorial plane. This motion simultaneously extends the distance to the oxygens in the tetrahedral edge while reducing the distance to the Cr atom in the neighboring equatorial plane.
The exploration of cadmium silicate, encompassing its three distinct stoichiometries: CdSiO3 [8], Cd2SiO4, and Cd3SiO5 [7], has been ongoing since the early 20th century, primarily due to its luminescent properties [9]. This luminescence, often referred to as persistent luminescence, has found applications in various fields, including bioimaging, optical data storage, as well as decorative and emergency signalling [10,11,12]. Notably, Dy3+ doped cadmium silicate materials have demonstrated persistent luminescence exceeding five hours [12]. Cadmium silicates adopt specific structures at room temperature which are: monoclinic CdSiO3, orthorhombic Cd2SiO4, and tetragonal Cd3SiO5. The initial structure (CdSiO3) is classified within the P121/c1 space group, characterized by three asymmetrically distorted (CdO6)4- octahedra arranged in slabs parallel to the (0 1 0) plane, with unbranched silicate chains serving as separators. These chains are composed of regular corner-sharing (SiO4)4- tetrahedra [8]. The second structure (Cd2SiO4) is classified within the Fddd space group and comprises solely one asymmetrically distorted (CdO6)4- octahedron amidst highly regular (SiO4)4- tetrahedra [7]. The final structure (Cd3SiO5) is categorized under the P4/nmm space group, featuring two distinctly symmetric (CdO6)4- octahedra positioned between regular (SiO4)4- tetrahedra [7,13]. Furthermore, the thenardite-type compound Hg2GeO4 was synthesized by Rfpke and Eysel (1978) through hydrothermal methods at 673 K and 2 x 10⁸ Pa in a welded gold capsule. Hg2GeO₄ is the sole known compound within the HgO-SiO₂-GeO₂ system. Mehrotra et al. [5] proposed a tentative structure based on geometrical considerations, a proposal later generally confirmed by Hesse in 1981 [6]. The inclination of Hg²⁺ toward twofold coordination is apparent from the varying short and long Hg-O distances, leading to a markedly distorted structure within the thenardite family [14].
Cr2SiO4 and Cd2SiO4 possessing the orthorhombic thenardite structure have undergone examination under elevated pressures [15,16]. The Cd2SiO4 structure underwent thorough refinement under different pressures, reaching up to 9.5 GPa. This analysis unveiled a bulk modulus of 119.5±0.5 GPa, accompanied by a pressure derivative B0’ valued at 6.17(4). On the contrary, the structure of Cr2SiO4, refined up to 9.2 GPa, demonstrated a bulk modulus of 94.7±0.5 GPa, alongside a B0’ value of 8.32(14). Miletech et al. [16] attributed the relatively lower bulk modulus and higher B0’ of the chromous structure to the compression of the unusually long Cr-O bond and the comparatively small size of the Cr2+ ion relative to the coordination polyhedron’s size. Meanwhile, there have been no reports on the structural properties of a similar compound, Hg2GeO4 of the thenardite-type, under high pressure to date.
In this study, our objective is to examine the distinct physical characteristics of Cd2SiO4 and Hg2GeO4 and investigate the effects of pressure variations on their behaviour. The subsequent section of our research focuses on the computational methodology employed. Transitioning to the third segment, we present a thorough overview of our major discoveries and engage in discussions regarding structural properties, elasticity, mechanical responses, dynamic features, and electronic properties. We will analyse these aspects under both ambient and pressured conditions. Lastly, we will synthesize our findings and present concluding remarks in the final section.

2. Materials and Methods

The molecular geometry optimization was carried out using the Projector-Augmented Wave (PAW) method within the density-functional theory (DFT) framework, as implemented in VASP [17]. Specifically, the Projector-Augmented Wave formalism-based pseudopotentials were employed. The Perdew-Burke-Ernzerhof for solids (PBEsol) [18] functional, within the Generalized-Gradient Approximation (GGA), was utilized for generating exchange-correlation functionals. Additionally, PBE [19] calculations were performed, revealing that PBEsol provides a better description of the crystal structure of Be2SiO4. Consequently, this study primarily focuses on the results obtained from PBEsol calculations. For all computations, a plane wave energy cutoff of 600 eV was set, with a selected energy convergence criterion of 10-8 eV. Geometry optimization employed a dense k-mesh based on the Monkhorst-Pack technique [20]. Phonon dispersion calculations were conducted using density-functional perturbation theory with VASP and Phonopy [21]. The phonon calculations utilized a 2×2×2 supercell (112 atoms), employing a 6×6×6 k-point mesh and an energy convergence criterion of 10-8 eV. To address the underestimation of the band gap for semiconductors/insulators in GGA approximation, the hybrid functional HSE06 was employed to compute electronic characteristics. The Hartree-Fock screening value was set at 0.2 Å [22]. For analyzing the band gap response to pressure variations, calculations were carried out using VASP with HSE06 functional. The bulk modulus and its pressure dependency were determined by fitting the pressure-volume (P-V) data to a third-order Birch-Murnaghan equation of state (EOS), elucidating the unit-cell volume’s response to compression [23].

3. Results

3.1. Structural Properties

Both mineral compounds feature an orthorhombic crystalline structure with the space group Fddd which is illustrated in Figure 1. In our case, calculations were conducted using GGA-PBE [19] and GGA-PBEsol [18] functionals. Our computational analysis indicates that the GGA-PBEsol functional accurately describes the ground state of the investigated compound, as summarized in Table 1. The predicted cell parameters closely match experimental values [6,15]. Table 1 reveals that PBE tends to slightly overestimate the cell parameters. The obtained atomic positions are listed in Table 2.
The thenardite-type minerals’ structure, as described in Figure 1, features tetrahedrally coordinated Si (Ge) and octahedrally coordinated Cd (Hg) atoms in Cd2SiO4 (Hg2GeO4). In Cd2SiO4, the O atom is coordinated by three Cd atoms and one Si atom. Similarly, in Hg2GeO4, the O atom forms bonds in a tetrahedral coordination with three identical Hg atoms and one Ge atom. The CdO6 (HgO6) octahedra link together via shared edges, creating zigzag chains aligned with the crystallographic [110] and [-110] directions. These chains establish a three-dimensional network, further connected through shared edges among CdO6 (HgO6) octahedra. Additionally, the SiO4 (GeO4) tetrahedra play a role in this connectivity, sharing edges with CdO6 (HgO6) octahedra. Both octahedra and tetrahedra exhibit significant distortion due to the unique connectivity of the SiO4 (GeO4) groups. In Cd2SiO4, the tetrahedron undergoes uniaxial elongation along its two-fold axis parallel to the c axis due to the sharing of two edges of the silicate tetrahedron with edges of the CdO6 polyhedra. Conversely, in Hg2GeO4, the elongation of the tetrahedron along its two-fold axis, aligned with the b axis, is induced by the sharing of two edges between the germanate tetrahedron and the HgO6 polyhedra.
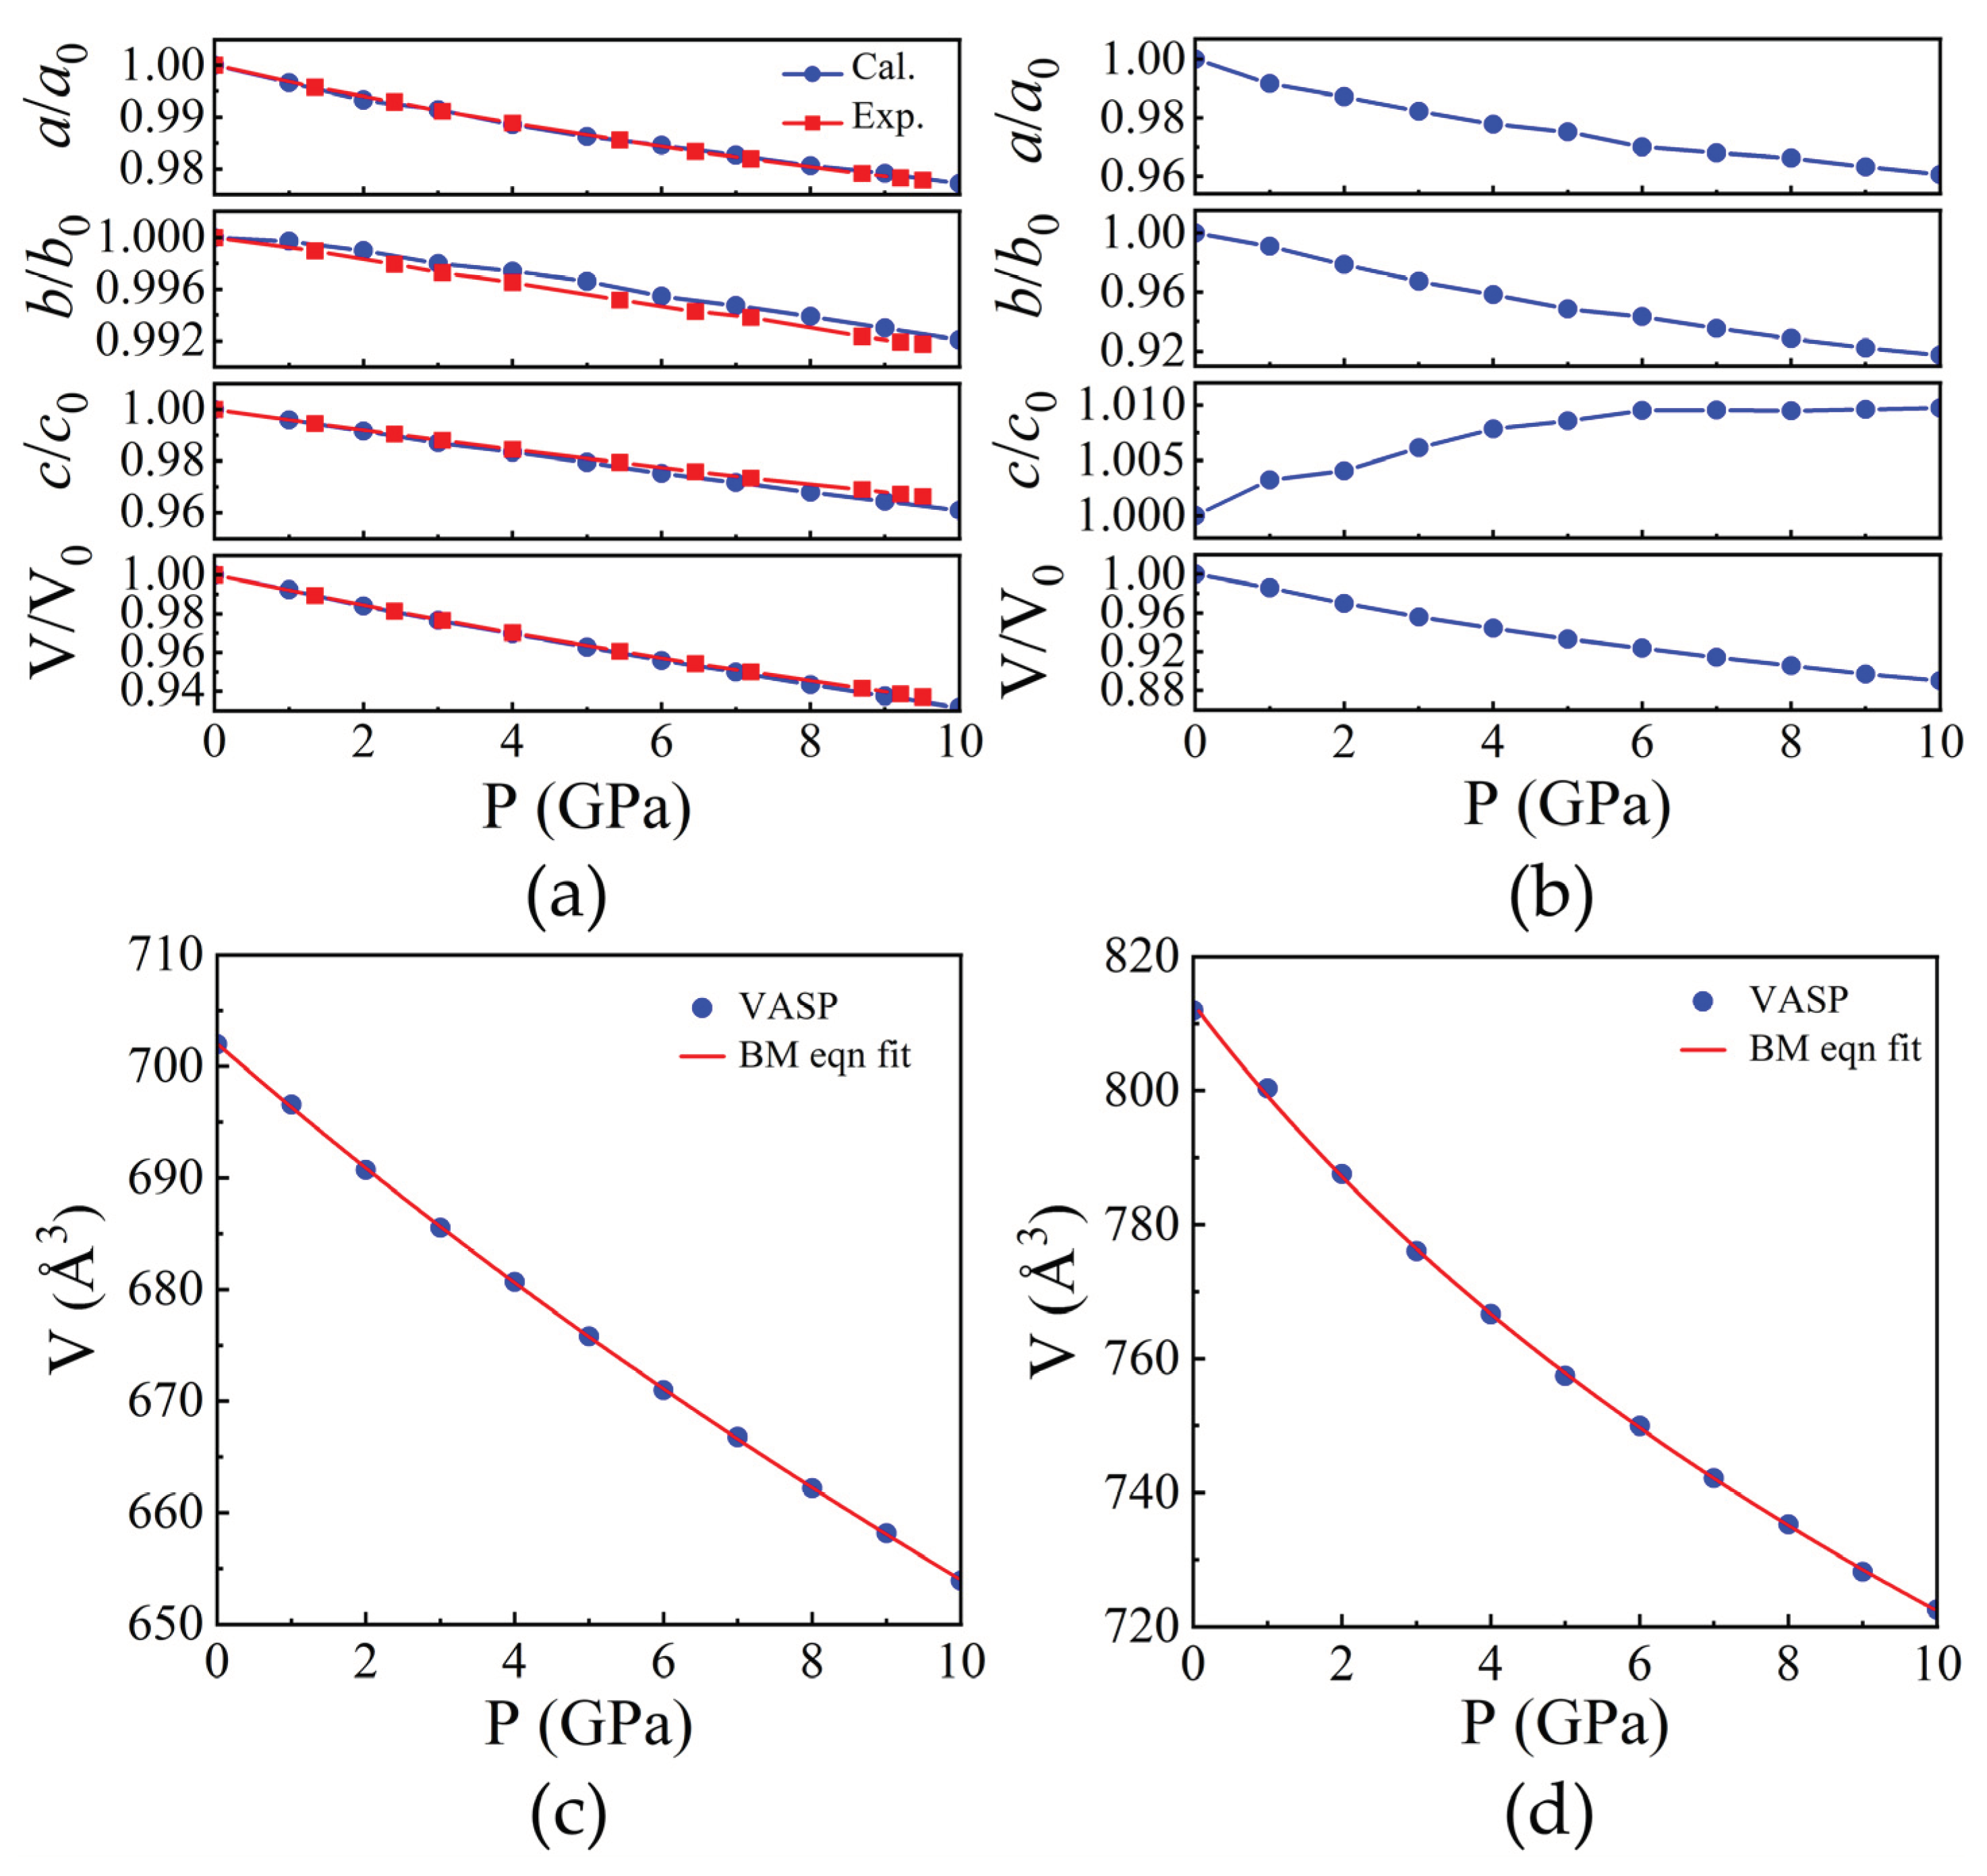
Furthermore, we have computed the structural parameters as variables dependent on pressure, illustrated in Figure 2(a) and Figure 2(b). For Cd2SiO4, we observed a close correspondence between the volume (V/V0) and lattice constants (a/a0, b/b0, c/c0) with experimental data, as indicated in Figure 2(a). The response of lattice parameters to pressure exhibits significant anisotropy in both compounds. As pressure increases, all lattice parameters decrease in Cd2SiO4, whereas in Hg2GeO4, parameters a and b decrease with increasing pressure, while parameter c shows an increase under pressure. From Figure 2(a) and Figure 2(b), it is evident that both compounds exhibit less compressibility along the b axis. Additionally, the volume (V0), bulk modulus (B0), and its pressure derivative (B0’) at zero pressure were determined through least-squares analysis of pressure-volume data. To calculate the bulk modulus for both compounds, we utilized the third-order Birch-Murnaghan equation of state (EOS). The resulting values for Cd2SiO4 are 702.03 ų, 120.53 GPa, and 4.43 for V0, B0, and B0’ respectively, and for Hg2GeO4, they are 812.95 ų, 54.95 GPa, and 7.50. In Figure 2(c) and Figure 2(d), the unit-cell volume data plotted against pressure is shown, along with the pressure-volume curve determined using these fitted parameters. R Miletich obtained B0 = 119.2(5) GPa and B0’ = 6.17(4) for Cd2SiO4, indicating agreement with our theoretical results [15]. The compressibility of Cd2SiO4, with B0 = 120.53 GPa, is lower than Hg2GeO4 and Cr2SiO4 (B0 = 94.7(4) GPa) [16]. Other known cadmium oxides with compression data include CdO and CdWO4, for which B0 = 108 GPa [24] and 123 GPa [25] were reported, respectively. This is a consequence of the fact that in the three compounds compressibility is dominated by changes induced by pressure in the coordination polyhedral of Cd. Conversely, the compressibility of Cd2SiO4 is quite similar that of olivine-type M2SiO4 compounds containing large M cations, such as Fe2SiO4 (B0 = 123.9 GPa) [26] or CaMgSiO4 (B0 = 113 GPa) [27].
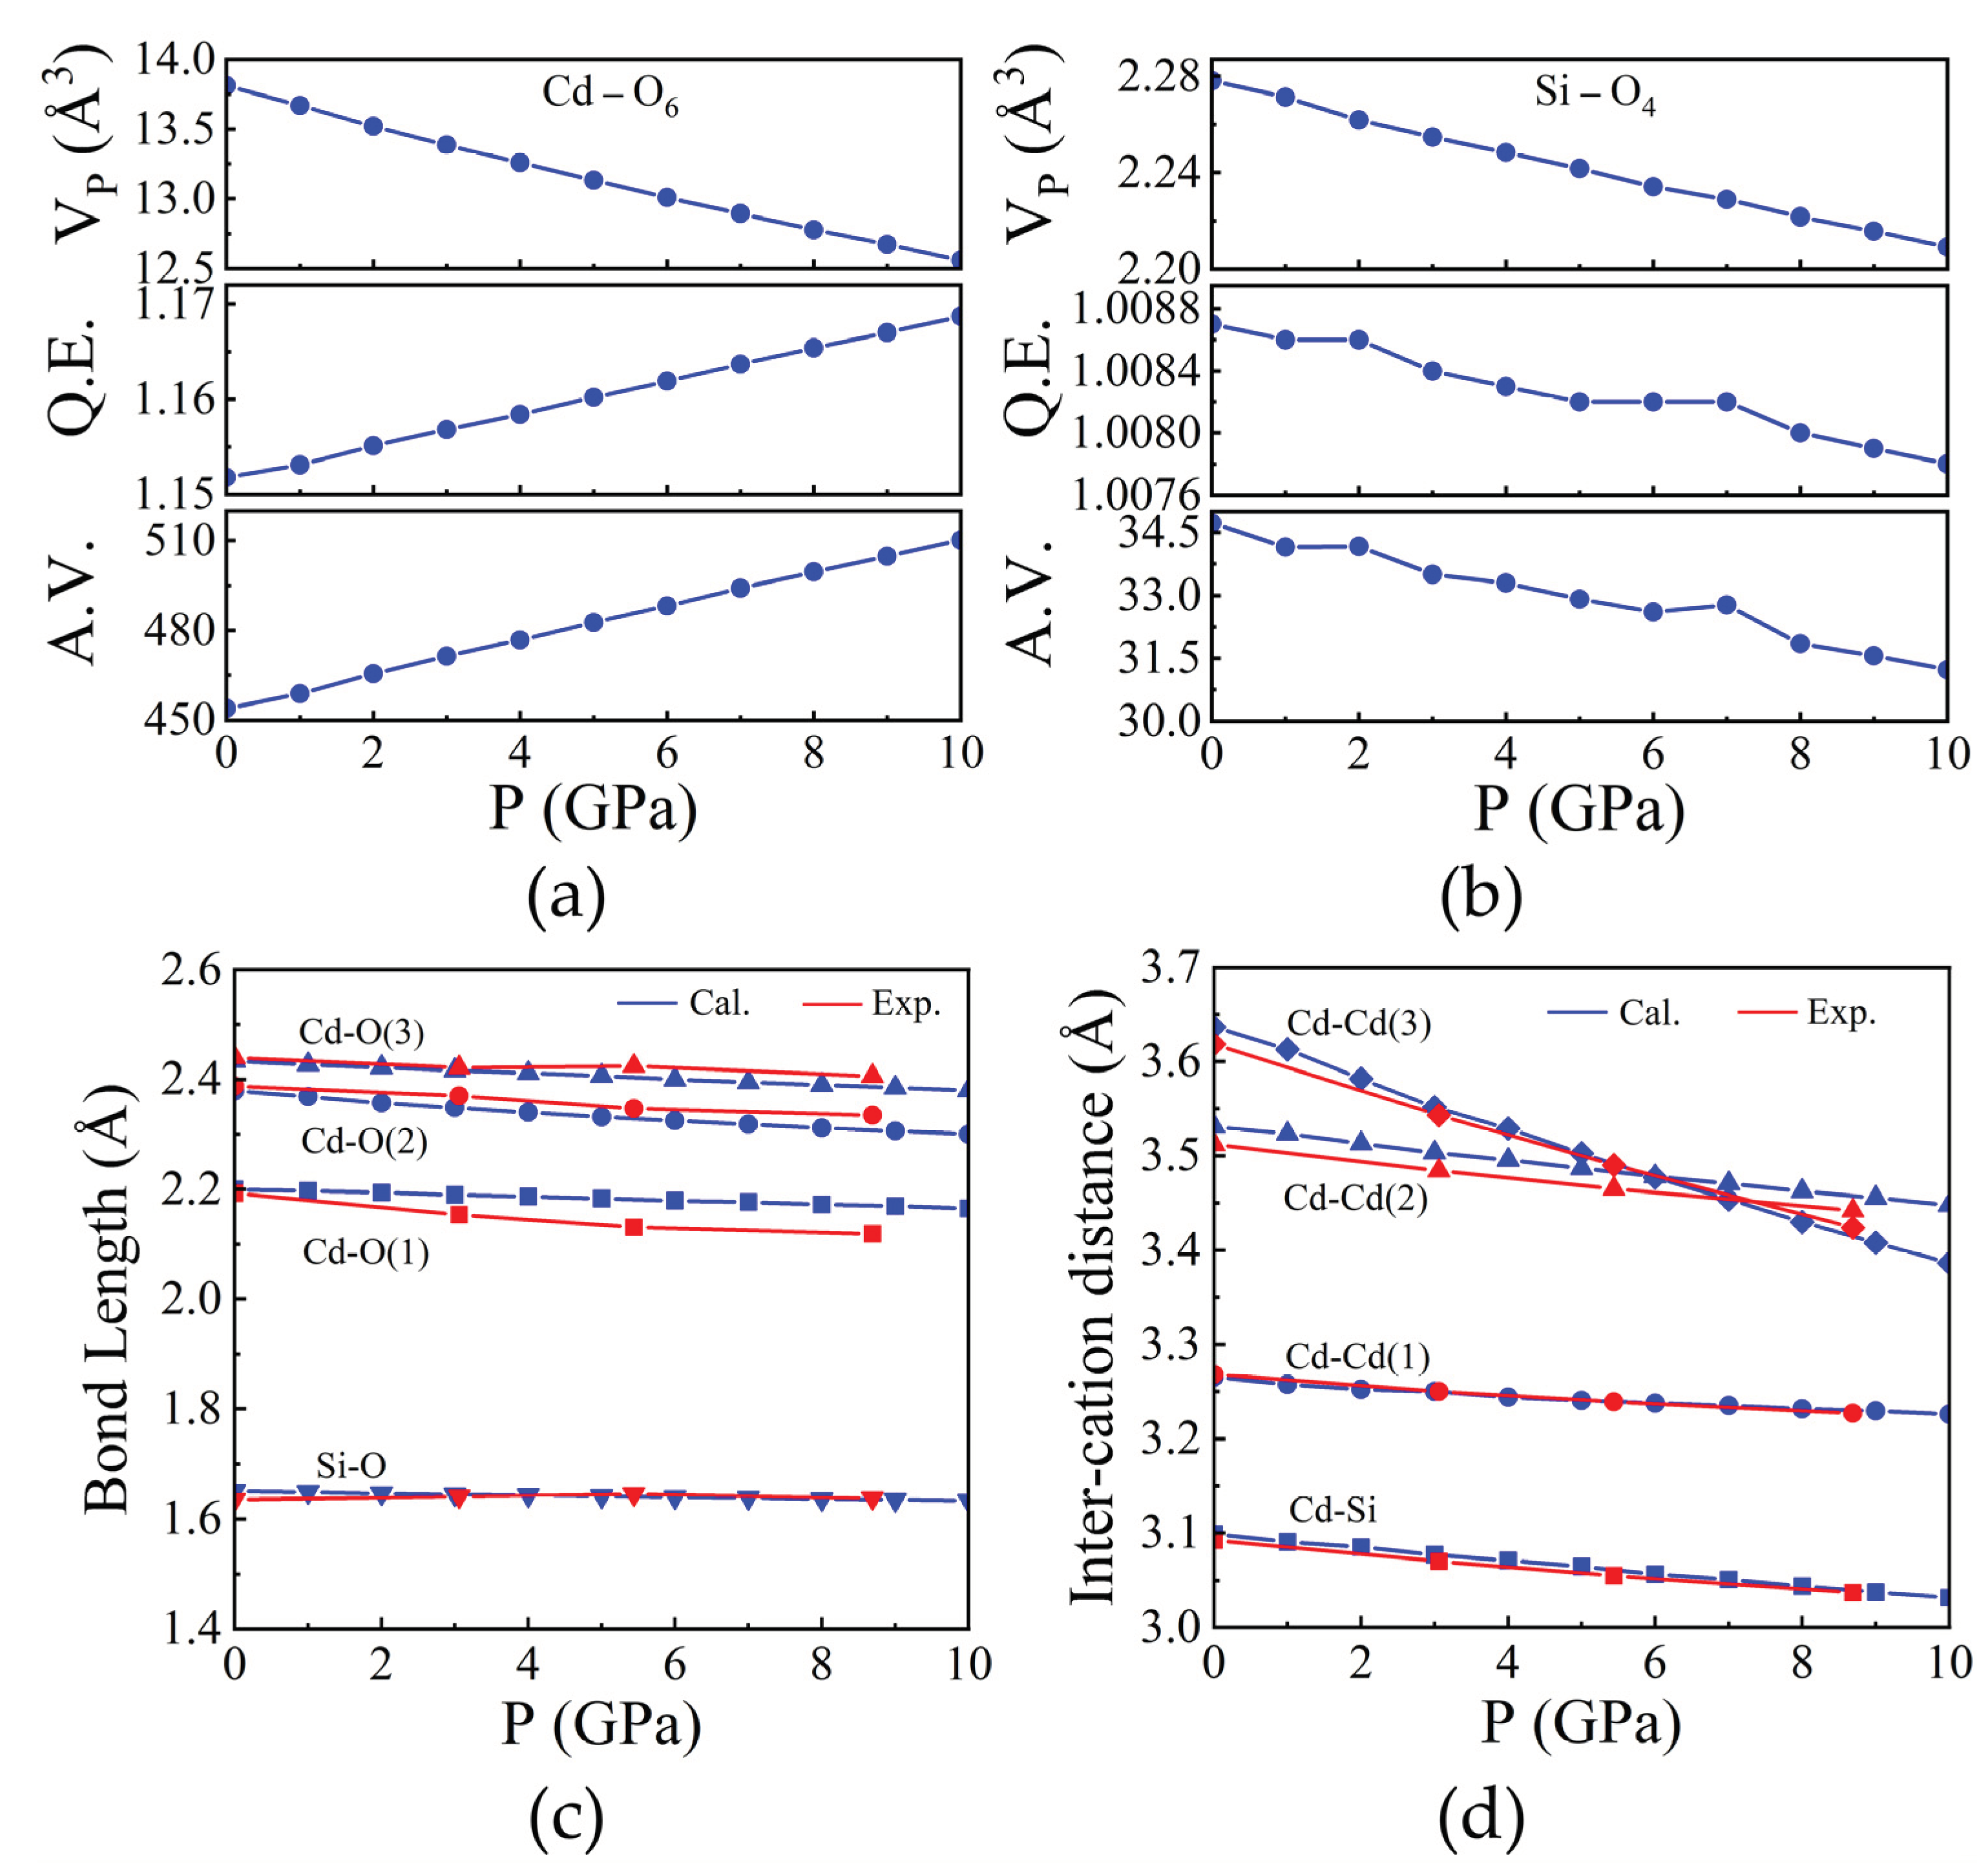
The compression of both the CdO6 and SiO4 coordination polyhedra in Cd2SiO4 is affected by their respective polyhedral geometries. The CdO6 polyhedra exhibit an increase in angular and bond-length distortion as pressure increases, as depicted in Figure 3(a). Figure 3(c) illustrates the Cd-O bond lengths as pressure varies, demonstrating anisotropic polyhedral compression. The longest bonds, Cd-O(5,6) share edge with the SiO4 tetrahedra, resulting in the shortest inter-cation distance (Cd-Si distance of 3.098 Å). Conversely, the shorter Cd-O(1,2) and Cd-O(3,4) bonds engage in weaker cation-cation interactions across shared O-O edges. The atypical angular distortion of the CdO6 octahedron, arising from polyhedral connections and shared edges, elucidates the alterations in polyhedral geometry induced by pressure. Significantly, the axes of the O-Cd-O octahedron exhibit substantial deviations from the ideal 180˚, with O(3)-Cd-O(4) measuring 141.5˚ and O(1)-Cd-O(6) at 113.39˚ as illustrated in Supplementary Figure S1. The displacement between Cd and O atoms along the c axis influences the O(3)-Cd-O(4) angle, whereas displacement along the b direction affects bond angles like O(5)-Cd-O(6), O(1)-Cd-O(4), and O(3)-Cd-O(5). Furthermore, the displacement of the Cd atom concerning the surrounding O atoms elucidates the distinction in compression between Cd-O(1) and Cd-O(2) bonds under pressure, leading to variations in compression along the crystallographic a and b axes, as depicted in Figure 2(a). In the SiO4 tetrahedron, polyhedral volumes and Si-O distances remain relatively unchanged with pressure, as depicted in Figure 3(b) and Figure 3(c) respectively, while angular distortion notably decreases. The decrease in distortion signifies the diminishing uniaxial elongation caused by repulsion between Cd and Si atoms along shared edges. Likewise, O-Si-O angles tend toward the ideal tetrahedral angle with increasing pressure. The compression mechanism of Cd2SiO4 structure is mainly governed by cation-cation repulsions across shared O-O polyhedral edges. Symmetrically distinct metal-metal distances exhibit minimal compression up to 10 GPa, indicating stiffness relative to the overall structure. These repulsions induce distortions in CdO6 octahedra and displace Cd atoms, leading to rapid compression of Cd-Cd(3) distance between opposing octahedra, even surpassing compression along the parallel c axis.
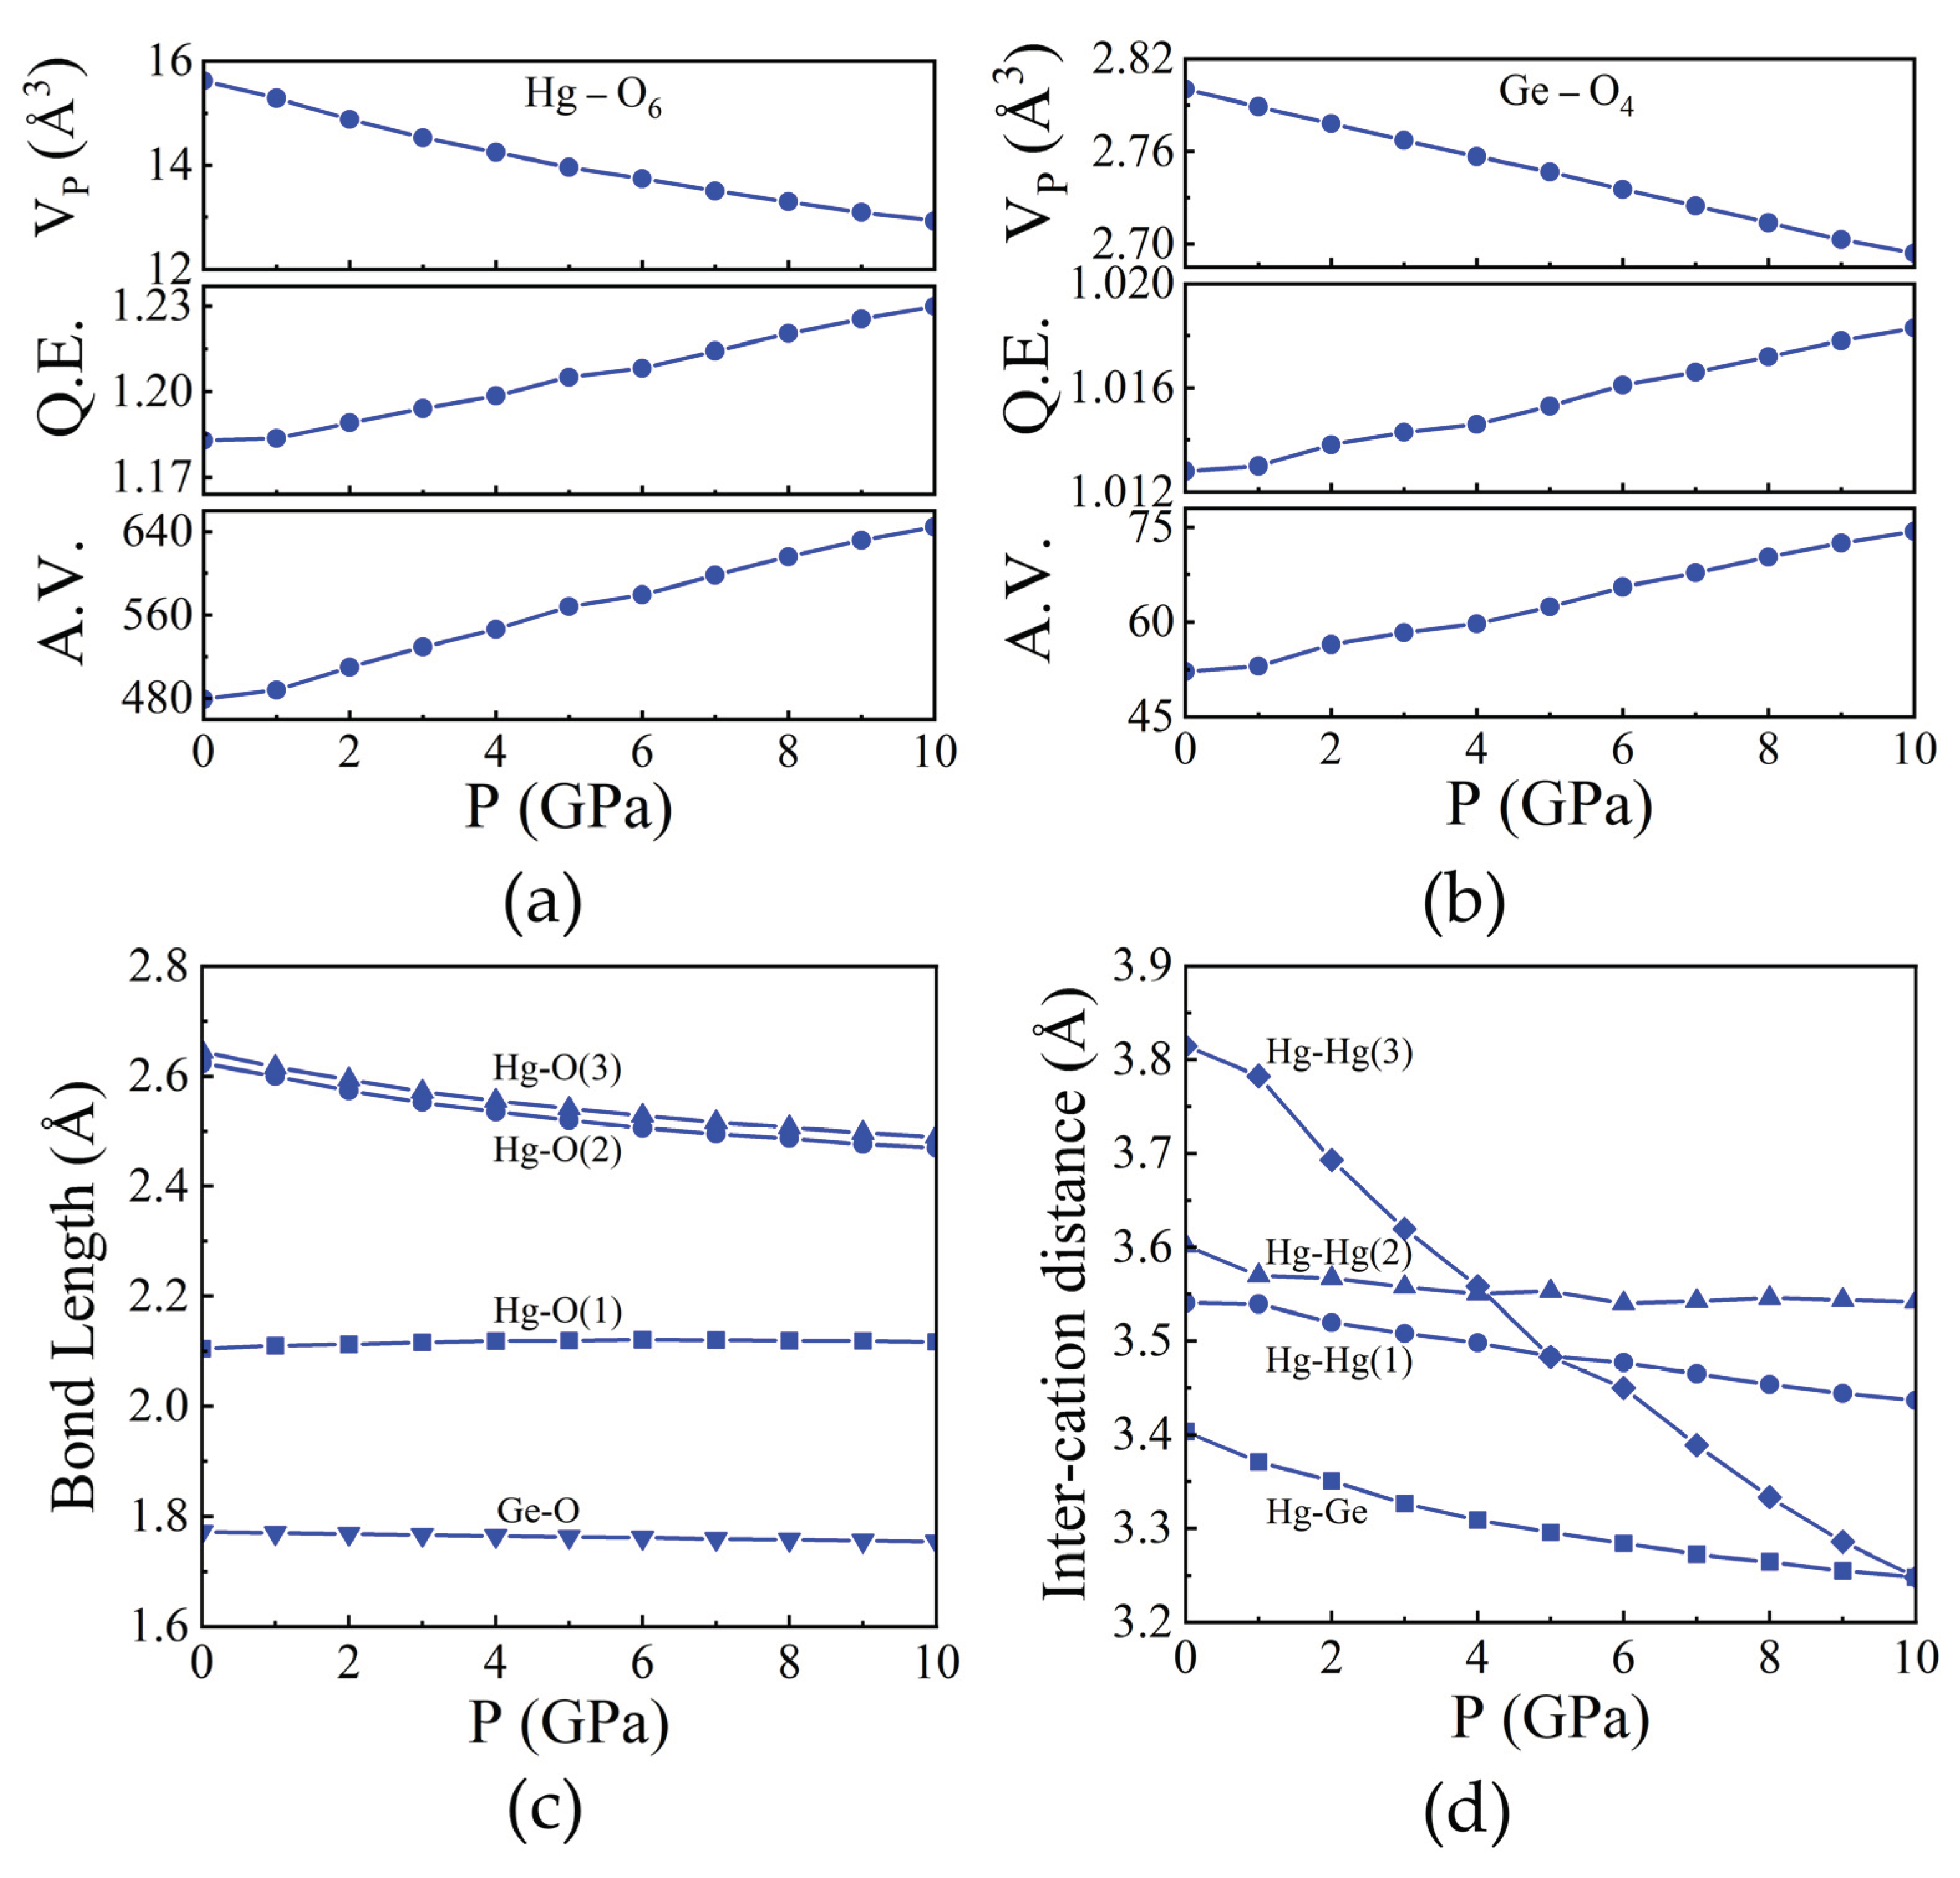
Likewise, we investigated the HgO6 and GeO4 polyhedra within the Hg2GeO4 compound. Both the HgO6 and GeO4 polyhedra demonstrate heightened angular distortion and bond-length variation with increasing pressure, as shown in Figure 4(a) and Figure 4(b). Figure 4(c) depicts the fluctuation in Hg-O bond lengths under varying pressures, highlighting anisotropic compression of the polyhedra. The longest bonds, Hg-O(3), share edges with the GeO4 tetrahedra, resulting in the shortest inter-cation distance (Hg-Ge distance of 3.403 Å). Conversely, the shorter Hg-O(1) and Hg-O(2) bonds engage in weaker cation-cation interactions across shared O-O edges. The atypical angular deformation of the HgO6 octahedron, stemming from polyhedral connections and shared edges, elucidates pressure-induced alterations in polyhedral geometry. Notably, the O-Hg-O octahedron axes exhibit significant deviations from the ideal 180˚, with O(3)-Hg-O(4) measuring 145.78˚ and O(1)-Hg-O(6) at 112.26˚ as shown in Supplementary Figure S2. The displacement of Hg atoms relative to O atoms along the b axis impacts the O(3)-Hg-O(4) angle, whereas displacement along the c direction alters bond angles such as O(5)-Hg-O(6), O(1)-Hg-O(4), and O(3)-Hg-O(5). Moreover, the displacement of the Hg atom relative to surrounding O atoms accounts for the discrepancy between Hg-O(1) and Hg-O(2) bond compressions with pressure, contributing to variations in compression along crystallographic a and b axes, as depicted in Figure 2(b). In the GeO4 tetrahedron, polyhedral volumes and Ge-O distances remain relatively stable under pressure, as shown in Figure 4(b) and Figure 4(c), respectively. Unlike SiO4, angular and bond-length distortion in GeO4 increases with pressure.

3.2. Elastic and Mechanical Properties

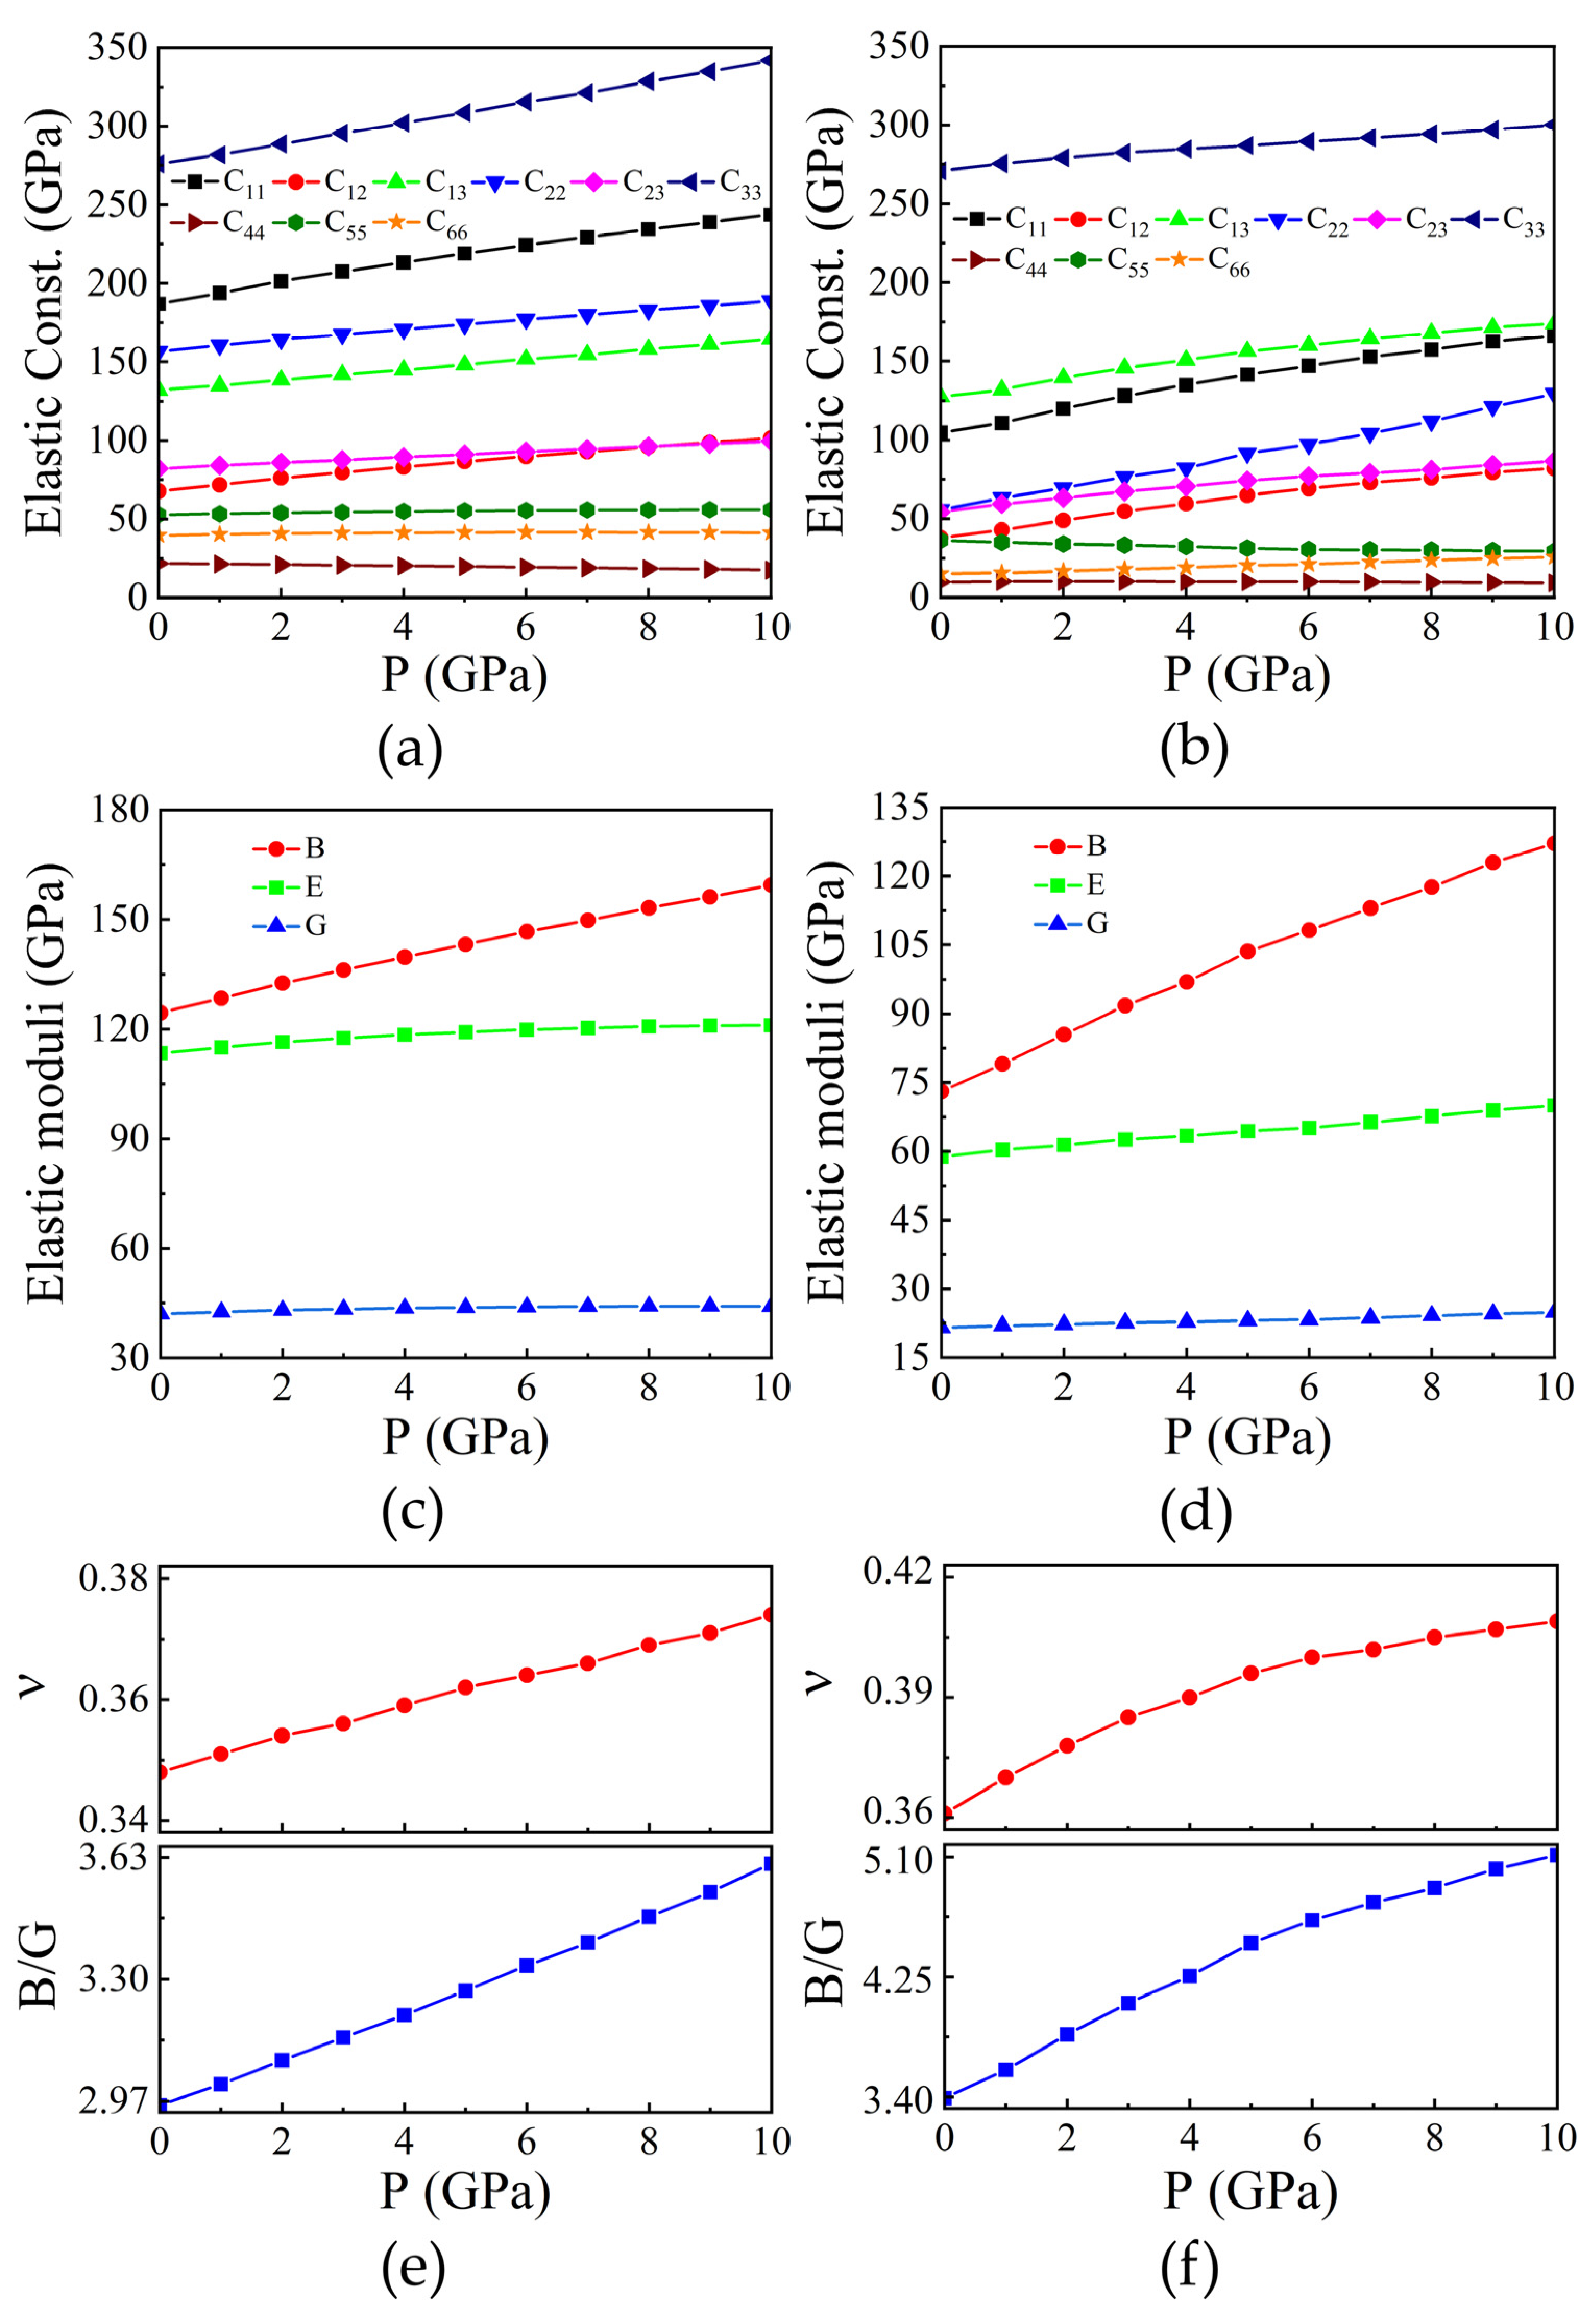
A material’s elastic properties govern its reaction to stress, encompassing both deformation and the subsequent restoration to its original form when stress is relieved. These properties play a crucial role in revealing the bonding dynamics between neighboring atomic layers, the directional characteristics of binding, and the overall structural integrity. Elastic constants of solids serve as a bridge between their mechanical and dynamical behaviours, offering crucial insights into the forces operating within them. Furthermore, these constants serve as predictive tools for determining the structural stability of materials. In the case of orthorhombic symmetry, there are nine distinct elastic constants: C11, C22, C33, C44, C55, C66, C12, C13, and C23 [28]. These elastic constants adhere to the generalized lattice stability criteria [29] across various pressure ranges, signifying the mechanical robustness of both compounds up to 10 GPa. With increasing pressure, almost all elastic constants experience growth, reflecting strong interactions between atoms. Consequently, the compounds exhibit enhanced strength, as depicted in the Figure 5(a) and Figure 5(b).
Employing the elastic constants acquired, we calculated the bulk modulus (B) and shear modulus (G) utilizing the Voigt-Reuss-Hill (VRH) approximation [30,31]. For Cd2SiO4, the calculated B and G values are 124.41 GPa and 42.05 GPa, respectively. Conversely, for Hg2GeO4, the B and G values are 73.06 GPa and 21.54 GPa, respectively. Notably, Cd2SiO4 exhibits a comparatively larger bulk modulus and shear modulus, indicating greater stiffness and resistance to deformation under stress. The determined B values at ambient pressure for both compounds align closely with the B0 value derived from the Birch-Murnaghan equation of state (EOS). Additionally, Young’s modulus (E) can be derived from the bulk and shear moduli. For Cd2SiO4, the obtained value of E is 113.37 GPa, while for Hg2GeO4, it is 58.78 GPa. We have calculated the elastic moduli upto 10 GPa. As pressure increases, the values of B, G, and E also increase, as depicted in Figure 5(c) and Figure 5(d).
The values of ν and the B/G ratio serve to characterize the brittle or ductile nature of a structure. If ν and B/G are both less than 0.26 and 1.75, respectively, the structure is considered brittle; otherwise, it is regarded as ductile [32,33]. Our findings suggest that both proposed structures exhibit ductile behavior. Poisson’s ratio serves as an indicator of volume alteration during uniaxial deformation, with a value of ν = 0.5 indicating no volume change during elastic deformation. The low values observed for both compounds imply significant volume changes during their deformation. Additionally, ν provides insights into the bonding forces’ characteristics more effectively than other elastic constants [34]. It has been established that ν = 0.25 represents the lower limit for central-force solids, while 0.5 indicates infinite elastic anisotropy [35]. The low ν values observed for both structures suggest central interatomic forces within the compounds. In addition, we have determined the ν and B/G ratio under various pressures for both compounds. Both the ν and B/G ratio exhibit an increase as pressure increases, as illustrated in Figure 5(e) and Figure 5(f).
To assess the elastic anisotropy of the compounds under investigation, we acquired shear anisotropic factors, which measure the degree of anisotropy in atomic bonding across various planes. These factors play a critical role in evaluating the durability of materials. We calculated shear anisotropic factors for the {100} (A1), {010} (A2), and {100} (A3) crystallographic planes, as well as percentages of anisotropy in compression (AB) and shear (AG) [36,37]. In a crystal displaying isotropy, the values of A1, A2, and A3 should be one; any deviation from this indicates the presence of elastic anisotropy. A percentage anisotropy of 0% signifies perfect isotropy. For both compounds, the calculated shear anisotropy values under different external pressures are detailed in Table 3. For Cd2SiO4, anisotropies increase in the {010}, {001}, and {100} planes (A2 < A3 < A1) at zero pressure, with the {100} plane exhibiting the highest anisotropy. Conversely, Hg2GeO4 displays an anisotropy sequence of A3 < A2 < A1. Percentage anisotropies in compression and shear were approximately 5% and 8%, respectively for Cd compound whereas for Hg compound they are 32% and 22%, respectively. In addition, the universal anisotropy index (AU) also provides the information of anisotropy in crystals [38]. The departure of AU from zero denotes the level of single crystal anisotropy, incorporating both shear and bulk contributions, which sets it apart from other established metrics. Thus, AU serves as a universal metric for quantifying single crystal elastic anisotropy. Cd2SiO4 exhibits an anisotropy index of 0.96, while Hg2GeO4 displays a value of 3.78.
Elastic wave velocities describe the rate at which waves travel through a substance when it undergoes elastic deformation. These waves consist of compression (longitudinal) waves (vl), and shear (transverse) waves (vt). For both compounds, the transverse (vt) and longitudinal (vl) mode velocities can be derived from the elastic constants [39]. The findings for both compounds are delineated in Table 4, indicating that the vl increases with pressure, whereas the vt initially rises before declining. Moreover, the Debye temperature (θD), a fundamental parameter, is linked to various solid-state properties like specific heat, elastic constants, and melting temperature. In this investigation, θD was determined from the mean elastic wave velocity (vm) [40] and shown in Table 4. For both compounds, the calculated value of θD found to increase with pressure.

3.3. Lattice Dynamics

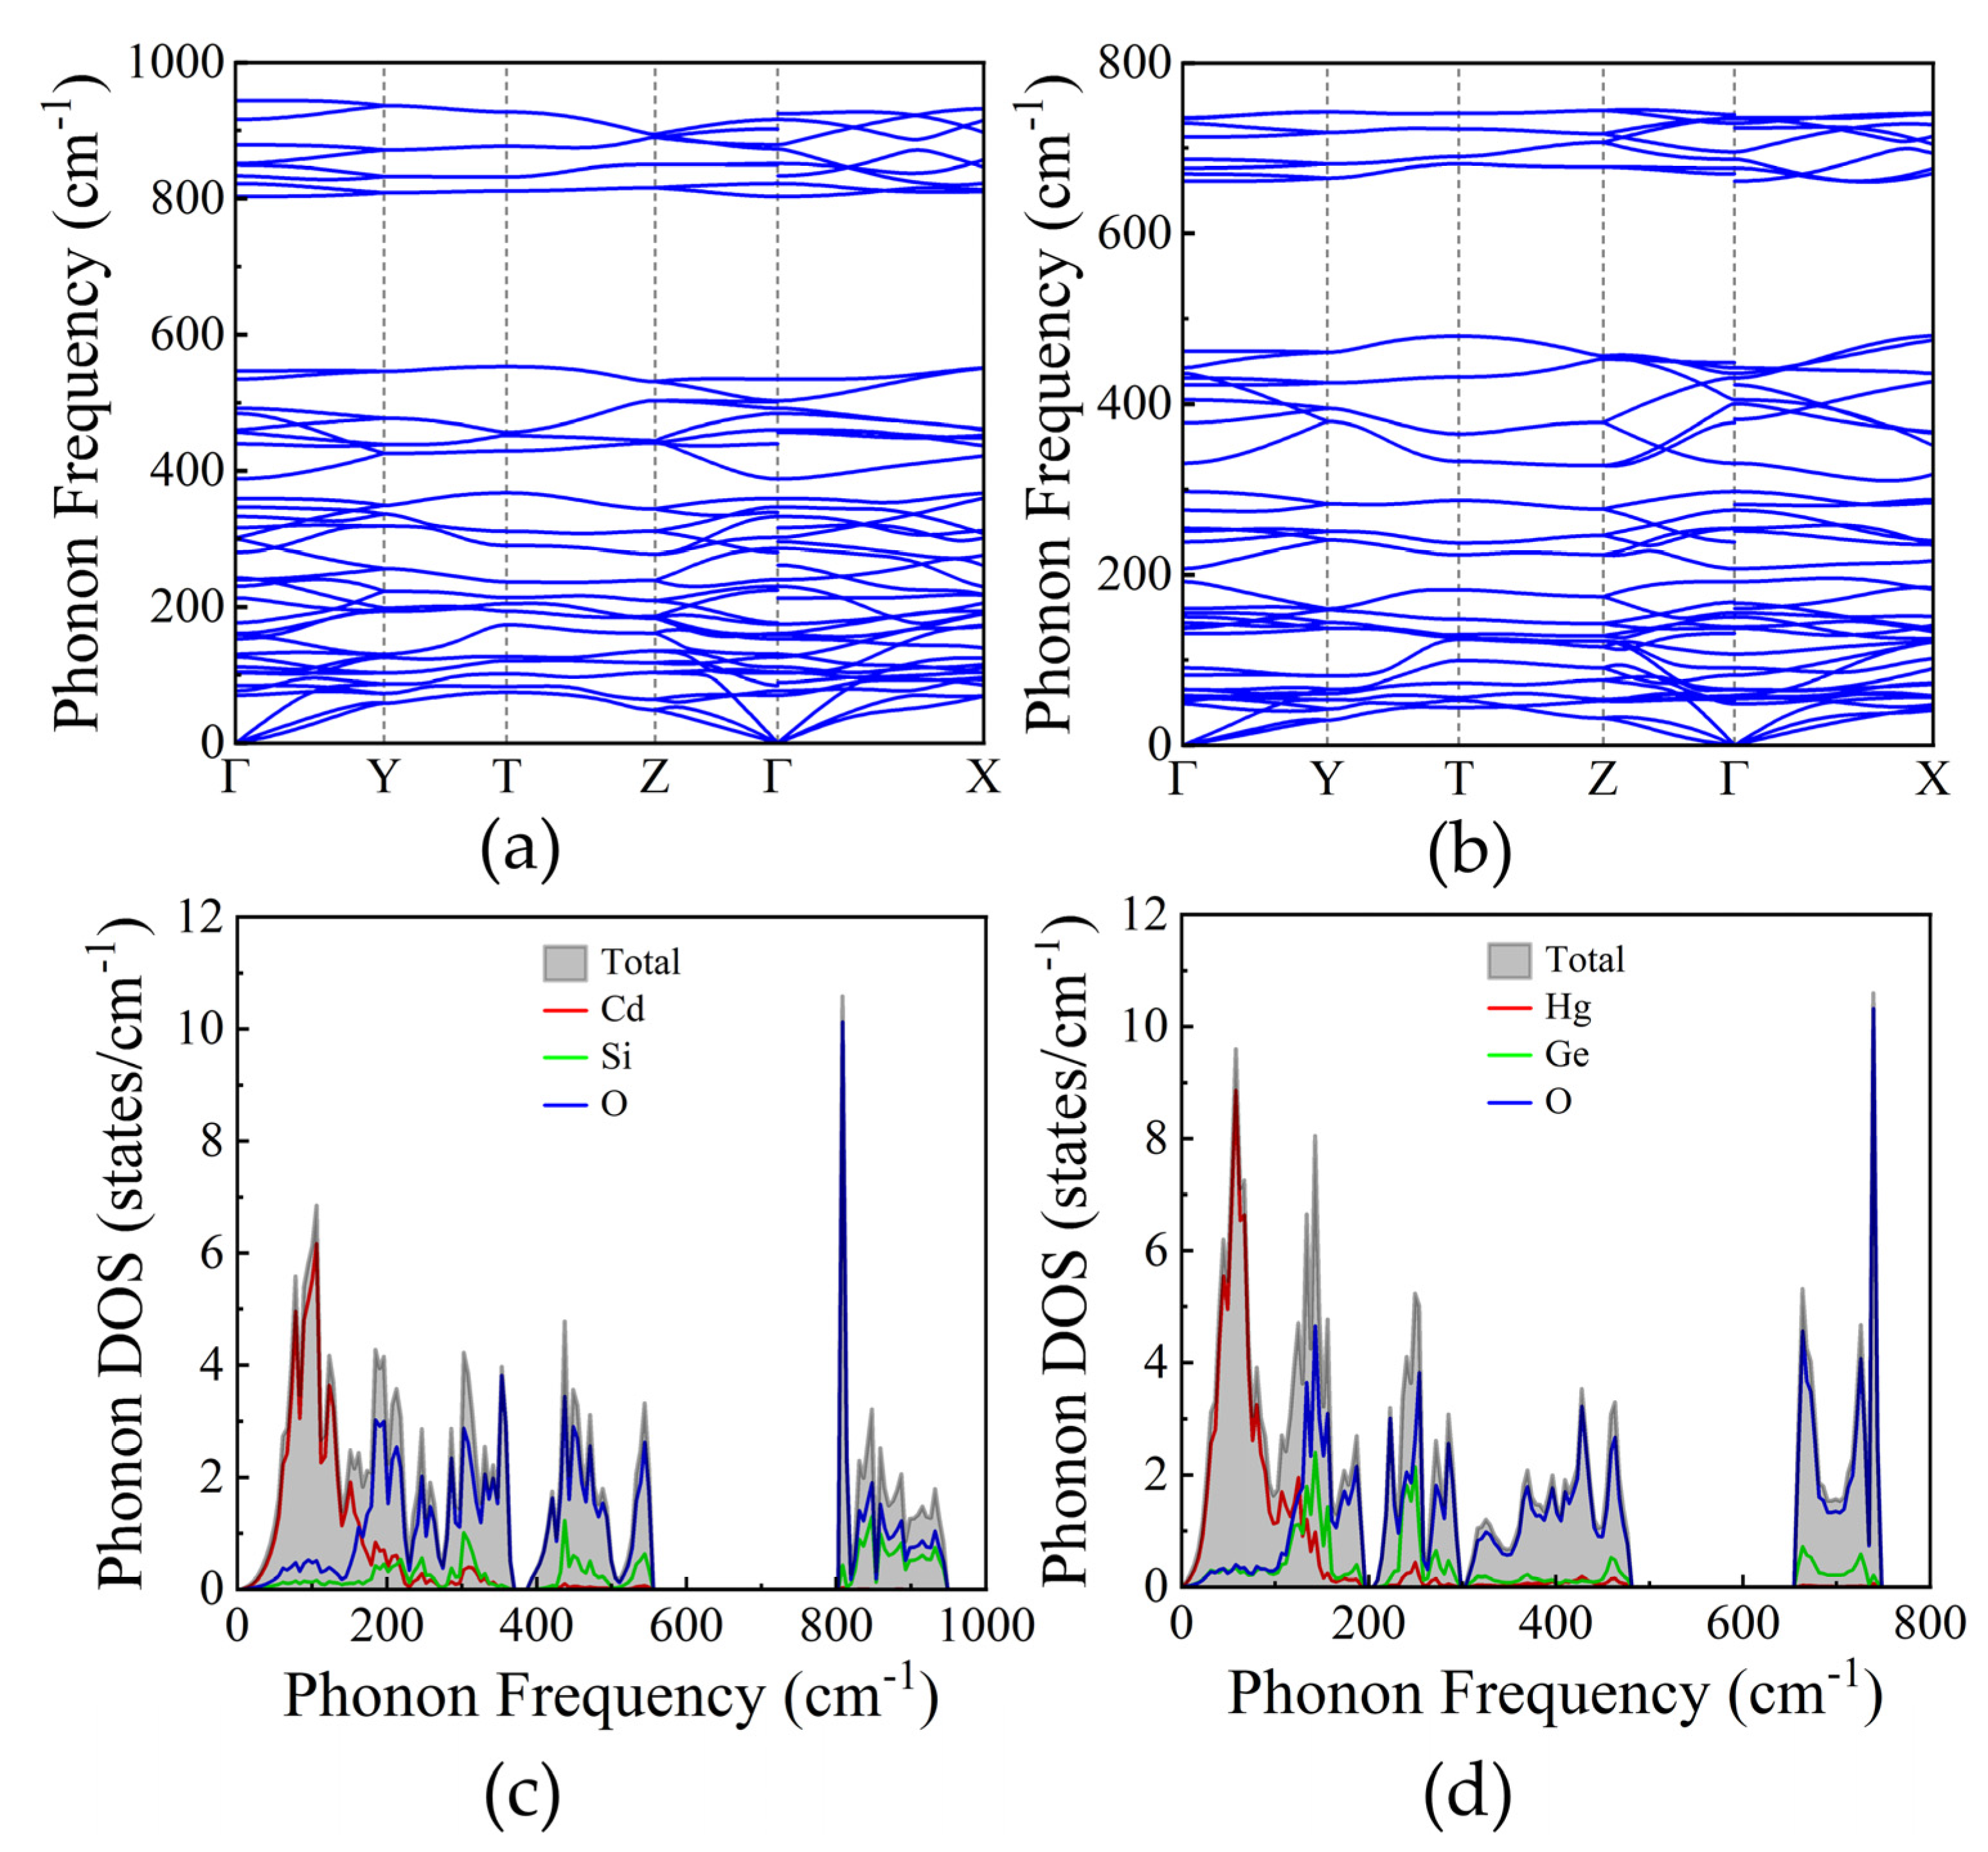
We conducted phonon dispersion analysis along the high-symmetry path (Γ-Y-T-Z-Γ-X) under zero pressure to assess the dynamical stability of the material. Figure 6(a) and Figure 6(b) display the calculated phonon dispersions for both compounds. Our findings indicate that the acoustic branches exhibit positive frequencies, confirming the dynamical stability of the system under analysis. Notably, there is a significant interaction between the optical and acoustic modes. Additionally, we computed the total and partial phonon density of states (PhDOS) for both compounds, as depicted in Figure 6(c) and Figure 6(d) for the Cd and Hg compounds, respectively. The PhDOS profiles of both compounds are primarily influenced by oxygen atoms. Furthermore, significant contributions of Cd and Hg atoms are evident in the lower frequency region (0-200 cm⁻¹), indicating that Cd and Hg atoms have lower frequencies with increasing atomic weight: Cd < Hg.
Moreover, we have computed the vibrational modes at zero pressure. Both compounds exhibit 42 vibrational modes. The mechanical representation of 39 optical modes is: ΓM = 4Ag + 6B1g + 5B2g + 6B3g + 4Au + 5B1u + 4B2u + 5B3u. The calculated optical modes contain the 21 Raman active (4Ag + 6B1g + 5B2g + 6B3g), and 18 IR active (4Au + 5B1u + 4B2u + 5B3u) modes. The obtained frequencies of these modes are given in Table 5.

3.4. Electronic Properties

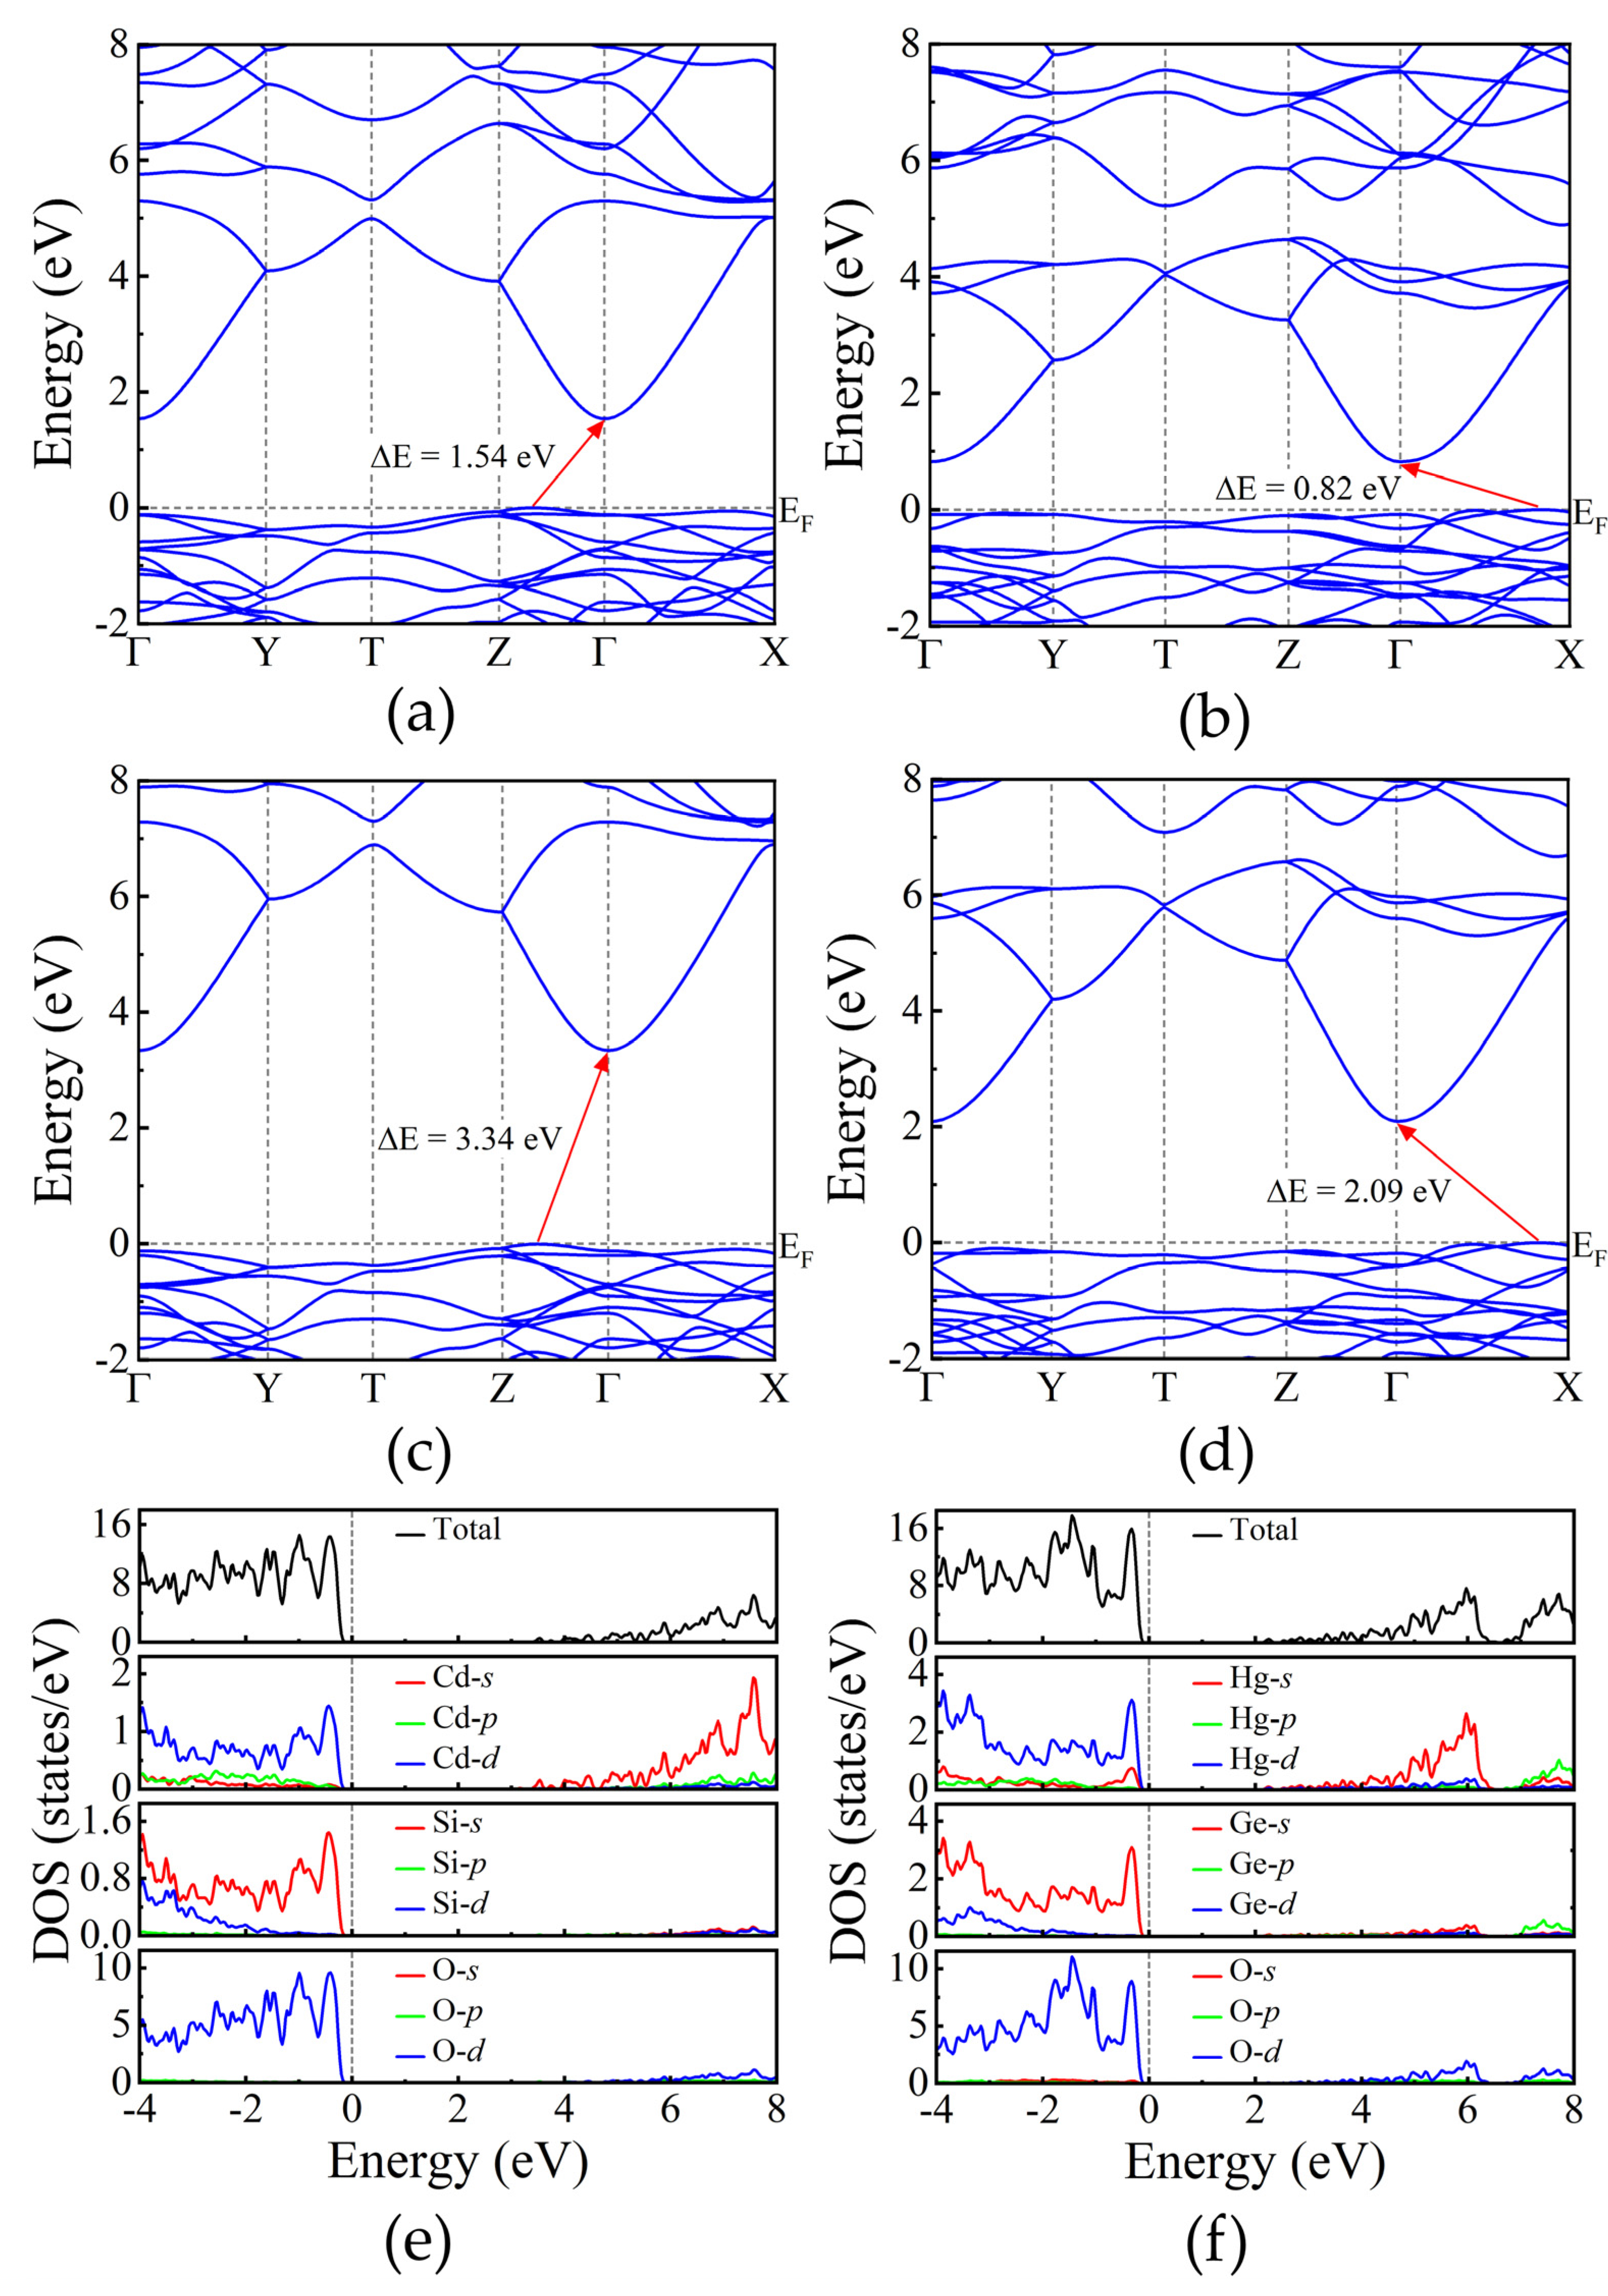
To thoroughly characterize the physical properties of the compounds under investigation, we employed the GGA-PBE functional to calculate their electronic band structures. The resulting band gap is 1.54 eV for Cd2SiO4 and 0.82 eV for Hg2GeO4, as shown in Figure 7(a) and Figure 7(b) respectively. Considering the known tendency of GGA to underestimate band gaps in insulators and semiconductors [41], we applied the HSE06 functional to improve the accuracy of the band gap determination. Figure 7(c) and Figure 7(d) illustrate the revised band gaps, which are 3.34 eV for the Cd compound and 2.09 eV for the Hg compound. Both compounds exhibit indirect gap characteristics, with the valence band’s highest point and the conduction band’s lowest point located at different positions. Furthermore, the analysis of the band structures indicates minimal dispersion in the valence band, while significant dispersion is observed in the conduction band. This implies that electrons will have a significant smaller effective mass than holes.
To gain a deeper insight into the electronic properties, we analyzed the total and partial density of states (DOS), as depicted in Figure 7(e) and Figure 7(f) using the HSE06 functional. From these figures, it is evident that the primary contributors to the highest peak of the valence bands are the O-3d states. Additionally, minor contributions from Cd-4d and Si-3s states are observed in the valence bands of the Cd compound, and Hg-5d and Ge-4s states in the Hg compound. The conduction bands of the Cd and Hg compounds are primarily dominated by Cd-5s and Hg-6s states, respectively. The Hg-6s orbitals are the responsible of the smaller band gap of Hg2GeO4. The same phenomenon is observed when PbWO4 [42] is compared to other tungstates [43] due to the role of Pb-6s states.
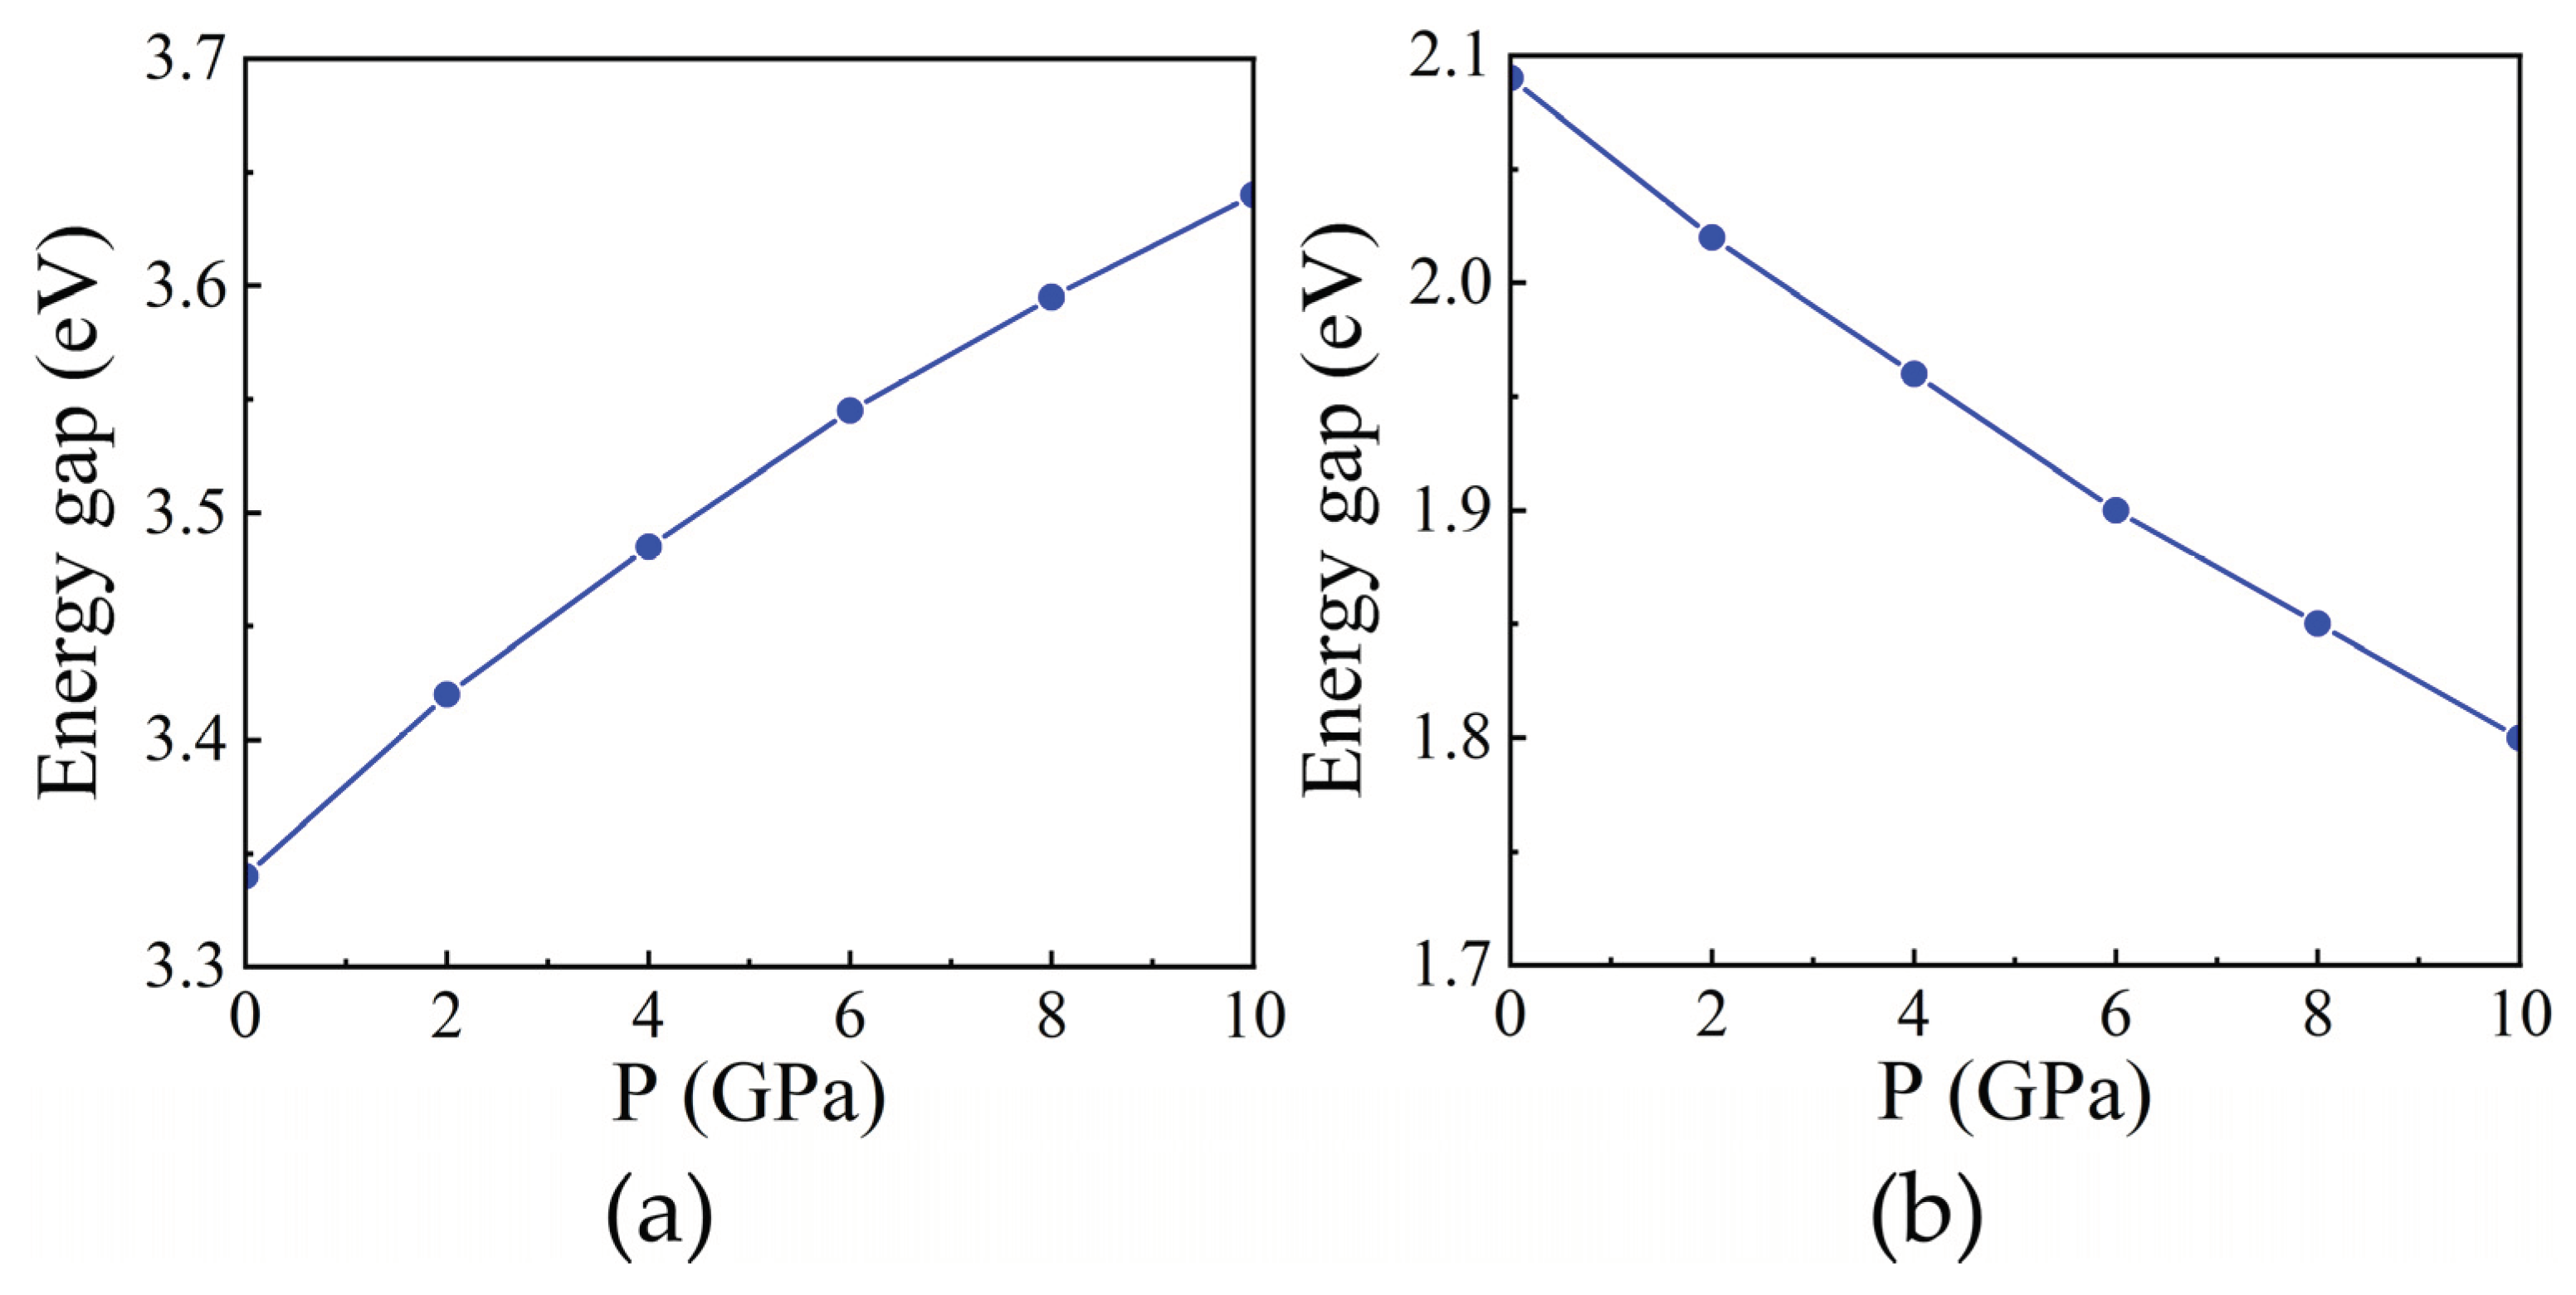
Moreover, we carried out high-pressure calculations to investigate the electronic properties under different pressure conditions. The calculated electronic band gaps under pressure for both structures are depicted in Figure 8. As pressure rises, there is a notable expansion in the band gap of Cd2SiO4 (see Figure 8(a)), whereas in the case of the Hg compound depicted in Figure 8(b), the band gap decreases with increasing pressure. The widening of the band gap in Cd2SiO4 results from the intensified crystal field splitting between bonding and antibonding states under compression [44]. Conversely, the distinctive behavior of the band gap in Hg2GeO4 is attributed to the involvement of Hg-6s states in the lower portion of the conduction band, causing it to decrease under compression. Similar phenomena occur with Pb-6s states in PbWO4 [42], in PbMoO4 [45], and in PbCrO4 [46].

4. Conclusions

In summary, we examined the structural, elastic, and electronic properties of Cd2SiO4 and Hg2GeO4 across different pressures using first-principles calculations based on density functional theory. Our analysis revealed that the computed lattice parameters at ambient pressure closely matched experimental data. The investigated compounds were determined to be mechanically and dynamically stable. We explored the pressure-dependent behavior of structural parameters. The compression of lattice parameters displayed an anisotropic behavior in both compounds. Notably, the compression mechanism in these structures is mainly governed by cation-cation repulsions across shared O-O polyhedral edges. The calculated elastic and mechanical properties reveal that Cd2SiO4 exhibits a comparatively larger bulk modulus and shear modulus, indicating greater stiffness and resistance to deformation under stress. We have computed the frequencies of vibrational modes, which include 21 Raman active modes, 3 acoustic modes, and 18 IR active modes. Both minerals were identified as indirect band gap insulators. Notably, Cd2SiO4 exhibited a significant increase in band gap with increasing pressure, while the band gap of Hg2GeO4 decreased under pressure. These findings revealed distinct structural and electronic responses despite the similar structures of the two compounds.

Supplementary Materials

The following supporting information can be downloaded at the website of this paper posted on Preprints.org. Figure S1: The pressure dependence of selected bond angles of Cd2SiO4; Figure S2: The pressure dependence of selected bond angles of Hg2GeO4.

Author Contributions

Jaspreet Singh – Formal analysis, Investigation, Visualization, Conceptualization. D Errandonea - Validation, Visualization, Writing - review and editing. G Vaitheeswaran - Conceptualization, Investigation, Methodology, Writing – review and editing. V Kanchana – Validation, Resources, Writing original draft, Supervision, Funding acquisition. All authors have read and agreed to the published version of the manuscript.

Acknowledgments

The authors J.S and V.K. acknowledge the National Supercomputing Mission (NSM) for providing computing resources of ‘PARAM SEVA’ at IIT Hyderabad. V.K. would like to acknowledge DST-FIST (SR/FST/PSI-215/2016) for the financial support. J.S. would like to acknowledge CSIR for the fellowship. D. E. thanks the financial support from the Spanish Ministerio de Ciencia e Innovación (https://doi.org/10.13039/501100011033) under Projects PID2019-106383GB-41, PID2022-138076NB-C41, and RED2022-134388-T. D. E. also thanks the financial support of Generalitat Valenciana through grants PROMETEO CIPROM/2021/075-GREENMAT and MFA/2022/007. This study forms part of the Advanced Materials program and is supported by MCIN with funding from European Union Next Generation EU (PRTR-C17.I1) and by the Generalitat Valenciana. G. V. would like to acknowledge Institute of Eminence, University of Hyderabad (UoH-IoE-RC3-21-046) for funding and CMSD University of Hyderabad for providing the computational facility.

Conflicts of Interest

The authors declare no conflict of interest

References

  1. Gmelin, L. Gmelin Handbook Der Anorganischen Chemie; Springer, 1984. [Google Scholar]
  2. Muller, O.; Roy, R. The Major Ternary Structural Families. (No Title) 1974.
  3. Dollase, W.A.; Seifert, F.; O’Neill, H.S.C. Structure of Cr2SiO4 and Possible Metal-Metal Interactions in Crystal and Melt. Phys Chem Miner 1994, 21, 104–109. [Google Scholar] [CrossRef]
  4. Zachariasen, W.H.; Ziegler, G.E. The Crystal Structure of Anhydrous Sodium Sulfate Na2SO4. Zeitschrift für Kristallographie-Crystalline Materials 1932, 81, 92–101. [Google Scholar] [CrossRef]
  5. Mehrotra, B.N.; Th, H.; Eysel, W.; Röpke, H.; Illguth, A. CRYSTAL CHEMISTRY OF COMPOUNDS WITH THENARDITE (Na2SO4V) STRUCTURE. 1978. [Google Scholar]
  6. Hesse, K.F.; Eysel, W. Structure of Dimercury (II) Germanate (IV). Acta Crystallogr B 1981, 37, 429–431. [Google Scholar] [CrossRef]
  7. Glasser, L.S.D.; Glasser, F.P. The Preparation and Crystal Data of the Cadmium Silicates CdSiO3, Cd2SiO4, and Cd3SiO5. Inorg Chem 1964, 3, 1228–1230. [Google Scholar] [CrossRef]
  8. Weil, M. Parawollastonite-Type Cd3[Si3O9]. Acta Crystallogr Sect E Struct Rep Online 2005, 61, i102–i104. [Google Scholar] [CrossRef]
  9. Lei, B.; Liu, Y.; Ye, Z.; Shi, C. Luminescence Properties of CdSiO3:Mn2+ Phosphor. J Lumin 2004, 109, 215–219. [Google Scholar] [CrossRef]
  10. den Eeckhout, K.; Smet, P.F.; Poelman, D. Persistent Luminescence in Eu2+-Doped Compounds: A Review. Materials 2010, 3, 2536–2566. [Google Scholar] [CrossRef]
  11. Aitasalo, T.; Hölsä, J.; Jungner, H.; Lastusaari, M.; Niittykoski, J. Thermoluminescence Study of Persistent Luminescence Materials: Eu2+-and R3+-Doped Calcium Aluminates, CaAl2O4:Eu2+, R3+. J Phys Chem B 2006, 110, 4589–4598. [Google Scholar] [CrossRef]
  12. Liu, Y.; Lei, B.; Shi, C. Luminescent Properties of a White Afterglow Phosphor CdSiO3:Dy3+. Chemistry of materials 2005, 17, 2108–2113. [Google Scholar] [CrossRef]
  13. Eysel, W. Kristallchemie von Oxyorthoverbindungen A3 0 [B04]. Neues Jahrb. Mineral. Monatsh 1970, 1970, 534–547. [Google Scholar]
  14. Wedepohl, K.H.; Correns, C.W.; Shaw, D.M.; Turekian, K.K.; Zemann, J. Handbook of Geochemistry; Springer, 1969; Vol. 2. [Google Scholar]
  15. Miletich, R.; Seifert, F.; Angel, R.J. Compression of Cadmium Orthosilicate, Cd2SiO4: A High-Pressure Single-Crystal Diffraction Study. Zeitschrift für Kristallographie-Crystalline Materials 1998, 213, 288–295. [Google Scholar] [CrossRef]
  16. Miletich, R.; Nowak, M.; Seifert, F.; Angel, R.J.; Brandstätter, G. High-Pressure Crystal Chemistry of Chromous Orthosilicate, Cr2SiO4. A Single-Crystal X-Ray Diffraction and Electronic Absorption Spectroscopy Study. Phys Chem Miner 1999, 26, 446–459. [Google Scholar] [CrossRef]
  17. Kresse, G.; Furthmüller, J. Efficiency of Ab-Initio Total Energy Calculations for Metals and Semiconductors Using a Plane-Wave Basis Set. Comput Mater Sci 1996, 6, 15–50. [Google Scholar] [CrossRef]
  18. Perdew, J.P.; Ruzsinszky, A.; Csonka, G.I.; Vydrov, O.A.; Scuseria, G.E.; Constantin, L.A.; Zhou, X.; Burke, K. Restoring the Density-Gradient Expansion for Exchange in Solids and Surfaces. Phys. Rev. Lett. 2008, 100, 136406. [Google Scholar] [CrossRef] [PubMed]
  19. Perdew, J.P.; Burke, K.; Ernzerhof, M. Generalized Gradient Approximation Made Simple. Phys. Rev. Lett. 1996, 77, 3865–3868. [Google Scholar] [CrossRef] [PubMed]
  20. Monkhorst, H.J.; Pack, J.D. Special Points for Brillouin-Zone Integrations. Phys Rev B 1976, 13, 5188–5192. [Google Scholar] [CrossRef]
  21. Gonze, X.; Lee, C. Dynamical Matrices, Born Effective Charges, Dielectric Permittivity Tensors, and Interatomic Force Constants from Density-Functional Perturbation Theory. Phys Rev B Condens Matter Mater Phys 1997, 55, 10355–10368. [Google Scholar] [CrossRef]
  22. Heyd, J.; Scuseria, G.E.; Ernzerhof, M. Hybrid Functionals Based on a Screened Coulomb Potential. J Chem Phys 2003, 118, 8207–8215. [Google Scholar] [CrossRef]
  23. Birch, F. Finite Elastic Strain of Cubic Crystals. Physical Review 1947, 71, 809–824. [Google Scholar] [CrossRef]
  24. Drickamer, H.G.; Lynch, R.W.; Clendenen, R.L.; Perez-Albueene, E.A. X-Ray Diffraction Studies of the Lattice Parameters of Solids under Very High Pressure. In Solid State Physics; Elsevier, 1967; Vol. 19, pp. 135–228. [Google Scholar]
  25. Ruiz-Fuertes, J.; Friedrich, A.; Errandonea, D.; Segura, A.; Morgenroth, W.; Rodríguez-Hernández, P.; Muñoz, A.; Meng, Y. Optical and Structural Study of the Pressure-Induced Phase Transition of CdWO4. Phys Rev B 2017, 95, 174105. [Google Scholar] [CrossRef]
  26. Isaak, D.G.; Graham, E.K.; Bass, J.D.; Wang, H. The Elastic Properties of Single-Crystal Fayalite as Determined by Dynamical Measurement Techniques. Pure Appl Geophys 1993, 141, 393–414. [Google Scholar] [CrossRef]
  27. Sharp, Z.D.; Hazen, R.M.; Finger, L.W. High-Pressure Crystal Chemistry of Monticellite, CaMgSiO4. American Mineralogist 1987, 72, 748–755. [Google Scholar]
  28. Nye, J.F. Physical Properties of Crystals: Their Representation by Tensors and Matrices; Oxford university press, 1985. [Google Scholar]
  29. Mouhat, F.; Coudert, F.-X. Necessary and Sufficient Elastic Stability Conditions in Various Crystal Systems. Phys Rev B 2014, 90, 224104. [Google Scholar] [CrossRef]
  30. Reuß, A. Berechnung Der Fließgrenze von Mischkristallen Auf Grund Der Plastizitätsbedingung Für Einkristalle. ZAMM-Journal of Applied Mathematics and Mechanics/Zeitschrift für Angewandte Mathematik und Mechanik 1929, 9, 49–58. [Google Scholar] [CrossRef]
  31. Hill, R. The Elastic Behaviour of a Crystalline Aggregate. Proceedings of the Physical Society. Section A 1952, 65, 349. [Google Scholar] [CrossRef]
  32. Pugh, S.F. XCII. Relations between the Elastic Moduli and the Plastic Properties of Polycrystalline Pure Metals. The London, Edinburgh, and Dublin Philosophical Magazine and Journal of Science 1954, 45, 823–843. [Google Scholar] [CrossRef]
  33. Lewandowski*, J.J.; Wang, W.H.; Greer, A.L. Intrinsic Plasticity or Brittleness of Metallic Glasses. Philos Mag Lett 2005, 85, 77–87. [Google Scholar] [CrossRef]
  34. Köster, W.; Franz, H. Poisson’s Ratio for Metals and Alloys. Metallurgical reviews 1961, 6, 1–56. [Google Scholar] [CrossRef]
  35. Ledbetter, M.H. Materials at Low Temperatures, Edited by RP Reed and AF Clark American Society for Metals. Metals Park, OH 1983, 1. [Google Scholar]
  36. Ravindran, P.; Fast, L.; Korzhavyi, P.A.; Johansson, B.; Wills, J.; Eriksson, O. Density Functional Theory for Calculation of Elastic Properties of Orthorhombic Crystals: Application to TiSi2. J Appl Phys 1998, 84, 4891–4904. [Google Scholar] [CrossRef]
  37. Chung, D.H.; Buessem, W.R. The Elastic Anisotropy of Crystals. J Appl Phys 1967, 38, 2010–2012. [Google Scholar] [CrossRef]
  38. Ranganathan, S.I.; Ostoja-Starzewski, M. Universal Elastic Anisotropy Index. Phys Rev Lett 2008, 101, 55504. [Google Scholar] [CrossRef] [PubMed]
  39. Brugger, K. Determination of Third-Order Elastic Coefficients in Crystals. J Appl Phys 1965, 36, 768–773. [Google Scholar] [CrossRef]
  40. Music, D.; Houben, A.; Dronskowski, R.; Schneider, J.M. Ab Initio Study of Ductility in M2AlC (M= Ti, V, Cr). Phys Rev B 2007, 75, 174102. [Google Scholar] [CrossRef]
  41. Ouahrani, T.; Boufatah, R.M.; Benaissa, M.; Morales-García, Á.; Badawi, M.; Errandonea, D. Effect of Intrinsic Point Defects on the Catalytic and Electronic Properties of Cu2WS4 Single Layer: Ab Initio Calculations. Phys. Rev. Mater. 2023, 7, 25403. [Google Scholar] [CrossRef]
  42. Errandonea, D.; Martinez-Garcia, D.; Lacomba-Perales, R.; Ruiz-Fuertes, J.; Segura, A. Effects of High Pressure on the Optical Absorption Spectrum of Scintillating PbWO4 Crystals. Appl Phys Lett 2006, 89. [Google Scholar] [CrossRef]
  43. Ruiz-Fuertes, J.; López-Moreno, S.; López-Solano, J.; Errandonea, D.; Segura, A.; Lacomba-Perales, R.; Muñoz, A.; Radescu, S.; Rodríguez-Hernández, P.; Gospodinov, M.; et al. Pressure Effects on the Electronic and Optical Properties of AWO4 Wolframites (A= Cd, Mg, Mn, and Zn): The Distinctive Behavior of Multiferroic MnWO 4. Phys Rev B 2012, 86, 125202. [Google Scholar] [CrossRef]
  44. Liang, A.; Shi, L.-T.; Turnbull, R.; Manjón, F.J.; Ibáñez, J.; Popescu, C.; Jasmin, M.; Singh, J.; Venkatakrishnan, K.; Vaitheeswaran, G.; et al. Pressure-Induced Band-Gap Energy Increase in a Metal Iodate. Phys Rev B 2022, 106, 235203. [Google Scholar] [CrossRef]
  45. Monteseguro, V.; Ruiz-Fuertes, J.; Contreras-García, J.; Rodríguez-Hernández, P.; Muñoz, A.; Errandonea, D. High Pressure Theoretical and Experimental Analysis of the Bandgap of BaMoO4, PbMoO4, and CdMoO4. Appl Phys Lett 2019, 115. [Google Scholar] [CrossRef]
  46. Errandonea, D.; Bandiello, E.; Segura, A.; Hamlin, J.J.; Maple, M.B.; Rodriguez-Hernandez, P.; Muñoz, A. Tuning the Band Gap of PbCrO4 through High-Pressure: Evidence of Wide-to-Narrow Semiconductor Transitions. J Alloys Compd 2014, 587, 14–20. [Google Scholar] [CrossRef]
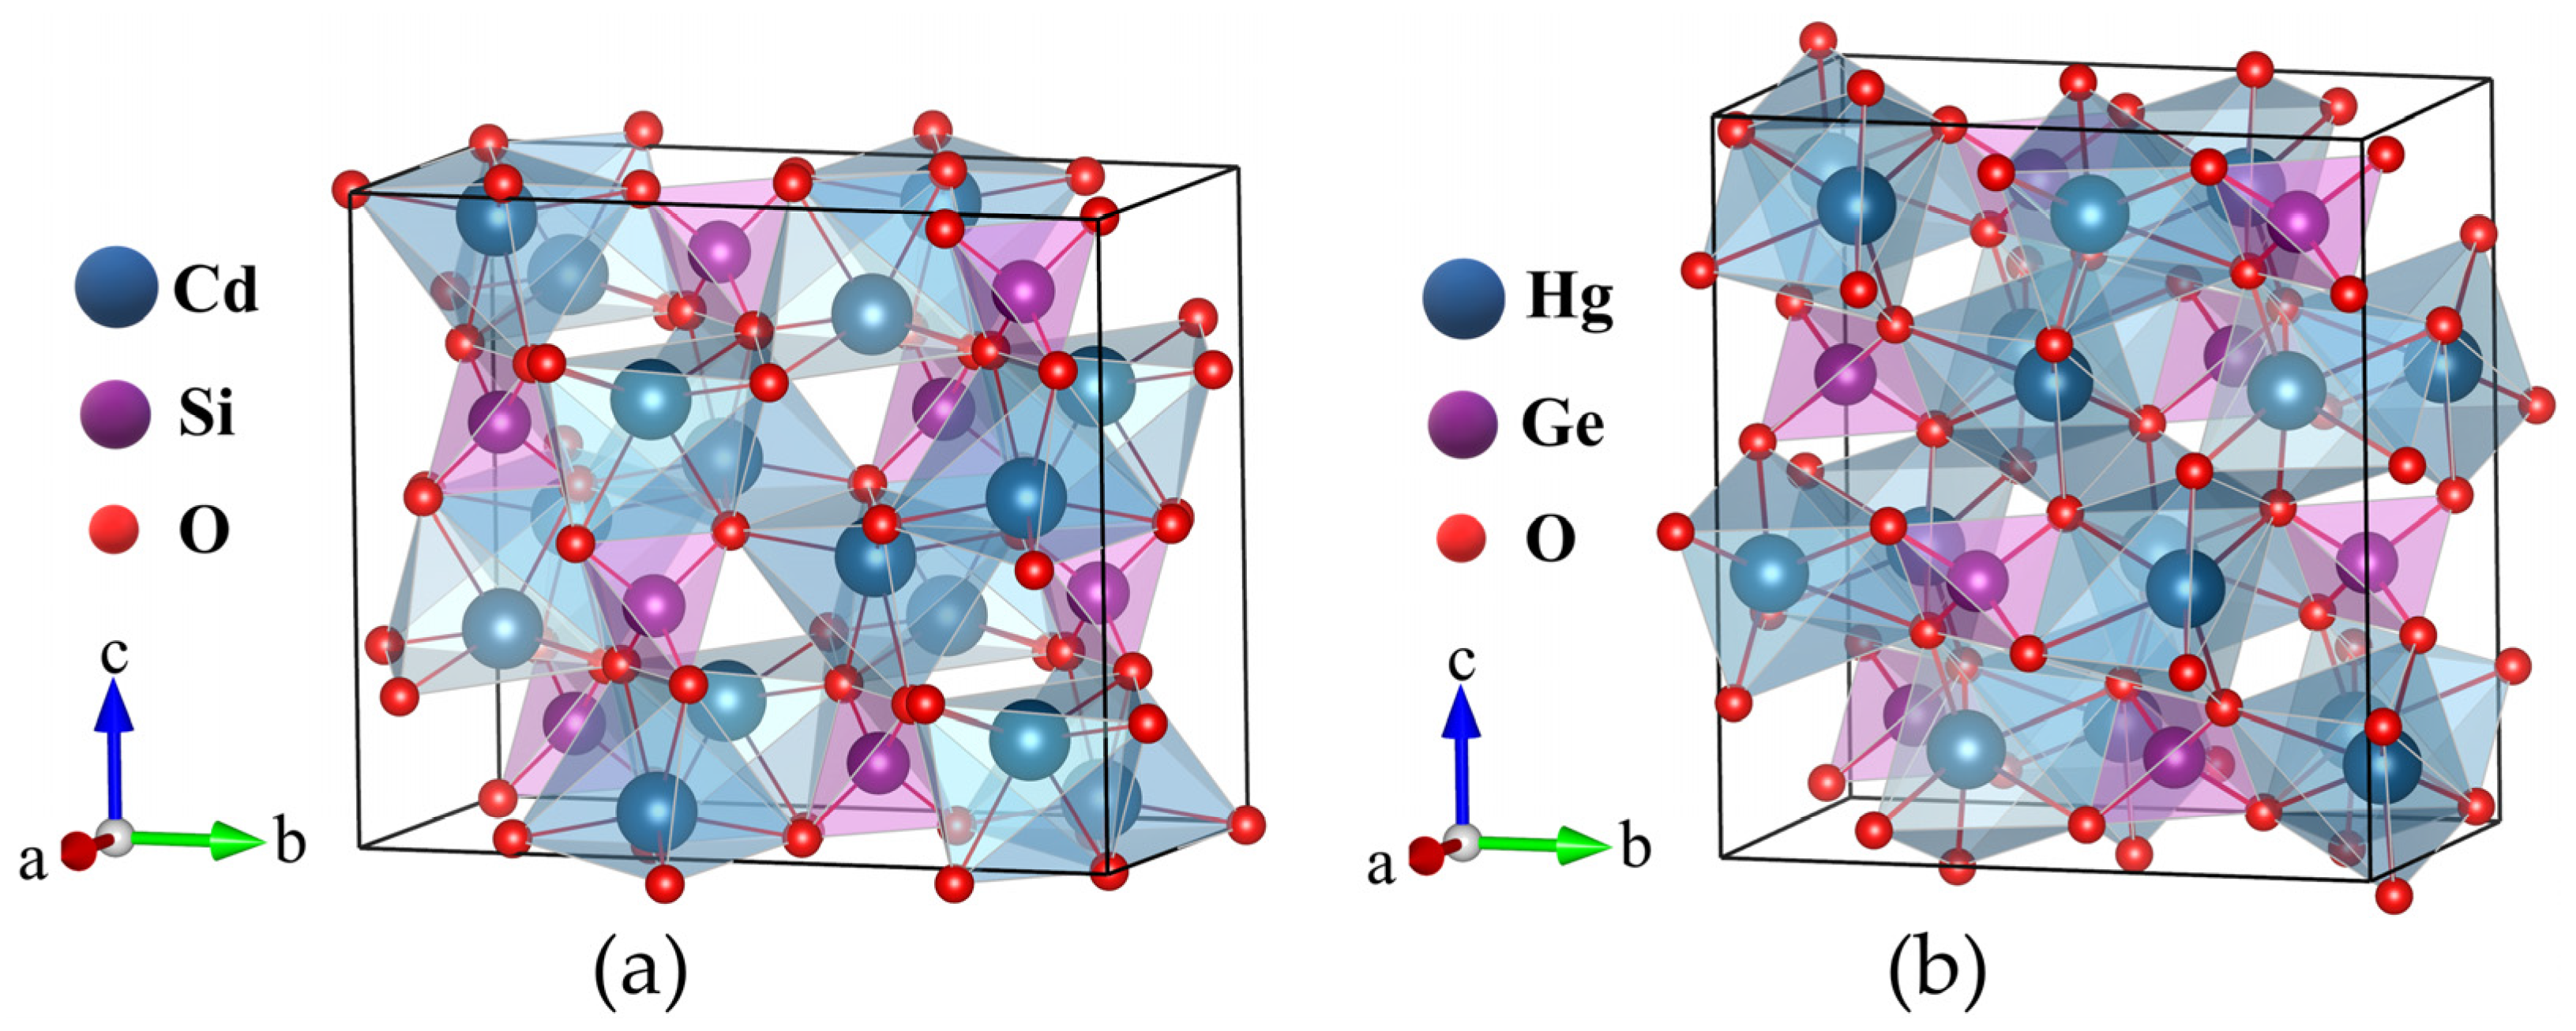
Figure 1. Crystal structure of (a) Cd2SiO4 and (b) Hg2GeO4.
Preprints 100892 g001
Figure 2. The variations in lattice parameters and volume under pressure for (a) Cd2SiO4 and (b) Hg2GeO4. The pressure-induced changes in volume, accompanied by fitting to the Birch-Murnaghan equation for (c) Cd2SiO4 and (d) Hg2GeO4.
Preprints 100892 g002
Figure 3. Pressure dependence of (a, b) polyhedral volume along with the quadratic elongation (QE) and angular variance (AV) of CdO6 and SiO4. (c) Selected bond lengths and (d) inter-cation distances as a function of pressure of Cd2SiO4.
Preprints 100892 g003
Figure 4. Pressure dependence of polyhedral volume along with the quadratic elongation (QE) and angular variance (AV) of (a) HgO6 and (b) GeO4. (c) Selected bond lengths and (d) inter-cation distances as a function of pressure of Hg2GeO4.
Preprints 100892 g004
Figure 5. The pressure-dependent variations in elastic constants, elastic moduli, Poisson’s ratio (ν), and B/G values are investigated for (a, c, e) Cd2SiO4 and (b, d, f) Hg2GeO4.
Preprints 100892 g005
Figure 6. The phonon dispersion and phonon density of states for (a, c) Cd2SiO4 and (b, d) Hg2GeO4.
Preprints 100892 g006
Figure 7. The electronic band structure of (a) Cd2SiO4 and (b) Hg2GeO4 using PBEsol-GGA. The electronic band structure and projected density of states using HSE functionals of (c, e) Cd2SiO4 and (d, f) Hg2GeO4.
Preprints 100892 g007
Figure 8. The electronic band gap of (a) Cd2SiO4 and (b) Hg2GeO4 using HS06 under external pressures.
Preprints 100892 g008
Table 1. The unit-cell parameters for Cd2SiO4 and Hg2GeO4, comprising outcomes from both PBE and PBEsol computations, as well as experimental findings.
Compound PBE PBEsol Expt. [6,15]
Cd2SiO4 a (Å) 6.100 6.008 6.011
b (Å) 12.005 11.883 11.805
c (Å) 10.015 9.834 9.802
V3) 733.44 701.97 695.60
Hg2GeO4 a (Å) 6.728 6.552 6.603
b (Å) 11.305 10.621 10.596
c (Å) 11.661 11.667 11.485
V3) 886.88 811.93 803.55
Table 2. Calculated atomic positions of both compounds using PBEsol functional.
Compound Atom x y z
Cd2SiO4 Cd(1) 0.1250 0.1250 0.4401
Cd(2) 0.8750 0.8750 0.5599
Cd(3) 0.3750 0.8750 0.6901
Si(1) 0.1250 0.1250 0.1250
Si(2) 0.8750 0.8750 0.8750
O(1) 0.9689 0.0508 0.2301
O(2) 0.0311 0.9492 0.7699
O(3) 0.7811 0.6992 0.2301
O(4) 0.2189 0.3008 0.7699
O(5) 0.7811 0.0508 0.5199
O(6) 0.2189 0.9492 0.4801
O(7) 0.9689 0.6992 0.5199
O(8) 0.0310 0.3008 0.4801
Hg2GeO4 Hg(1) 0.1250 0.4454 0.1250
Hg(2) 0.8750 0.5546 0.8750
Hg(3) 0.3750 0.6954 0.8750
Ge(1) 0.1250 0.1250 0.1250
Ge(2) 0.8750 0.8750 0.8750
O(1) 0.9783 0.2319 0.0425
O(2) 0.0217 0.7681 0.9574
O(3) 0.7717 0.5181 0.0425
O(4) 0.2283 0.4819 0.9574
O(5) 0.7717 0.2319 0.7074
O(6) 0.2283 0.7681 0.2925
O(7) 0.9783 0.5181 0.7074
O(8) 0.0217 0.4819 0.2925
Table 3. The shear anisotropy factors as a function of pressure.
Compound P(GPa) A1 A2 A3 AB AG AU
Cd2SiO4 0 0.4375 0.7863 0.7614 0.0568 0.0779 0.9658
2 0.3958 0.7686 0.7643 0.0520 0.0869 1.0613
4 0.3598 0.7486 0.7603 0.0505 0.0977 1.1889
6 0.3276 0.7254 0.7500 0.0498 0.1101 1.3420
8 0.2997 0.7016 0.7367 0.0498 0.1230 1.5077
10 0.2731 0.6760 0.7188 0.0499 0.1380 1.7055
Hg2GeO4 0 0.3260 0.6662 0.7101 0.3245 0.2199 3.7801
2 0.3371 0.6137 0.7262 0.2639 0.1972 3.1736
4 0.3410 0.5733 0.7764 0.2193 0.1852 2.8348
6 0.3409 0.5246 0.7973 0.1772 0.1808 2.6384
8 0.3310 0.4933 0.8050 0.1459 0.1870 2.6420
10 0.3104 0.4591 0.7787 0.1191 0.1975 2.732
Table 4. Calculated density (ρ), longitudinal (vl), transverse (vt), and mean (vm) elastic wave velocities and Debye temperature (θD) for both compounds under external pressures.
Compound P(GPa) ρ (gm/cc) vl (km/s) vt (km/s) vm (km/s) θD
Cd2SiO4 0 5.9973 5.4857 2.6479 2.9763 381.45
2 6.0949 5.5822 2.6569 2.9887 385.11
4 6.1848 5.6551 2.6550 2.9885 386.98
6 6.2744 5.7198 2.6466 2.9812 387.88
8 6.3578 5.7737 2.6346 2.9696 388.07
10 6.4383 5.8208 2.6172 2.9518 387.37
Hg2GeO4 0 8.7991 3.4010 1.5646 1.7628 215.23
2 9.0717 3.5619 1.5657 1.7677 218.03
4 9.3188 3.6957 1.5632 1.7674 219.96
6 9.5266 3.8229 1.5628 1.7690 221.78
8 9.7168 3.9256 1.5749 1.7838 225.11
10 9.8873 4.0251 1.5853 1.7966 228.06
Table 5. The vibrational modes of Cd2SiO4 and Hg2GeO4.
Cd2SiO4 Hg2GeO4
Mode RAMAN/IR
active
Frequency
(cm-1)
Mode RAMAN/IR
active
Frequency (cm-1)
B3g RAMAN 70.48 B1g RAMAN 48.66
B2g RAMAN 77.06 B3u IR 52.15
B3u IR 84.64 B2g RAMAN 54.79
Ag RAMAN 103.24 B3g RAMAN 55.31
B1g RAMAN 104.33 Ag RAMAN 58.19
Au IR 111.70 Au IR 65.15
B3g RAMAN 126.47 B1u IR 65.44
B1u IR 130.56 B3g RAMAN 82.04
B1g RAMAN 153.06 B1g RAMAN 90.45
B1g RAMAN 159.24 B2u IR 106.81
B2g RAMAN 160.85 B3u IR 131.11
B2u IR 174.60 B1g RAMAN 137.11
B3u IR 176.64 B2g RAMAN 138.72
B1u IR 213.17 B3g RAMAN 150.48
B3g RAMAN 230.41 B2g RAMAN 155.27
B2g RAMAN 240.23 B1u IR 160.18
B3u IR 280.10 B2u IR 191.72
B2u IR 286.03 Ag RAMAN 207.15
Ag RAMAN 302.00 B3u IR 238.31
B1u IR 316.32 B1u IR 250.96
B1g RAMAN 332.81 Au IR 254.10
B3g RAMAN 346.75 B1g RAMAN 275.48
Au IR 359.30 B3g RAMAN 297.23
Ag RAMAN 388.13 Ag RAMAN 330.62
B3u IR 439.61 B3u IR 377.96
B1u IR 456.44 B2u IR 400.32
B3g RAMAN 460.04 B3g RAMAN 404.92
Au IR 484.22 B1u IR 422.41
B1g RAMAN 491.78 B1g RAMAN 430.53
B2u IR 502.84 B2g RAMAN 435.91
B2g RAMAN 534.46 Au IR 442.38
Au IR 803.04 B1u IR 661.33
Ag RAMAN 822.00 B3u IR 669.70
B1u IR 833.21 B3g RAMAN 676.43
B3u IR 849.23 B1g RAMAN 686.86
B3g RAMAN 851.31 B2u IR 695.40
B2u IR 872.81 Au IR 729.19
B1g RAMAN 878.83 B2g RAMAN 734.43
B2g RAMAN 915.79 Ag RAMAN 735.64
Disclaimer/Publisher’s Note: The statements, opinions and data contained in all publications are solely those of the individual author(s) and contributor(s) and not of MDPI and/or the editor(s). MDPI and/or the editor(s) disclaim responsibility for any injury to people or property resulting from any ideas, methods, instructions or products referred to in the content.
Copyright: This open access article is published under a Creative Commons CC BY 4.0 license, which permit the free download, distribution, and reuse, provided that the author and preprint are cited in any reuse.
Prerpints.org logo

Preprints.org is a free preprint server supported by MDPI in Basel, Switzerland.

Subscribe

© 2024 MDPI (Basel, Switzerland) unless otherwise stated