Preprint
Article

Life Cycle Assessment of Wheat Straw Pyrolysis With Volatiles Fraction Chemical Looping Combustion

Altmetrics

Downloads

111

Views

53

Comments

0

A peer-reviewed article of this preprint also exists.

Submitted:

09 March 2024

Posted:

11 March 2024

You are already at the latest version

Alerts
Abstract
Keywords: Biomass pyrolysis, Chemical Looping Combustion, Life Cycle Assessment, Environmental Impacts, Carbon Footprint.
Keywords: 
Subject: Engineering  -   Chemical Engineering

1. Introduction

To reach zero net CO2 emissions and limit global warming to 1.5°C following the Paris Agreement [1] it is necessary to remove and permanently store CO₂ from the atmosphere. Thus, carbon dioxide removal technologies are needed. In 2018, the International Panel on Climate Change officially listed biochar as a negative emissions technology, signaling that it may hold the key to some of our most pressing environmental challenges [2]. It can be converted into one of the safest, fastest and most efficient technologies to remove large amounts of CO2 from the atmosphere. This is achieved thanks to the fact that during its production the C from the CO2 that the plants had removed from the atmosphere through photosynthesis is fixed in a very stable way in the biochar, thus preventing it from being released again into the atmosphere due to the decomposing action of the microorganisms.
There are many works in literature studying the properties of biochar to enhance CO2 uptake, including physical, chemical, and physicochemical treatments. Following the up-to-date findings, a balance between the textural (specific surface area and micropore volume) and surface chemical attributes (basicity, mineral content, various functional groups, non-polarity and hydrophobicity) should be reached to produce biochar with high CO2 uptake capacity, strong selectivity towards CO2 over other gases and stable performance upon multiple cycles of CO2 adsorption-desorption [3]. Another aspect to be considered for biochar to be a key factor in the world of sustainability is its scalability.
One of the ways to obtain biochar is by subjecting biomass residues to a high temperature process in the absence or low content of oxygen (pyrolysis) [4]. Biochar obtained presents a high content of very stable organic carbon and high porosity. These properties make biochar a highly versatile material to be used not only for CO2 capture but applicable in areas as diverse as agriculture, gardening and landscaping, livestock, water purification, soil recovery and decontamination, and construction [5].
Together with biochar, the products obtained after biomass pyrolysis are water, oil tar and gases like hydrogen, methane, carbon dioxide and carbon monoxide. The amount and properties of these products in different phases depend upon the pyrolysis conditions and the characteristics of the input biomass. Especially interesting is the bio-oil obtained which is a highly complex mixture of many oxygenated hydrocarbons. Once upgraded, it could be used as fuel to replace fossil fuels, with the advantage of its renewability and low NOx and SOx emission [6]. The pyrolysis gases are useful in heat and power generation, either for the pyrolysis process itself or other processes, including the conversion into new fuels.
When pyrolysis gases are burned for energy generation CO2 may be emitted. These CO2 emissions could be considered as neutral since they are generated from biomass, which is a neutral fuel. If the combustion of pyrolysis gases implemented CO2 capture, the biochar production process would reinforce its potential to achieve negative CO2 emissions. In order to capture this CO2, the combustion of pyrolysis gases could proceed using the Chemical Looping Combustion technology (CLC). It is based on a simple principle, i.e the oxygen required for combustion is supplied by a solid oxygen carrier circulating between two interconnected reactors where it first transfers the oxygen to the fuel (fuel reactor) and subsequently reoxidizes (air reactor). Commonly fluidized beds have proposed for fuel and air reactors although fixed bed has also been tested as an option. CLC avoids the direct contact between fuel and [7] air and thus facilitating the generation of a concentrated CO2 stream easy to capture (see Figure 1).
The development of an adequate oxygen carrier acquires vital importance for the development of this technology. Through the las 20 years, different oxygen carriers have developed and tested in continuous CLC units [8], mostly based on nickel, copper, manganese and iron oxides or combinations of them [9]. Not only reactivity and selectivity of the oxygen carriers should be considered, but also its mechanical properties. The oxygen carrier is one of the main cost for the CLC technology, thus attrition during operation should be considered for further scale-up of the materials [10].
The objective of the present work is to evaluate different approaches for biochar production with combustion of pyrolysis gases and bio-oil for energy production. In the conventional approach, the pyrolysis gas is partly used to fulfil the energy demand of the pyrolysis process, which is highly endothermic. In the CLC-approach syngas and bio-oil are burned in a Chemical Looping Combustion (CLC) system. Life Cycle Assessment (LCA) was performed to these systems to evaluate their environmental impact [11,12].

2. Methods

This LCA is based on the material and energy flows required by the three systems studied. This section details scope definition, inventory analysis and impact assessment considered for the systems.

2.1. Scope Definition

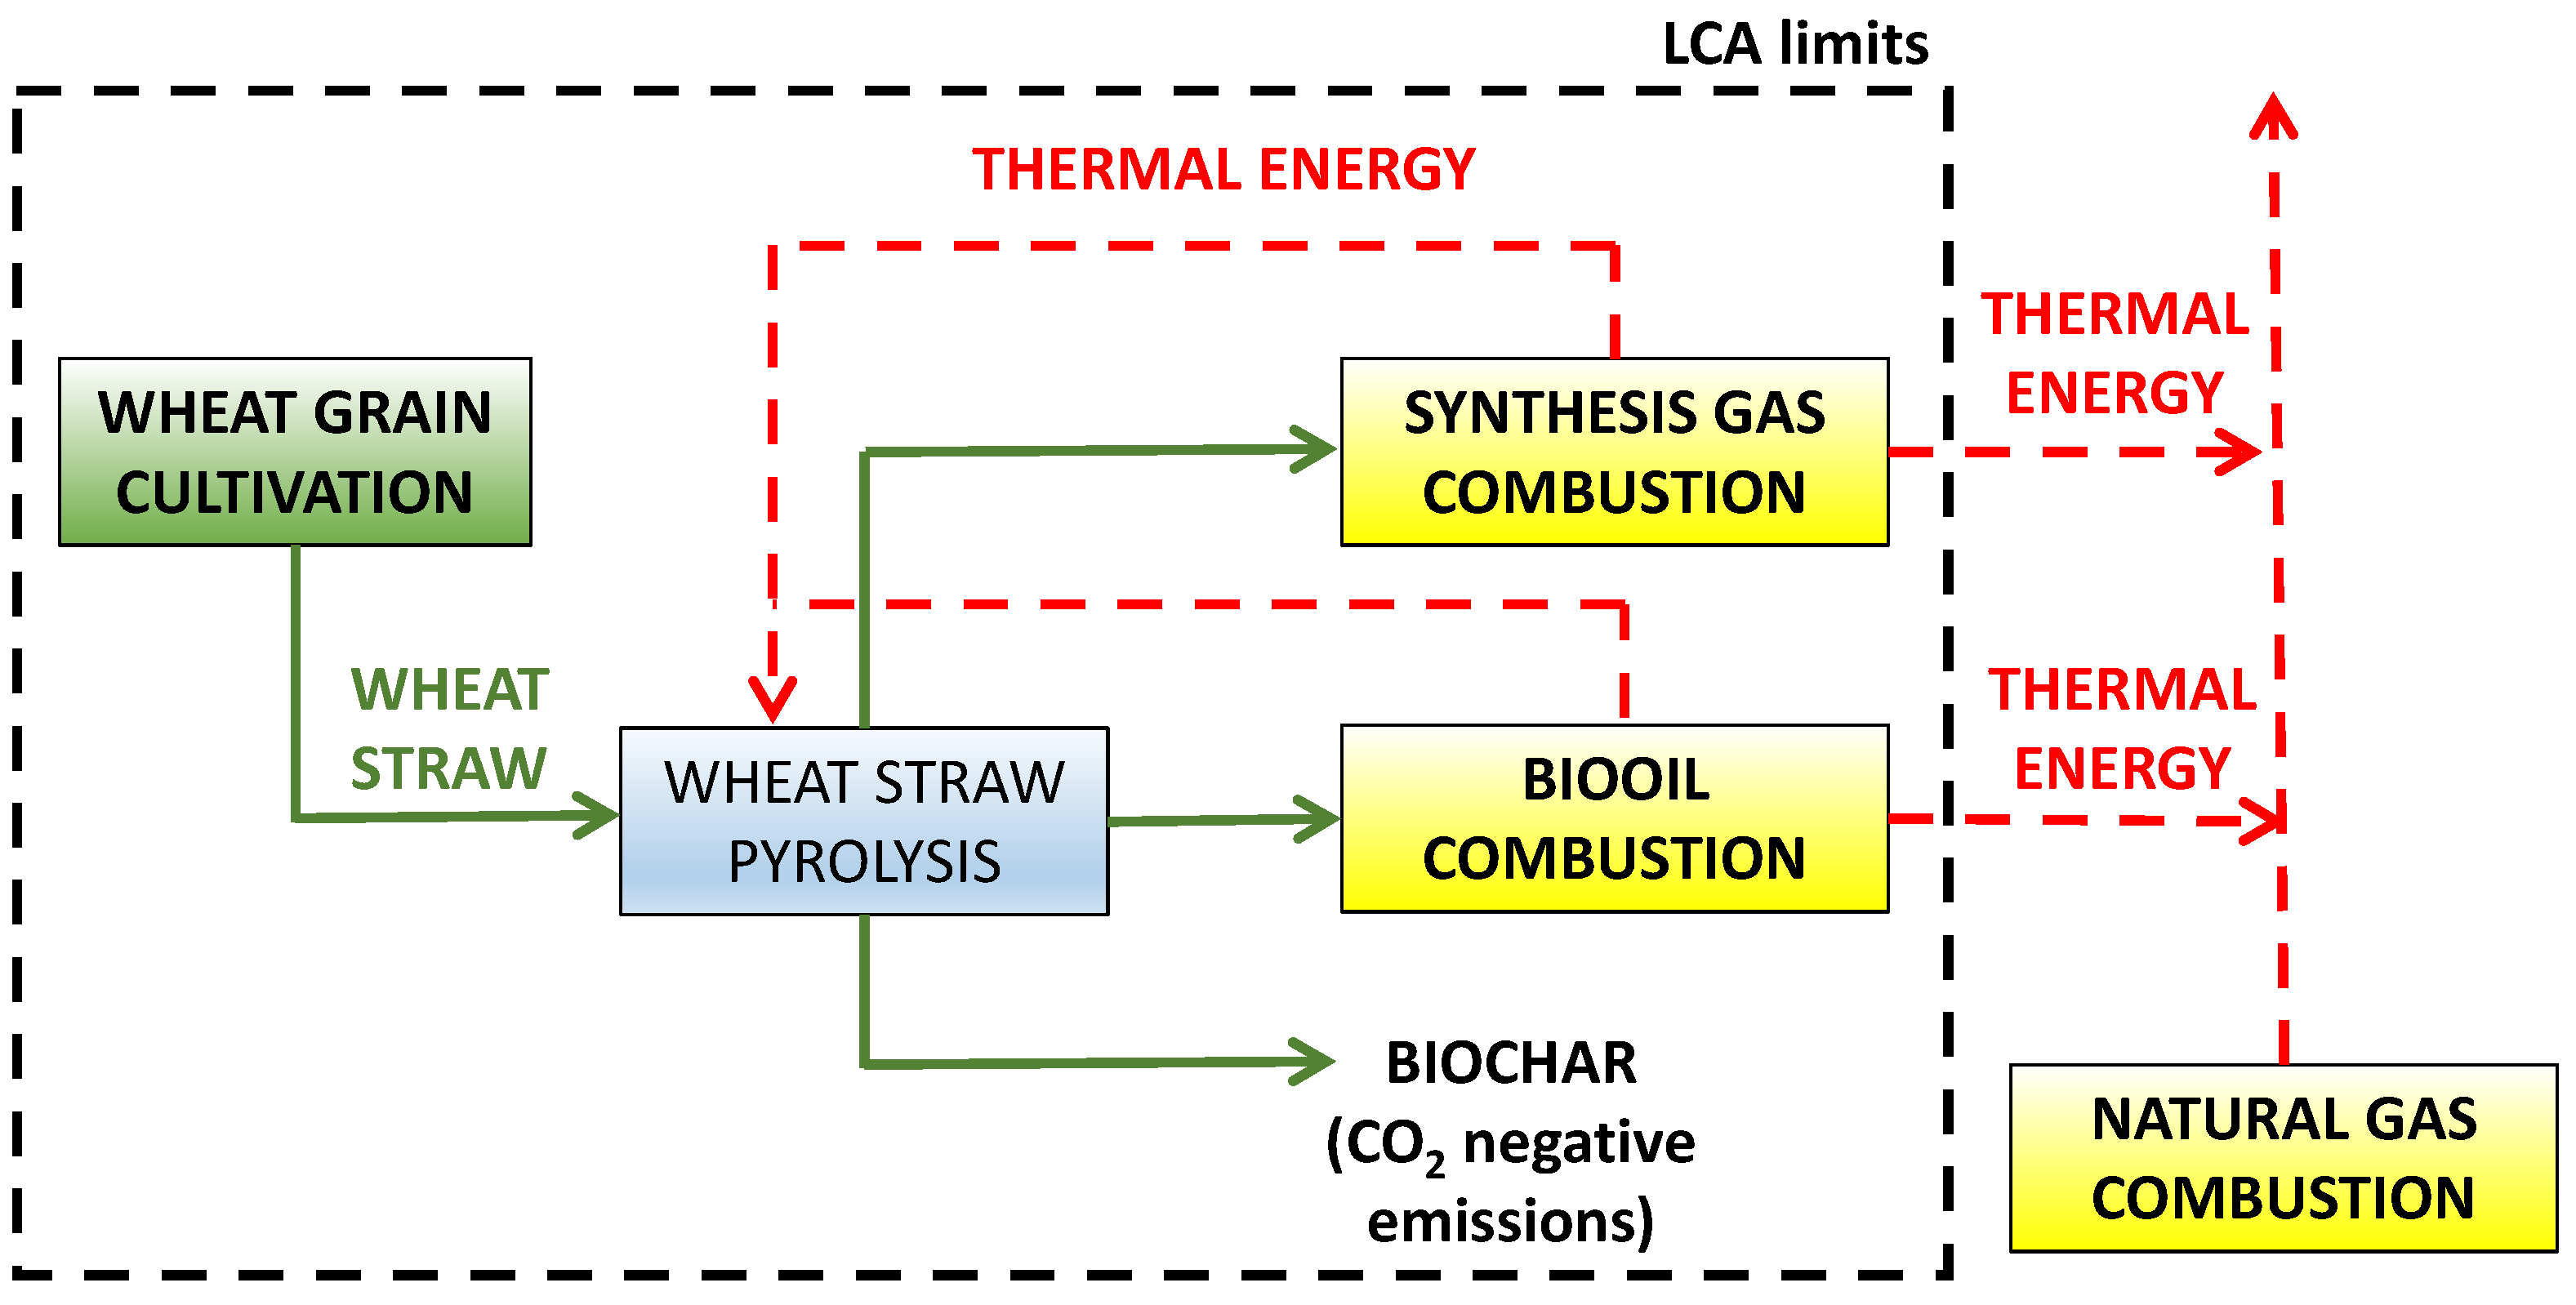
The LCA presented in this paper follows the recommendations given by the European Platform on Life Cycle Assessment [13]. Scope and limits of the study include all the process steps outlined in Figure 2. For the LCA simulation Sphera® LCA for Experts version 10.7 software is used, together with the databases associated with this software. Regarding time and geographical references, processes located in Spain are taken into consideration. Otherwise, data from the European Union or Germany are considered.

2.1.1. Functional Unit and Base Case

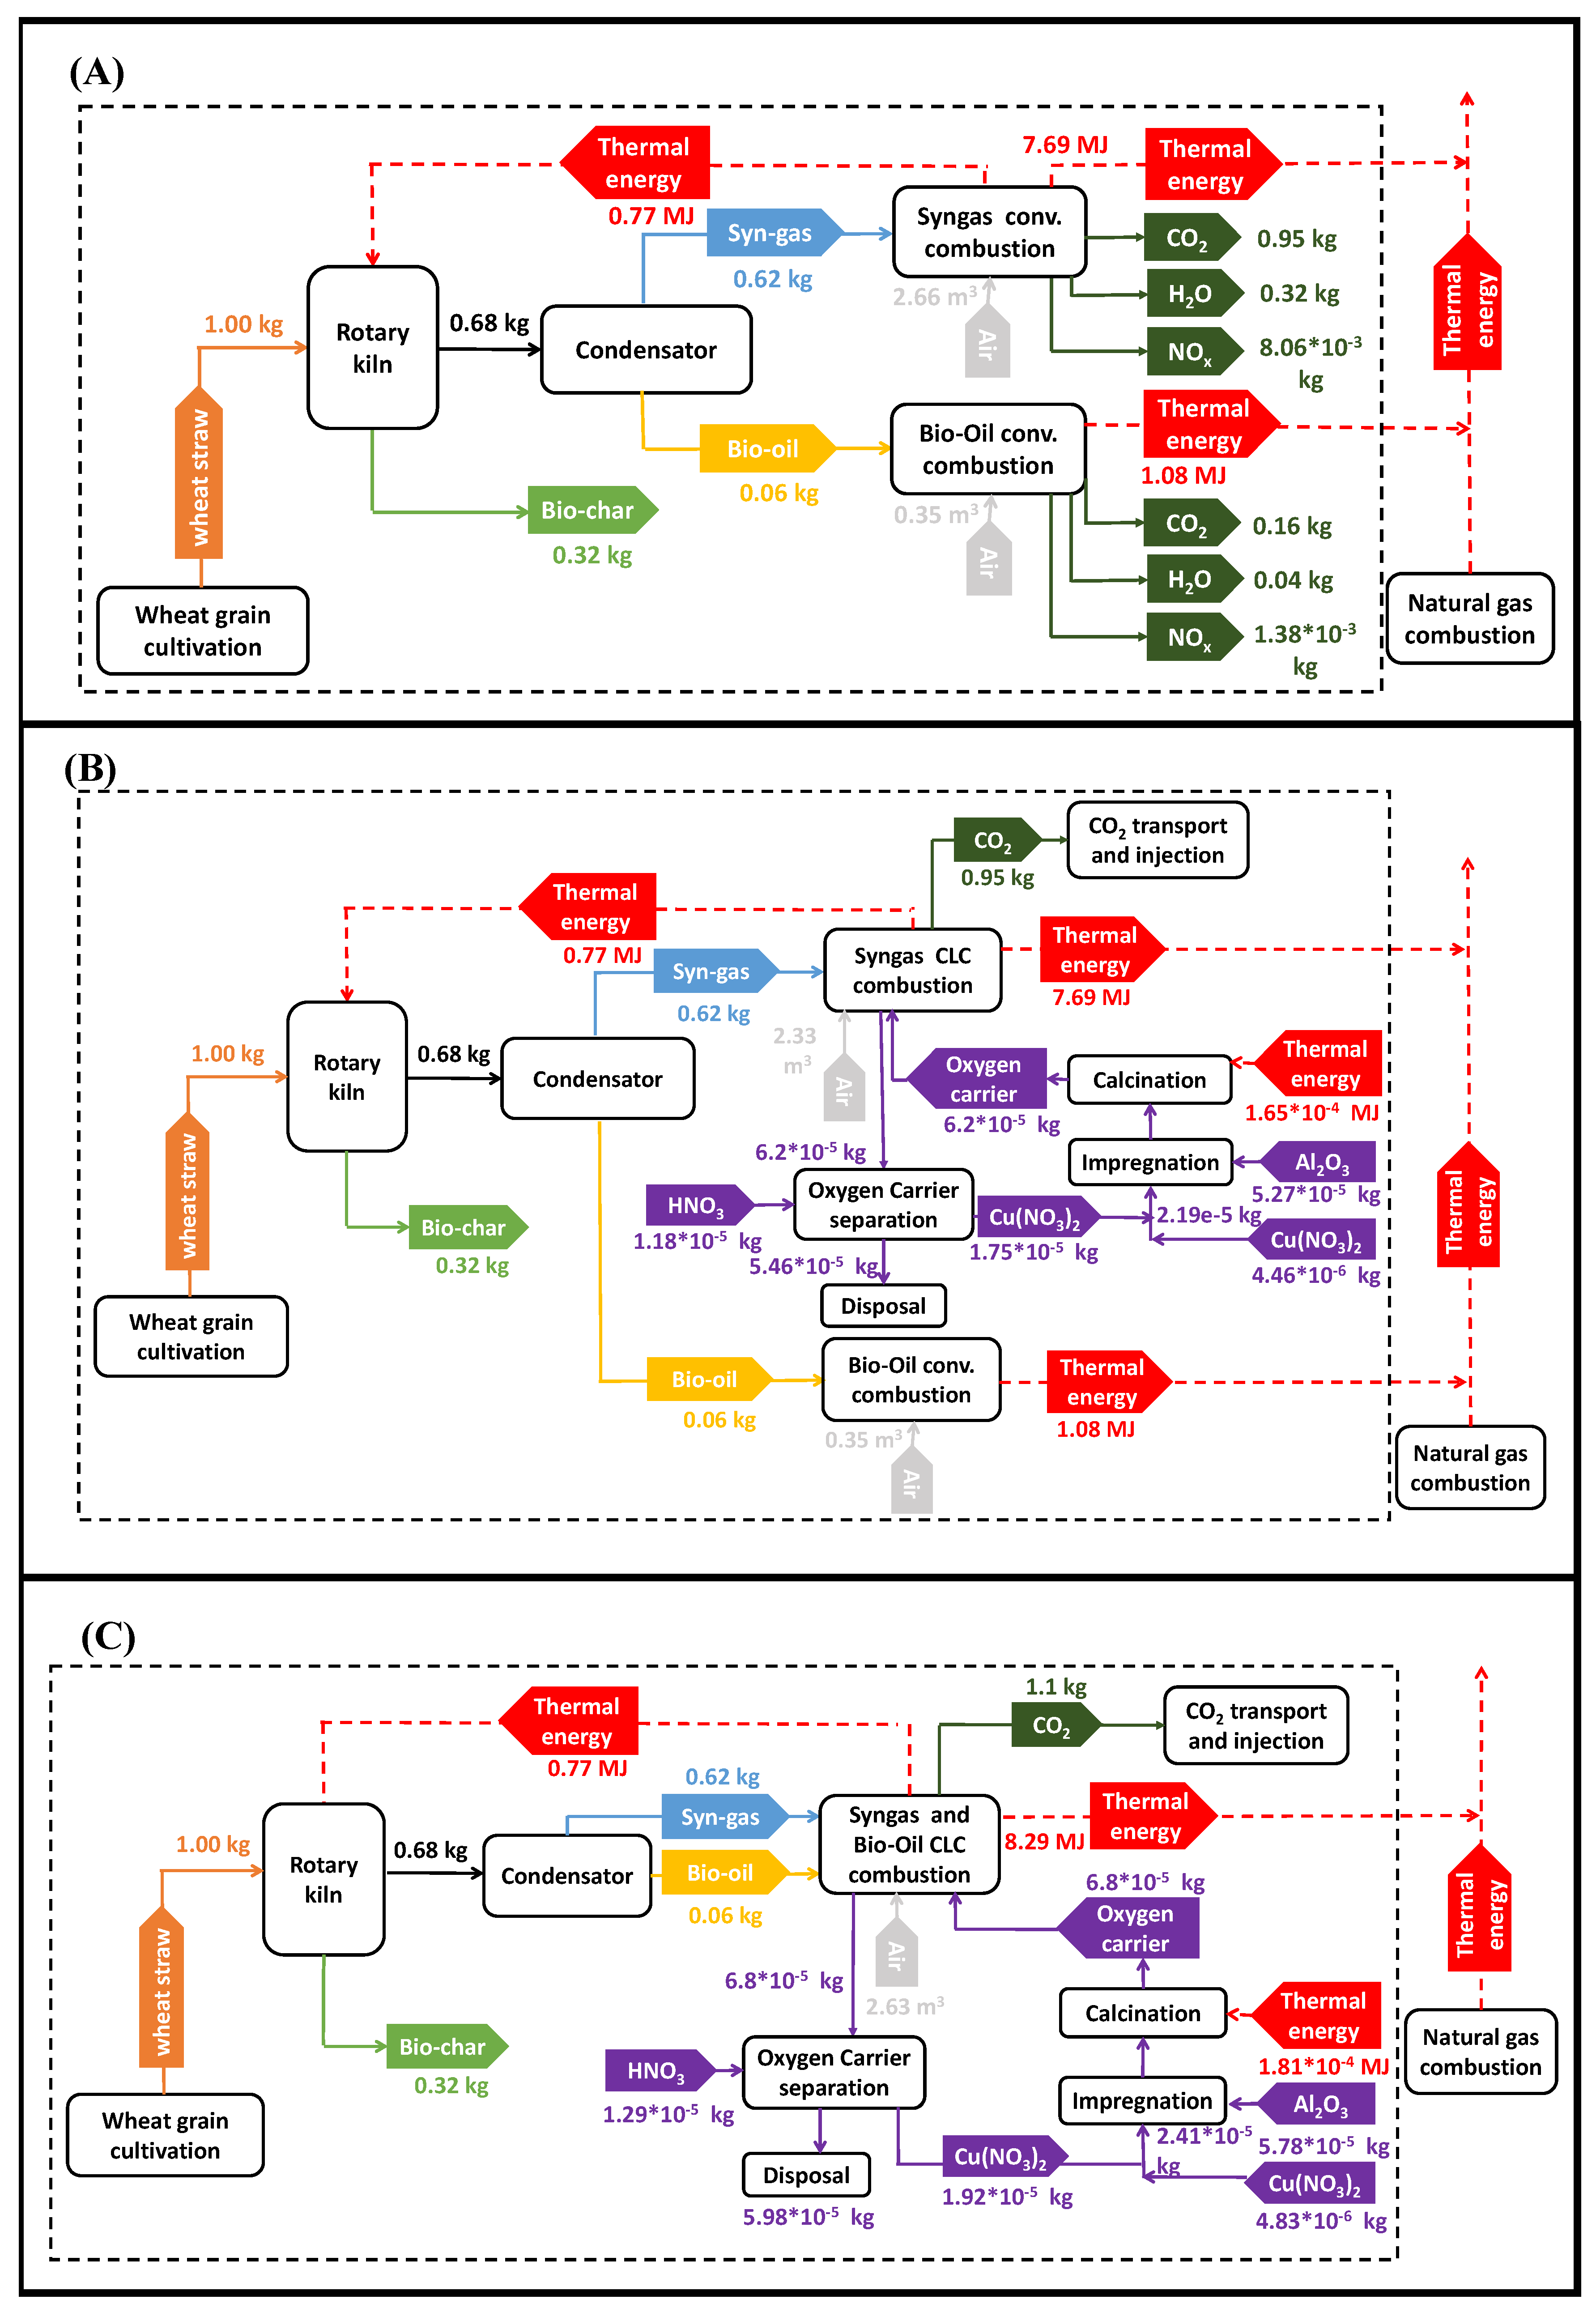
Comparative LCAs were conducted with reference to the Case I in Figure 3(A). In the three cases studied 1 kg of wheat straw is pyrolyzed on a Rotary Kiln at 550 ºC to obtain the same fraction of products: 0.62 kg of syngas, 0.06 kg of bio-oil and 0.32 kg of bio-char [14]. Straw pyrolysis energy requirements calculations data are: 0.55 MJ/kg to pyrolyze dry wheat straw [15] and 7.5 % wheat straw water content, obtaining an energy requirement of 0.77 MJ/kg. Composition exhaust gases pyrolysis is: H2, 13 %v, CO, 34 %v, CO2, 24 %v, CH4, 29 %v [14].
(i)
Case I- Conventional combustion gas fraction
1 kg of wet wheat straw is pyrolyzed in this first Case, with gas fraction burned by conventional combustion to supply the heat necessary for pyrolysis (Figure 3(A)). Considering syngas LHV and the efficiency of the conventional combustion as 95 %, the combustion heat of 0.62 kg will release 8.46 MJ of thermal energy. If 0.77 MJ are used to heat pyrolysis reactor, 7.69 MJ of thermal energy will leave the LCA limits. The environmental impacts of the production of this thermal energy by natural gas combustion are subtracted in the LCA. Considering stoichiometry combustion, syngas burner exit gas composition is: 0.95 kg CO2, 0.32 kg H2O, 8.06*10-3 kg NOx (3/350 kg NOx/kg CO2). Air necessary for the conventional combustion is 30 % in excess over the stoichiometric [16]. For the bio-oil conventional combustion, C10H12O2 has been taken as the bio-oil average composition and its LHV is 19.0 MJ/kg [17]. As in the case of syngas, 95 % is efficiency combustion, air requirement is 30 % in excess, CO2, H2O are the stoichiometric, and NOx is calculated with the ratio 3/350 kg NOx/kg CO2.
(ii)
Case II- Gas fraction CLC combustion and bio-oil conventional combustion.
In this case, the wheat straw pyrolysis gas fraction is burned on a CLC reactor instead on a conventional combustion reactor (Case I). For the CLC combustion, efficiency is reduced to 90% [18], and, therefore, the heat released is now 8.03 MJ (Figure 3(B)). CLC combustion releases CO2 pure stream that is transported and injected into an underground deposit (0.95 kg) and avoids NOx emissions. For an oxygen carrier based of copper oxygen (Cu15, 15 %w CuO over Al2O3) it is necessary 0.025 kg per MWh of syngas burned [19], so 6.2*10-5 kg of Cu15 are necessary in this study for gas fraction CLC combustion. The oxygen carrier is synthesized by impregnation of copper nitrate over Al2O3 and then calcined at 500 ºC. Part of the Cu15 elutriated in CLC reactors is recovered with a new impregnation with copper nitrate and the other part is sent to the landfill as inert waste. Detailed description of the oxygen carrier manufacture, its recovery and final treatment can be found in a work of the authors [20]. To calculate the necessary air, it will be considered that 0.5% in excess over the stoichiometric [19].
(iii)
Case III- Gas fraction and bio-oil CLC combustion.
In this third case, the gas fraction and the bio-oil (volatiles in Figure 3(C)) produced by wheat straw pyrolysis are combusted by CLC. The combustion efficiency is 90 % and the heat released is now 8.49 MJ. 0.68 kg of synthesis gas are considered for Cu15 mass calculation. Air necessary for the CLC combustion is 0.5 % in excess over the stoichiometric. CO2 captured after combustion is the sum of the released during combustion of synthesis gas fraction and bio-oil calculated in previous sections.

2.1.2. Impact Categories

Sphera® LCA for experts version 10.7 enabled calculation of 16 environmental impact indicators (EIIs) following the recommendations made by the European Comission-Joint Research Center [13]. The values obtained for each of these, along with the corresponding units and the method used for their estimation are presented in Table S1 in Supplemented Material. Selected impacts are grouped into level “I” (recommended and satisfactory), level “II” (recommended but in need of some improvements) or level “III” (recommended, but to be applied with caution).

2.2. Life Cycle Inventory

1.66 kg of wet wheat straw are produced [21] for 1 kg of wheat grain and ECOINVENT database is used for the simulation of wheat cultivation. CO2 captured during wheat growing is considered as neutral, and only CO2 released during cultivation and harvesting by machinery is emitted. Sphera® LCA for Experts version 10.7 database is used for the simulation of the main inputs and outputs of these processes. Oxygen carrier manufacture inventory is detailed in [20] and CO2 transport and injection simulation is described in [8] and considered as negative emissions. Carbon content in biochar is 70 % [14] and CO2 captured in biochar is considered as negative emissions. Finally, thermal energy released in synthetic gas and bio-oil combustion, are considered as avoided by natural gas combustion and their environmental impacts production are subtracted in LCA.

3. Results

Figure 4 shows EIIs total values for the three cases multiplied by different factors to show the 16 EIIs in the same graph. This Figure 4 shows that Case II reduces the environmental impacts from Case I for 7 environmental indicators (GWP, ODP, RI, POF, AC, EUT, EUM). On the other hand, Case II slightly increases the value of RU indicator, and maintains the value of the remaining 8 indicators (IR, EUF, HTC, HTNC, ECFW, LU, RDM and WU). In Case III it can be seen that the same 7 indicators as Case II decrease with respect to Case I (GWP, ODP, RI, POF, AC, EUT, EUM) but that it does so to a greater extent than Case II. Case III slightly increases the value of RU indicator and maintains the value of the remaining 8 indicators (IR, EUF, HTC, HTNC, ECFW, LU, RDM and WU).
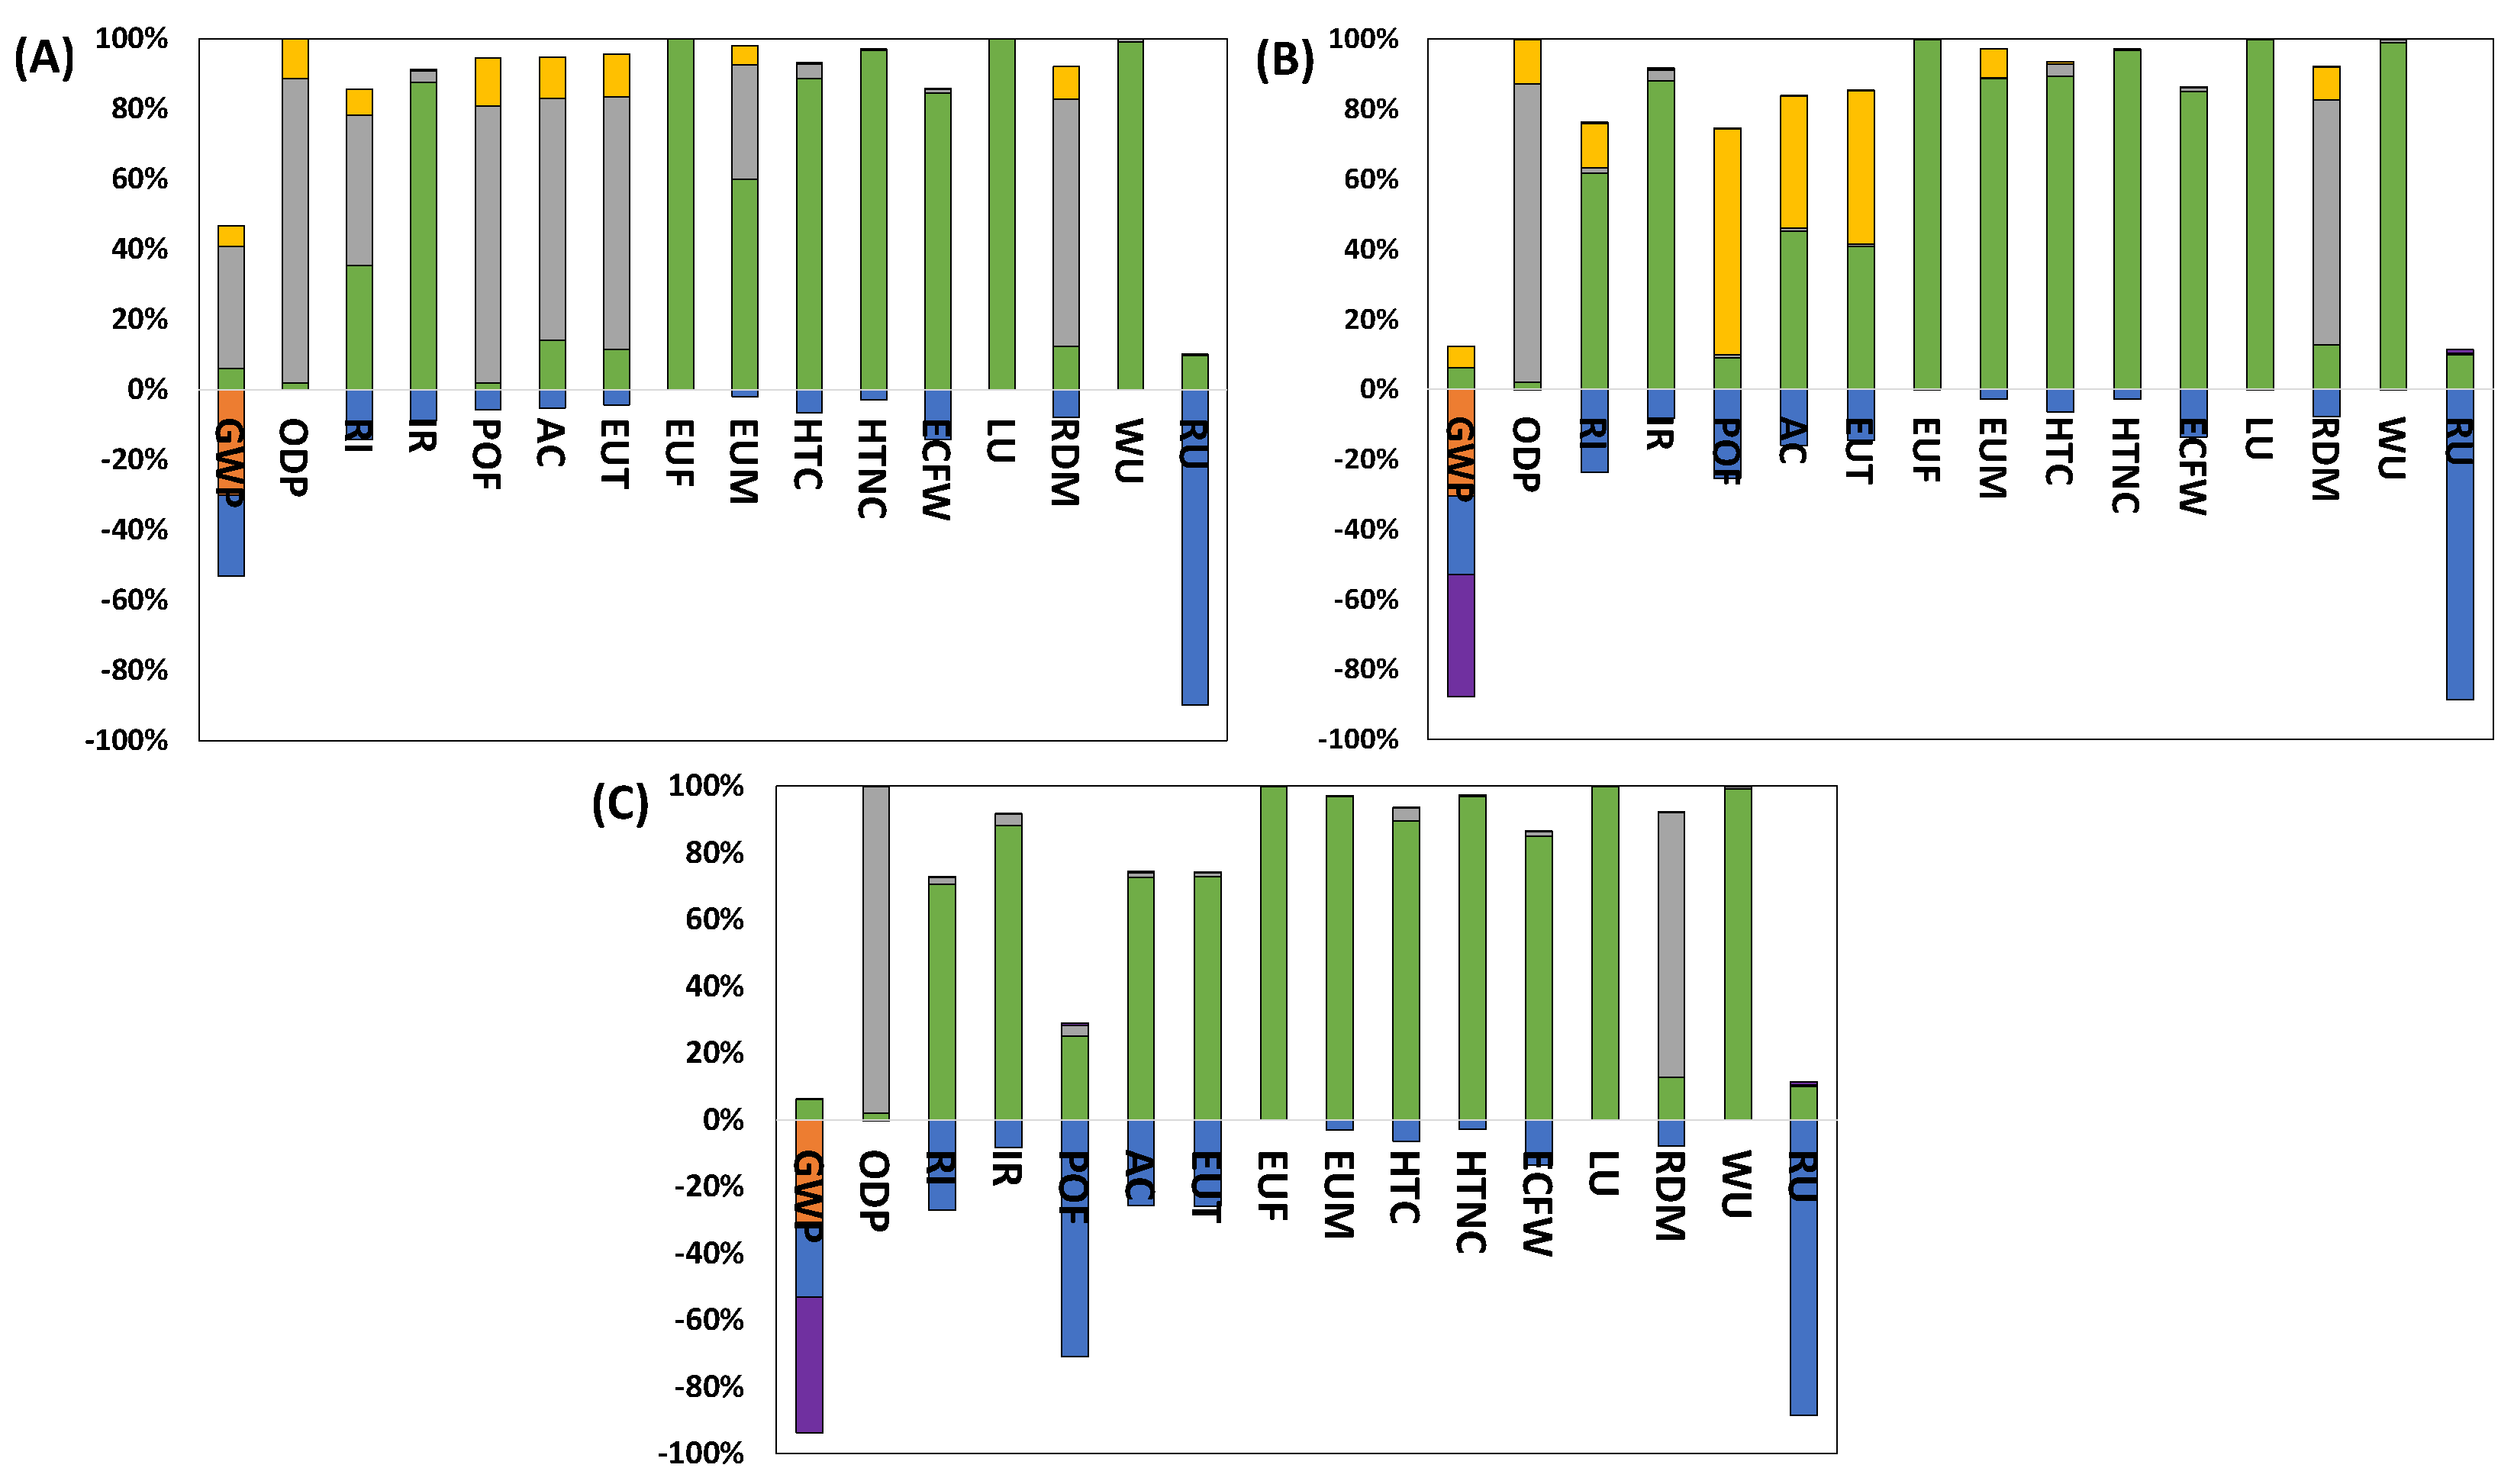
Looking into the values of the EIIs of the three cases with the contribution of each processes to the total values it is possible to find reasons for differences in Figure 3. This is what is represented on Figure 5 with the contribution of the different processes to the total values for the Cases I, II, and III, Figure 5(A), 5(B) and 5(C), respectively. The numerical values for each case are showed in Tables S2-S4 of the Supplementary Material.
GWP value is reduced for Cases II and III due to the transport and injection of CO2 after combustion in CLC. Since in Case III both the syngas and the bio-oil are burned by CLC, the reduction in the GWP value is greater. Regarding indicators RI, POF, AC, EUT, EUM, the reduction is due to the fact that NOx is not emitted in the CLC processes, and since in Case III less NOx is emitted than in Case II, EIIs reductions are greater. ODP indicator lower values for Cases II and III with respect to Case I are due to they use less air for combustion; air compression is considered to be done with renewable energy, which causes this indicator to decrease slightly. The reason why renewable energy increases the ODP indicator is that photovoltaics has a great influence on it [22]. Finally, RU indicator value increment for Cases II and III with respect to Case I is determined entirely by the fact that the amount of natural gas saved in the thermal energy emitted in the combustion of syn-gas or bio-oil, is less pronounced in Cases II and III. The reason of this variation is the efficiency of the combustion process for CLC that has been considered 90% for conventional combustion is 95%.
It can be concluded in the view of these results that the combustion of the gaseous fraction of the wheat straw pyrolysis decreases most of the EIIs because due to CO2 and NOx avoid emissions; this decrease is more pronounced when bot gaseous and liquid fractions (volatiles fraction) is burned by CLC. In the next section, the GWP reduction is going to be studied in detail comparing with the direct combustion of wheat straw.

3.1. Study of the CO2 Avoided

CO2 balances of the three different configurations studied in this work are compared with a base case that is the direct combustion of wheat straw to obtain thermal energy. With conventional fuels derived from fossils the term CO2 avoided it is frequently used to compare plants with and without carbon capture. In this context, CO2 avoided is the emissions per kWh of a plant with CO2 capture, compared to the emissions of a baseline plant that does not capture CO2 [23]. However, this comparison is not useful for energy plants with biomass as fuel because in this case combustion emissions should be considered as neutral and could lead to wrong conclusions. This is why in this section the three cases studied are going to be compared in terms of CO2 balance instead of CO2 avoided.
Table 1 shows CO2 fluxes for the generation of 17.1 MJ of energy for the four energy plants studied. 17.1 MJ is the energy generated during the direct combustion of 1 kg of wheat straw considering its LHV as 18.0 MJ/kg [24], carbon content 52.85%w and the efficiency combustion as 95 %.
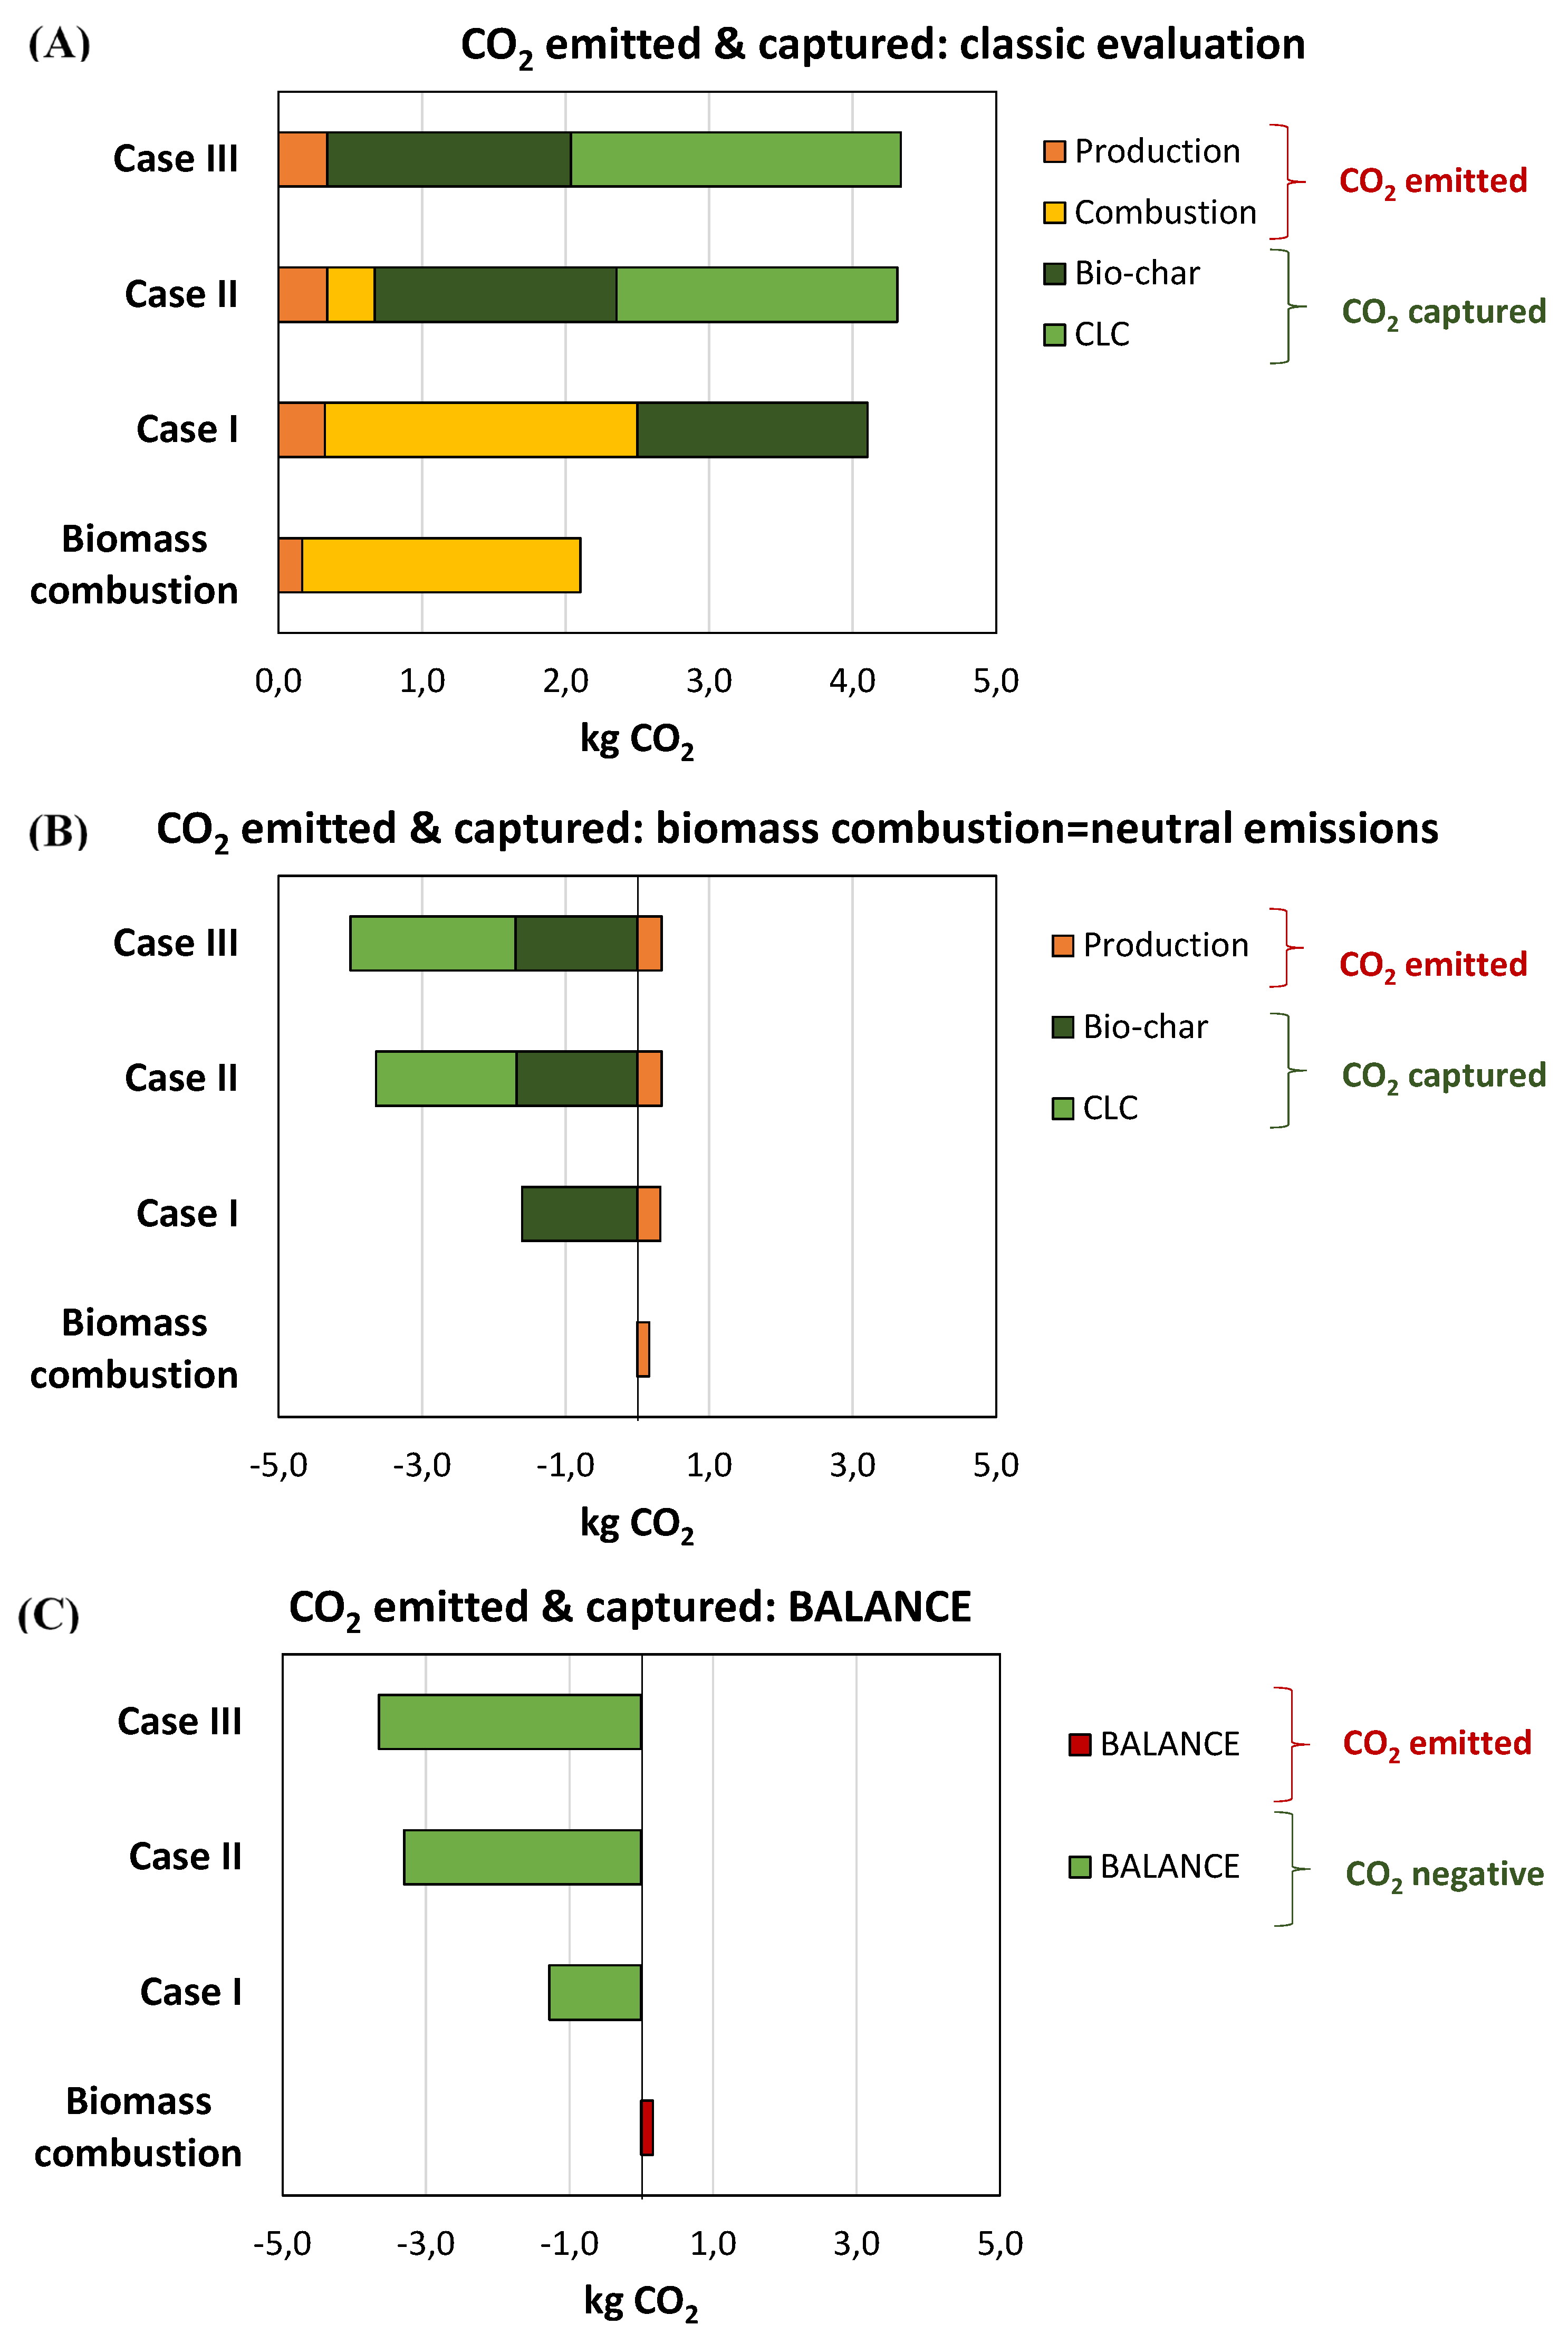
Cases I, II and III need more biomass (1.95, 2.05, and 2.06 kg) to generate 17.1 MJ of thermal energy than biomass direct combustion (1 kg) because energy released in these configurations is the resultant of syngas and bio-oil pyrolysis fractions burning after heating the rotary kiln (thermal energy fluxes that leaves the LCA limits in Figures 3(A), 3(B), and 3(C)). CO2 emissions during production is the CO2 released in wheat grain cultivation and harvesting machinery using fossil fuels. However, it can be assumed that this CO2 will be neutral in the close future as this machinery will be power by electricity. The CO2 absorbed by wheat plant by photosynthesis is considered as neutral, as it is the CO2 emitted in biomass combustion. CO2 is captured by two ways: bio-char (Cases I, II and III) and after CLC combustion (Cases II and II) and considered as negative emissions. Total emitted and total captured (Table 1) are the sum of the CO2 emissions and captured and are represented in Figure 6(A) for the base case and the three cases studied in this work. Classic comparison with fossil fuels between different cases with CO2 capture systems and base case without capture systems could use the term CO2 avoided, calculated by subtracting the total CO2 emissions between Cases I, II, and II and the base case. However this calculation, as it has been said before, could lead to wrong conclusions when biomass is used as fuel. In this study, in Figure 6(B) is represented the CO2 emitted and captured but considering CO2 emissions in combustion as neutral and CO2 captured in biochar and CLC as negative. It can be seen in this Figure 6(B) that the biomass combustion emissions are only due to wheat grain cultivation. CO2 captured in bio-char is subtracted from CO2 emission during cultivation (Case I). CO2 captured after CLC combustion are subtracted from CO2 fluxes (Cases II and III) Finally, if CO2 with positive and negative signs are summed, CO2 Net Balances are calculated (Table 1) that are represented in Figure 6(C). In this figure it is possible to see that the biomass direct combustion for the production of 17.1 MJ of thermal energy has CO2 positive emissions of 0.165 kg, while these emissions have negative value if the wheat straw is pyrolyzed instead of directly burned and gas and liquid fraction burned to obtain thermal energy. If gas and bio-oil fractions are conventionally combusted the CO2 emissions are negative with a value of -1.283 kg. If gaseous fraction is burned in by CLC, the CO2 is captured and negative emissions grow until a value of -3.30 kg/17.1 MJ generated. If bio-oil is also burned by CLC the negative emissions CO2 grow until de value of -3.66 kg.

4. Conclusions

Biochar is a negative emissions technology and one of the most efficient technologies to remove large amounts of CO2 from the atmosphere. One of the ways to obtain biochar is by subjecting biomass residues to a high temperature process in the absence or low content of oxygen (pyrolysis). When pyrolysis gases are burned for energy generation CO2 may be emitted and could be considered as neutral. If these CO2 emissions are captured, the biochar production process would reinforce its potential to achieve negative CO2 emissions. In this work gas fraction and bio-oil produced by wheat straw pyrolysis are combusted by Chemical Looping combustion and CO2 emitted is underground stored and considered as negative emissions. LCA comparison is performed to confirm environmental benefits of this technology comparing with direct combustion of gas fraction and bio-oil. CLC combustion reduces 7 of the 16 EIIs studied mainly due to CO2 and NOx avoided emissions. Finally, CO2 balance is performed to compare energy production between direct biomass combustion and pyrolysis with conventional and CLC gas and bio-oil fraction combustions. Higher negative emissions are obtained when CLC is used as pyrolysis fractions combustion technology, while biomass direct combustion has positive emissions.

Supplementary Materials

The following supporting information can be downloaded at the website of this paper posted on Preprints.org, Table S1. Environmental Impact Indicators. Table S2- Numerical values of the EIIs for the processes of the Case I. Table S3- Numerical values of the EIIs for the processes of the Case II. Table S4- Numerical values of the EIIs for the processes of the Case III.

Author Contributions

Conceptualization, T.M., A.N. A.A., T.P., L.M.G, F.G.L., L.D.; methodology, A.A.; software, A.N. and M.M.; validation, A.N. and M.M.; formal analysis, T.M., A.A. and T.P..; investigation, L.M.G., F.G.L. and L.D.; writing—original draft preparation, T.M. and A.N.; writing—review and editing, T.M., A.N. A.A., T.P., L.M.G, F.G.L., L.D. All authors have read and agreed to the published version of the manuscript.

Funding

This research received no external funding

Acknowledgments

A.N. gratefully acknowledges Iberus Campus mobility scholarships.

Conflicts of Interest

The authors declare no conflicts of interest.

References

  1. ONU United Nations Framework Convention for Climate Change. The Paris Agreement. Available online: http://unfccc.int/paris_agreement/items/9485.php.
  2. Shukla, P.; Skea, J.; Reisinger, A.; Slade, R.; Fradera, R.; Pathak, M.; Al Khourdajie, A.; Belkacemi, M.; van Diemen, R.; Hasija, A.; et al. IPCC, 2022: Summary for Policymakers. In Climate Change 2022: Mitigation of Climate Change.; Cambridge University Press, C., UK and New York, NY, U. (Ed. )., Ed.; 2022.
  3. Shafawi, A.N.; Mohamed, A.R.; Lahijani, P.; Mohammadi, M. Recent Advances in Developing Engineered Biochar for CO<inf>2</Inf> Capture: An Insight into the Biochar Modification Approaches. J. Environ. Chem. Eng. 2021, 9. [CrossRef]
  4. Tripathi, M.; Sahu, J.N.; Ganesan, P. Effect of Process Parameters on Production of Biochar from Biomass Waste through Pyrolysis: A Review. Renew. Sustain. Energy Rev. 2016, 55, 467–481. [CrossRef]
  5. Li, Y.; Xing, B.; Ding, Y.; Han, X.; Wang, S. A Critical Review of the Production and Advanced Utilization of Biochar via Selective Pyrolysis of Lignocellulosic Biomass. Bioresour. Technol. 2020, 312. [CrossRef]
  6. Oasmaa, A.; Czernik, S. Fuel Oil Quality of Biomass Pyrolysis Oils - State of the Art for the End Users. Energy and Fuels 1999, 13, 914–921. [CrossRef]
  7. Mattisson, T.; Keller, M.; Linderholm, C.; Moldenhauer, P.; Rydén, M.; Leion, H.; Lyngfelt, A. Chemical-Looping Technologies Using Circulating Fluidized Bed Systems: Status of Development. Fuel Process. Technol. 2018, 172, 1–12. [CrossRef]
  8. Lyngfelt, A. Chemical Looping Combustion: Status and Development Challenges. Energy and Fuels 2020, 34, 9077–9093. [CrossRef]
  9. Adánez, J.; Abad, A. Chemical-Looping Combustion: Status and Research Needs. Proc. Combust. Inst. 2019, 37, 4303–4317. [CrossRef]
  10. Lyngfelt, A.; Leckner, B. A 1000 MW<inf>th</Inf> Boiler for Chemical-Looping Combustion of Solid Fuels – Discussion of Design and Costs. Appl. Energy 2015, 157, 475–487. [CrossRef]
  11. Navajas, A.; Uriarte, L.; Gandía, L. Application of Eco-Design and Life Cycle Assessment Standards for Environmental Impact Reduction of an Industrial Product. Sustainability 2017, 9, 1724. [CrossRef]
  12. Navajas, A.; Echarri, I.; Gandía, L.M.; Pozuelo, J.; Cascarosa, E. Life Cycle Assessment in Higher Education: Design and Implementation of a Teaching Sequence Activity. Sustainability 2024, 16. [CrossRef]
  13. EC-JRC Recommendations Based on Existing Environmental Impact Assessment Models and Factors for Life Cycle Assessment in European Context. ILCD Handbook. Available online: http://publications.jrc.ec.europa.eu/repository/bitstream/JRC61049/jrc61049_ilcd handbook final.pdf.
  14. Hofbauer, H. Niedertemperatur Drehrohrpyrolyse Als Vorschaltprozess Für Die Co-Verbrennung von Unkonventionellen Brennstoffen in Thermischen Anlagen, Technischen Universität Wien, 2010.
  15. He, F.; Yi, W.; Bai, X. Investigation on Caloric Requirement of Biomass Pyrolysis Using TG-DSC Analyzer. Energy Convers. Manag. 2006, 47, 2461–2469. [CrossRef]
  16. Habib, M.A.; Mokheimer, E.M.A.; Sanusi, S.Y.; Nemitallah, M.A. Numerical Investigations of Combustion and Emissions of Syngas as Compared to Methane in a 200 MW Package Boiler. Energy Convers. Manag. 2014, 83, 296–305. [CrossRef]
  17. Basu, P. Pyrolysis. Biomass Gasification, Pyrolysis and Torrefaction 2013, 147–176. [CrossRef]
  18. Forero, C.R.; Gayán, P.; de Diego, L.F.; Abad, A.; García-Labiano, F.; Adánez, J. Syngas Combustion in a 500 Wth Chemical-Looping Combustion System Using an Impregnated Cu-Based Oxygen Carrier. Fuel Process. Technol. 2009, 90, 1471–1479. [CrossRef]
  19. Cabello, A.; Abad, A.; Mendiara, T.; Izquierdo, M.T.; de Diego, L.F. Outstanding Performance of a Cu-Based Oxygen Carrier Impregnated on Alumina in Chemical Looping Combustion. Chem. Eng. J. 2023, 455. [CrossRef]
  20. Navajas, A.; Mendiara, T.; Goñi, V.; Jiménez, A.; Gandía, L.M.; Abad, A.; García-Labiano, F.; de Diego, L.F. Life Cycle Assessment of Natural Gas Fuelled Power Plants Based on Chemical Looping Combustion Technology. Energy Convers. Manag. 2019, 198. [CrossRef]
  21. Saskatchewan province web Harvesting Surplus Cereal Straw Available online: https://www.saskatchewan.ca/business/agriculture-natural-resources-and-industry/agribusiness-farmers-and-ranchers/crops-and-irrigation/field-crops/cereals-barley-wheat-oats-triticale/harvesting-surplus-cereal-straw (accessed on 9 November 2023).
  22. Sphera Process Data Set: Electricity from Photovoltaic; AC, Technology Mix of CIS, CdTe, Mono Crystalline and Multi Crystalline; Production Mix, at Plant; 1kV - 60kV Available online: https://sphera.com/2023/xml-data/processes/5c5c2277-8df1-4a73-a479-9c14deec9bb1.xml (accessed on 10 November 2023).
  23. International Energy Agency Greenhouse Gas R&D Programme 2007 Capturing CO2; 2007;
  24. Saidur, R.; Abdelaziz, E.A.; Demirbas, A.; Hossain, M.S.; Mekhilef, S. A Review on Biomass as a Fuel for Boilers. Renew. Sustain. Energy Rev. 2011, 15, 2262–2289. [CrossRef]
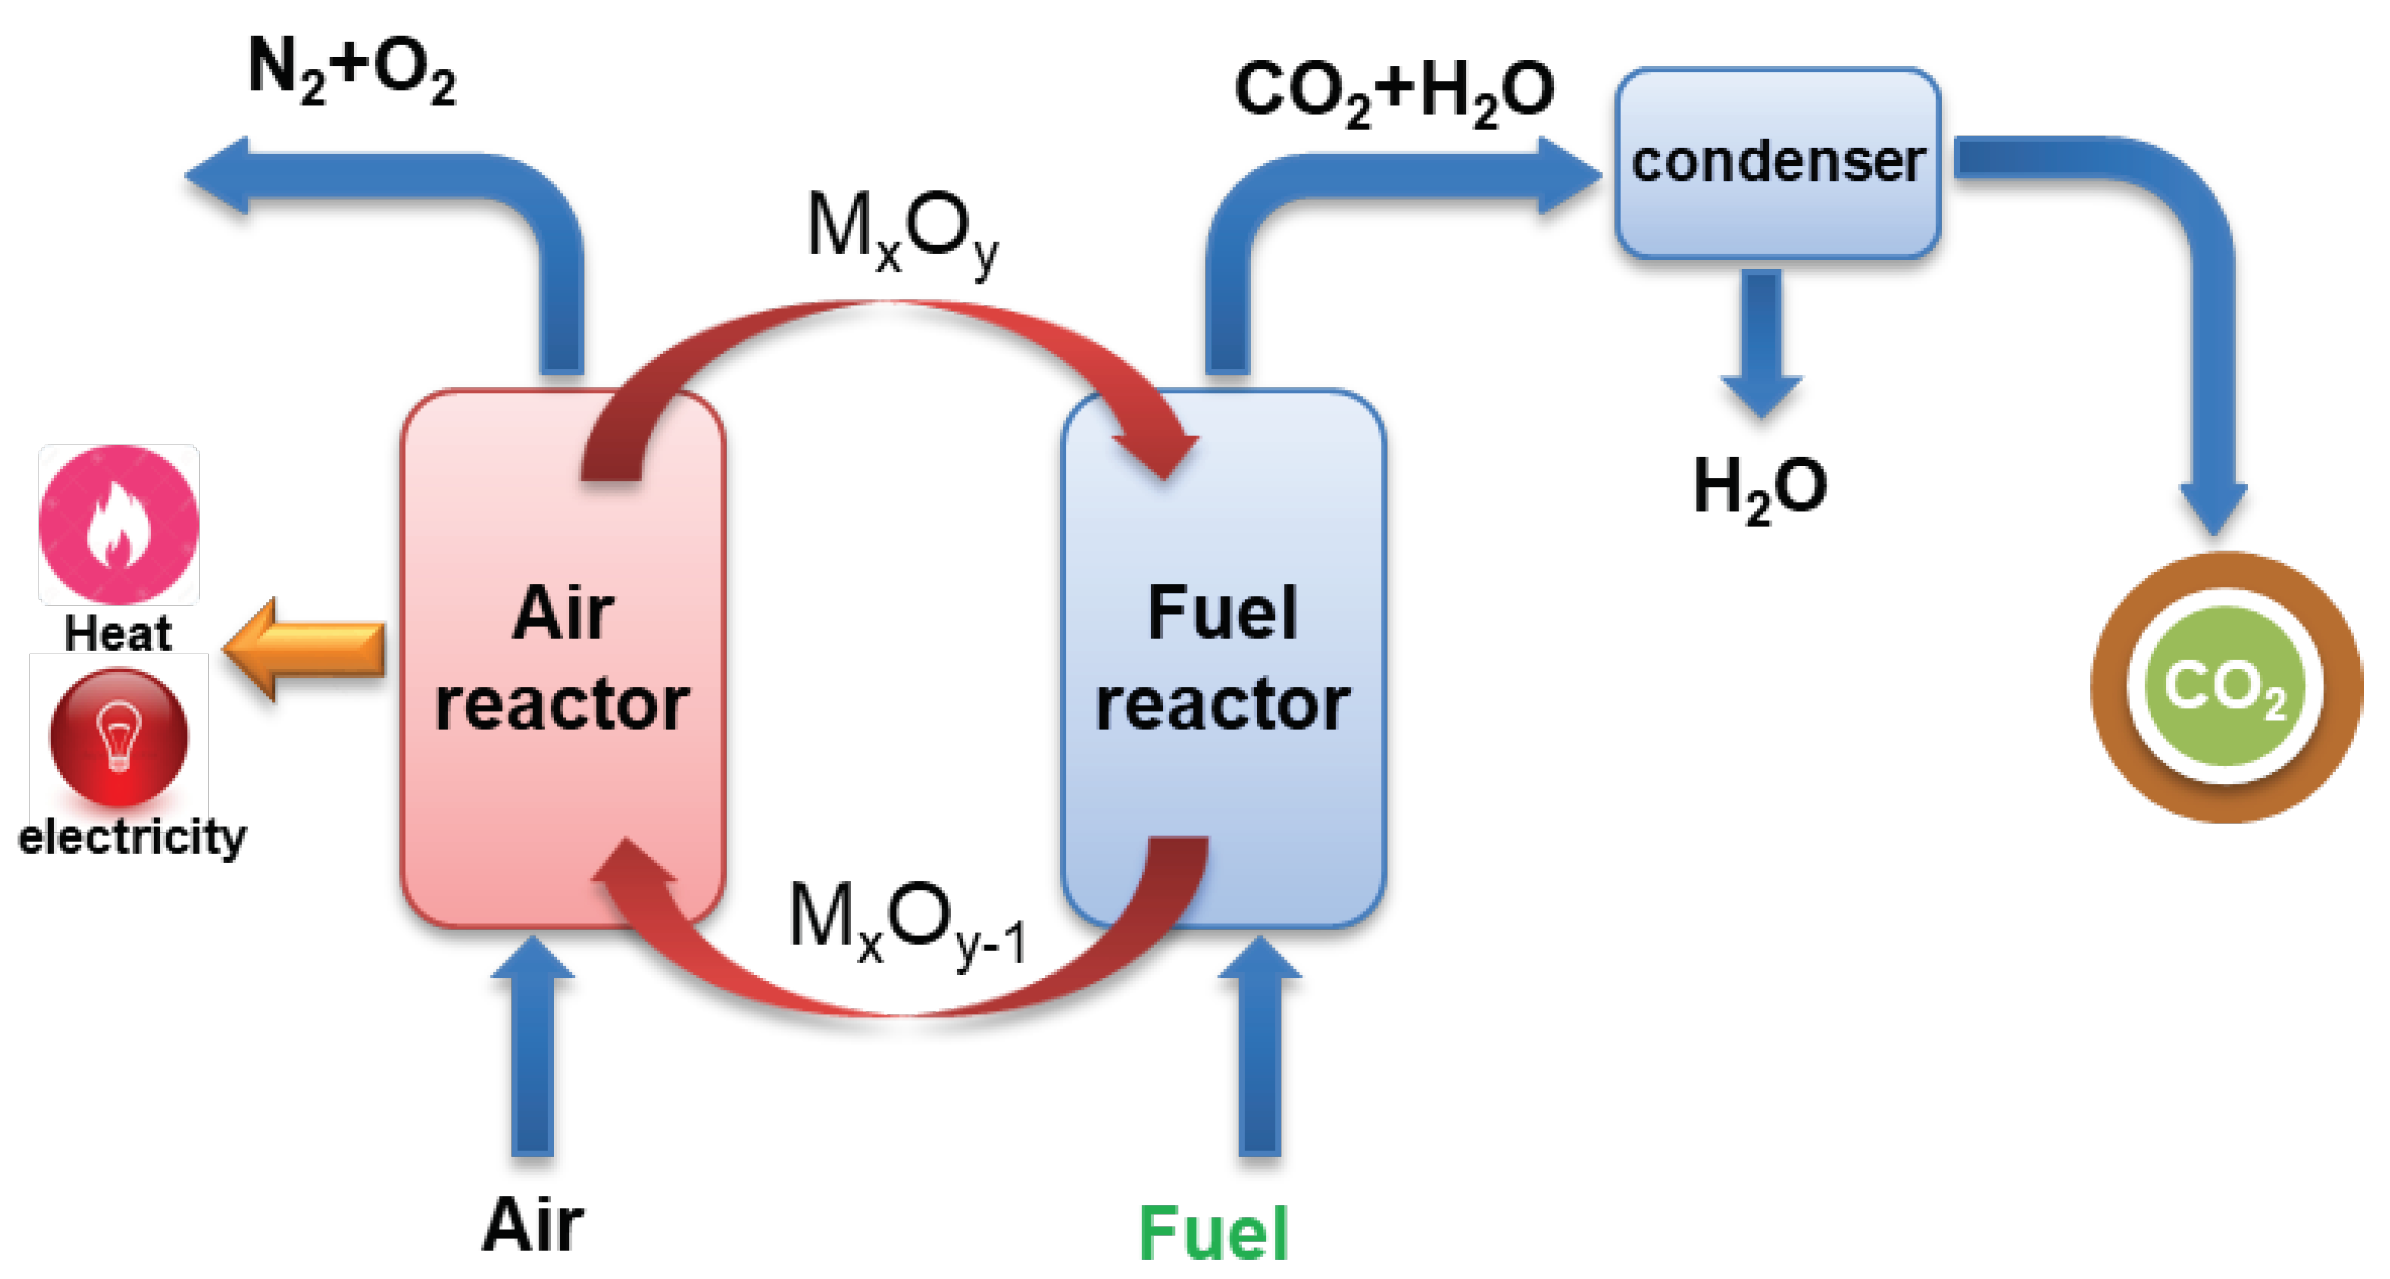
Figure 1. Scheme for the Chemical Looping Combustion process.
Preprints 100979 g001
Figure 2. Limits and processes studied in the LCA.
Preprints 100979 g002
Figure 3. Life Cycle boundaries and inventories for 1 kg wheat straw pyrolysis with: (A) syn-gas and bio-oil conventional combustion; (B) syn-gas CLC combustion and bio-oil conventional combustion; (C) syn-gas and bio-oil (volatiles) CLC combustion.
Preprints 100979 g003
Figure 4. Environmental impact indicators vales multiplied by different factors for the three cases studied: Case I (blue), Case II (orange), Case III (grey).
Preprints 100979 g004
Figure 5. Contribution of the different processes to the EIIs total values for Case I (A), Case II (B), Case III (C): CH4 thermal energy equivalence (blue), bio-oil conventional combustion (Cases I and II, gold), CO2 transport and injection (Cases II and II, purple), CO2 biochar sequestration (orange), wheat straw production (green), and syngas conventional combustion (Case I, grey), syngas CLC combustion (Case II, grey), syngas and bio-oil CLC combustion (Case III, grey).
Preprints 100979 g005
Figure 6. CO2 balances for the generation of 17.1 MJ of thermal energy by wheat straw combustion and pyrolysis with gas fraction and bio-oil conventional combustion (Case I), gas fraction CLC combustion and bio-oil conventional combustion (Case II), and volatiles fraction CLC combustion (Case III).
Preprints 100979 g006
Table 1. CO2 emissions, captured and avoided for the generation of 17.1 MJ of thermal energy by wheat straw combustion (Biomass combustion) and pyrolysis with gas fraction and bio-oil conventional combustion (Case I), gas fraction CLC combustion and bio-oil conventional combustion (Case II), and volatiles fraction CLC combustion (Case III).
Biomass combustion Case I Case II Case III
Biomass amount (kg) 1.00 1.95 2.05 2.06
CO2 emissions (kg)
Production 0.165 0.322 0.338 0.340
Combustion 1.938 2.178 0.332 0.000
CO2 captured (kg)
Bio-char 0.00 1.605 1.685 1.696
CLC 0.000 0.000 1.956 2.302
Total emitted (kg) 2.103 2.501 0.670 0.340
Total captured (kg) 0.000 1.605 3.641 3.998
Balance (kg CO2) 2.103 0.896 -2.971 -3.657
Net balance (kg CO2) 0.165 -1.283 -3.303 -3.657
Disclaimer/Publisher’s Note: The statements, opinions and data contained in all publications are solely those of the individual author(s) and contributor(s) and not of MDPI and/or the editor(s). MDPI and/or the editor(s) disclaim responsibility for any injury to people or property resulting from any ideas, methods, instructions or products referred to in the content.
Copyright: This open access article is published under a Creative Commons CC BY 4.0 license, which permit the free download, distribution, and reuse, provided that the author and preprint are cited in any reuse.
Prerpints.org logo

Preprints.org is a free preprint server supported by MDPI in Basel, Switzerland.

Subscribe

© 2024 MDPI (Basel, Switzerland) unless otherwise stated