1. Introduction
In Danish streams, the European eel and brown trout (Salmo trutta) populations constituted about 10% and 75%, respectively, of the total fish populations (Larsen 1955).
Since then, extensive studies were carried out on the biology of brown trout in fresh and salt water, and the brown trout is today very important in recreational fishing in fresh and salt water.
In the mid-1950s, fishing for eels in fresh and salt water was of great economic importance in the recreational and commercial fishery. In fresh water, yellow eels were caught in large numbers in streams and lakes in fykes and bottom nets, and a large number of fixed eel catching facilities throughout the rivers fished out-migrating silver eels. In salt water, silver eels were fished in coastal areas, many of them produced in Danish freshwater, and high number of silver eel migrated from the Baltic areas and passed through the Danish straits and the commercial fishery.
In contrast to brown trout, there are surprisingly few population studies about the Danish streams as production areas for eels, e.g. Larsen 1972, Rasmussen 1977, Rasmussen 1983, Rasmussen & Therkildsen 1979, Bisgaard & Pedersen 1991 and Rasmussen & Pedersen 2023.
The European eel population declined very much since the early 1960s, and the current recruitment of glass eel to North Europe is today a few percentage of the 1960–1979 reference level (ICES 2023). The causes of this decline are probably multiple and complex. These may include a combination of oceanic factors (Castonguay et al. 1994, Friedland et al. 2007. And continental factors such as reduction of grow-up habitats in rivers, fishing in fresh and saltwater, obstructions to up- and downstream migration for eel at all life stages, mortality in water turbines, pollution, diseases, parasites (e.g. Anguillicola crassus) and bird predation (ICES 2005, Pedersen & Rasmussen 2013, Pedersen & Rasmussen 2018, Pedersen et al. 2024). The reduction in glass eel recruitment may have directly affected the density of local eel populations, and thus indirectly (through intraspecific and maybe interspecific competition) the growth dynamics and sex ratios of eels, but very little is known about this.
To aid recovery and conservation of the eel stock, the European Council adopted a framework regulation (EU 2007), requiring each EU Member State to issue, a country national eel management plan (EMP). The goal of this EMP is to ensure spawning escapement of at least 40% of the silver eel production, relative to the best estimate of escapement before start of anthropogenic influence. In Danish freshwater (rivers 15,000 ha and lakes 45,000 ha), the pristine annual silver eel production was estimated to 750 tons in rivers and 360 tons in lakes, totally 1,110 tons. Therefore, 40 % corresponds to 440 tons of silver eel escapement annually of pristine condition in freshwater (Pedersen & Rasmussen 2013). With the present implemented regulations in Denmark (reduced fishing effort, closed fishing periods, increased minimum size of yellow eel), the target of the 40% silver eel production without stocking and fishing in rivers, was estimated to be achieved in year 2080. To reach the goal earlier, eel stocking may be a useful method. To know how much to stock we need to establish the relationship between number of glass eel or on-grown eels and the number of produced silver eel (Rasmussen & Pedersen 2023, Pedersen et al. 2024).
Bisgaard & Pedersen (1991) compared mortality and growth of wild and on-grown stocked eels in a small river with reference to tagging techniques. Aged wild eel showed close agreement with annual length increment in tagged and recaptured wild-tagged eel.
Rasmussen & Pedersen (2023) used information from the 1970s about silver eel and yellow eel populations in two rivers in Danish streams, and calculated that at that time, before the decline of eel populations, the annual production of silver eel was about 50 kg ha-1. In one study, the calculations (growth and survival) were based on sampled and otolith aged silver eels. In the other study the calculations (yellow eel density, growth and survival) were based on electrofished caught yellow eel, that were otolith aged and used to estimate silver eel production. In both studies, the data enabled to estimate growth rates and von Bertalanffy length growth trajectories. In the last study, feeding habits and feeding rates were also analyzed. These data and results possibly represent the pristine status of eel population in Danish freshwater before the decline in glass eel recruitment.
Measurement of biological production in fish species is an important aspect of population dynamics (e.g. Ivlev 1966, Chapman 1967). Production is the total elaboration of fish tissue (g wet weight or energy) during any time interval Δt, and the production and rates integrate changes in number and body mass. Part of the standing biomass might be able to migrate away from the production site, in this case as silver eel. Purely logically and mathematically, the migrating biomass of silver eel will always be less the total biological production. Calculation of silver eel production in the present study was not possible, because most of the yellow eels were less that about 35 cm, i.e. less than silver ageing of eel, maybe except for a small unknown number of youngest male silver eel, that might have left the population (see 4.1).
The objective of the present paper is to 1) examining growth and annual length increment (cm) and Kcal of yellow eel; 2) from yellow eel density and eel body mass calculate annual mortality M of yellow eel, and 3) calculate the biological production (g wet weight) of yellow eel. Finally, 4) feeding habits of yellow eel was examined.
2. Material and Methods
2.1. Location
Vester Vedsted Baeck (location 55.07768, 8.67902) has a catchment area of 24 km2, main stem of 6 km estimated downstream areas of wetlands, mean annual water flow estimated to 293 L sec-1, and the baeck goes out into the Wadden Sea, North Sea. Water temperature was measured (20 observations) with a min-max thermometer in all three years, and temperature was calculated to water temperature 0C = 2.52(±2.89) + 12.12(±2.72) *exp(-0.09(±0.04)*(t-6.5(±0.2)), R2 = 0.78, where t is day. Mean water temperature from January to December was calculated to 9.94 0C with a max temperature in July to about 14.7 0C, with some observed values up to 18 0C. The baeck is heavily regulated, but there are no obstacles in the stem beside a sluice at the outlet to the sea. The baeck widths vary from 2.5 to 3.6 m, the bottom is dominated by sand, and four species of waterweeds can be seen in the baeck. Fascines supports the riverbank, which provide good hiding opportunities for eel. Besides eel, sticklebacks (Gasterosteus aculeatus and Pungitius pungitius) and plaice (Platichthyes flesus) are common.
2.2. Sampling, Ageing, Growth and Food Analysis
In 1979, 1980 and 1981 electrofishing (Rasmussen 1983) were performed every sixth week from March to November. Four stations each of 50 m were electrofished (Bohlin et al. 1989), and the total electrofished area was 546 m2. Glass eel from the North Sea into the baeck was fully recruited mid-June.
All eels caught were measured (0.5 cm), and five eel of each length group were weighed (0.01 g) at the laboratory, and 553 otoliths were aged (0+ to 10+ year) by burning the otoliths (Christensen 1964, Moriarty & Steinmetz 1979).
The mean length 7.19 (cm) and body mass 0.29 (g) of glass eel was calculated from a sample of 194 glass eel in another river (Pedersen et al. 2023).
Annual growth rate (Δ cm) from glass eel to yellow eel age stage of individual yellow eel, was calculated, assuming linear growth of yellow eel, as: Δ = (lengthyellow eell - 7.19 cm)/ageyellow eel (Lester et al. 2004, Rasmussen & Pedersen 2023). This was also done for body mass calculated to Kcal assuming that one glass eel has an energy content of 0.3496 Kcal.
Body mass (g wet weight) was calculated as w = 0.00077*length3.23, and body mass (Kcal) was calculated as wkcal = 0.00021* length3.76 (Rasmussen 1983). Annual instantaneous growth rate G was calculated as ln(w1/w0), where w1 is the body mass one year after w0. Mean body mass (MBM) was calculated as MBM = w*(exp(G)-1)/G.
Natural mortality M was calculated as M = ln(n1/n0), and mean number (MN) was calculated as MN = n1*(1 – exp(M))/-M, where n1 is the number of eel one year after n0.
Natural mortality M as function of body mass BM was calculated as M = a*BMb.
Biological production (g wet weight) was calculated as Production = MN*MBM*G.
Von Bertalanffy growth trajectory (cm) was calculated from ∆ (cm) vs. age.
In this paper data for density, length, body mass and age class from all stations and years were pooled to month October, i.e. mean of data from three years. It has smaller significance for the calculation of growth, mortality and biological production, because these responses were calculated from age class to age class. Seasonal variations in density and some other results can be found in Rasmussen 1983.
Stomach (N = 780) sampled from all three years were distributed to months, the first in March and the last in October. Stomach content was weighed (0.01 g) and determined to main taxa. Number of Occurrence (NoC) was calculated as number of eel with the specific food topic divided with the number of eel with food in the stomachs. Some of the prey taxa were length (0.1 cm) measured.
2.3. Data Treatment
The results were calculated and tested using Excel ver. 5.0 and Real Statistics
3. Results
3.1. Number, Growth and Biological Production
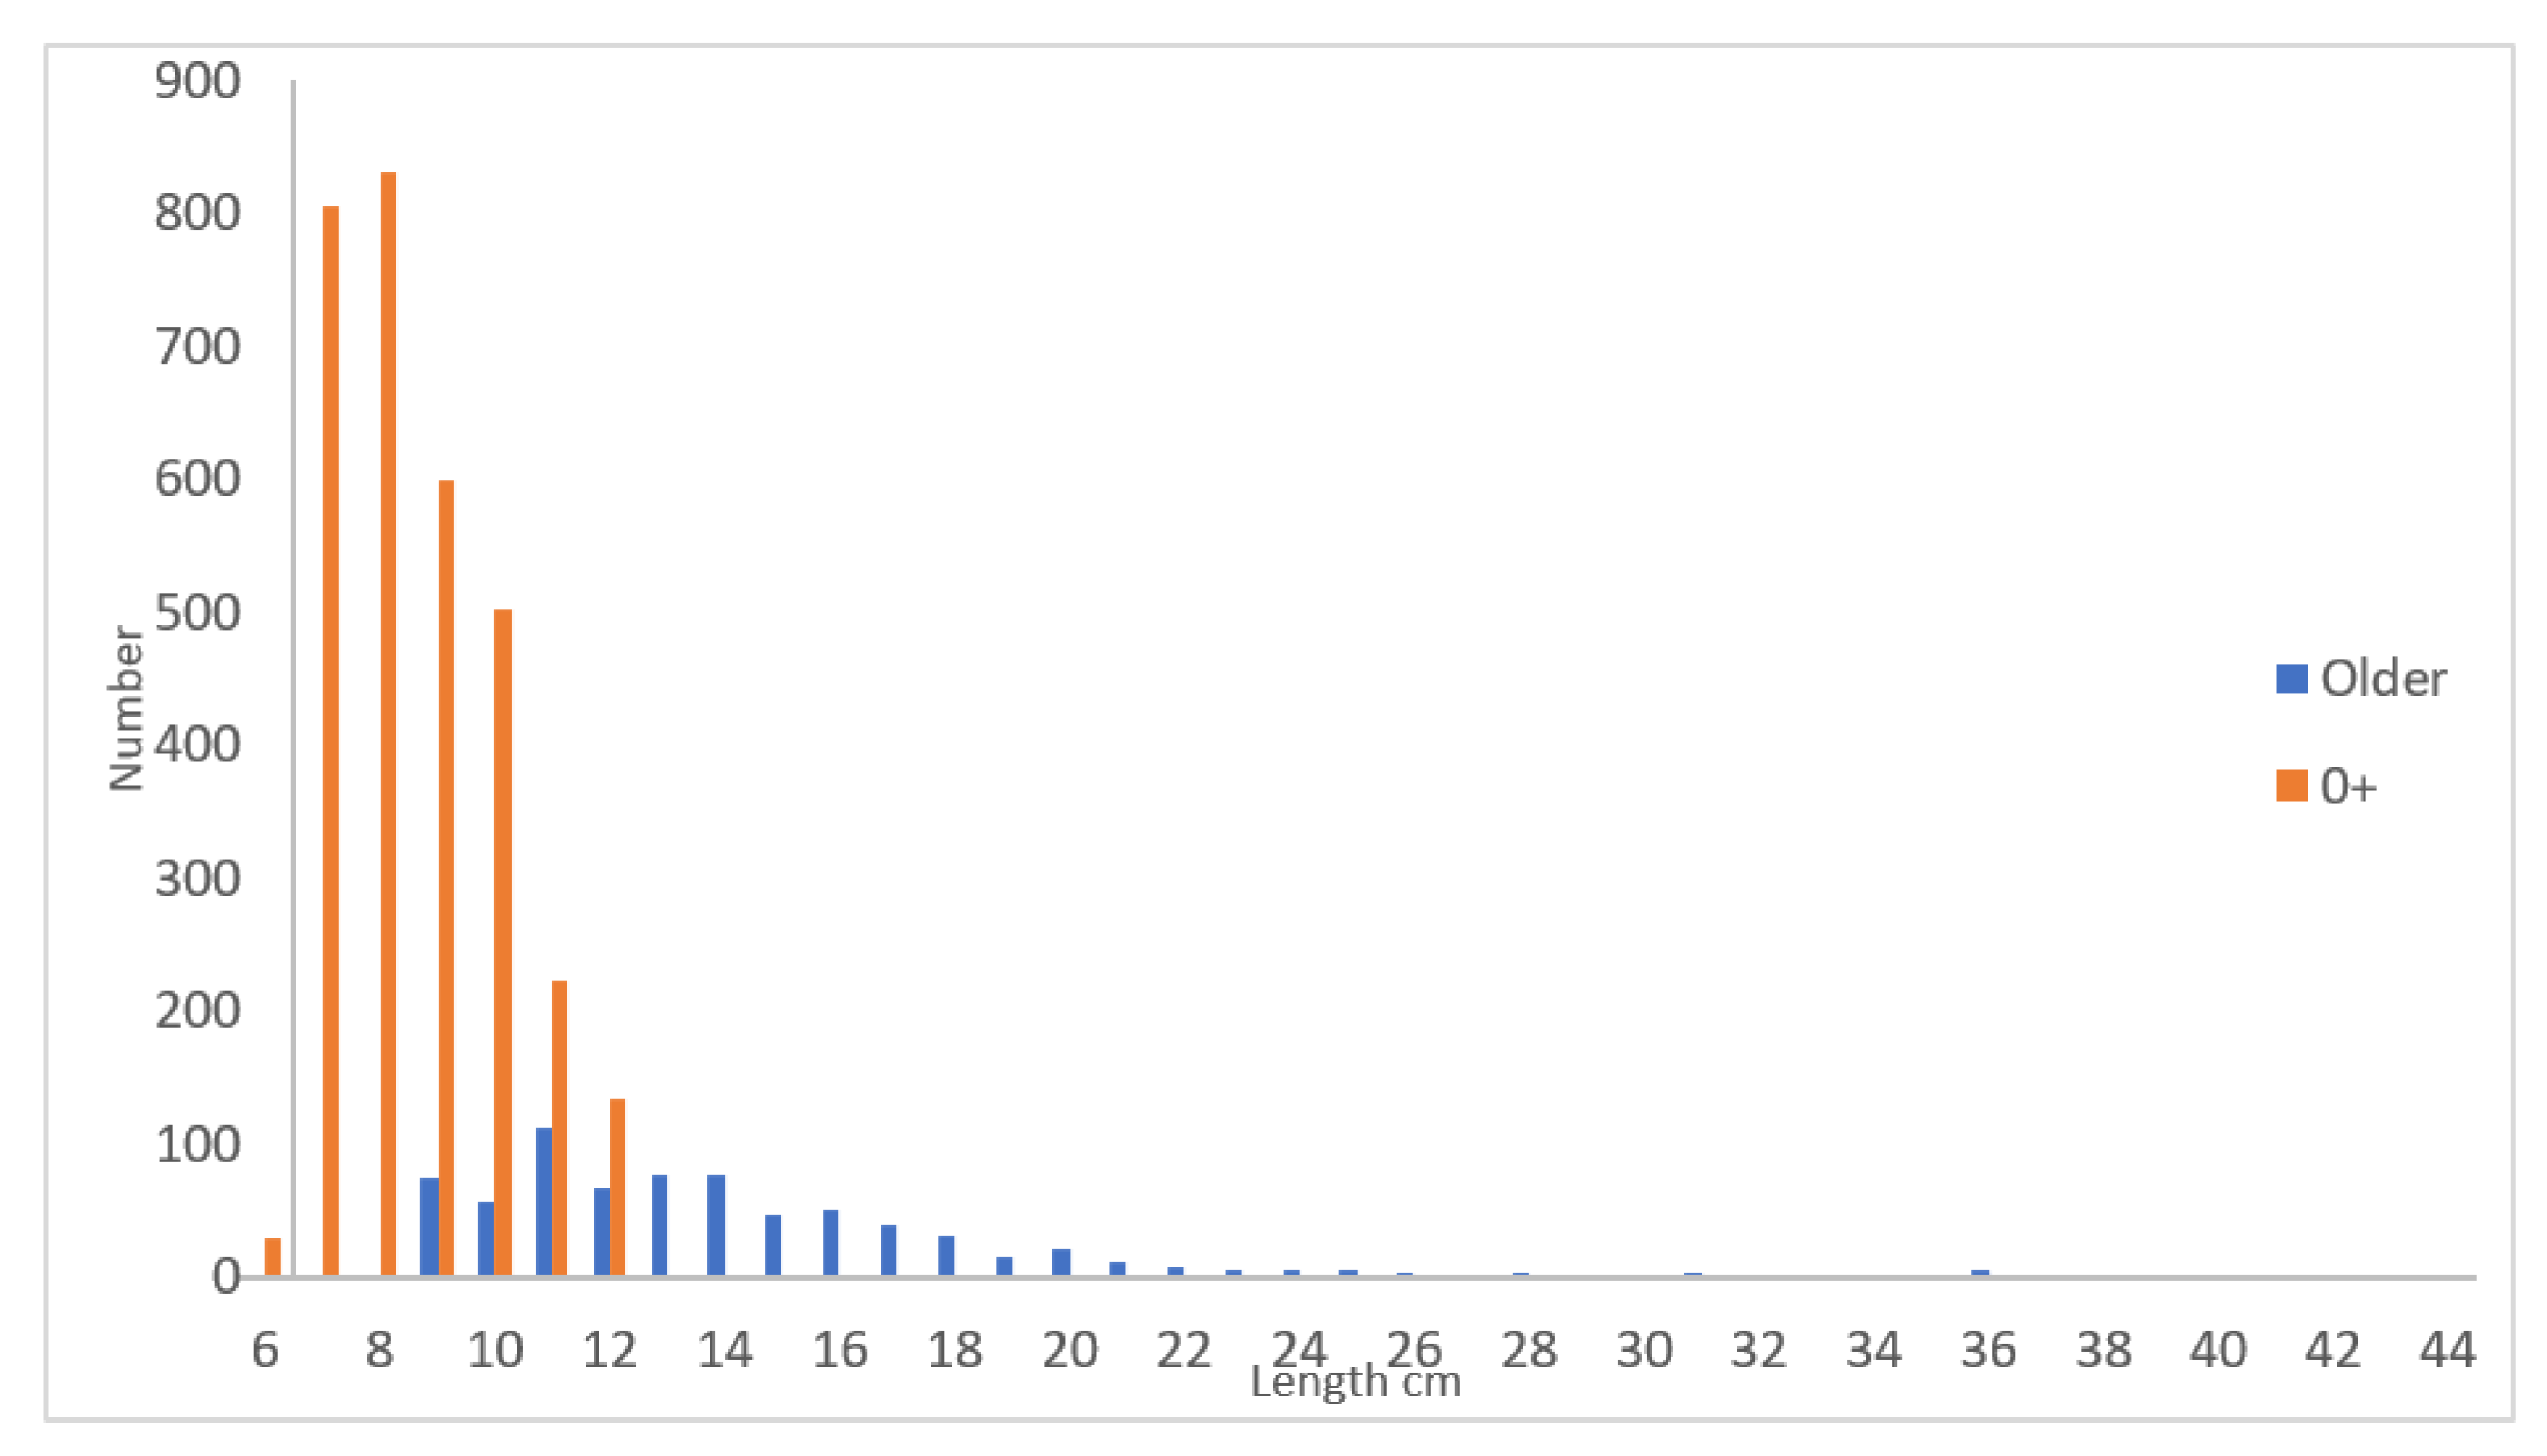
Figure 1 shows length distribution of yellow eel in October as a mean for all three years. The population was dominated by eel sizes up to about 20 cm, and rather few eel above.
The total population number of yellow eel in October (
Table 1), ages 0+ to 10+, and excluding the permanent annual input of glass eel that was reduced to 0+ four months later, amounts to about 550 yellow eel pr. 100 m
2, or about 5-6 yellow eel pr. 1 m
2.
The glass eel started after recruitment in June with a size of about 7.19 cm and grow the following four months up to a size of 9.13 cm as 0+ in October. Over the next 10 year from age 0+ to age 10+ they grow up to a mean size of about 35.2 cm (
Table 1), few single eels were found up to 48.5 cm.
The annual natural mortality M (
Table 1) started from 3.63 (glass eel to 0+ in four months recalculated to annual mortality) and final mortality 0.13 from age 9+ to 10+.
The total annual biological production (
Table 1) was calculated to about 1,347 g 100 m
-2 from glass eel to age 10+.
3.2. Length vs. Age
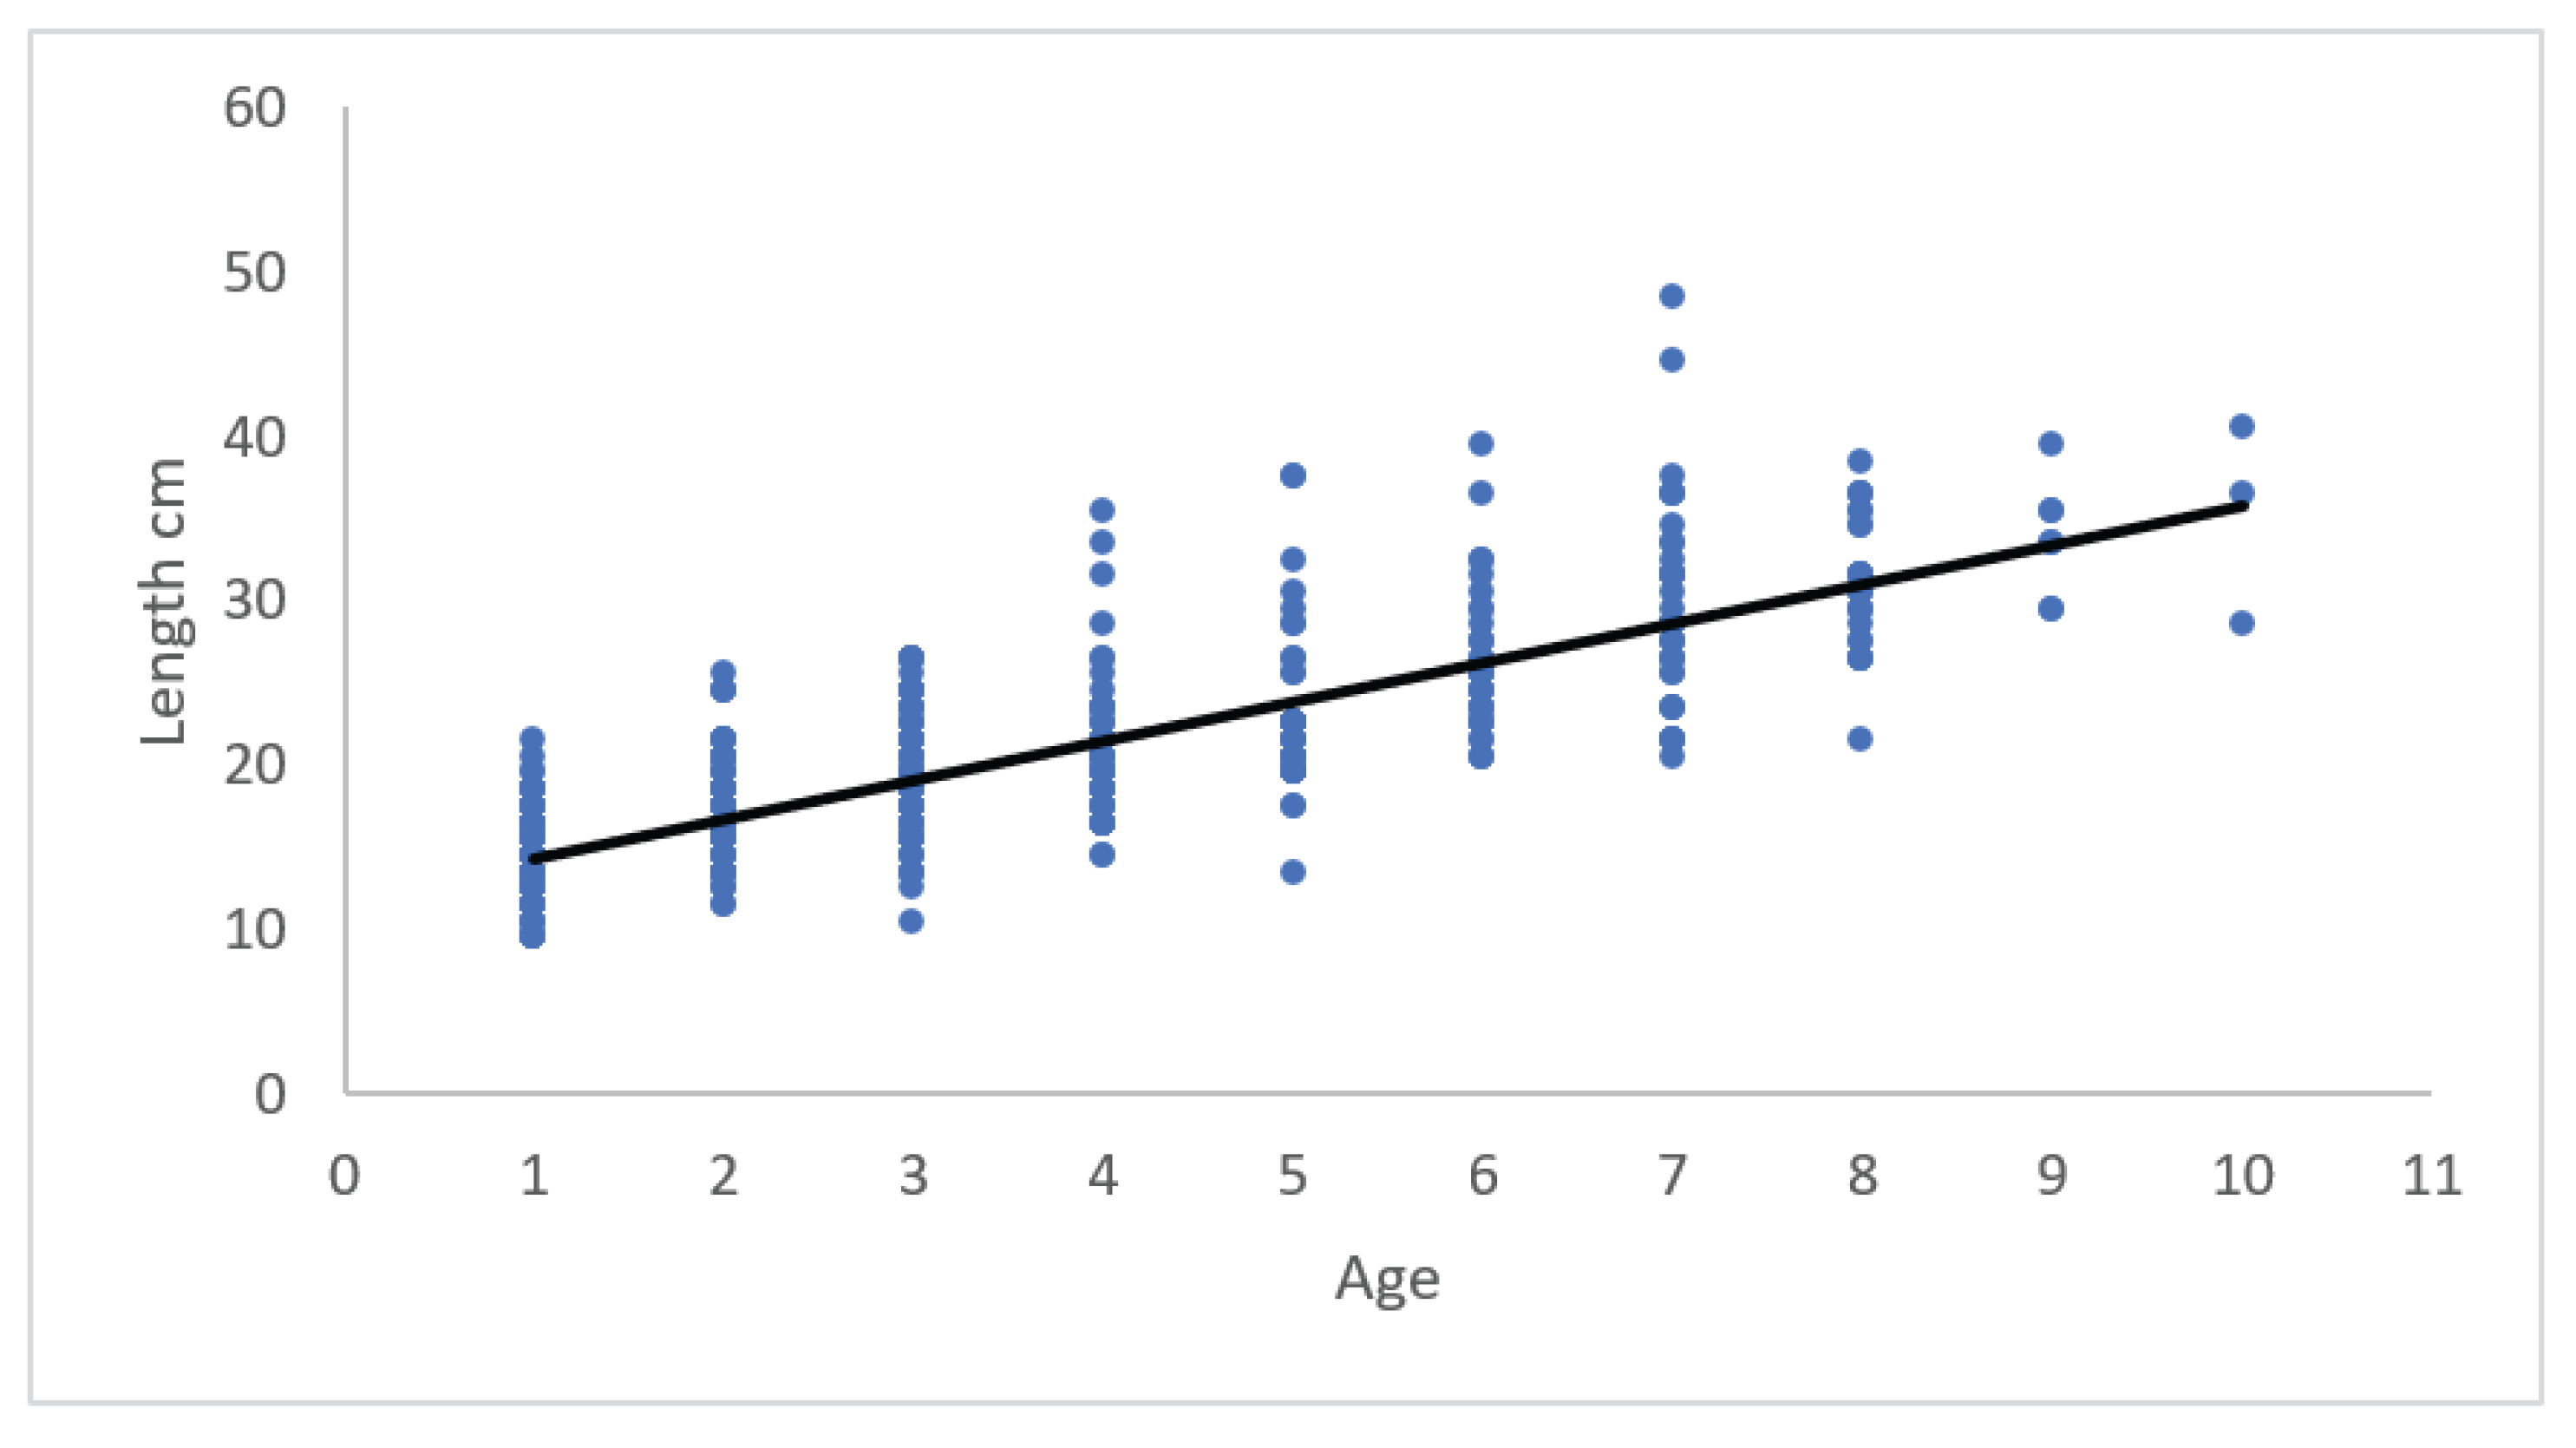
Figure 2 shows the relationship between length and age from 450 observations of length-at-age. The mean annual growth rate ∆ was about 2.4 cm.
The relationship between ∆ cm and age from 450 observations is shown in
Figure 3. The mean annual growth rate ∆ was about 3.1 cm.
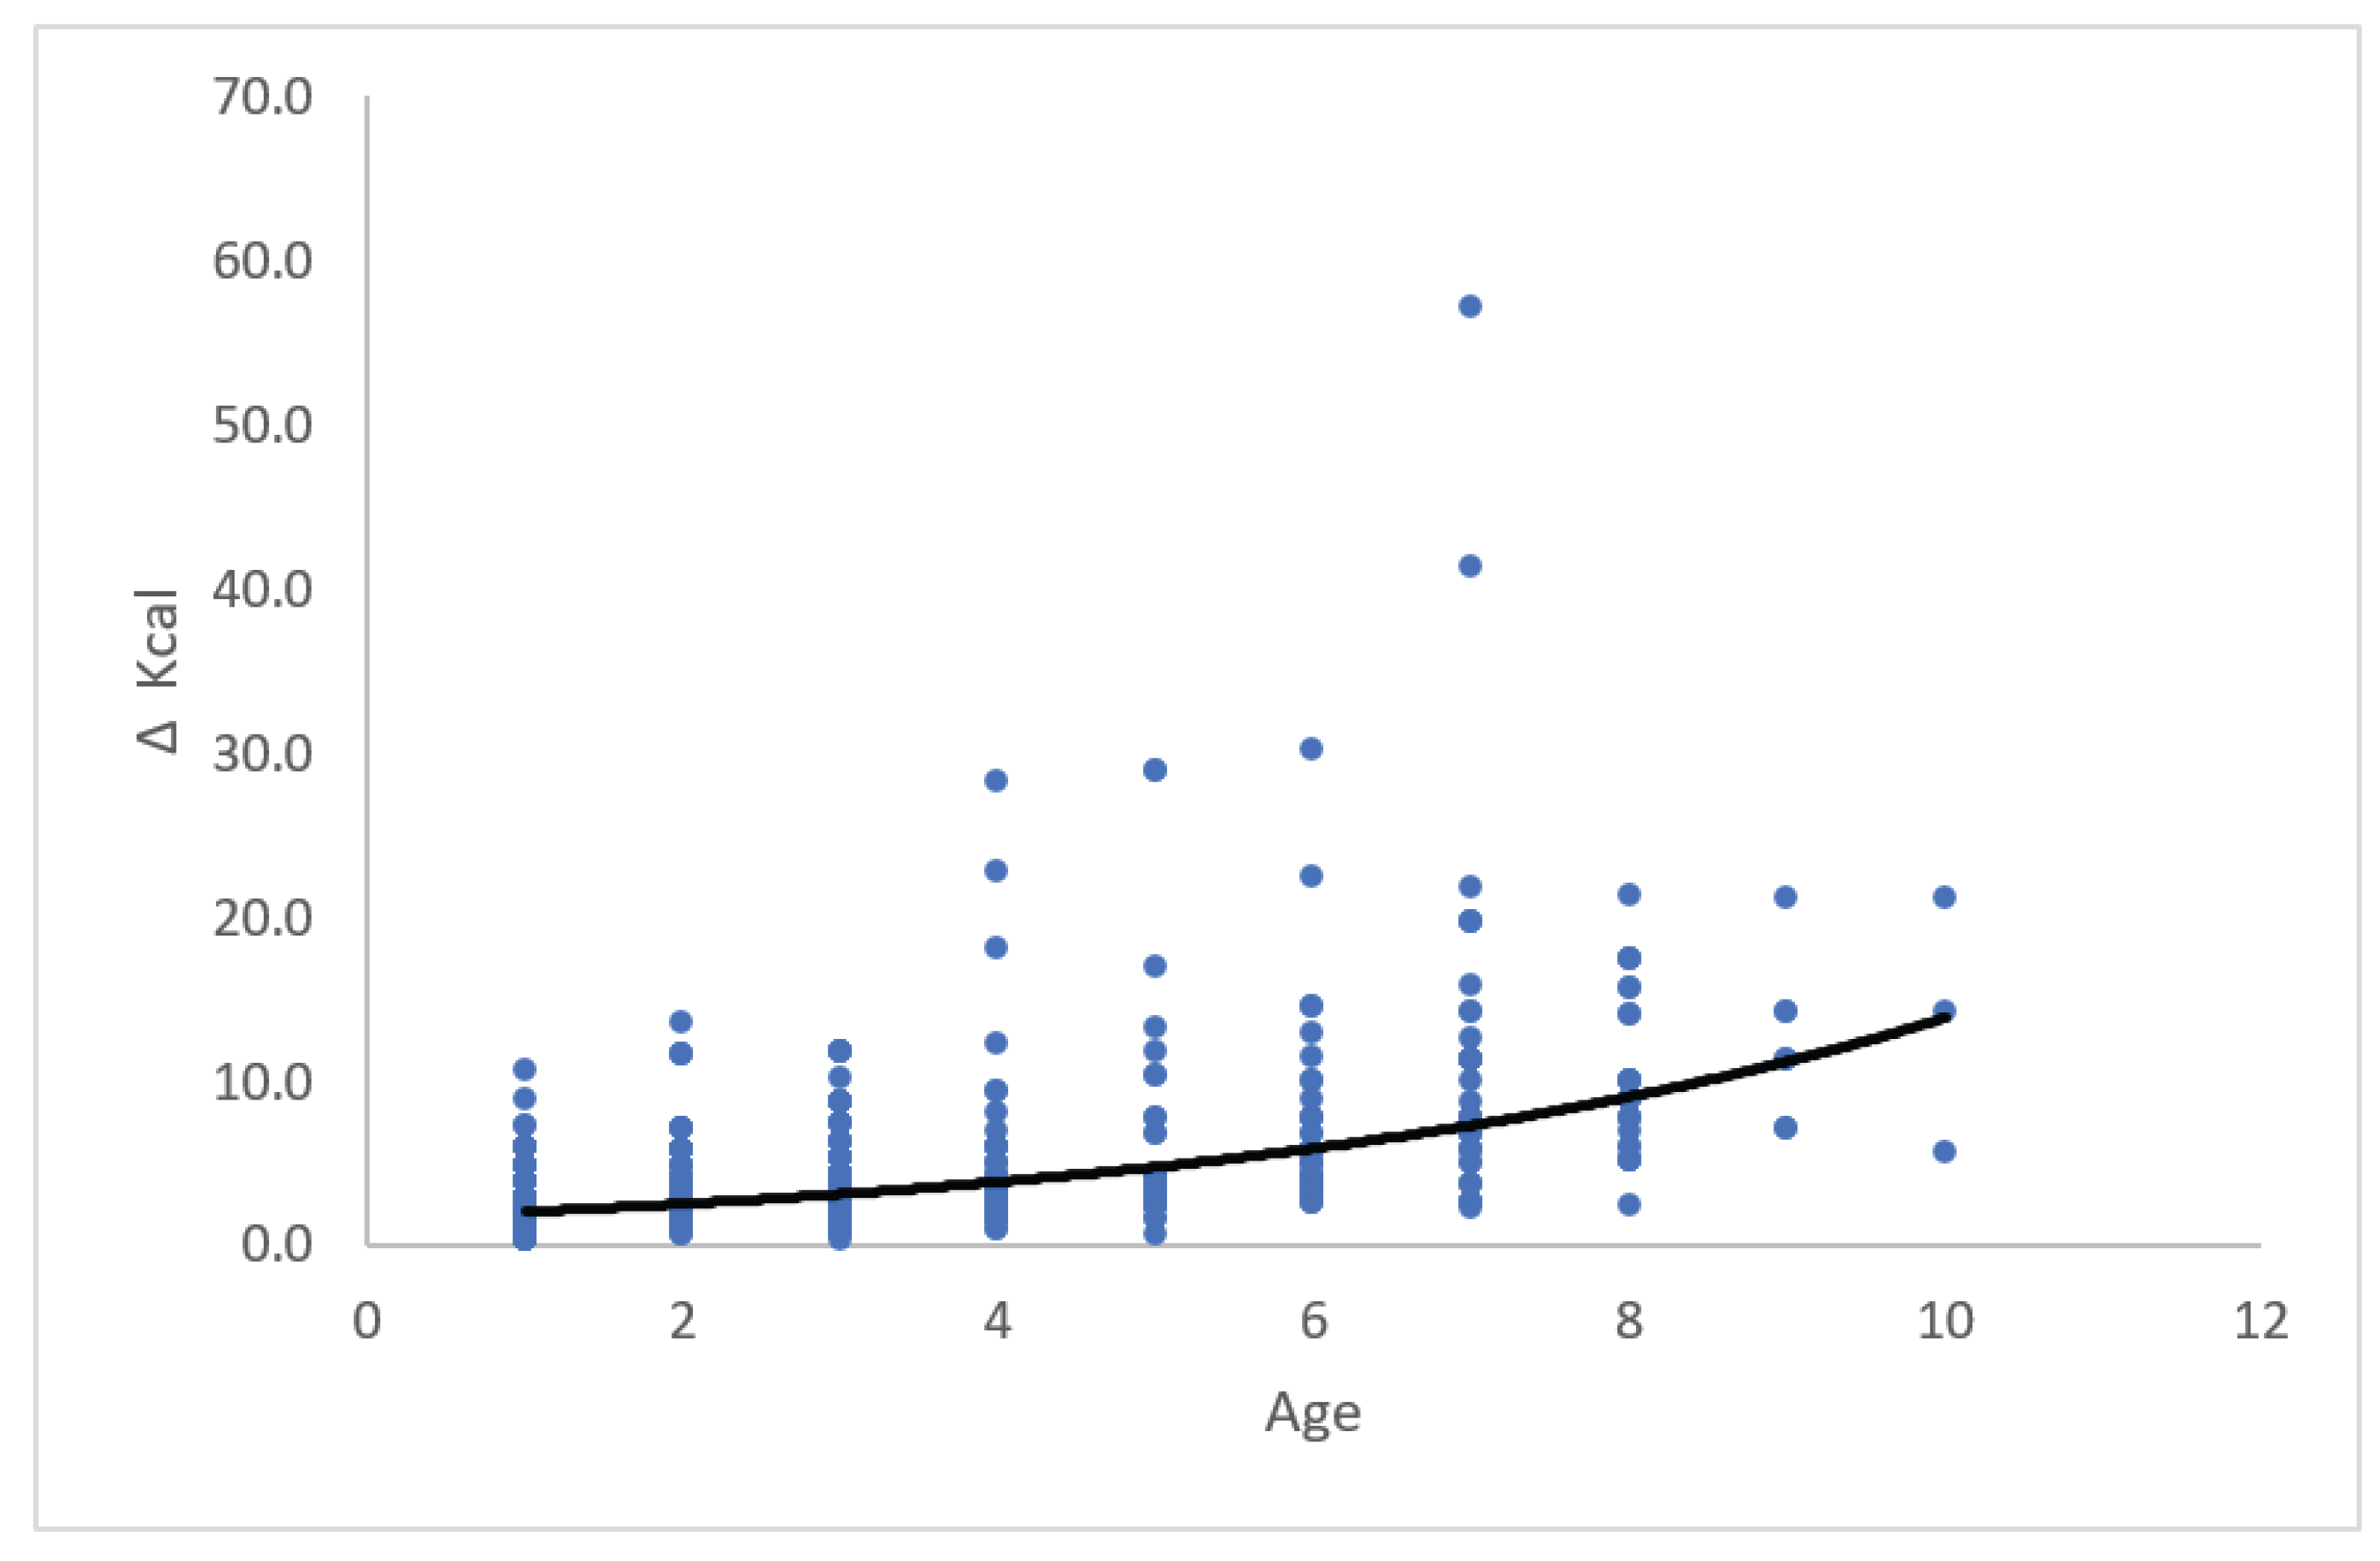
The relationship between ∆ Kcal and age from 450 observations is shown in
Figure 4. The mean annual growth ∆ was about 5.33 Kcal. Twenty observations were statistical outliers with values of ∆ from 17.4 to 57.2 and lengths from 31.5 to 48.5 cm.
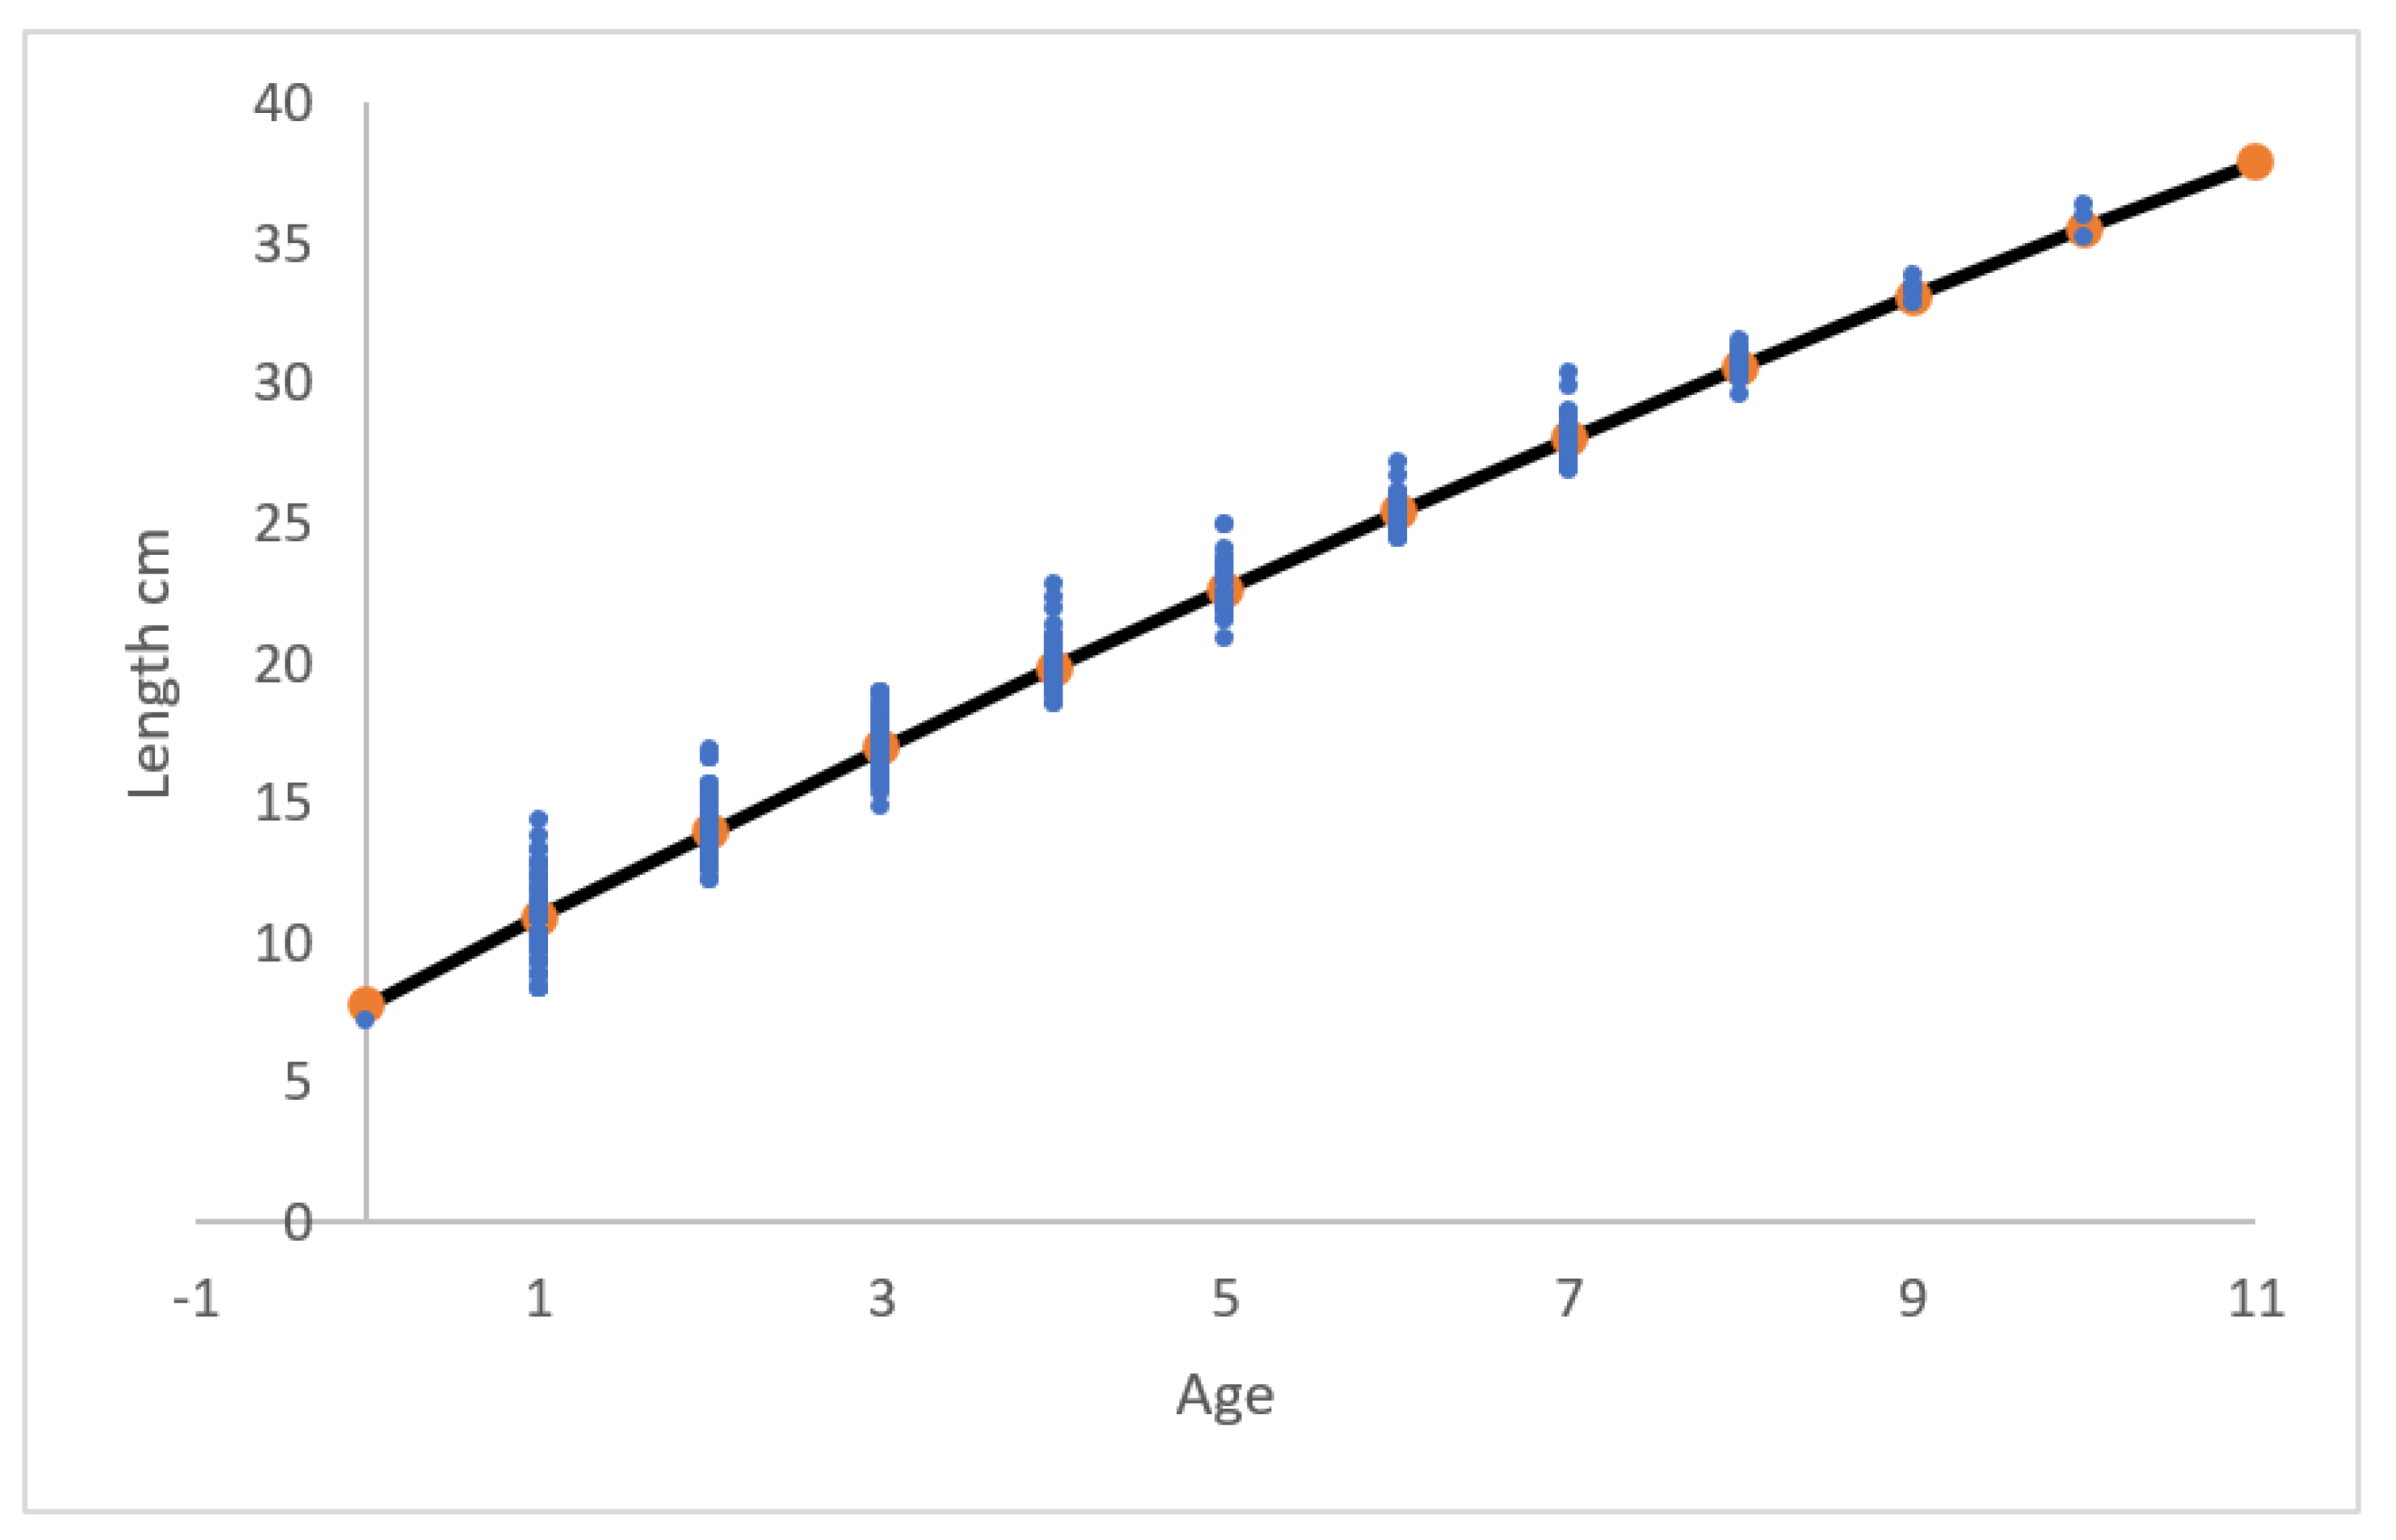
The Bertalanffy growth trajectory length (cm) of yellow eel is shown in
Figure 5 using the ∆ values in
Figure 3.
3.3. Natural Mortality M vs. Body Mass
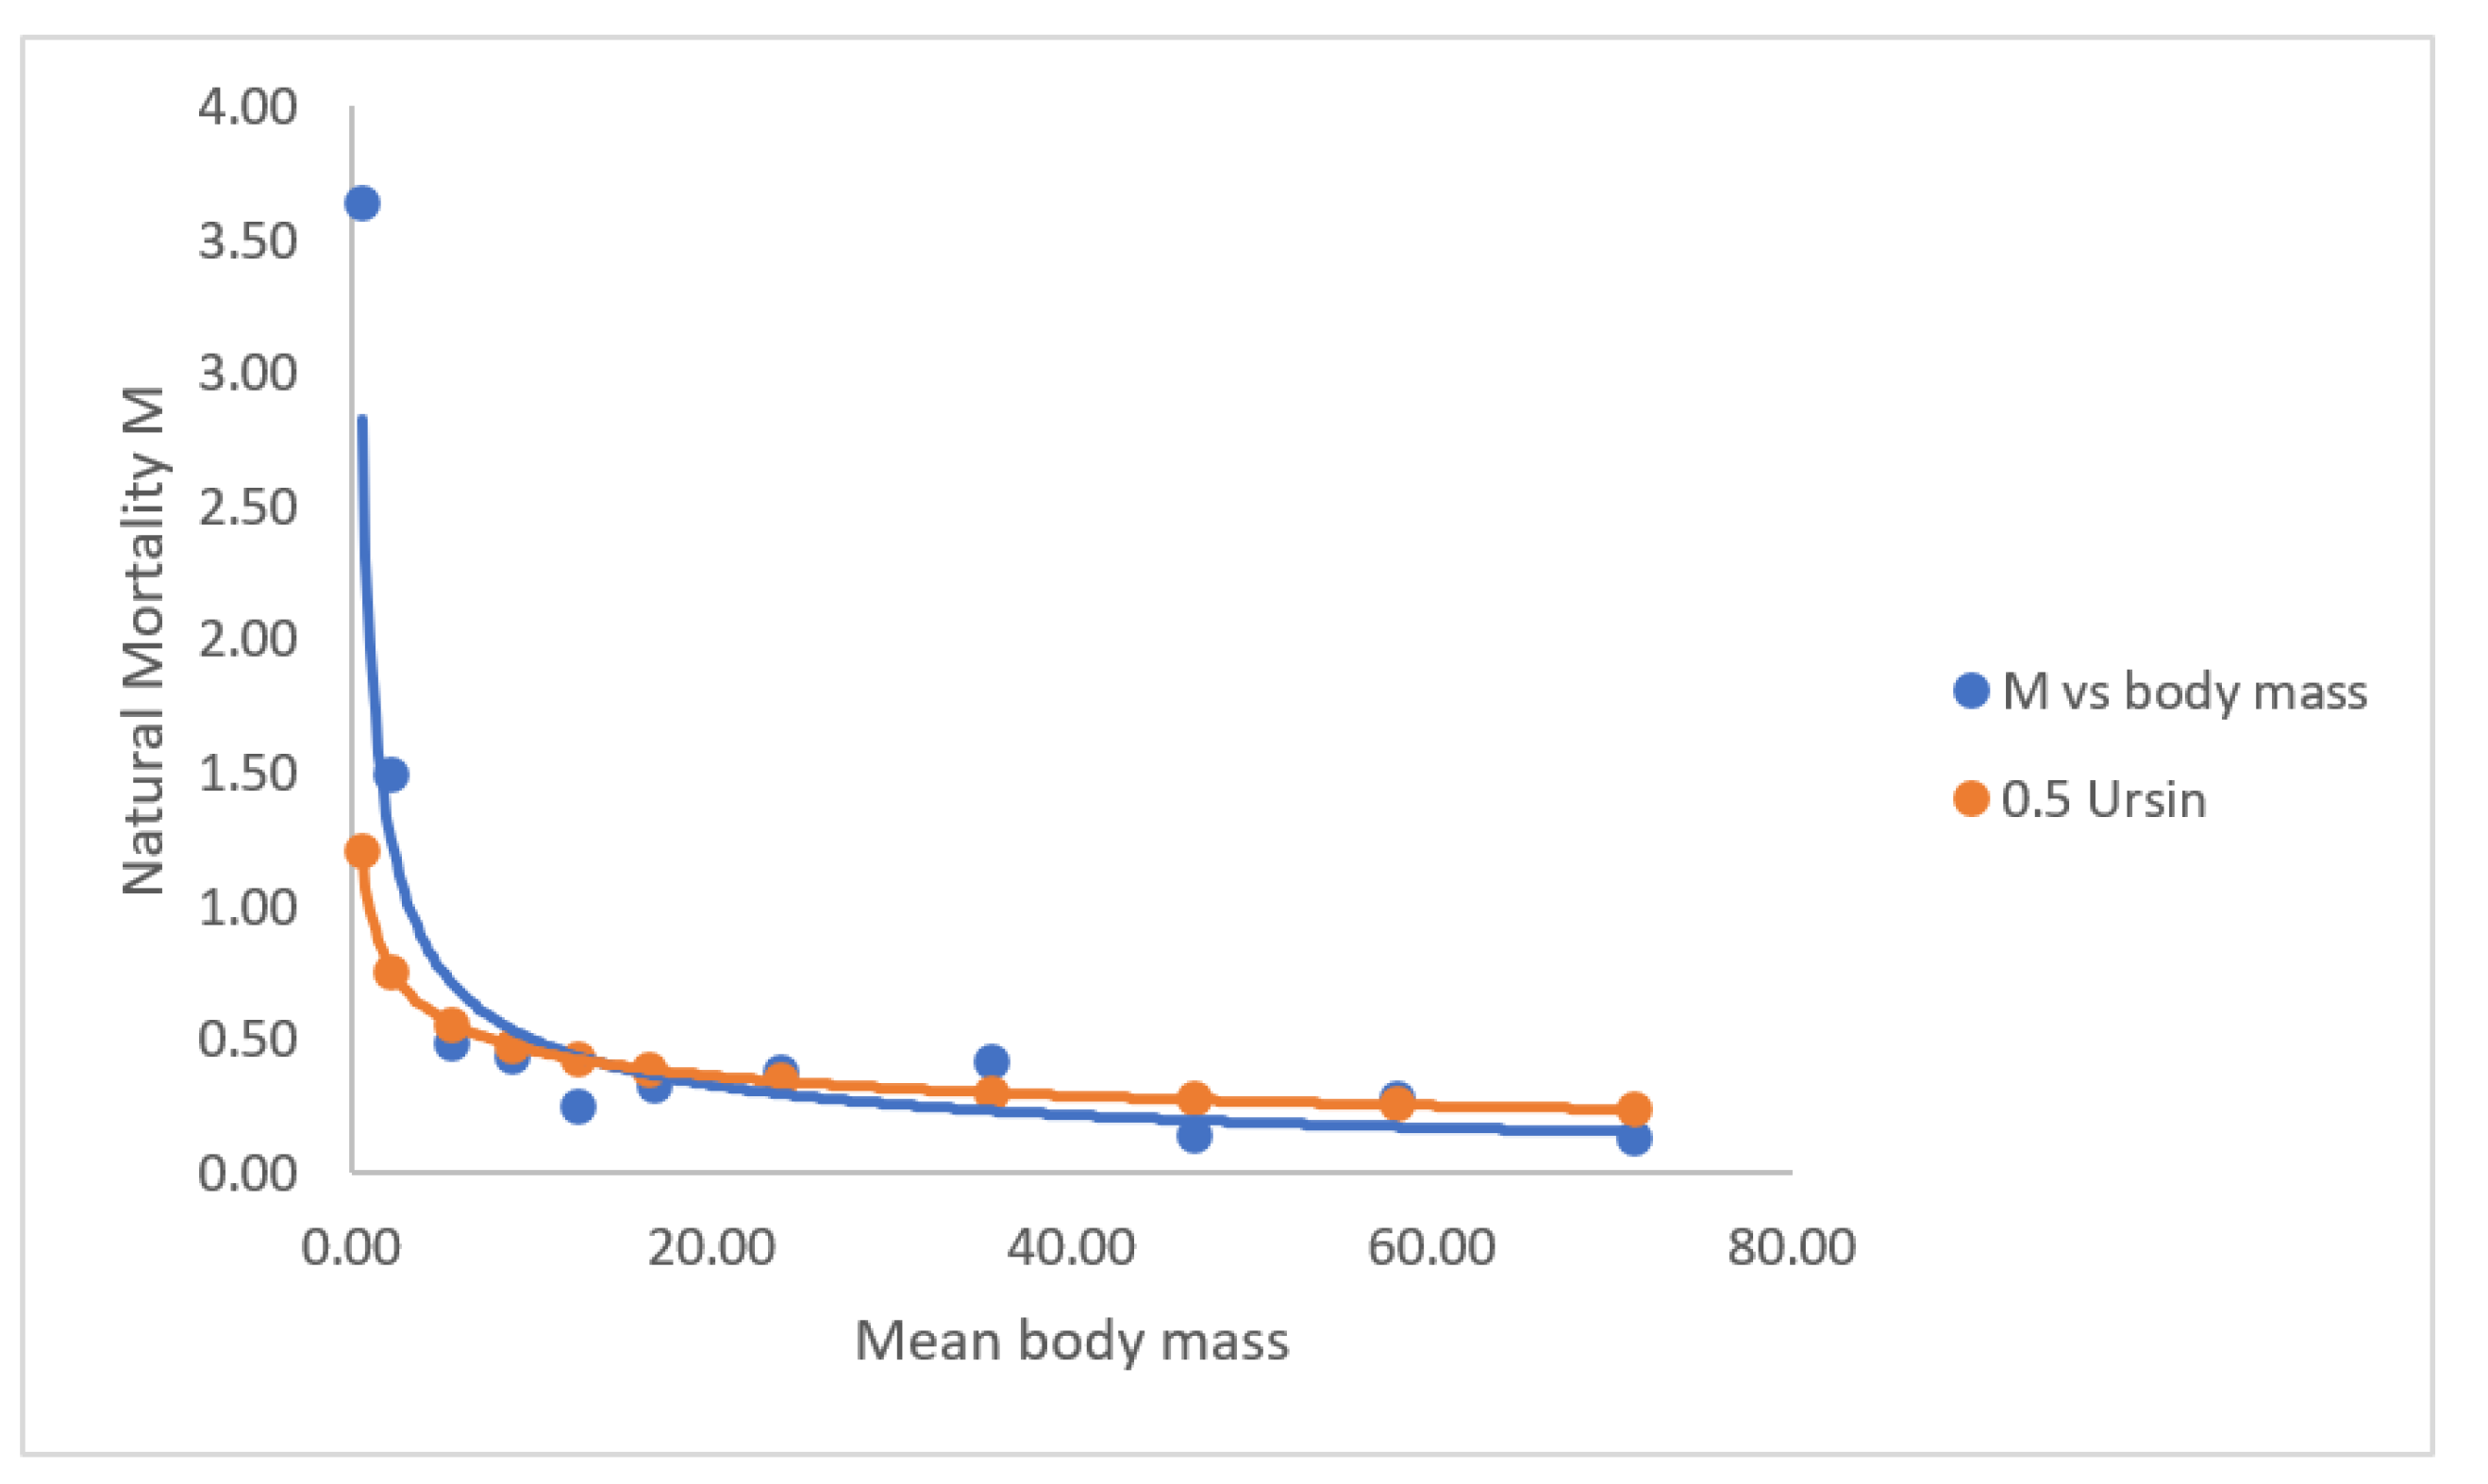
Figure 6 shows the natural mortality as a function of body mass. M vs body mass BM was calculated from 11 observations of M given in
Table 1. 0.5*Ursin was calculated from M = 0.5*BM
-1/3. M calculated from the observations of M and BM fits very well with 0.5*Ursin.
3.4. Feeding Results
An overview of the food items is shown in
Table 2. The stomach contents can be regarded as composed of five most important food groups. Isopoda (
Asellus aquaticus), Amphipoda (
Gammarus pulex), Ephemeroptera nymph, Trichoptera larvae, Chironomidae larvae and Simulidae larvae.
In addition to the five important taxa are Lumbricidae, Dytiscidae larvae and adults, Hemiptera (Corixa), Hirudinea and Gastropoda, and eggs (June and July) from Gasterosteus aculeatus, in one single eel 29 cm in August, two Gasterosteus aculeatus was observed, but all the last taxa are in smaller amounts.
Chironomidae larvae, Gammarus pulex and Ephemeroptera nymphs are the dominating taxa. Simulidae larvae was found from March to September, and especially in April they were important and in high number pr. Eel.
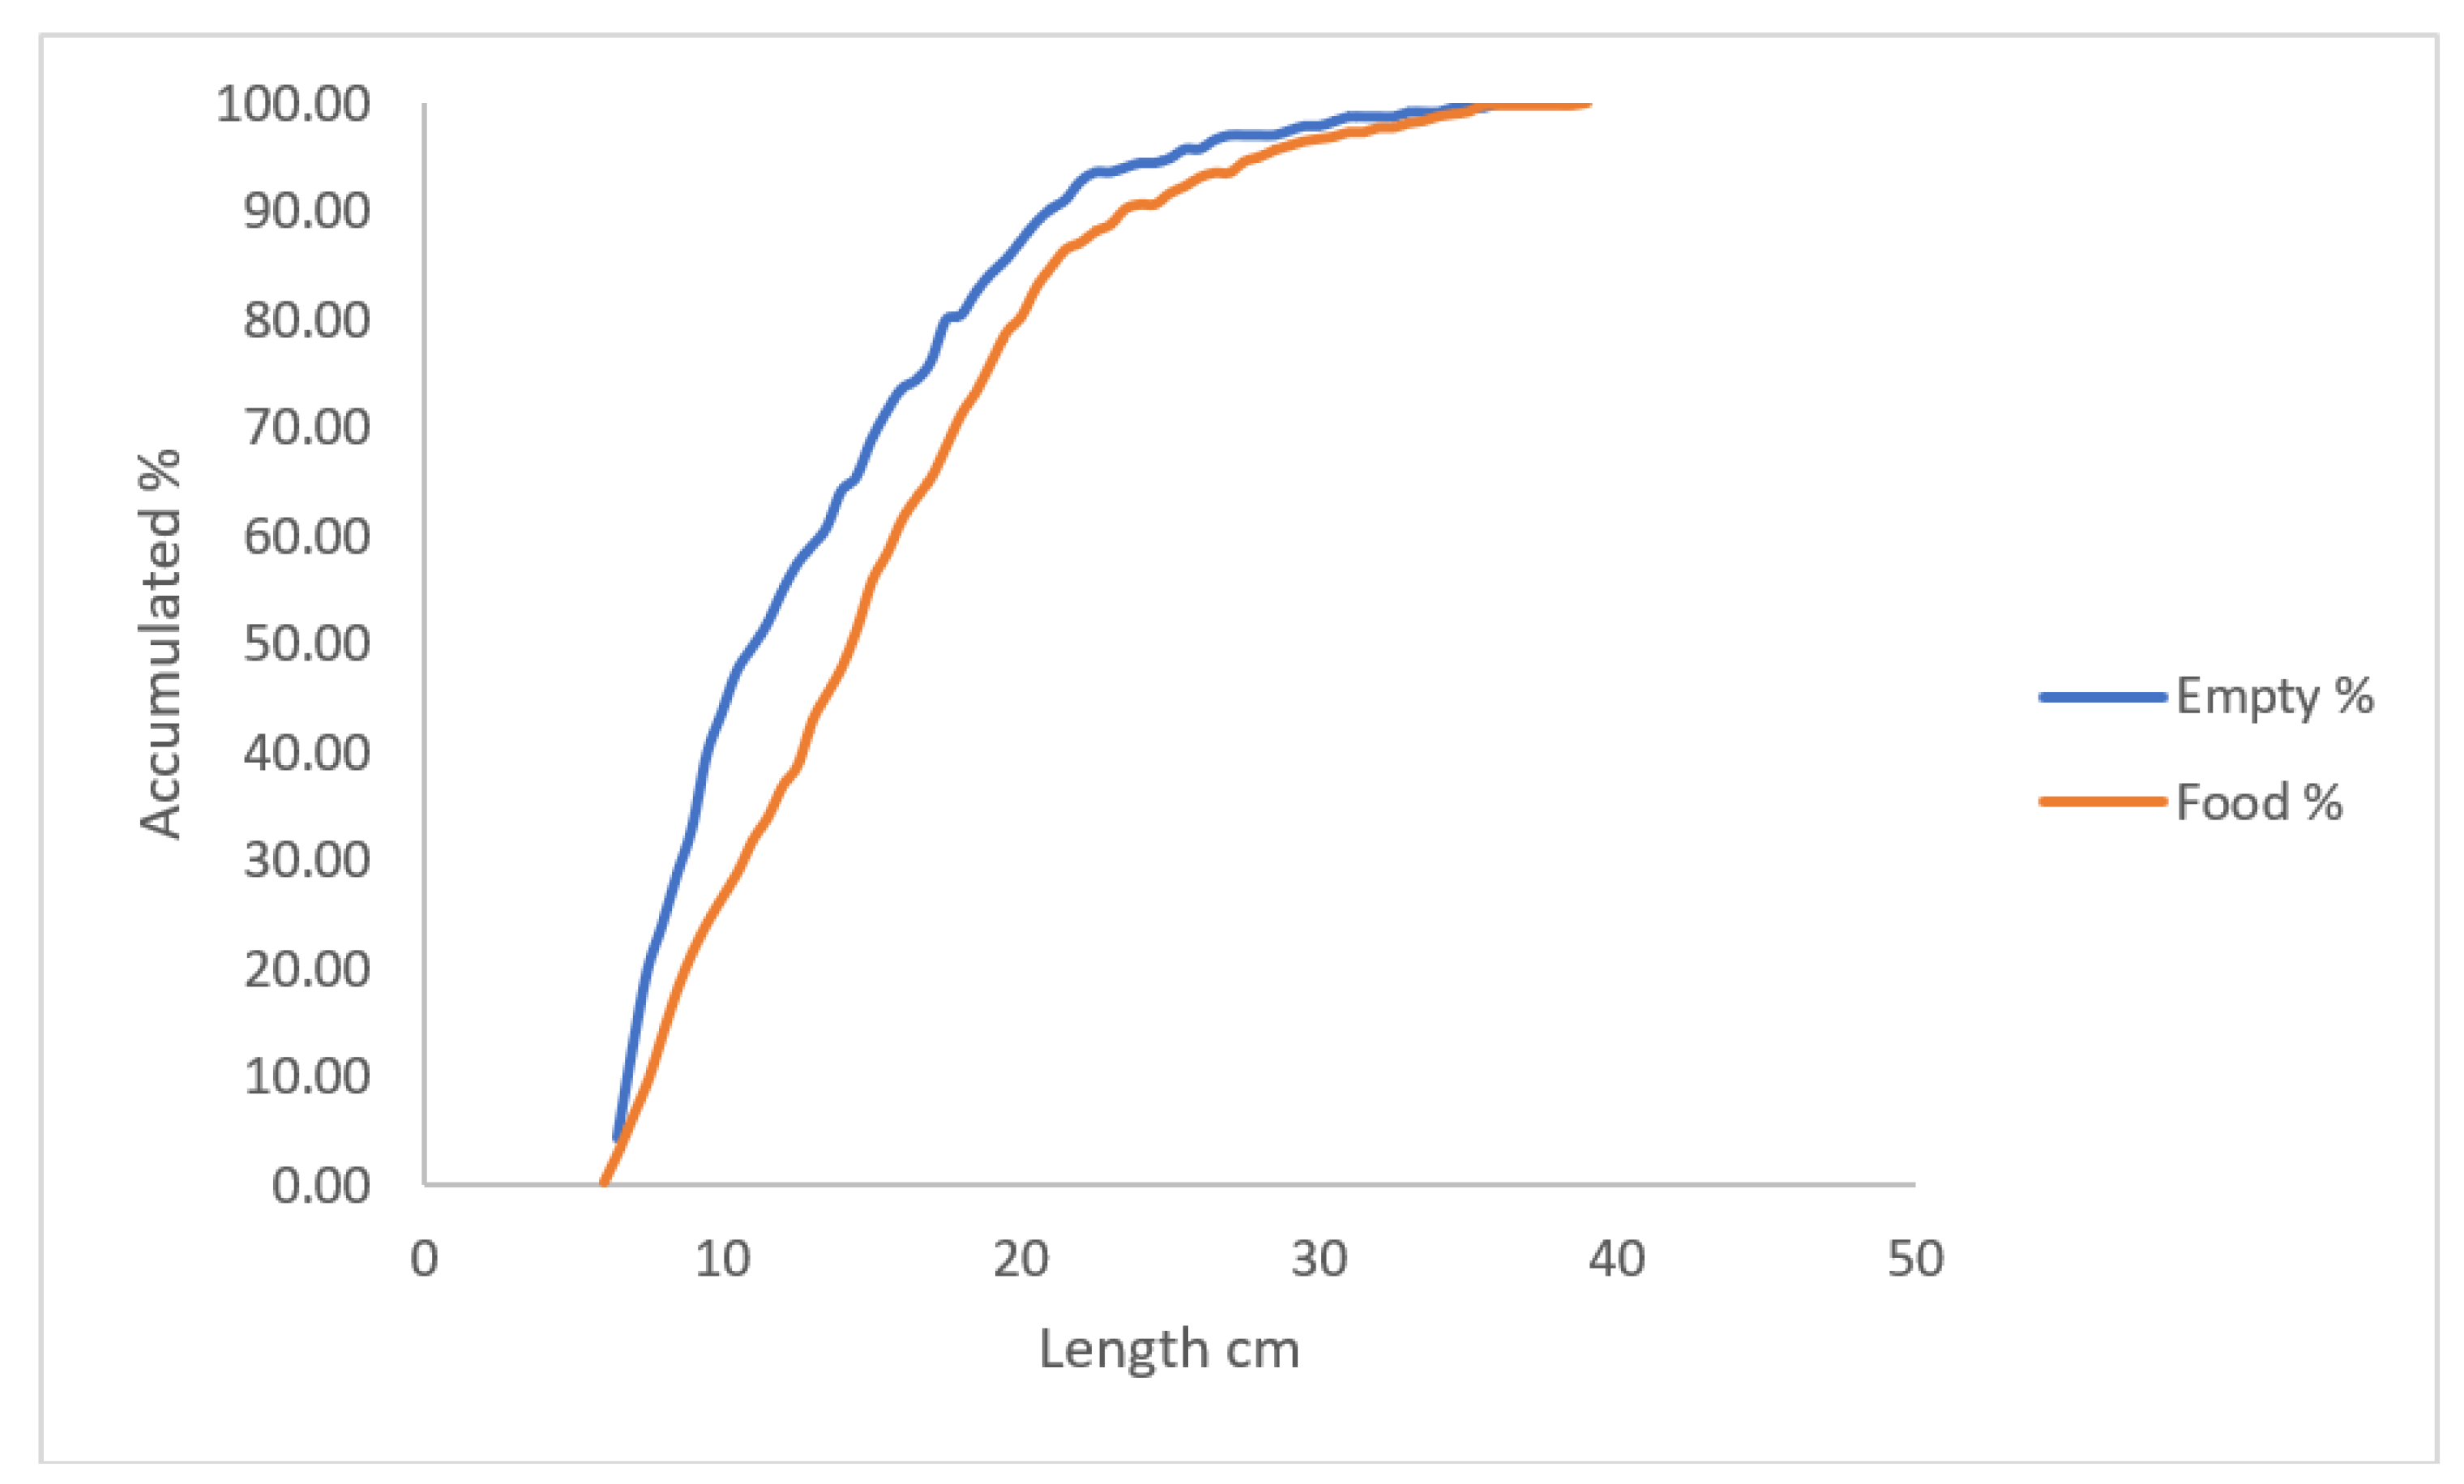
The mean number of empty stomachs is 26% (April – October) and the relationship between empty and stomachs with food is giver in
Figure 7. The distribution of empty stomachs vs length is different compared to stomachs vs length with food (Kruskal-Wallis test, p << 0.05).
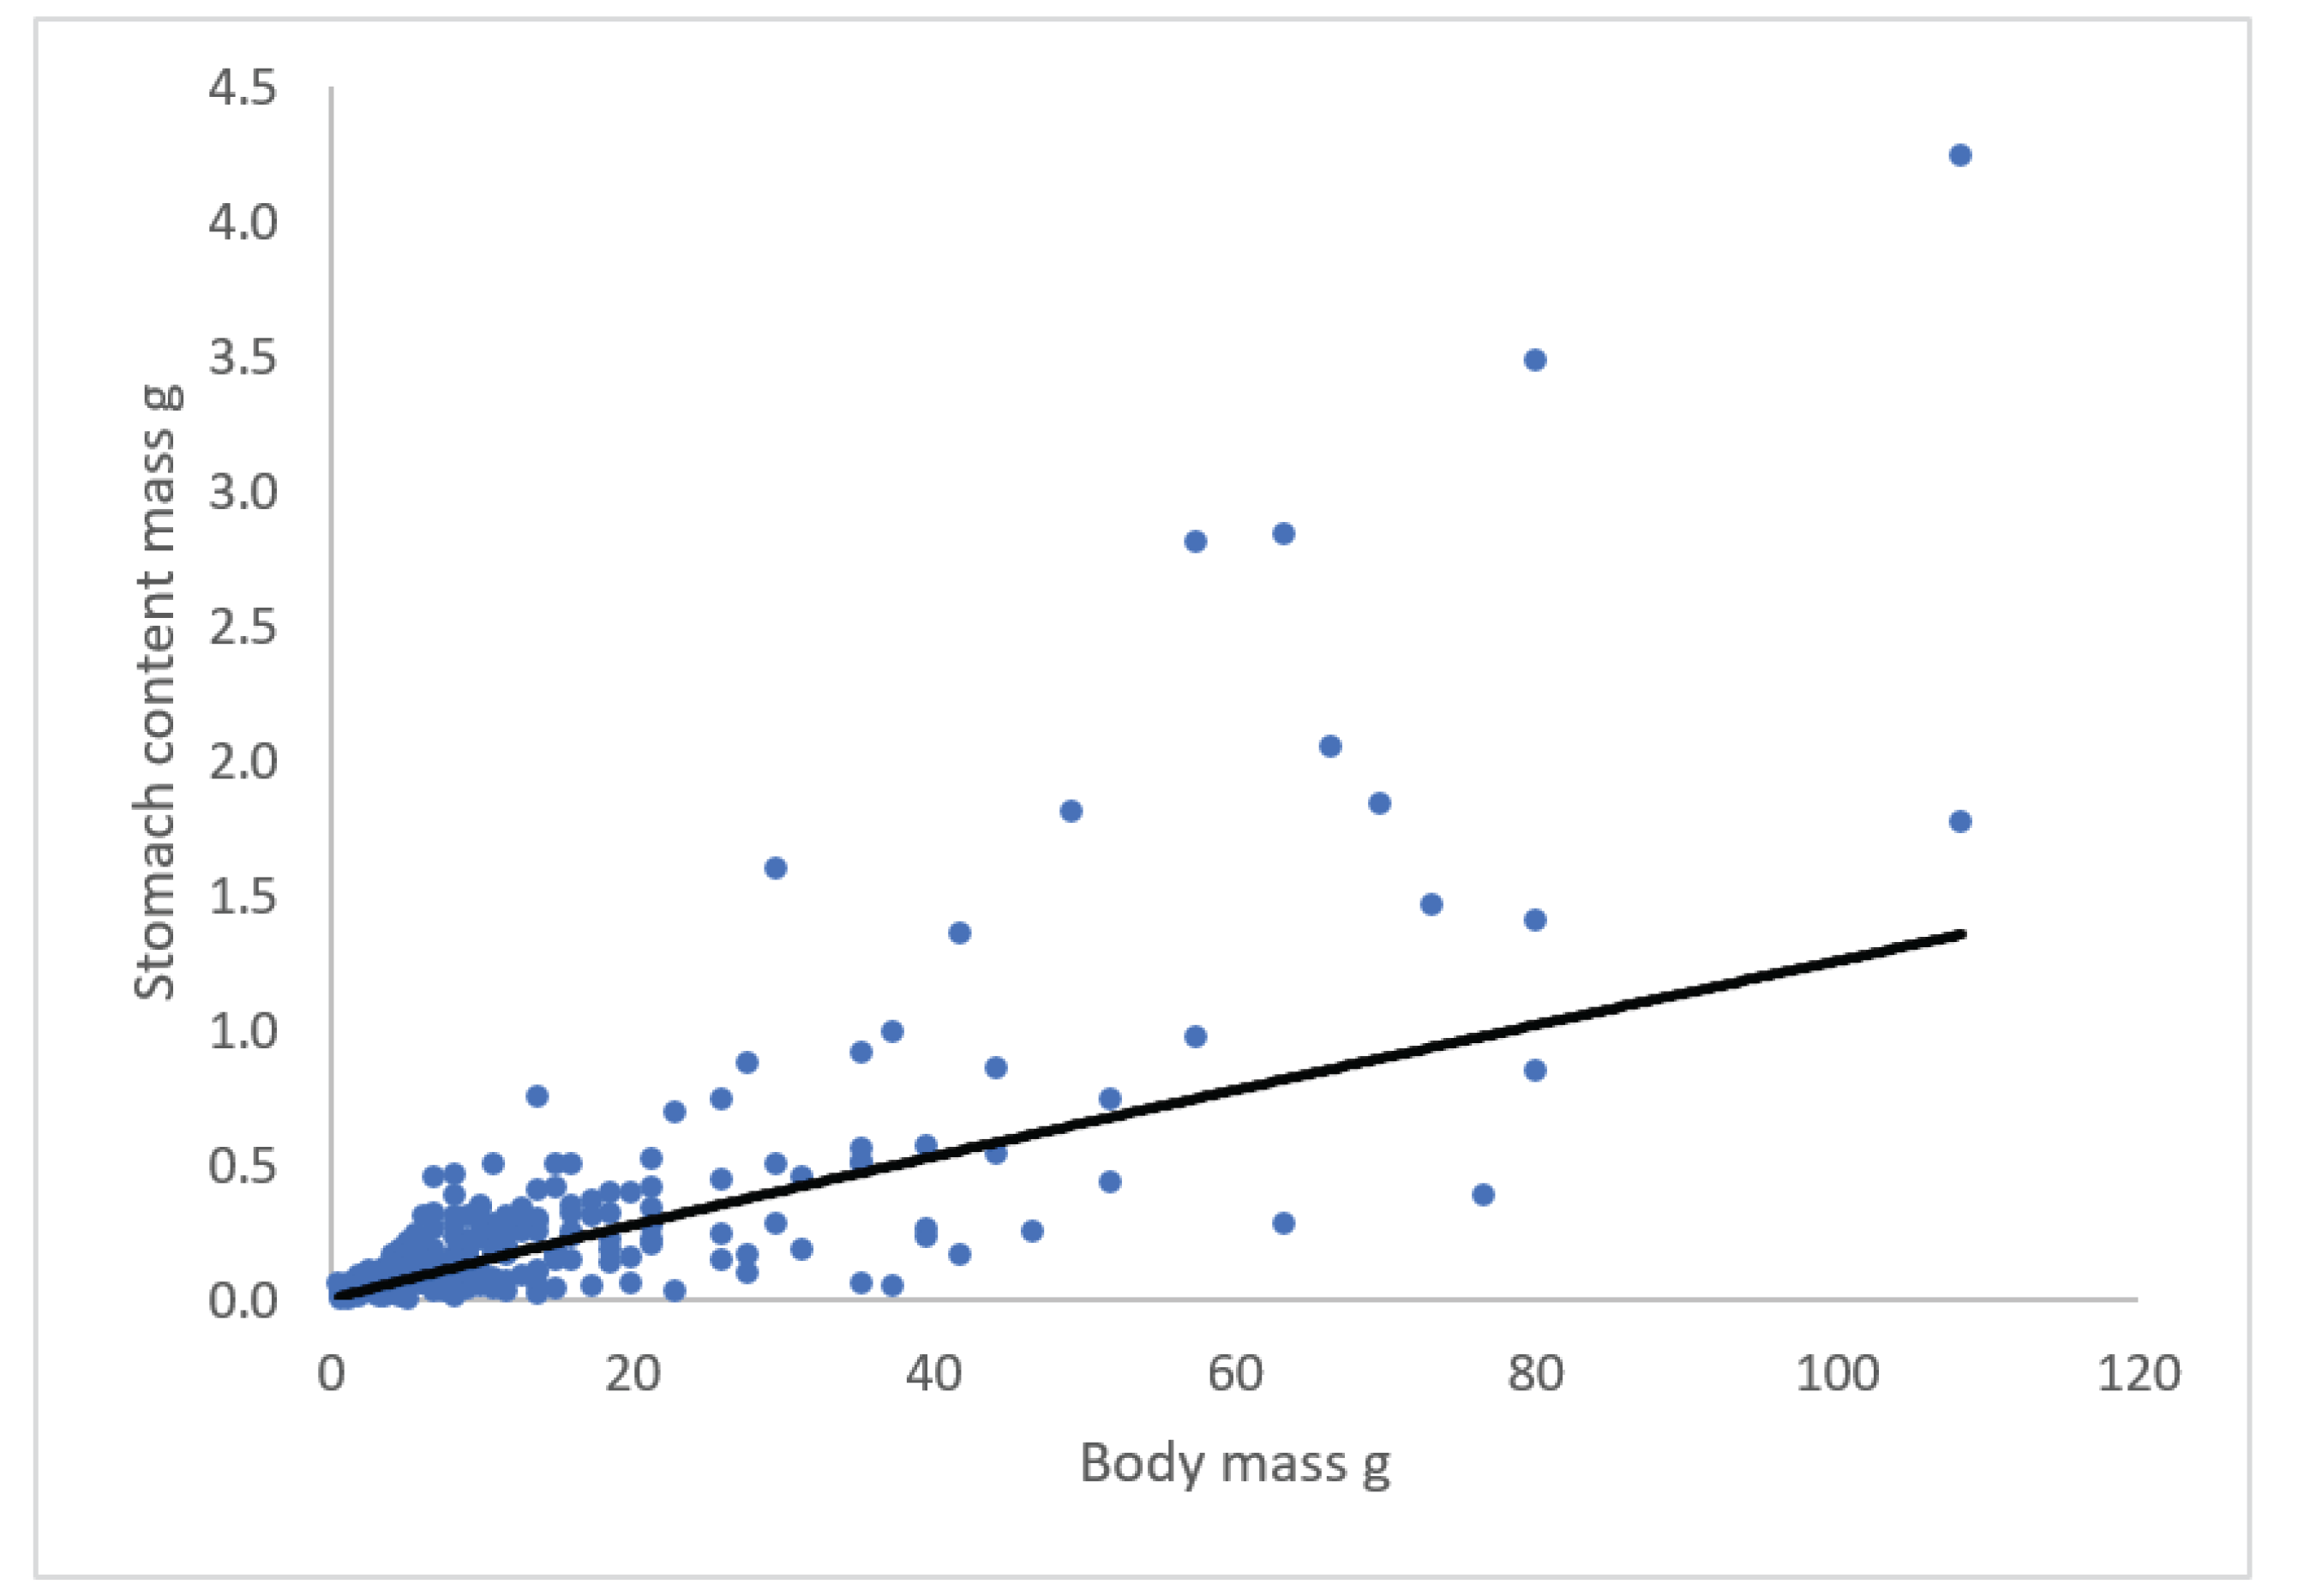
The relationship (April to October) between stomach content (g) and body mass (g) of eel is given in
Figure 8, and stomach content = 0.0214(±0.0031)*body mass
0.9397(±0.0876), R
2 = 0.62, which mean that the mean stomach content is about 2.1% of body mass, and that stomach content is more or less proportional to body mass.
Table 3 shows NoC predation on Simulidae and Chironomidae larvae, Ephemeroptera nymphs, Tricoptera l and Gammarus vs four eel length groups. Ephemeroptera and Chironomidae larvae are preferred of smaller eel and at decreasing amount at decreasing length, and Trichoptera larvae are preferred at increasing eel length.
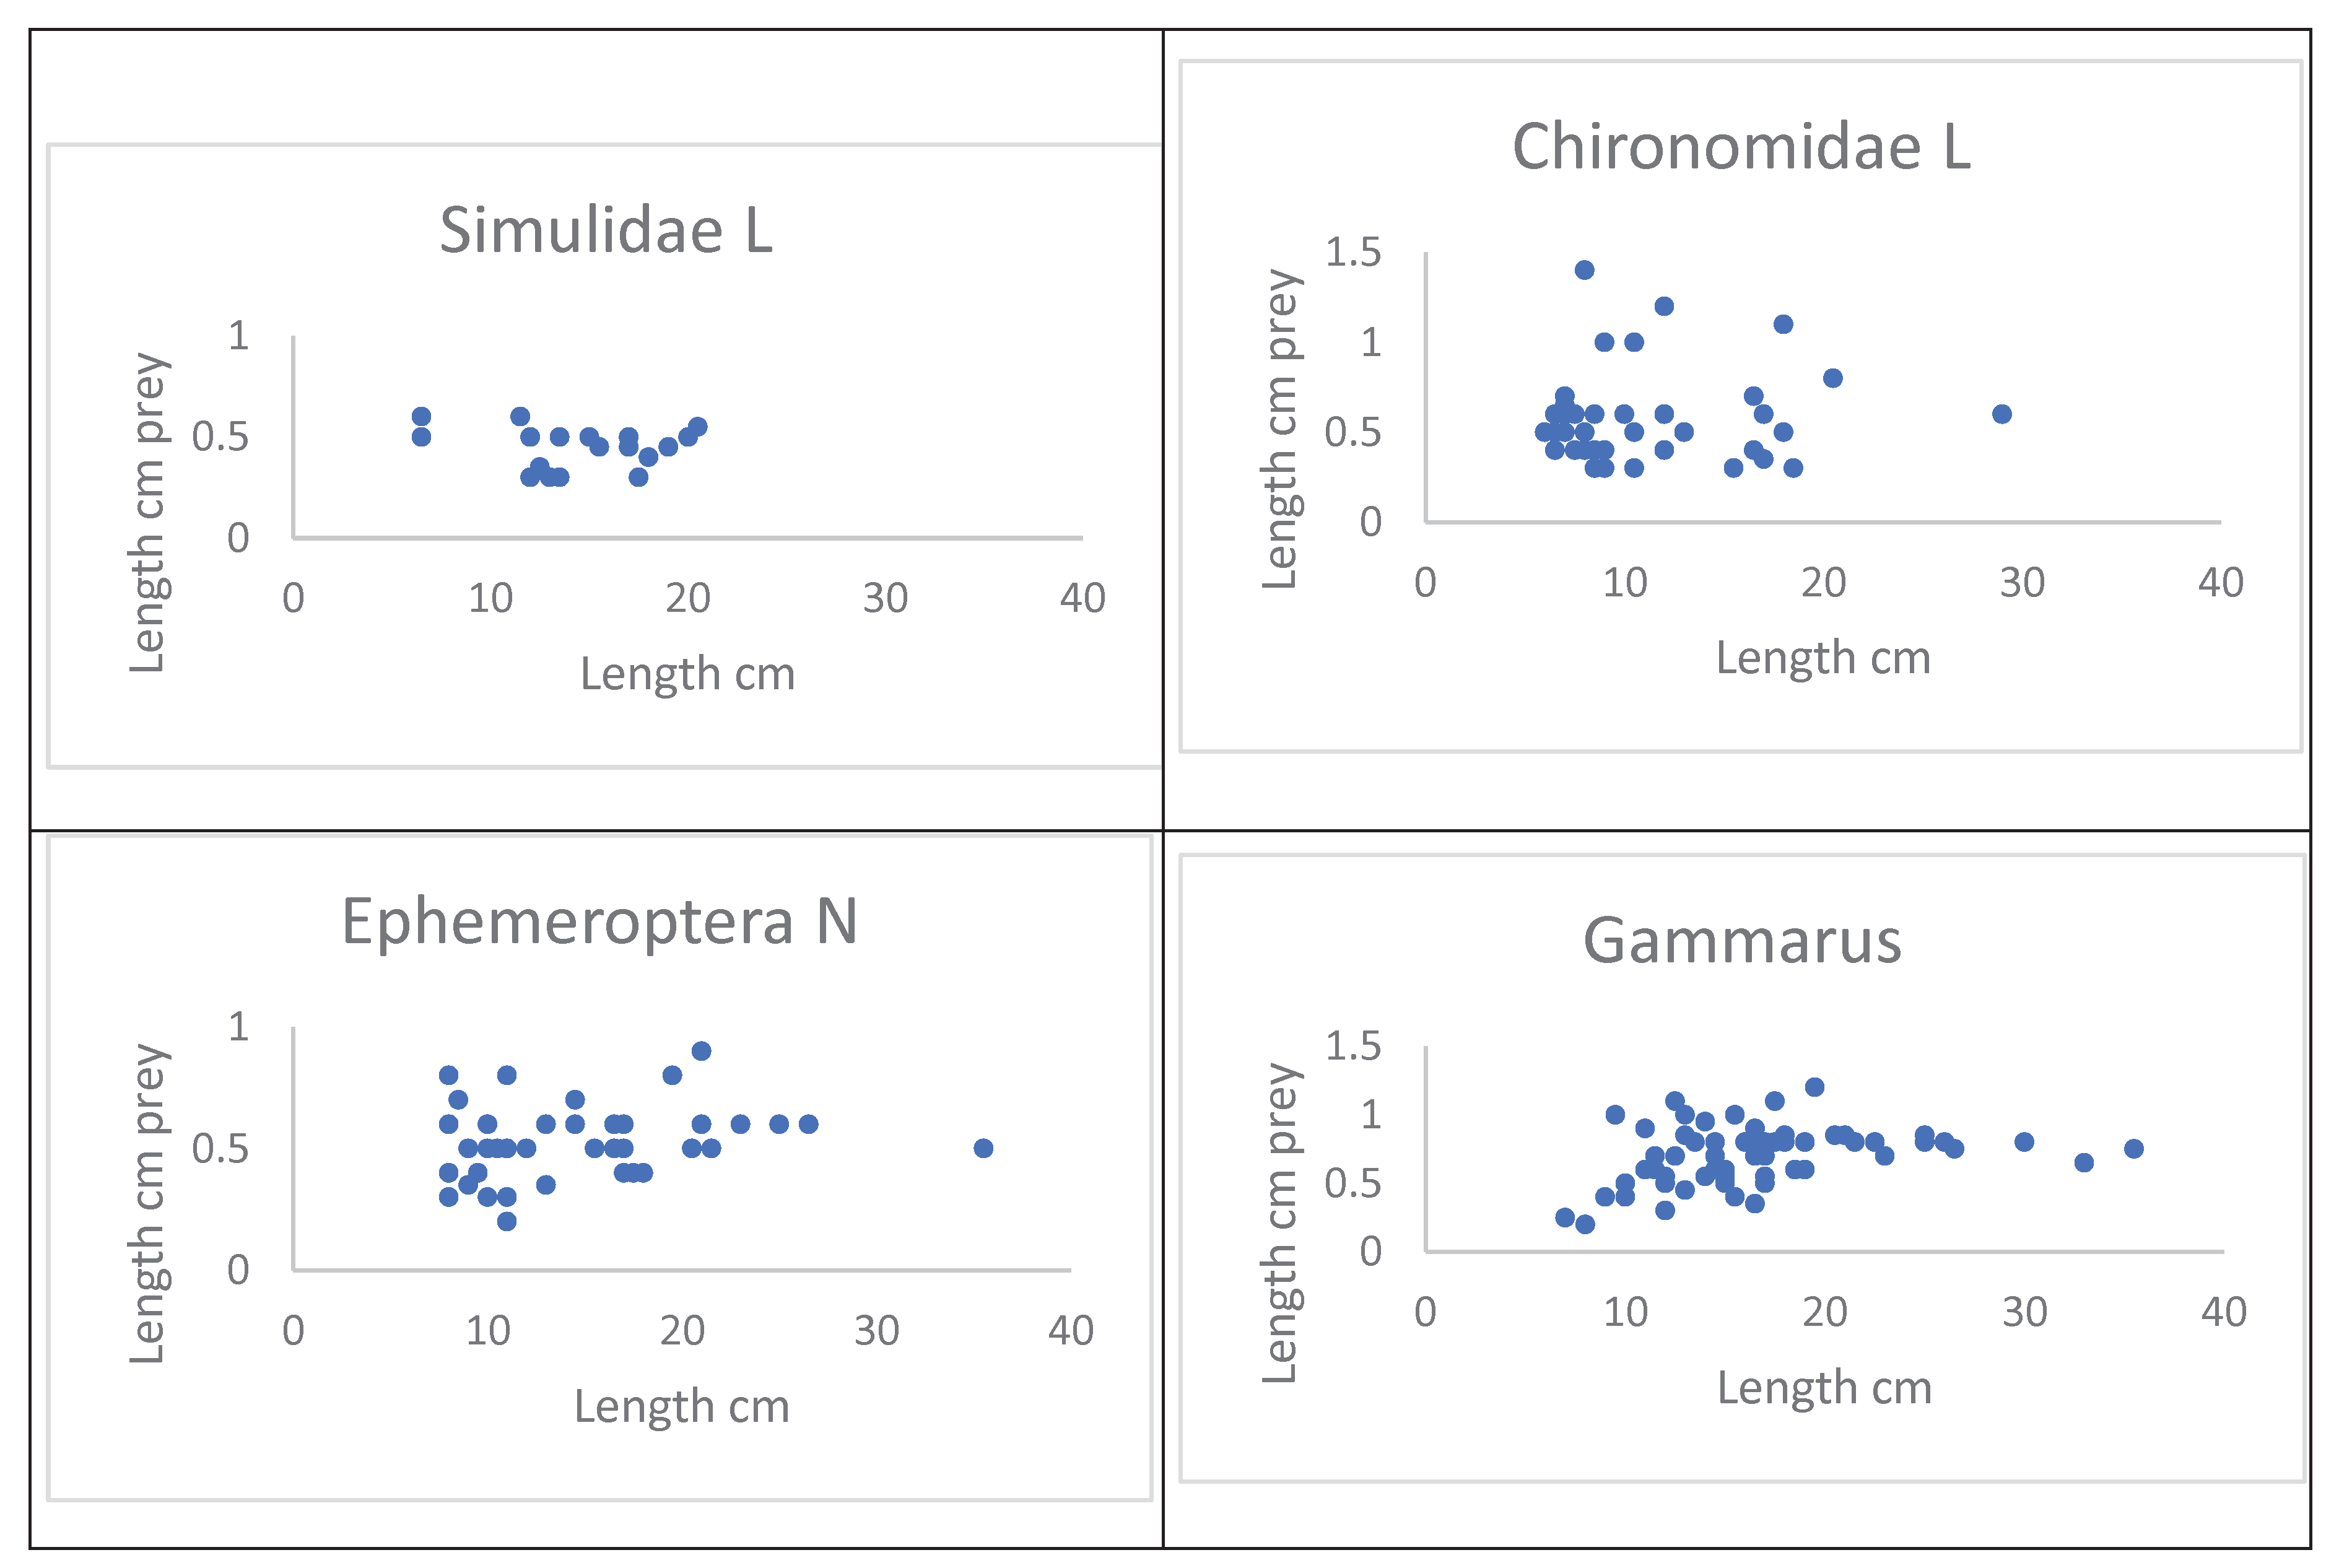
The size (cm) of Simulidae and Chironomidae larvae and Ephemeroptera nymph and Gammarus vs. eel length is shown in
Figure 9. The mean size of prey is independent of eel length.
4. Discussion
4.1. Linear Growth and von Bertalanffy Trajectory of Yellow Eel
Bioenergetics model developed for fishes indicates that somatic growth rate scales allometrically with fish body mass: dw/dt = a*wtm- b*wtn, where wtis somatic body mass, a*wtmis the rate of energy acquisition, and b*wtnreflects energy losses owing to respiration (e.g. standard metabolism, SDA and activity) (Ursin 1967, Lester 2004).
Setting m = 2/3 and n = 1, integrate dw/dt, we get the von Bertalanffy growth trajectory:
wt = w∞[(1– exp(-k*(t – t0)))]3.
References in the literature e.g. Lester et al. (2004 and references herein) suggests, that m and n have similar values, that both lie close to 2/3, suggesting the following equation holds: dw/dt = (a - b) w2/3.
Given that body mass increases with the cube of length (w = al3), and substituting w with l, the potential growth rate for length (cm yr-1) is dl/dt = h0, where h0 = (a - b)/3a1/3. Integrating dl/dt, thus length is a simple linear function of time, lt = k + h0*lt-1, where the constant k is set to 7.19 cm (i.e. length of glass eel). (a – b) is the net growth, and with increasing individual food intake the growth rate will increase, but looked over increasing ages the annual growth rate of individuals is constant.
Linear growth of immature fish is debatable (Lester et al. 2004). For example, Rasmussen 1952 sampled and aged yellow eel caught in Lake Esrum, Denmark. The otoliths were age determined due to thin slip, and the individual growth rate showed constant annual linear growth. Dahl 1967 stocked glass eel in ponds in Denmark and aged the otoliths due to thin slip, and individual eel showed constant annual linear growth. Sinha & Jones (1967a) aged yellow eel (2 – 12 years) in different rivers in UK by grinding the otoliths, and individuals all showed linear growth. Frier & Rasmussen (2020) aged and calculated annual growth rate of sea trout (Salmo trutta) in marine water. The growth rate from smolt up to first spawning in autumn was linear and rather fast. The sea trout loose up to about 40% of body mass when spawning, and they have to build body mass up before they can restart growing in length (Frier & Rasmussen 2020). Hereafter they grow in linear length and body mass up to next spawning the following autumn. The growth period is thus shorter than the year before, so following a cohort of sea trout through several spawning, the growth curve follow a van Bertalanffy growth trajectory. However, the individual growth in length through each year is always linear, and can vary from individual to individual.
The linear growth of fish species assumes, that (a - b) does not change, and that all surplus energy is allocated to somatic growth, and does not account for the change in somatic growth, that occurs when fishes become sexually mature and some energy is allocated to reproduction (Day & Taylor 1997). Yellow eels are immature during the entire growth period up to the silver eel stage, and individual yellow eel will therefore always grow with a linear growth trajectory. This does not mean that all individual yellow eel within an age class grow with the same ∆ cm, see
Figure 2, and
Figure 2 in Rasmussen & Pedersen (2023), where the variance of the age individual observations decrease at increasing age. Probably it is a combination of genetics and varying feeding rate a*w
tmof each single eel.
We propose that rather early at age, some yellow eel in the cohort distribute to fast growth rate and probably early silvering, while the lower growing yellow eel silver later at increasing higher age. The yellow eel that mature later make it possible to calculate a von Bertalanffy trajectory.
Rasmussen & Pedersen (2023) assumed linear growth of yellow eel in River Brede. Male (4 – 25 year) and female (7 – 24 year) silver eel with known length and age at silvering enabled to calculate length-at-age through a cohort of yellow eel form low age at silvering to high age at silvering. For both sex length-at-age decreased considerable going from low age at silvering to high age at silvering, and male yellow eel grow significant slower than female silver eel. For both sex and for a given yellow eel age, there was rather high variation in calculated yellow eel size. This means that through a cohort starting from glass eel to silvering, some yellow eel grow rather fast, and reach size of silvering in a few number of year, the decreasing growth rate at increasing age postpones the age at silvering. This means that even if we assume individual linear growth, for a given age there will be fast growing yellow eel vs slow growing yellow eel. It also means that the given potential growth rate vary for length-at-age (cm year-1) or h0 = (a - b)/3a1/3. One can imagine that the fastest growing yellow eels simply eat relatively more than slow growing yellow eels, i.e. values of ´a´ are greater for the fast-growing eels compared to the slow growing eels.
Figure 2 shows the traditional mean length-at-age relationship, where annual ∆ is the slope of the regression and calculated to 2.4 cm. This is a rather slow growth rate.
Figure 3 shows the annual ∆ cm calculated from otoliths and is calculated to mean 3.1 cm. ∆ is decreasing as function of age.
The difference between the two values of ∆ is probably explained by the two different calculation data.
More interesting is the declining value of ∆ in
Figure 3 compared to increasing values of ∆ in
Figure 4. Most probably, it is explained by the relative increasing energy content in yellow eel at increasing age. This means that at increasing length the length/energy content is higher for a given length compared to length/weight relation in wet weight at the same length. The calculated ∆ in
Figure 3 was calculated in wet weight, so the corresponding increasing length-at-age in energy means decreasing ∆. In
Figure 4 is calculated ∆ Kcal as function of age and ∆ is increasing. The observations are skewed, and 20 values of ∆ Kcal are outliers, with lengths cm varying from 31.5 to 48.5 cm. They were all yellow eel, and we suggest that they have so high relative energy content, that they prepare for early silvering and out migrating.
Using the calculated ∆ cm in
Figure 3, which are decreasing and therefore follow the prerequisites (i.e. decreasing ∆ at increasing age) for the von Bertalanffy growth trajectory which is shown in
Figure 5. The slow decreasing ∆ at increasing age means that L
∞, here calculated to 118.4 (±21.4) cm is rather high, but not unlikely, because eel can grow up to 133 cm (Fishbase.org). The 95% confidence limit of L
∞ is rather high and in general, the von Bertalanffy equation should be used with precaution (Day & Taylor 1997, Lester 2004), especially with data that does not distinguish between male and female. Rasmussen & Therkildsen (1979) calculated in a Danish river L
∞ for unsexed eel to 59.8 (±5.01) cm. Rasmussen & Pedersen (2023) calculated in a Danish river L
∞ for males to 49.7(±0.56) cm and females to 74.4(±1.52) cm. Bisgaard & Pedersen (1991) calculated in a Danish river L
∞ to 90.3 cm in a population of unsexed eel.
4.2. Mortality M vs Body Mass
Annual natural mortality M of fish species, including eel, is probably a function of e.g. sex, body mass, water temperature, predators and stock density (e.g. Pedersen et al. 2023, Bevacqua et al. 2012, Ursin 1967, Vøllestad & Jonsson 1988, Berg & Jørgensen 1994, De Leo & Gatto 1996 and Lorenzen 1996). This means that M is decreasing with increasing body mass and male versus female eel, and increasing with water temperature, and M is increasing with increasing density of yellow eel. Ursin (1967) proposed as a “rule of thumb” that M = M
-1/3, but he overlooked that M should be scaled including other predictors other than only body mass, so M is better described as a*M
-1/3 (Pedersen et al. 2023, Bevacqua et al. 2011). Pedersen & Rasmussen (2013) propose that M = 0.5*M
-1/3.The two calculations in
Figure 6 show reasonable agreement between M from observations compared to M calculated by 0.5*M
-1/3, and this model of M has also been used in Pedersen & Rasmussen (2013) and Rasmussen & Pedersen (2023). Down to about body size of 10 g, there is a slight increase of M, but below body size of 10g the mortality increase rather fast.
4.3. Biological Production
The biological productions of yellow eel in this study was calculated to 13.5 g m-2 year-1. Rasmussen & Pedersen 2023 calculated biological production in two Danish rivers to 11.0 and 6.6 g m-2 year-1, respectively. Lobon-Cervia et al. 1995 calculated biological production along the course of River Esva in North Spain, mostly dominated by males, aged up to 4+ (i.e. five growth seasons) and up to 40 cm length. Numbers of yellow eel were estimated from electrofishing, and the eels were aged by clearing the otoliths. The biological production depended on distance to the estuary, and values up to 35.3 g m-2 year-1, but with large variations, was recorded. Biological production in running waters depends on number of recruitment of glass eel, mortality and growth rate, so production can be expected to vary quite much. However, there are so few yellow eel studies to compare. Lobon-Cervia and Rasmussen (2024) showed that the biological production of brown trout in rivers in England, Denmark and Spain had a limit up to 40-45 g m-2 year-1 primarily as a function of recruitment of fry in spring. Yellow eel and brown trout more or less eat the same taxa in rivers, so the high production of yellow eel is natural.
4.4. Feeding
The food taxa in the baeck in this study was dominated by five important taxa, other taxa were in small number. This is in contrast with River Køge-Lellinge (Rasmussen & Therkildsen 1979), where a much higher number of different taxa constituted the diet of eel. In the baeck in this study, only one single stickleback was found, whereas in the other river several six fish species was found in the food. In this study Gammarus pulex was an important taxa, but only sporadic in the other study. We propose this is because of the small size and physical bad habitat condition of the baeck in this study, whereas in the other study the river was larger and with better habitat condition.
The number of empty yellow eel stomachs in both studies was surprisingly high, and one wonder why in contrast to stream brown trout (
Salmo trutta), where more or less all fish always have food items in their stomachs. Feeding of eel depends on water temperature (Dörner & Berg 2015), and they eat from water temperatures 5-6 to 25-30
0C. The water temperature in 25 March in this study was estimated about 6.1
0C, so the eels had just started eating and this might explains the high percentage of empty stomachs. The water temperature on October 3rd was estimated to about 9.7
0C and this might explains the lower number of empty stomachs. In
Figure 7 is shown, that the proportion of empty stomachs is more pronounced in smaller eel. It could be because of agonistic behavior between eels because of the high density of eel up to about 20 cm length and because of the rather high eel density about 5 – 6 eel pr. one m
2.
Sinha & Jones (1967b) looked at the stomach content of a high number of eel in English rivers. The food consisted mainly of Trichoptera and Diptera larvae, Plecoptera, and Ephemeroptera nymphs, through at times, Gastropoda, Annelida, Crustacean and fish were common in the stomachs, when eaten the last the fish mostly taken were elvers and bigger eels. Frost (1946) analyzed the food of eel in the Windermere area, including two running water, total 74 eel. The food items were Limnephilids larvae, Plecoptera and Ephemeroptera nymphs, Chironomids and other Diptera larvae, Gammarus pulex and Mollusca.
In all the mentioned few studies available, there was no identification of river food items, so we don’t know what the eel prefer from the food items, but the conclusion is probably that the yellow eel eat what is available in the river, but eat fish in low number (Dörner & Berg 2015).
The size of the food items in
Figure 9 did not vary as function of eel length. Collecting eels for food analysis only gives a snapshot of the food on the day in question. One could explain the results in this study by the fact, that there is a constant grazing of new, recruited small individuals of food animals, and that these smaller items are quickly eaten, especially by the smallest eels under, for example, 10 cm in length, which then have to eat the slightly larger food items. The size of
Gammarus pulex shows an increase in eaten Gammarus all the way down to 2 mm in length, then up to a constant length of Gammarus at a size of eel of approx. 12 cm length.
Gammarus pulex constantly produces new individuals depending on the water temperature. This is in contrast to the aquatic insects, which have a more constant number of generations. This might explain
Figure 9. However, this requires extensive research.
Data Availability
The data used can be obtained from the corresponding author.
Acknowledgments
Thanks to technical assistance from Knud Jørgensen and Erik Hansen for contribution to field work and ageing the otoliths.
Conflicts of Interest
The authors certify that they have no affiliations with or involvement in any organization or entity with any financial interest (such as honoraria; educational grants; participation in speakers' bureaus; membership, employment, consultancies, stock ownership, or other equity interest; and expert testimony or patent-licensing arrangements), or non-financial interest (such as personal or professional relationships, affiliations, knowledge, or beliefs) in the subject matter or materials discussed in this manuscript.
References
- Berg, S., Jørgensen, J., 1994. Stocking experiments with O+ eel (Anguilla anguilla L.) in Danish streams: post stocking movements, densities and mortality: In Rehabilitation of Freshwater Fisheries, 314 - 325. Edited by I.G. Cowx. Fishing News Books. University of Hull, U.K. ISBN 0-85238-195-6.
- Bevacqua, S., Melia, P., De Leo, G.A., Gatto, M., 2011. Intra-specific scaling of natural mortality in fish: paradigmatic case of the European eel. Oecologia (2011) 165:333–339. DOI 10.1007/s00442-010-1727-9. DOI 10.1007/s00442-010-1727-9.
- Bohlin, T., Hamrin, S., Heggberget, T.G., Rasmussen, G., Saltveit, S.J., 1989. Electrofishing – Theory and practice with spcial emphasis on salmonids. Hydrobiologia, 173,9-43.
- Bisgaard, J. & Pedersen, M.I., 1991. Mortality and growth of wild and introduced cultured eel (Anguilla anguilla (L.)) in a Danish stream, with special reference to a new tagging technique. Dana, vol. 9, 57-69.
- Castonguay, M., Hudson, P.V., Moriarty, C., Drinkwater, K.F. & Jessop, B.M. 1994. Is there a role of ocean environment in American and European eel decline? Fisheries Oceanography 3: 197–203.
- Chapman, D.W. 1967. Production in fish populations, 3-29. The Biological Basis of Fish Production, Edited by Shelby D. Gerking. Blackwell Scientific Publications, Oxford and Edinburg.
- Christensen, J.M., 1964. Burning of otoliths, a technique for age determination of soles and other fish. Journal Conseil Permanent Internationale pour l’Exploration de la Mer, 29, 73-81.
- Dahl, J., 1967. Some recent observations on the age and growth of eel. Proceeding of the 3rd British Coarse Fish Conference, 48-52.
- Day, T. & Taylor, P.D. 1997. Von Bertalanffy¨s growth equation should not be used to model age and size at maturity. The American Naturalist, vol. 149, no. 2:381-392.
- De Leo, G. A., Gatto, M., 1996. Trends in vital rates of the European eel: Evidence for density dependence? Ecological Applications Volume: 6, 1281-1294. 6.
- Dörner, H., Berg, S., 2015. Feeding ecology. Biology and Ecology of Anguillid Eels, 171 – 191. In Boca Raton: Taylor and Francis.
- EU, 2007. Council regulation (EC) No 1100/2007 of 18. September 2007 establishing measures for the recovery of the stock of European eel. Official Journal of the European Union. L 248, 17-23. 20 September.
- Friedland, K.D., Miller, M.J. & Knights, B. 2007. Oceanic changes in the Sargasso Sea and declines in recruitment of the European eel. ICES Journal of Marine Science 64: 519–530. [CrossRef]
- Frier J.O. & Rasmussen, G. 2020. Circulus formation rate in scales from sea trout (Salmo trutta L.). DTU Aqua Report no. 376-2020. 31 pp.
- Frost, W.E. 1946. Observations on the food of eel (Anguilla anguilla) from the Windermee Catchment Area. Journal of Animal Ecology, Vol. 15, No. 1, 43-53.
- ICES. 2005. Report of the ICES ⁄ EIFAC Working Group on Eels. No. ICES CM 2005 ⁄I:01. Galway, Ireland, 184 pp.
- ICES (2023). Advice on fishing opportunities and conservation. ele.2737.nea. [CrossRef]
- Ivlev VS (1966). The biological productivity of waters (English version). Journal of Fisheries Research Board of Canada, 23, 1727–1759.
- Larsen, K., 1972. Studies on the biology of Danish stream fishes. III. On seasonal fluctuations in the stock density of yellow eel in shallow stream biotopes, and their causes. Meddelelser i Danmarks Fiskeri og Havundersøgelser. N. S. 7 (2): 23-46.
- Lester, N.P., Shuter, B.J., Abrams, P.A., 2004. Interpreting the von Bertalanffy model of somatic growth in fishes: the cost of reproduction. Proceeding of the Royal Society. M 271, 1625:1631.
- Lobon-Cervia, J., Utrilla. C.G., Rincon, P.A.. 1995. Variations in the population dynamics of the European eel Anguilla anguilla (L.) along course of a Catabrian river. Ecology of Freshwater Fish, 4: 17-27.
- Lobon-Cervia, Rasmussen, G., 2024. Determinants and Dynamics of Production Rates of Stream-Dwelling Salmonids: The Importance of Intrinsic Factors. 551-587. In Advances in the Ecology of Stream-Dwelling Salmonids. Fish & Fisheries Series 44.
- Lorenzen, K., 1996. The relationship between body weight and natural mortality in juvenile and adult fish: a comparison of natural ecosystems and aquaculture. Journal of Fish Biology, 49, 627–647.
- Pedersen, M.I., Rasmussen, G.H., 2013. Background material for preparation of eel management plan in Denmark. DTU Aqua-rapport nr. 271-2013. (In Danish).
- Moriarty C. & Steinmetz B, 1979. On age determination of eel. Rapport et Proces-verbaux des Reunions. Conseil international pour l’Exploration de la Mer, 174, 70-74.
- Pedersen, M.I., Rasmussen, G.H., 2013. Background material for preparation of eel management plan in Denmark. DTU Aqua-rapport nr. 271-2013. (In Danish).
- Pedersen, M.I., Rasmussen, G.H., 2018. Fisheries regulation on European Eel (Anguilla anguilla) for 2018: how big is the effect? Journal of Fish Research, volume 2, Issue 1, 17-18.
- Pedersen, M.I., Rasmussen, G., Jepsen, N., 2023. Density-dependent growth, survival and biomass production of stocked glass eel (Anguilla anguilla) in seminatural ponds. Fisheries and Management Ecology. 1-7.
- Pedersen, M.I, Jepsen, N., Rasmussen, G. Mikkelsen, J.S., 2024. Impact assessment of eel releases.
- upstream Vestbirk hydroelectric power station, River Gudenå. DTU Aqua-rapport nr. xx-2024. (In press, In Danish).
- Rasmussen, C.J., 1952. Size and age of the silver eel (Anguilla anguilla L) in Esrum Lake. Rep. Dansk Biolologisk Station, LIV (I).
- Rasmussen G., 1977. Production of eels in a small stream in Zealand. Proceedings of the 8th British Freshwater Fish Conference, 61-68.
- Rasmussen G., 1983. Recent investigations on the population dynamics of eel (Anguila anguilla L.) in some Danish streams. Proceedings of the 3th British Freshwater Fish Conference, 71-77.
- Rasmussen G. & Therkildsen B., 1979. Food, Growth and Production of Anguilla anguilla L. in a small Danish stream. Rapports et Proces-Verbaux des Reunions, Conseil internationale pour l’Exploitation de la Mer, 174: 32–40.
- Rasmussen, G., Pedersen, S., 2018. Sea Trout (Salmo trutta L.) in Denmark, 483-521. In Brown Trout: Biology, Ecology and Management, First Edition. Edited by Javier Lobón-Cerviá and Nuria Sanz.
- © 2018 John Wiley & Sons Ltd. Published 2018 by John Wiley & Sons Ltd.
- Rasmussen, G. & Pedersen, M.I., 2023. Growth rate and biological production of yellow eel (Anguilla anguilla) and production of silver eel and the number of glass eel to fulfill the Danish EMP. Doi:10.20944/preprints202310.1247.v1.
- Sinha, V., R., P. & Jones, J.W., 1967a. On the age and growth of the freshwater eel (Anguilla anguilla). Journal of Zoological, 153: 99-117.
- Sinha, V. & Jones, J.W., 1967b. On the food of the freshwater eels and their feeding relationship with salmonids. Journal of Zoological, 153, 119-137.
- Ursin, E., 1967. A mathematical model of some aspects of fish growth, respiration and mortality. Journal of Fisheries Research Board of Canada, 24, 2355–2391.
- Vøllestad, L.A., Jonsson, B., 1988. A 13-year study of the population dynamics and growth of the European eel Anguilla anguilla in a Norwegian river: evidence for density-dependent mortality, and development of a model for predicting yield. Journal of Animal Ecology, 57, 983-997.
|
Disclaimer/Publisher’s Note: The statements, opinions and data contained in all publications are solely those of the individual author(s) and contributor(s) and not of MDPI and/or the editor(s). MDPI and/or the editor(s) disclaim responsibility for any injury to people or property resulting from any ideas, methods, instructions or products referred to in the content. |
© 2024 by the authors. Licensee MDPI, Basel, Switzerland. This article is an open access article distributed under the terms and conditions of the Creative Commons Attribution (CC BY) license (http://creativecommons.org/licenses/by/4.0/).
