Preprint
Article

Mechanical Characterization of Corrugated Board: Sensitivity Analysis in Design of Experiments

Altmetrics

Downloads

150

Views

70

Comments

0

Submitted:

09 March 2024

Posted:

12 March 2024

You are already at the latest version

Alerts
Abstract
Corrugated board is a composite material characterized by strong orthotropy in both the elastic and plastic phases. Additionally, due to its layered structure, which consists of alternately arranged flat and wavy layers of paper, its mechanics becomes complicated. Therefore, a precisely selected set of laboratory tests is needed to correctly identify all the necessary material parameters of cardboard. The work attempts to define a full set of laboratory tests in order to determine material parameters describing the linear-elastic, orthotropic behavior of cardboard and the basic parameters defining popular plasticity criteria, such as the asymmetric orthotropic Hoffman criterion. For this purpose, sensitivity analysis and numerical models of several selected basic laboratory tests were used. Since the aim of the work is to choose appropriate laboratory tests necessary to correctly determine the material parameters of corrugated board (not its individual layers), the numerical models do not contain detailed cardboard geometry, but only its homogenized representation in the form of the flat shell models. All numerical models are based on the nonlinear finite element method and constitutive modelling in the form of UMAT subroutines implemented in the ABAQUS software. Based on the analyses, appropriate measurements and laboratory tests were indicated that are most sensitive to the material parameters sought.
Keywords: 
Subject: Engineering  -   Mechanical Engineering

1. Introduction

Cardboard is a material commonly used around the world. Cardboard products currently constitute approximately 70% of the paper products market, and the sales value of this market segment is in the order of hundreds of billions of dollars. The main driving forces of this market are the global development of e-commerce, the sale of ready-made takeaway food and the process of replacing plastics with biodegradable materials.
Cardboard packaging is very common because it is a product that is cheap and suitable for mass production. Moreover, corrugated cardboard is an environmentally friendly product because it can be recycled many times without significant loss of quality [1,2,3]. Corrugated board is a very lightweight material, so it practically does not affect the weight of the shipment. Thanks to its strength parameters and characteristic structure, it well protects the packaged elements against mechanical damage [4,5]. One of the few disadvantages of corrugated cardboard is its sensitivity to environmental conditions (e.g. moisture) [6,7,8] and degradation caused by an aging [9].
Corrugated board consists of several various layers of paper (paperboards), at least one of which is corrugated. The structure distinguishes between flat liners and corrugated flutings. Typically, stiffer liners are intended to provide puncture resistance, and wavy flutes affect the stiffness and strength of the structure [10,11]. The most popular are type B and C flutes, often used in cardboard for large boxes, and type E mini-flutes, used for smaller packages or as an internal flute in 5- and 7-layer cardboards [12].
Paperboard consists mainly of wood fibers, which, due to the production process, are oriented mainly in one direction, the so-called the machine direction (MD). Paperboard is non-homogeneous and anisotropic material. However, with a good approximation, this material can be treated as orthotropic, in which three perpendicular directions are distinguished: the machine direction mentioned above, the cross direction (CD) lying in the plane of the paperboard and the direction consistent with the thickness of the paperboard (ZD), see e.g. Figure 1.
Due to the fact that corrugated board consists of many layers (including at least one corrugated in the MD direction), and each layer may have a different thickness and different properties, cardboard becomes a complex structure and therefore very interesting from a mechanical point of view. It should be noted here that the use of a spatial model to analyze corrugated board is extremely rare and is justified in exceptional situations, such as the assessment of local deformations of the analyzed structure [13,14,15]. In most practical cases, corrugated board is described as a plate made of an orthotropic material, the properties of which are obtained, for example, in the process of homogenization of the analyzed structure [16,17,18]. This is justified because the geometric dimensions (the thickness of the cardboard is much smaller than the other two dimensions) allow for a simplification based on treating the cardboard structure as a plate, and the homogenized properties facilitate the description of the behavior of the structure. This also enables rapid evaluation of the results of standardized experimental tests necessary to assess the quality of corrugated board.
In this work paperboard is modeled using orthotropic Hooke’s law combined with a yield criterion and a hardening. If the considered structure is presented as a homogeneous plate, its elastic behavior can be defined by the directional dependencies of its Young’s moduli, shear moduli, and Poisson's ratios in the three principal material directions: machine direction (1), cross direction (2), and through-thickness direction (3). These parameters are essential to capture the unique orthotropic characteristics of the paperboard, where the stiffness and strength vary significantly depending on the orientation relative to the fiber direction. This orthotropic model allows for a more accurate and nuanced understanding of the mechanical behavior of cardboard structures, especially under diverse loading conditions, thereby enabling more reliable predictions of their performance in practical applications.
There are several yield criteria for describing anisotropic plastic deformations. The most common is the quadratic Hill criterion [19]. It predicts the same yield stress in tension and in compression and depends only on the deviatoric stresses. The Hill criterion has been extended by many authors. Caddell, Raghava and Atkins [20], as well as Deshpande, Fleck and Ashby [21] proposed different criteria that take into account the pressure dependence, also Makela and Ostlund proposed very interesting extension of Hill model in [mo].
In issues related to cardboard mechanics, the asymmetric orthotropic Hoffman [23] and the universal Xia-Perks-Boys criteria are of particular interest [24]. Both models can present asymmetric tension-compression response which is an important feature in many materials including bio-based materials [25]. However, the models are different in terms of material parameters and calibration strategy. The Hoffman yield criterion can be expressed as the difference between the square of the equivalent stress and the square of the hardening function, which depends on an internal hardening parameter, and the equivalent stress is given by the sum of a quadratic and a linear term of the stress vector. The Xia-Perks-Boys criterion introduces a non-quadratic yield surface, which consists of 6 sub-surfaces to account for in-plane anisotropic plasticity as well as asymmetric tension-compression properties. Three subspaces represent tension in MD, tension in CD, and positive shear, whereas three other sub-surfaces correspond to compression in MD, compression in CD, and negative shear, respectively. More details on identification procedure of this model can be found in the work by Garbowski et al. [26] It can be seen that each of the proposed approaches requires a certain number of experiments to determine the necessary model parameters necessary to describe the behavior of the analyzed material.
Determining the material properties of the model is necessary to predict the behavior of a structure made of this material. From a practical point of view, it is crucial to limit the variety and number of experiments. The basic tests used in this work to determine the properties of cardboard include: the Edgewise Crush Test (ECT), the Bending Test (BNT), the Torsional Stiffness Test (TST) and the Shear Stiffness Test (SST).
The Edgewise Crush Test (ECT) allows the determination of the strength of corrugated board under edge pressure [27,28]. It gives information on the ability of a particular board construction to resist crushing [29].
The 4-point bending test allows to express the resistance of multilayer paperboard to bending under the influence of forces acting perpendicular to its surface [30]. The bending stiffness is defined per unit width of the element. Numerous studies indicate the influence of the research method [31], the method of sample arrangement [32], and the geometric parameters of the samples used [33] on the obtained mechanical properties, which means a significant sensitivity of the method to the parameters of the model used to evaluate the experimental results.
The problems of torsion and shear flexure of anisotropic plates were discussed by [34,35] and many others. Regardless of theoretical considerations, shear properties of materials are very difficult to measure, since the achievement of a state of pure shear is experimentally challenging. For composite materials, typical tests employed to extract the shear modulus and strength include the Iosipescu shear test [36], rail shear [37] and the ±45° tensile test [38]. The transverse stiffness of corrugated cardboard can be determined based on modified plate torsion tests (also called as Shear Stiffness Test) [39,40]. A different approach involving the use of research of board samples subjected to a torque was presented by [41,42]. In this case, the torque was applied dynamically (the torsion pendulum method). There are also a number of works describing the behavior of orthotropic structures subjected to static torsion [43,44]. A standardized test that involves loading a sample with a torque is called the Torsional Stiffness Test (TST).
In summary, this work delves into the intricate mechanics of corrugated board, a material paramount in global commerce and environmental sustainability efforts. While its layered structure and orthotropic nature add complexity to its mechanical analysis, it is precisely these attributes that make corrugated board a subject of significant scientific and practical interest. By focusing on a comprehensive set of laboratory tests, this study aims to accurately characterize the linear-elastic and plastic behavior of cardboard. Emphasizing the need for specific, sensitivity-tested experiments, a pragmatic approach, using homogenized models and sophisticated numerical methods to optimize the selection of tests for determining material parameters were adopted here. This approach, grounded in the principles of finite element analysis and constitutive modeling, allows for a nuanced understanding of corrugated board's behavior, addressing both its strengths and vulnerabilities. Consequently, this research contributes not only to the academic field of material science but also offers valuable insights for industries relying on cardboard, balancing the needs for durability, environmental responsibility, and economic viability.

2. Method and Materials

2.1. Selected Experimental Setup – Brief Presentation

Laboratory tests currently utilized in the cardboard industry are not explicitly used for comprehensive characterization of the corrugated board, but rather for determining certain characteristic indices that describe the material qualitatively. The aim of this work is to select the most significant laboratory tests in order to determine all important material parameters of corrugated board, therefore a certain number of tests in various configurations were analyzed. It is a priori assumed that it will not be one type of test, but rather a combination of many.
The most popular is the edge crush test (ECT), which is used to determine the ultimate compressive strength of corrugated board in the cross direction (i.e. perpendicular to the direction of corrugation). Due to the flexibility of the plates and feed mechanisms in the machines used for these tests, it is rather unlikely to determine by this test the stiffness of the material. A kind of remedy for this problem might be the use of non-contact systems for measuring strains (see [45]), however, in order to keep the set of tests simple, here the possibility of using optical displacement measurements will not be taken into account. This test, however, cannot be performed in the direction of corrugation (MD) because the specimen buckles immediately in the zone of contact between the edges and the load plates. For cognitive purposes, a new configuration is tried here in which the sample is cut and loaded in a direction rotated by 45 degrees in relation to the direction of corrugation.
Another frequently used test is the 4-point bending test, which is used to determine the bending stiffness of a cardboard sample in the direction of the corrugation (MD) and transversely to the direction of the corrugation (CD). The displacement and force applied in this test are usually small so that the measurement is not burdened with non-linearities that may come from large displacements or the effects of material non-linearity (here also the structural non-linearity - see [14]). In order to determine the maximum number of constitutive parameters of cardboard in the bending test (BNT), both displacements and forces were increased to intentionally activate the effects of material nonlinearity in the board samples.
A less frequently used test is the torsional stiffness test (TST), in which the sample is twisted relative to the central axis of the sample along MD or CD. This test is also performed on a device called dynamic stiffness tester (DST), but since it is a dynamic test, it is more difficult to control the measurements, especially when the samples are very slender, which is increasingly common in the lightweighting of cardboard compositions currently seen on the market. Therefore, a static test seems more appropriate to activate many material parameters and be able to identify them correctly.
Last but not least, the laboratory test that will be analyzed here is the shear stiffness test (SST). This is a test in which a square sample is loaded at two diagonal corners and simultaneously held at the other two corners. In this test, the greatest number of material parameters of the cardboard sample are expected to be activated in both the elastic and plastic phases. The sample can be cut from the sheet in such a way that the main material axes are parallel to the edge of the sample or to its diagonal. Both variants will be analyzed in this paper. In order to check which variant of sample cutting allows the activation of more material parameters of the cardboard, this work will analyze both orientations of orthotropic directions in the sample.
Figure 1 and Figure 2 show the dimensions of the samples in individual tests, the boundary conditions (BC) and the orientation of the main material axes in the corrugated board. In all tests, the force and displacement are measured directly at the place where the force/displacement is applied. In the real, physical test, these forces are measured directly by strain gauges, while in numerical models, in order to simplify calculations, it is usually determined as a reaction at the places where the Cauchy and/or Neumann boundary conditions are applied. In two cases (i.e. BNT and ECT) the force/displacement is applied through supports over a certain length of the sample, so the force value is the result of the integration of the reaction forces at the support of the sample:
P = 0 L p   d x .
Figure 1 presents samples in which the main material direction MD is along the longer edge of the corrugated board sample (ECT, BNT and TST) or along one of the edges of the sample (SST). Figure 2 presents samples in which the main material direction MD is along the shorter edge of the corrugated board sample (BNT and TST) or in a direction rotated 45 degrees relative to one of the edges of the sample (ECT and SST).
The above presented list does not exhaust the full list of tests performed in paper and cardboard laboratories. However, it is assumed that the experimental setups selected and described above will together create a sufficient list of laboratory tests necessary to identify all the necessary material parameters of corrugated board required for its proper mechanical characterization.

2.2. Numerical Models

Since the aim of the work is to develop a strategy for carrying out experiments, despite the authors’ numerous experience in the field of experimental research [], the analyzes presented below are based on the results of numerical experiments. At this stage of our research, we are solely assessing the utility of selected tests in identifying the effective material parameters of corrugated board by examining the sensitivity of measurable values from the test to changes in the sought parameters. For this purpose, numerical models, which are easy to execute for a large population of different cases, are most commonly employed. The numerical models were built using the finite element method, while all computer simulations were carried out using simplified flat models, i.e. without detailed mapping of the complex structure of corrugated board and its individual layers. Thanks to this, the selected constitutive model and its individual parameters are activated in the model at the level of the homogenized board, and not at the level of individual component papers. This type of simplification is widely used not only among scientists involved in modeling corrugated board [46,47] but also in the practical application of computational models in the corrugated board packaging industry [48].
All numerical models use a four-node shell element with full integration (described in the ABAQUS program as a element S4). The finite element dimension was assumed to be approximately 2 mm in all cases as a compromise between the quality of results and the speed of analysis. As a result of mesh sensitivity study, it was observed that reducing and increasing the finite element by even 50% causes a change in the registered forces and displacements by only 2-3%. Because the sensitivity of the mesh in the analyzed examples is relatively low, and more importantly, the accuracy error associated with the finite element size is systematic, which means that it does not affect either the qualitative or quantitative estimation of the sensitivity of the results of numerical analyzes with respect to changes in individual material parameters. In other words, the size of the mesh has a marginal impact on the analyzes performed, which is why the results related to the sensitivity of the mesh are omitted in the description of the numerical models.
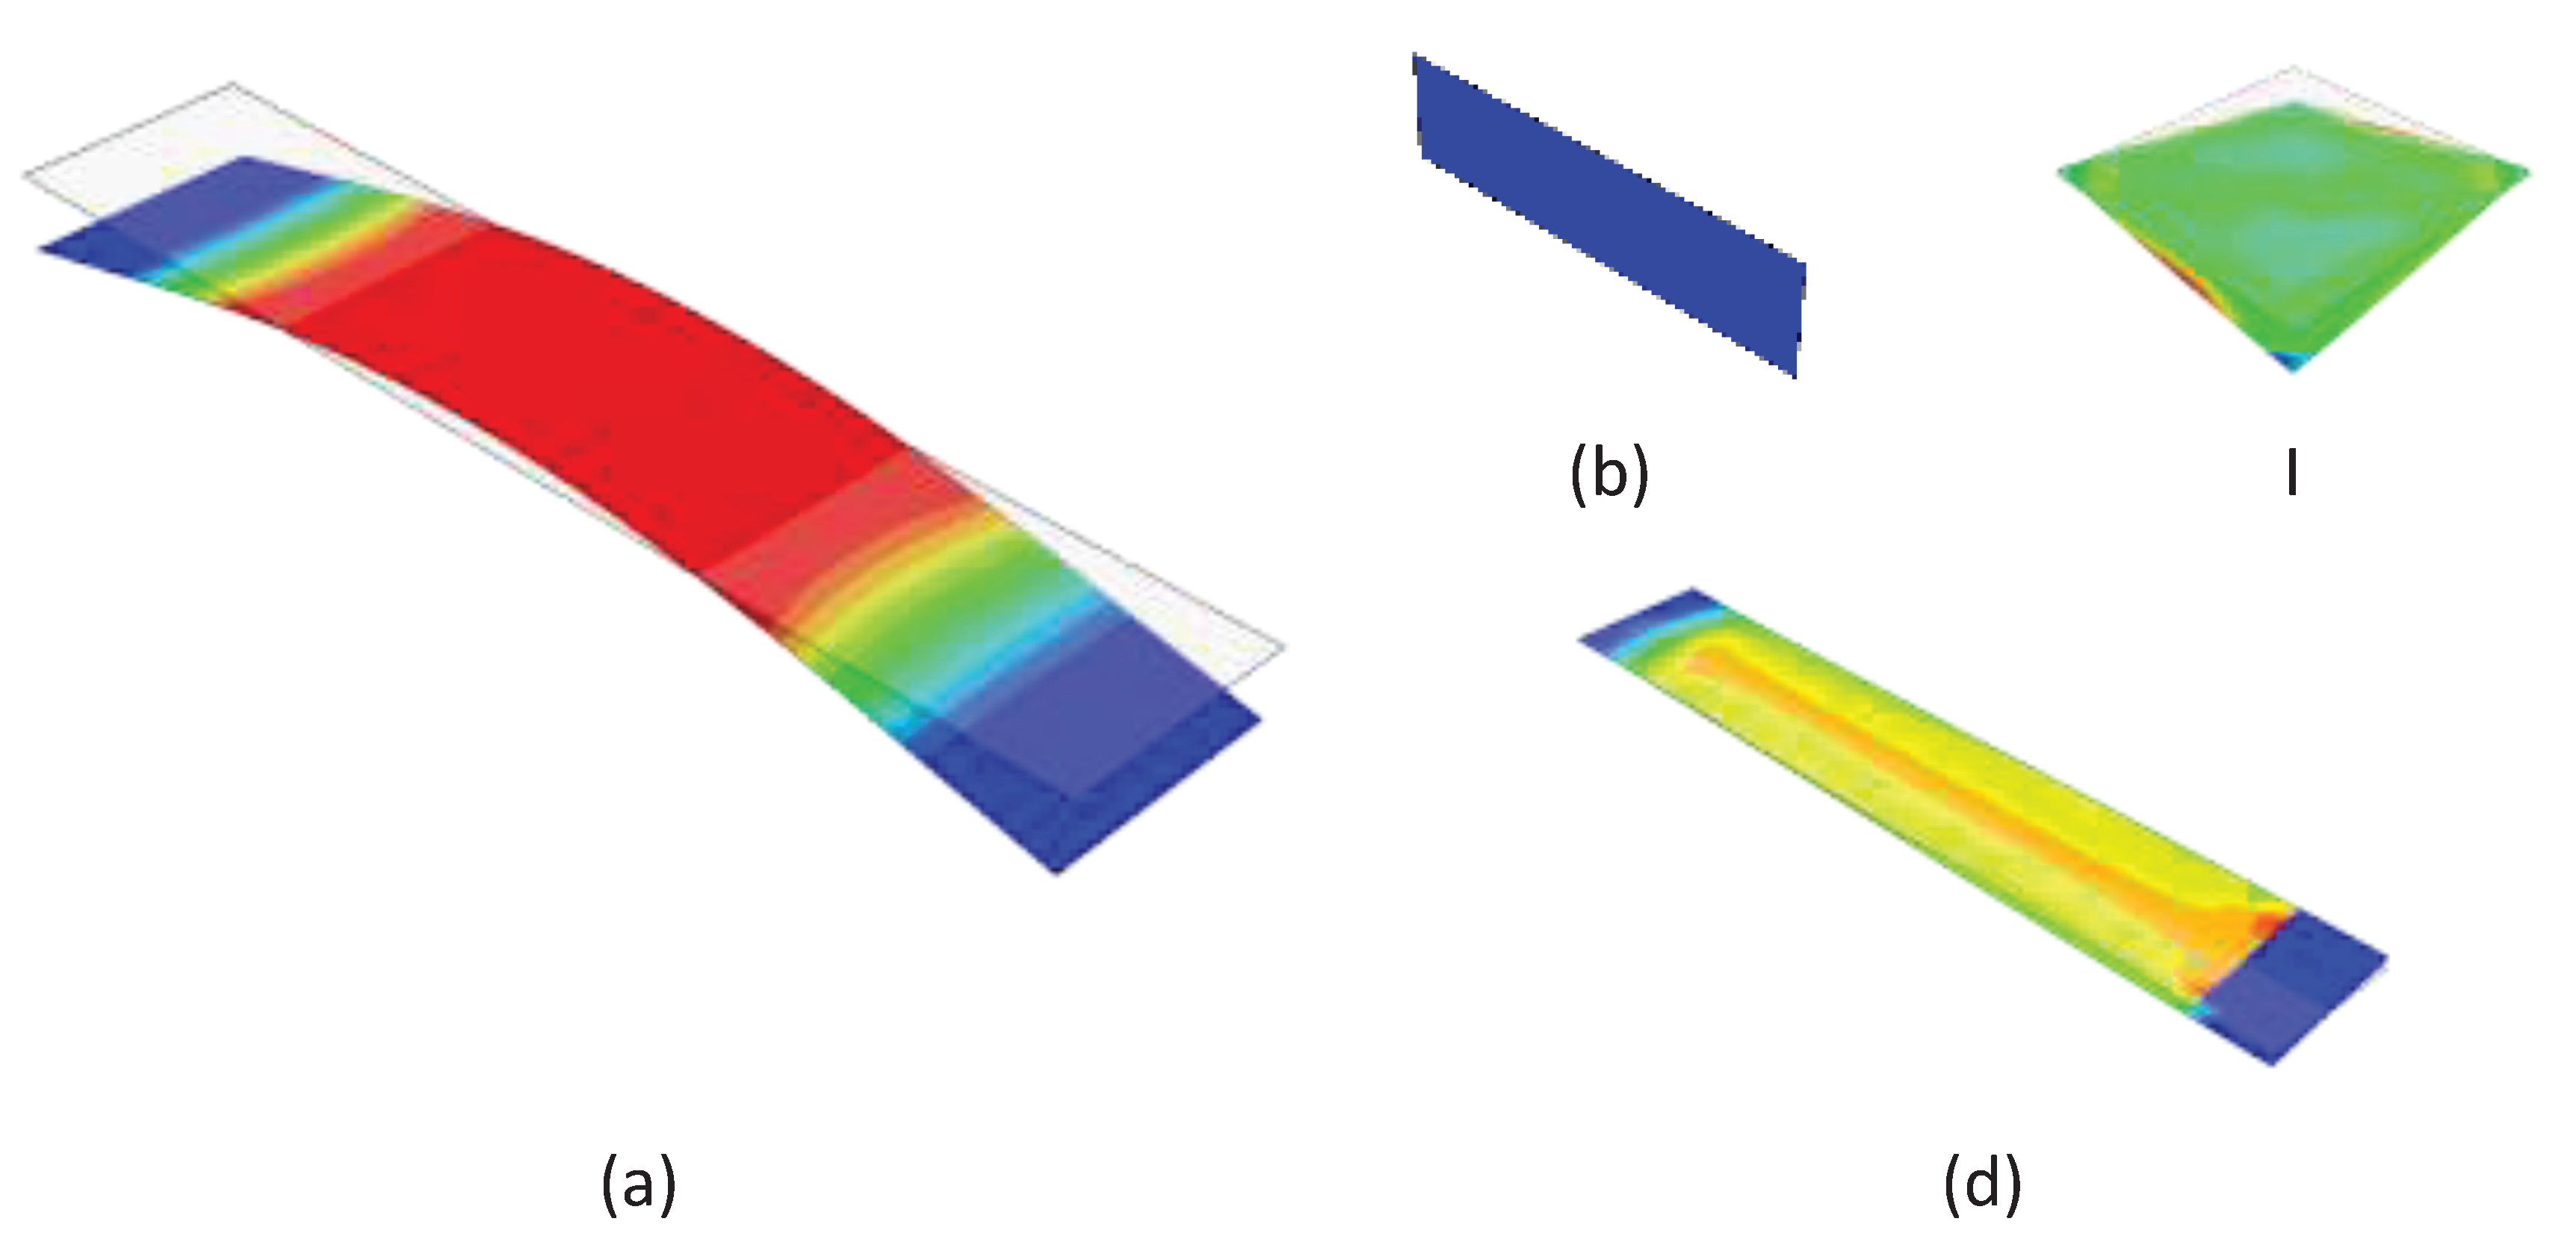
Figure 3 shows the homogenized corrugated board samples during the simulation of individual laboratory tests. In each case (see Figure 3a–d), the equivalent Mises stress is shown.

2.3. Constitutive Modelling of Corrugated Board

It is generally known that paper is an orthotropic material with a clear asymmetry of the yield stress during compression and tension in all main material directions. Both in the direction of the fibers and across it, when stretched, the paper is almost twice as durable as when compressed. This is certainly related to the small thickness of the sample and, consequently, to the effects of local buckling of cellulose fibers in the paper structure. Identical effects (although of different scale) are noticeable when stretching and compressing corrugated board.
This means that on a macro scale, i.e. analyzing corrugated board as a material composed of one layer only with homogenized mechanical properties and average thickness – it can be described by similar constitutive models as paper. For orthotropic materials in a plane stress state, the relationship between elastic deformation and stress is as follows:
ε 11 ε 22 2 ε 12 2 ε 13 2 ε 23 = E 1 1 ν 21 E 2 1 0 0 0 ν 12 E 1 1 E 2 1 0 0 0 0 0 G 12 1 0 0 0 0 0 G 13 1 0 0 0 0 0 G 23 1 σ 11 σ 22 σ 12 σ 13 σ 23 ,
where: E 1 – Young's modulus in the machine direction, E 2 – Young's modulus in the cross direction, G 12 – Kirchoff's modulus in 1-2 plane, ν 12 , ν 21 – Pois’on's ratios in 1-2 plane, while G 13 and G 23 – transverse shear moduli in 1-3 and 2-3 planes, respectively. Due to the symmetry of the material compliance matrix, the relationship between Pois’on's ratios is as follows:
ν 12 E 1 = ν 21 E 2 ,
Many different models can be chosen to describe the behavior of paper in the inelastic phase, e.g., Hill [19], Hoffman [23], Xia [24], Tsai-Wu [49,50] and many others. All mentioned criteria with greater or lesser simplification describe the plasticity yielding and plastic flow rule in thin orthotropic laminates. Here the Hoffman criterion is utilized. It is considered as an extension of the Hill criterion with the ability to capture not only orthotropic behavior but also the difference between plastic yielding in main orthotropic directions during tension and compression. The Hoffman plasticity criterion can be written as:
f = 1 2 σ T P σ + q T σ 2 σ y 2 ,
where σ y is a reference strength (assuming no hardening/softening), which can be determined experimentally; while the stress vector in the 1-2 (or MD-CD) plane in Voight notation is defined as σ = σ 11 ,   σ 22 ,   σ 12 T . It is important that the subscripts 11 and 22 refer to the in-plane directions, MD and CD, whereas the subscript 12 refers to the in-plane shear direction. The orthotropic plastic matrix, P , in equation (4) describes the anisotropy of the material. The P matrix can be written as
P = 2 R 1 2 2 R 1 2 0 2 R 1 2 R 2 2 0 0 0 3 R 12 2 ,
where R 11 , R 22 , R 12 are the ratios of plastic stresses in the directions 11, 22 and 12, respectively, with respect to the reference yield strength σ y (here it is assumed that the reference direction is 22 and the out-of-plane ratio, R33, equals one, which leads to R 22 = R 33 = 1 ). The q vector is characterized by differences in plastic stresses in tension and compression according to:
q = 2 σ 01 + σ 01 R 1 2 σ 02 + σ 02 R 2 2 0 ,
where σ 0 i + and σ 0 i ( i = 1 ,   2 ) are the tensile and compressive yield strengths, respectively, in MD ( i = 1 ) or CD ( i = 2 ). It is worth noting that assuming q = 0 , equation (4) reduces to the classic Hill plasticity criterion. More details, along with a description of the implementation, can be found in [25,51].

2.4. Sensitivity Analysis

Sensitivity analysis is an excellent tool to study which model parameters have the greatest impact on the change in recorded measurements. In the analyzed case, one of the variables, i.e. the thickness of the homogenized corrugated board, was the only parameter chosen a priori without monitoring its sensitivity. Although this is not a global approach, it allows checking the sensitivity of selected measurable quantities (from various laboratory tests) to small perturbations in the material parameters of samples of different thicknesses. Here the three values of thicknesses of corrugated board are assumed: 1.5 mm, 3.0 mm and 4.5 mm, which correspond to three popular types of flute, namely E, B and EB (i.e. the most typical types of cardboard available on the market).
In the case of selected laboratory tests (already described in Section 2.1), i.e. ECT, BNT and SST, these measurable quantities recorded by the laboratory devices are: force, P (N) and displacement, u (mm); in the case of the TST it is the moment, M (Nmm) and angle of rotation, θ (rad). In order to find a reliable scalar-value for a clear and easy assessment of changes in the measured quantity resulting from changes of individual parameters, integrals from corresponding force-displacement or moment-rotation diagrams were used to determine the sensitivities in all tests. This is only possible if the argument on one of the axes (in this case - the x-axis, which here represents displacement or rotation) is fixed for measurements made both using a model with reference parameters and a model with a certain (relatively small) perturbation of one of these parameters. Therefore, in computational models, simulations of laboratory tests were always carried out using the displacement (or rotation) control. All material parameters used in these study were taken from our previous research for representative thin, medium and thick boards [52,53].
The normalized sensitivities of individual tests can be determined parameter’s using the formula:
s i = 1 Δ F ( y , x i ) d y F y , x d y 1 ,
where s i represents the normalized sensitivity of the i-th parameter in selected test (i.e. ECT, BNT, SST or TST); i denote the i -th parameter; F = P (in case of ECT, BNT and SST) or F = M (in case of TST); y = u (in ECT, BNT and STS) or y = θ (in TST); Δ is a percentage change in parameters, and x is a vector, which combines all parameters, i.e.:
x = E 1 , E 2 , ν 12 , G 12 , G 13 , G 23 , T 1 , T 2 , C 1 , C 2 , τ 12 T ,
while x i is a vector of parameters similar to x , but with selected (i-th) parameter perturbated by a constant value Δ .
In this approach, first the i-th parameter is perturbed by a small value, e.g. 1% (represented by Δ) and then the ratio of the integral of F ( y , x i ) with the perturbed parameter to the integral of F ( y , x ) with the original parameters are calculated. This ratio gives an indication of how much the output (force or moment) changes in response to the perturbation in the parameter. Finally, dividing by Δ normalizes this sensitivity measure, allowing for comparison across different parameters and tests.
This normalized sensitivity measure is advantageous as it provides a dimensionless quantity that directly quantifies the relative change in the output for a given relative change in a parameter, making it easier to interpret and compare the sensitivities of different parameters and tests.

3. Results and Discussion

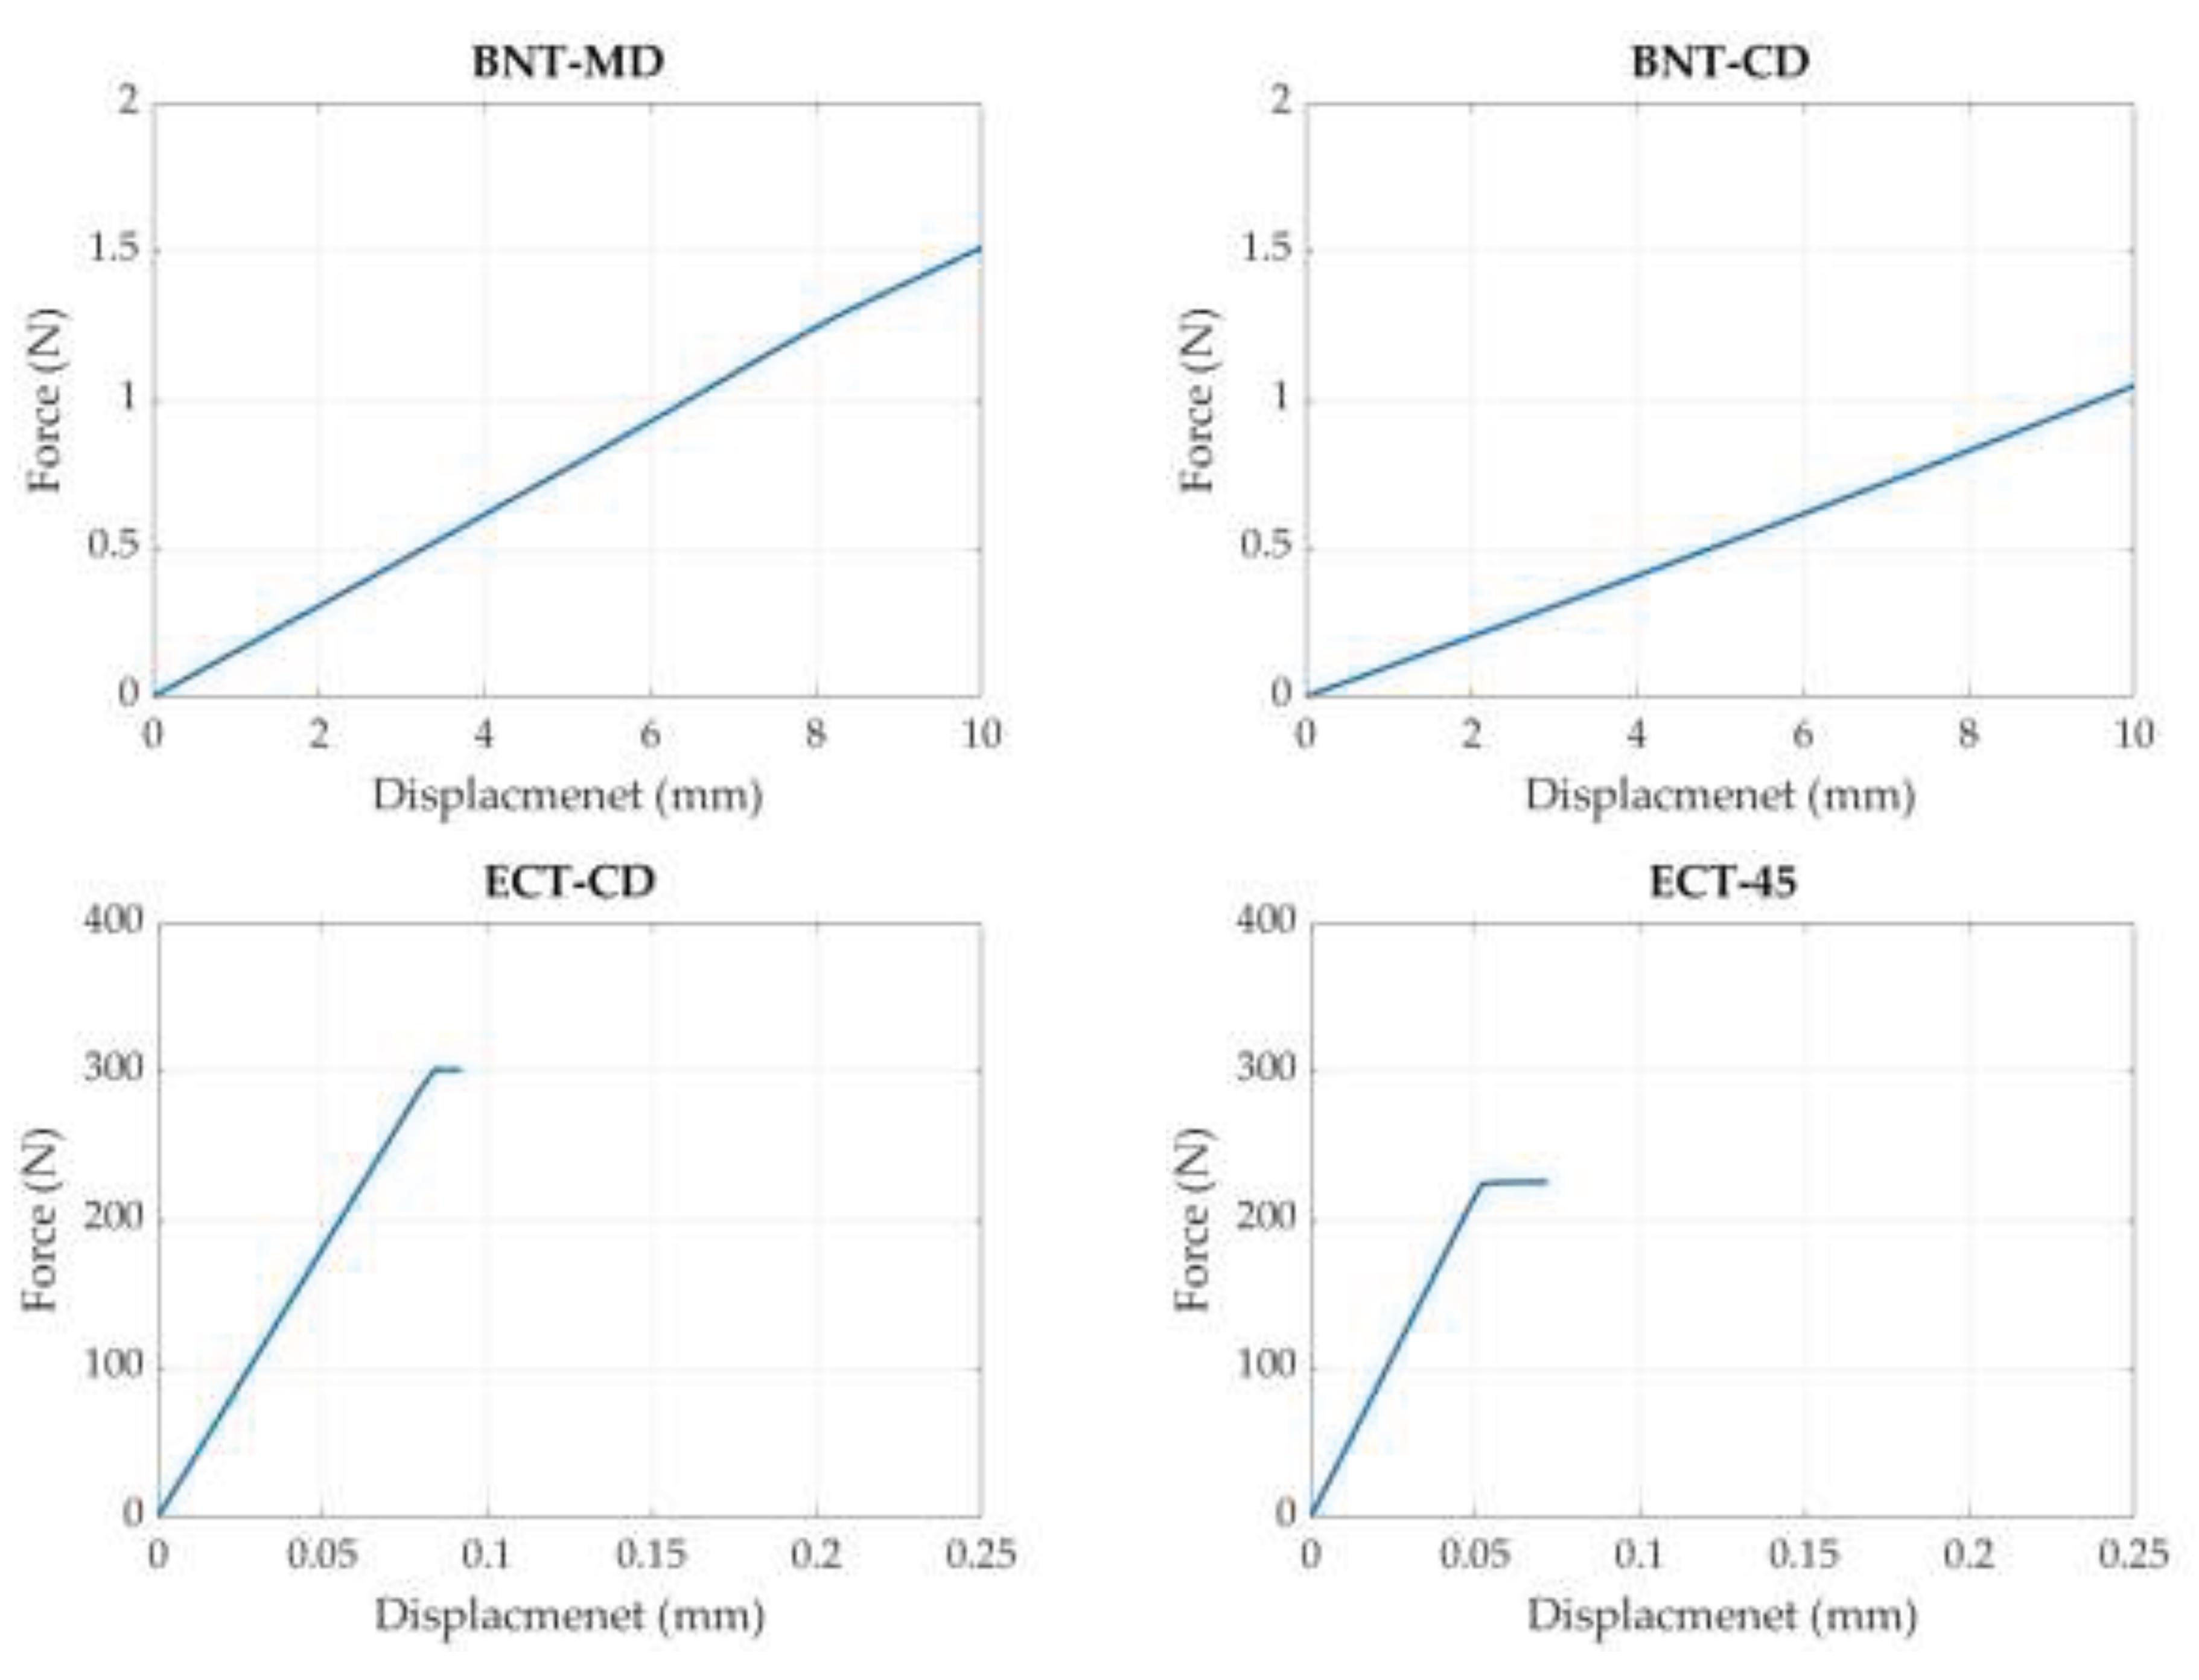
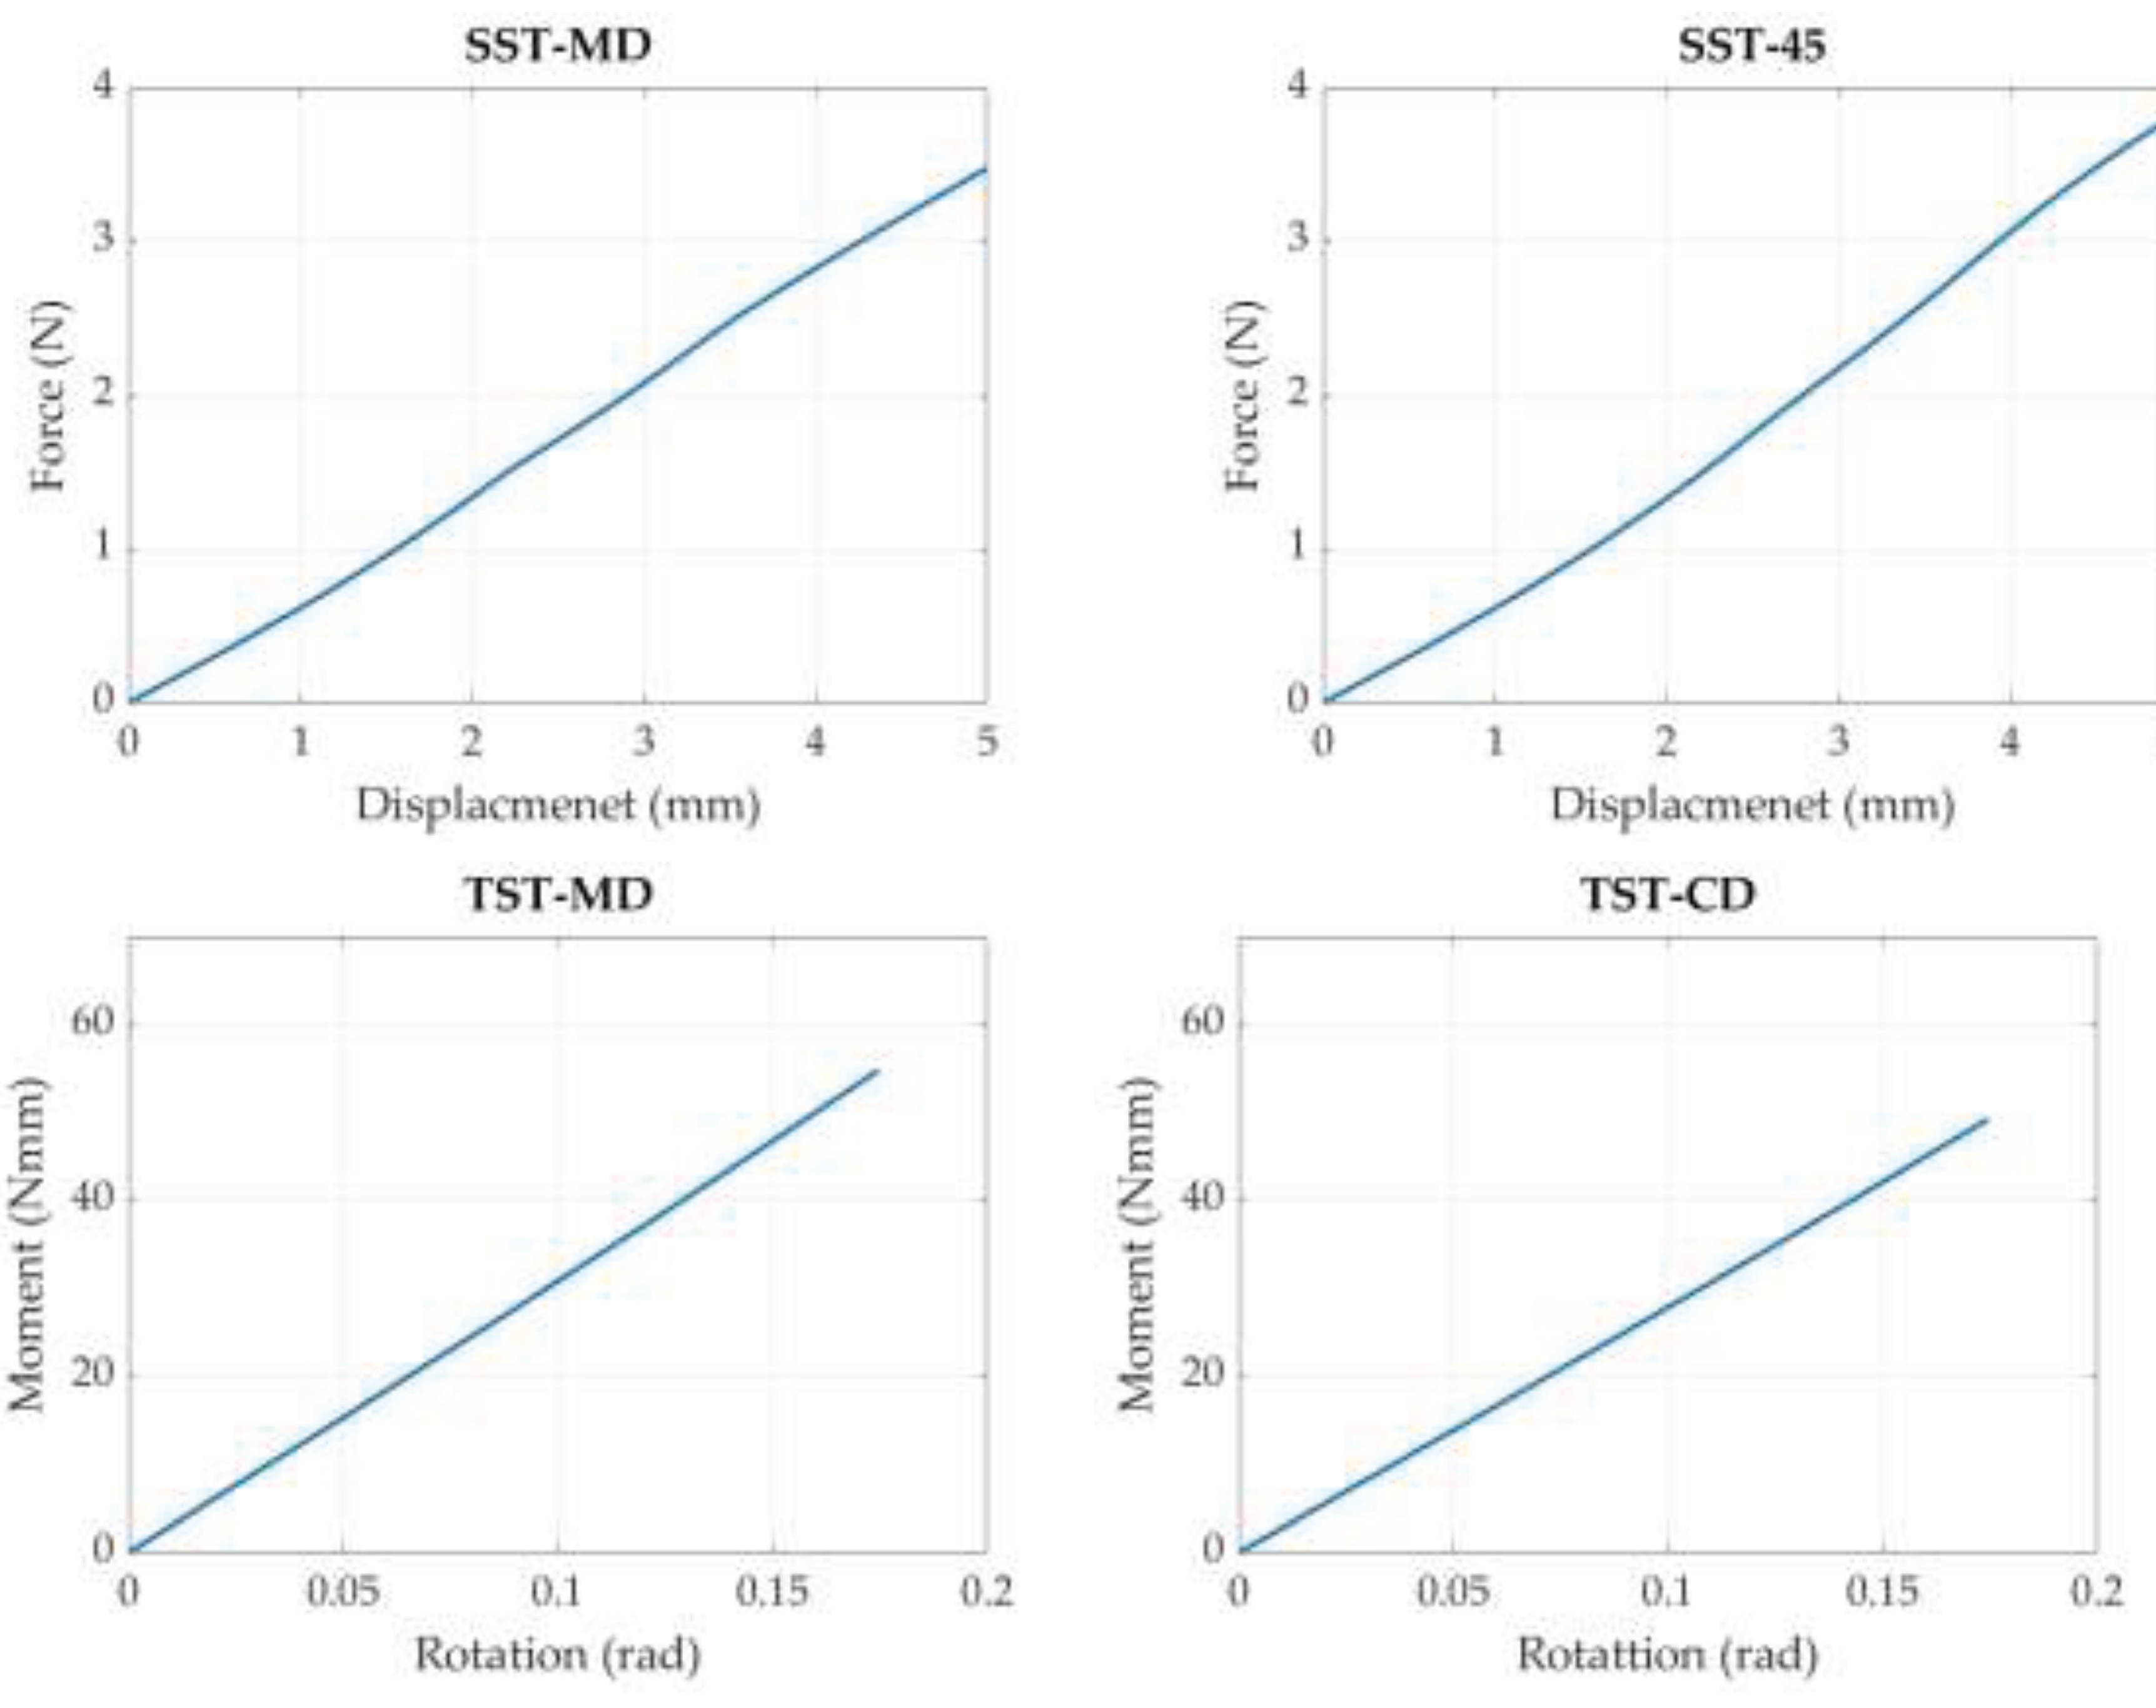
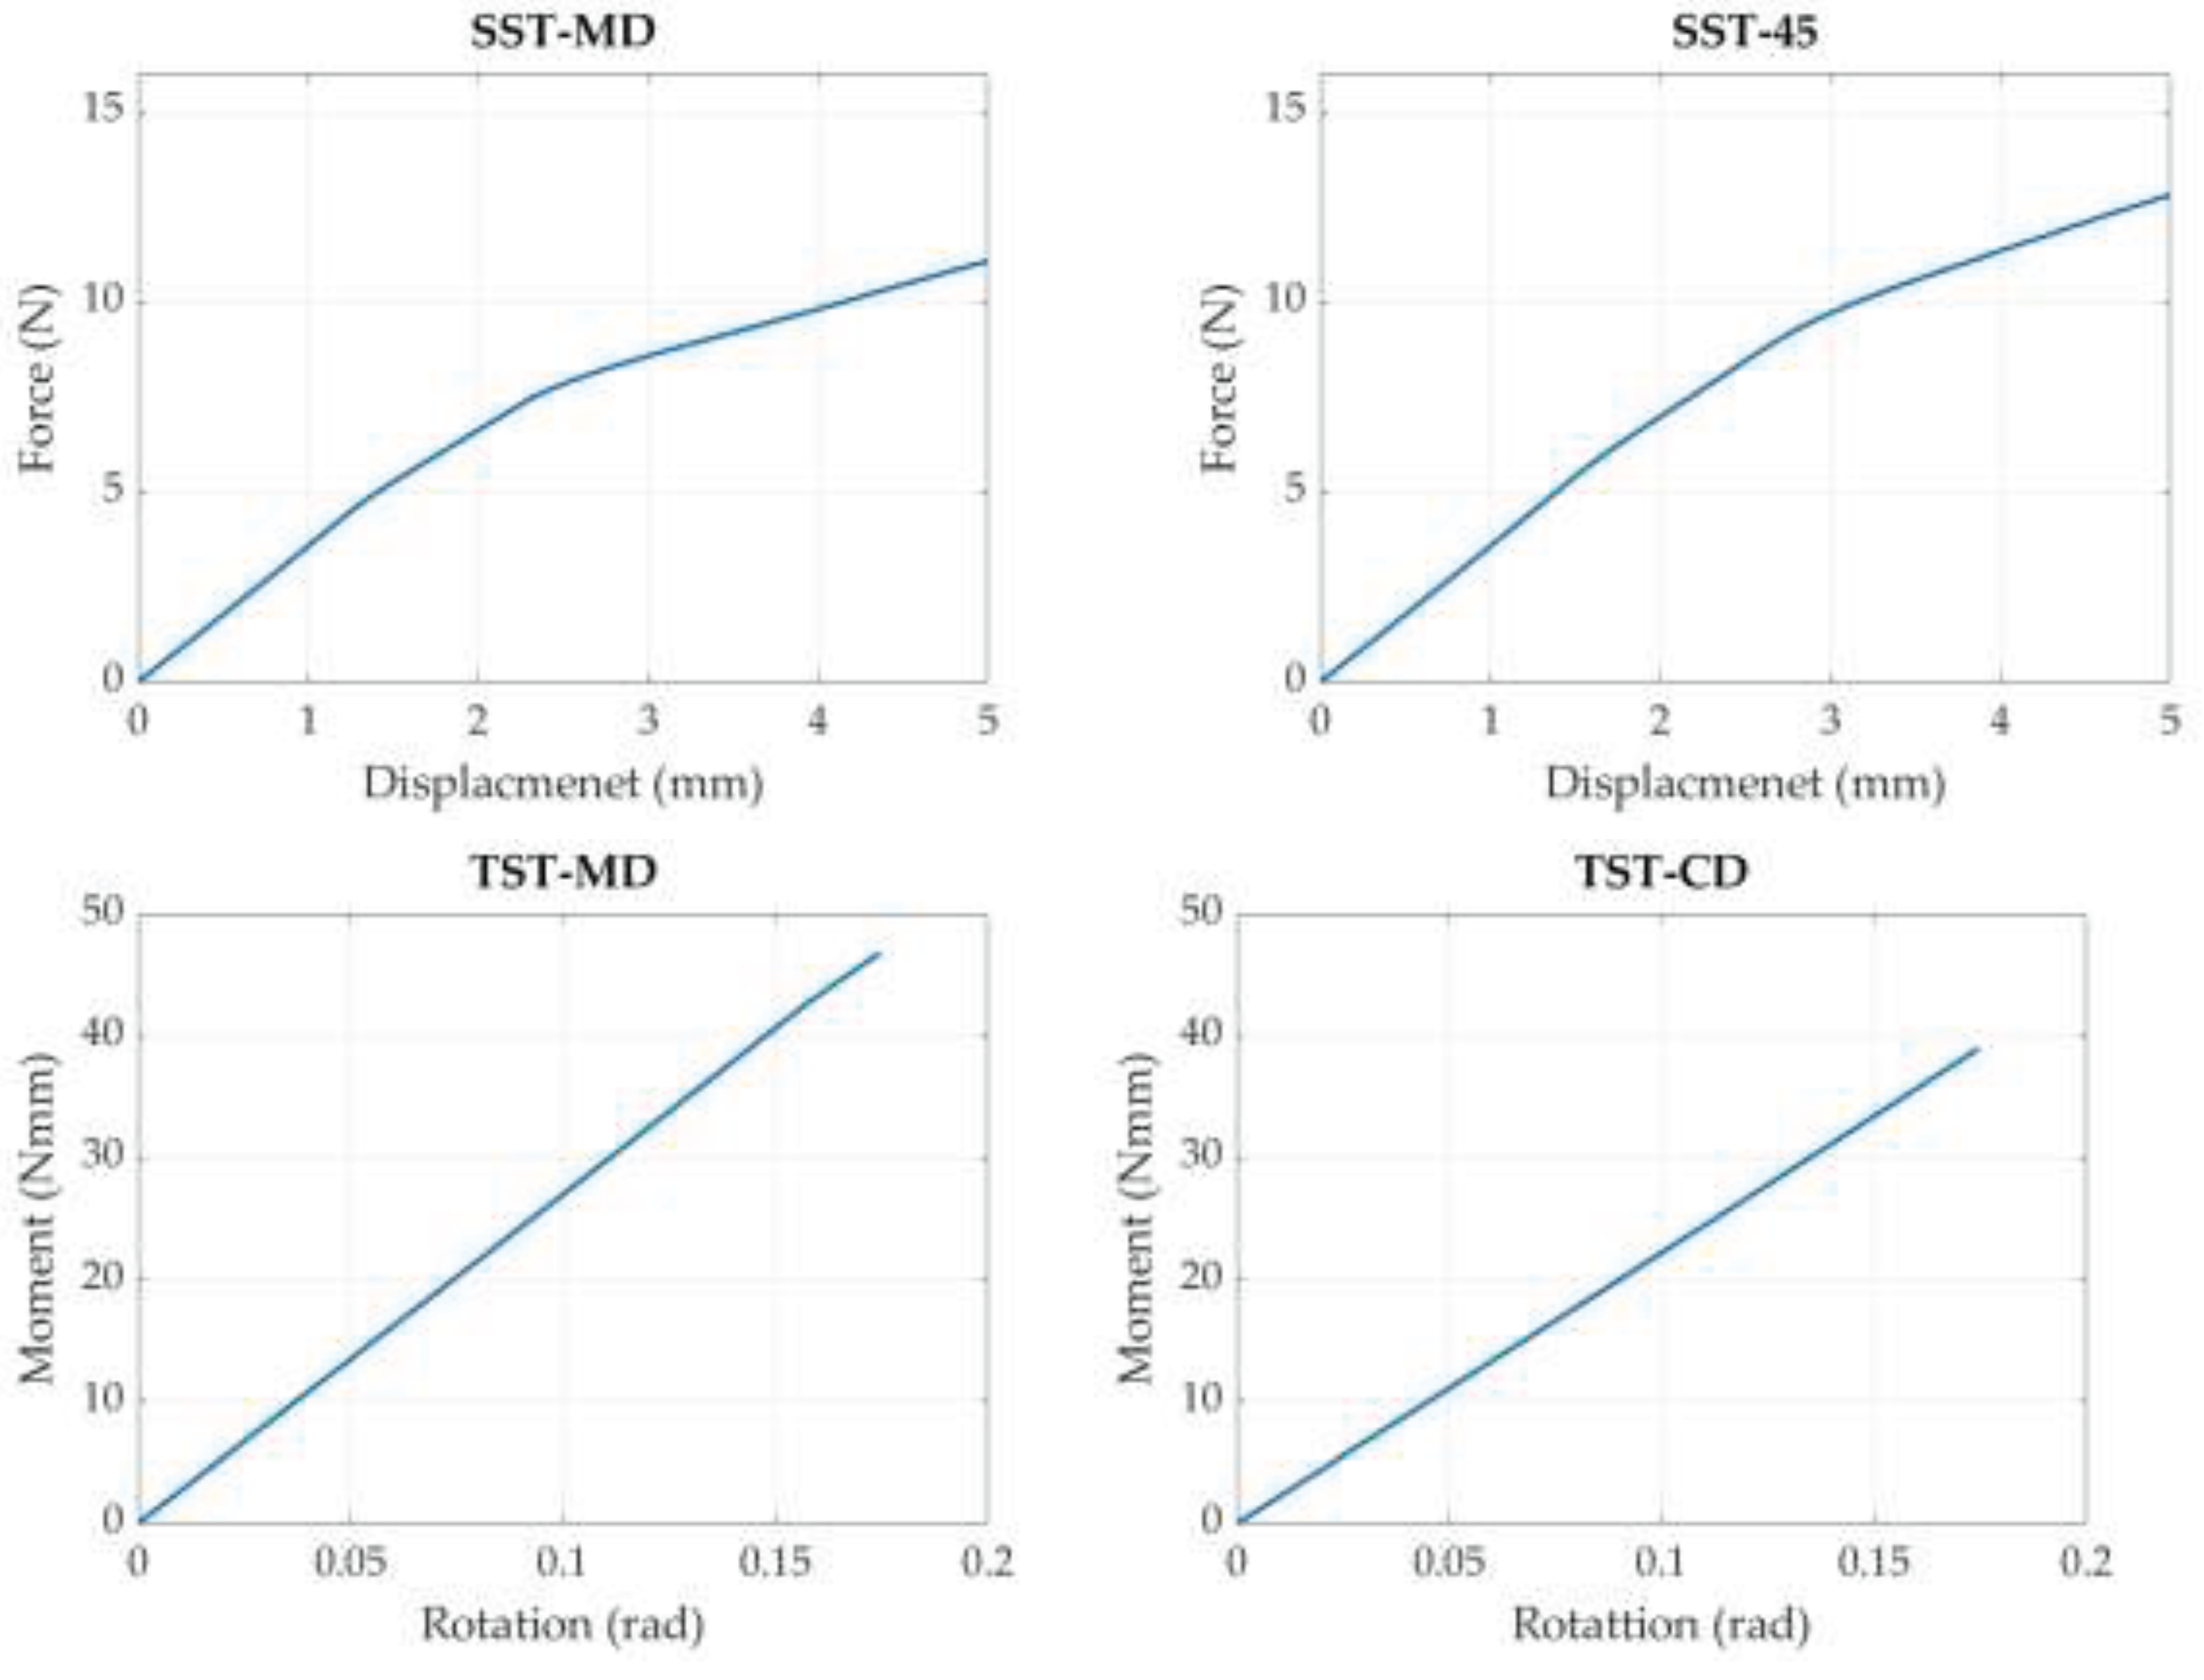
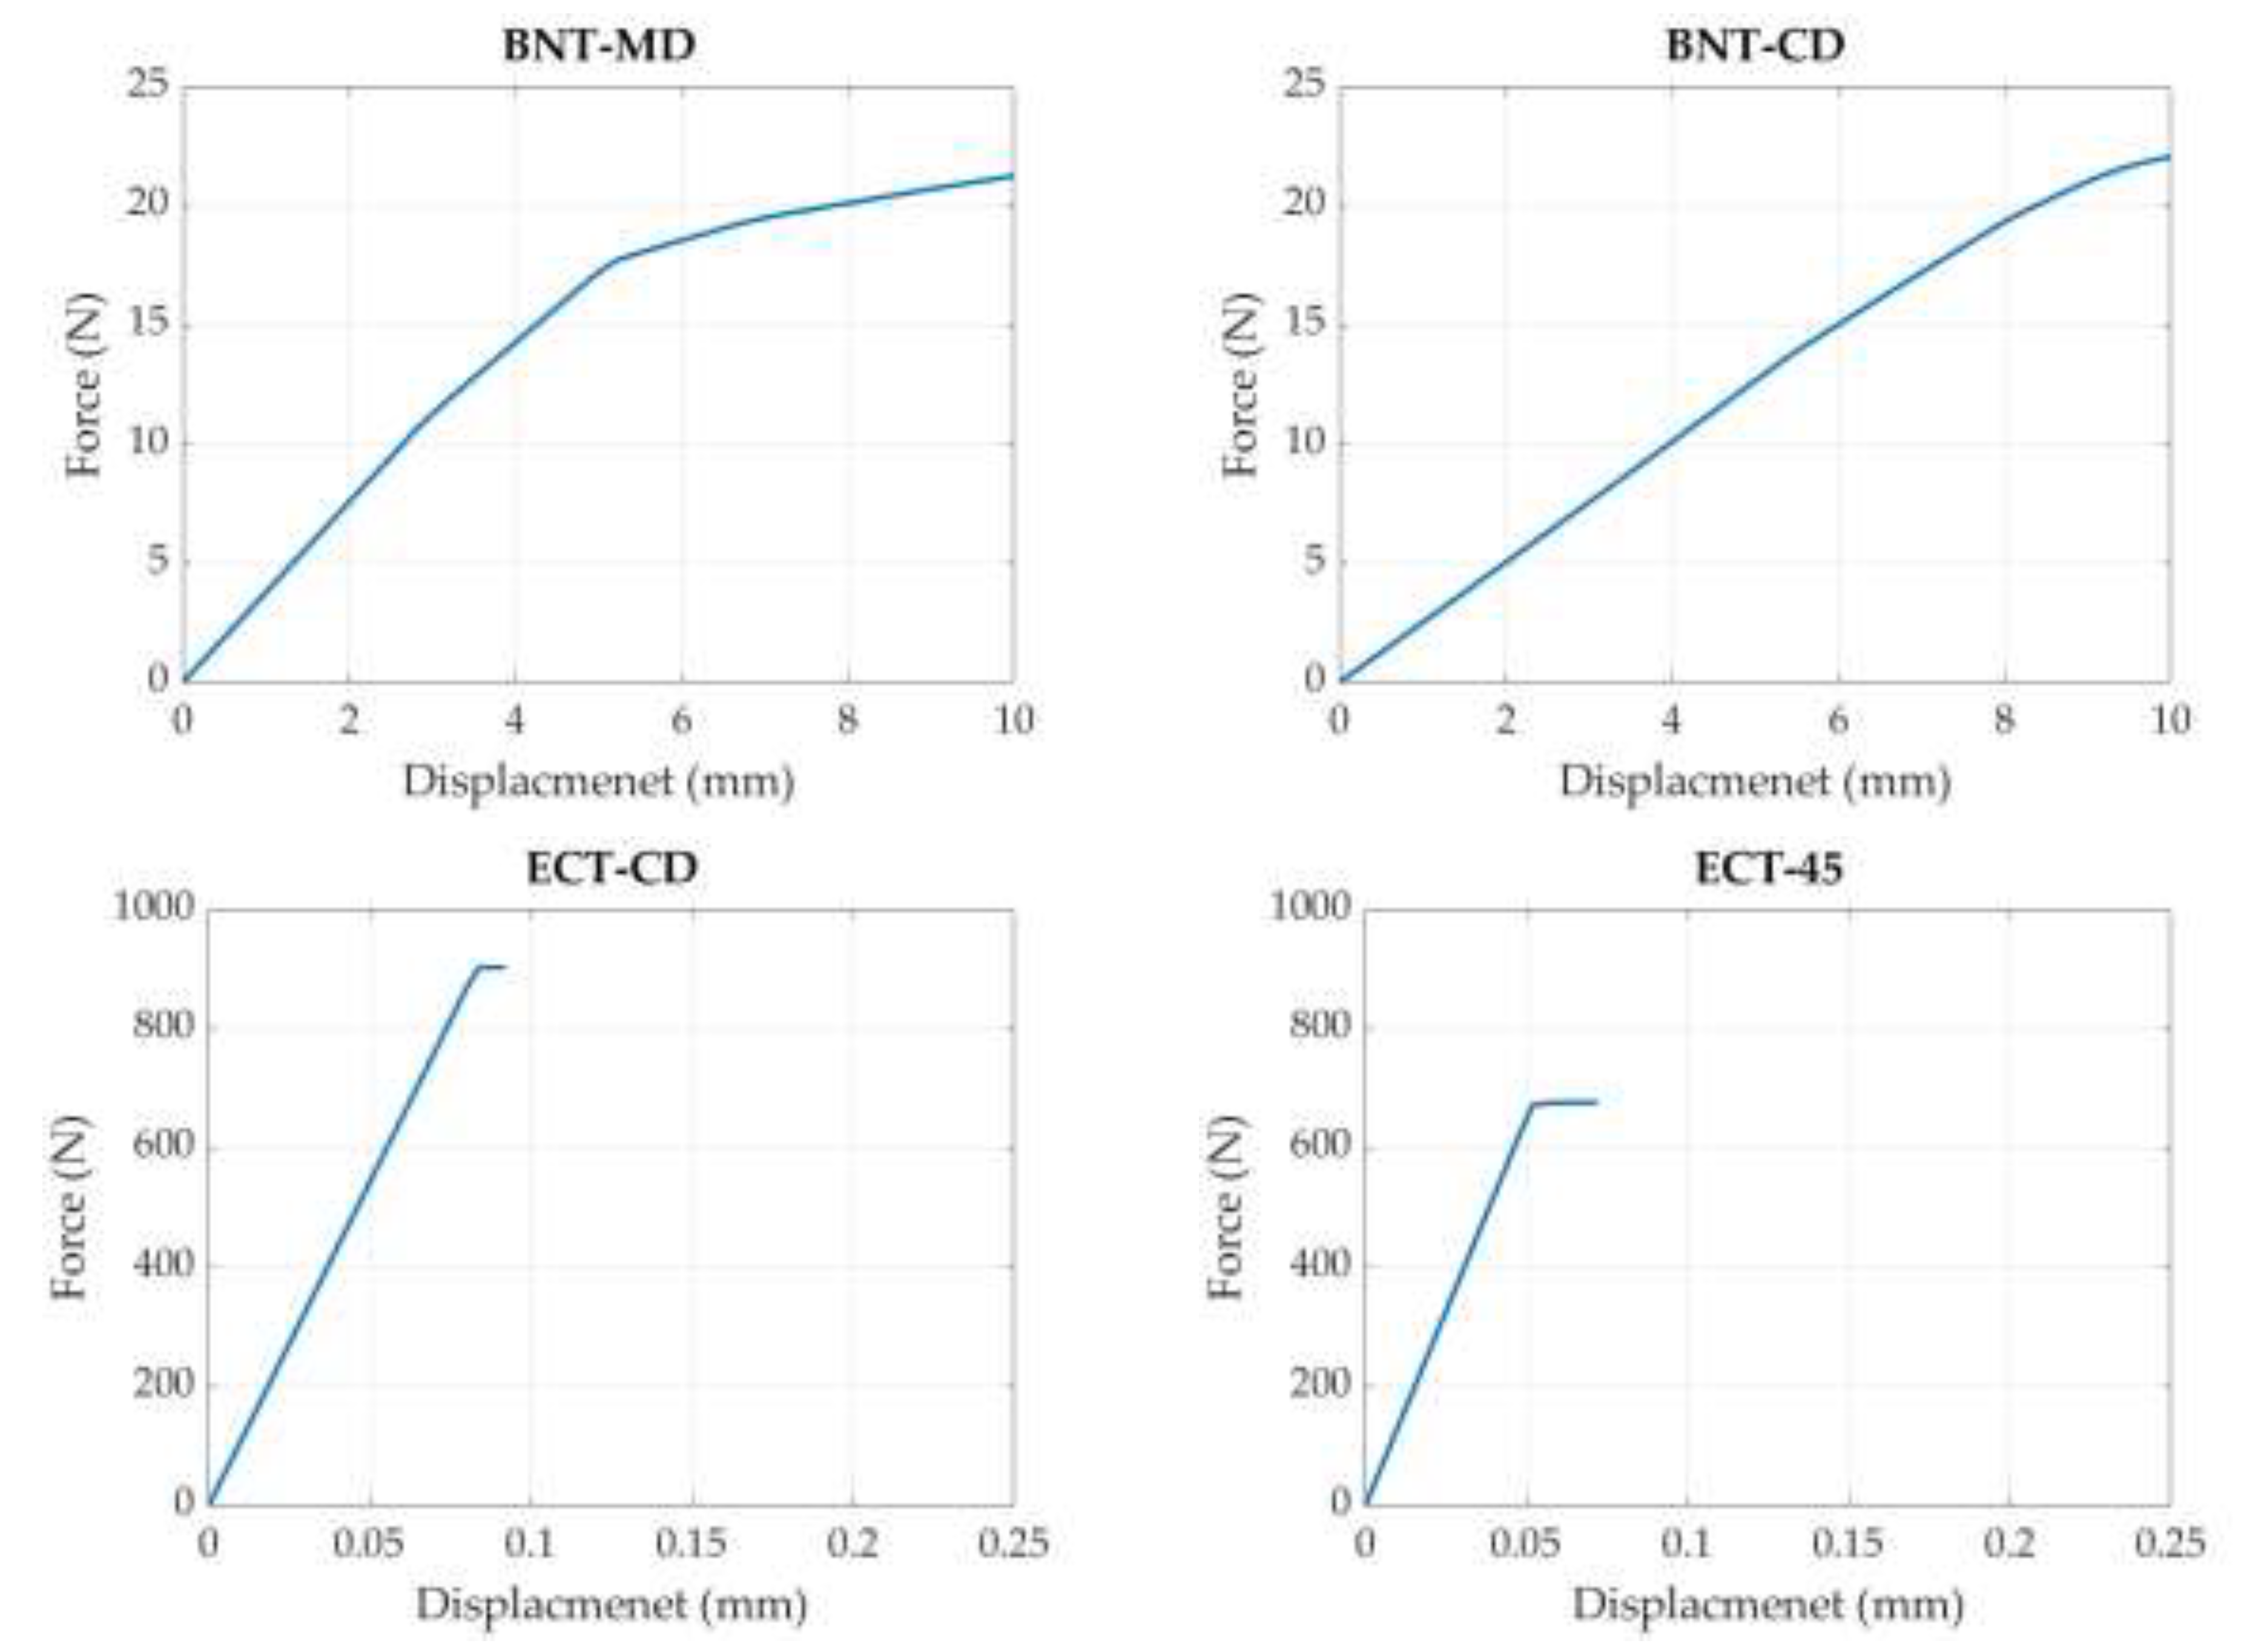
Figure 4, Figure 5 and Figure 6 show the force-displacement and moment-rotation curves for corrugated board samples of different thicknesses (thin, medium, thick) under various tests. These figures effectively illustrate the mechanical behavior of the board in response to different types of loads, such as bending, shearing, and torsional forces. The curves provide insights into the material’s stiffness and strength characteristics, aiding in understanding how corrugated board behaves under different stress conditions and how its mechanical properties vary with thickness.
The nonlinear character of most curves in Figure 4, Figure 5 and Figure 6 indicates the activation of material nonlinearity in corrugated boards of varying thicknesses under different stress conditions. This nonlinearity in the force-displacement and moment-rotation relationships is a crucial insight, revealing the complex mechanical behavior of the material beyond linear elastic responses, particularly under higher loads or specific stress states. This characteristic is essential for understanding the real-world performance of corrugated board in various applications.
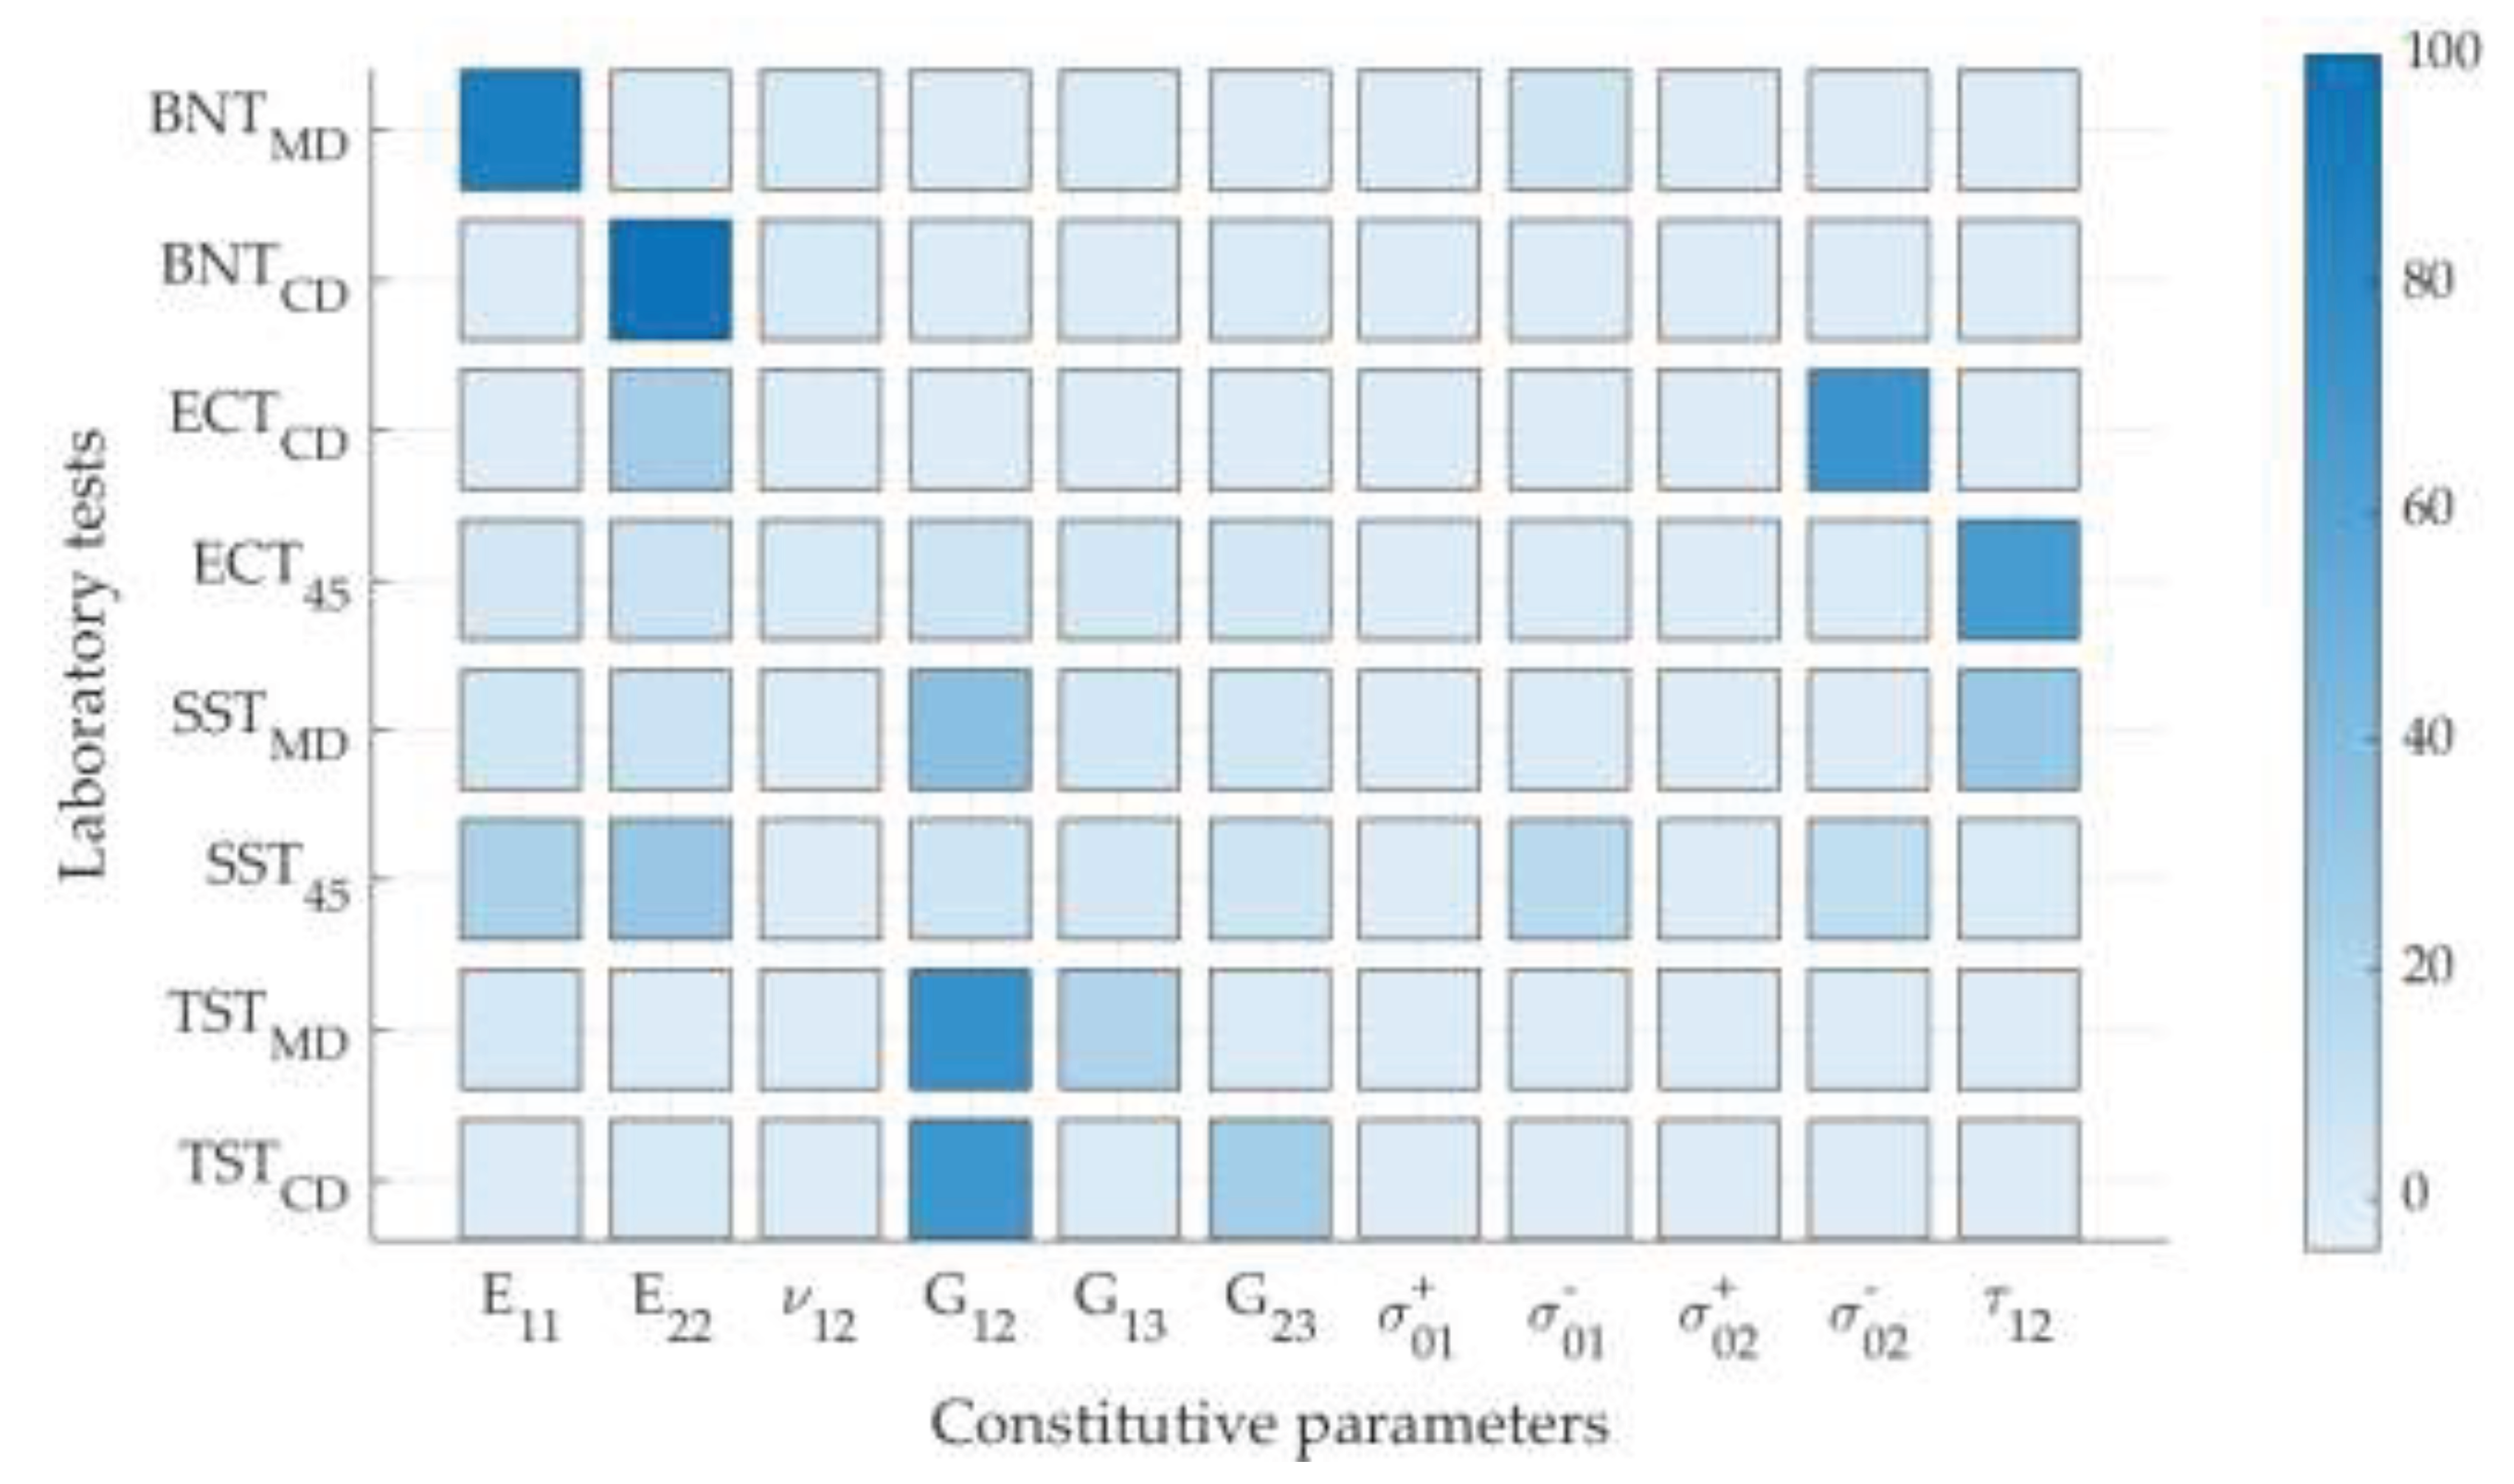
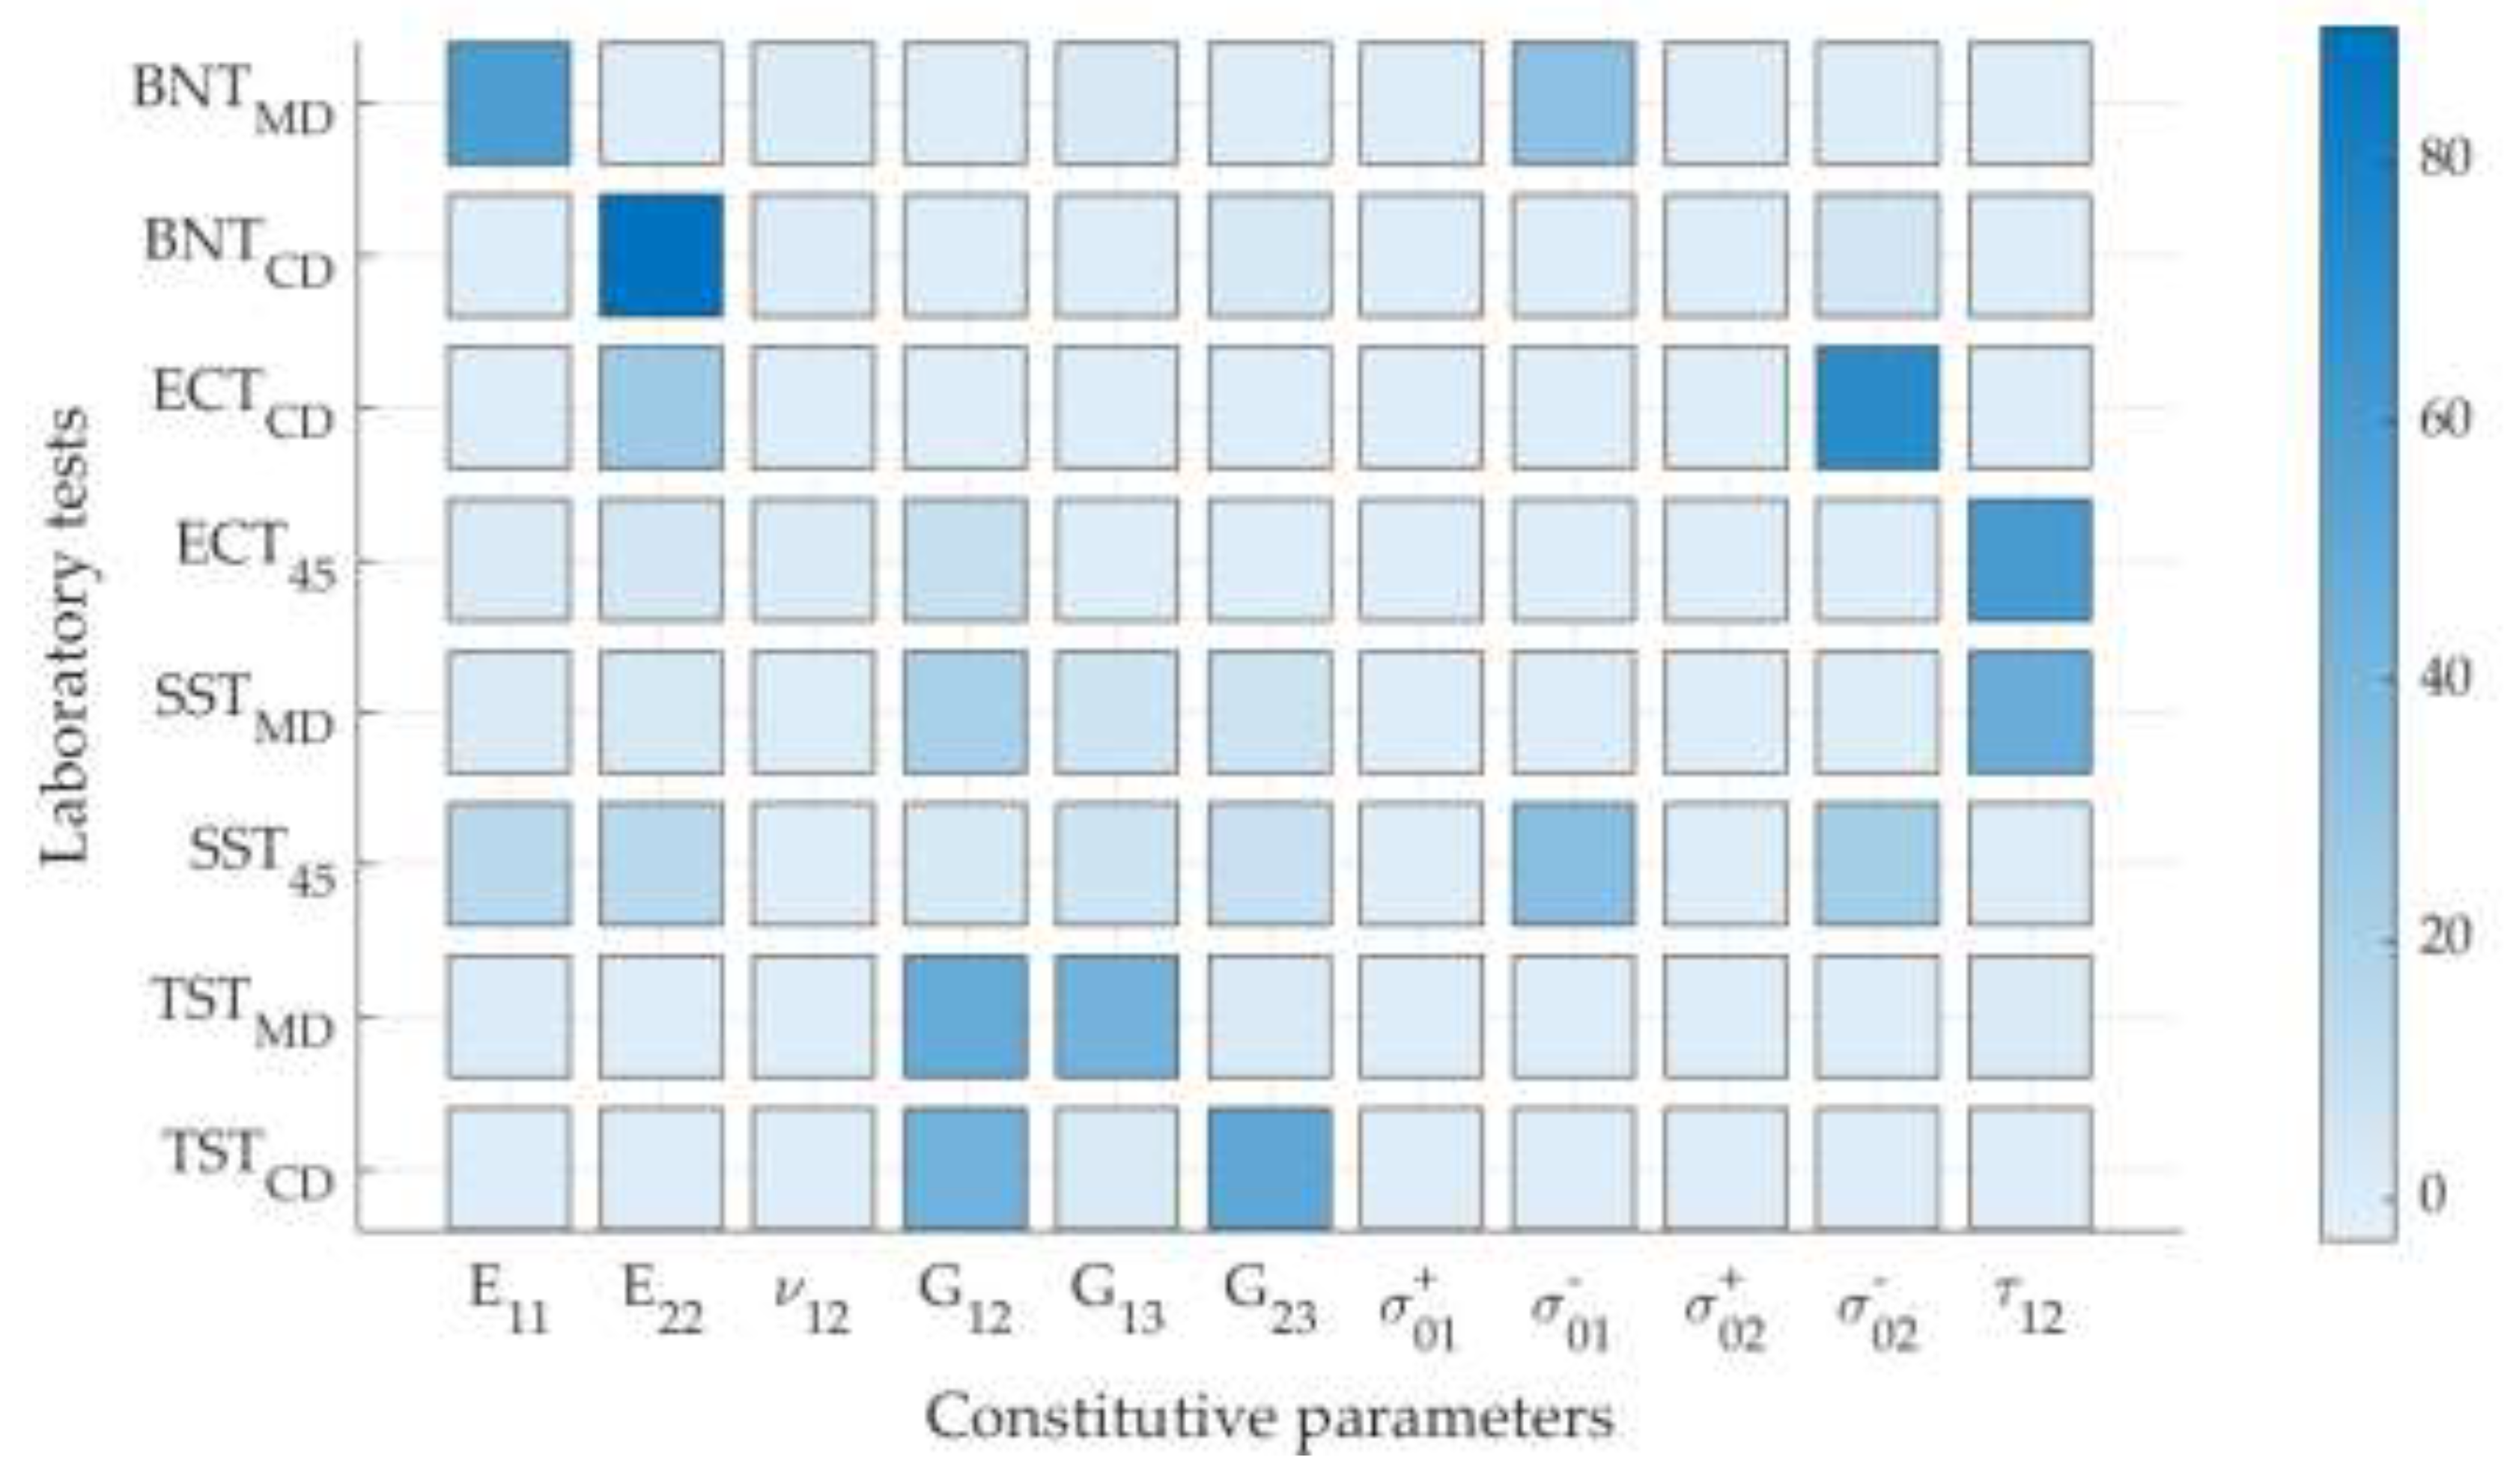
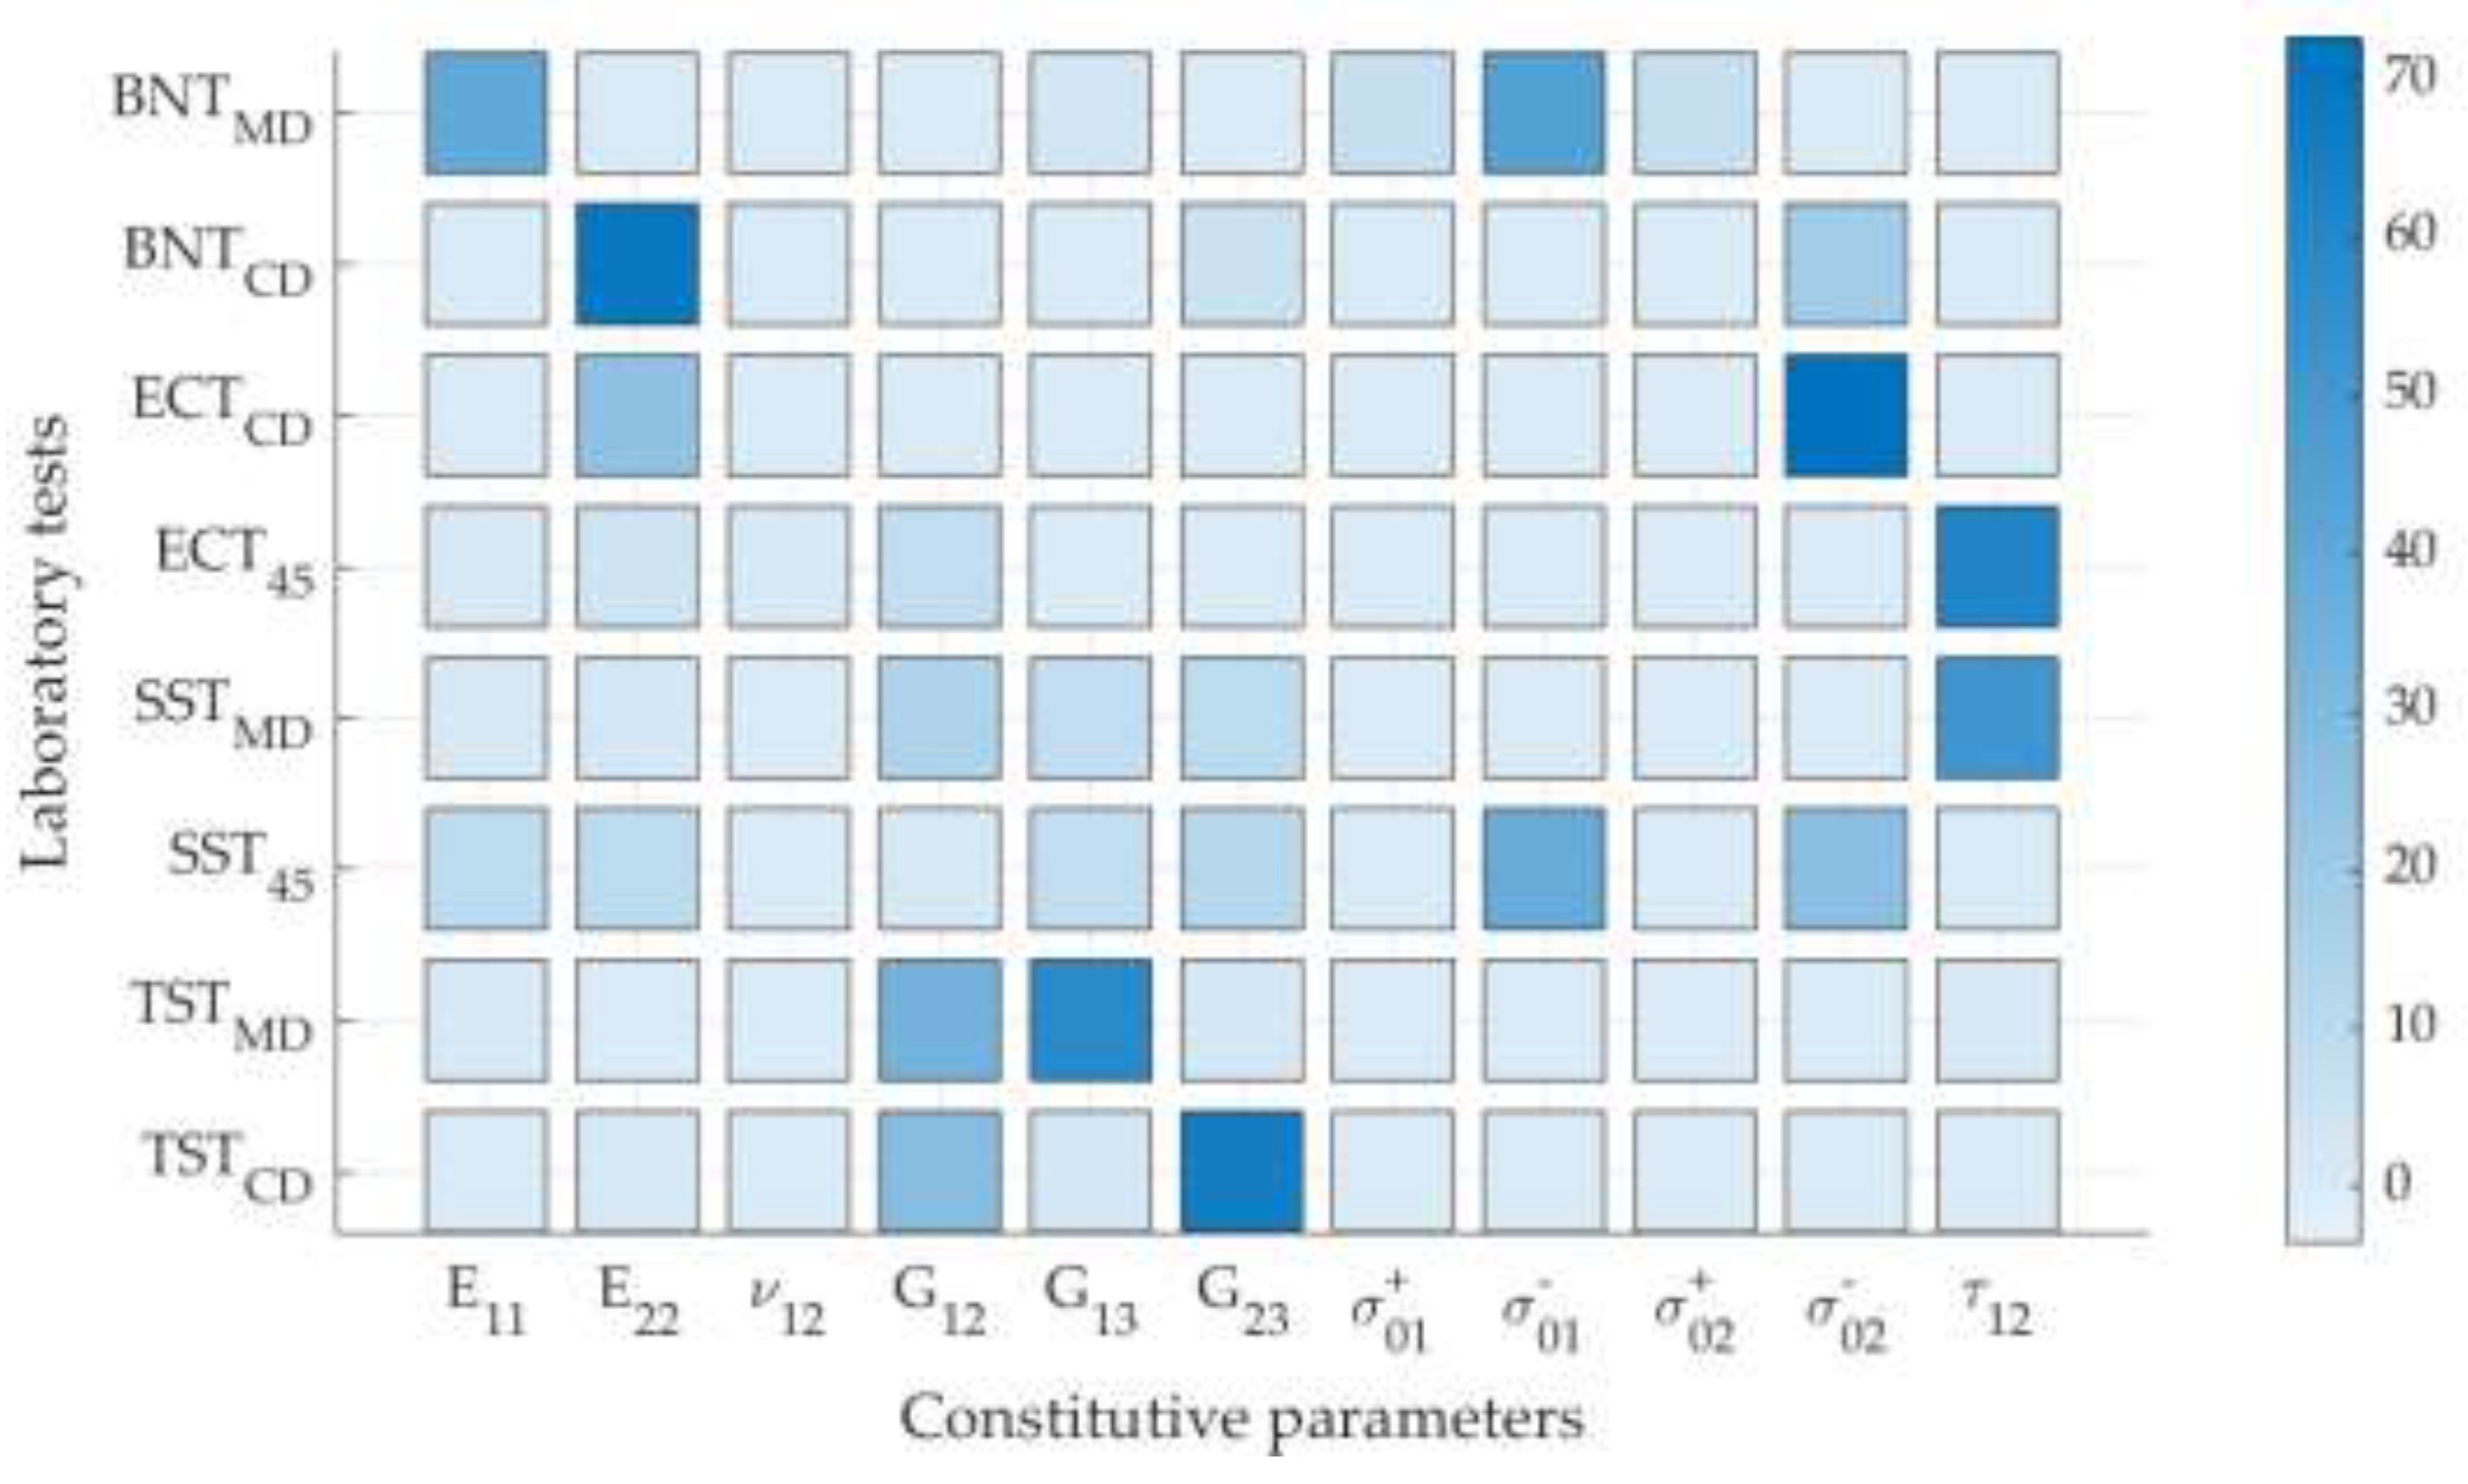
In the mechanical characterization of corrugated boards with varying thicknesses, specific tests have been identified as optimal for determining material properties, along with their corresponding sensitivity values from Table 1, Table 2 and Table 3 and Figure 7, Figure 8 and Figure 9. The sensitivity values presented in Table 1, Table 2 and Table 3 are expressed as normalized (in percentages), which signify the relative change in measurable experimental outcomes in response to a perturbation in material parameters, Δ . For instance, a sensitivity value of 89.8% implies that an alteration in the parameter x i results in an 89,8% change (in reference a perturbation constant Δ ) in the integral of measured force or moment in the experiment. This high percentage indicates a strong sensitivity, meaning that the particular material parameter greatly influences the mechanical response of the corrugated board in the given test. Conversely, a lower sensitivity value suggests that changes in the parameter have a lesser impact on the material’s response.
These sensitivity values are instrumental in identifying which tests are most effective for assessing specific material properties of corrugated board. For example, a high sensitivity in a bending test for a particular stiffness parameter would indicate that the test is highly effective in evaluating that stiffness characteristic of the board. Similarly, the variations in sensitivity across different board thicknesses and tests provide insights into how the mechanical properties of corrugated board are influenced by its structural characteristics.
For example, for correct identification of the longitudinal stiffness ( E 11 ), the Bending Test in the Machine Direction (BNT-MD) is recommended for thin boards (1.5 mm) with a sensitivity of 89.8, while in medium (3.0 mm) and thick (4.5 mm) boards, BNT-MD remains the primary choice with sensitivities of 58.6 and 39.8, respectively. Transverse stiffness ( E 22 ) is best assessed using the Bending Test in the Cross Direction (BNT-CD) for all thicknesses, with sensitivities of 100.8 (thin), 90.4 (medium), and 69.6 (thick), although the Shear Stiffness Test at 45° (SST-45) can serve as an alternative.
For in-plane shear modulus ( G 12 ), the selected tests vary with thickness. In thin boards, the Shear Stiffness Test in the Machine Direction (SST-MD) is recommended, followed by the Torsional Stiffness Test in the Machine Direction (TST-MD) with sensitivity values of 36.6 and 74.0, respectively. In medium boards, SST-MD takes precedence with a sensitivity of 21.4, and TST-MD serves as an alternative with a sensitivity of 49.4. In thick boards, SST-MD is again the primary choice with a sensitivity of 14.8, while TST-MD offers a sensitivity of 34.2. Notably, for transverse shear moduli ( G 13 and G 23 ), the Torsional Stiffness Test (TST-MD or TST-CD) consistently exhibits the highest sensitivity across all thicknesses, making it the preferred choice for these parameters, providing a comprehensive understanding of material behavior in corrugated boards.
For compressive strength in MD and CD, σ 01 and σ 02 , respectively, the sensitivities vary with board thickness. For σ 01 , SST-45 is effective across all thicknesses, with sensitivity values of 15.8 for 1.5 mm, 34.4 for 3.0 mm, and 39.0 for 4.5 mm boards. For σ 02 , ECT-CD is the most sensitive, with values of 72.6 for both 1.5 mm and 4.5 mm, and 72.8 for 3.0 mm boards. Shear strength, τ 12 shows high sensitivity for SST-45 and SST-MD across all thicknesses. Sensitivity values for SST-45 are 66.2 for 1.5 mm, 61.0 for 3.0 mm, and 61.4 for 4.5 mm boards, while for SST-MD, they are 30.2, 47.6, and 51.6, respectively.
Finally, all tests are rather insensitive to tensile strength in MD and CD, σ 01 + and σ 02 + , respectively, across all board thicknesses. Similarly, all presented here tests display very low sensitivity across all sample thicknesses to Poisson’s ratio, ν 12 , with the highest values being relatively low in each case.
In practical terms, the key takeaway from this study is the identification of specific tests that are most sensitive and hence most effective for determining particular material properties of corrugated board. For instance, for assessing longitudinal stiffness in thin boards, the Bending Test in the Machine Direction is optimal due to its high sensitivity, while for in-plane shear modulus, the choice of test varies with board thickness, with the Shear Stiffness Test being more effective for thinner boards. This understanding allows for a more focused and efficient testing setup, ensuring that the most informative tests are prioritized to accurately gauge the mechanical characteristics of corrugated boards across different dimensions.
The main observations from the study and practical recommendations for effective identification of the elastic and inelastic parameters of corrugated boards of varying thicknesses are as follow:
1. Longitudinal Stiffness ( E 11 ):
• For all thickness categories (thin, medium and thick), the Bending Test in the Machine Direction (BNT-MD) consistently shows high sensitivity for the stiffness in MD, E 11 . This indicates that BNT-MD is a reliable choice for assessing the longitudinal stiffness of corrugated boards, irrespective of their thickness.
• Recommendation: BNT-MD should be utilized as a standard test for evaluating longitudinal stiffness in quality control and material characterization processes.
2. Transverse Stiffness ( E 22 ):
• The Bending Test in the Cross Direction (BNT-CD) demonstrates the highest sensitivity for stiffness in CD, E 22 across all board thicknesses. This test effectively captures the transverse stiffness properties of the corrugated boards.
• Recommendation: The BNT-CD can be successfully implemented for a thorough assessment of transverse stiffness, especially in contexts where this property is critical to the performance of the corrugated board.
3. Poisson’s Ratio ( ν 12 ):
• This parameter shows generally low sensitivity across all tests and board thicknesses, suggesting the need for specialized testing methods or equipment to accurately measure ν 12 . The consistent insensitivity of all tests to Poisson’s Ratio ( ν 12 ) indicates its minor role in the mechanical behavior of corrugated board. This suggests that while Poisson’s Ratio is a measurable property, it may not be critical to the performance and functionality of corrugated board in practical applications, for example as corrugated boxes. This highlights the importance of focusing on the most impactful mechanical properties, other than Poisson’s Ratio, for practical applications of corrugated boards.
• Recommendation: One might consider advanced testing methodologies or equipment modifications to enhance the detection and measurement of Poisson’s Ratio in corrugated boards or to use empirical formulas developed by Baum [54].
4. In-Plane Shear Modulus ( G 12 ):
• TST-MD and SST-MD emerge as the most sensitive tests for G 12 for all board thicknesses. These tests are crucial for understanding the shear behavior of the boards under in-plane loads.
• Recommendation: If possible, one should regularly include TST-MD and SST-MD in testing regimes to ensure comprehensive evaluation of in-plane shear modulus, particularly for high-stress applications.
5. Transverse Shear Moduli ( G 13 and G 23 ):
• The TST-MD is highly sensitive to G 13 , while TST-CD shows the highest sensitivity to G 23 , especially in thicker boards. These tests are essential for assessing the shear properties in different orientations.
• Recommendation: Both tests TST-MD and TST-CD should be employed to fully characterize the shear properties in corrugated boards, aiding in the optimization of their structural integrity and design.
6. Compressive Strength ( σ 01 and σ 02 ):
• SST-45 is notably effective for compressive strength in MD, σ 01 across all thicknesses, whereas ECT-CD stands out in measuring compressive strength in CD, σ 02 , particularly for medium and thick boards.
• Recommendation: The focus should be on SST-45 for correct identification of σ 01 and ECT-CD for characterization σ 02 in routine testing. These tests are crucial for industries where compressive strength is a key factor in packaging and material handling.
7. Shear Strength ( τ 12 ):
• Both SST-45 and SST-MD exhibit high sensitivity for in-plane shear strength, τ 12 , making them essential for evaluating the shear strength of corrugated boards.
• Recommendation: These tests should be incorporated into standard testing procedures to assess shear strength, ensuring the boards meet the required performance standards in shear loading conditions.
8. Tensile Strength ( σ 01 + and σ 02 + ):
• It’s noteworthy that all tests show low sensitivity to σ 01 + and σ 02 + , indicating challenges in measuring these parameters with the current test setup.
• Recommendation: The alternative or more specialized testing methods should be explored to effectively evaluate the tensile strength parameters of corrugated boards, providing that those parameters are expected to be activated in particular application of corrugated board.
It can be observed that in many common applications of corrugated board, particularly as packaging material, the tensile strength parameters in the Machine Direction (MD) and Cross Direction (CD) remain largely inactive. This observation implies that while these parameters can be critical in specific, specialized applications, they may not be as crucial in typical uses of corrugated board. Therefore, although alternative or more specialized testing methods could be developed to assess tensile strength more accurately, this should be guided by the specific requirements of the intended application. In scenarios where corrugated boards are not subjected to significant tensile stresses, the emphasis on these parameters might be less pertinent, as evidenced by the study’s results. This underscores the importance of tailoring testing protocols to the practical demands and conditions under which the corrugated board is expected to perform.
This consideration similarly applies to Poisson’s ratio. Much like the tensile strength parameters in MD and CD, Poisson’s Ratio, while a measurable property, often plays a less critical role in the most common applications of corrugated board. The study suggests that in typical usage scenarios, especially in packaging, the influence of Poisson’s ratio on the overall mechanical performance of corrugated boards is minimal. Therefore, while it can be an important factor in specialized applications, the focus on Poisson’s ratio in standard testing protocols for corrugated board may not be as crucial for general use cases, aligning with the observed trends in tensile strength parameters.
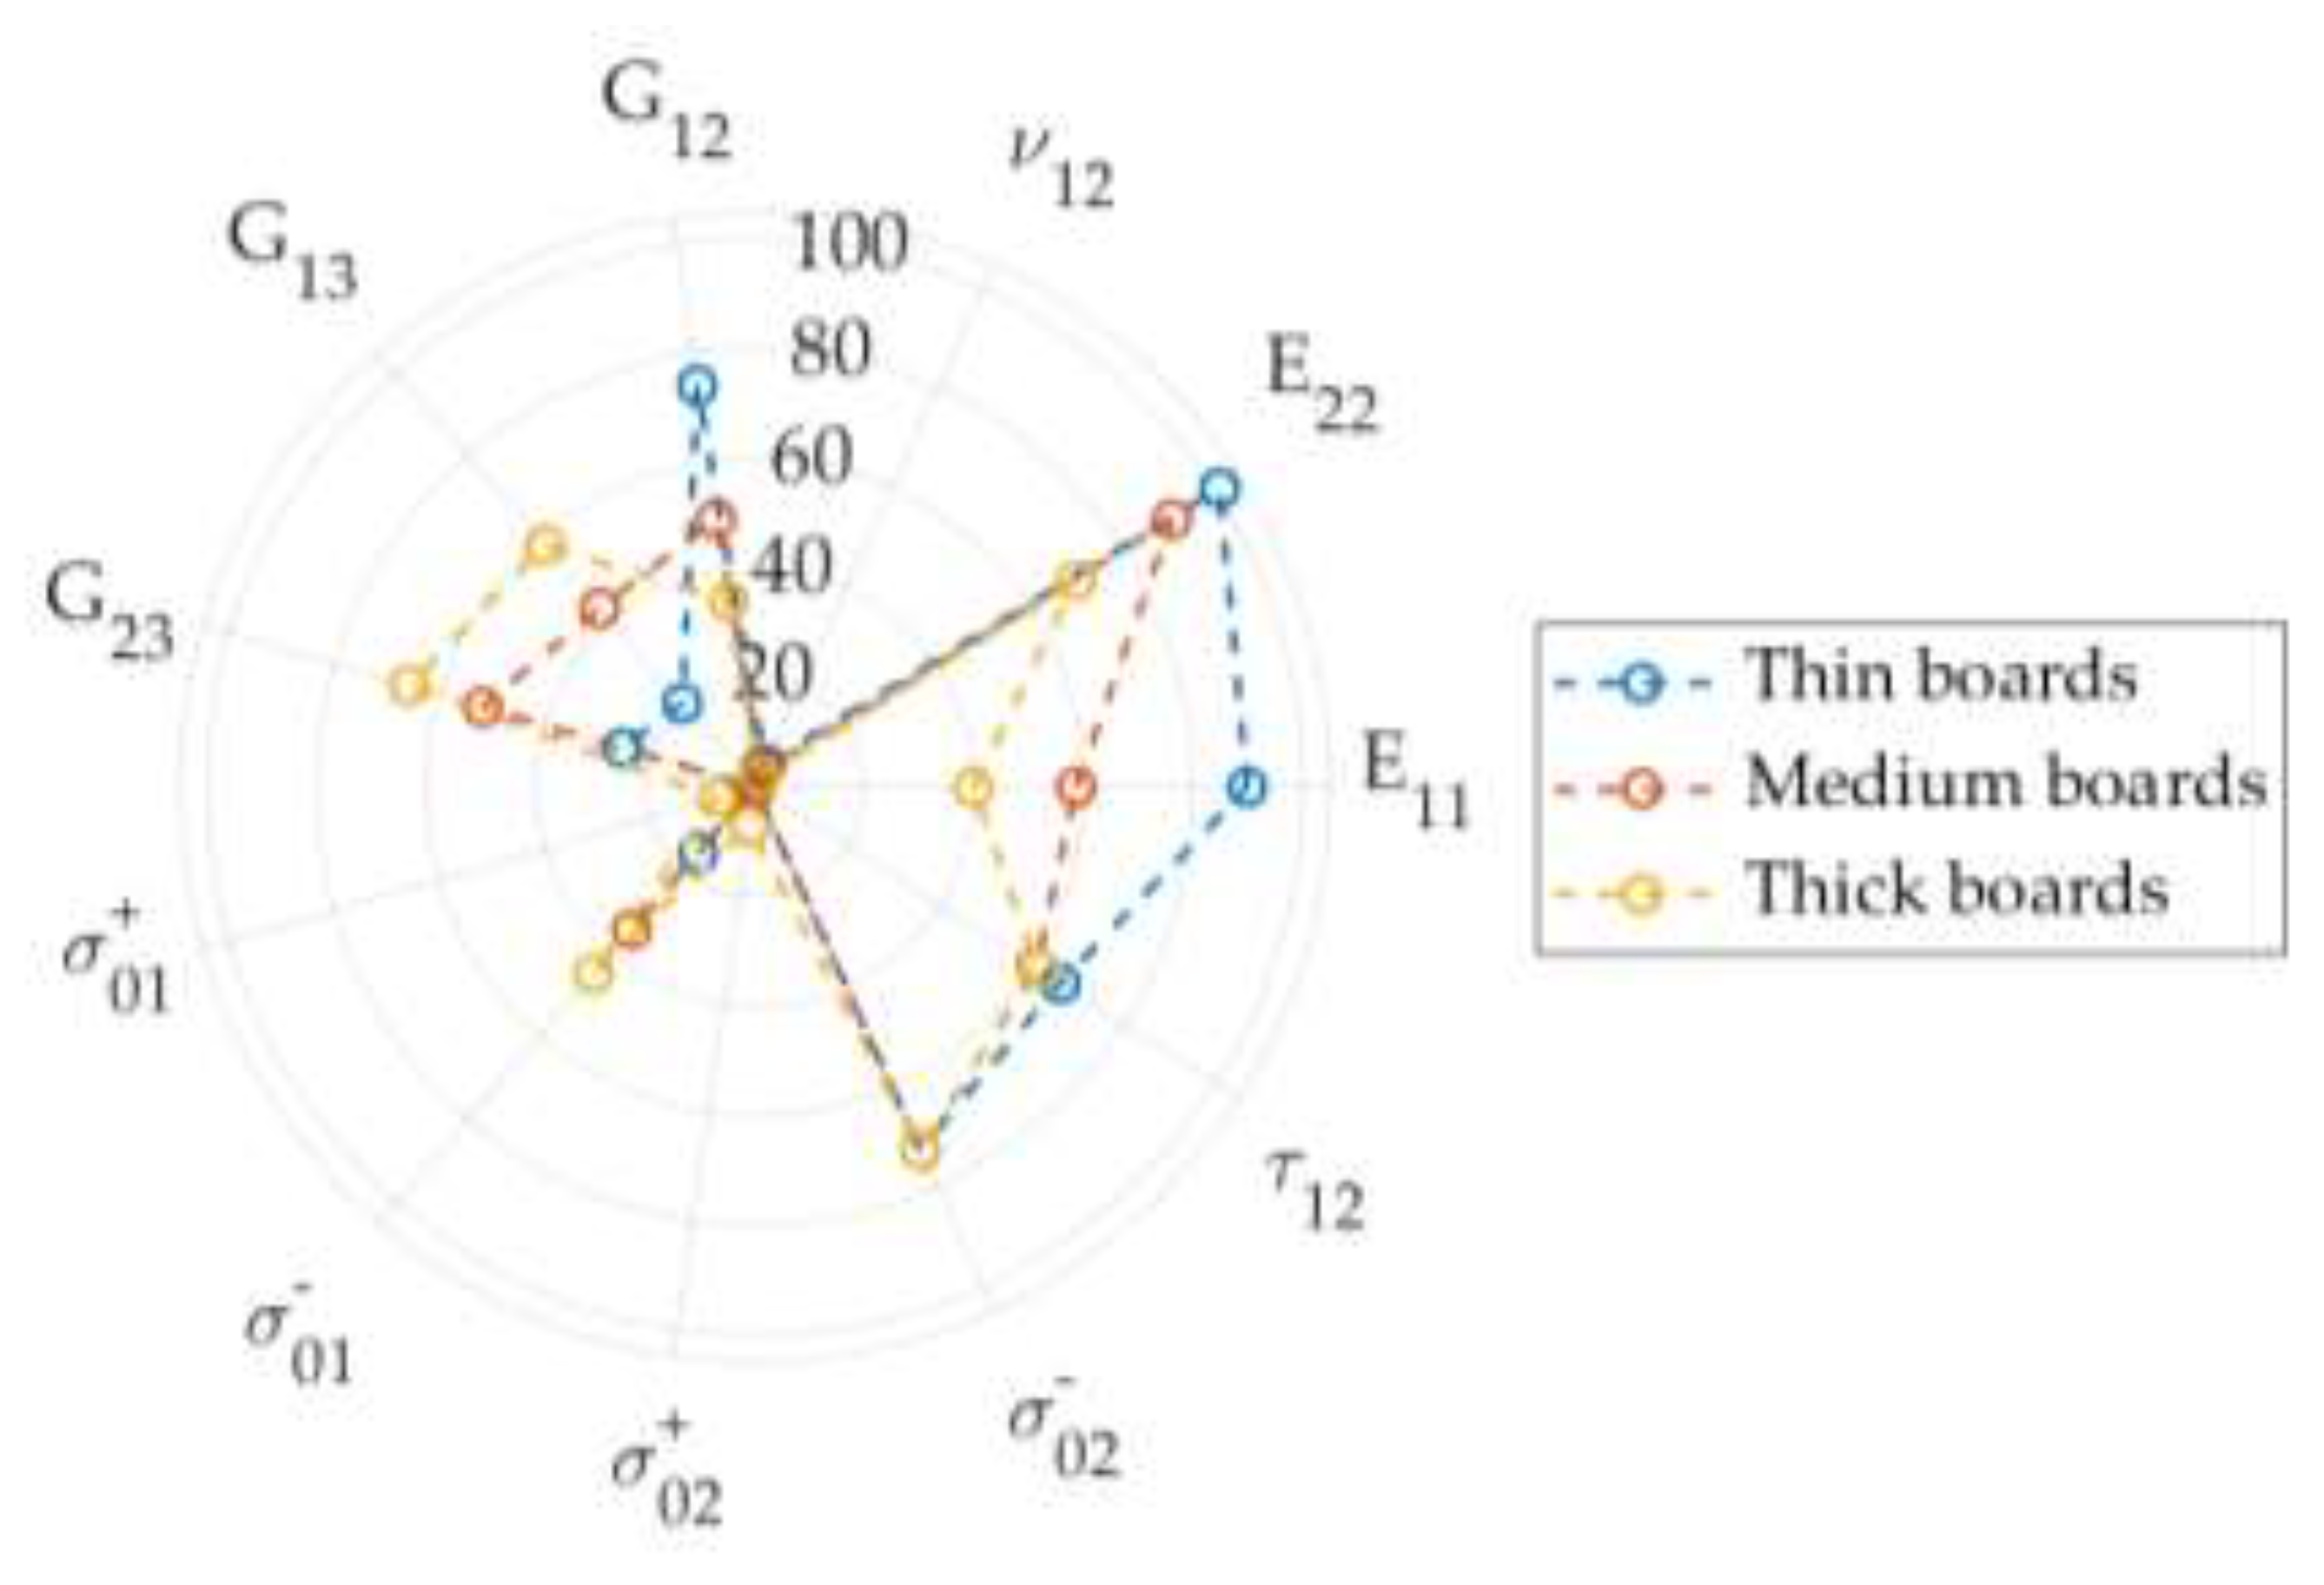
Figure 10 summarizes all analysis performed in this study. It presents mechanical sensitivities for corrugated boards of different thicknesses: thin, medium, and thick. The sensitivities measures of various mechanical properties like tensile strength in two orientations ( σ 01 and σ 02 ), shear strength ( τ 12 ), elastic moduli ( E 11 , E 22 ), shear moduli ( G 12 , G 13 , G 23 ), and Poisson’s ratio ( ν 12 ) are presented.
The concentric circles represent normalized sensitivity values, with data points connected to show the relationship between the thickness of the boards and their respective mechanical properties. The dashed lines with different patterns and colors correspond to the different board thicknesses, indicating how each property changes with board thickness. The distribution of points illustrates the maximum normalized sensitivity (from all tests) of each property for thin, medium, and thick cardboard samples.
It's evident that certain properties exhibit high sensitivity across all thicknesses, indicating that the tests used are particularly effective for these parameters. Conversely, some properties like σ 01 + , σ 02 + or ν 12 show lack of sensitivity, suggesting that the used tests may be not reliable for these parameters in such samples geometry and thickness or they are not triggered in those test. In practice, this graph indicates which parameters are activated and with what intensity in the presented set of tests for different board thicknesses, as well as those that have no effect on the measurable quantities in all tests used in this study.

4. Conclusions

The research's main findings focus on the mechanical characterization of corrugated boards with varying thicknesses, emphasizing the most useful tests for determining specific material properties. The study uses a variety of laboratory tests, such as the edge crush test (ECT), bending stiffness test (BNT), torsional stiffness test (TST), and shear stiffness test (SST). The tests are analyzed for their ability to characterize material parameters effectively.
The sensitivity analysis performed in the study is central to determining which tests are most effective for which material parameters, depending on board thickness. This allows for a more targeted approach in the mechanical testing of corrugated boards, ensuring that the most relevant properties are accurately assessed for different applications. The study also reveals that the mechanical behavior of corrugated boards is nonlinear under various loads, particularly at higher loads or specific stress states. This insight is crucial for understanding real-world performance in various applications. The research provides guidance on optimizing testing methods for better material characterization, which can lead to improved design and usage of corrugated board products.
In evaluating the mechanical properties of corrugated boards, the study highlights the efficacy of certain tests while revealing limitations in others. Bending Tests (BNT-MD and BNT-CD) are crucial for assessing longitudinal and transverse stiffness, and Shear Stiffness Tests (SST-MD and SST-45), along with Torsional Stiffness Tests (TST_MD and TST_CD), are highly effective for evaluating shear properties and compressive strength. However, these tests show limited sensitivity to Poisson's Ratio ( ν 12 ) and Tensile Strength in both MD and CD ( σ 01 + and σ 02 + ), suggesting a need for more specialized tests in these areas. To extend the test setup, incorporating advanced techniques specifically designed for assessing Poisson's Ratio and Tensile Strength would enhance the overall assessment capability. Regularly reviewing and updating the test suite is essential to maintain relevance with evolving material properties and industry applications, ensuring a comprehensive and accurate characterization of corrugated boards.

References

  1. Putz, H.-J. & Schabel, S. The myth of limited fibre life cycles. Wochenblatt für Papierfabrikation 2018, 6, 350–356. [Google Scholar]
  2. Lorang, E. , Lobianco, A. & Delacote, P. Increasing paper and cardboard recycling: impacts on the forest sector and carbon emissions. Environ. Model. Assess. 2023, 28, 189–200. [Google Scholar]
  3. Sanchez-Salvador, J.L. , Balea, A., Monte, M.C. et al. Comparison Of Mechanical And Chemical Nanocellulose As Additives To Reinforce Recycled Cardboard. Sci Rep 2020, 10, 3778. [Google Scholar] [CrossRef]
  4. Wang, C.-C. , Chen, C.-H. & Jiang, B.C. Shock absorption characteristics and optimal design of corrugated fiberboard using drop testing. Appl. Sci. 2021, 11, 5815. [Google Scholar] [CrossRef]
  5. Fehér, L., Pidl, R. & Böröcz, P. Compression strength estimation of corrugated board boxes for a reduction in sidewall surface cutouts – experimental and numerical approaches. Materials 2023, 16, 597. [CrossRef]
  6. Hung, D. , Nakano, Y., Tanaka, F., Hamanaka, D. & Uchino, T. Preserving the strength of corrugated cardboard under high humidity condition using nano-sized mists. Compos. Sci. Technol. 2010, 70, 2123–2127. [Google Scholar]
  7. Allaoui, S. , Aboura, Z. & Benzeggagh, M. L. Effects of the environmental conditions on the mechanical behaviour of the corrugated cardboard. Compos. Sci. Technol. 2009, 69, 104–110. [Google Scholar]
  8. Berry, T. M. , Ambaw, A., Defraeye, T., Coetzee, C. J. & Opara, U. L. Moisture adsorption in palletised corrugated fibreboard cartons under shipping conditions: a CFD modelling approach. Food Bioprod. Process. 2018, 114, 43–59. [Google Scholar]
  9. Alam, I. , Sharma, C. Degradation of paper products due to volatile organic compounds. Sci Rep 2023, 13, 6426. [Google Scholar] [CrossRef]
  10. Urbanik, T. J. Effect of corrugated flute shape on fibreboard edgewise crush strength and bending stiffness. J. Pulp Pap. Sci. 2001, 27, 330–335. [Google Scholar]
  11. Ihwah, A. , Dewi, I. A., Sukardi, S. & Fitriani, Y. Proportion of raw material optimisation in handicraft paper making made of Pinang fibre (Areca catechu l.) and old corrugated cardboard (used cardboard). Int. J. Environ. Waste Manag. 2021, 28, 282–297. [Google Scholar]
  12. Twede, D., Selke, S. E. M. & Shires, D. Cartons, Crates and Corrugated Board: Handbook of Paper and Wood Packaging Technology, 41–42, 55–56 (DEStech Publications, Inc, 2005). 2005.
  13. Zhang, Z. , Qiu, T., Song, R. & Sun, Y. Nonlinear finite element analysis of the fluted corrugated sheet in the corrugated cardboard. Advan. in Mater. Sci. and Engin. 2014, 2014, 65401. [Google Scholar] [CrossRef]
  14. Mrówczyński, D. , Pozorska J. , Garbowski T. & Pozorski Z. Corrugated board stiffness of unsymmetrical multilayered corrugated board: influence of boundary conditions. BioResources, 2023, 18, 7611–7628. [Google Scholar] [CrossRef]
  15. Lin, C. , Nicaise, S.M., Lilley, D.E. et al. Nanocardboard as a nanoscale analog of hollow sandwich plates. Nat Commun 2018, 9, 4442. [Google Scholar] [CrossRef]
  16. Aboura, Z. , Talbi, N., Allaoui, S. & Benzeggagh, M. L. Elastic behaviour of corrugated cardboard: experiments and modelling. Compos. Struct. 2004, 63, 53–62. [Google Scholar]
  17. Buannic, N. , Cartraud, P. & Quesnel, T. Homogenization of corrugated core sandwich panels. Compos. Struct. 2003, 59, 299–312. [Google Scholar]
  18. Suarez, B. , Muneta, M. L. M, Sanz-Bobi, J. D. & Romero G. Application of homogenization approaches to the numerical analysis of seating made of multi-wall corrugated cardboard. Compos. Struct. 2021, 262, 113642. [Google Scholar] [CrossRef]
  19. Hill, R. A theory of the yielding and plastic flow of anisotropic metals. Proc. R. Soc. Lond. Ser. A 1948, 193, 281–297. [Google Scholar]
  20. Caddell, R. M. , Raghava, R. S. & Atkins, A. G. Yield criterion for anisotropic and pressure dependent solids such as oriented polymers. J. Mater. Sci. 1973, 8, 1641–1646. [Google Scholar]
  21. Deshpande, V. S. , Fleck, N. A. & Ashby, M. F. Effective properties of the octet-truss lattice material. J. Mech. Phys. Solid. 2001, 49, 1747–1769. [Google Scholar]
  22. Mäkelä, P. , Östlund, S. Orthotropic Elastic–Plastic Material Model for Paper Materials. International Journal of Solids and Structures, 2003, 40, 5599–5620. [Google Scholar] [CrossRef]
  23. Hoffman, O. The brittle strength of orthotropic materials. J. Compos. Mater. 1967, 1, 200–206. [Google Scholar] [CrossRef]
  24. Xia, Q. S. , Boyce, M. C. & Parks, D. M. A constitutive model for the anisotropic elastic–plastic deformation of paper and paperboard. Int. J. Solids Struct. 2002, 39, 4053–4071. [Google Scholar]
  25. Alzweighi, M. , Mansour, R., Tryding, J. & Kulachenko A. Evaluation of Hoffman and Xia plasticity models against bi-axial tension experiments of planar fiber network materials. Int. J. Solids Struct. 2022, 238, 111358. [Google Scholar] [CrossRef]
  26. Garbowski, T., Maier, G. & Novati, G. On Calibration of Orthotropic Elastic-Plastic Constitutive Models for Paper Foils by Biaxial Tests and Inverse Analyses. Structural and Multidisciplinary Optimization, 46, 111–128 (2011). [CrossRef]
  27. Schrampfer, K. E., Whitsitt, W. J. & Baum, G. A. Combined Board Edge Crush (ECT) Technology. Institute of Paper Chemistry, Appleton, WI, USA (1987).
  28. Jamsari, M. A. , Kueh, C., Gray-Stuart, E. M., Dahm, K. & Bronlund, J. E. Modelling the impact of crushing on the strength performance of corrugated fibreboard. Packag. Technol. Sci. 2020, 33, 159–170. [Google Scholar]
  29. Urbanik, T. J. Effect of paperboard stress-strain characteristics on strength of singlewall corrugated fiberboard: a theoretical approach. US Forest Products Laboratory Report. FPL 401 ( 1981.
  30. TAPPI T820. Flexural Stiffness of Corrugated Board. Pulp and Paper Association. Norcross, GA, USA, (2019).
  31. Mujika, F. , Arrese, A. , Adarraga, I. & Oses, U. New correction terms concerning three-point and four-point bending tests. Polym. Test. 2016, 55, 25–37. [Google Scholar]
  32. Garbowski, T. & Knitter-Piątkowska, A. Analytical determination of the bending stiffness of a five-layer corrugated cardboard with imperfections. Materials 2022, 15, 663. [Google Scholar] [CrossRef]
  33. Yoshihara, H. , Yoshinobu, M. & Maruta, M. Bending stiffness and moment capacity of cardboard obtained from three-point and elastic bending tests. Nord. Pulp Paper Res. J. 2023, 38, 73–85. [Google Scholar]
  34. Nordstrand, T. , Carlsson, L. A. & Allen, H. G. Transverse shear stiffness of structural core sandwich. Comp. Struct. 1994, 27, 317–329. [Google Scholar]
  35. Reissner, E. On torsion and transverse flexure of orthotropic elastic plates. J. Appl. Mech. 1980, 47, 855–860. [Google Scholar] [CrossRef]
  36. ASTM Standard D5379. Standard test method for shear properties of composite materials by the V-notched beam method. ASTM International, West Conshohocken, USA (2005).
  37. ASTM Standard D4255. Test method for in-plane shear properties of polymer matrix composite materials by the rail shear method. ASTM International, West Conshohocken, USA (2007).
  38. ASTM Standard D3518. Standard test method for in-plane shear response of polymer matrix composite materials by tensile test of a ±45° laminate. ASTM International, West Conshohocken, USA (2007).
  39. Avilés, F. , Couoh-Solis, F., Carlsson, L. A., Hernández-Pérez, A. & May-Pat, A. Experimental determination of torsion and shear properties of sandwich panels and laminated composites by the plate twist test. Comp. Struct. 2011, 93, 1923–1928. [Google Scholar]
  40. Hernandez-Perez, A. , Avilés, F. & Carlsson, L. A. First-order shear deformation analysis of the sandwich plate twist specimen. J. Sandw. Struct. Mater. 2012, 14, 229–245. [Google Scholar]
  41. Popil, R. E. , Coffin, D. W. & Habeger, C. C. Transverse shear measurement for corrugated board and its significance. Appita J. 2008, 61, 307–312. [Google Scholar]
  42. Chalmers I. R. A new method for determining the shear stiffness of corrugated board, Appita J. 2006, 59, 357-361.
  43. Li, M., Wu, L., Ma, L., Xiong, J. & Guan, Z. Torsion of carbon fiber composite pyramidal core sandwich plates. Comp. Struct. 93, Issue 9, 2358-2367 (2011).
  44. Pozorski, Z. , Wojciechowski, S. The influence of symmetrical boundary conditions on the structural behaviour of sandwich panels subjected to torsion. Symmetry 2020, 12, 2093. [Google Scholar] [CrossRef]
  45. Garbowski, T. , Grabski, J. K. & Marek, A. Full-field measurements in the edge crush test of a corrugated board—Analytical and numerical predictive models. Materials 2021, 14, 2840. [Google Scholar] [CrossRef] [PubMed]
  46. Fadiji, T. , Ambaw, A., Coetzee, C. J., Berry, T.M. & Opara, U. L. Application of finite element analysis to predict the mechanical strength of ventilated corrugated paperboard packaging for handling fresh produce. Biosyst. Eng. 2018, 174, 260–281. [Google Scholar]
  47. Suarez, B., Muneta, M. L. M., Sanz-Bobi, J. D. & Romero, G. Application of homogenization approaches to the numerical analysis of seating made of multi-wall corrugated cardboard. Compos. Struct. 262, 113642. [CrossRef]
  48. FEMat Systems. Available online: http://www.fematsystems.pl/en/systems/sst/ (accessed on 30 December 2023).
  49. Tsai, S. W. & Wu, E. M. A general theory of strength for anisotropic materials. J. Compos. Mater. 5(1), 58–80 (1971).
  50. Wu, Z.R. , Yang, Y. & Lei, H. Progressive failure analysis of perforated composite laminates considering nonlinear shear effect. Sci Rep 2023, 13, 22375. [Google Scholar] [CrossRef]
  51. Alzweighi, M.; Tryding, J.; Mansour, R.; Borgqvist, E.; Kulachenko, A. Anisotropic Damage Behavior in Fiber-Based Materials: Modeling and Experimental Validation. Journal of the Mechanics and Physics of Solids, 2023, 181, 105430. [Google Scholar] [CrossRef]
  52. Garbowski, T.; Garbowska, L. Computer aided estimation of corrugated board box compression strength. Part 2. The sensitivity analysis in selected laboratory tests of corrugated board. Przegląd papierniczy, 2018, 74, 435–440. [Google Scholar] [CrossRef]
  53. Garbowski, T.; Garbowska, L. Computer aided estimation of corrugated board box compression strength. Part 3. Laboratory-numerical procedure for an identification of elastic properties of corrugated board. Przegląd papierniczy,, 2018, 74, 577–585. [Google Scholar] [CrossRef]
  54. Baum, G.A.: The elastic properties of paper: A review. IPC technical paper series number, 145 (1984).
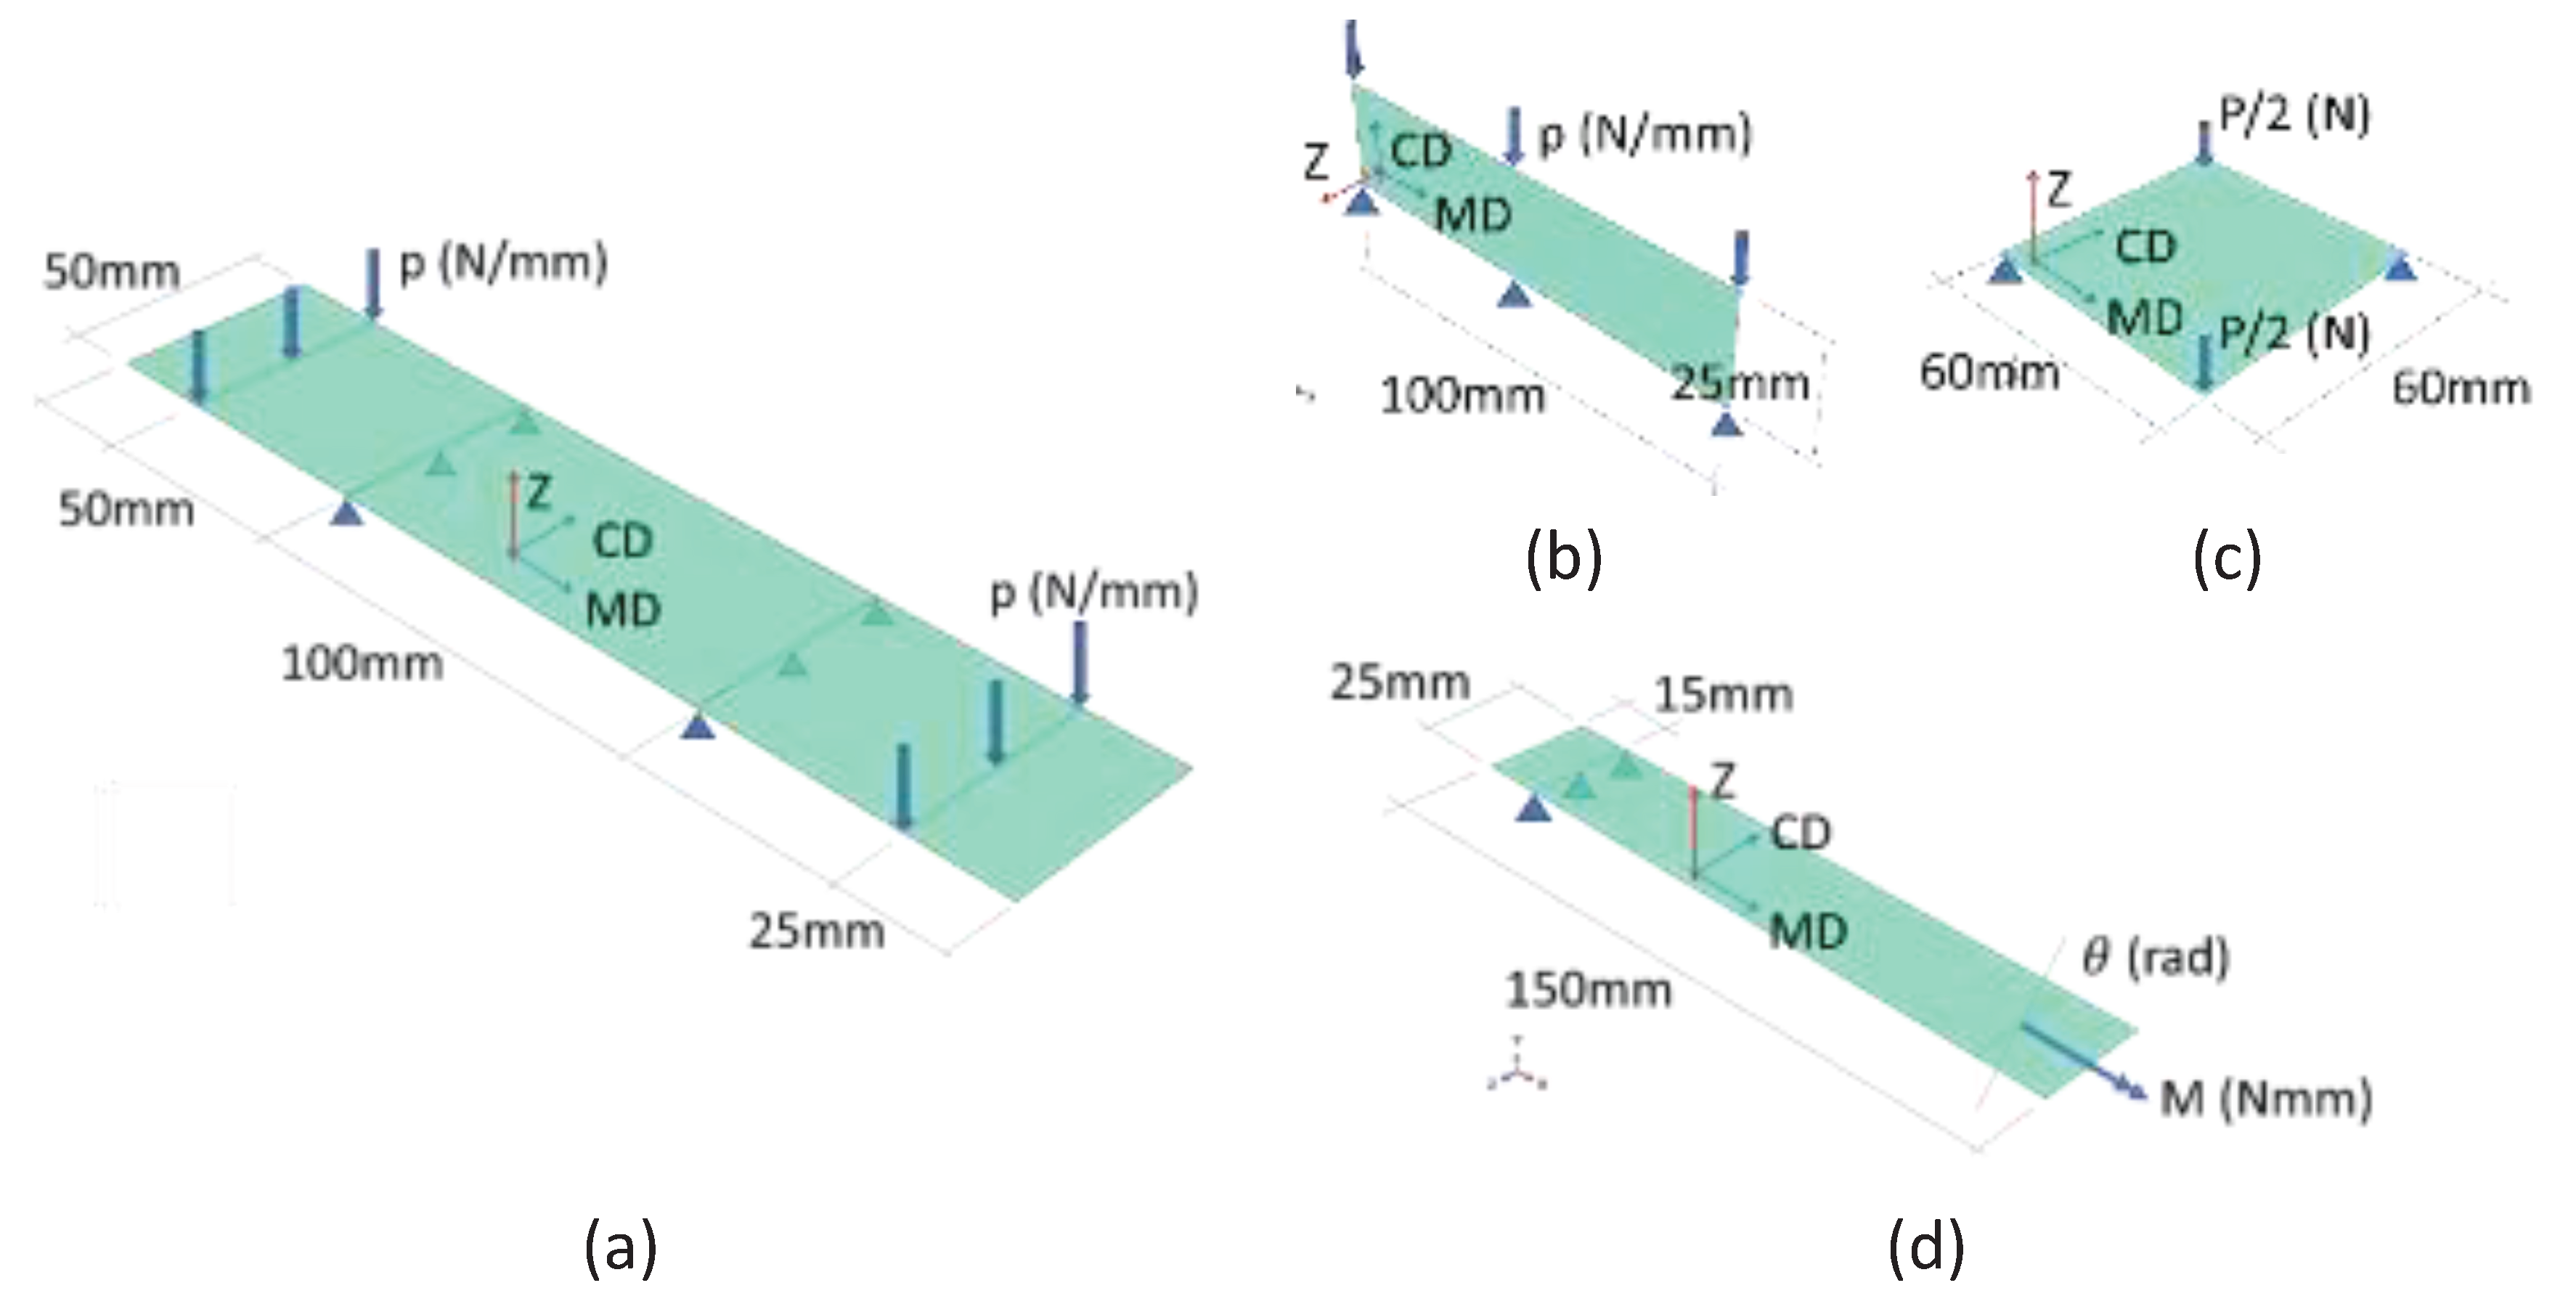
Figure 1. Presentation of the corrugated board samples in various tests: (a) bending stiffness test in MD; (b) edge crush test (traditional); (c) shear stiffness test; (d) torsional stiffness test in MD.
Preprints 100989 g001
Figure 2. Presentation of the corrugated board samples in various tests: (a) bending stiffness test in CD; (b) edge crush test (material rotated by 45deg); (c) shear stiffness test (material rotated by 45drg); (d) torsional stiffness test in CD.
Preprints 100989 g002
Figure 3. Deformed samples in four different tests – fem models.
Preprints 100989 g003
Figure 4. Force displacement and moment-rotation curves from four different test in two variants of thin (1.5 mm) cardboard samples.
Preprints 100989 g004aPreprints 100989 g004b
Figure 5. Force displacement and moment-rotation curves from four different test in two variants of medium (3.0 mm) cardboard samples.
Preprints 100989 g005aPreprints 100989 g005b
Figure 6. Force displacement and moment-rotation curves from four different test in two variants of thick (4.5 mm) cardboard samples.
Preprints 100989 g006aPreprints 100989 g006b
Figure 7. Normalized sensitivities for the thin (1.5 mm) corrugated board.
Preprints 100989 g007
Figure 8. Normalized sensitivities for the medium (3.0 mm) corrugated board.
Preprints 100989 g008
Figure 9. Normalized sensitivities for the thick (4.5 mm) corrugated board.
Preprints 100989 g009
Figure 10. Maximum sensitivity values achieved across all tests for the full spectrum of elastic and plastic material properties of corrugated board, encompassing three different cardboard sample thicknesses.
Preprints 100989 g010
Table 1. Normalized sensitivities for the thin (1.5 mm) corrugated board.
B N T M D B N T C D E C T C D E C T 45 S S T M D S S T 45 T S T M D T S T C D
E 11 89,8 -2,0 0,0 5,2 5,4 22,2 3,6 0,0
E 22 1,2 100,8 25,0 8,8 8,2 30,8 0,0 2,4
ν 12 3,0 2,4 0,0 2,4 0,6 -4,6 0,0 0,0
G 12 0,2 0,2 0,0 7,2 36,6 6,4 74,0 69,8
G 13 1,0 0,2 0,0 4,6 4,2 4,4 20,2 1,0
G 23 0,2 1,2 0,0 4,6 4,8 6,2 0,8 25,2
σ 01 + 0,0 0,0 0,0 0,0 0,0 0,0 0,0 0,0
σ 01 6,0 0,0 0,0 1,0 1,0 15,8 0,0 0,0
σ 02 + 0,0 0,0 0,0 0,0 0,0 0,0 0,0 0,0
σ 02 -0,4 0,0 72,6 1,4 0,2 12,6 0,0 0,0
τ 12 0,0 0,0 0,0 66,2 30,2 1,0 0,0 0,0
Table 2. Normalized sensitivities for the medium (3.0 mm) corrugated board.
B N T M D B N T C D E C T C D E C T 45 S S T M D S S T 45 T S T M D T S T C D
E 11 58,6 -0,8 0,0 1,6 2,2 14,6 1,0 0,0
E 22 0,6 90,4 26,0 4,6 3,2 14,4 0,0 0,6
ν 12 1,2 1,0 0,0 1,4 0,2 -3,2 0,0 0,0
G 12 0,2 0,0 0,0 9,4 21,4 2,8 49,4 43,6
G 13 2,4 0,2 0,0 0,0 6,4 6,6 43,2 1,6
G 23 0,2 3,6 0,0 0,0 7,4 9,2 1,6 51,8
σ 01 + 0,2 0,0 0,0 0,0 0,0 0,0 0,0 0,0
σ 01 32,8 -1,4 0,0 0,0 0,4 34,4 0,0 0,0
σ 02 + 0,0 0,1 0,0 0,0 0,0 0,0 0,0 0,0
σ 02 -1,8 5,4 72,8 0,0 0,2 23,8 0,0 0,0
τ 12 0,0 0,0 0,0 61,0 47,6 0,6 1,6 0,0
Table 3. Normalized sensitivities for the thick (4.5 mm) corrugated board.
B N T M D B N T C D E C T C D E C T 45 S S T M D S S T 45 T S T M D T S T C D
E 11 39,8 0,0 0,0 1,4 1,6 10,0 1,0 0,0
E 22 0,4 69,6 25,0 4,0 2,2 9,8 0,0 1,4
ν 12 0,4 0,4 0,0 1,2 0,0 -2,2 0,0 0,0
G 12 0,0 0,0 0,0 8,2 14,8 2,0 34,2 28,4
G 13 3,4 0,2 0,0 0,0 8,2 8,6 58,4 2,6
G 23 0,2 6,2 0,0 0,0 9,8 12,0 2,4 65,8
σ 01 + 7,2 0,0 0,0 0,0 0,0 0,0 0,0 0,0
σ 01 45,0 -3,6 0,0 0,0 0,4 39,0 0,0 0,0
σ 02 + 0,0 3,1 0,0 0,0 0,0 0,0 0,0 0,0
σ 02 -2,6 19,2 72,6 0,0 0,0 26,4 0,0 0,0
τ 12 0,2 0,0 0,0 61,4 51,6 0,4 1,2 0,0
Disclaimer/Publisher’s Note: The statements, opinions and data contained in all publications are solely those of the individual author(s) and contributor(s) and not of MDPI and/or the editor(s). MDPI and/or the editor(s) disclaim responsibility for any injury to people or property resulting from any ideas, methods, instructions or products referred to in the content.
Copyright: This open access article is published under a Creative Commons CC BY 4.0 license, which permit the free download, distribution, and reuse, provided that the author and preprint are cited in any reuse.
Prerpints.org logo

Preprints.org is a free preprint server supported by MDPI in Basel, Switzerland.

Subscribe

© 2024 MDPI (Basel, Switzerland) unless otherwise stated