1. Introduction
Highway pavement successively appear all kinds of damage, deformation and other defects collectively referred to as pavement disease. The cracking category of pavement distress is a common form of damage to asphalt pavements. In actual road use, pavement cracks may lead to unstable vehicle movement and increase the risk of traffic accidents. The function of pavement disease detection is to provide important reference and scientific basis for road maintenance decision-making[
1].
In the current pavement crack detection algorithm, the traditional manual detection of pavement cracks has the problems of low efficiency, high cost, and the safety of the inspectors can not be guaranteed. With the advancement of technology, image processing algorithms have been widely used in many fields, including crack detection[
2]. Traditional image processing algorithms in practice are sensitive to noise in the image and are based on preset rules or thresholds to determine the cracked area, which lacks adaptive and learning capabilities[
3,
4]. As detection continues to evolve, deep learning is starting to come into view. The correctness and efficiency of deep learning has a large advantage over traditional algorithms[
5], Mainly includes R-CNN, Fast-RCNN, Mask-RCNN, Alex Net[
6,
7,
8,
9] and YOLO series[
10,
11,
12,
13]. Although current deep learning algorithms have achieved some results in crack detection, network models often detect pavement cracks without deeply capturing crack features and optimizing them for the cracks’ own characteristics. Specifically: the edge distribution of pavement cracks is often complex, and the depth-convolution features acquired by the network model for identification do not take into account the crack edge features; the distribution of pavement cracks is not uniform, and the network model has different detection capabilities for various cracks with different lengths and widths. These limit the improvement of the accuracy of pavement crack detection to a certain extent, so the research on crack detection algorithms with higher accuracy is very meaningful and valuable. In this study, for the problem that the network models does not consider the shallow geometric features of crack-like disease and the defective detection quality of crack disease, YOLOX, which has fast detection speed and good detection performance, is used as the detection network model, and the detection effect is improved by improving the output part of the features from the backbone network, the enhancement of the feature extraction part, and the loss function, respectively.
Considering that there is a certain Angle between the vehicle camera and the ground when collecting data, the road image is distorted, and the spatial geometry of the sample cannot respond to its real distribution, a good road image data set is obtained by using geometric distortion constraint correction.
The main contributions of this study to road pavement crack detection are as follows:
(1) Extract shallow geometric edge features in the backbone network and con-struct CFPN to cross fusion the shallow geometric features with the deep features. In-corporate the ECA attention module in the sampling part of the strengthen feature ex-traction layer to improve the ability of the network model to pay attention to the crack features.
(2) WEIoU is used instead of IoU loss, penalty terms with different weights are as-signed to the length and width loss functions of the crack annotation box to enhance the positioning ability of the target box with larger aspect ratio. The constructed EC-YOLOX network framework can better focus on the geometric characteristics of cracks, and retain the integrity of cracks while improving the detection quality.
(3) A geometric distortion constraint correction is proposed to correct the pavement image of single-point perspective projection, which changes the geometric distribution form of pavement cracks.
The rest of the paper is organized as follows.
Section 2 describes the current existing work on traditional image processing based and deep learning based crack detection research.
Section 3 constructs the CFPN adaptive feature fusion network, and fuses ECANet at the Strengthen feature extraction layer to enhance the network models ability to recognize cracks. Enhance A geometric distortion constraint correction is ap-plied to the road pavement image. In the next section 4, the dataset construction and image acquisition methods are described. Experiments verify that our method is superior to other methods from different perspectives, and then the results of the test phase are discussed.
Section 5 discusses the determination of the relevant parameters and their impact on the network model. Finally, the conclusion of this work is given in section 6.
2. Related Work
2.1. Crack Detection Based on Conventional Image Processing
Pavements crack detection in the past has used a number of test methods such as laser, infrared, thermal, radio graphic and thermal testing to automate the crack detection process[
14,
15,
16]. Subsequently, computerized image processing began to be used for pavement crack recognition and detection. Early research on target detection was mainly based on image processing algorithms that extracted and classified targets based on color, shape, and edge features[
17]. Na[
18] proposed a method of asphalt pavement crack detection based on mathematical morphology, and used threshold method to segment the image. The basic mathematical morphology operators used are expansion and erosion, and the other morphological operations are a combination of these two operations. Yin[
19] obtained the projected images of different types of cracks and their respective laws based on the binary images processed by the Tunnel crack segmentation method. According to the image characteristics and the optical principle of the detection equipment, the image is effectively preprocessed before extracting the cracks. Wang[
20] proposes that global threshold can simply and quickly process images with significant differences in background grayscale.
2.2. Crack Detection Based on Deep Learning
Deep learning algorithms have a large advantage over traditional algorithms in target detection and semantic segmentation. Current crack disease detection is led by deep learning in terms of correctness and efficiency[
21]. Zhang[
22] proposed an automatic detection method based on deep convolution neural networks, which is the first time that a deep learning-based method is applied to the problem of road crack detection. The samples used by the detection algorithm are all highlighted pavement crack data, and not much optimization has been done in terms of anti-noise and shadow clutter, which needs to be improved for the detection of many small pavement cracks as well as cracks with large surrounding noise. Ale[
23] proposed deep learning-based model called RetinaNet for road damage detection. RetinaNet can use different neural networks as a backbone for learning feature maps. However, the model is prone to detect some artifacts such as paint, and line shading as cracks. Nguyen[
24] proposed a CNN model for crack detection. The advantage of this CNN architecture is that it can remove almost all noise and artifacts in the original image at a relatively large size of 750 × 1900 pixels, and detect all image patches containing cracks.
2.3. Improved Network Model for Crack Detection
Currently many scholars utilize improved network models for crack detection. MA[
25] uses Generative Adversarial Networks (PCGAN) to solve the problem of small number of images, followed by accelerated algorithm and median flow to improve the YOLOv3 model for crack detection and counting. Guo[
26] uses YOLOv5 to detect pavement distress and proposes an improved MN-YOLOv5 network model that greatly reduces the number of parameters of the network model and the size of the model. Meanwhile, a lightweight attention mechanism module is introduced to improve the network model detection accuracy. Wang[
27] proposed an AF-PAN structure, which is used to solve the case where the predicted box is located inside the real box or of the same size by introducing an Adaptive Attention Module (AAM) for capturing the depth features and using CIoU for GIoU replacement. QU[
28] proposes a deeply supervised convolution neural network to detect cracks by means of a multiscale convolution feature fusion module. In the multiscale feature fusion module high-level features are directly introduced into the low-level features at different convolution stages. LIU[
29] proposed an adaptive spatial feature fusion (ASFF) that adaptively learns the importance of different levels of features at each location to avoid spatial contradiction. CUI[
30] proposes an Att-Unet network model to solve the problem of positive and negative sample imbalance in semantic segmentation by adding an attention mechanism module to efficiently extract crack multiscale features. Chen[
31] constructed a directional sub-crack detector to define cracks in terms of segmented angles. A multi-branch angular regression loss (MAR Loss) is proposed to minimize the distribution difference angular distribution between the predicted angular distribution of branches and the redefined real boundary.
Considering that the distribution of cracks in the actual inspection application is often very complex, the algorithm needs to pay more attention to the geometric characteristics and key features of cracks in the pavement image to ensure the inspection efficiency and meet the requirements of the actual application. Based on the above scholars’ research on image processing and deep learning, we propose CFPN (Cross feature pyramid network) to extract the shallow edge features of cracks, and cross fusion the shallow features with the deep convolution feature through adaptive feature fusion, which endows the features with the multi-scale global field of view information. The ECA (Efficient Channel Attention) attention mechanism is integrated after the up-sampling and down-sampling in strengthen feature extraction layer to prevent feature loss in the up-sampling and down-sampling process of the network, and to strengthen the feature extraction capability of different channels. Finally, considering the large crack aspect ratio in actual detection, the WEIoU (weight efficient intersection over union) loss function is constructed to assign different weight penalty terms to the target box of cracks with different lengths to enhance the target box localization ability.
3. Improved YOLOX Crack Detection
To combine crack detection with practical applications, firstly, the geometric distortion constraint correction is used to correct the acquired road image data and improve the crack distribution form of the pavement. Secondly, the YOLOX network model is improved by constructing CFPN and embedding the ECA attention module in strengthen feature extraction layer of the network. Finally, WEIoU is proposed to optimize the localization ability of target box in training. The overall technical route is shown in
Figure 1.
3.1 Road Image Geometric Distortion Constraint Correction
Perspective transformation[
32] projection center for the point of view, due to the line of sight and the plane where the rectangle exists a certain angle, so that the image on the projection plane perspective distortion, the formation of a new quadrilateral.
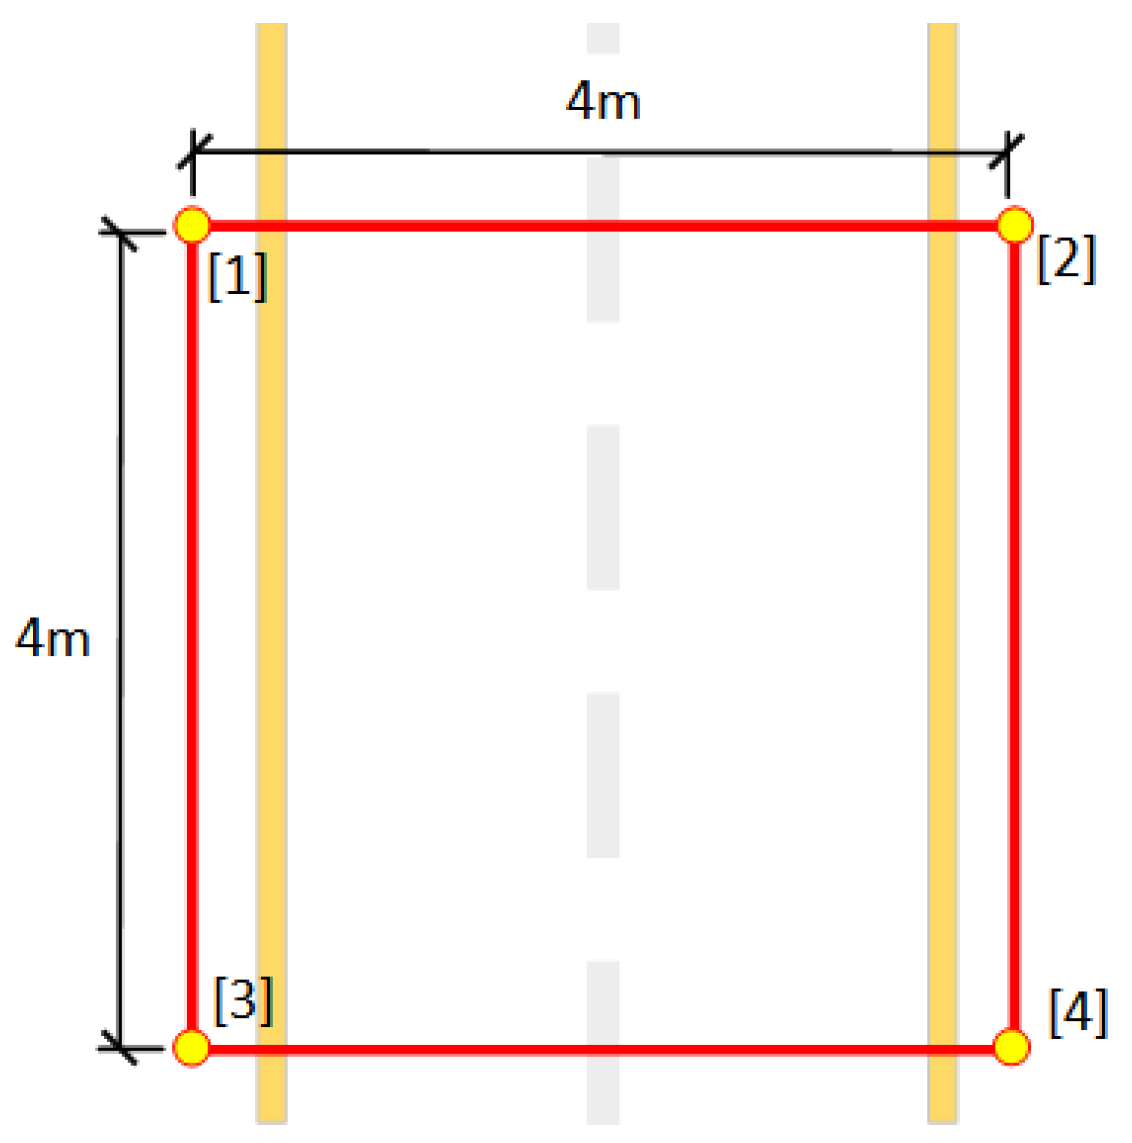
To combine geometric correction with pavement image acquisition, this study uses the method of measuring the constraints of target objects on pavement image to correct pavement image. To meet the measurement requirement of a single lane width of 3.75 m, manual surveying was done so that the spacing between target object was 4 m. Utilizing the range of target object measurements allows the entire image to include the lane being inspected, excluding unnecessary portions of the image outside of the lane and meeting the need for crack integrity during an inspection. As shown in
Figure 2, points [
1,
2,
3,
4] are the actual positions of the measured target.
The perspective transformation formula is shown in Equation 1, where
is the coordinate of a point in the original image, and the coordinates of the corresponding image obtained after perspective transformation are
, where
,
.
are the distortion correction parameters. Rearranging the formula gives:
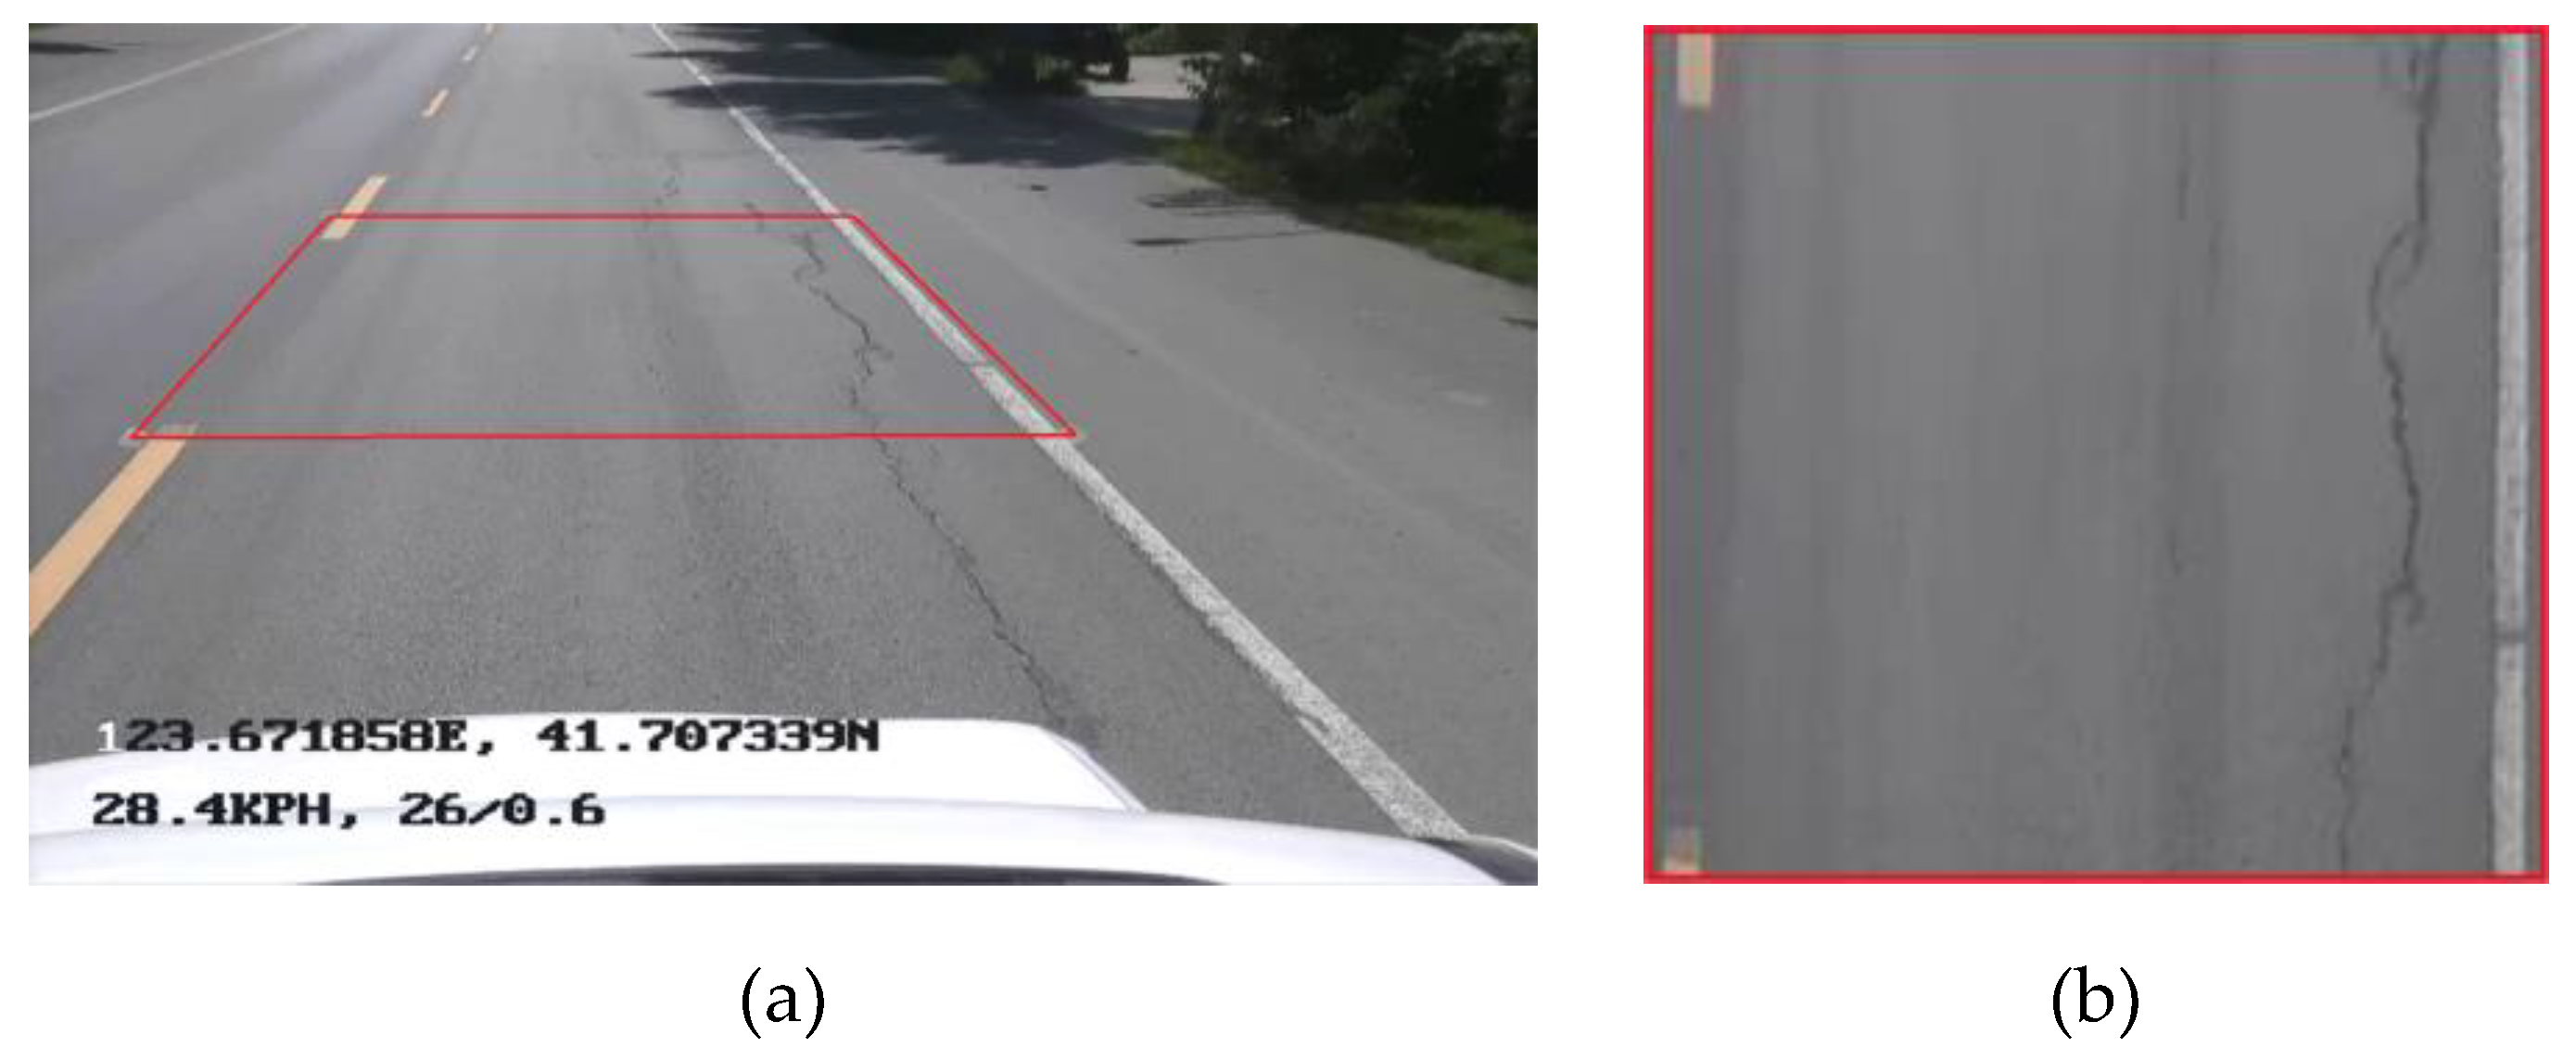
The image sizes after geometric distortion correction is constrained by the range determined by the measured target. By corresponding the image size to the actual size, the image size is determined to be 4000 * 4000 pixels. The formula 2 and formula 3 are rearranged, and the coordinate values of the target object in the image are selected by mouse click and substituted into the formula. The 8 coordinate parameters required by the original formula (including 4 aberration coordinate parameters and 4 orthogonal coordinate parameters) are reduced to 4 parameters (aberration coordinate parameters), which simplifies the calculation steps. The effect of road image correction is shown in
Figure 3.
3.2. Improvement of Backbone Network Feature Output Layer
You Only Look Once (YOLO) is a novel target detection algorithm characterized by fast detection speed, low background error rate, and more, created by Redmore, Divvala, Girshick, and Farhail in 2016. Through different periods of development, many versions of YOLO have appeared, and YOLOX[
33] has a more rational network structure and better robustness compared to YOLOv3 in 2018 and YOLOv5 in 2020. Currently YOLOX in the field of target detection has made a breakthrough through various ways[
34,
35,
36,
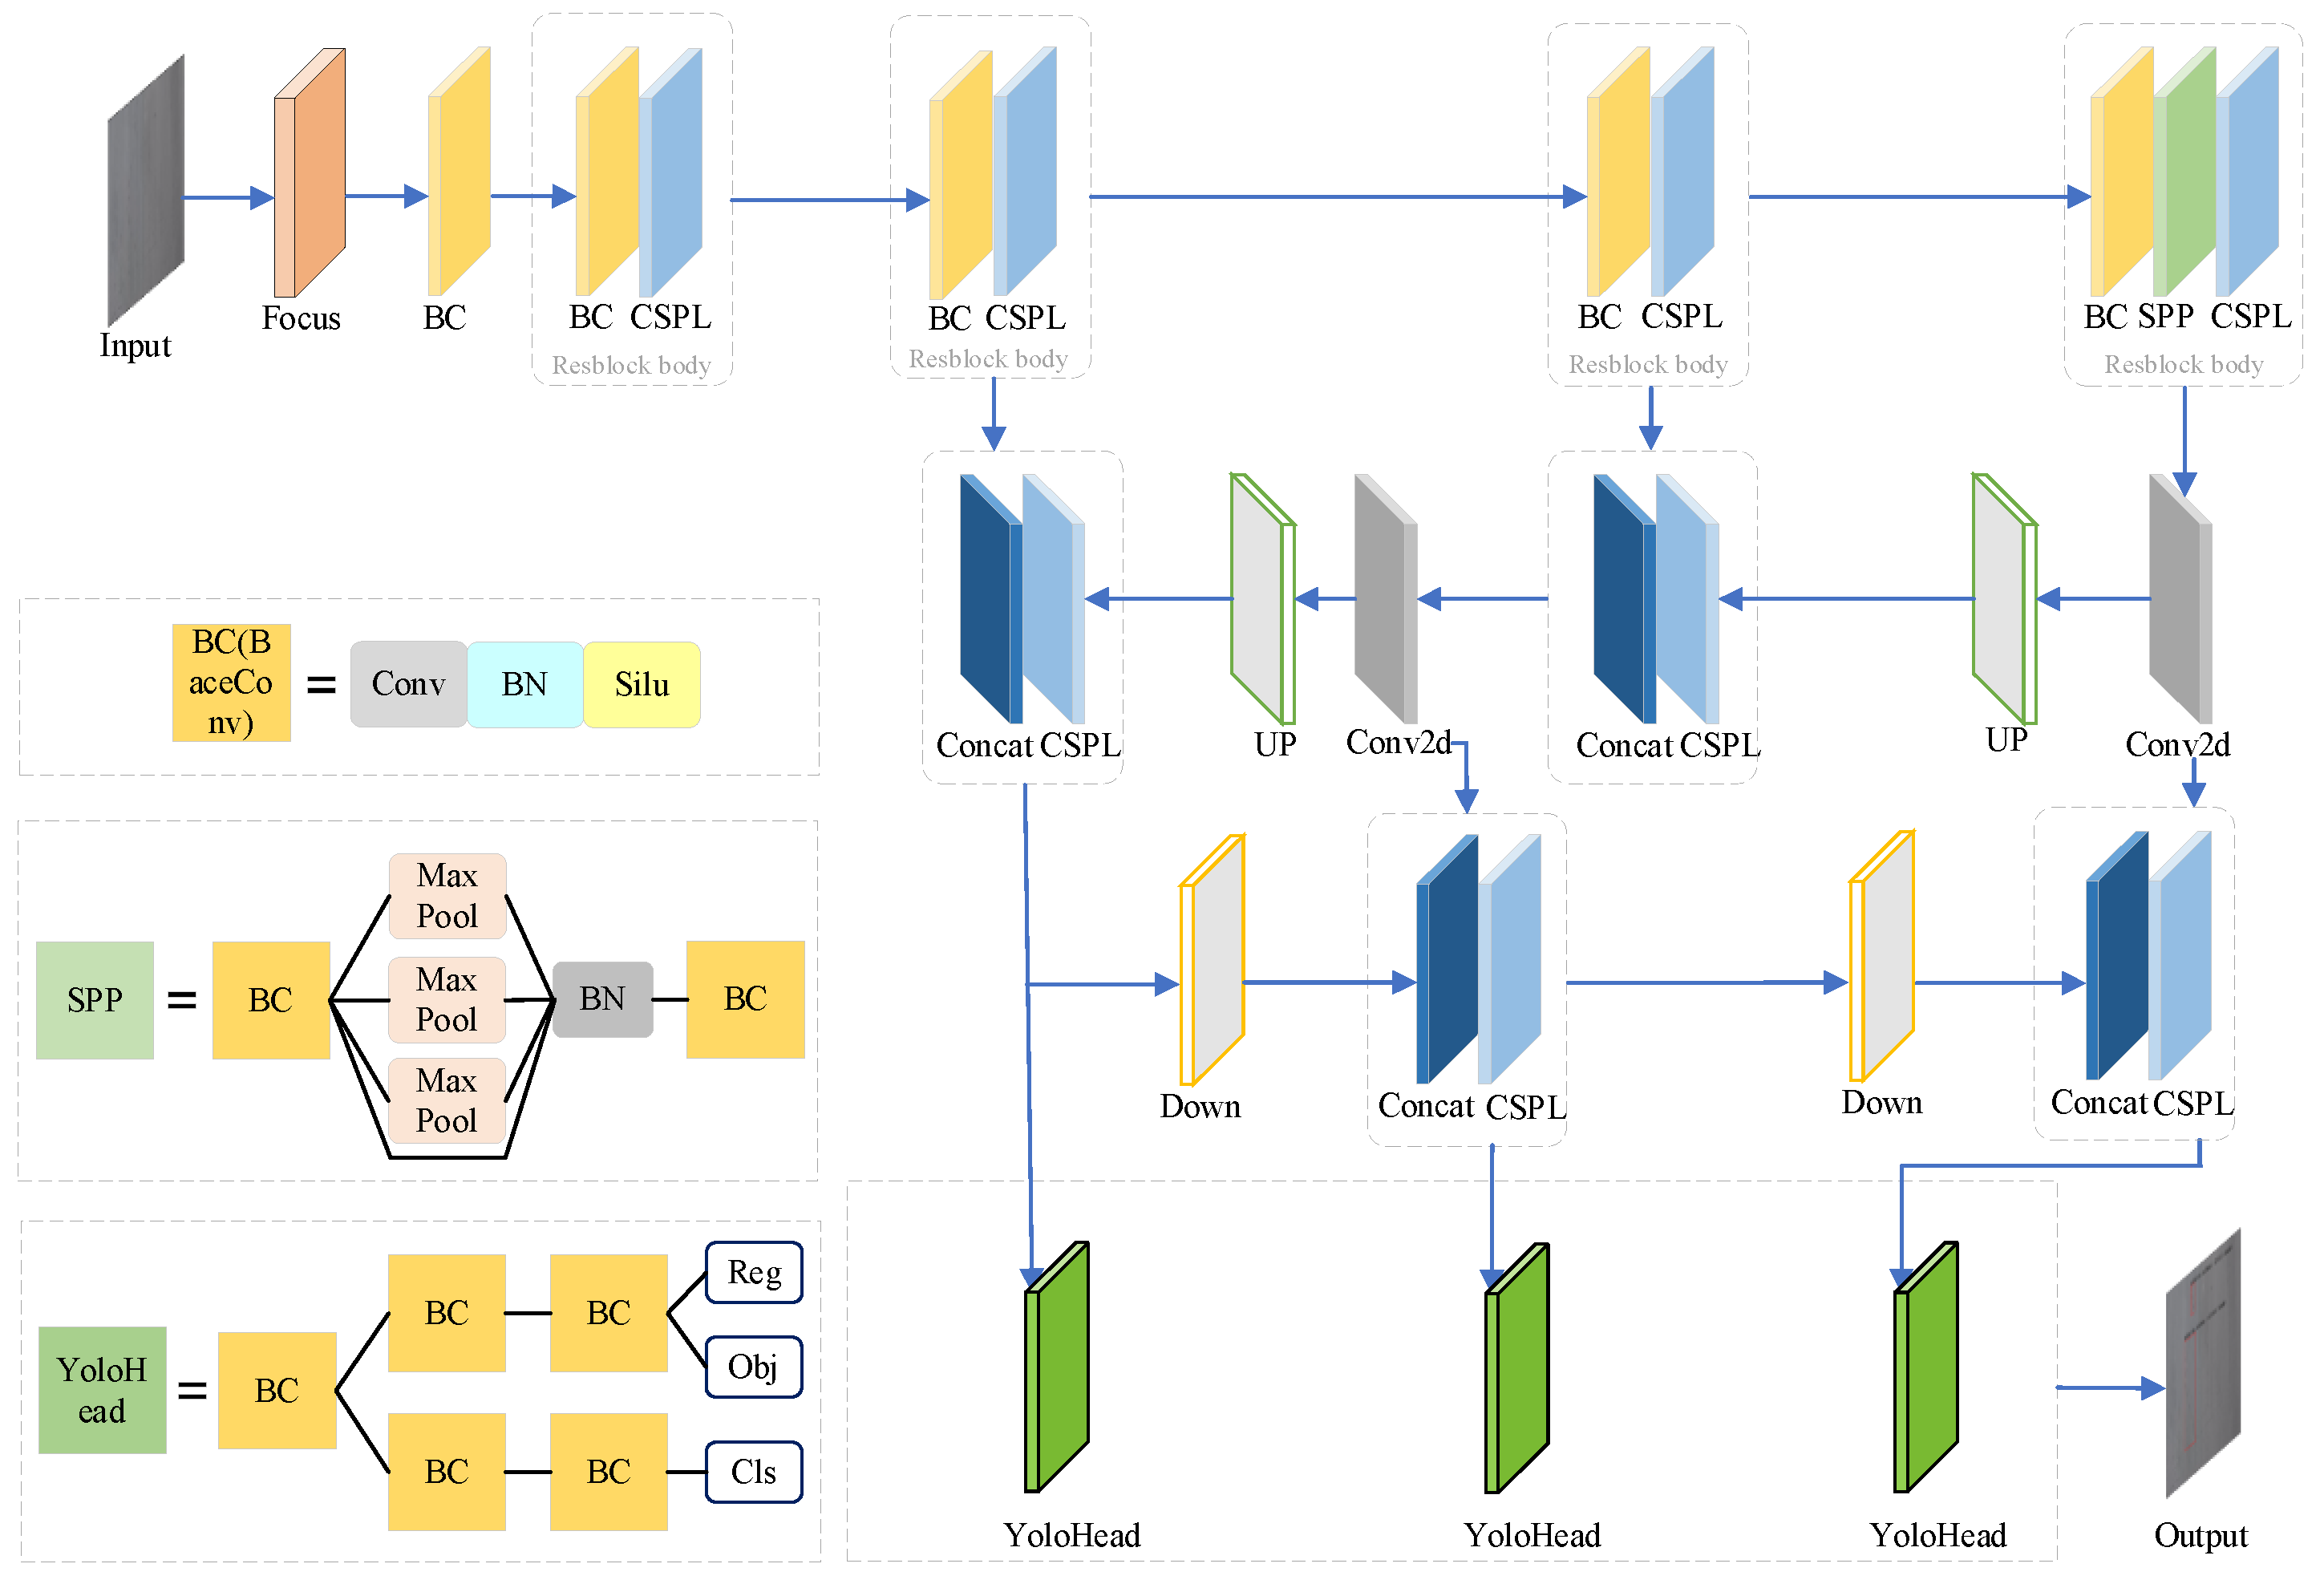
37]. The whole YOLOX network can be divided into three parts, which are the backbone feature extraction network, strengthen feature extraction network, and the classification and regression part. The structure of YOLOX network model is shown in
Figure 4.
In YOLOX, CSPdarknet finally outputs three feature layers by extracting deep features, and the poor correlation of features at different scales during feature extraction can easily lead to the degradation of the ability to extract geometric information. To solve the problems that the network ignores the influence of shallow features to weaken the geometric features of cracks during feature extraction and the loss of semantic information during multi-scale feature extraction, we choose to improve the feature output layer of the backbone network.
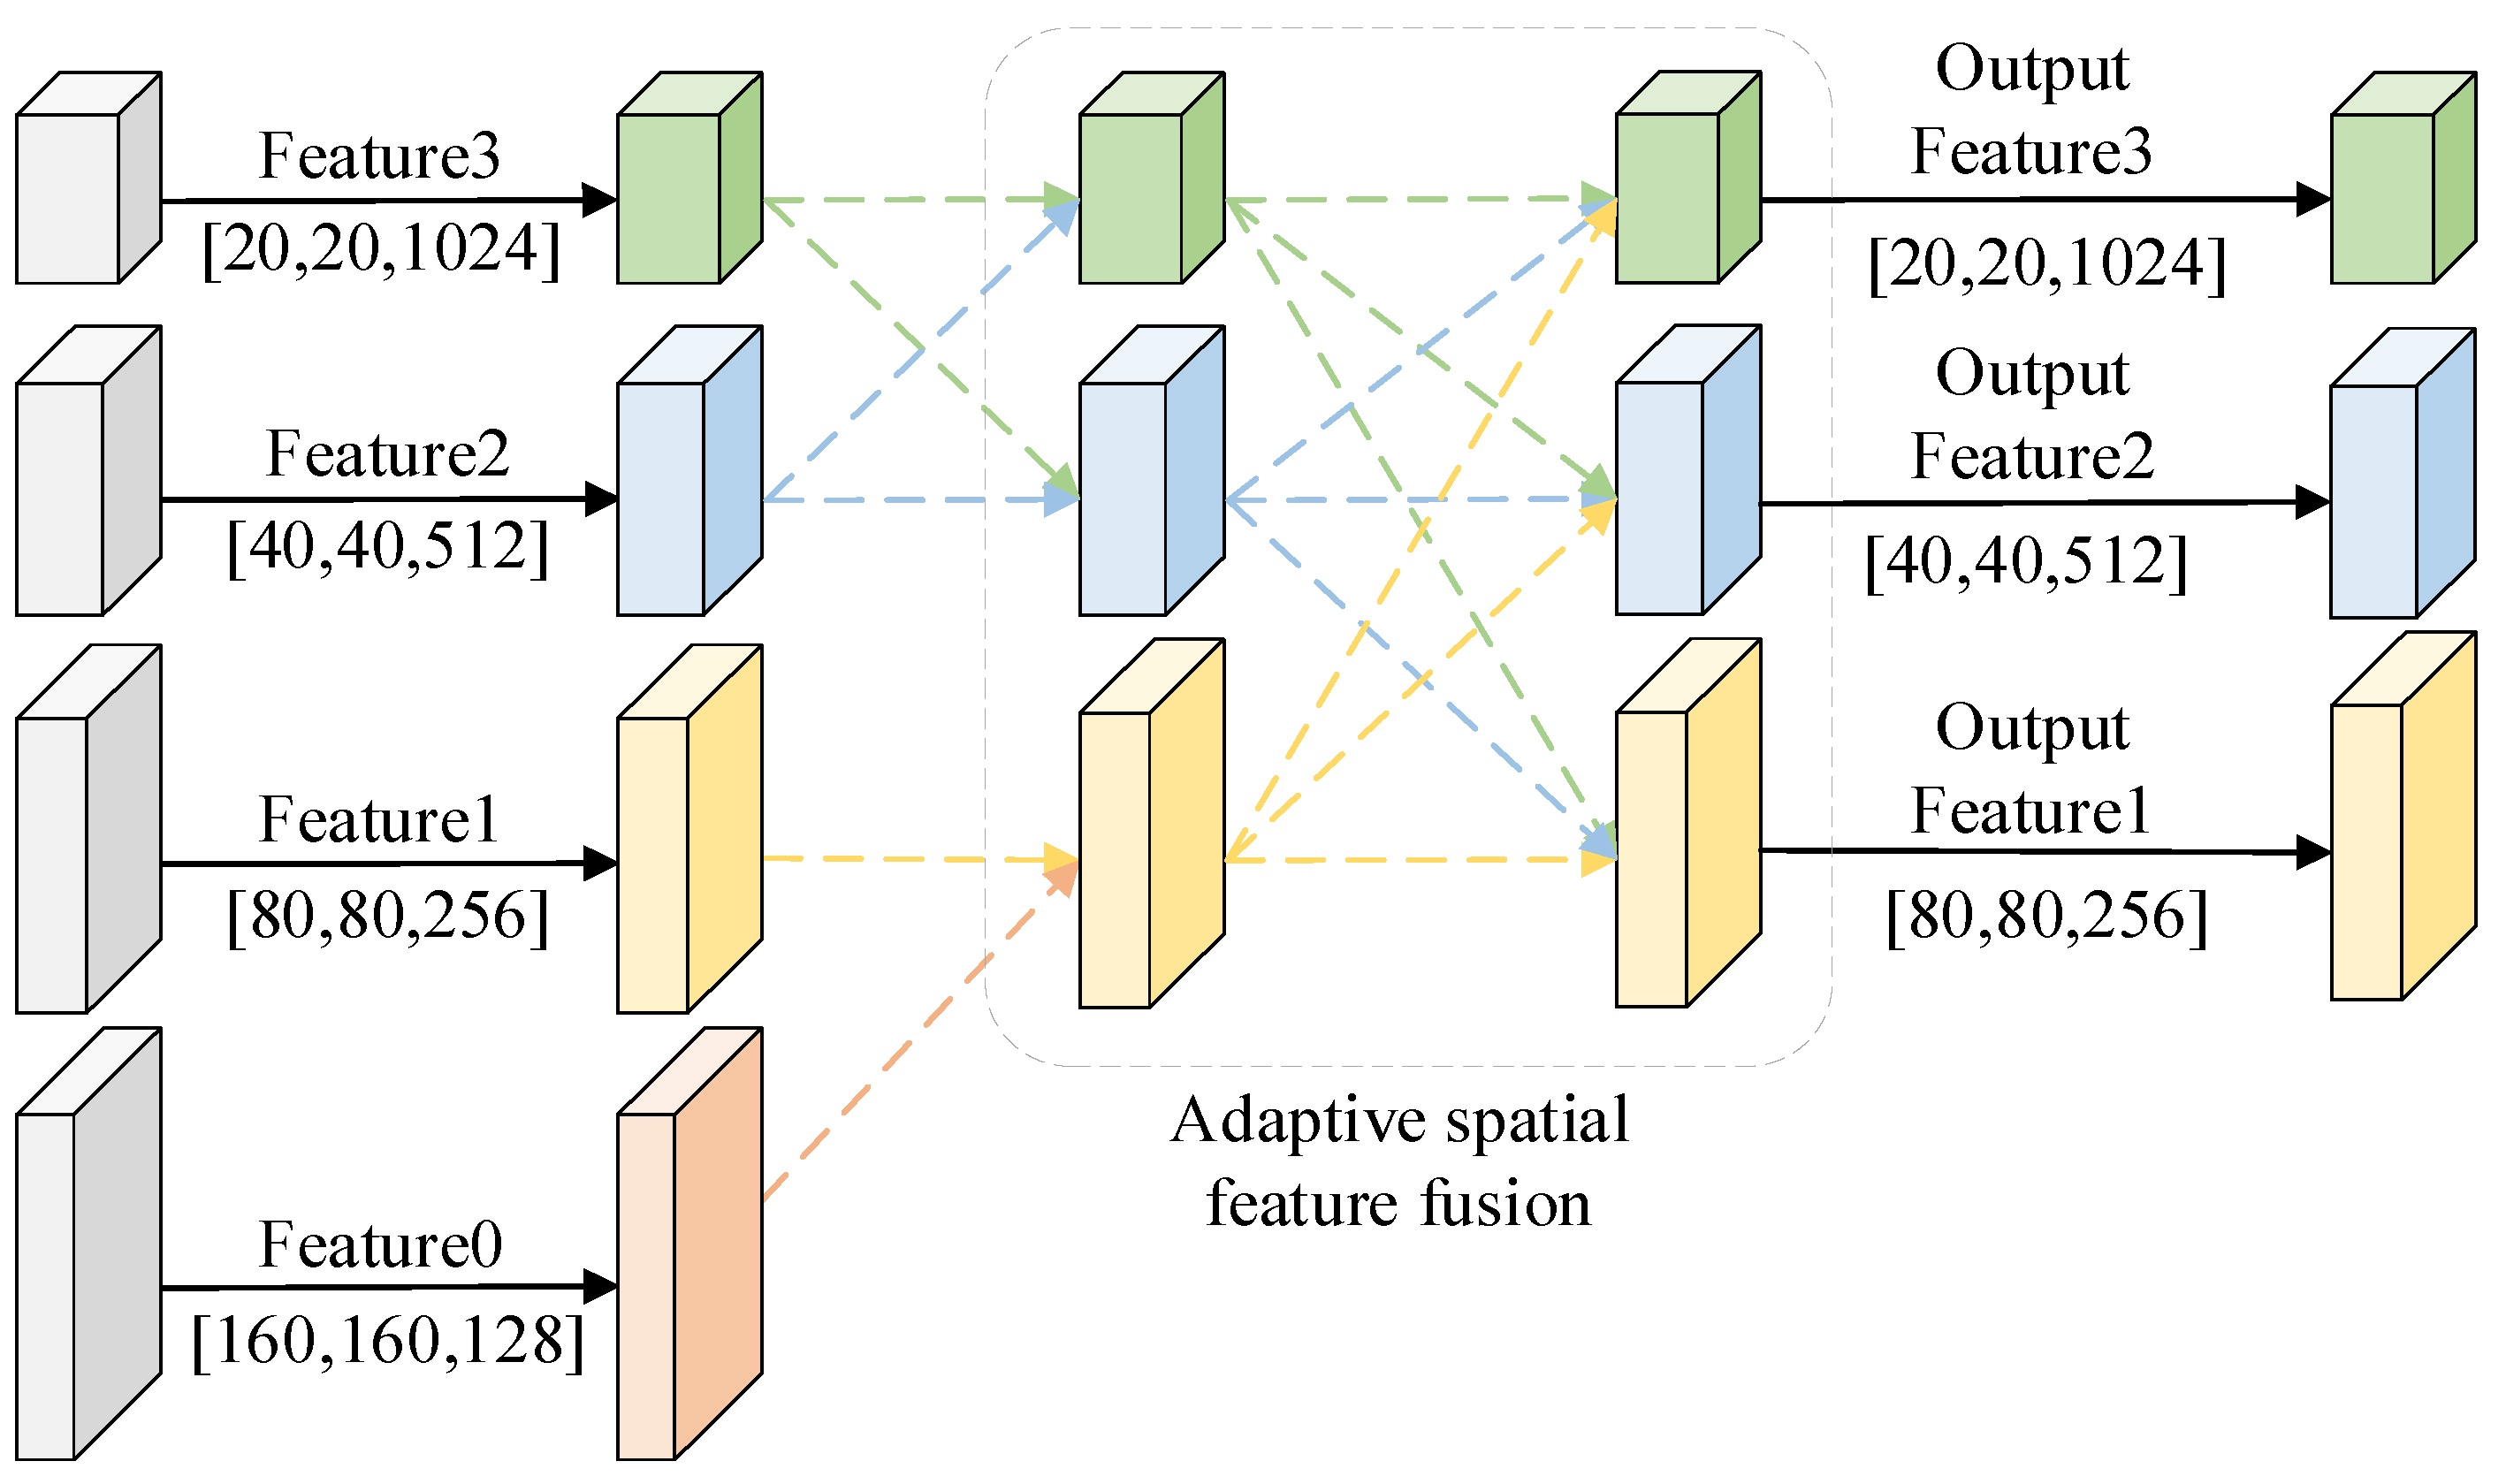
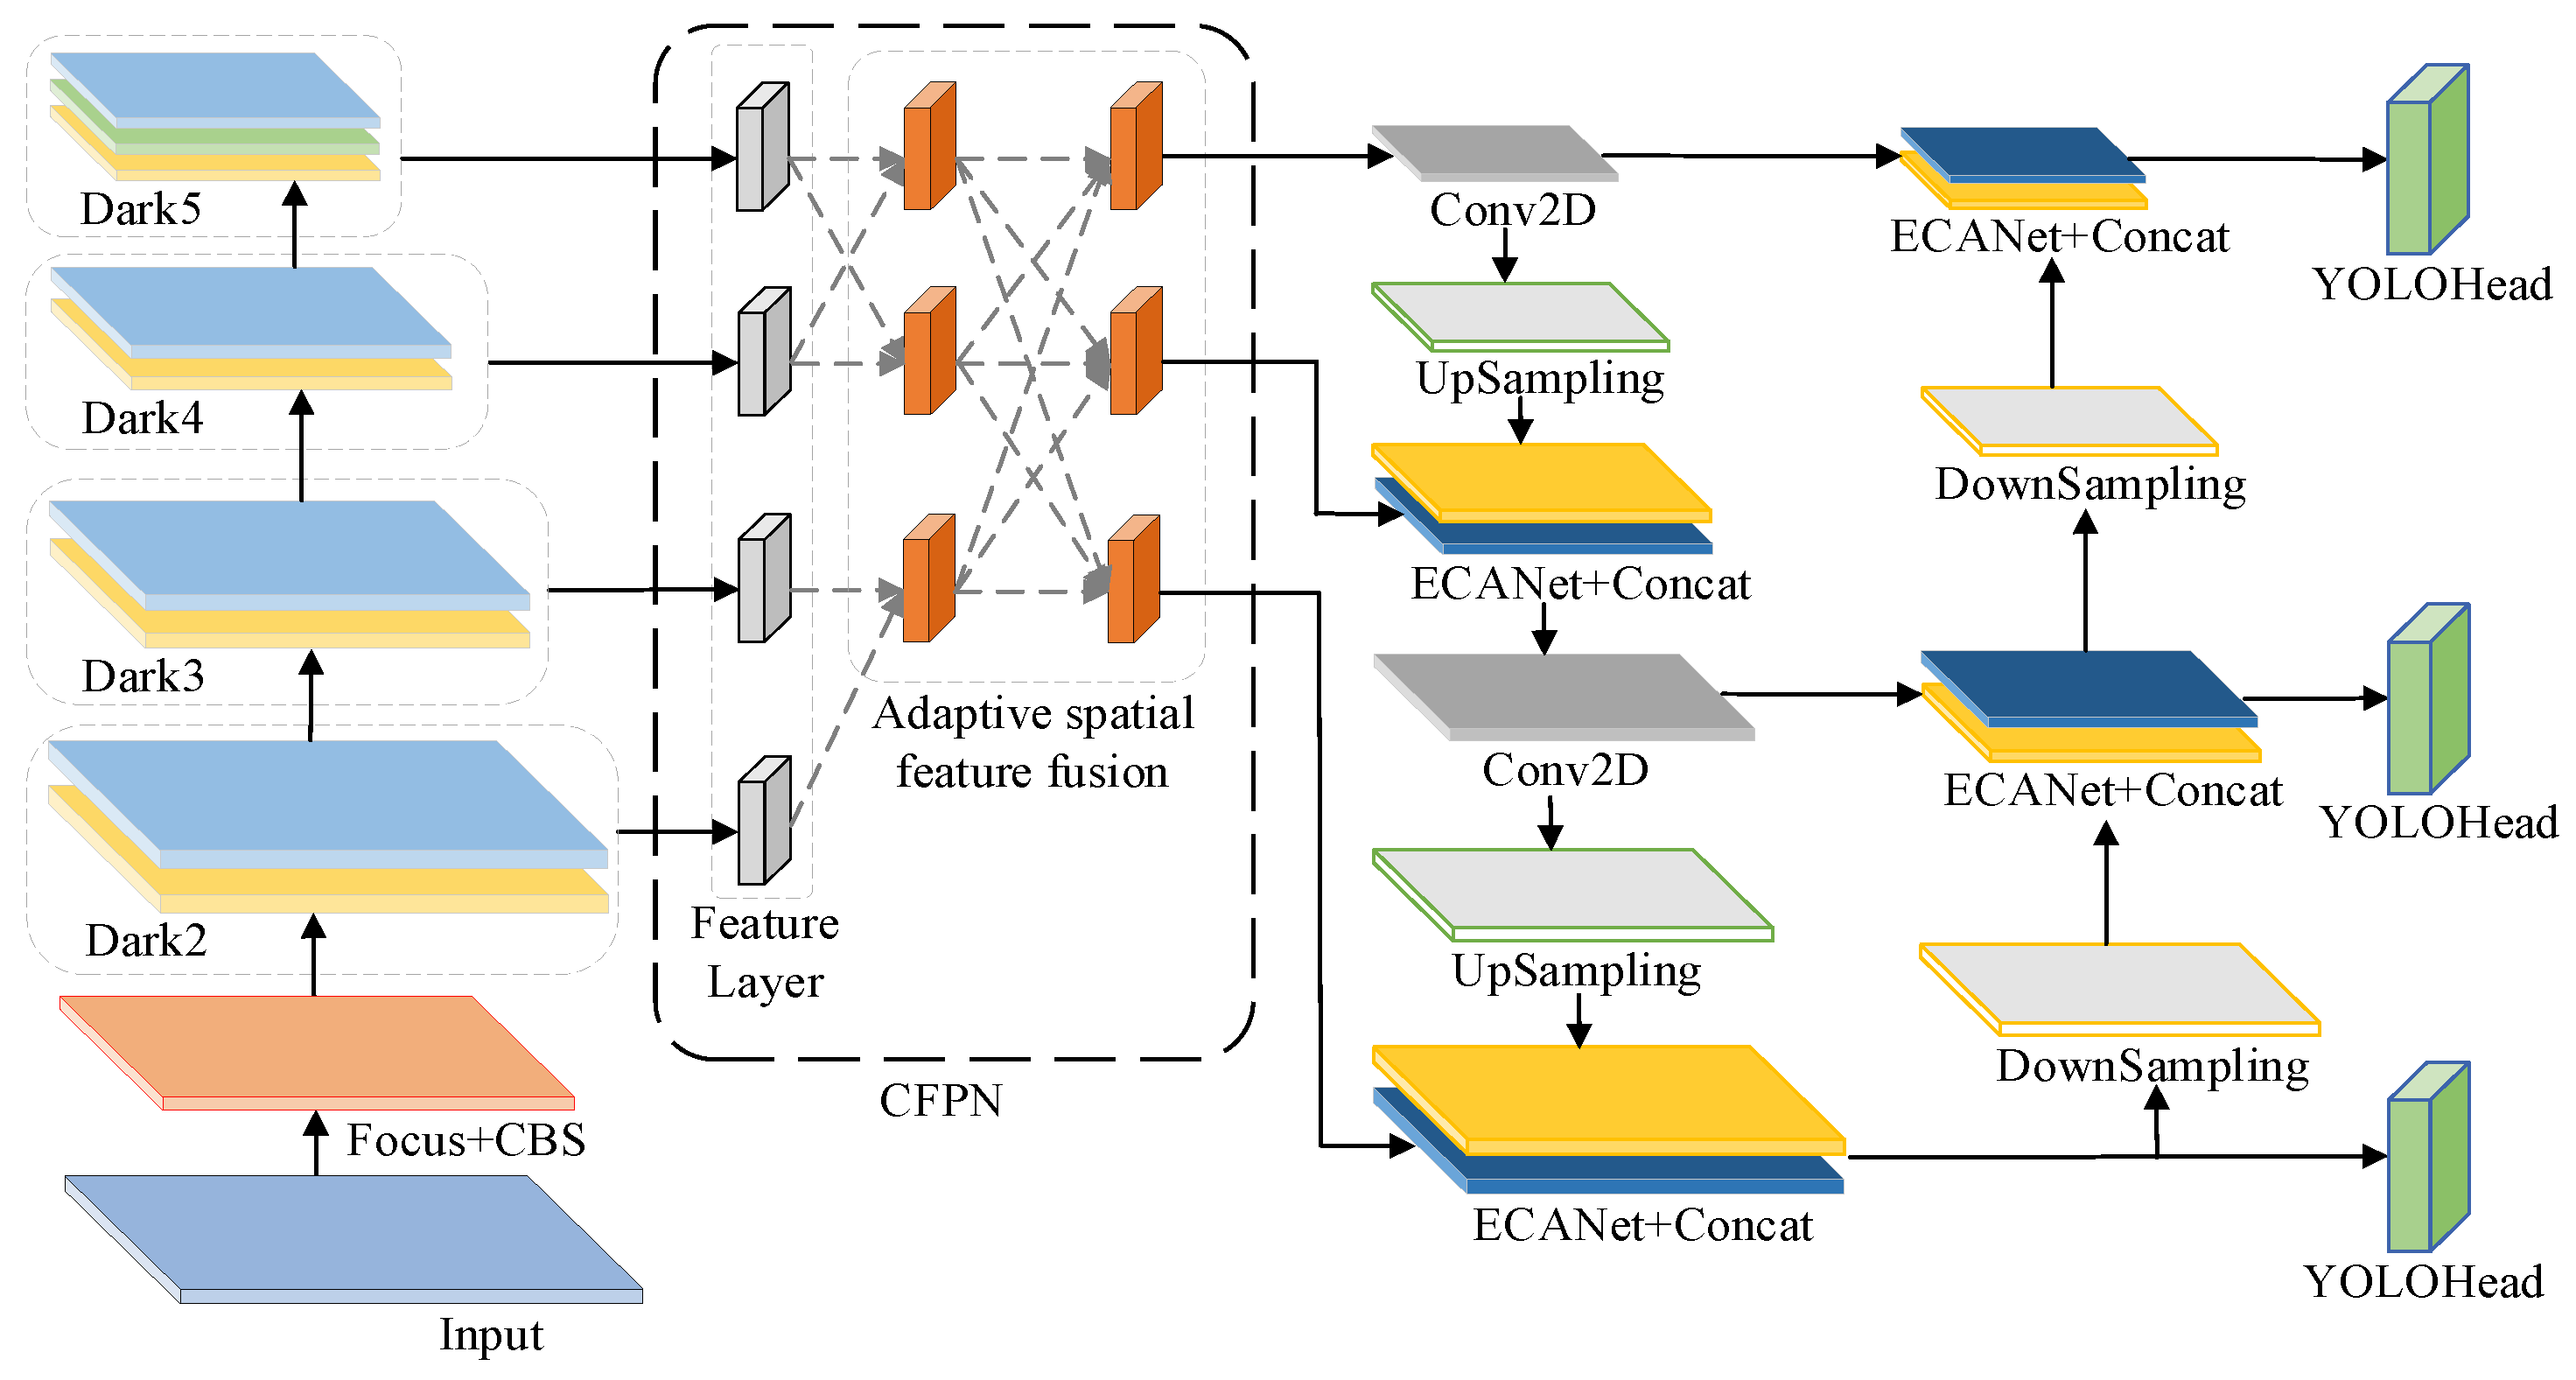
CFPN adopts multi-scale cross-feature fusion, and large-scale features are added during the feature fusion process to prevent large-scale feature information from being lost or degraded during transmission and interaction. Subsequently, cross-feature fusion of non-adjacent feature layers is carried out to concatenate feature information of different scales with each other. The specific structure of CFPN is to elicit a shallow feature Feature0 output from dark2 in YOLOX backbone network CSPdarknet, and cross fusion shallow feature Feature0 with the feature Feature1 output from dark3. In deep semantic information, dark4 is cross fusion with Feature2 and Feature3 output by dark5. This is followed by the second level of cross-feature fusion, where the second level of feature fusion cross-fuses the three scales of feature layers output from the first level of feature fusion with each other. In this level, non-adjacent shallow geometric features and deep semantic features are fused after being assigned different weights respectively, which solves the problem of large semantic gap between non-adjacent layers, and further utilizes spatial fusion to alleviate multi-target feature dispersion. The structure of CFPN is shown in
Figure 5.
The ASFF module in the CFPN structure is used with to adaptive fuse different scale features so that the network adaptive learns the weight of each scale’s features in the fusion process. The multi-scale feature cross-fusion process is divided into two levels, the first level is the cross-fusion of the neighboring feature maps of the upper and lower levels. The second level of cross feature fusion is the cross-fusion of the three-dimensional feature layers output from the first level. Take the first level of deep feature fusion as an example, where
and
are the feature vectors from the two scales of positions at
, which represent the feature vectors of each position in Feature2 and Feature3 in deep feature fusion, respectively. Multiplying
and
with the weight parameters
and
of the different feature layers
is obtained.
on the first level ASFF module represents the feature vector at
of the feature map after cross fusion. The two fused feature vectors
and
have the same dimensions as
and
, respectively. The first level of ASFF module feature fusion is shown in Equation 4.
Where
and
are used as weight parameters, defined by the SoftMax function to range between [0,1]. The control parameters
and
are determined by a 1×1 convolution. Finally, the ratio of individual control parameters to the sum of all control parameters is calculated to determine the weighting parameters
and
. The weighting parameters are calculated as shown in Equation 5.
3.3. ECANet Construction
Attention mechanisms are one way to realize adaptive attention in networks. Common implementations of attention mechanisms in deep learning are SENet[
38], ECANet[
39], CBAM[
40] and CoordAtt[
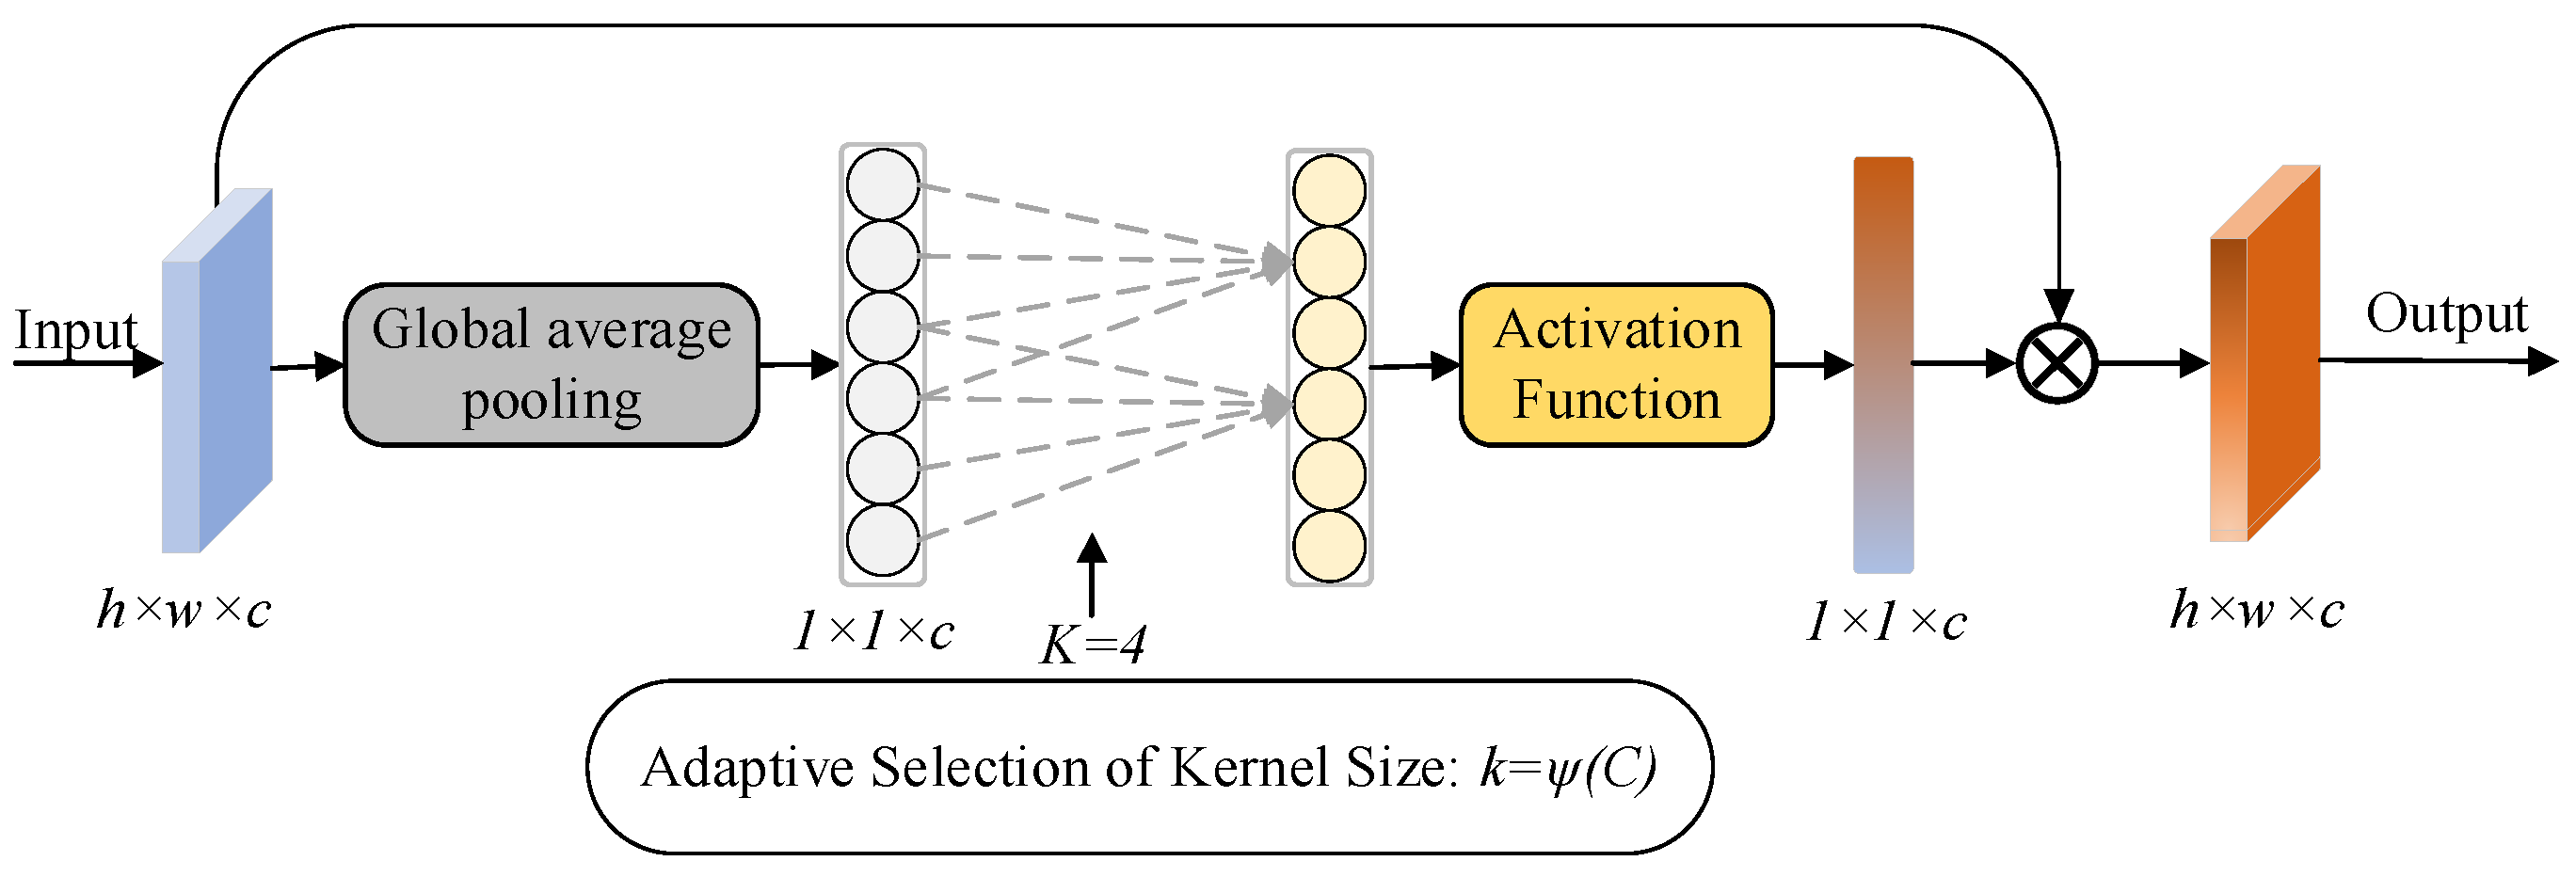
41]. The core focus of the attention mechanism is to allow the network to focus on what it needs to focus on more. Where ECA (Efficient Channel Attention) Net can be seen as an improved version of SENet and a form of implementation of the channel attention mechanism. ECANet uses an adaptive function to control the size of the convolution kernel to transform the feature map with input [h,w,c] into a normalized weight vector of [1,1,c], which is multiplied with the original map to obtain the weighted computed feature map. The adaptive function is shown in Equation 6.
Where
is the given channel dimension,
and
are experimental parameters, which take the values of 2 and 1, respectively, in the experiment. The convolution kernel size
is adaptive derived based on the number of input channels to obtain cross-channel information. The ECA module is shown in
Figure 6.
ECANet is added to the first and second feature layers after up-sampling and at the two down-samples of strengthen feature extraction layer. The add locations are shown in
Figure 7. Adding ECANet solves the problem of enhancing the feature extraction layer in the process of up-sampling and down-sampling of its key feature information is lost, in the process of feature extraction for the crack features to give different weight values, to ensure the continuity and integrity of the crack. The construction of EC-YOLOX network has been completed, and the network model is shown in
Figure 8.
3.4 Improvement of the loss function
The loss function is used to estimate the performance of the network model and guide the training of the model. The loss function of YOLOX is composed of several parts, including the category prediction loss, the target box regression loss, and the target existence probability loss. The total loss function is shown in Equation 7.
Where
is used to obtain the species predicted loss;
is used to calculate the marginal regression loss of the target; and
is used to obtain the probability loss of the presence of the target. The total predicted loss value is obtained by summing the 3 loss values. Common localization loss algorithms include IoU, GIoU (generalized IoU), DIoU (distance IoU), CIoU (complete IoU) and EIoU (efficient-IoU)[
42,
43,
44].
WEIOU (weight efficient IoU) is proposed to replace the original loss function because of the flaws in the calculation of IoU (intersection over union) in the border regression loss
. The WEIoU loss function consists of the overlap area loss, the predicted box width loss and the predicted box height loss. A penalty terms affected by the aspect ratio of the labeled box is added for the high aspect ratio of the real box of the crack. The weights of the real box in the height and width are calculated respectively, and the loss in the width and height direction is given different weights, and the height and width losses of the prediction box and the real box are multiplied by the weight function. WEIOU improves the convergence speed and positioning effect of fracture samples with large aspect ratio, and solves the problem of unbalanced loss calculation caused by too large aspect ratio of target box. The WEIoU loss function is shown in Equation 8.
Where is the width of the actual box; is the height of the actual box; is the width of the predicted box; is the height of the predicted box; and are the width and height of the smallest outer rectangle of the predicted target box and the actual target box.
4. Experimental Results and Analysis
4.1. Experimental Data
The acquisition and analysis of crack images is the main method to realize the detection and classification of pavement cracks[
45,
46,
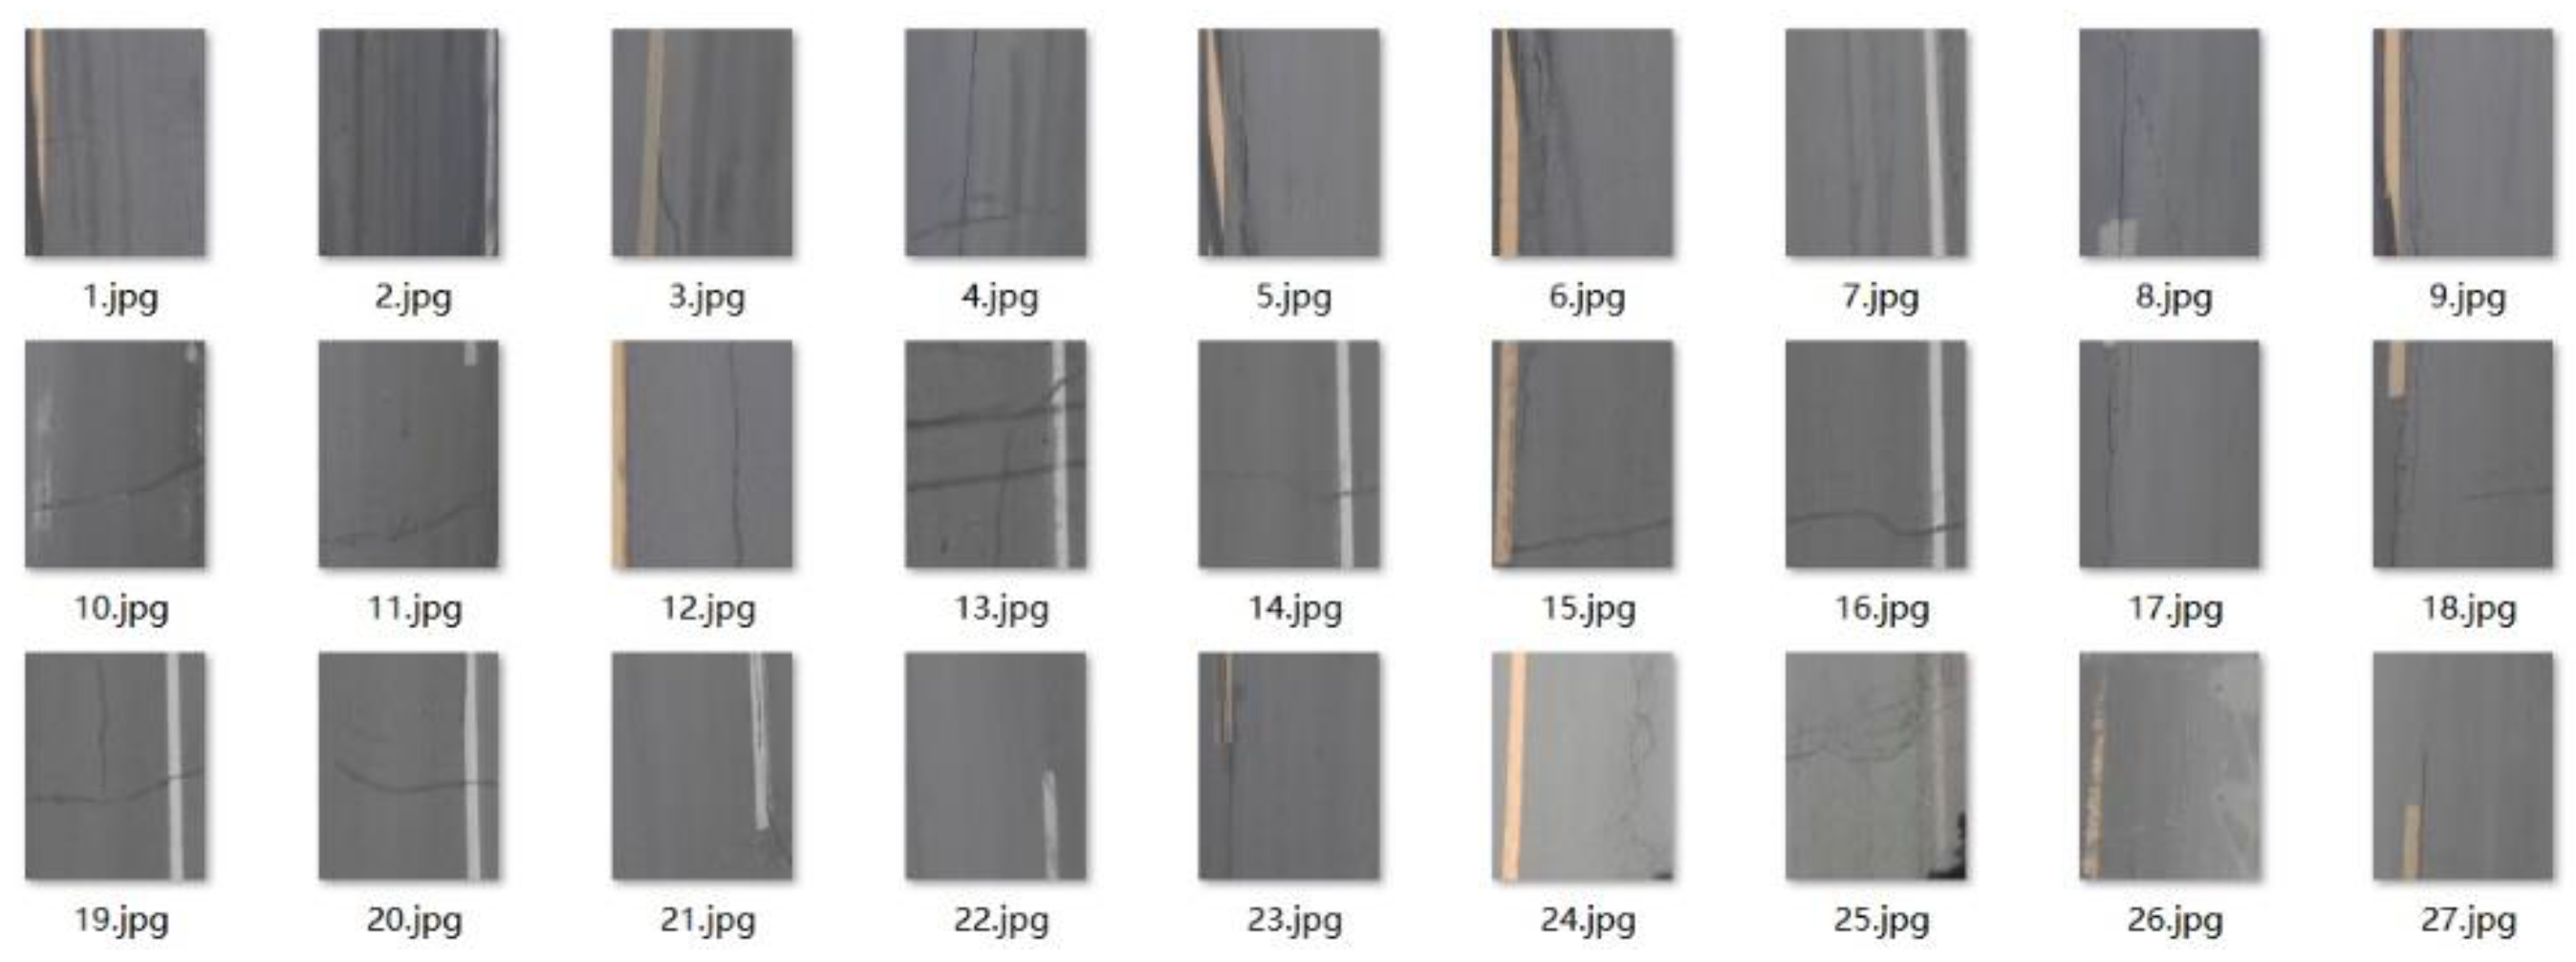
47]. In this study, Hikvision T-type vehicle camera was used to collect road image data in Shenyang, Liaoning province. The obtained road image data is corrected by geometric distortion constraint and the crack data set is established. In order to enrich the diversity of samples and increase the number of samples, the corrected image is segmented according to a certain area, and the size of the segmented image is 640*800. The self-built dataset image is shown in
Figure 9.
According to the classification of crack diseases in pavement diseases, the labeling types are divided into five categories. They are Vertical crack, Horizontal crack, potholes, Regional crack and repaired crack. There are a total of 2858 pavement image data after processing and labeling, and the number of labels in the sample are shown in
Table 1.
4.2. Training Environment and Evaluation Indicators
The individual parameters of the computer hardware used in this experiment are mainly shown by
Table 2. The specific training parameters of the network model are shown by
Table 3.
In the prediction of the model, the prediction results can be categorized into four cases: True Positive (TP): the prediction is correct, the prediction result is positive, and the actual sample is positive; False Negative (FN): the prediction is incorrect, and the prediction result is negative; False Positive (FP): the prediction is incorrect, and the prediction result is positive, and the actual sample is negative. False Positive (FP): the prediction is wrong, the prediction result is positive, and the actual sample is negative. True Negative (TN): the prediction is correct, the prediction result is negative, and the actual sample is negative.
Evaluation metrics: Compared to other models for target detection, YOLOX’s evaluation metrics are mainly based on precision, recall and mean accuracy value (mAP). Precision is the ratio between the correct samples of the model prediction success and all the correct samples of the model prediction as shown in Formula 9. Recall is the ratio between the correct samples successfully predicted by the model and actually all the correct samples, expressed as a percentage. As shown in Formula 10. The number of categories to be classified by the model is denoted by n. In this study, there are five types of crack categories. AP is the area under the Precision-Recall Curve (P-R Curve), and mAP is the average of the APs of the different categories. mAP is shown in Equation 11.
4.3. Pavement Image Correction Results
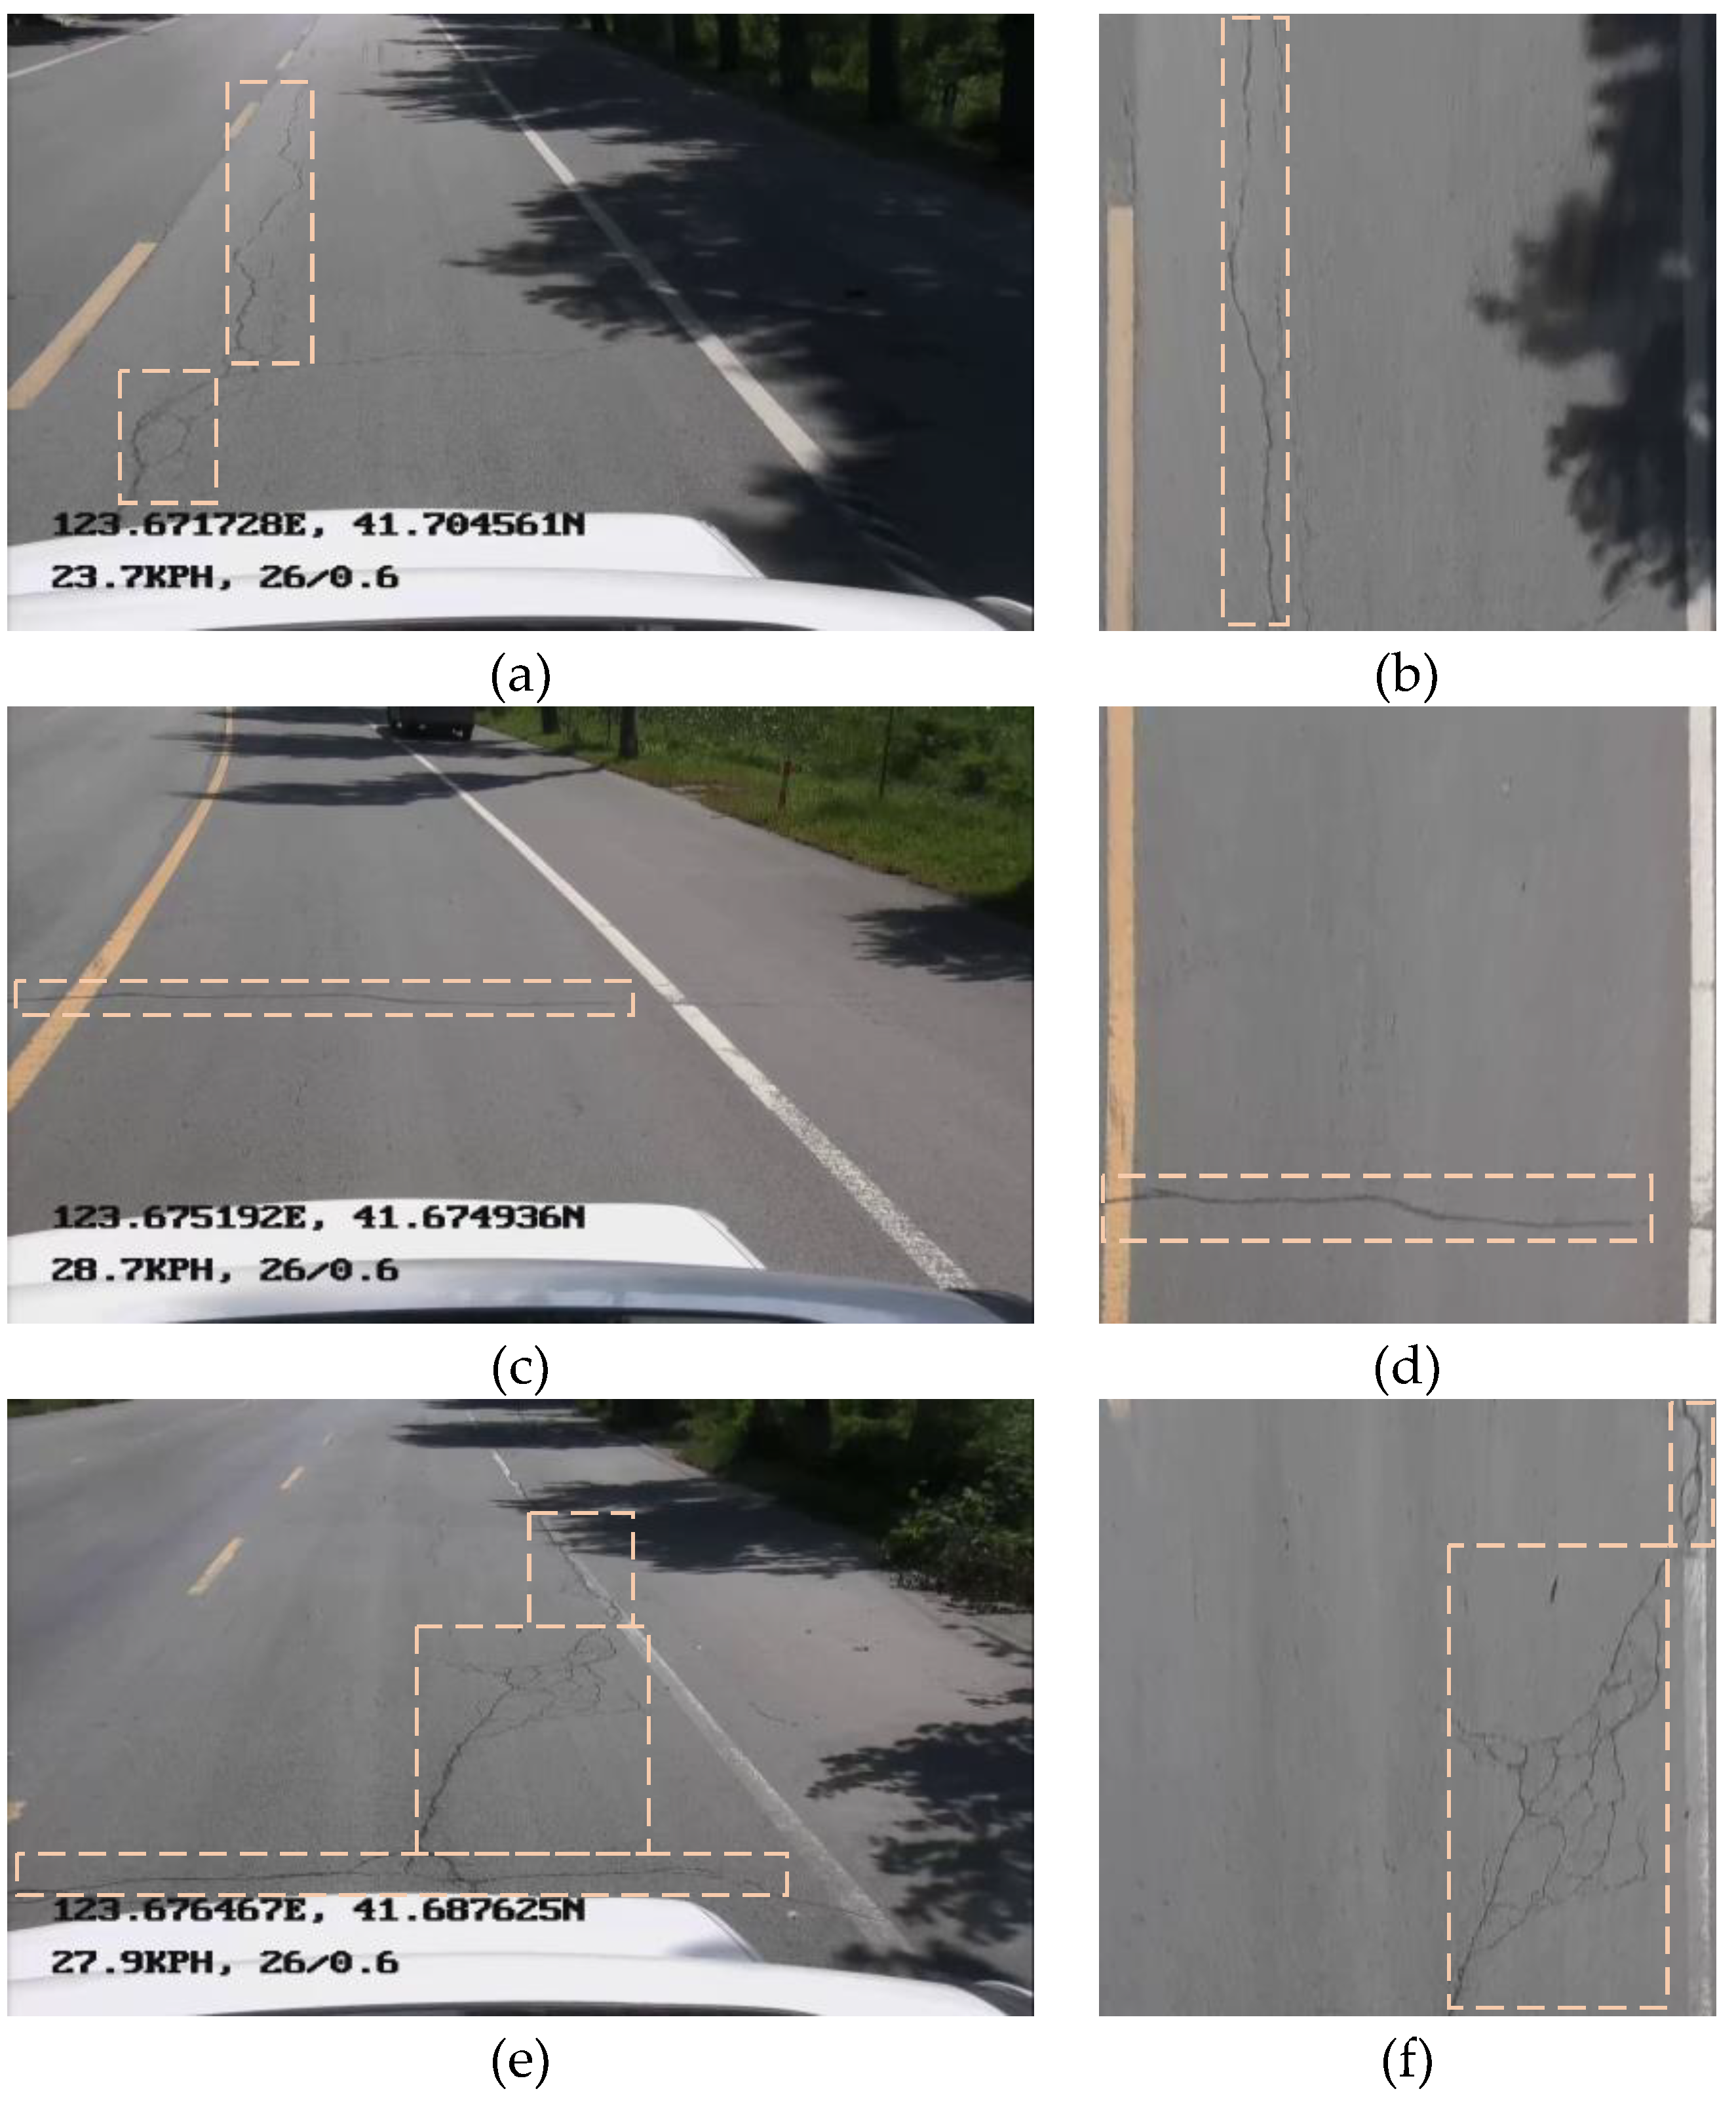
A geometric distortion constraint correction is used on the pavement image to obtain a pavement image of the area of interest inside the lane. The corrected image removes the pavement background that adversely affects the inspection results and corrects the single-point perspective projection map to an orthographic image in a bird’s eye view. A comparison of the pavement image and the sample labeling of the corrected image is shown in
Figure 10. The distortion produced by longer and multi-segment cracks in the pavement image has a large impact on the sample labeling, and the original image contains a large amount of background when labeling, the comparison effect is shown in
Figure 10(a) and
Figure 10(b). The geometric distortion has little effect on the transverse crack, and the deviation of the target box between the original image and the corrected image is small. The comparison effect is shown in
Figure 10(c) and
Figure 10(d). When labeling regional cracks, the images from two different viewpoints have a greater impact on the regional cracks. Uncorrected image labeling when the labeling box reflects the crack region is not real, the distortion produced at the far end from the lens is large, which is not conducive to the labeling of the target box and the detection of cracks. The labeling effect is shown in
Figure 10(e) and
Figure 10(f).
Using global adaptive threshold to process the crack target box before and after correction, the comparison of crack sample labeling before and after correction is shown in
Figure 11.
Figure 11(a) shows the uncorrected crack labeling box after threshold.
Figure 11(b) After correcting the crack labeling box compared with the former, the cracks accounted for a significantly larger area of the labeling region, and the labeling box contains fewer pavements background, which reduces the impact of the complex pavement background on the crack samples when labeling and training.
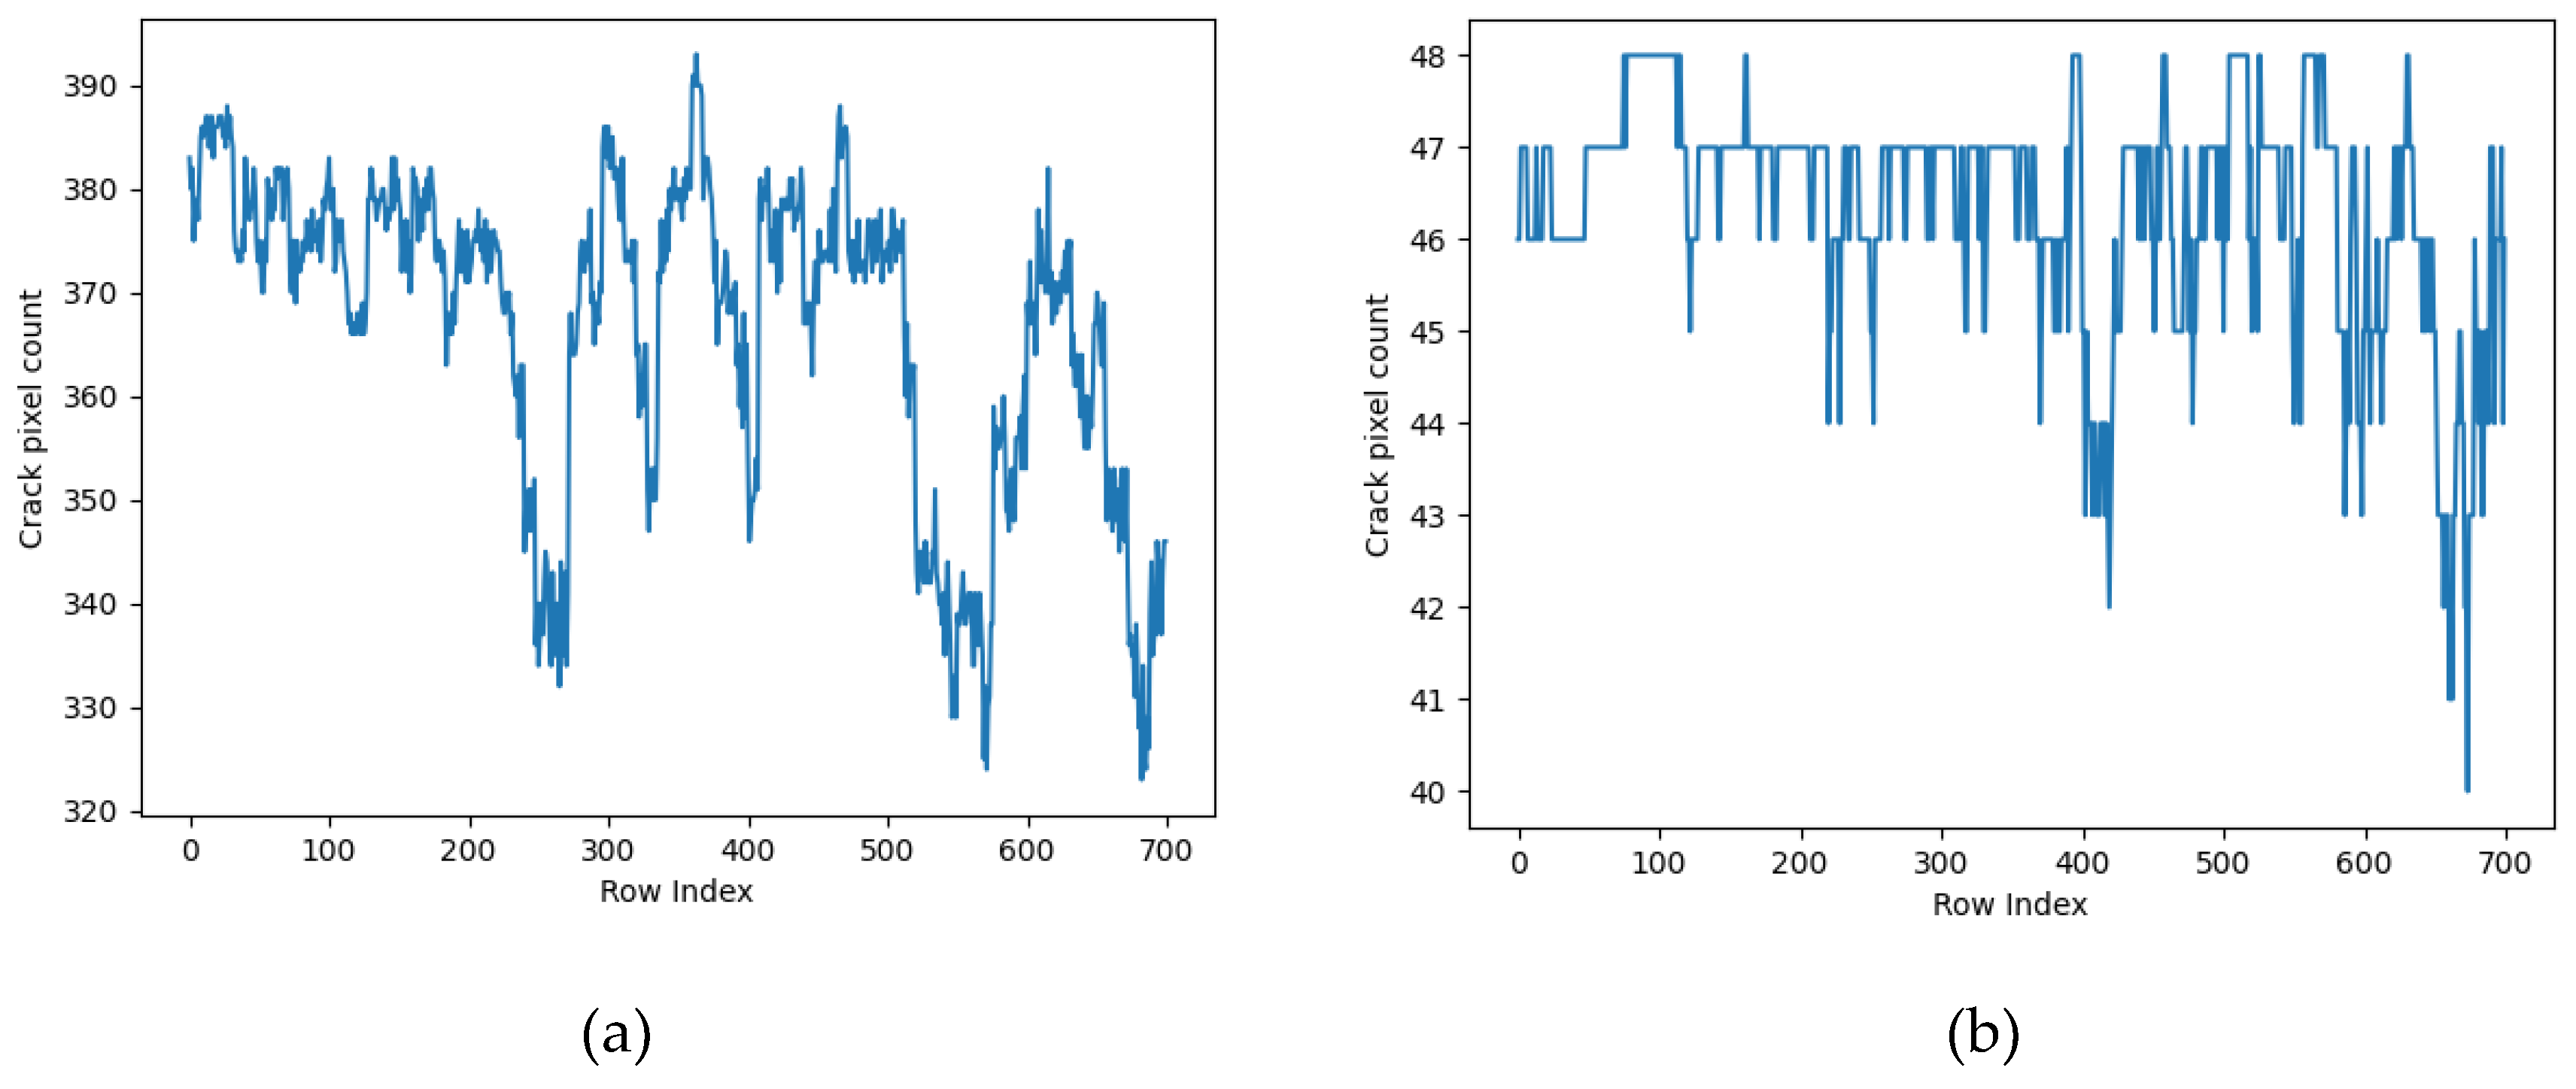
The fracture geometry is simulated by using the gray distribution, and the histogram grays statistics is performed on the marked area. The statistical diagram of crack gray distribution is shown in
Figure 12. Compared with the uncorrected crack gray distribution, the corrected crack gray distribution is smoother and the deviation is smaller. Experiments show that the geometric distortion constraint correction can change the geometric shape of the crack, and achieve the purpose of eliminating the complex background and optimizing the data structure of the crack sample.
4.4. Comparative Experiment of Test Results
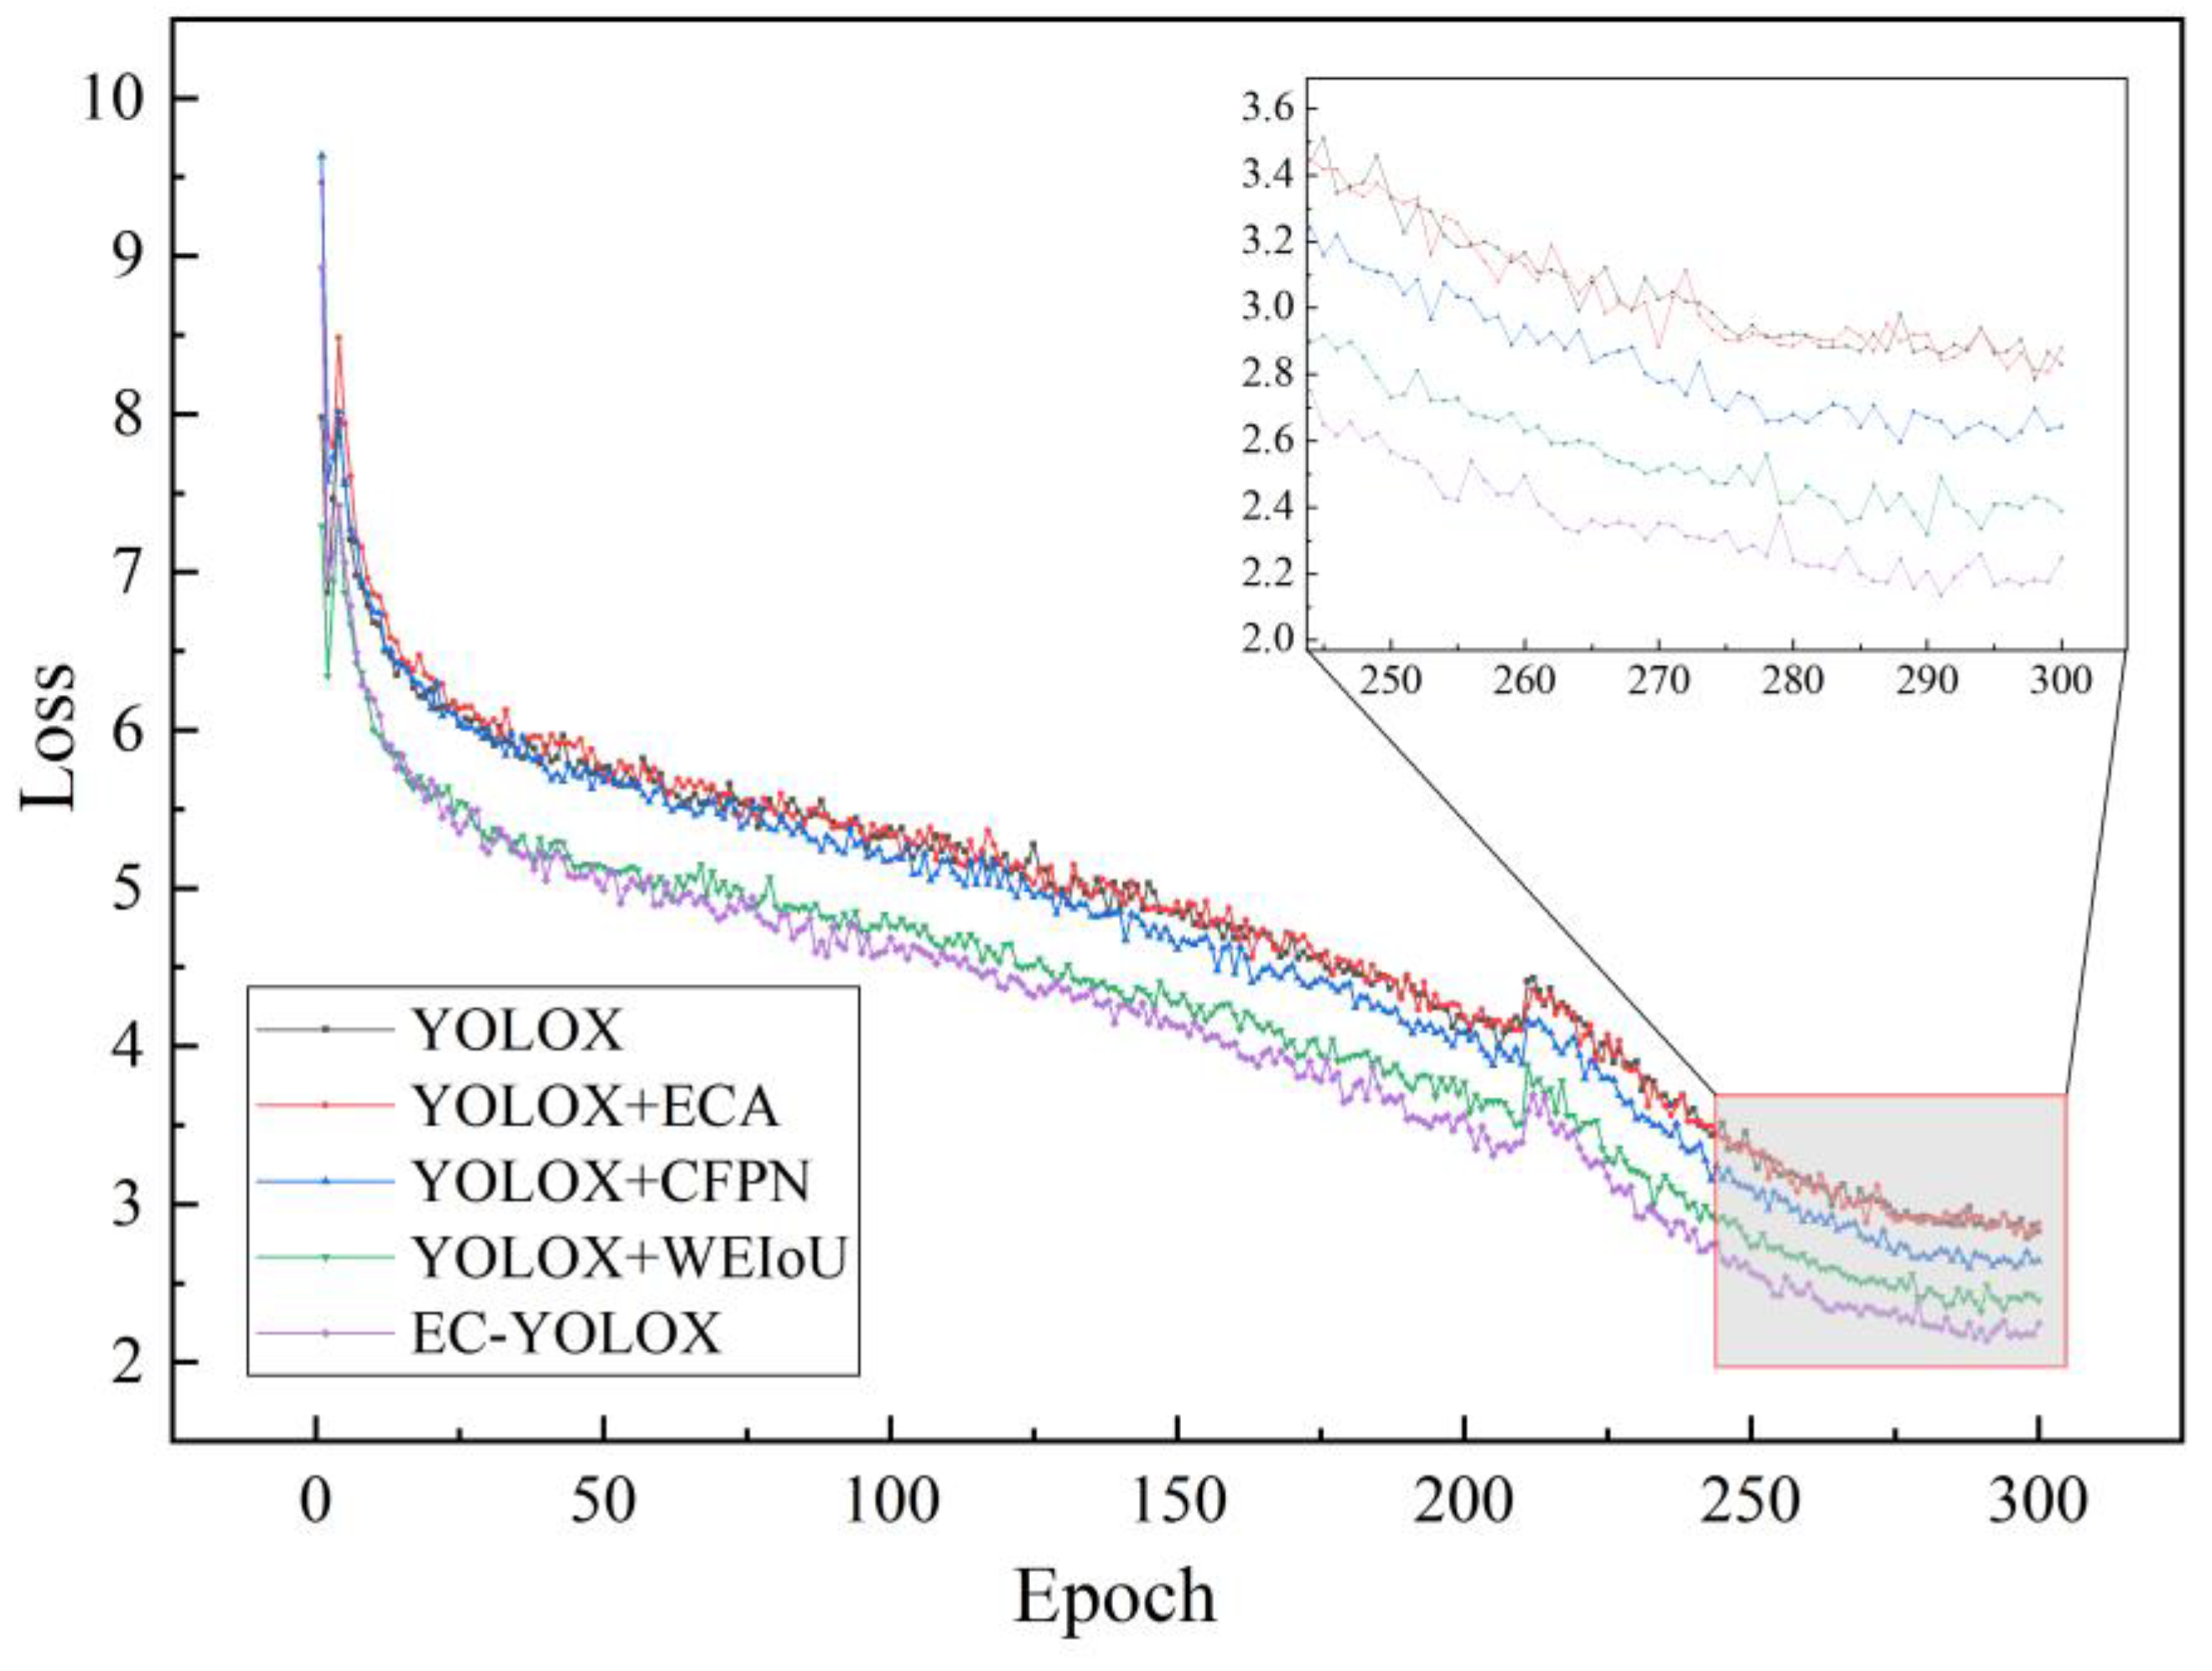
In response to the complexity of road crack samples, the vulnerability of geometric features to loss, and the presence of numerous noise in the road background, we have compared the experimental parameters of YOLOX-s, YOLOX-E with ECANet added at up- sampling and down-sampling, YOLOX-C with improved network feature output layer CFPN, and EC-YOLOX. The minimum loss of EC-YOLOX network model is 2.136, while the corresponding minimum losses of YOLOX-s, YOLOX-C and YOLOX-E are 2.784, 2.807 and 2.597, respectively. The minimum loss of YOLOX-W with the improved loss function of WEIoU is 2.319, which is effectively reduced compared with other network models that have not been improved. In the comparison of EC-YOLOX with other network models, it has the smallest loss value, which verifies that adding the WEIoU loss function and improving the network model can effectively reduce the loss of the network model. The loss curves of different models are shown in
Figure 13.
After improving the network model, the mAP of EC-YOLOX on the self-built dataset reached 76.34%. Compared with YOLOX-s, mAP increased by 4.45%. Compared with YOLOX-s, EC-YOLOX has achieved varying degrees of improvement in Precision, F1, and Recall. Precision has increased by 0.21%, while F1 and Recall have improved by 0.04 and 5.86%, respectively. This suggests that EC-YOLOX has strong detection capabilities for positive samples, achieving higher accuracy in identifying positive samples and fewer instances of misclassifying positive samples as other samples. Compared with other types of YOLOv3-Darknet, YOLOv4-CIoU, YOLOv5-Darknet, and YOLOv7-l, EC-YOLOX has excellent detection accuracy and efficiency. The mAP has improved by 11.85%, 9.26%, 6.72%, and 8.34%, respectively. The comparison of GFLOPS, params, and accuracy is shown in
Table 4.
Furthermore, the improved network models accuracy improvement was verified using the public crack dataset CrackForest[
48]. EC-YOLOX performed better on the public dataset, with an average detection accuracy improvement of 2.31% compared to YOLOX. The comparison of model accuracy on the public dataset is shown in
Table 5.
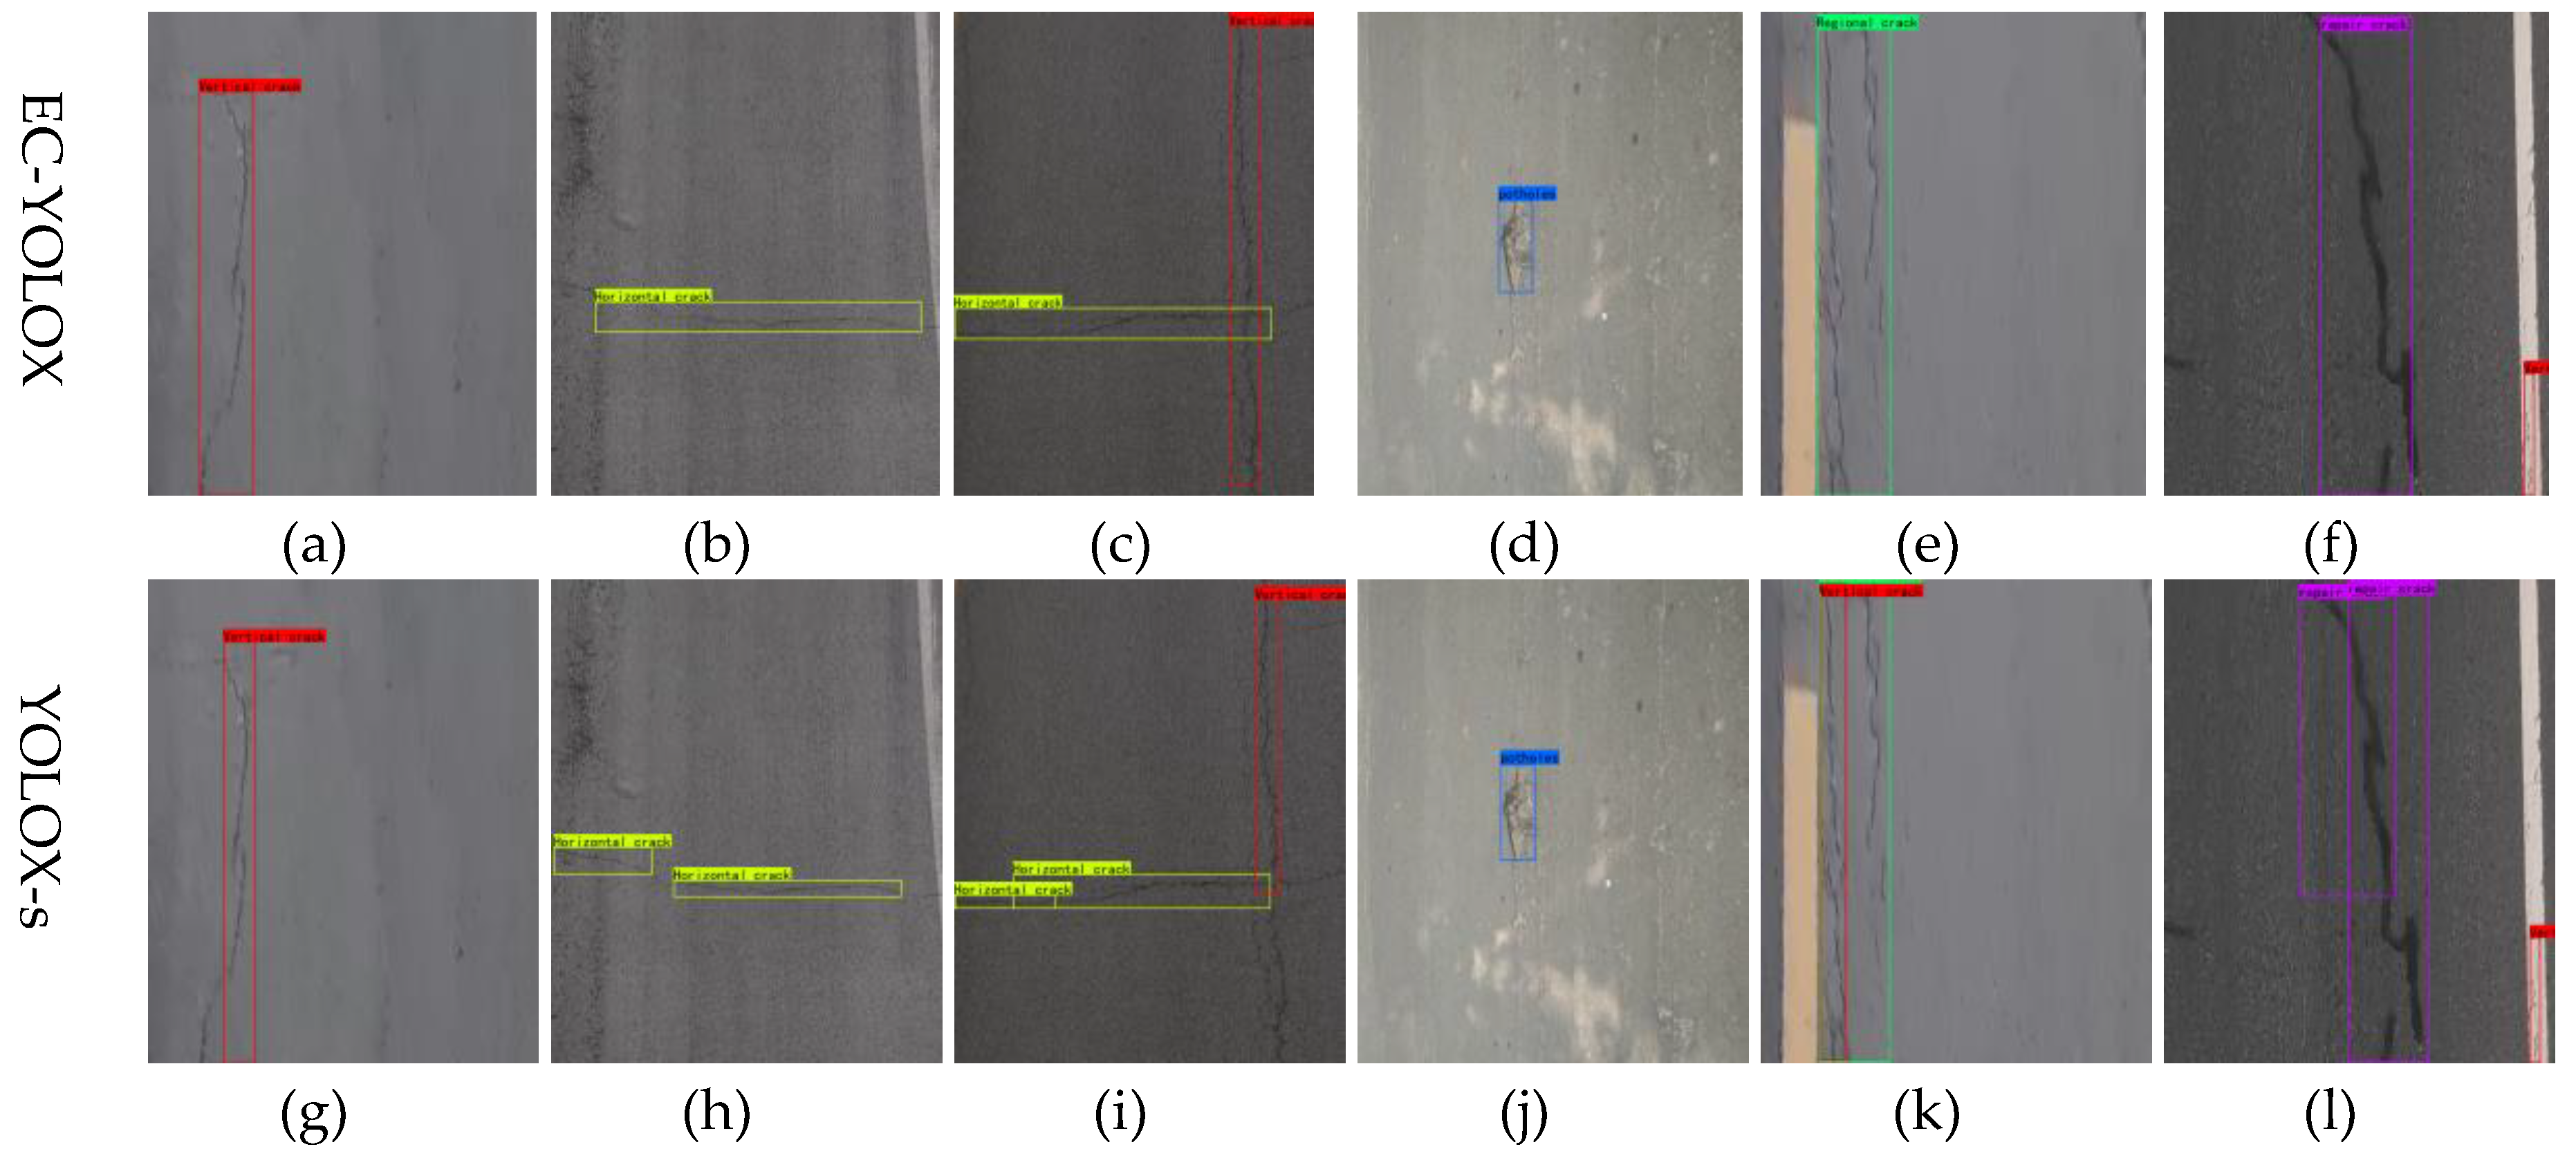
The final detection results comparison shows that EC-YOLOX has strong multi-scale feature recognition ability, can better focus on the geometric features of cracks, and improve the models detection ability of crack integrity through cross-channel information fusion. Compared with YOLOX, EC-YOLOX has better detection accuracy and stronger detection of crack integrity. The comparison of the proposed model with existing YOLOX-s detection results is shown in
Figure 14.
When identifying narrow vertical cracks, the EC-YOLOX network can resist interference from regions were crack features are not obvious, and identify the entire crack as a narrow crack. The YOLOX-s identifies vertical crack with narrower bounding boxes, and fails to focus on the large-scale geometric features of cracks, resulting in slightly worse integrity. The detection of vertical cracks is shown in
Figure 14(a) and
Figure 14(g). The detection results of horizontal cracks are similar to those of vertical cracks. Compared to YOLOX, EC-YOLOX captures shallow semantic information, focuses on the geometric edge features of cracks, and has better overall detection performance. The detection of horizontal cracks is shown in
Figure 14(b) and
Figure 14(h). In many road damage cases, horizontal and vertical cracks often coexist. As shown in
Figure 14(c) and
Figure 14(i), EC-YOLOX has higher detection quality for both horizontal and vertical cracks in the same image, with good overall detection of cracks. The comparison of pothole detection is shown in
Figure 14(d) and
Figure 14(j). When detecting regional cracks, EC-YOLOX is able to focus on the overall integrity of the cracks by leveraging the multi-scale information provided by the network. This allows it to detect all cracks within the region, while YOLOX-s identifies the region as containing two different types of cracks. This is highly undesirable in road pavement quality assessment, as it not only increases the number of detected defects, but also prevents a true evaluation of the road’s actual damage condition. The comparison of detection is shown in
Figure 14(e) and
Figure 14(k). In the detection of repaired cracks, EC-YOLOX focuses on the overall integrity of the repaired cracks, ensuring that the samples are contained within a single detection region. In contrast, YOLOX-s exhibits slight overlap in the detection regions during the detection process. The comparison of detection is shown in
Figure 14(f) and
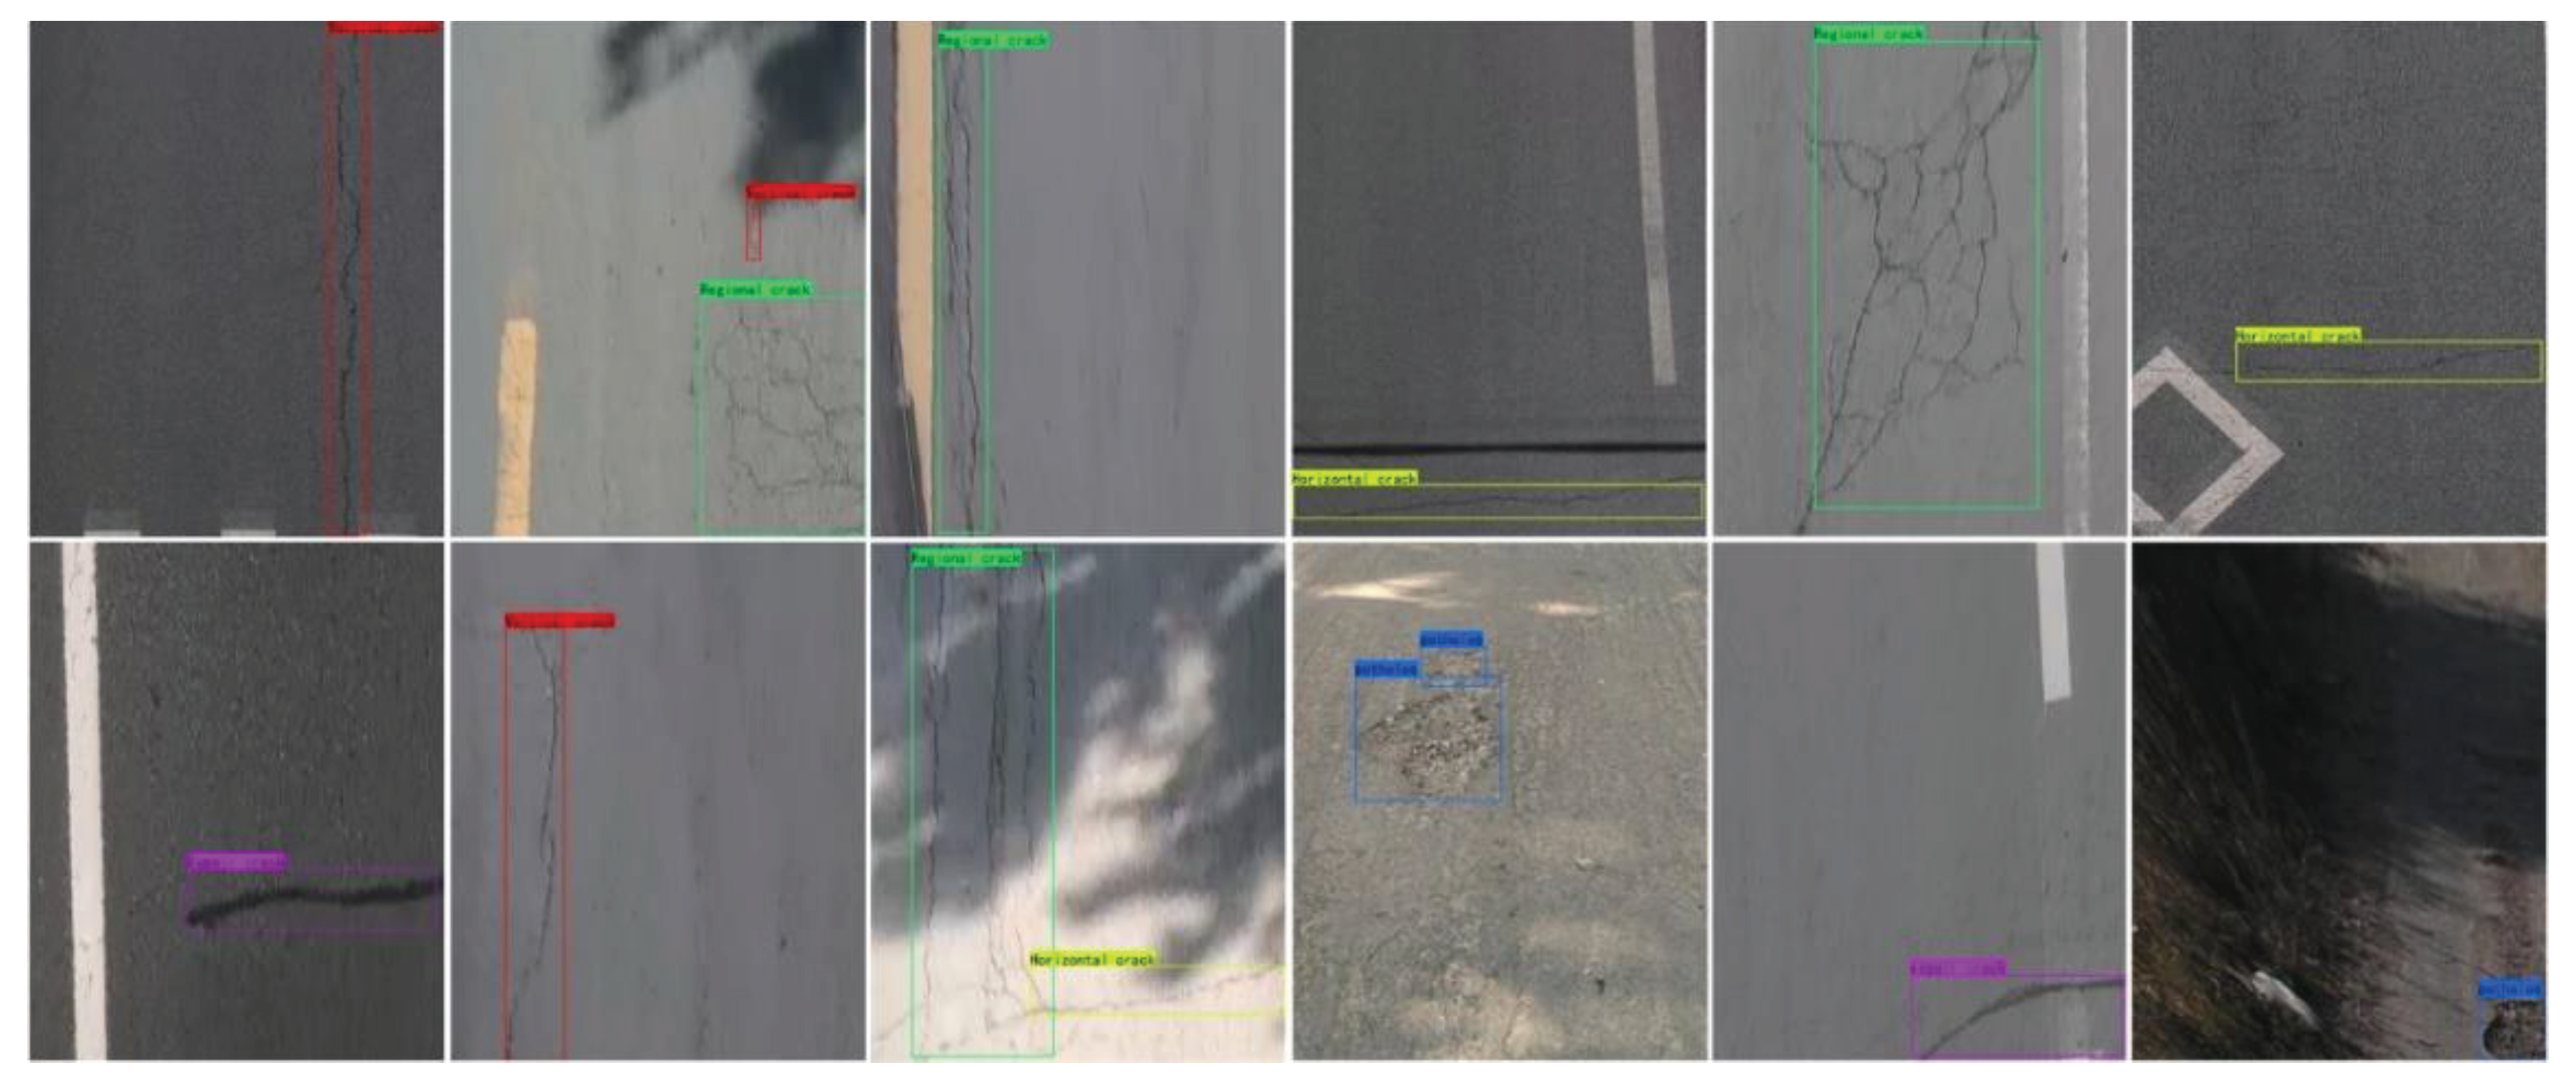
Figure 14(l). Other detection results of EC-YOLOX are shown in
Figure 15.
5. Discussion
The experimental results show that YOLOX-w with WEIoU can slightly increase mAP, which is only 0.9 % higher than that of YOLOX. Combined with
Figure 7, the main function of the WEIoU loss function is to enhance the positioning ability of the target frame, reduce the loss in the network training process, and make the loss calculation more reasonable. The YOLOX-C, which incorporates the addition of CFPN to enhance the feature output layer of the backbone network, demonstrates a 2.5% improvement in average precision compared to YOLOX. Combining this with the analysis of the loss curve in
Figure 7, it is observed that the incorporation of CFPN can, in situations of precision improvement, marginally reduce the loss values during network training. In YOLOX-E, which enhances the feature extraction layer by incorporating the ECA attention module, a 2.99% improvement in detection accuracy is achieved compared to YOLOX. Experimental results demonstrate that the addition of attention mechanisms enables the model to focus on relevant features, thereby enhancing the overall detection accuracy of the network. The proposed EC-YOLOX, in this study, achieves an average precision of 76.34%, showcasing the best performance among all evaluated networks. This validates the effectiveness of the proposed network model in detecting road surface crack diseases. Detailed data comparisons are provided in
Table 6.
By introducing the ECA module, YOLOX+ECA achieves a recognition accuracy of 74.88% on the self-constructed dataset for object detection. In comparison with other network models incorporating attention modules, the mAP is improved by 1.24%, 0.97%, and 0.89%, respectively. The addition of the ECA attention module leads to a respective improvement of 0.02% in F1 and 3.56% in Recall compared to YOLOX-s. This indicates that the inclusion of the ECA attention module results in the correct detection of more positive samples, as opposed to detecting many samples with only a small fraction being positive. Furthermore, the network models with the added ECA attention module demonstrates a significant improvement in accuracy and other parameters compared to network models with other attention modules. Detailed model accuracy data comparisons are provided in
Table 7.
Although the EC-YOLOX network demonstrates superior detection performance compared to other networks, there remains room for further optimization in the network architecture. Some small cracks with grayscale values highly similar to the road background are prone to being missed. In future research, the integration of hardware devices with deep learning neural networks will continue to be explored, aiming to merge the characteristics of data acquisition with this of network models. Moreover, continuous optimization of the network model will be conducted to address small cracks with grayscale values similar to the road background, enhancing the network’s ability to extract features from different dimensions.
6. Conclusions
This study aims to enhance the efficiency of highway quality inspection by collecting road surface image data in Shenyang. For road quality inspection, data is collected using a vehicle camera, and a geometric distortion constraint method is proposed to rectify the collected data. After rectification, road surface background unrelated to cracks is excluded, enhancing the spatial continuity and integrity of road cracks. The EC-YOLOX network model is constructed to detect road surface crack diseases, employing the CFPN to extract shallow features of the backbone network and cross-fusing features at various scales. By incorporating the ECANet into strengthen feature extraction layer, the geometric characteristics of elongated and small continuous cracks in the entire image are emphasized, enabling the crack features to gain stronger attention from the network. Finally, the WEIoU is employed to adjust the loss function calculation method. Different weight penalty terms are added to the loss in the width and height directions of the target box, improving the localization capability of the target box. In comparison to the YOLOX network, the minimum value of the loss function decreases from 2.784 to 2.136, and the average detection accuracy improves by 4.45%. The results demonstrate that the proposed EC-YOLOX is effective in detecting road surface cracks with enhanced robustness, making it more suitable for the detection and application of road surface cracks in practical scenarios.
Author Contributions
Methodology, Zeyu Liu; Resources, Xin Lu; Writing – original draft, Lishuang Sun; Writing – review & editing, Zhiwei Xie.
References
- Staniek, M. Detection of cracks in asphalt pavement during road inspection processes. Zeszyty Naukowe. Transport/Politechnika Śląska 2017. [Google Scholar]
- Munawar, H.S.; Hammad, A.W.; Haddad, A.; Soares, C.A.P.; Waller, S.T. Image-based crack detection methods: A review. Infrastructures 2021, 6, 115. [Google Scholar] [CrossRef]
- Cuevas, E.; Zaldivar, D.; Pérez-Cisneros, M. A novel multi-threshold segmentation approach based on differential evolution optimization. Expert Systems with Applications 2010, 37, 5265–5271. [Google Scholar] [CrossRef]
- Sahoo, P.K.; Soltani, S.; Wong, A.K. A survey of thresholding techniques. Computer vision, graphics, and image processing 1988, 41, 233–260. [Google Scholar] [CrossRef]
- Deng, J.; Xuan, X.; Wang, W.; Li, Z.; Yao, H.; Wang, Z. A review of research on object detection based on deep learning. In Proceedings of the Journal of Physics: Conference Series; 2020; p. 012028. [Google Scholar]
- Krizhevsky, A.; Sutskever, I.; Hinton, G.E. Imagenet classification with deep convolutional neural networks. Advances in neural information processing systems 2012, 25. [Google Scholar] [CrossRef]
- Girshick, R. Fast r-cnn. In Proceedings of the Proceedings of the IEEE international conference on computer vision, 2015; pp. 1440–1448.
- Ren, S.; He, K.; Girshick, R.; Sun, J. Faster r-cnn: Towards real-time object detection with region proposal networks. Advances in neural information processing systems 2015, 28. [Google Scholar] [CrossRef] [PubMed]
- He, K.; Gkioxari, G.; Dollár, P.; Girshick, R. Mask r-cnn. In Proceedings of the Proceedings of the IEEE international conference on computer vision, 2017; pp. 2961–2969.
- Redmon, J.; Farhadi, A. Yolov3: An incremental improvement. arXiv 2018, arXiv:1804.02767. [Google Scholar]
- Redmon, J.; Farhadi, A. YOLO9000: better, faster, stronger. In Proceedings of the Proceedings of the IEEE conference on computer vision and pattern recognition, 2017; pp. 7263–7271.
- Redmon, J.; Divvala, S.; Girshick, R.; Farhadi, A. You only look once: Unified, real-time object detection. In Proceedings of the Proceedings of the IEEE conference on computer vision and pattern recognition, 2016; pp. 779–788.
- Bochkovskiy, A.; Wang, C.-Y.; Liao, H.-Y.M. Yolov4: Optimal speed and accuracy of object detection. arXiv 2020, arXiv:2004.10934. [Google Scholar]
- Gavilán, M.; Balcones, D.; Marcos, O.; Llorca, D.F.; Sotelo, M.A.; Parra, I.; Ocaña, M.; Aliseda, P.; Yarza, P.; Amírola, A. Adaptive road crack detection system by pavement classification. Sensors 2011, 11, 9628–9657. [Google Scholar] [CrossRef]
- Zou, Q.; Zhang, Z.; Li, Q.; Qi, X.; Wang, Q.; Wang, S. Deepcrack: Learning hierarchical convolutional features for crack detection. IEEE transactions on image processing 2018, 28, 1498–1512. [Google Scholar] [CrossRef]
- Nishikawa, T.; Yoshida, J.; Sugiyama, T.; Fujino, Y. Concrete crack detection by multiple sequential image filtering. Computer-Aided Civil and Infrastructure Engineering 2012, 27, 29–47. [Google Scholar] [CrossRef]
- Liu, Y.; Zhong, B.; Zheng, H. Algorithm for detecting straight line segments in color images. Laser Optoelectron. Prog 2019, 56, 211002. [Google Scholar]
- Wei, N.; Zhao, X.; Wang, T.; Song, H. Mathematical morphology based asphalt pavement crack detection. In Proceedings of the International Conference on Transportation Engineering 2009; 2009; pp. 3883–3887. [Google Scholar]
- Yin, G.; Gao, J.; Gao, J.; Li, C.; Jin, M.; Shi, M.; Tuo, H.; Wei, P. Crack identification method of highway tunnel based on image processing. Journal of Traffic and Transportation Engineering (English Edition) 2023. [Google Scholar]
- Wang, W.; Wang, M.; Li, H.; Zhao, H.; Wang, K.; He, C.; Wang, J.; Zheng, S.; Chen, J. Pavement crack image acquisition methods and crack extraction algorithms: A review. Journal of Traffic and Transportation Engineering (English Edition) 2019, 6, 535–556. [Google Scholar] [CrossRef]
- Guo, Y.; Liu, Y.; Georgiou, T.; Lew, M.S. A review of semantic segmentation using deep neural networks. International journal of multimedia information retrieval 2018, 7, 87–93. [Google Scholar] [CrossRef]
- Zhang, L.; Yang, F.; Zhang, Y.D.; Zhu, Y.J. Road crack detection using deep convolutional neural network. In Proceedings of the 2016 IEEE international conference on image processing (ICIP); 2016; pp. 3708–3712. [Google Scholar]
- Ale, L.; Zhang, N.; Li, L. Road damage detection using RetinaNet. In Proceedings of the 2018 IEEE International Conference on Big Data (Big Data); 2018; pp. 5197–5200. [Google Scholar]
- Nguyen, H.-N.; Kam, T.-Y.; Cheng, P.-Y. Automatic crack detection from 2D images using a crack measure-based B-spline level set model. Multidimensional Systems and Signal Processing 2018, 29, 213–244. [Google Scholar] [CrossRef]
- Ma, D.; Fang, H.; Wang, N.; Zhang, C.; Dong, J.; Hu, H. Automatic detection and counting system for pavement cracks based on PCGAN and YOLO-MF. IEEE Transactions on Intelligent Transportation Systems 2022, 23, 22166–22178. [Google Scholar] [CrossRef]
- Guo, G.; Zhang, Z. Road damage detection algorithm for improved YOLOv5. Scientific reports 2022, 12, 15523. [Google Scholar] [CrossRef]
- Wang, J.; Chen, Y.; Dong, Z.; Gao, M. Improved YOLOv5 network for real-time multi-scale traffic sign detection. Neural Computing and Applications 2023, 35, 7853–7865. [Google Scholar] [CrossRef]
- Qu, Z.; Cao, C.; Liu, L.; Zhou, D.-Y. A deeply supervised convolutional neural network for pavement crack detection with multiscale feature fusion. IEEE transactions on neural networks and learning systems 2021, 33, 4890–4899. [Google Scholar] [CrossRef] [PubMed]
- Liu, S.; Huang, D.; Wang, Y. Learning spatial fusion for single-shot object detection. arXiv 2019, arXiv:1911.09516. [Google Scholar]
- Cui, X.; Wang, Q.; Dai, J.; Xue, Y.; Duan, Y. Intelligent crack detection based on attention mechanism in convolution neural network. Advances in Structural Engineering 2021, 24, 1859–1868. [Google Scholar] [CrossRef]
- Chen, Z.; Zhang, J.; Lai, Z.; Zhu, G.; Liu, Z.; Chen, J.; Li, J. The devil is in the crack orientation: A new perspective for crack detection. In Proceedings of the Proceedings of the IEEE/CVF International Conference on Computer Vision, 2023; pp. 6653–6663.
- Haralick, R.M. Using perspective transformations in scene analysis. Computer graphics and image processing 1980, 13, 191–221. [Google Scholar] [CrossRef]
- Ge, Z.; Liu, S.; Wang, F.; Li, Z.; Sun, J. Yolox: Exceeding yolo series in 2021. arXiv 2021, arXiv:2107.08430. [Google Scholar]
- He, Q.; Xu, A.; Ye, Z.; Zhou, W.; Cai, T. Object detection based on lightweight YOLOX for autonomous driving. Sensors 2023, 23, 7596. [Google Scholar] [CrossRef] [PubMed]
- Zhang, Y.; Xu, W.; Yang, S.; Xu, Y.; Yu, X. Improved YOLOX detection algorithm for contraband in X-ray images. Applied optics 2022, 61, 6297–6310. [Google Scholar] [CrossRef] [PubMed]
- Li, Z.; Jiang, X.; Shuai, L.; Zhang, B.; Yang, Y.; Mu, J. A Real-Time Detection Algorithm for Sweet Cherry Fruit Maturity Based on YOLOX in the Natural Environment. Agronomy 2022, 12, 2482. [Google Scholar] [CrossRef]
- Song, C.-Y.; Zhang, F.; Li, J.-S.; Xie, J.-Y.; Chen, Y.; Hang, Z.; Zhang, J.-X. Detection of maize tassels for UAV remote sensing image with an improved YOLOX model. Journal of Integrative Agriculture 2023, 22, 1671–1683. [Google Scholar] [CrossRef]
- Hu, J.; Shen, L.; Sun, G. Squeeze-and-excitation networks. In Proceedings of the Proceedings of the IEEE conference on computer vision and pattern recognition, 2018; pp. 7132–7141.
- Wang, Q.; Wu, B.; Zhu, P.; Li, P.; Zuo, W.; Hu, Q. ECA-Net: Efficient channel attention for deep convolutional neural networks. In Proceedings of the Proceedings of the IEEE/CVF conference on computer vision and pattern recognition, 2020; pp. 11534–11542.
- Woo, S.; Park, J.; Lee, J.-Y.; Kweon, I.S. Cbam: Convolutional block attention module. In Proceedings of the Proceedings of the European conference on computer vision (ECCV), 2018; pp. 3–19.
- Hou, Q.; Zhou, D.; Feng, J. Coordinate attention for efficient mobile network design. In Proceedings of the Proceedings of the IEEE/CVF conference on computer vision and pattern recognition, 2021; pp. 13713–13722.
- Zhou, D.; Fang, J.; Song, X.; Guan, C.; Yin, J.; Dai, Y.; Yang, R. Iou loss for 2d/3d object detection. In Proceedings of the 2019 international conference on 3D vision (3DV); 2019; pp. 85–94. [Google Scholar]
- Zheng, Z.; Wang, P.; Liu, W.; Li, J.; Ye, R.; Ren, D. Distance-IoU loss: Faster and better learning for bounding box regression. In Proceedings of the Proceedings of the AAAI conference on artificial intelligence, 2020; pp. 12993–13000.
- Zhang, Y.; Ren, W.; Zhang, Z.; Jia, Z.; Wang, L.; Tan, T. Focal and efficient IOU loss for accurate bounding box regression. arXiv 2021, arXiv:2101.08158. [Google Scholar] [CrossRef]
- Liu, F.; Liu, J.; Wang, L. Asphalt pavement crack detection based on convolutional neural network and infrared thermography. IEEE Transactions on Intelligent Transportation Systems 2022, 23, 22145–22155. [Google Scholar] [CrossRef]
- Xu, Z.; Guan, H.; Kang, J.; Lei, X.; Ma, L.; Yu, Y.; Chen, Y.; Li, J. Pavement crack detection from CCD images with a locally enhanced transformer network. International Journal of Applied Earth Observation and Geoinformation 2022, 110, 102825. [Google Scholar] [CrossRef]
- Huyan, J.; Li, W.; Tighe, S.; Xu, Z.; Zhai, J. CrackU-net: A novel deep convolutional neural network for pixelwise pavement crack detection. Structural Control and Health Monitoring 2020, 27, e2551. [Google Scholar] [CrossRef]
- 4Shi, Y.; Cui, L.; Qi, Z.; Meng, F.; Chen, Z. Automatic road crack detection using random structured forests. IEEE Transactions on Intelligent Transportation Systems 2016, 17, 3434–3445. [Google Scholar]
Figure 1.
Overall technology roadmap.
Figure 1.
Overall technology roadmap.
Figure 2.
Pavement target object determination.
Figure 2.
Pavement target object determination.
Figure 3.
Pavement image correction; (a) is the pre-correction pavement image, (b) is the post-correction pavement image.
Figure 3.
Pavement image correction; (a) is the pre-correction pavement image, (b) is the post-correction pavement image.
Figure 4.
Structure of YOLOX network model.
Figure 4.
Structure of YOLOX network model.
Figure 5.
Structure of CFPN.
Figure 5.
Structure of CFPN.
Figure 6.
ECA Attention Module.
Figure 6.
ECA Attention Module.
Figure 7.
Plot of ECANet fusion locations. (a) shows two up-sampled fused ECANet locations in the network, which are output to the second layer of the feature pyramid network after cat operation; (b) shows two down-sampled fused ECANet locations in the network, which finally output the result to YOLOHead.
Figure 8.
Structure of EC-YOLOX network model.
Figure 8.
Structure of EC-YOLOX network model.
Figure 9.
Partial self-built dataset image.
Figure 9.
Partial self-built dataset image.
Figure 10.
Labeling of different types of data samples.
Figure 10.
Labeling of different types of data samples.
Figure 11.
crack labeling area before and after correction; (a) is the pre-correction crack labeling area, (b) is the post-correction crack labeling area.
Figure 11.
crack labeling area before and after correction; (a) is the pre-correction crack labeling area, (b) is the post-correction crack labeling area.
Figure 12.
Statistics of crack gray distribution before and after correction; (a) is the crack gray statistical histogram before correction, (b) is the crack gray statistical histogram after correction.
Figure 12.
Statistics of crack gray distribution before and after correction; (a) is the crack gray statistical histogram before correction, (b) is the crack gray statistical histogram after correction.
Figure 13.
Comparison of loss curves of network model.
Figure 13.
Comparison of loss curves of network model.
Figure 14.
Comparison of detection results of different models.
Figure 14.
Comparison of detection results of different models.
Figure 15.
EC-YOLOX test results.
Figure 15.
EC-YOLOX test results.
Table 1.
Different labeling categories and quantities.
Table 1.
Different labeling categories and quantities.
| Classes |
Num |
| Vertical crack |
952 |
| Horizontal crack |
188 |
| Regional crack |
263 |
| potholes |
1563 |
| repaired crack |
329 |
| Total |
3295 |
Table 2.
Computer software and hardware specifications.
Table 2.
Computer software and hardware specifications.
| Indicator |
Value |
| system |
Windows10 |
| PyTorch |
1.7.1 |
| Torch vision |
0.8.2 |
| processor |
Intel Xeon Gold 6128 @ 3.40GHz (X2) |
| GPU |
NVIDIA GeForce RTX 3070 Ti |
| Python |
3.6 |
| Total |
3295 |
Table 3.
Training parameter configuration.
Table 3.
Training parameter configuration.
| Indicator |
Value |
| Learning rate |
1e-2 |
| Minimum learning rate |
0.01 |
| Weight decay |
5e-3 |
| SGD |
0.937 |
| Epoch |
300 |
| Batch size |
6 |
| Num wokerMosaic |
100.5 |
Table 4.
Accuracy of self-built dataset model.
Table 4.
Accuracy of self-built dataset model.
| Model |
GFLOPS |
params |
Precision |
F1 |
Recall |
/% |
| YOLOX-s |
26.766G |
8.939M |
75.61% |
0.66 |
60.56% |
71.89% |
| YOLOv3-Darknet |
155.329G |
61.545M |
78.33% |
0.61 |
51.27% |
64.49% |
| YOLOv4-CIoU |
141.969G |
63.959M |
75.94% |
0.67 |
61.64% |
67.08% |
| YOLOv5-Darknet |
16.511G |
7.074M |
75.66% |
0.52 |
42.46% |
69.62% |
| YOLOv7-l |
106.472G |
37.620M |
75.59% |
0.57 |
48.66% |
68.00% |
| Faster rcnn |
369.817G |
136.771M |
34.54% |
0.49 |
85.07% |
65.88% |
| EC-YOLOX |
41.191G |
17.799M |
75.82% |
0.70 |
66.42% |
76.34% |
Table 5.
CrackForest dataset model accuracy.
Table 5.
CrackForest dataset model accuracy.
| Model |
Precision |
F1 |
Recall |
/% |
| YOLOX-s |
85.03% |
0.80 |
75.95% |
80.89% |
| YOLOv3-Darknet |
81.90% |
0.71 |
63.36% |
75.44% |
| YOLOv4-CIoU |
79.00% |
0.53 |
35.52% |
62.24% |
| YOLOv5-Darknet |
87.25% |
0.48 |
36.49% |
72.02% |
| YOLOv7-l |
77.19% |
0.58 |
46.68% |
73.13% |
| Faster rcnn |
38.26% |
0.52 |
84.66% |
69.28% |
| EC-YOLOX |
87.22% |
0.81 |
75.40% |
83.20% |
Table 6.
Ablation experiment.
Table 6.
Ablation experiment.
| Model |
WEIoU |
CFPN |
ECA |
/% |
| YOLOX-s |
|
|
|
71.89% |
| YOLOX-W |
√ |
|
|
72.79% |
| YOLOX-C |
|
√ |
|
74.39% |
| YOLOX-E |
|
|
√ |
74.88% |
| EC-YOLOX |
√ |
√ |
√ |
76.34% |
Table 7.
Accuracy of different attention mechanism models.
Table 7.
Accuracy of different attention mechanism models.
| Model |
Precision |
F1 |
Recall |
|
| YOLOX-s |
75.61% |
0.66 |
60.56% |
71.89% |
| YOLOX+SE |
79.53% |
0.68 |
61.72% |
73.64% |
| YOLOX+CBAM |
76.80% |
0.66 |
59.64% |
73.91% |
| YOLOX+ECA |
73.67% |
0.68 |
64.10% |
74.88% |
| YOLOX+CA |
72.86% |
0.67 |
62.08% |
73.99% |
|
Disclaimer/Publisher’s Note: The statements, opinions and data contained in all publications are solely those of the individual author(s) and contributor(s) and not of MDPI and/or the editor(s). MDPI and/or the editor(s) disclaim responsibility for any injury to people or property resulting from any ideas, methods, instructions or products referred to in the content. |
© 2024 by the authors. Licensee MDPI, Basel, Switzerland. This article is an open access article distributed under the terms and conditions of the Creative Commons Attribution (CC BY) license (http://creativecommons.org/licenses/by/4.0/).

