1. Introduction
Glioblastoma (GBM) is a form of brain tumor that is particularly problematic due to its aggressive nature and high proliferative capacity, promoting tumor recurrence in around 90% of patients [
1]. GBM is classified as a grade IV astrocytoma, meaning that it arises from astrocytes of the brain, most commonly in the temporal and frontal lobes [
2]. GBMs are widely accepted to be one of the most morbid cancers, with only 40% surviving their first year of diagnosis, and as little as 17% surviving their second. In untreated cases, GBMs can cause patient death within six months. Standard treatment of GBMs involves surgical removal or resection, followed by a combination of chemotherapy and radiotherapy, though this has only proven effective to moderately prolong life expectancy and is not curative [
3].
The poor survival rate associated with GBMs is directly linked to their location and propensity to invade healthy brain parenchyma. Complete tumor excision reduces patient mortality; however, this is rarely possible due to the lack of a distinct border between the GBM and normal brain tissue [
4]. Research aiming to improve GBM outcomes has resulted in several novel treatments such as inhibitor therapy, immunotherapy and drug-delivering nanoparticles, but these have failed to translate into the clinic as they provide no significant survival benefit when compared to standard treatments [
5,
6]. Tumour recurrence is inevitable due to the invasive nature of GBM cells, a characteristic which fails to be targeted by current GBM therapeutics. Cancer cells migrate by hijacking the molecular machinery of the cell, utilizing the cytoskeleton and adhesion proteins for motility [
7]. GBMs adopt mesenchymal migration, characterized by an elongated cell body and lamellipodia at the cells’ leading edge to drive migration [
8]. Both actin stress fibres and focal adhesions (FAs) generate the force and adhesion required for migration [
9]. As the migratory capacity of GBM cells aids tumor recurrence, it is therefore of interest to target migration in highly invasive cancers such as GBMs, to promote patient survival.
Drugs produced from natural sources are invaluable in the field of drug discovery and development, as they can provide complex compounds without requiring synthesis in a laboratory. Natural compounds are highly diverse, offering a plethora of chemical structures to test, potentially leading to the discovery of novel mechanisms of action to combat conditions where therapeutic progress has remained unchanged. It is estimated that around 80% of humans rely on plant-based drugs as there are so many available on the market [
10]. Within the field of cancer research, approximately 50% of internationally approved anti-cancer drugs have arisen from natural sources [
11].
Three plant-derived compounds which have recently gained interest for anti-cancer properties are Turmeric, Magnolia Bark and Indigo. Magnolia bark, derived from the Magnolia tree, is multifunctional due to the presence of two active pharmacological ingredients (APIs), Magnolol and Honokiol [
12]. Various properties of Magnolia Bark have been determined, such as anti-inflammatory, antimicrobial, antioxidant, neuroprotective and cytotoxic activity [
13]. Honokiol has been suggested to regulate cell signaling, proliferation, and growth inhibition in various tumors, but has also shown efficacy as an adjuvant agent alongside standard chemotherapeutics and radiotherapy to overcome drug resistance [
14,
15]. Animal and
in vitro studies of Magnolol have also shown promise in reducing tumor growth [
16]. Turmeric is widely used for a range of health benefits due to its API, Curcumin, which has been shown as therapeutically viable. Curcumin is present at low concentrations (3%) within Turmeric, where it exhibits antioxidant and anti-inflammatory properties, but also appears to play a role in the prevention of heart disease, Alzheimer’s, and cancer [
17]. Various studies have demonstrated the ability of Curcumin to induce apoptosis, whilst preventing angiogenesis, metastasis and growth [
18,
19]. Similar to Magnolia Bark, Curcumin has also shown efficacy in generating DNA damage to induce apoptosis in the established LN229 glioma cell line when administered as an adjuvant alongside EGFR kinase inhibitors [
20,
21]. Derived from the Indigofera tinctoria plant, Indigo is a natural dye used cosmetically to improve hair and scalp quality and reduce hair loss [
22]. Indigo has been observed to induce apoptosis in patients with acute promyelocytic leukemia, although poor solubility was noted [
23]. Several APIs are found in Indigo, such as indirubins, which are a promising group of compounds, including BIO-indirubin (BIO), which appear to exert anti-migratory effects on glioma cells [
24]. BIO has demonstrated efficient targeting of cell migration in pediatric gliomas, whilst also acting as a cytotoxic potentiator of cell death in adult GBM [
25].
Figure 1.
The structure of three plant derived compounds. (a) Magnolia possesses two APIs, Magnolol and Honokiol. (b) Indigo is derived from the Indigofera tinctoria plant. (c) Curcumin is the API found in Turmeric.
Figure 1.
The structure of three plant derived compounds. (a) Magnolia possesses two APIs, Magnolol and Honokiol. (b) Indigo is derived from the Indigofera tinctoria plant. (c) Curcumin is the API found in Turmeric.
Although many plant-based compounds have been investigated for their potential cytotoxic and anti-cancer effects, the migrastatic activity of these compounds has so far not been evaluated, particularly in GBMs. Here we describe anti-migratory activity and novel phenotypic effects of three plant-derived candidate drugs to target cell migration including, Magnolia bark, indirubin and Curcumin. We aimed to assess anti-migratory activity of these compounds, with the hope of identifying novel treatment options to increase the efficacy of chemotherapy and radiotherapy, by limiting GBM cell migration to ultimately improve patient outcomes. Utilizing 2D phenotypic and scratch assays, 3D spheroid invasion assays and immunofluorescence microscopy enabled the identification and quantification of the effects that Turmeric, Indigo and Magnolia bark have on cell migration and invasion. This study highlights the potential use of plant-derived therapeutics as novel treatment options for GBMs, alongside current treatment regimens, to promote GBM patient survival. Therefore, this supports the wider use of naturally sourced compounds as therapeutic candidates.
2. Materials and Methods
2.1. Cell Culture
The GBM cell line U87, obtained from ATCC (previously STR (short tandem repeat) profiled and mycoplasma tested), was cultured in complete medium, consisting of Dulbecco’s Modified Eagles Medium (DMEM) (Fisher Scientific, UK), supplemented with 10% heat inactivated fetal calf serum (FCS) (Sigma-Aldrich, UK) and 1% Penicillin/Streptomycin (Sigma-Aldrich, UK) in an incubator at 37 oC and 5% CO2 atmosphere.
2.2. Drug Preparation
Turmeric (New Leaf Products), Magnolia Bark (Nutrivity) and Indigo (It’s Pure Organics) were crushed into powders, weighed and resolubilized in dimethyl sulfoxide (DMSO) (Sigma-Aldrich, UK) to a working concentration of 100 mg/ml.
2.3. MTT (3-(4,5-Dimethylthiazol-2-yl)-2,5-Diphenyltetrazolium Bromide) Assay
MTT assays were carried out as previously described [
26]. Following trypsinization, U87 cells were seeded at a density of 1 x10
4 cells/ml in complete medium, before 200 µl of cell suspension was added to each well of columns 2 to 12, in flat bottomed 96 well plates (CytoOne, UK). 200 µl of complete media was added to each well of column 1, and plates were incubated for 24 hours. Drugs were diluted to 100 µg/ml in complete media, before a two-fold range of dilutions was carried out in columns 3 to 12. Columns 1 and 2 contained complete media only and complete media containing 0.1% DMSO, to act as internal controls. Plates were then incubated for 96 hours. 20 µl of 5 mg/ml MTT (Sigma-Aldrich, UK) dissolved in phosphate buffered saline (PBS) (Sigma-Aldrich, UK) was added to each well. Media was removed after 4 hours, 150 µl of DMSO (Fisher Scientific, UK) was added, mixed thoroughly and each plate was read on a FLUOstar Ultima Microplate Reader at 540 nm. IC
75 values were calculated for each drug, based on percentage cell survival, to ensure targeting of cell migration rather than proliferation. MTT assays were repeated twice.
2.4. 2D Phenotypic Assay and Immunofluorescence (IF)
Coverslips (Sigma-Aldrich, UK) were immersed in 100% methanol (Sigma-Aldrich, UK) under sterile conditions and placed in 6 well plates (CytoOne, UK) following methanol evaporation. U87 cell suspension was diluted to 1000 cells/ml and seeded on top of the coverslips, then incubated for 4 hours to induce cell attachment. Media was replaced with 2ml of either control (0.1% DMSO) or drug treatment (0.027 µg/ml Indigo, 0.031 µg/ml Turmeric and 0.116 µg/ml Magnolia, 1:1000 dilutions of the IC75 values determined by MTT assays). Migratory activity was observed every 24 hours on an EVOS XL Core imaging system (ThermoFisher Scientific, UK), as part of the migration/invasion assays. After adding 4% paraformaldehyde (PFA) (Sigma-Aldrich, UK), coverslips were incubated at room temperature for 15 minutes, washed 3 times in PBS and incubated for a further 5 minutes with 0.05% Triton X-100 (Sigma-Aldrich, UK) for permeabilization. The coverslips were washed with PBS 3 times, before 0.05% blocker was prepared from skimmed milk powder (ASDA, UK) and PBS, and added to the wells. Mouse anti-vinculin (1:500, EMD Millipore Corp, USA), DAPI (4′,6-diamidino-2-phenylindole) (1:1000, EMD Millipore Corp, USA) and TRITC (tetramethyl rhodamine) conjugated phalloidin (1:1000, ECM Biosciences, USA) were diluted in the blocker solution and centrifuged for 5 minutes at 13,000 rpm. 200 µl drops of primary antibody supernatant were transferred onto strips of Parafilm (Fisher Scientific, UK) floating on water, before coverslips were placed cell side down in the antibody, covered in foil and incubated at room temperature for an hour. After being transferred back into the wells, coverslips were washed 3 times with PBS, whilst the secondary antibody was prepared as above (Alexa Fluor 488 goat anti-mouse, 1:500, Abcam, UK). Antibody incubation was carried out as before. 2 drops of MOWIOL (Sigma-Aldrich, UK) were added to each labelled glass slide (Sigma-Aldrich, UK) and coverslips were placed onto the slides cell side down, covered in tinfoil and allowed to airdry overnight at room temperature.
2.5. Scratch Assay
Cells were seeded at a concentration of 1 x 10⁵ cells/ml in 6 well plates (CytoOne, UK) and incubated for 48 hours. A 200 µl pipette tip was used to produce scratches horizontally across the centre of each coverslip, and media was replaced with 2 ml of either control (0.1% DMSO) or drug treatment (27.02 µg/ml Indigo, 0.027 µg/ml Indigo, 31.94 µg/ml Turmeric, 0.032 µg/ml Turmeric, 116.07 µg/ml Magnolia and 0.116 µg/ml Magnolia). Migration into the scratches was monitored at 0 and 24 hours using an EVOS XL Core imaging system (ThermoFisher Scientific, UK).
ImageJ (v2.9.0) package Fiji (v1.53t) was used to calculate the area of each scratch, using the ‘polygon selection’ tool to outline the cell free scratch area [
27]. Migration was quantified by calculating the scratch index reciprocal (SIR) as below:
2.6. Spheroid Invasion Assay & IF
Ultra-low adherence round bottomed 96 well plates (Costar, USA) were seeded with U87 cells at a concentration of 5 x 10
3 cells/ml and incubated for 96 hours to promote cell aggregation and spheroid formation. Spheroid invasion assays and subsequent analysis was carried out as previously described [
25], with spheroids being treated with either control (0.1% DMSO) or drug treatment (27.02 µg/ml Indigo, 0.027 g/ml Indigo, 31.94 µg/ml Turmeric, 0.032 µg/ml Turmeric, 116.07 µg/ml Magnolia and 0.116 µg/ml Magnolia). Images were obtained of the spheroids in their collagen plugs every 24 hours for a total of 72 hours, using an EVOS XL Core imaging system (ThermoFisher Scientific, UK). Analysis of cell migration/invasion into a collagen matrix was quantified as previously described, by calculating the migration index (MI) for both the migrating front and migrating edge.
Following experimental completion, each collagen plug was washed 3 times with PBS and incubated with 4% PFA overnight, at room temperature, covered in tinfoil. Both primary and secondary antibody incubations were carried out as described for the 2D phenotypic assays, however spheroids were stained in the 96 well plates. For mounting, the whole collagen plugs containing the migratory cells and spheroids were gently removed with a pastette from the individual wells and transferred into MOWIOL on to a glass slide. A coverslip was added and the specimens were allowed to airdry overnight as before.
2.7. Confocal Microscopy
All slides were imaged using a Zeiss LSM 880, fitted with a Zeiss Plan-APOCHROMAT 63x and an EC Plan-Neofluar 10x objective lens. Alexa fluor 488 labelled vinculin was excited at a wavelength of 488 nm, TRITC conjugated phalloidin at 561 nm and DAPI at 405 nm.
2.8. Focal Adhesion Analysis
To determine the effects of drug treatment on FA generation, images acquired on the Zeiss LSM 880 were opened in Fiji and split into their respective color channels [
27]. The total number of both FAs and cells were counted using the green channel only, before the number of FAs per cell was calculated for each drug treatment.
2.9. Actin Localisation Analysis
Similarly to the FA analysis, images were split into their color channels, before the red channel was selected. Distinct actin localization categories were determined from all images and each cell was categorized accordingly into one of three groups (cortical, stress fibres or fragmented) and counted, before the percentage of cells in each category was calculated.
2.10. Statistical Analysis
All data analysis was carried out using IBM SPSS Statistics (v28) [
28]. Kolmogorov-Smirnov tests were used to determine if data was normally distributed or not (n ≥ 50). An ANOVA was carried out followed by a Tukey post hoc test if data was normally distributed, whilst a Kruskal-Wallis followed by a post hoc test was carried out on non-normally distributed data.
3. Results
3.1. MTT Assays
IC75 values were determined for each of the plant-derived compounds. Turmeric had an IC75 of 31.94 µg/ml, Indigo was calculated as 27.02 µg/ml and Magnolia bark was 116.07 µg/ml. The concentrations were established to be anti-migratory rather than cytotoxic and therefore used in the assays.
3.2. 2D Phenotypic Assay
Images of the 2D assays acquired via confocal microscopy highlighted differences in cytoskeletal organization following treatment with the three plant-derived compounds.
3.2.1. Actin Localization
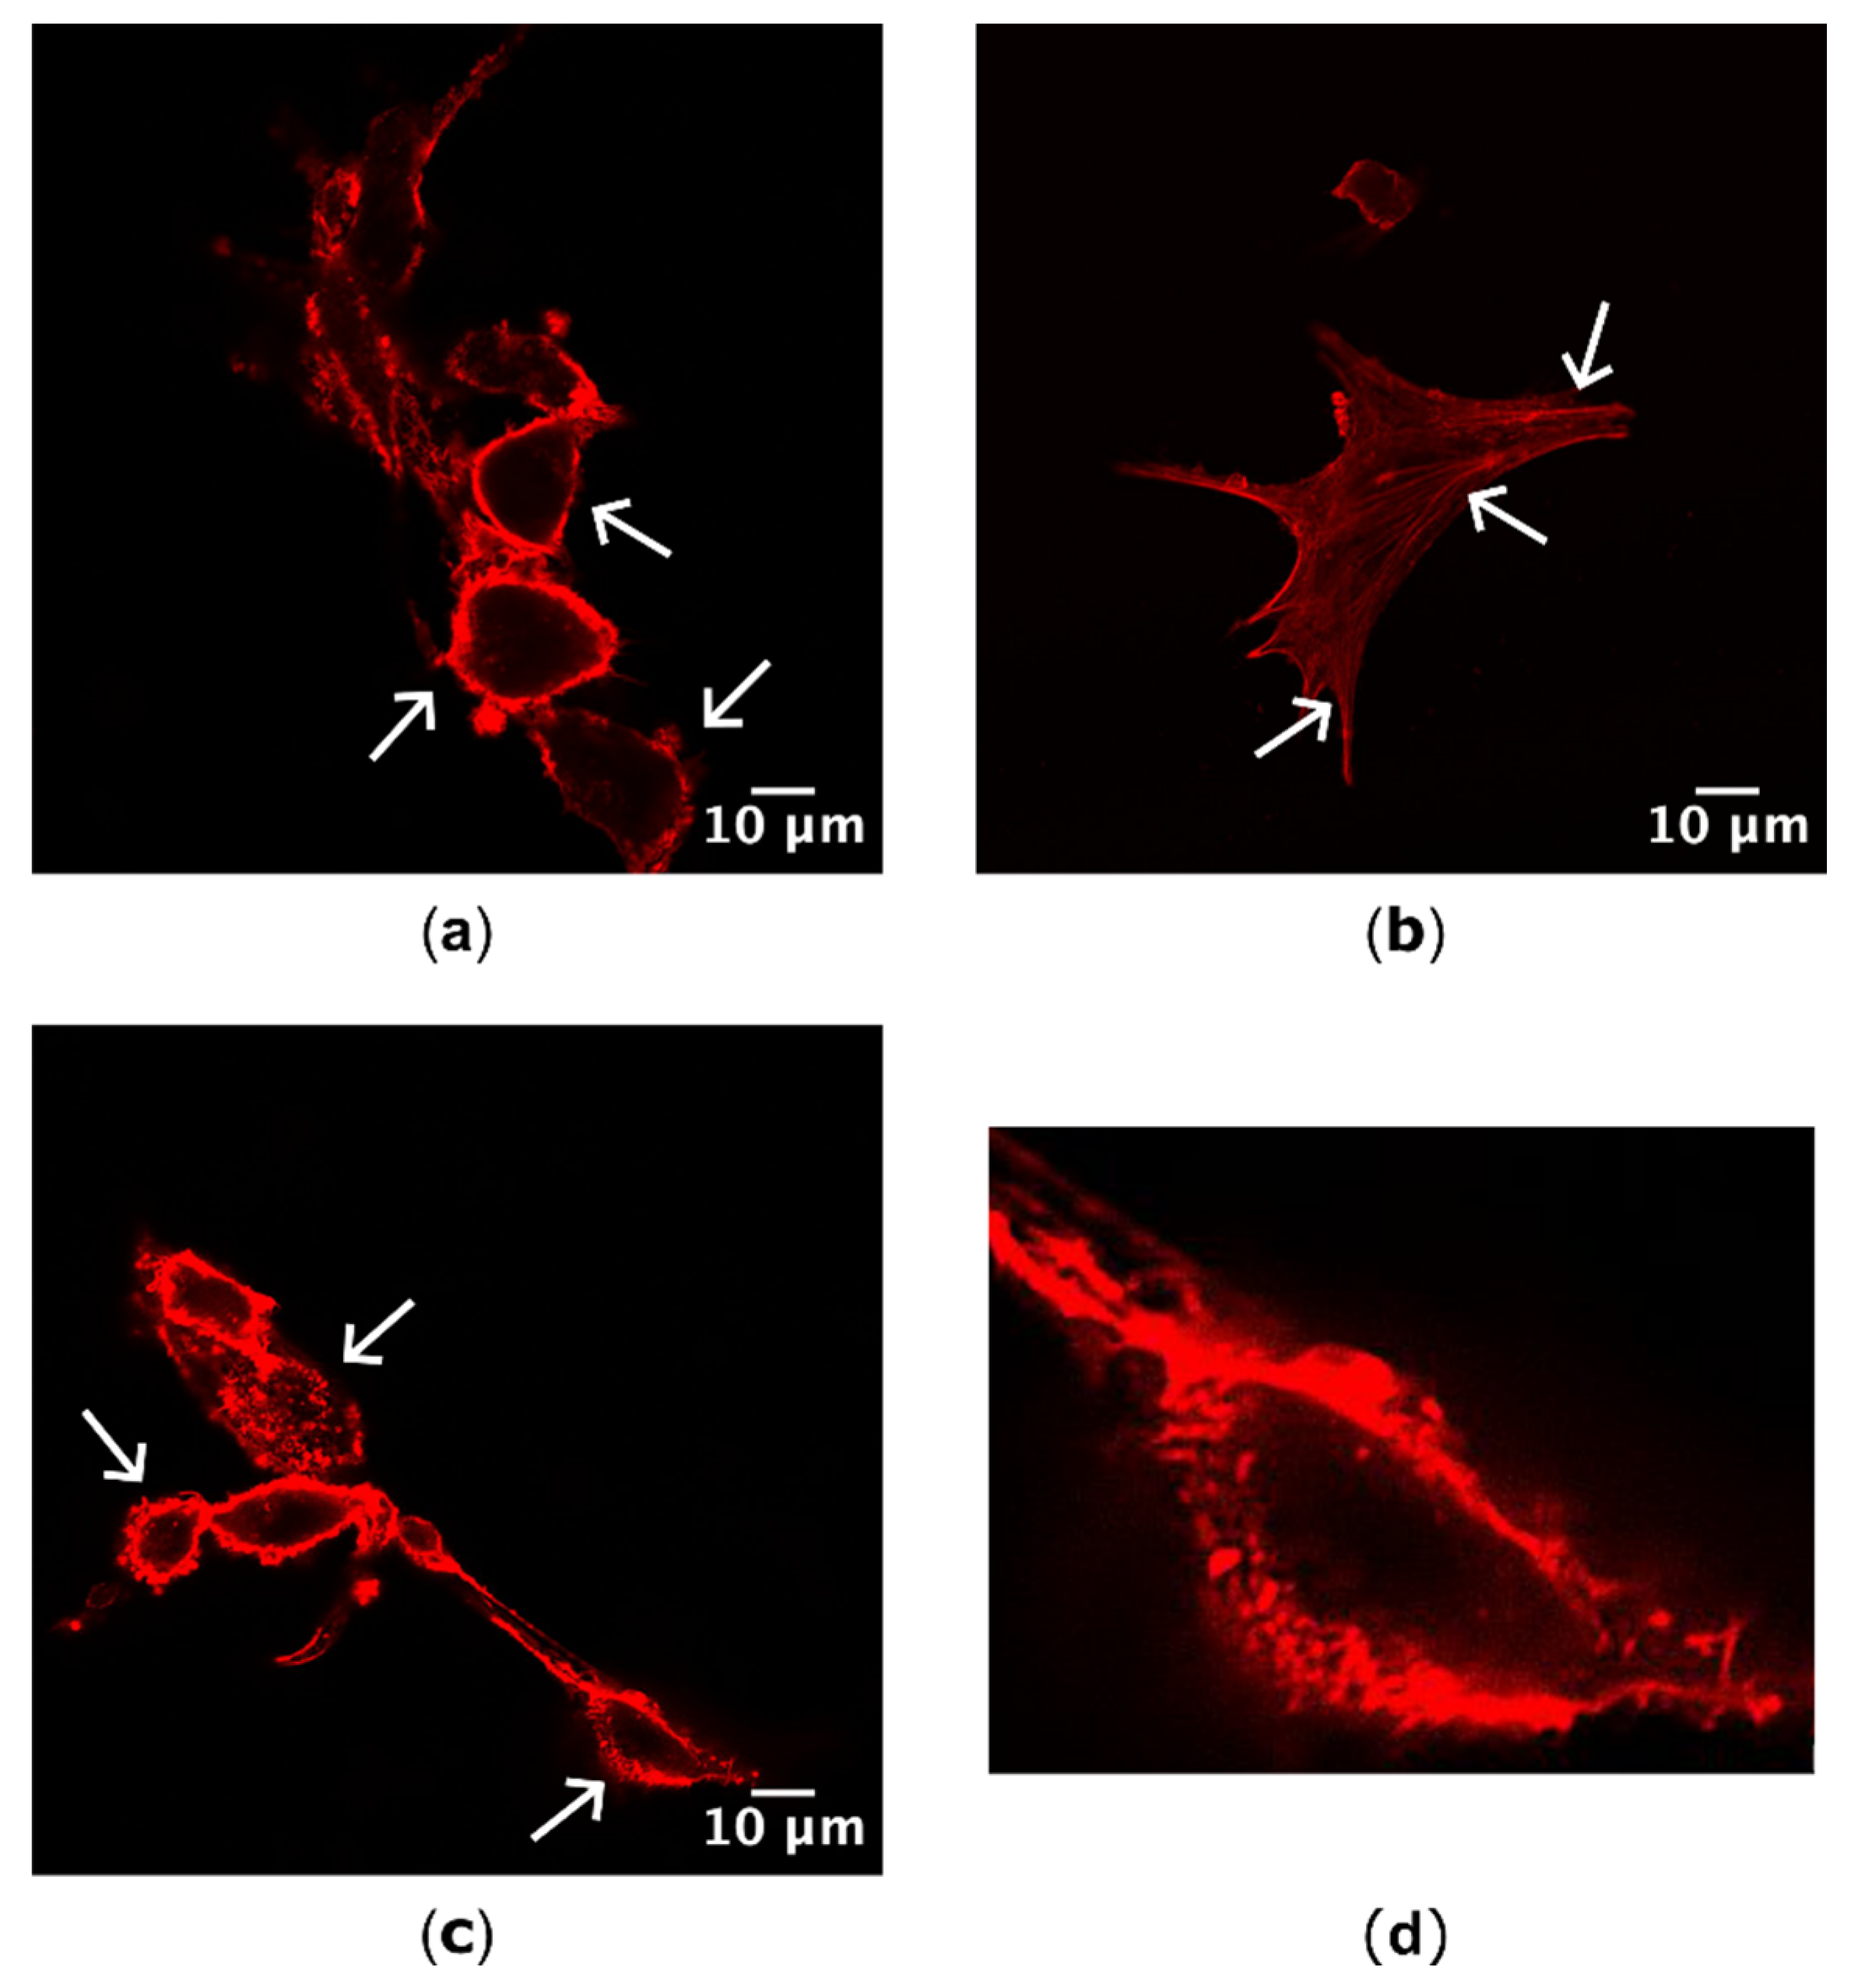
Differences in actin localization as a result of drug treatment were visible and distinct, with cells possessing either cortical actin concentrated around the cells’ perimeter, stress fibres or actin fragments with a bleb-like appearance (
Figure 2).
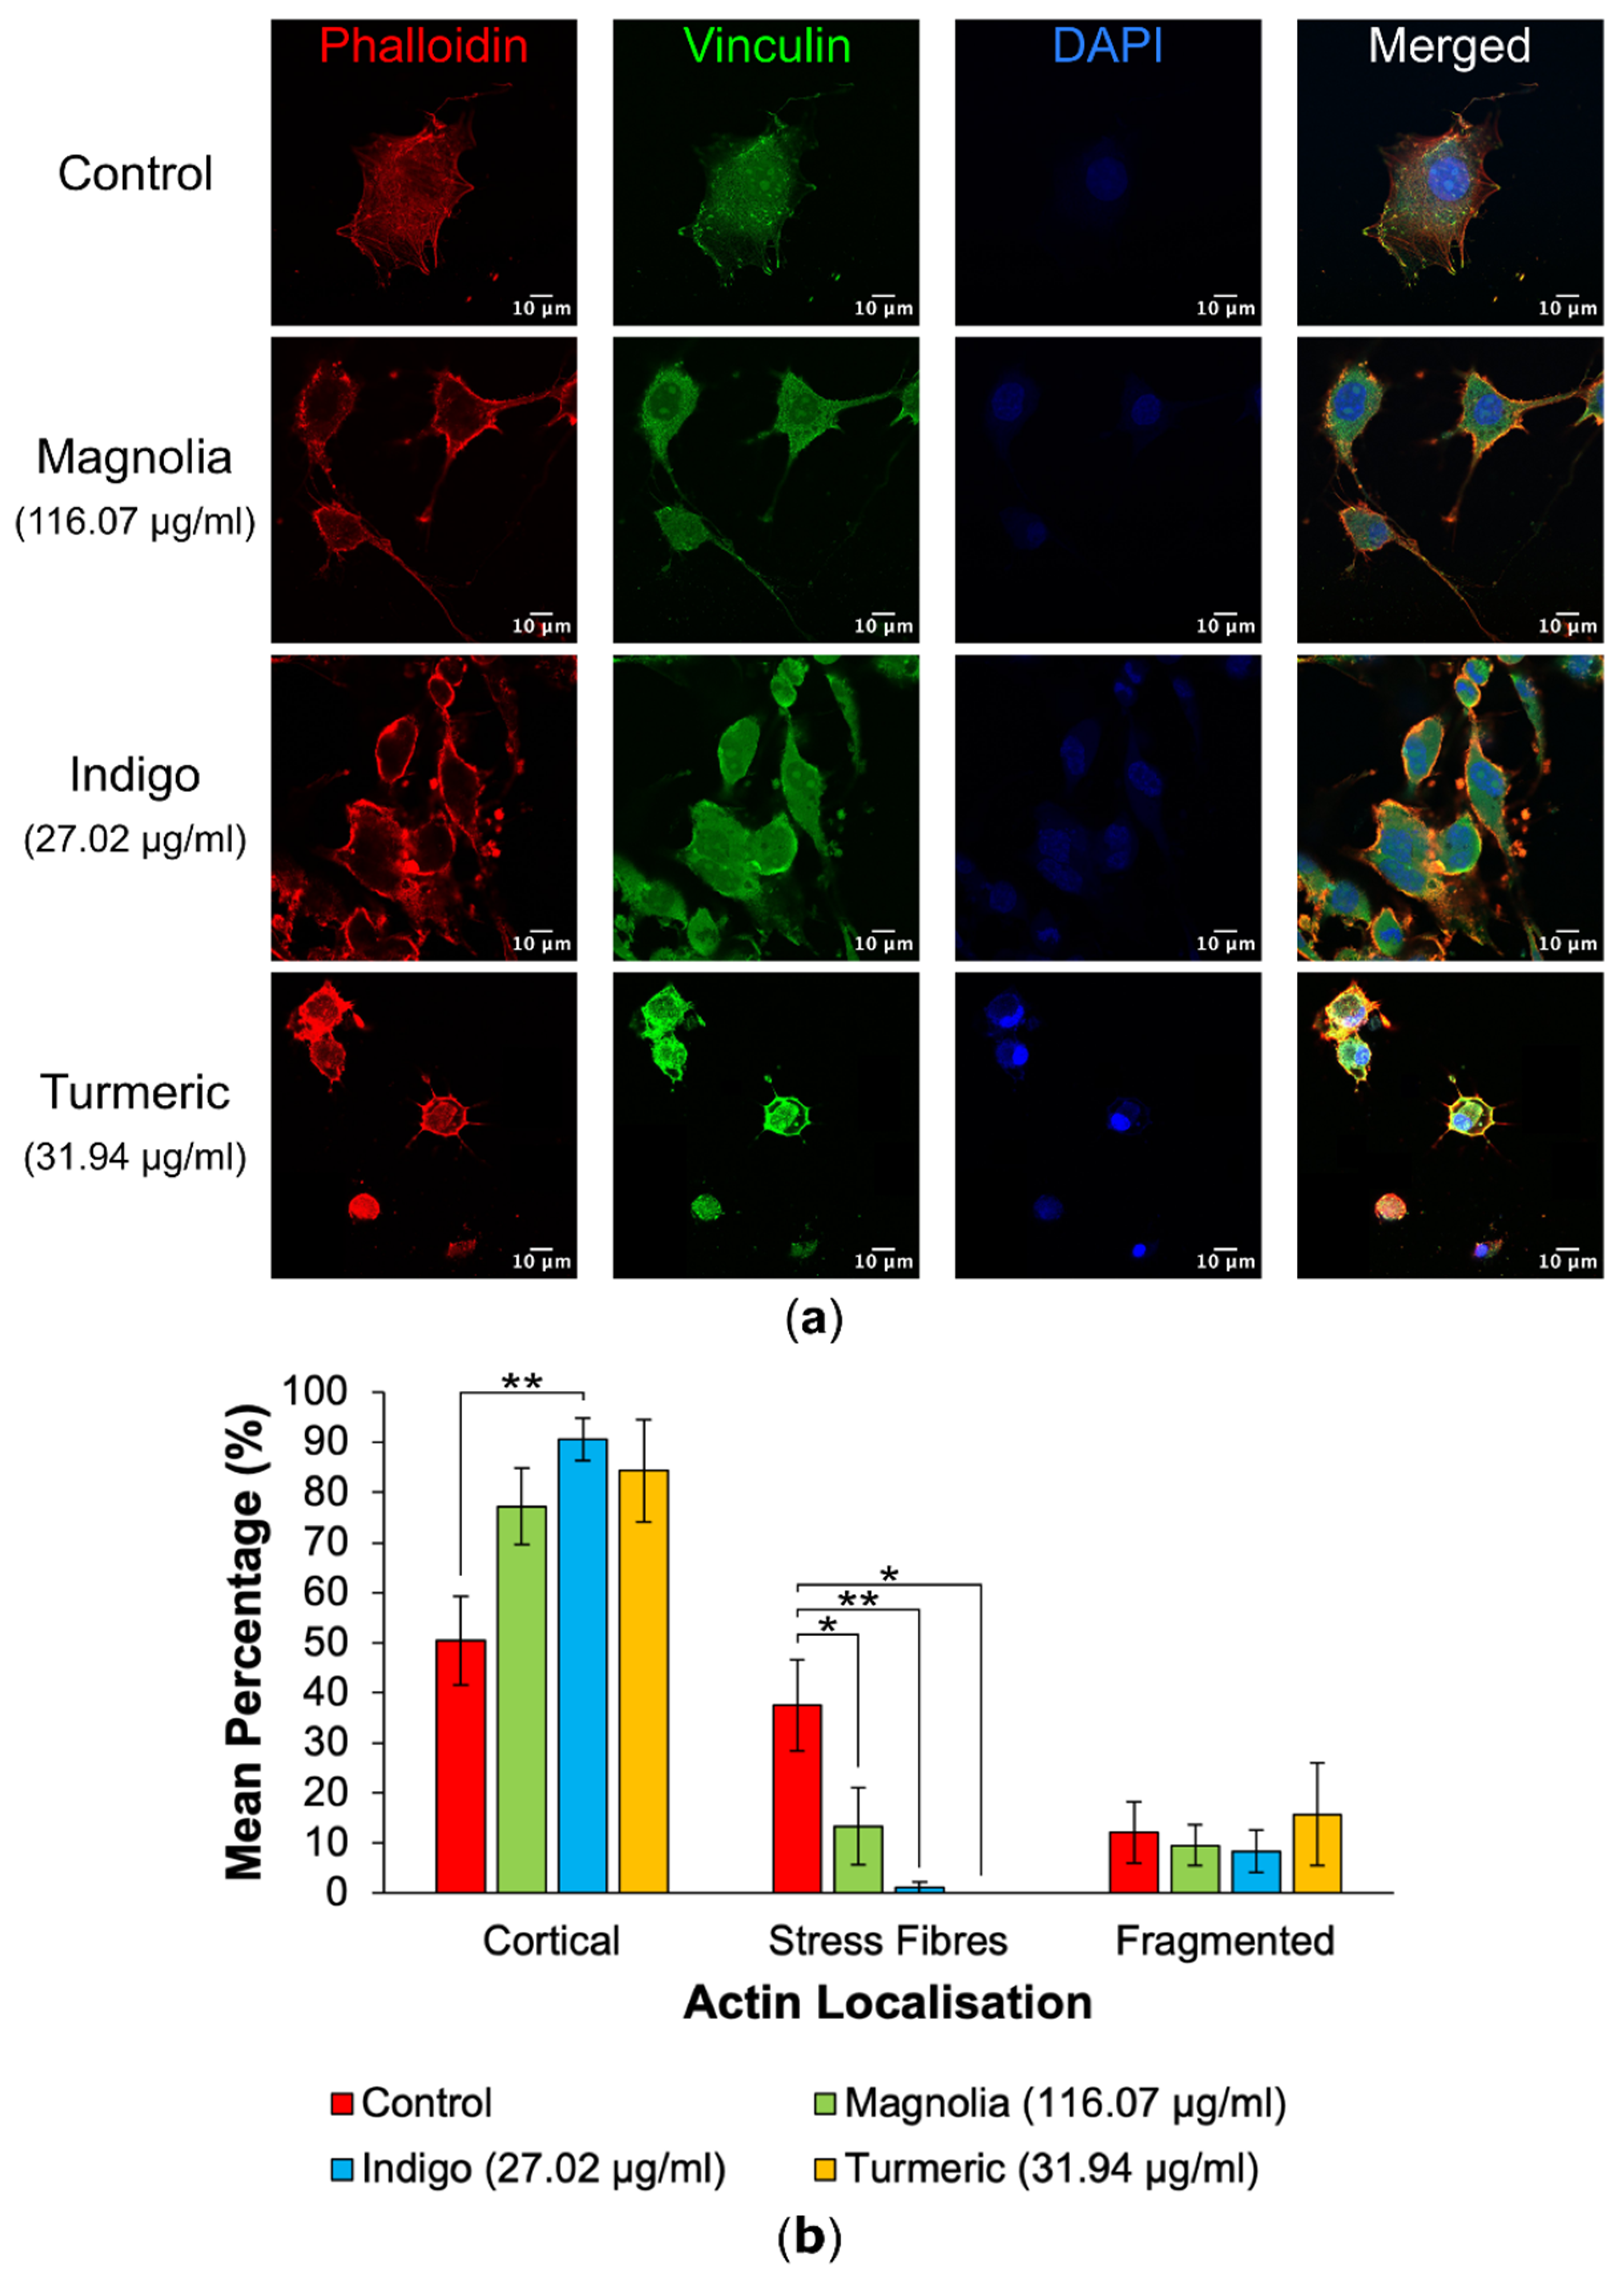
Actin localization in mock treated cells versus drug-treated cells was quantified following visualization by confocal microscopy to highlight any potential effects of each plant-derived drug on cytoskeletal organization (
Figure 3). Control treated cells mainly exhibited actin on their cortex, with all treatments possessing a higher mean percentage of cortical actin in comparison to the control, however this was only significant for Indigo (27.02 µg/ml). Stress fibre formation was significantly reduced after all three drug treatments, and was the most significant for Indigo, despite treatment with Turmeric (31.94 µg/ml) seemingly resulting in total inhibition of actin stress fibre formation. The mean percentage of fragmented actin was the highest following treatment with Turmeric; however, this was determined to be statistically insignificant.
3.2.2. FA Generation
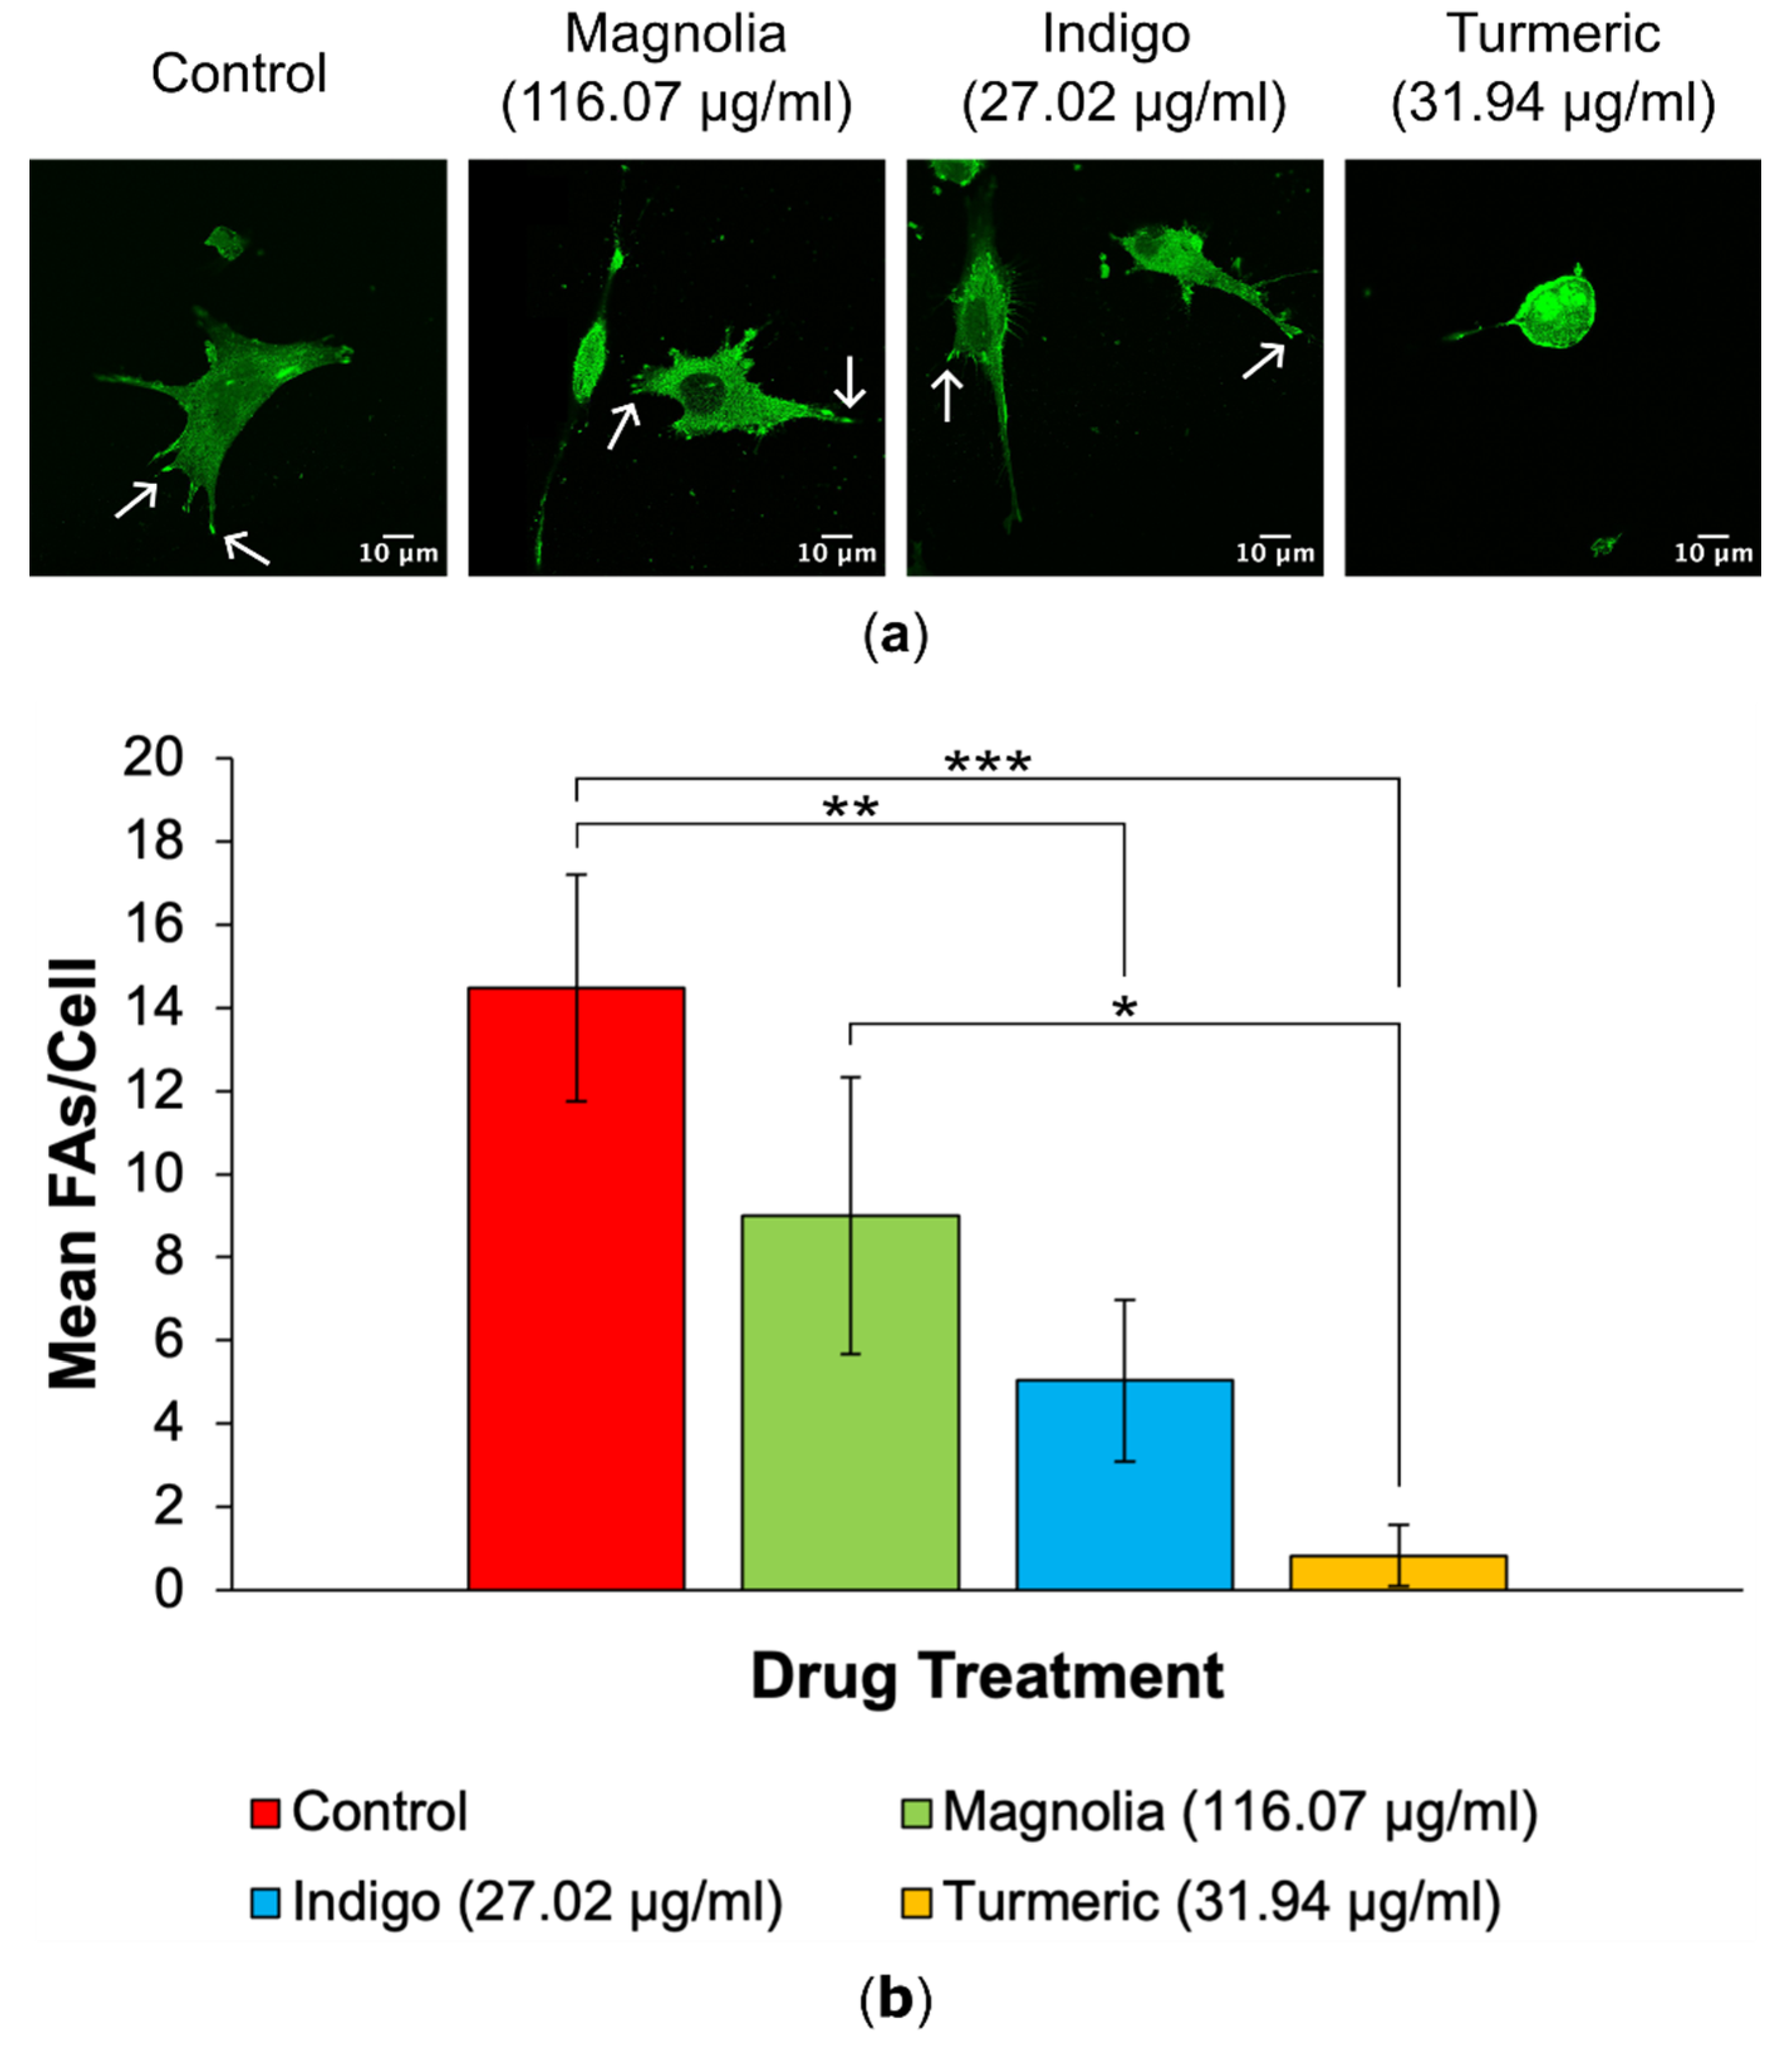
A decrease in FA numbers was observed in all drug treatments, with Turmeric (31.94 µg/ml) displaying the lowest mean number of FAs per cell, which appears to be directly correlated with the observed rounded, amoeboid morphology in Turmeric treated cells (
Figure 4). Cells subjected to treatment with Indigo (27.02 µg/ml) also exhibited statistically significantly decreased FA numbers, but this was less significant than Turmeric.
3.3. Scratch Assays
3.3.1. Drugs Administered at Low Concentration
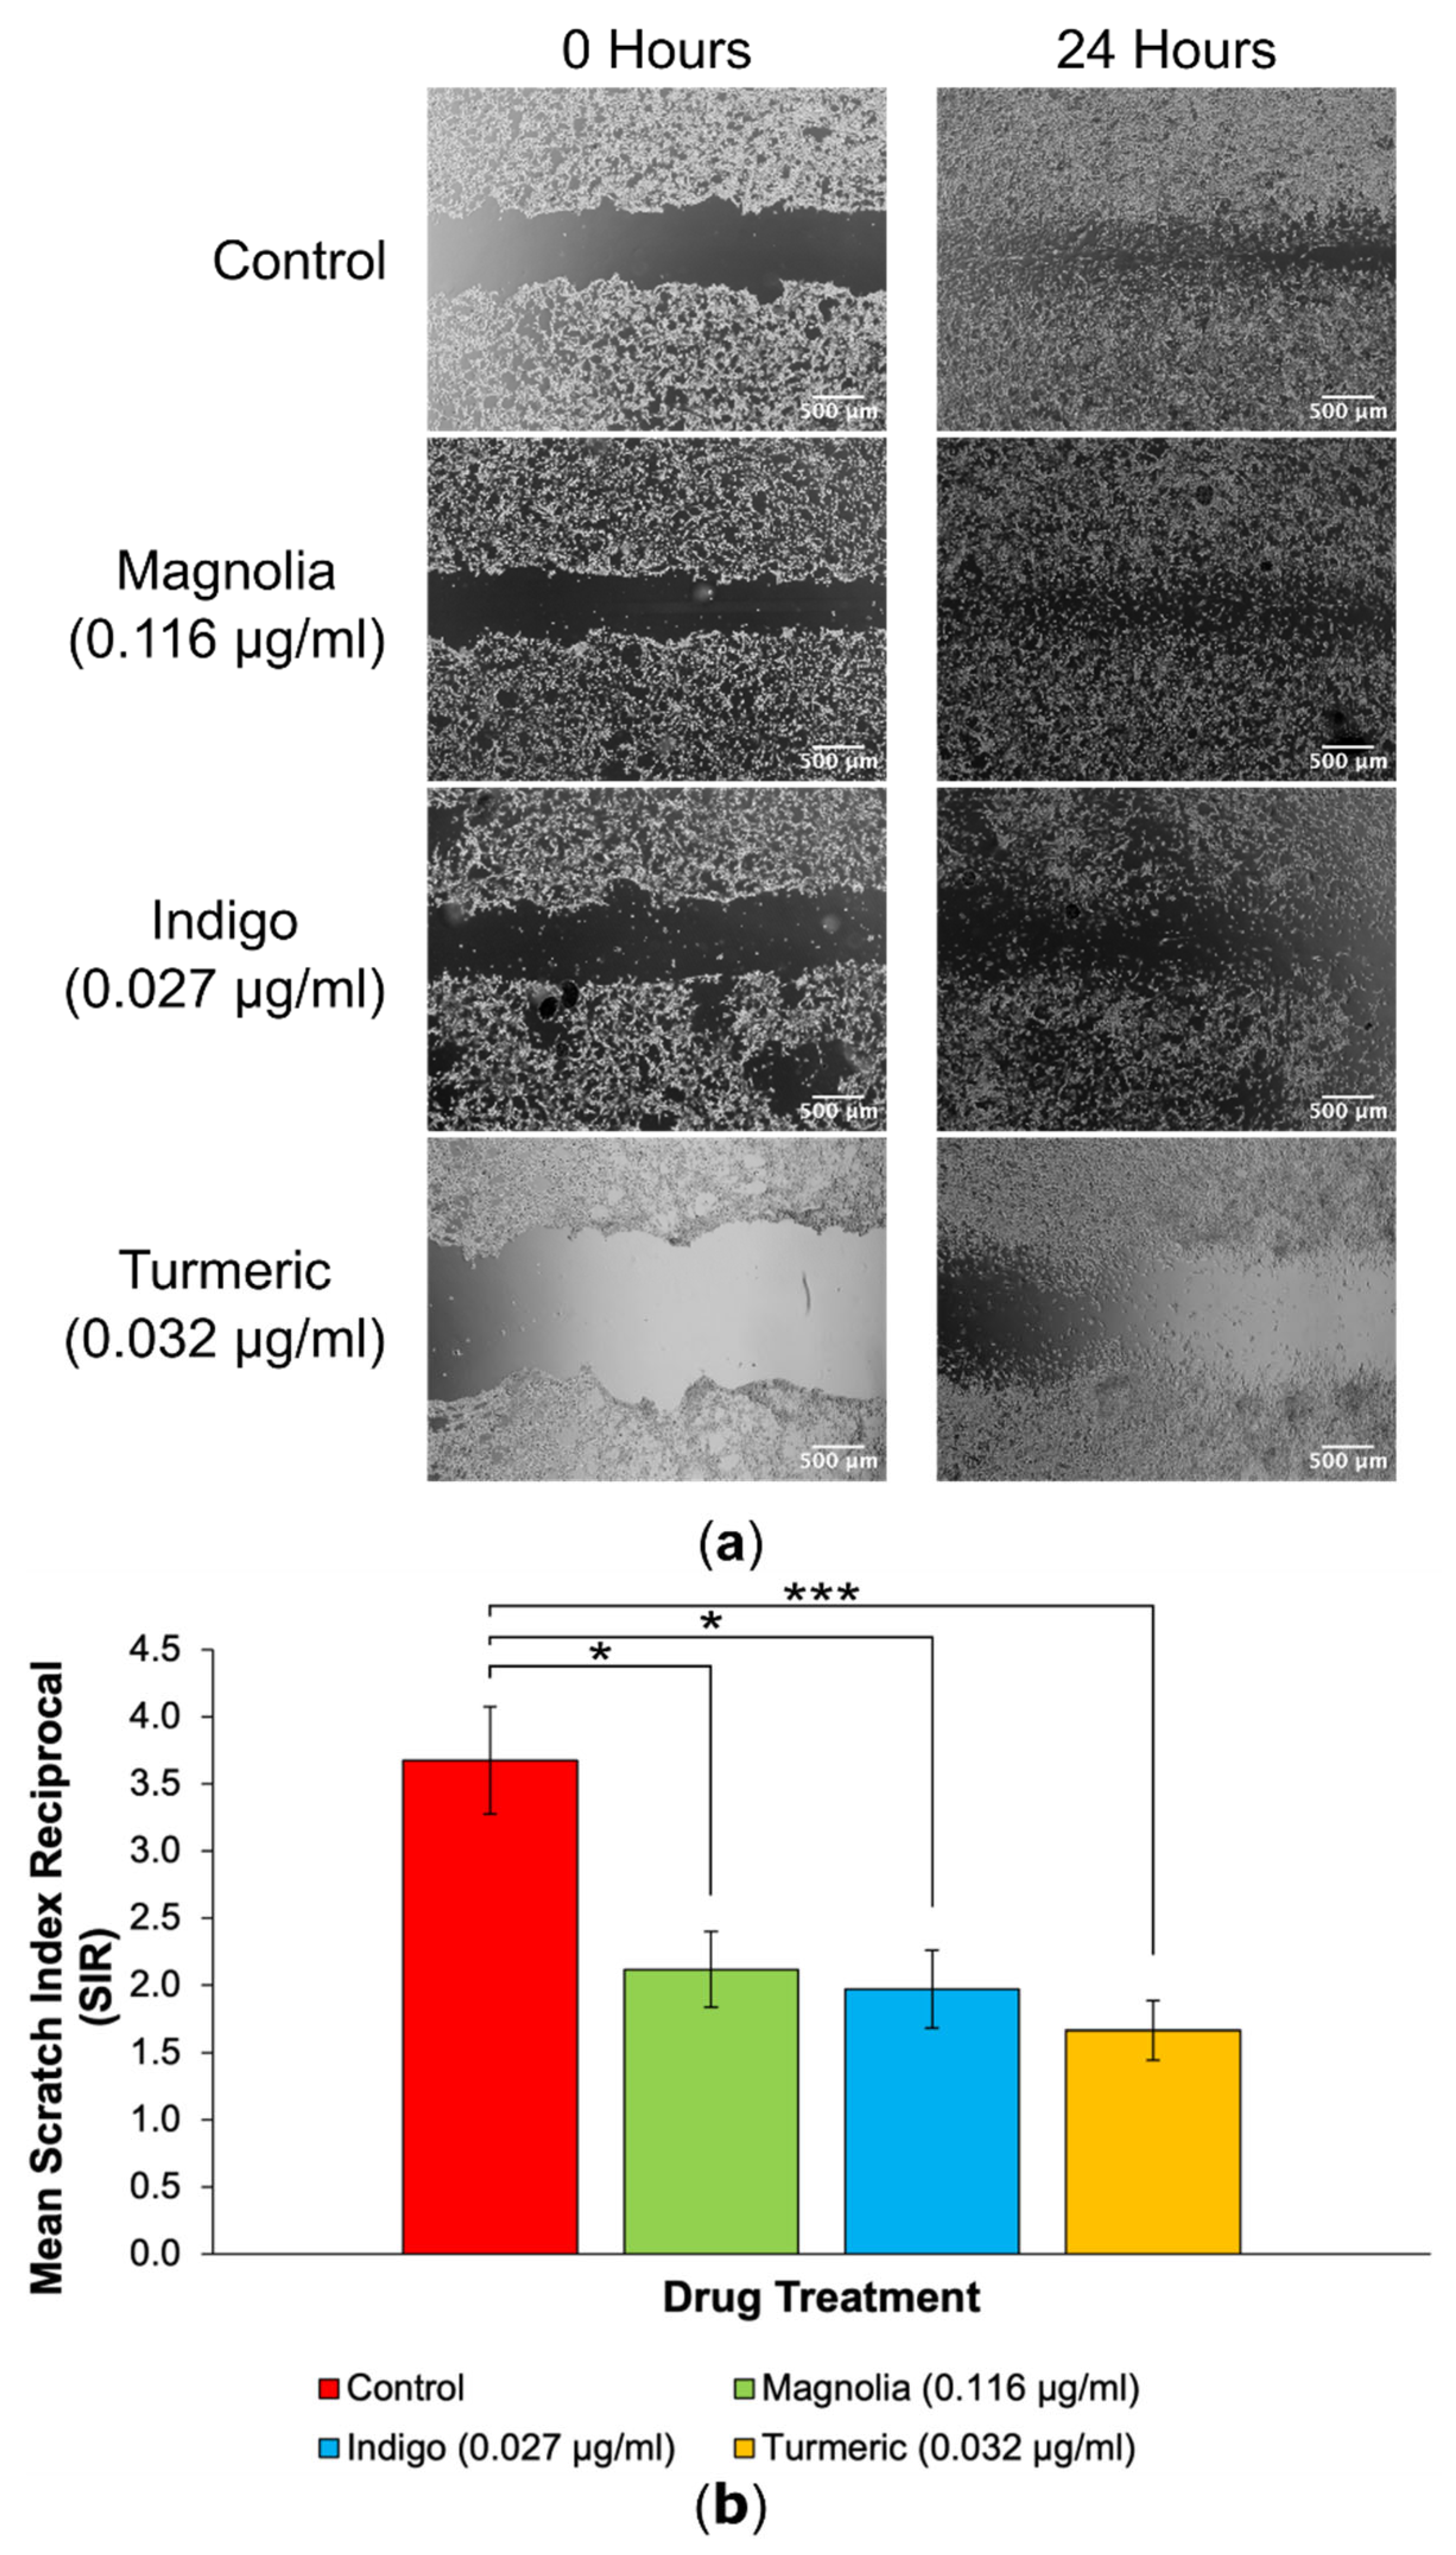
Each of the three plant-derived drugs significantly reduced migration into scratches, with Turmeric exerting the most effective anti-migratory effect in 2D (
Figure 5). After 24 hours, the initial scratch edges were less distinct in the control, Magnolia (0.116 µg/ml) and Indigo (0.027 µg/ml) treatment groups. In contrast, Turmeric (0.032 µg/ml) treatment visually reduced migration into scratches the most, with a high cell confluency visible at the scratch edges after incubating for 24 hours, unlike any of the other treatment groups.
Quantification of 2D migration via SIR determination demonstrated that treatment with Turmeric (0.032 µg/ml) significantly decreased migration the most, although both Magnolia (0.116 µg/ml) and Indigo (0.027 µg/ml) displayed migrastatic activity in U87 cells. It is worth noting that none of the three plant-derived drugs completely inhibited migration.
3.3.2. Drugs Administered at High Concentration
Images acquired of the scratches following a 24-hour incubation demonstrated that at the higher plant-derived drug concentrations the effect on cell migration was more pronounced. A visible cell front was distinguishable in scratches treated with each of the three compounds. All three treatment groups reduced the migration of U87 cells into scratches in comparison to the control treatment, however Magnolia (116.07 µg/ml) and Indigo (27.02 µg/ml) appeared to exert an enhanced inhibitory effect on 2D glioma cell migration.
Interestingly, treatment with Indigo (27.02 µg/ml) had the lowest SIR compared to the control group, although this was equally as statistically significant as Turmeric (31.94 µg/ml) (p < 0.001), indicating that both Indigo and Turmeric exert 2D anti-migratory activity on U87 cells. Magnolia (116.07 µg/ml) also reduced the mean SIR, but this was not as significant as Indigo or Turmeric. Therefore, all three compounds are capable of reducing glioma cell migration in a 2D environment, but do not completely inhibit migration.
Figure 6.
2D migration into scratches is significantly reduced by plant-derived compounds with established anti-cancer activity at their IC75 concentrations. (a) EVOS XL Core generated images demonstrated the extent of migration into scratches after a 24-hour incubation. Scale bar = 500 µm. (b) Mean SIR for each of the lower concentration treatment groups (mean ± SEM). All three compounds reduced 2D migration, but Indigo (27.02 µg/ml) produced the lowest SIR, although this was just as statistically significant as Turmeric when compared to the control. n ≥ 11 for each drug treatment. ANOVA: * = p ≤ 0.05, ** = p ≤ 0.01 and *** = p ≤ 0.001.
3.4. Spheroid Invasion Assays
All drugs were assessed for their activity on migration/invasion in a 3D environment in the spheroid invasion assays. Two MIs were established, the migration front and migration edge. This allowed further investigation of drug activity on cell populations, i.e. the bulk cell population migrating away from the spheroid, and single, highly migratory cells ahead of the main bulk of migrating cells. MIs for both the front and edge were 0 at 0 hours for all spheroids as no cells had migrated away from the original spheroids straight after embedding in collagen.
3.4.1. Drugs Administered at Low Concentration
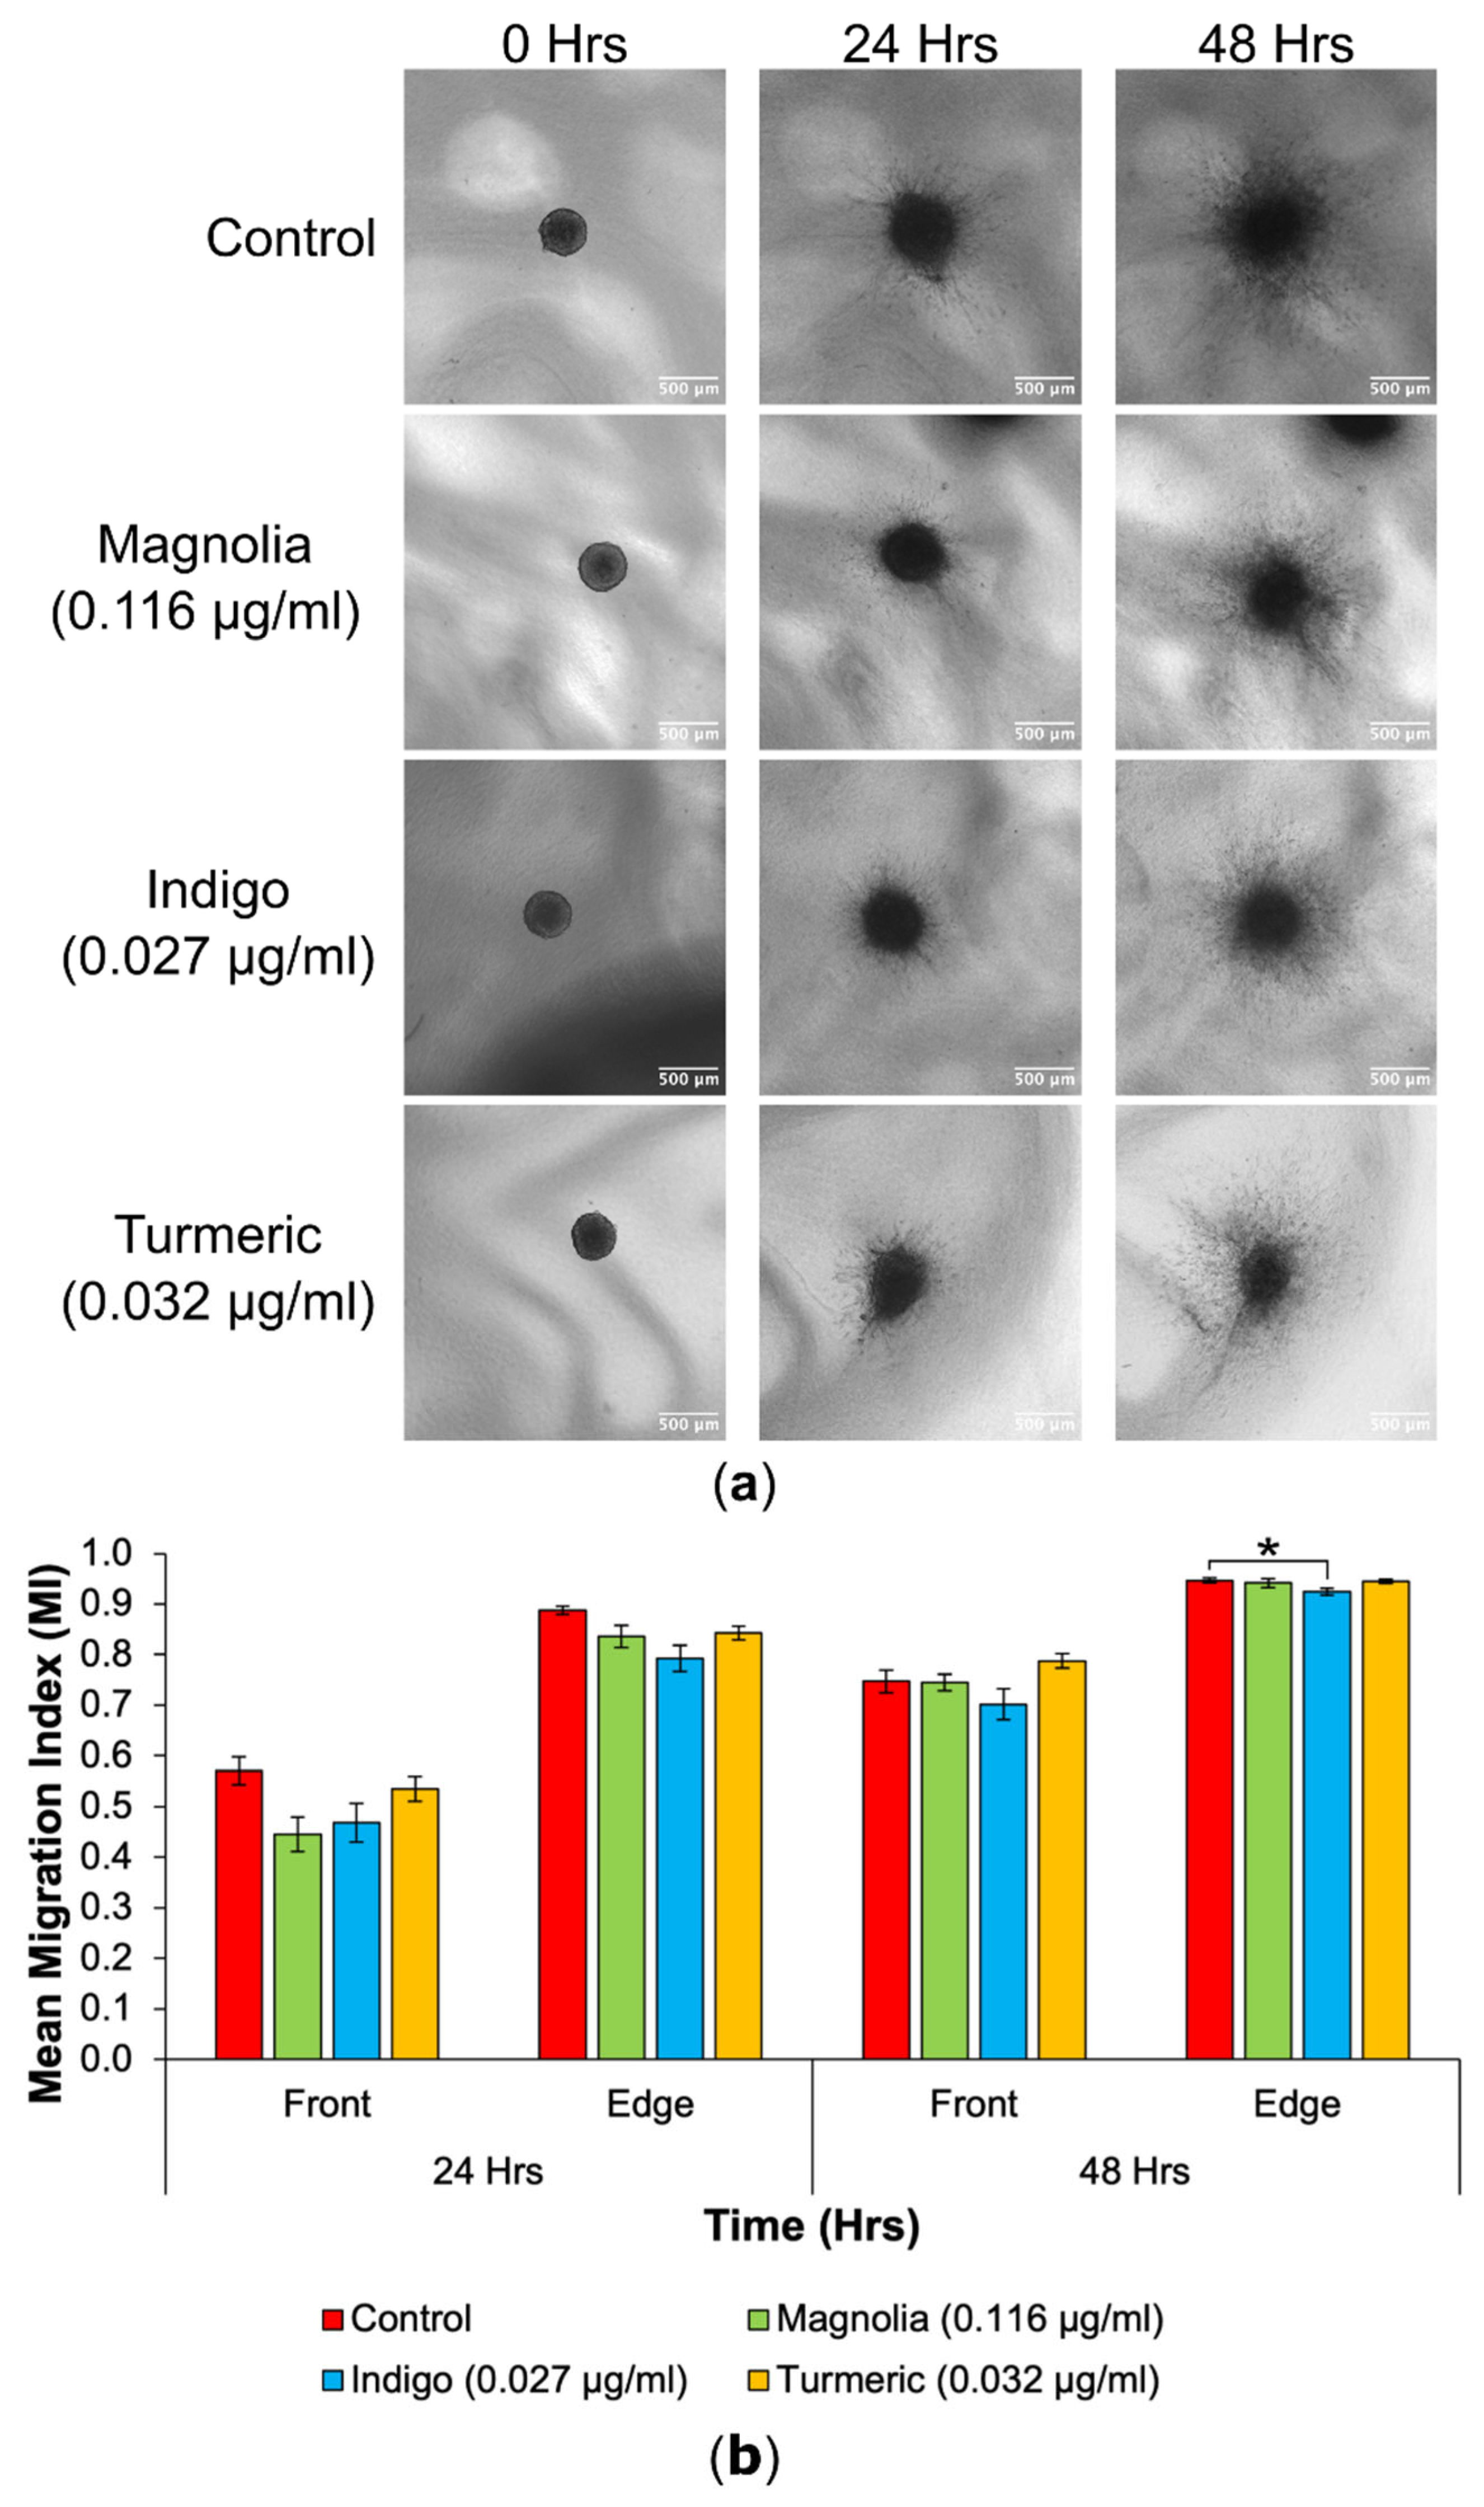
3D cell migration into the collagen matrix appeared to be reduced in the Turmeric (0.032 µg/ml) treated group, and cells migrating seemed less densely populated around the spheroid in comparison to the control. In addition, Turmeric treated spheroids seemed to change the least in size, as spheroids from all other treatment groups increased over the 48-hour incubation.
Figure 7.
Cell migration from spheroids was reduced following treatment with low concentration natural products. (a) Images obtained using an EVOS XL Core imaging system showed an increase in migration into the collagen matrix over a 48-hour period. Spheroids in the treated groups appeared visually consistent with the control. Scale bar = 500 µm. (b) Mean MIs for each of the lower drug concentrations, at the migrating front and edge at all timepoints (mean ± SEM). Indigo (0.027 g/ml) treated spheroids had the most significantly reduced edge MI at 48 hours. Magnolia (0.116 µg/ml) exerted the most anti-migratory effect for the migrating front after 24 hours, but this was not statistically significant. n ≥ 7 for each drug treatment. ANOVA (front MI 24 hours, edge MI 24 hours and front MI 48 hours) and Kruskal-Wallis (edge MI 48 hours): * = p ≤ 0.05, ** = p ≤ 0.01 and *** = p ≤ 0.001.
At 24 hours, spheroids treated with Magnolia (0.116 µg/ml) exhibited the biggest reduction in cell migration and Indigo treatment produced the lowest edge MI, but there were no significant differences determined at 24 hours. Indigo had the most inhibitory effect on cell migration at the migrating front after 48 hours, whilst Turmeric treatment appeared to increase the mean front MI, although any differences between the control and drug treatments were insignificant. For the migrating edge at 48 hours, Indigo induced the biggest reduction in migration, and was the only statistically significant result observed. Although Turmeric (0.032 µg/ml) displayed the most migrastatic activity in 2D, this is not recapitulated in 3D. Again, the three plant-based drugs failed to completely halt migration.
3.4.2. Drugs Administered at High Concentration
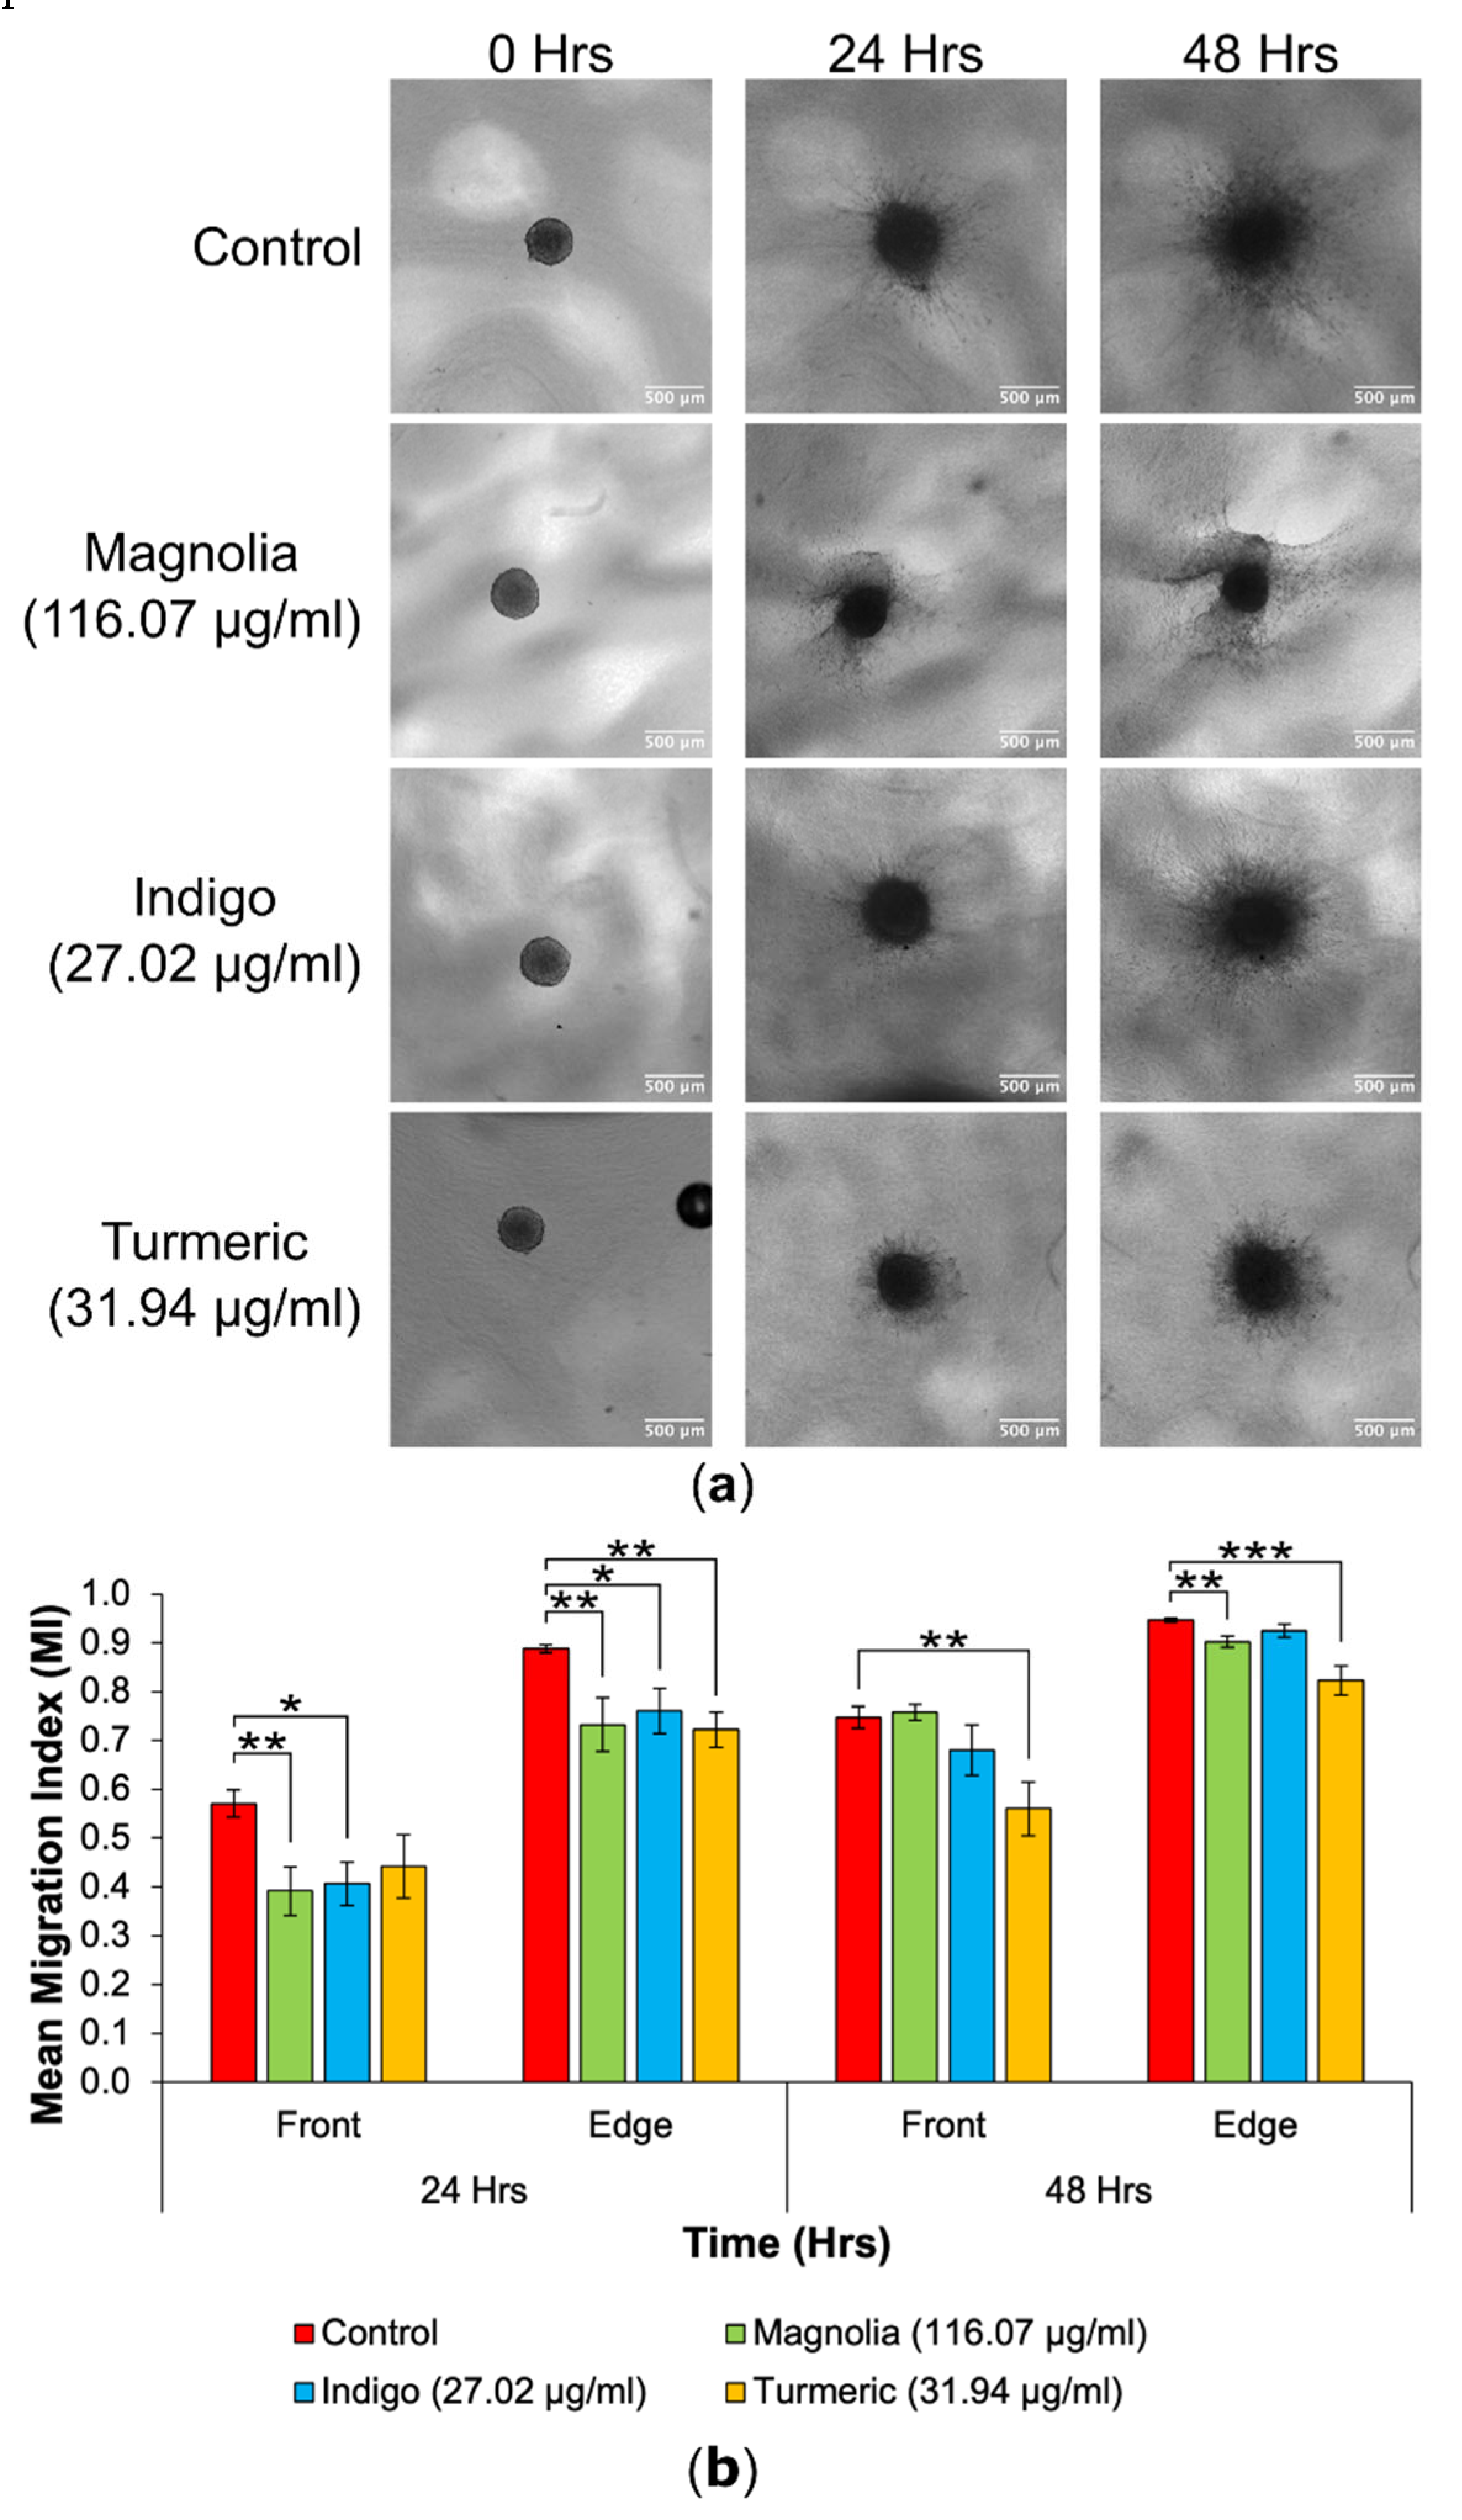
Out of all drug treatments, Turmeric (31.94 µg/ml) appeared to reduce migration into the collagen matrix the most at both 24 and 48 hours, with migrating cells remaining closely associated with the original spheroid.
Figure 8.
Decrease in 3D GBM cell migration after treatment with high concentration plant-based drugs. (a) Spheroid images taken over 48 hours highlight a decrease in migration in the Turmeric (31.94 µg/ml) group. Scale bar = 500 µm. (b) The mean MI of both treated and mock-treated spheroids (mean ± SEM). At the 24-hour migrating edge and both 48-hour fronts, Turmeric (31.94 µg/ml) produced the lowest and most statistically significant MI. n ≥ 7 for each drug treatment. ANOVA (front MI 24 hours, edge MI 24 hours and front MI 48 hours) and Kruskal-Wallis (edge MI 48 hours): * = p ≤ 0.05, ** = p ≤ 0.01 and *** = p ≤ 0.001.
For the migrating front at 24 hours, Magnolia (116.07 µg/ml) and Indigo (27.02 µg/ml) treatment significantly reduced the mean MI, with Magnolia exhibiting the most inhibitory effect. All three drugs decreased the mean edge MI after a 24-hour incubation, but Turmeric had the highest anti-migratory effect (p < 0.01), although all three treatments were statistically significant when compared to the control. However, at 48 hours, Turmeric treated spheroids exhibited the lowest mean MI for both the migrating front and edge. The effect of Turmeric was enhanced for the migrating front compared to the edge. Cell migration continued from the spheroids into the collagen matrix, despite treatment with each of the three compounds.
3.4.3. Spheroid Confocal Microscopy
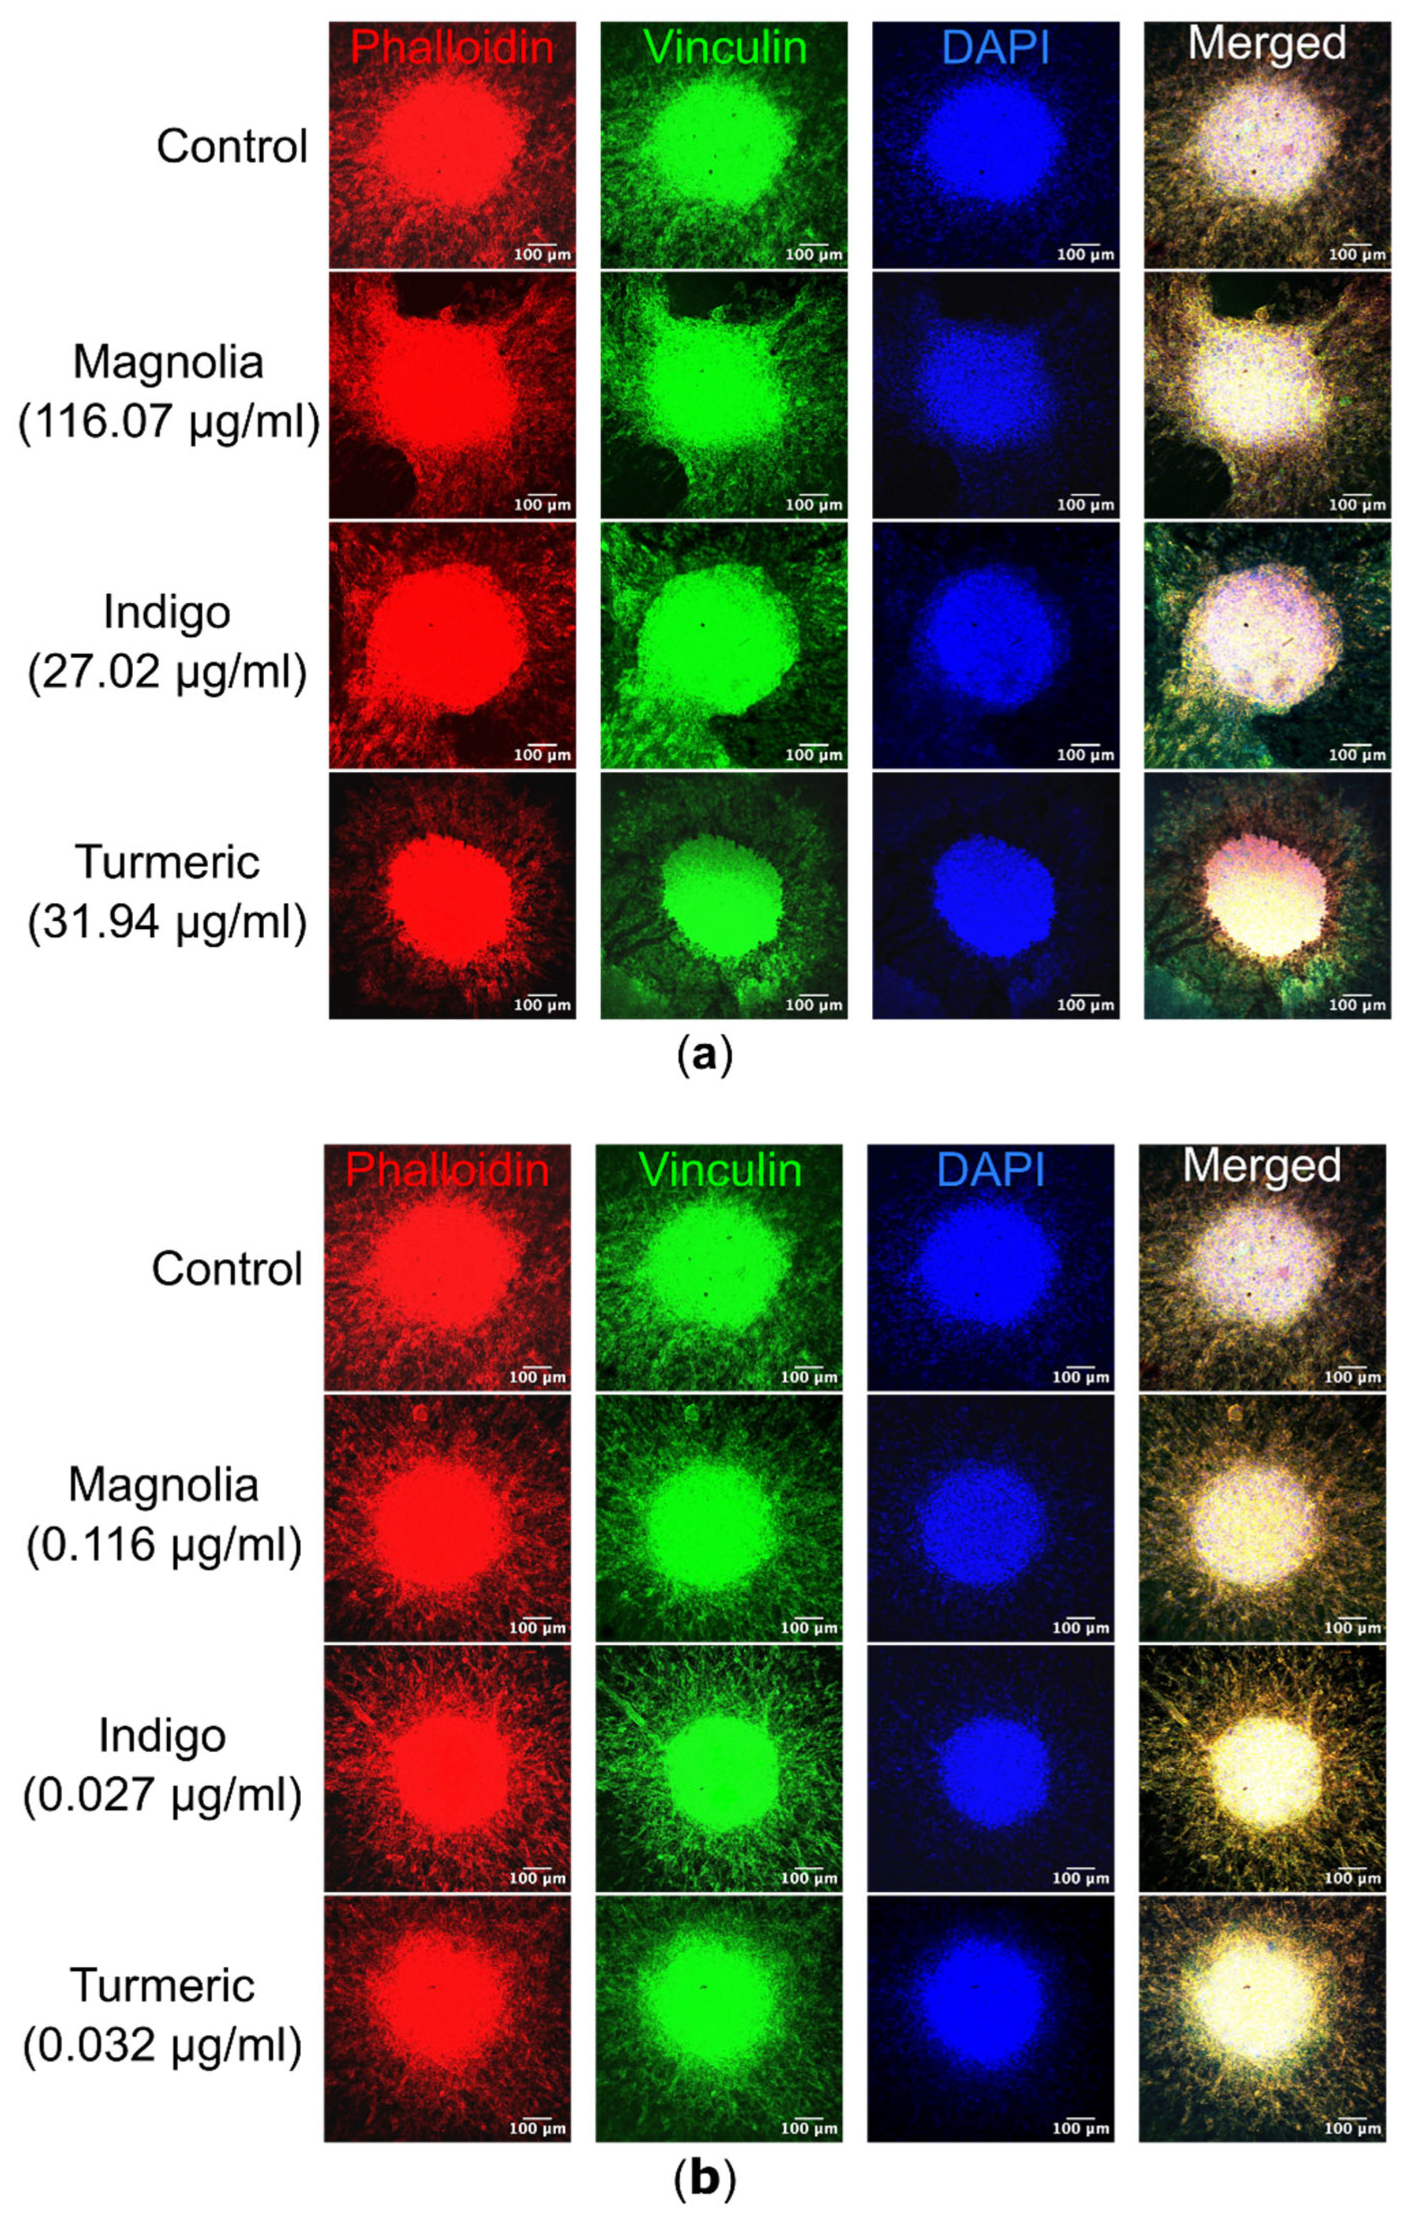
Visualization of spheroids and migrating cells in their collagen plugs by confocal microscopy highlighted differences in cell morphology as a result of drug treatment. The most noticeable effect was observed after treatment with Turmeric (31.94 µg/ml), with migrating cells possessing a rounded morphology, compared to the elongated cell body observed in the control mock-treated spheroids. In Turmeric (31.94 µg/ml) treated spheroids, actin appeared concentrated in the spheroid core. However, this effect was not observed with the lower Turmeric concentration (0.032 µg/ml), suggesting the effects on migration are concentration dependent. Both Turmeric (31.94 µg/ml) and Indigo (27.02 µg/ml) treatments appeared to result in sheet-like migration, rather than single cell motility seen in the control. For Magnolia and Indigo, at both low and high concentrations, cell morphology was consistent with the control.
Figure 9.
Immunofluorescence of both migrating U87 cells and spheroids within their respective collagen plugs. (a) Images of each treatment group were acquired, with Alexa fluor 488 labelled vinculin excited at a wavelength of 488nm, TRITC conjugated phalloidin at 561nm and DAPI at 405nm. Turmeric (31.94 µg/ml) cells are morphologically rounded in comparison to the control, and actin is less visible within migrating cells. Scale bar = 10 µm. (b) Similarly, spheroids treated with the lower concentrations of the plant-based compounds were visualized, but there are no obvious differences in cell morphology as a result of drug treatment. n ≥ 2 for each drug treatment. Scale bar = 10 µm.
4. Discussion
Treatment options for GBM remain unchanged and mainly focus on exerting cytotoxicity, although these treatments are failing to offer a significant survival benefit to patients. No current GBM treatment functions to target cell migration, despite high migratory activity in GBMs being directly associated with invasion into healthy brain parenchyma and therefore tumor recurrence, highlighting that this is an area of unmet need in GBM management. Hence, there is an urgent demand for novel or repurposed treatment options to improve GBM patient survival by targeting migration in combination with standard treatments like surgery, chemotherapy and radiotherapy. Plant-based compounds are of particular interest in GBM research as they have been shown to exhibit anti-cancer activity with associated low, non-specific cytotoxic side effects, however, any potential effects on cell migration are less well documented. Therefore, we investigated the anti-migratory activity of three plant-derived compounds with known cytotoxicity, Turmeric, Indigo and Magnolia Bark, to determine if they could be potentially used in combination with standard GBM treatments to promote patient survival.
4.1. Turmeric
Microscopic examination at the subcellular level revealed changes in actin localization and FA dynamics following treatment with the plant-derived compounds, as hypothesized, as both proteins are required to promote cell adhesion, structure and movement [
29]. Cells in the mock-treated control group exhibited mainly stress fibres or cortical actin, whereas Turmeric treatment (31.94 µg/ml) resulted in an increase in cortical actin, however, this was determined to be statistically insignificant. In addition, stress fibre formation was completely inhibited following treatment with Turmeric, and interestingly all three compounds resulted in a statistically significant decrease in the number of cells with stress fibres. Decreased numbers of FAs were noted in the Turmeric group, concomitant with a striking rounded, amoeboid morphological phenotype. A distinct absence of actin stress fibres in Turmeric treated cells suggests that Curcumin can induce a mesenchymal amoeboid transition (MAT), as amoeboid cells require peripheral actin to generate the constant polarity changes necessary for migration [
30]. MAT has been previously documented in glioma cells, reducing Rac1 activity whilst increasing ROCK expression and our previous studies have also highlighted phenotypic switching in glioma cells [
31,
32,
33,
34]. Cytoskeletal changes observed following treatment with Turmeric have been previously noted, where cell migration inhibition occurred through actin and FA regulation, as previously demonstrated [
35]. Cofilin, a protein which functions to either extend or shorten actin filaments, was detected at reduced levels as a result of Turmeric treatment, suggesting a potential role of Curcumin in targeting the cytoskeleton [
36,
37]. It has been hypothesized that the effect of Turmeric on FA generation occurs via FAK (focal adhesion kinase), allowing regulatory control of cell migration [
38]. Previous studies have also shown that Curcumin reduces fascin expression, resulting in decreased filopodia formation in U87 cells [
39]. To our knowledge, our observation of the effect of Turmeric on FA dynamics in glioma cells has so far not been reported.
In 2D scratch assays, Turmeric significantly reduced the mean SIR at both concentrations used, however, this effect was enhanced at the higher concentration (31.94 µg/ml). In line with our findings, previous studies carried out also highlighted the anti-migratory activity of Curcumin using non-small cell lung cancer cells [
40]. Data generated in spheroid invasion assays demonstrated that treatment with low concentration Turmeric (0.032 µg/ml) failed to significantly reduce 3D migration in comparison to the control, at all timepoints. In contrast, the mean 24-hour edge MI and both 48-hour MIs were significantly lower in the higher concentration group (31.94 µg/ml), suggesting that the effects of Turmeric are concentration dependent in a 3D setting. It is interesting that the effects on the cells migrating the furthest away from the spheroid (indicated by the migration edge) for Turmeric treated cells were more significant than those on the migrating cell bulk front; we suggest that Curcumin may be particularly targeting highly migratory single GBM cells likely to acquire treatment resistance and contribute to tumor recurrence [
41]. Despite Turmeric’s ability to significantly reduce migration of cells at the front and edge, migration was not completely inhibited, suggesting a switch to an alternative signaling pathway and form of motility. Visualization of the spheroids and migratory cells in their collagen plugs by confocal microscopy supports our suggestion of a morphological transition to amoeboid cell morphology and cell migration/invasion induced by Turmeric (31.94 µg/ml), compared to the elongated cell bodies observed in cells emanating from the control, mock-treated spheroids, although this effect was not observed at the lower concentration. In addition, we suggest a possible switch to collective cell migration in response to Turmeric, which has been previously noted in established glioma cell lines following anti-migratory drug treatment [
34].
GBM cell migration is a complex process governed by many cellular mechanisms and pathways, many of which become dysregulated via acquired mutations to oncogenes and tumor suppressor genes (TSGs) [
42]. As a product of a TSG, phosphatase and tensin homolog (PTEN) acts to regulate several signaling pathways involved in cell growth and division [
43]. Mutations resulting in a loss of function to
PTEN promote increased proliferative activity, giving rise to additional mutations which could potentially result in GBM cell survival [
44]. The PI3K-PKB/Akt-mTOR pathway is one such signaling mechanism under the regulatory control of PTEN, with roles in cell survival and proliferation [
45]. Once the proto-oncogene Ras is activated upon receptor tyrosine kinase binding in healthy cells, the PI3K (phosphoinositide-3-kinase) signaling cascade is subsequently triggered [
46]. Resulting in the activation of second messengers, PI3K initiates mammalian target of rapamycin complex 1 (mTORC1) expression, to stimulate proliferation. Protein kinase B (PKB) activation also occurs via a PI3K mediated mechanism; however this can be halted by PTEN [
47].
Figure 10.
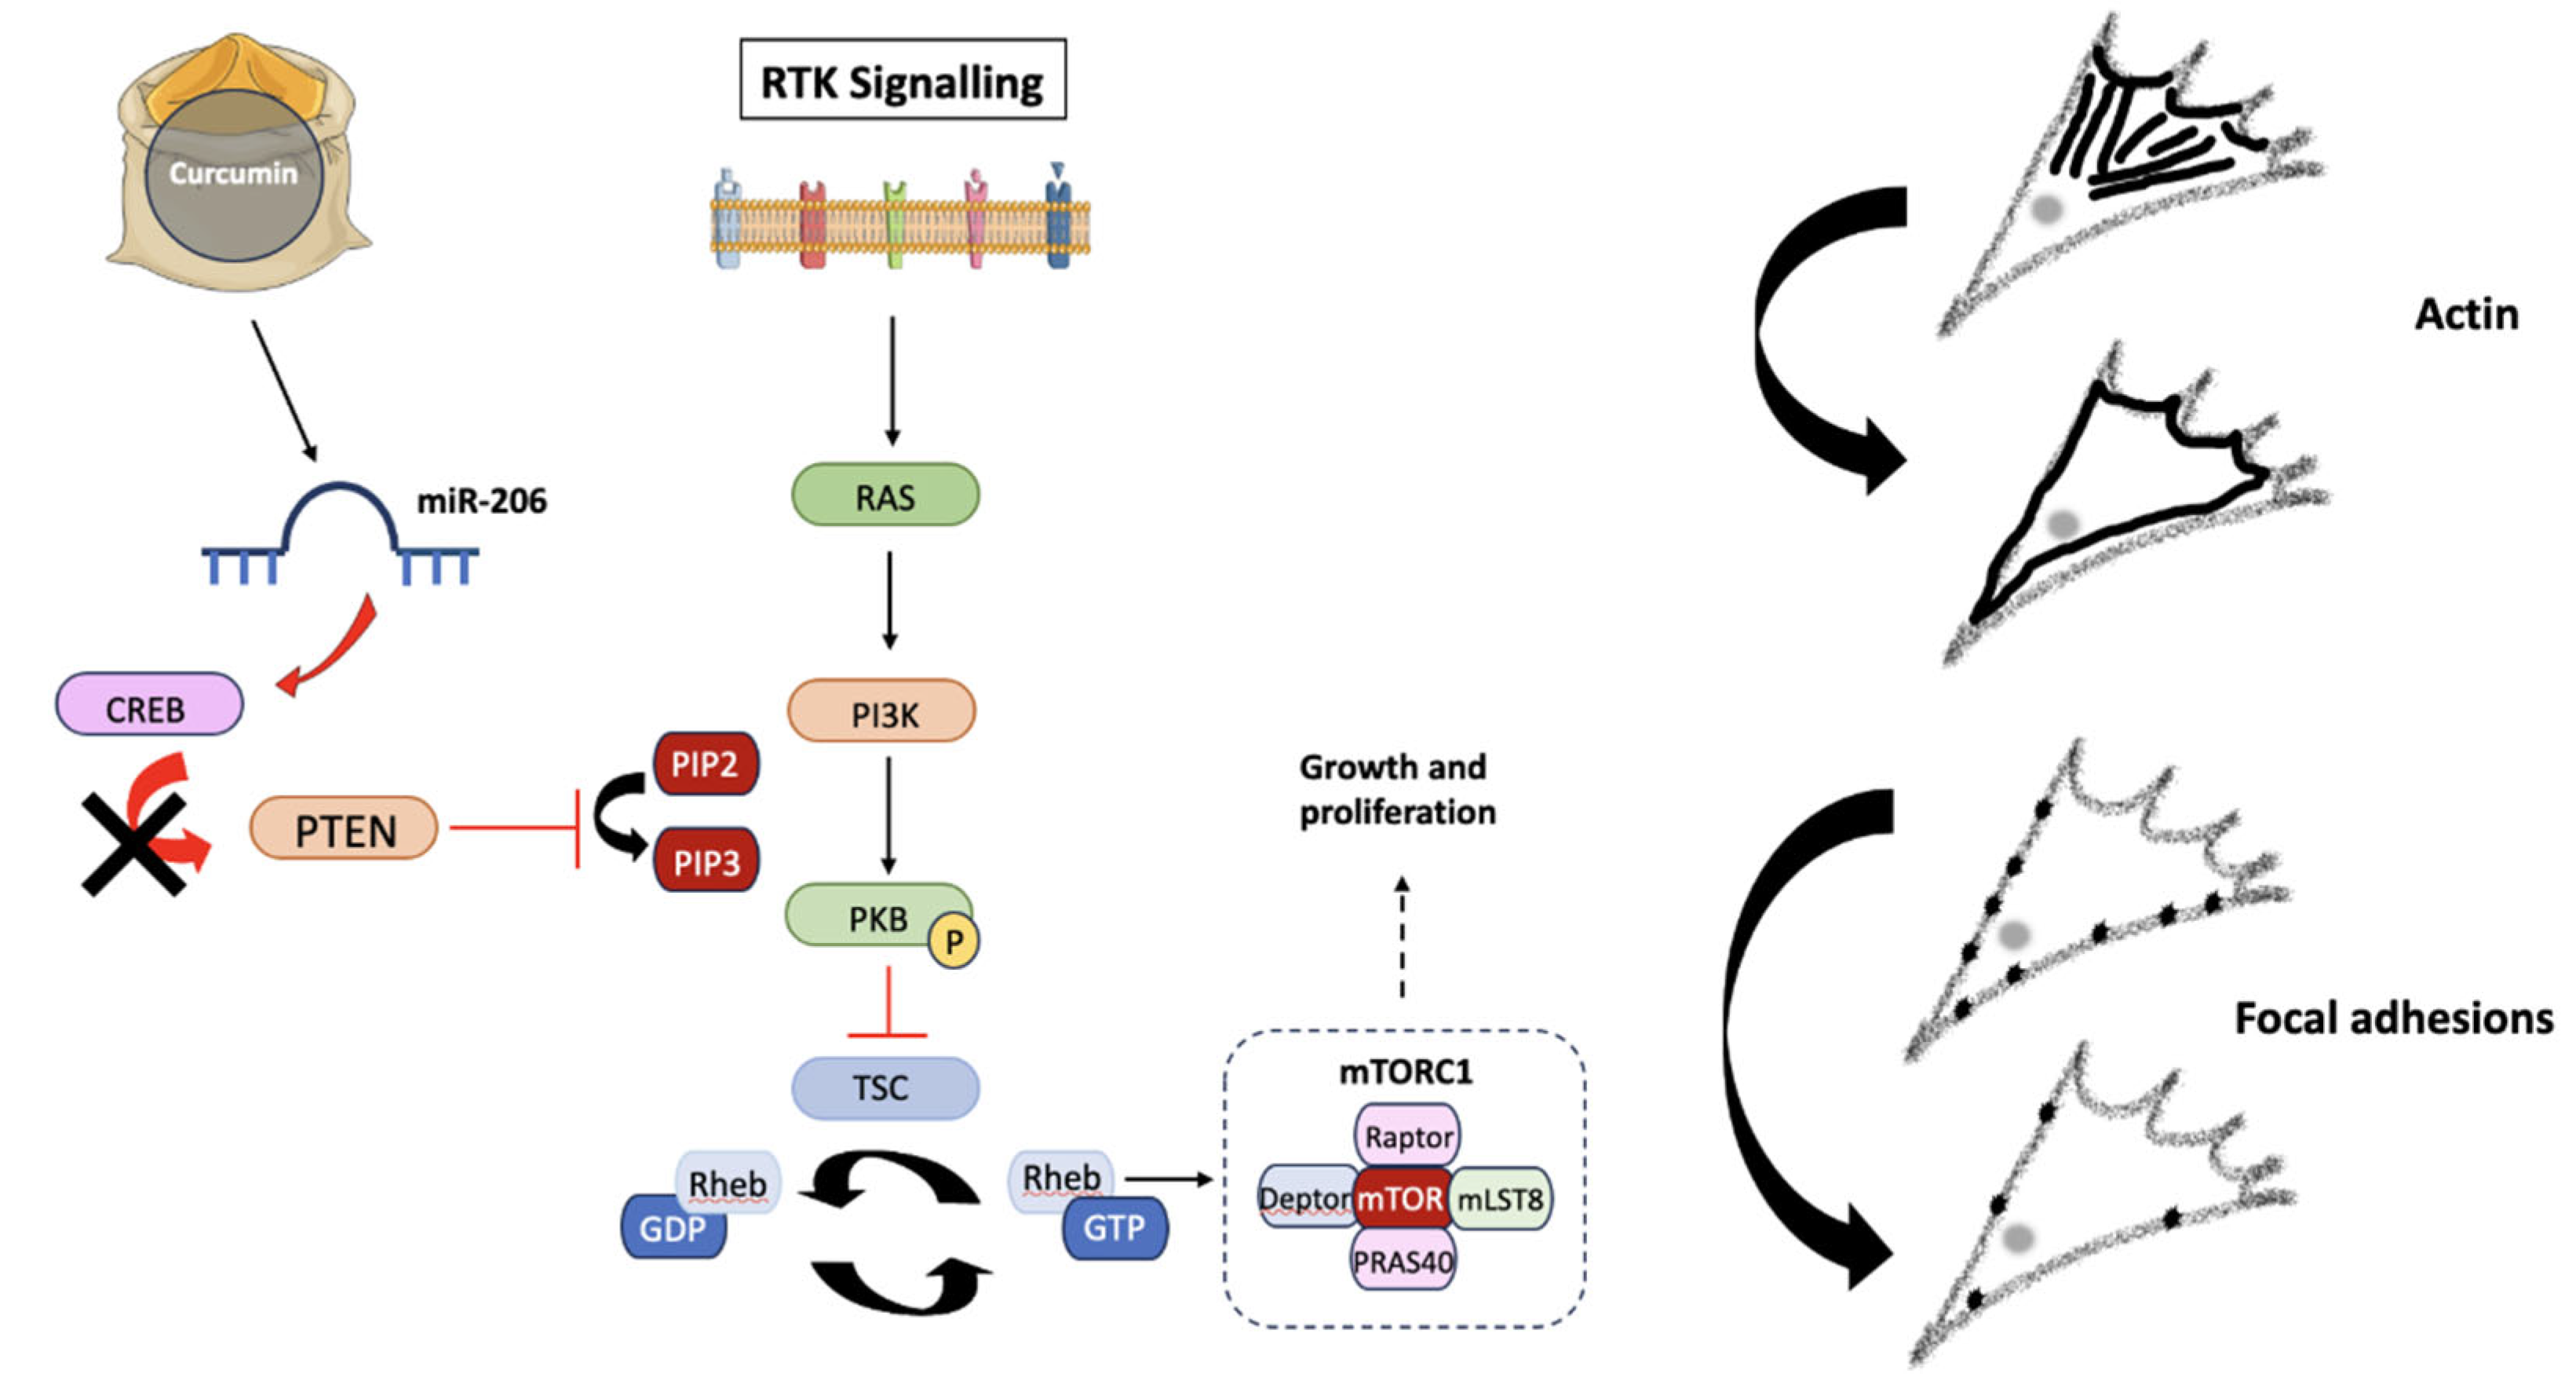
The potential effects of Curcumin on the PI3K-PKB-mTOR pathway. Receptor tyrosine kinases (RTKs) activate Ras and PI3K following the conversion of PIP2 into PIP3. PKB is then activated via phosphorylation, where it inhibits tuberous sclerosis protein (TSC), a GTPase responsible for converting Rheb-GTP into Rheb-GDP. Rheb (Ras homolog enriched in brain) controls mTORC1 expression, exerting effects on growth and proliferation. Curcumin, the active compound of Turmeric, has been shown to up-regulate miR-206, which reduces CREB protein expression, preventing PTEN down-regulation and therefore inhibiting mTORC1 activity by preventing PKB phosphorylation. The lack of mTORC1 activity induces changes in cytoskeletal dynamics, due to direct effects on migration. Created using Smart Servier Medical Art (
https://smart.servier.com/).
Previous studies have suggested that Curcumin exerts its effects on non-small cell lung cancer migration due to inhibition of the PI3K-PKB-mTOR signaling pathway, which acts to increase miR-206 expression and ultimately prevent carcinogenesis [
40]. By decreasing CREB (cyclic-AMP response binding element) expression, miR-206 can act as an activator or inhibitor of tumor progression. In the case of GBMs, CREB activity exerts control over
PTEN, promoting increased proliferation [
48]. The anti-migratory effects of Turmeric can potentially be attributed to suppression of the PI3K-PKB-mTOR pathway and miR-206 overexpression, consequently increasing PTEN expression due to decreased CREB activation. Treatment strategies targeting the PI3K-PKB-mTOR pathway result in reduced chemotherapy resistance and improved patient outcomes, implying that the use of Turmeric in targeting this signaling pathway is clinically relevant [
49,
50].
Cell migration often utilizes a leader-follower system, with cells gaining a benefit over the surrounding cells to essentially carve a path for the follower cells to take advantage of [
51]. Little is known about the molecular and cellular differences between follower and leader cells, however the ability of Turmeric to target GBM leader cells demonstrates its therapeutic potential, as the leader or edge cells directly contribute to GBM recurrence and patient death [
52].
4.2. Indigo
Treatment with Indigo (27.02 µg/ml) significantly increased the number of cells with primarily cortical actin, whilst decreasing the numbers with actin stress fibres. FA numbers were also significantly reduced, however, both stress fibres and FA formation were not completely inhibited, indicating a higher concentration is required to completely inhibit these cellular localizations and associated dynamics in GBM cells. Indirubins are a group of active compounds found in Indigo which exert cytotoxic effects [
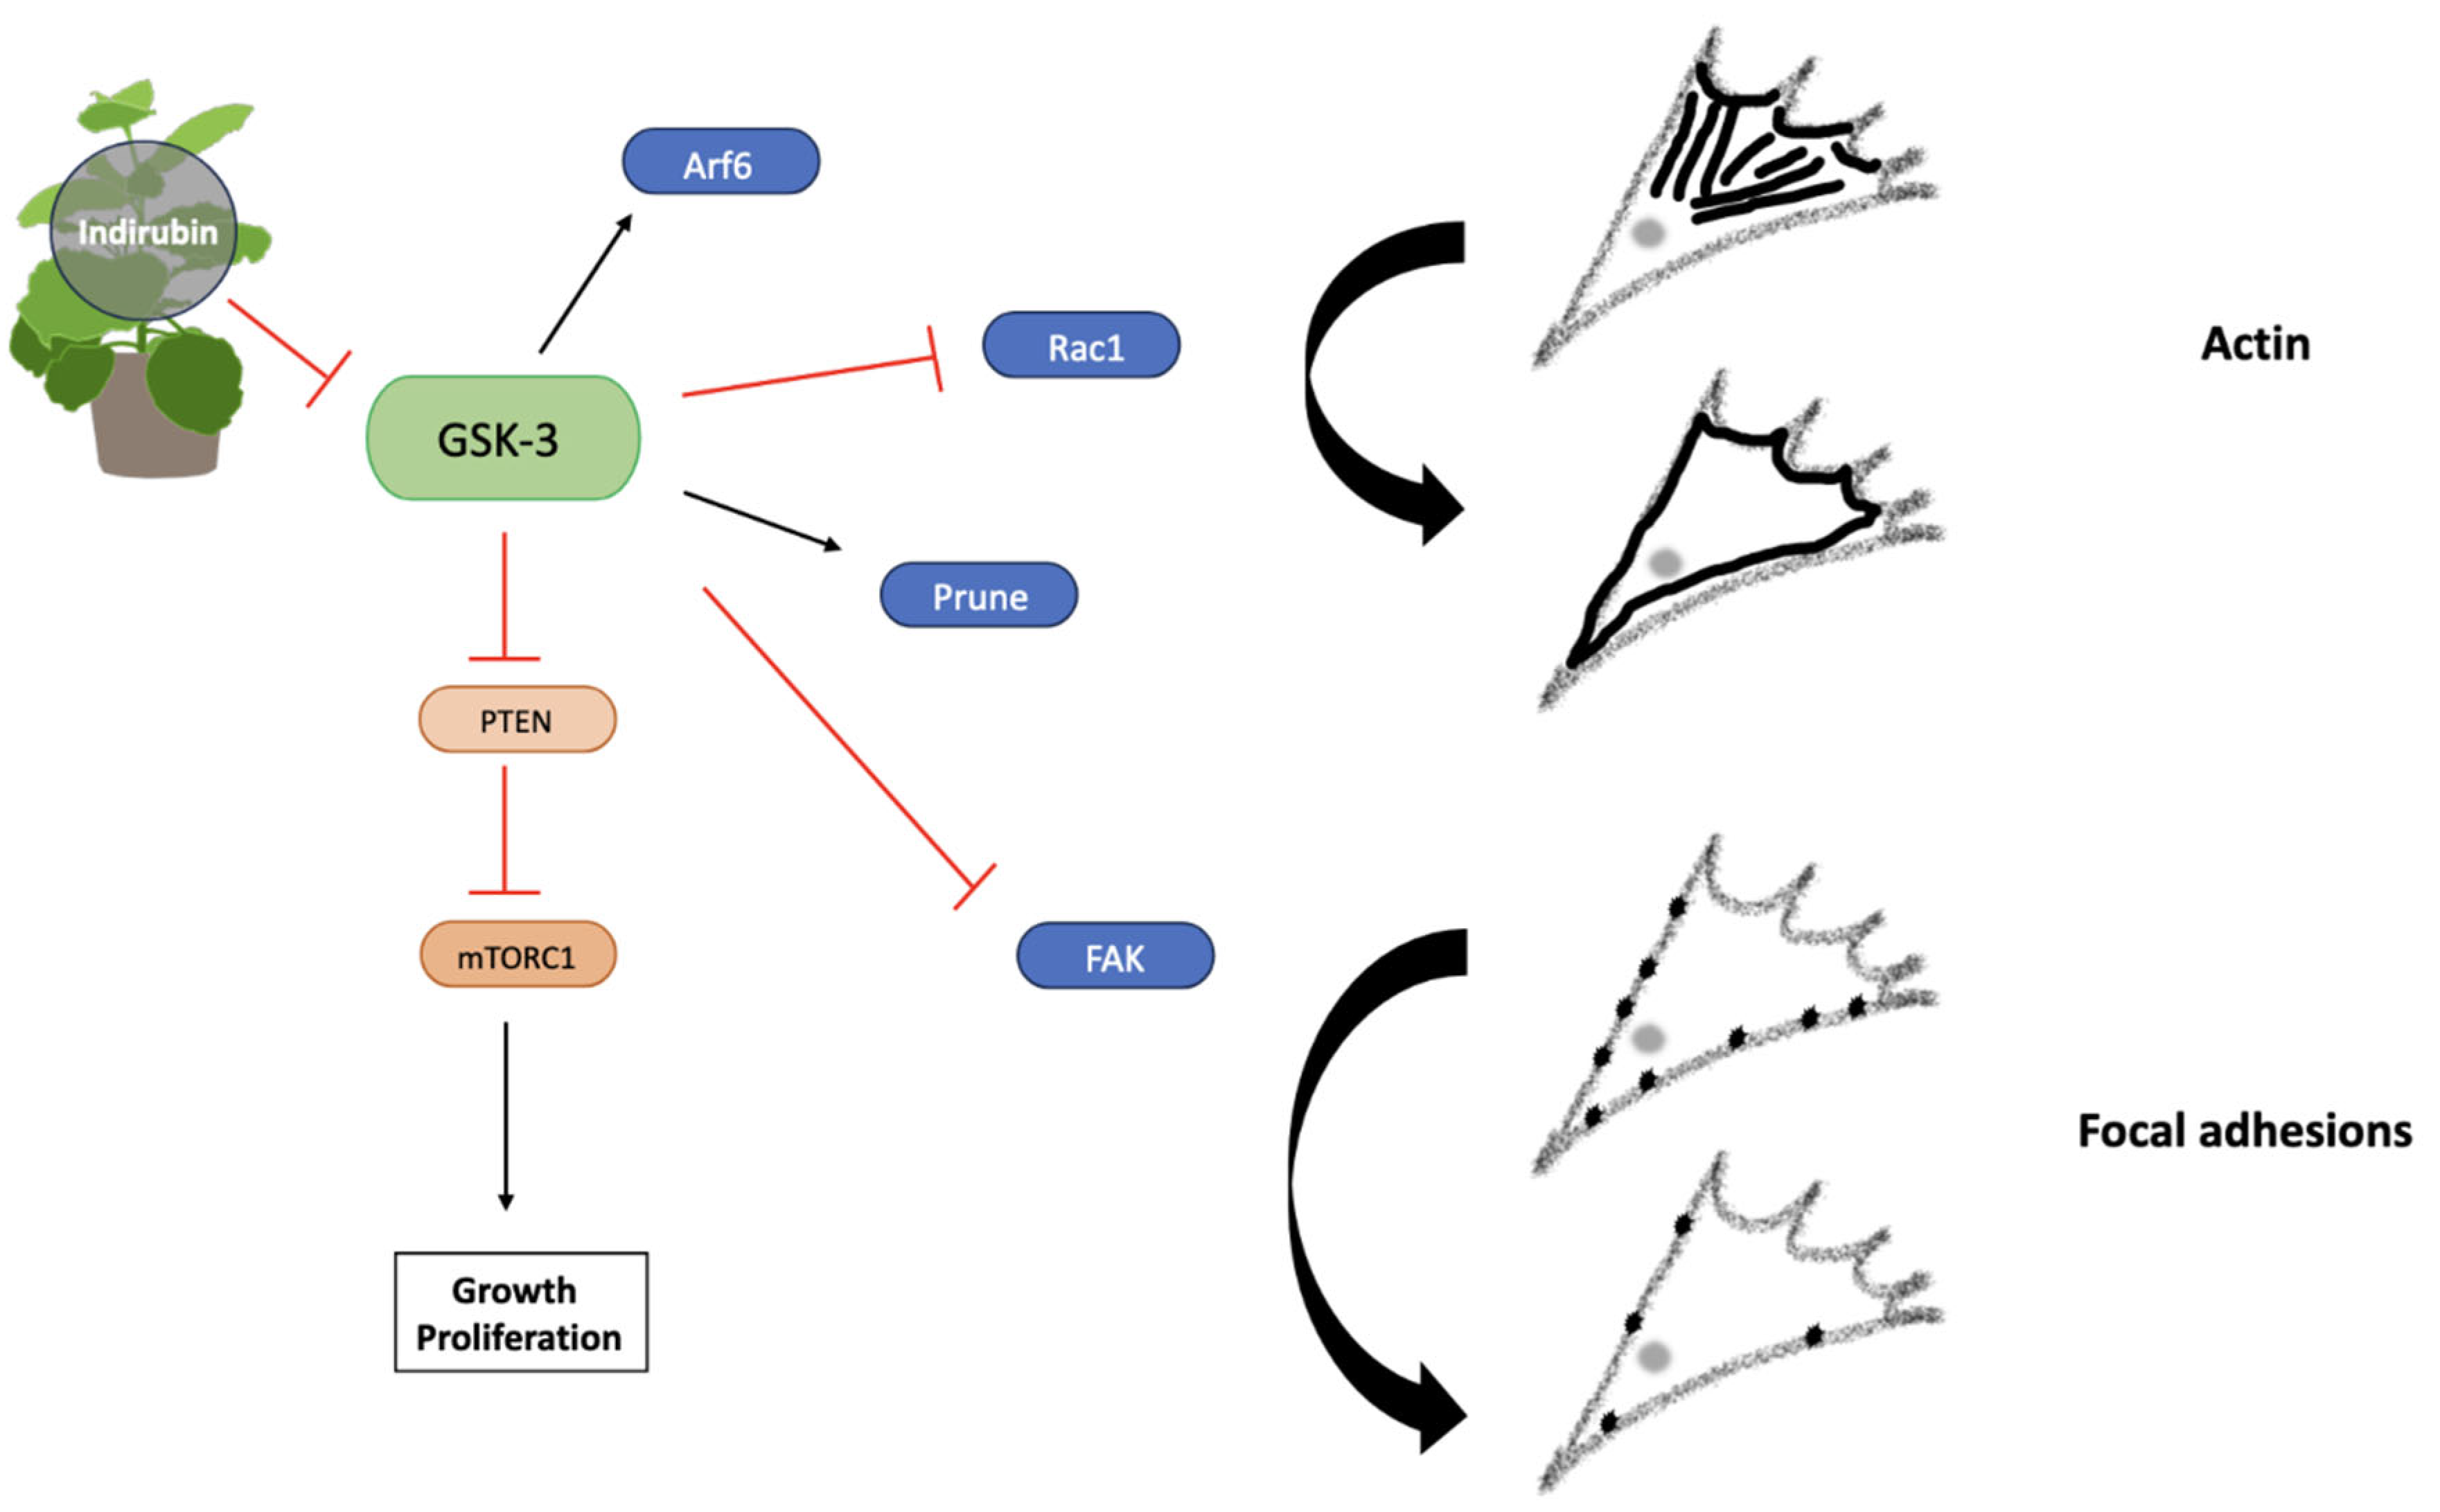
53]. BIO is part of the Indirubin group and has demonstrated efficient migrastatic activity in reducing GBM cell migration through a process of GSK-3 inhibition, therefore resulting in cytoskeletal changes and reduced FA generation [
25].
2D migration was reduced the most in Indigo treated scratches at the IC
75 concentration (27.02 µg/ml), but this effect was not as enhanced at the lower concentration (0.027 µg/ml). Indigo (0.027 µg/ml) exerted the most anti-migratory effect on spheroids at the migrating edge after both 24 and 48 hours. At the higher Indigo concentration, the mean front and edge MIs were only significantly reduced after 24 hours, suggesting that Indigo degrades quickly. As therapeutic compounds are required to remain at a constant concentration within the brain during treatment, the short duration of Indigo potentially limits its translation into the clinic and suggests a carefully planned treatment regime over a defined time period [
54]. The effect of Indigo on migration from spheroids was more pronounced at the migrating front at both concentrations and all timepoints, indicating its anti-migratory effect is much less pronounced in GBM leader cells, potentially limiting the use of Indigo in patients.
Confocal microscopy demonstrated that there were few differences in the morphology of migrating cells following treatment with both concentrations of Indigo, indicating that its effects are exerted at a subcellular level. However, this contradicts research which has highlighted the presence of cortical actin localization and amoeboid morphology following GSK-3 inhibition, suggesting that Indigo is capable of targeting several signaling pathways or that different derivatives exert distinct effects on cell morphology [
55]. GSK-3 functions in several signaling pathways involved in cell migration such as PTEN suppression, actin expression via Rac activation and FAK inhibition, changing cytoskeletal dynamics to ultimately alter motility [
56]. It is worth noting that cells migrating from spheroids in the higher concentration group appeared to move in a sheet-like manner indicative of collective cell migration.
Figure 11.
Indirubin exerts anti-migratory effects via GSK-3 inhibition. Arf6 activation induced by GSK-3 promotes actin localisation, whilst Prune increases FAK expression. Maintenance of FA turnover is controlled by GSK-3 mediated FAK inhibition. PTEN inhibition also depends on GSK-3 expression, promoting activation of the PI3K-PKB-mTORC1 pathway, therefore leading to growth, proliferation and migration. Actin localisation and FA dynamics are altered via GSK-3 inhibition. Created using Smart Servier Medical Art (
https://smart.servier.com/).
4.3. Magnolia
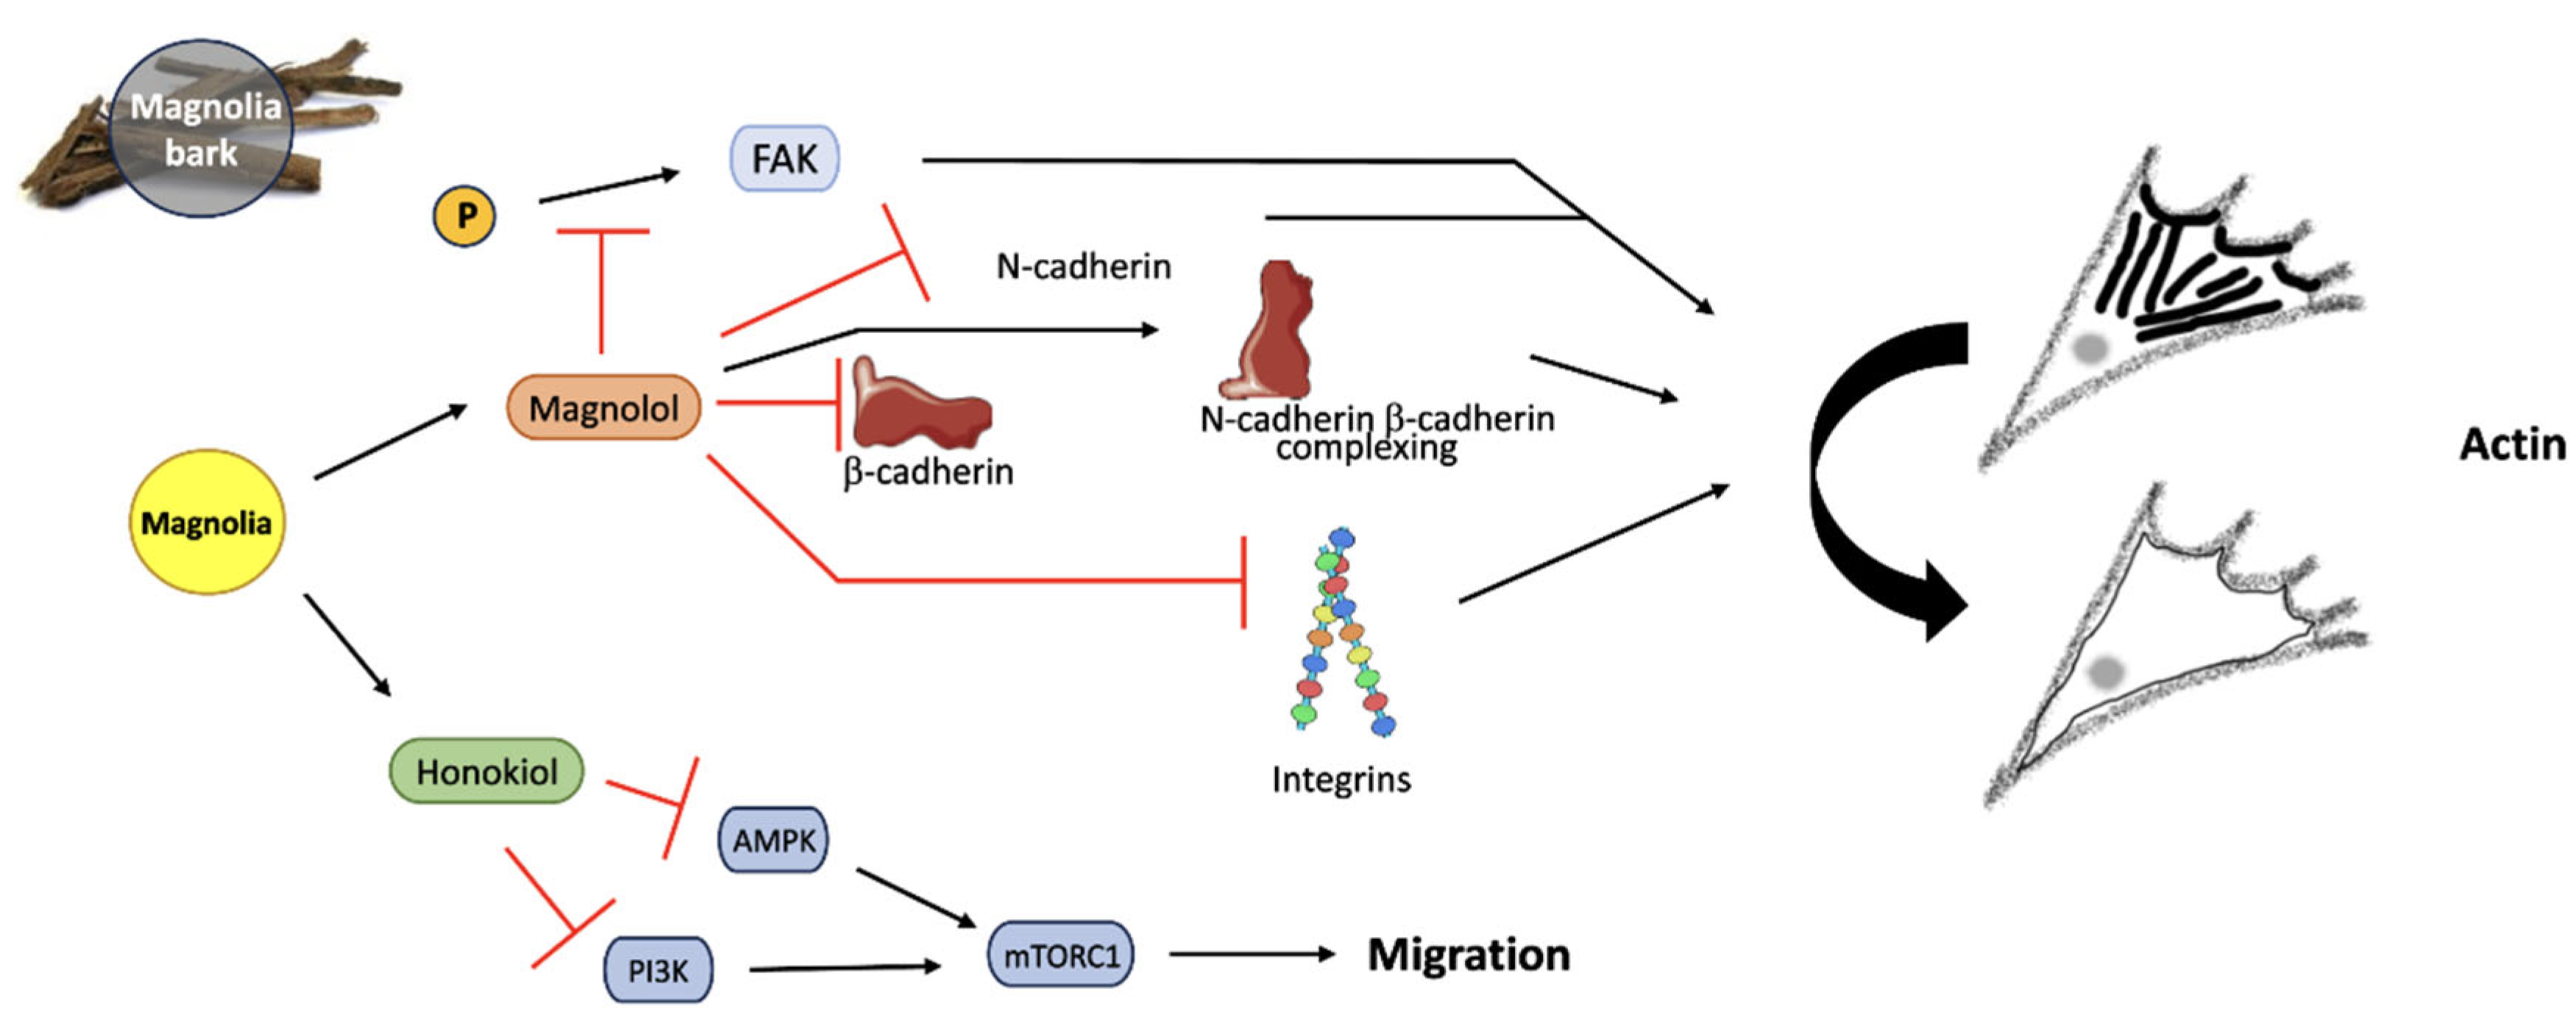
The number of cells with primarily actin stress fibres was significantly reduced in the Magnolia treatment group (116.07 µg/ml), however, the decrease in FA production was determined to be insignificant. As one of Magnolia’s active agents, the efficiency of Magnolol as a migrastatic has been proposed to occur as a result of reduced FA expression, membrane bound N-cadherin expression and a lack of FAK phosphorylation [
57]. N-cadherins (neural-cadherins) are overexpressed when cells gain the mesenchymal features required to invade surrounding tissues as a unit [
58,
59]. The impact of cadherin expression on glioma survival has been questioned, however [
60].
At both Magnolia concentrations, the mean SIR was reduced in comparison to the control group, however this was only statistically significant at the lower concentration (0.116 µg/ml). 3D cell migration from spheroids was decreased the most at the migrating front after 24 hours following treatment with 0.116 µg/ml Magnolia, but this was not observed after 48 hours, suggesting that Magnolia fails to exert anti-migratory activity over a longer time period. Despite Magnolia exerting anti-migratory effects in both 2D and 3D, no discernible effects on cell morphology were observed as cells moved away from the original spheroids. Magnolia’s active compound Honokiol has exhibited both anti-migratory and cytotoxic activity on cancer cells, with autophagy being triggered at high concentrations due to decreased PI3K activity, therefore inhibiting functions carried out by the PI3K-PKB-mTOR pathway [
61]. It is believed that reduced mTOR activity occurs due to AMPK (5’ AMP-activated protein kinase) expression, consequently inhibiting cell migration [
62]. Although this mechanism is not fully understood, Magnolia may act via similar signaling pathways as Turmeric. Magnolia treatment failed to completely halt GBM cell migration in all assays carried out, perhaps suggesting a switch to an alternative method of movement, therefore further research is required to determine if cells possess the capacity to acquire treatment resistance after exposure to each of the plant-based drugs.
Figure 12.
Magnolia bark reduces cell migration through the action of both APIs, Magnolol and Honokiol. FAK phosphorylation is inhibited by Magnolol, down-regulating N-cadherins, β-cadherins, and integrins. N-cadherin and β-cadherin complexation is increased by Magnolol, resulting in reduced migration. AMPK and PI3K are inhibited by Honokiol, consequently decreasing mTORC1 activity and migration by altering actin localization in the cytoskeleton. Created using Smart Servier Medical Art (
https://smart.servier.com/); Magnolia bark image created by siewlingc (
https://www.freeimg.net/photo/1000145/traditionalchinesemedicine-chineseherb-bark).
5. Conclusions
Cytotoxic activity of plant-derived compounds on cancer cells have been frequently reported in the literature, making them molecules of great interest. However, the repurposing of these compounds as migrastatics is less well documented and is a novel approach to prevent tumor recurrence and improve patient survival. In this study, 2D and 3D migration and invasion assays have demonstrated the anti-migratory activity of three plant-derived compounds with previously established cytotoxic, anti-cancer activity. We report that Turmeric, Magnolia and Indigo are all showing promise as migrastatic drugs, with Turmeric exhibiting the most pronounced effect on migration, potentially via a PTEN mediated mechanism. Both of Magnolia’s active agents, Magnolol and Honokiol, may decrease migration via inhibition of FAK phosphorylation and reduced PI3K activity, respectively. Down-regulation of GSK-3 is responsible for the effect on migration observed following treatment with Indigo. Despite Turmeric, Magnolia and Indigo all exerting anti-migratory activity, Turmeric resulted in significant decreases in GBM cell migration and was particularly efficient at targeting cells at the spheroid migrating edge, emphasizing the potential role of Curcumin as a GBM therapeutic to prevent tumor recurrence and ultimately improve patient survival.
This study highlights that the repurposing of naturally sourced compounds with proven cytotoxic and anti-cancer activity is a cost effective and efficient strategy to target cell migration in highly motile cancer cells such as GBMs. As our approach to use plant-derived products as migrastatics has demonstrated Turmeric’s anti-migratory activity, further investigation should be carried out to elucidate the signaling pathways involved. In addition, we will continue our studies using patient-derived cell lines to confirm if our observed effects can be reproduced in a more clinically relevant background. Turmeric is readily available and inexpensive, with no discernible non-specific side effects; therefore future studies should also determine the effects of a combinatory approach with the standard cytotoxic treatment agent Temozolomide (TMZ) to provide improved treatment options for brain tumor patients.
Author Contributions
Conceptualization, A.B.-R.; methodology, E.T., S.P. and A.B.-R.; software, E.T. and S.P.; validation, E.T., S.P. and A.B.-R.; formal analysis, E.T. and S.P.; investigation, E.T.; resources, E.T., S.P. and A.B.-R.; data curation, E.T., S.P. and A.B.-R.; writing—original draft preparation, E.T and S.P.; writing—review and editing, S.P. and A.B.-R.; visualization, E.T., S.P. and A.B.-R.; supervision, A.B.-R.; project administration, A.B.-R.; funding acquisition, A.B.-R.. All authors have read and agreed to the published version of the manuscript.
Funding
This research received no external funding.
Institutional Review Board Statement
Not applicable.
Informed Consent Statement
Not applicable.
Data Availability Statement
Data will be made available on request.
Acknowledgments
We would like to thank Emma Pinder and Kayley Jaworska (University of Huddersfield) for their technical support during this project.
Conflicts of Interest
The authors declare no conflict of interest.
References
- Weller, M.; et al. Standards of care for treatment of recurrent glioblastoma--are we there yet? Neuro-Oncology 2013, 15, 4–27. [Google Scholar] [CrossRef] [PubMed]
- Thakkar, J.P.; et al. Epidemiologic and molecular prognostic review of glioblastoma. Cancer Epidemiology, Biomarkers & Prevention 2014, 23, 1985–1996. [Google Scholar]
- Minniti, G.; et al. Current status and recent advances in reirradiation of glioblastoma. Radiation Oncology 2021, 16. [Google Scholar] [CrossRef] [PubMed]
- Davis, M.E. Glioblastoma: Overview of Disease and Treatment. Clinical Journal of Oncology Nursing 2016, 20, 2–8. [Google Scholar] [CrossRef]
- Wu, W.; et al. Glioblastoma multiforme (GBM): An overview of current therapies and mechanisms of resistance. Pharmacological Research 2021, 171. [Google Scholar] [CrossRef] [PubMed]
- Singh, S.K. and R. Singh, Nanotherapy: targeting the tumour microenvironment. Nature Reviews Cancer 2022, 22, 258. [Google Scholar] [CrossRef] [PubMed]
- Mierke, C.T. Physical view on migration modes. Cell Adhesion & Migration 2015, 9, 367–379. [Google Scholar]
- O'Neill, G.M. The coordination between actin filaments and adhesion in mesenchymal migration. 3Cell Adhesion & Migration 2009, 3, 355–357. [Google Scholar]
- Wehrle-Haller, B. Structure and function of focal adhesions. Current Opinion in Cell Biology 2012, 24, 116–124. [Google Scholar] [CrossRef]
- Sen, T.; Samanta, S.K. Medicinal plants, human health and biodiversity: a broad review. Biotechnological Applications of Biodiversity 2015, 147, 59–110. [Google Scholar]
- Khan, T.; Gurav, P. PhytoNanotechnology: Enhancing Delivery of Plant Based Anti-cancer Drugs. Frontiers in Pharmacology 2018, 8. [Google Scholar] [CrossRef]
- Sarrica, A.; et al. Safety and Toxicology of Magnolol and Honokiol. Planta Medica 2018, 84, 1151–1164. [Google Scholar] [CrossRef] [PubMed]
- Khatoon, F.; et al. Pharmacological features, health benefits and clinical implications of Honokiol. Journal of Biomolecular Structure and Dynamics 2023, 41, 7511–7533. [Google Scholar] [PubMed]
- Banik, K.; et al. Honokiol for cancer therapeutics: A traditional medicine that can modulate multiple oncogenic targets. Pharmacological Research 2019, 144, 192–209. [Google Scholar] [CrossRef] [PubMed]
- Pan, J.; et al. Honokiol targets mitochondria to halt cancer progression and metastasis. Molecular Nutrition & Food Research 2016, 60, 1383–1395. [Google Scholar]
- Ranaware, A.M.; et al. Magnolol: A Neolignan from the Magnolia Family for the Prevention and Treatment of Cancer. International Journal of Molecular Sciences 2018, 19, 2362. [Google Scholar] [CrossRef] [PubMed]
- Xu, X.-Y.; et al. Bioactivity, Health Benefits, and Related Molecular Mechanisms of Curcumin: Current Progress, Challenges, and Perspectives. Nutrients 2018, 10, 1553. [Google Scholar] [CrossRef] [PubMed]
- Astinfeshana, M.; et al. Curcumin inhibits angiogenesis in endothelial cells using downregulation of the PI3K/Akt signaling pathway. Food Bioscience 2019, 29, 86–93. [Google Scholar] [CrossRef]
- Sharifi-Rad, J.; et al. Turmeric and Its Major Compound Curcumin on Health: Bioactive Effects and Safety Profiles for Food, Pharmaceutical, Biotechnological and Medicinal Applications. Frontiers in Pharmacology 2020, 11. [Google Scholar] [CrossRef]
- Bojko, A.; et al. Modulatory Effects of Curcumin and Tyrphostins (AG494 and AG1478) on Growth Regulation and Viability of LN229 Human Brain Cancer Cells. Nutrition and Cancer 2015, 67, 1170–1182. [Google Scholar]
- Zanotto-Filho, A.; et al. The curry spice Curcumin selectively inhibits cancer cells growth in vitro and in preclinical model of glioblastoma. Journal of Nutritional Biochemistry 2012, 23, 591–601. [Google Scholar] [CrossRef] [PubMed]
- Cui, H.; et al. Recent Advancements in Natural Plant Colorants Used for Hair Dye Applications: A Review. Molecules 2022, 27, 8062. [Google Scholar] [CrossRef] [PubMed]
- Xie, Q.; et al. A novel realgar-indigo naturalis formula more effectively induces apoptosis in NB4 cells. Pakistan Journal of Pharmaceutical Sciences 2019, 32, 957–962. [Google Scholar] [PubMed]
- Williams, S.P.; et al. Indirubins Decrease Glioma Invasion by Blocking Migratory Phenotypes in Both the Tumor and Stromal Endothelial Cell Compartments. Cancer Research 2011, 71, 5374–5380. [Google Scholar] [CrossRef]
- Cockle, J.V.; et al. Cell migration in paediatric glioma; characterisation and potential therapeutic targeting. British Journal of Cancer 2015, 112, 693–703. [Google Scholar] [CrossRef] [PubMed]
- Song, H.; et al. Discovery of selective, antimetastatic and anti-cancer stem cell metallohelices via post-assembly modification. Chemical Science 2019, 10, 8547–8557. [Google Scholar] [CrossRef] [PubMed]
- Schindelin, J.; et al. Fiji: an open-source platform for biological-image analysis. Nature Methods 2012, 9, 676–682. [Google Scholar] [CrossRef] [PubMed]
- IBM Corp. Released 2021; IBM SPSS Statistics for Macintosh, Version 28.0; IBM Corp: Armonk, NY.
- Revach, O.-Y.; I. Grosheva, and B. Geiger, Biomechanical regulation of focal adhesion and invadopodia formation. Journal of Cell Science 2020, 133. [Google Scholar] [CrossRef]
- Alvarez-González, B.; et al. Cytoskeletal Mechanics Regulating Amoeboid Cell Locomotion. Applied Mechanics Reviews 2014, 66. [Google Scholar] [CrossRef]
- Rösel, D.; et al. Up-regulation of Rho/ROCK signaling in sarcoma cells drives invasion and increased generation of protrusive forces. Molecular Cancer Research 2008, 6, 1410–1420. [Google Scholar] [CrossRef]
- Kosla, J.; et al. Metastasis of aggressive amoeboid sarcoma cells is dependent on Rho/ROCK/MLC signaling. Cell Communication & Signalling 2013, 11. [Google Scholar]
- Matsuoka, T. and M. Yashiro, Rho/ROCK signaling in motility and metastasis of gastric cancer. World Journal of Gastroenterology 2014, 20, 13756–13766. [Google Scholar] [CrossRef] [PubMed]
- Ketchen, S.E.; et al. Drug Resistance in Glioma Cells Induced by a Mesenchymal-Amoeboid Migratory Switch. Biomedicines 2021, 10, 9–24. [Google Scholar] [CrossRef] [PubMed]
- Davoodvandi, A.; et al. Antimetastatic Effects of Curcumin in Oral and Gastrointestinal Cancers. Frontiers in Pharmacology 2021, 12. [Google Scholar] [CrossRef] [PubMed]
- Bravo-Cordero, J.J.; et al. Functions of cofilin in cell locomotion and invasion. Nature Reviews Molecular Cell Biology 2013, 14, 405–415. [Google Scholar] [CrossRef] [PubMed]
- Li, M.; et al. Turmeric extract, with absorbable Curcumin, has potent anti-metastatic effect in vitro and in vivo. Phytomedicine 2018, 46, 131–141. [Google Scholar] [CrossRef] [PubMed]
- Mitra, S.K.; D.A. Hanson, and D.D. Schlaepfer. Focal adhesion kinase: in command and control of cell motility. Nature Reviews Molecular Cell Biology 2005, 6, 56–68. [Google Scholar] [CrossRef]
- Park, K.S.; et al. Anti-Migration and Anti-Invasion Effects of Curcumin via Suppression of Fascin Expression in Glioblastoma Cells. Brain Tumour Research and Treatment 2019, 7, 16–24. [Google Scholar] [CrossRef]
- Wang, N.; et al. Curcumin inhibits migration and invasion of non-small cell lung cancer cells through up-regulation of miR-206 and suppression of PI3K/AKT/mTOR signaling pathway. Acta Pharmaceutica 2020, 70, 399–409. [Google Scholar] [CrossRef]
- Bastola, S.; et al. Glioma-initiating cells at tumor edge gain signals from tumor core cells to promote their malignancy. Nature Communications 2020, 11. [Google Scholar] [CrossRef]
- Zhang, Y.; Q. Xia, and J. Lin. Identification of the potential oncogenes in glioblastoma based on bioinformatic analysis and elucidation of the underlying mechanisms. Oncology Reports 2018, 40, 715–725. [Google Scholar]
- Zhang, Z.; et al. PTEN regulates PLK1 and controls chromosomal stability during cell division. Cell Cycle 2016, 15, 2476–2485. [Google Scholar] [CrossRef] [PubMed]
- Hanahan, D. and R.A. Weinberg, Hallmarks of cancer: the next generation. Cell 2011, 144, 646–674. [Google Scholar] [CrossRef] [PubMed]
- He, Y.; et al. Targeting PI3K/Akt signal transduction for cancer therapy. Signal Transduction and Targeted Therapy 2021, 6. [Google Scholar] [CrossRef]
- Hemmings, B.A. and D.F. Restuccia, PI3K-PKB/Akt pathway. Cold Spring Harbor Perspectives in Biology 2012, 4. [Google Scholar] [CrossRef] [PubMed]
- Paplomata, E. and R. O'Regan, The PI3K/AKT/mTOR pathway in breast cancer: targets, trials and biomarkers. Therapeutic Advances in Medical Oncology 2014, 6, 154–166. [Google Scholar] [CrossRef] [PubMed]
- Zhang, H.; et al. Complex roles of cAMP-PKA-CREB signaling in cancer. Experimental Hematology & Oncology 2020, 9. [Google Scholar]
- Yue, D. and X. Qin, miR-182 regulates trastuzumab resistance by targeting MET in breast cancer cells. Cancer Gene Therapy 2019, 26, 1–10. [Google Scholar] [CrossRef]
- Liu, R.; et al. PI3K/AKT pathway as a key link modulates the multidrug resistance of cancers. Cell Death & Disease 2020, 11. [Google Scholar]
- Mercedes, S.A.V.; et al. Decoding leader cells in collective cancer invasion. Nature Reviews Cancer 2021, 21, 592–604. [Google Scholar] [CrossRef]
- Minata, M.; et al. Phenotypic Plasticity of Invasive Edge Glioma Stem-like Cells in Response to Ionizing Radiation. Cell Reports 2019, 26, 1893–1905. [Google Scholar] [CrossRef] [PubMed]
- Rebl, H.; et al. Synergistic effect of plasma-activated medium and novel indirubin derivatives on human skin cancer cells by activation of the AhR pathway. Scientific Reports 2022, 12. [Google Scholar] [CrossRef]
- Peat, S.; et al. Characterisation of the anti-migratory activity of the 6-bromoindirubin-3’oxime (BIO) derivative VTIND42 in patient-derived GBM subpopulations. Neuro-Oncology 2019, 21. [Google Scholar] [CrossRef]
- Hajka, D.; et al. GSK3 as a Regulator of Cytoskeleton Architecture: Consequences for Health and Disease. Cells 2021, 10. [Google Scholar] [CrossRef] [PubMed]
- Sun, T.; M. Rodriguez, and L. Kim. RGlycogen synthase kinase 3 in the world of cell migration. Development, Growth & Differentiation 2009, 51, 735–742. [Google Scholar]
- Cheng, Y.-C.; et al. Magnolol Inhibits Human Glioblastoma Cell Migration by Regulating N-Cadherin. Journal of Neuropathology & Experimental Neurology 2018, 77, 426–436. [Google Scholar]
- Mrozik, K.M.; et al. N-cadherin in cancer metastasis, its emerging role in haematological malignancies and potential as a therapeutic target in cancer. BMC Cancer 2018, 18. [Google Scholar] [CrossRef]
- Loh, C.-Y.; et al. The E-Cadherin and N-Cadherin Switch in Epithelial-to-Mesenchymal Transition: Signaling, Therapeutic Implications, and Challenges. Cells 2019, 8. [Google Scholar] [CrossRef]
- Noh, M.-G.; et al. Prognostic significance of E-cadherin and N-cadherin expression in Gliomas. BMC Cancer 2017, 17. [Google Scholar] [CrossRef]
- Yeh, P.-S.; et al. Honokiol induces autophagy of neuroblastoma cells through activating the PI3K/Akt/mTOR and endoplasmic reticular stress/ERK1/2 signaling pathways and suppressing cell migration. Cancer Letters 2016, 370, 66–77. [Google Scholar] [CrossRef]
- Lee, J.S.; et al. Honokiol induces apoptosis and suppresses migration and invasion of ovarian carcinoma cells via AMPK/mTOR signaling pathway. International Journal of Molecular Medicine 2019, 43, 1969–1978. [Google Scholar] [CrossRef]
|
Disclaimer/Publisher’s Note: The statements, opinions and data contained in all publications are solely those of the individual author(s) and contributor(s) and not of MDPI and/or the editor(s). MDPI and/or the editor(s) disclaim responsibility for any injury to people or property resulting from any ideas, methods, instructions or products referred to in the content. |
© 2024 by the authors. Licensee MDPI, Basel, Switzerland. This article is an open access article distributed under the terms and conditions of the Creative Commons Attribution (CC BY) license (http://creativecommons.org/licenses/by/4.0/).


