Preprint
Article

Spectral-Kinetic Characterization of YF3: Eu3+ and YF3: (Eu3+, Nd3+) Nanoparticles for Optical Temperature Sensing

This version is not peer-reviewed.

Submitted:

14 March 2024

Posted:

17 March 2024

You are already at the latest version

A peer-reviewed article of this preprint also exists.

Abstract
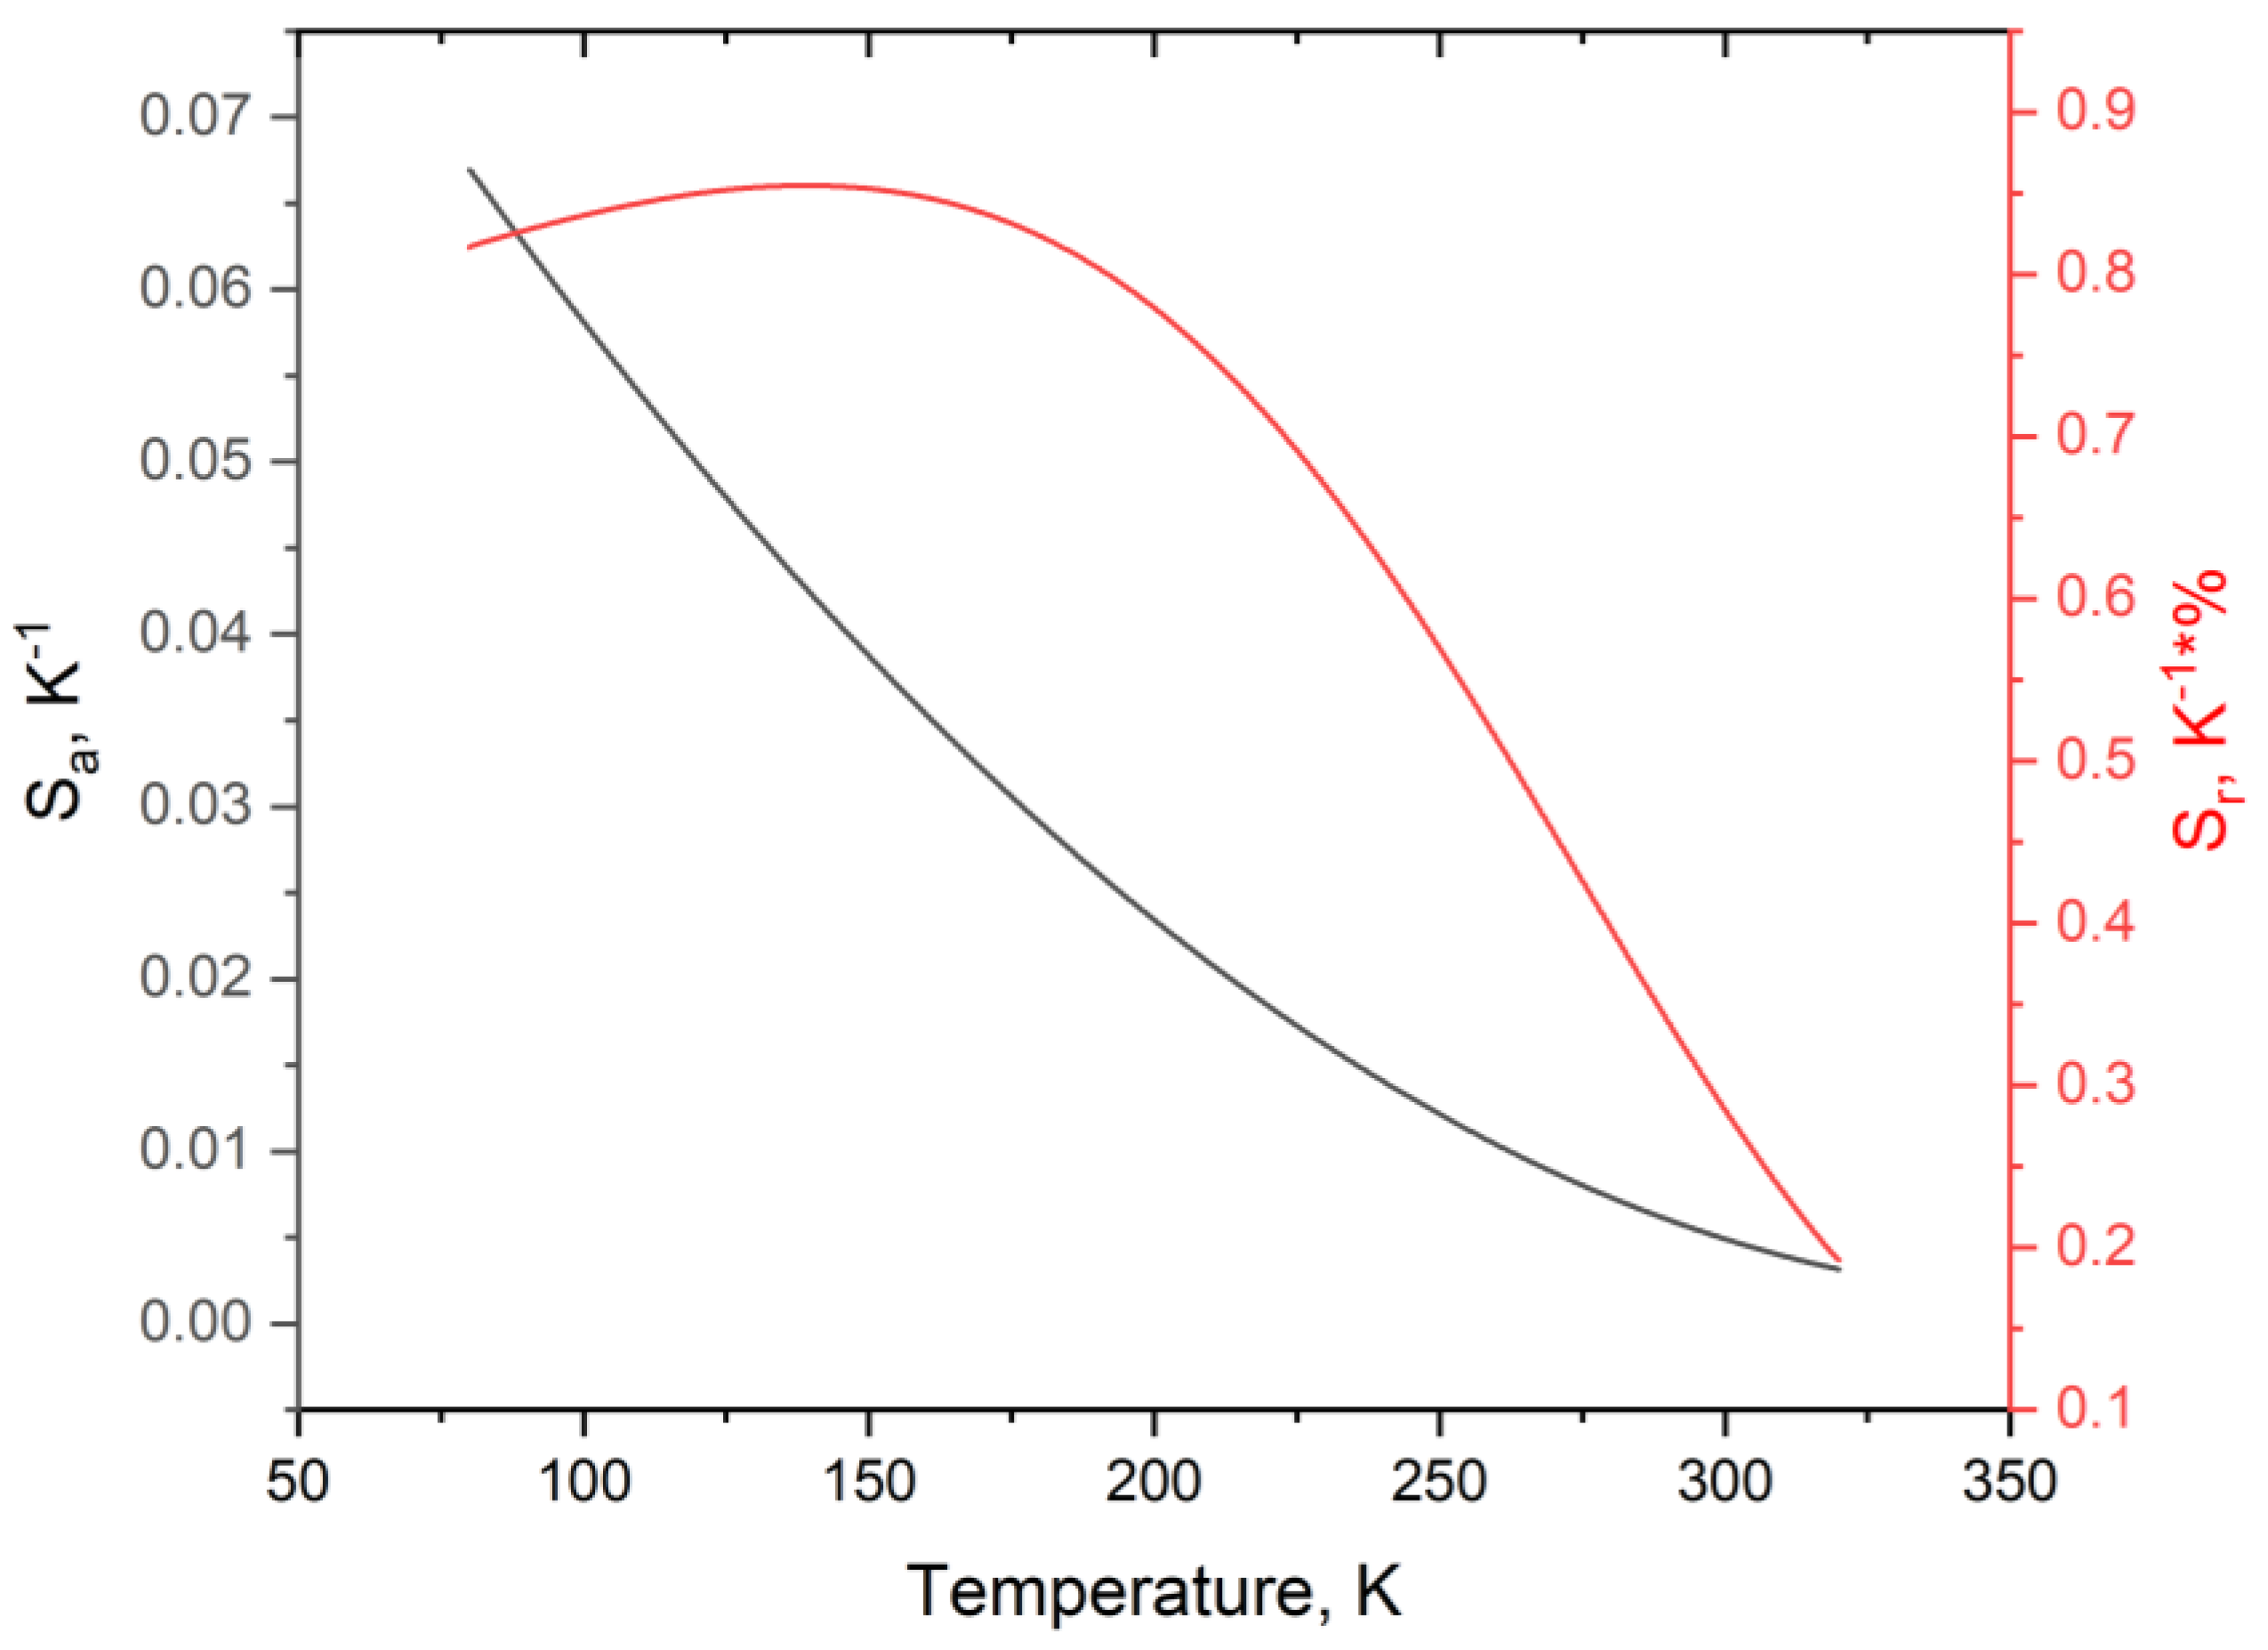
Abstract: The YF3: (Eu3+, Nd3+) nanoparticles (orthorhombic phase, D ~ 130 nm)) were synthesized via the co-precipitation method with subsequent hydrothermal treatment and annealing. The Eu3+ τdecay linearly descends with the increase of temperature in the 80 - 320 K range. The τdecay (T) slope values of the annealed YF3: Eu3+ (2.5 and 5.0 mol. %) nanoparticles were the highest (110·10-4 and 67·10-4, μs/K in the whole 80 – 320 K range, respectively. Thus, these samples were chosen for further doping with Nd3+. The maximum Sa and Sr values based on the LIR (IEu/INd) function were 0.67 K-1 (at 80 K) and 0.86 %·K-1 (at 154 K), respectively. As it was mentioned above, the sin-gle-doped YF3: Eu3+ (2.5. %) nanoparticles showed the linearly decreasing τdecay (T) function (5D0 – 7F1 emission). The main idea of Nd3+ co-doping was to increase this slope value (as well as the sensitivity) by increasing the rate of τdecay (T) descent via the addition of one more tempera-ture-dependent channel of 5D0 excited state depopulation. Indeed, we managed to increase the slope (Sa) up to 180·10-4 K-1 at 80 K. This result is one of the highest compared to the world analogs.
Keywords: 
Subject: 
Chemistry and Materials Science  -   Materials Science and Technology

1. Introduction

Optical temperature sensing methods based on the use of inorganic phosphors have been intensively developed during the last decade [1]. In these methods, temperature reading is performed via analysis of the luminescence signal, which should be temperature-dependent. In turn, the temperature dependence of the luminescence signal should be known [2,3]. Among a huge variety of inorganic phosphors including oxides and quantum dots, rare-earth-doped fluoride nanoparticles pay a special role due to high chemical and mechanical stability, bright narrow luminescence peaks [4], and, in some cases low cytotoxicity [5,6]. Yttrium fluoride is considered very promising host-matrix due to low phonon energy (around 500 cm-1), which leads to the decrease in the non-radiative transition probability. The water-based synthesis procedures are usually cheap, easy, and environmentally friendly. In addition, in this host a high down-conversion quantum yield for rare-earth (RE) ion pair was achieved [7]. The YF3 matrix provides substitution of Y3+ ions by RE3+ ones without valence change or charge compensation. Finally, in our previous work [8], we developed a hypothesis, that thermal expansion of YF3 also contributes in the temperature sensitivity of the RE spectral-kinetic characteristics. Thus, it is interesting to study another ion pair in this promising matrix.
In its turn, the choice of doping ion(s) is also a challenging task. Indeed, it depends on the application [4]. For medical applications including hyperthermia, the phosphors should operate in the so-called biological window, where the biological tissues are partially transparent [8,9]. In the case of in vitro studies, the excitation in this spectral range is also desirable because the operation in the biological window provides the lack of autofluorescence from cells. For industrial applications, for example, for temperature mapping of microcircuits such strict restrictions are not so significant [10]. However, very important characteristics of the optical temperature sensors are absolute (Sa) and relative (Sr) temperature sensitivities. These characteristics express the rate of change of the luminescence parameters with the temperature [1]. The higher rate provides higher sensitivity which leads to the more easiness and accuracy of temperature measurements. In the case of single-doped phosphors, the temperature sensitivity of spectral characteristics is commonly based on the presence of two thermally coupled electron levels sharing their electron populations according to the Boltzmann law [2,3]. The main disadvantage of these systems is relatively low temperature sensitivity depending on the energy gap between these two levels. Moreover, it is difficult to manipulate the energy gap due to the fact, that 4f electron shell is shielded by the 5s shell. To increase temperature sensitivity, double-doped phosphors can be utilized [2]. Indeed, there are more temperature-dependent processes, that can synergize increasing the temperature-dependence of spectral-kinetic characteristics. One of the most common and interesting way to increase the sensitivity is to analyze two emissions of heteronymous ions. However, these emissions should stem from two interacting energy levels. For example, in Tb3+, Eu3+:YF3 phosphors there are two pairs of interacting energy levels: 5D3 (Tb3+) - 5L6 (Eu3+) and 5D4 (Tb3+) - 5D1 (Eu3+) under Tb3+ excitation (377 nm corresponding to the 7F6 - 5D3 absorption band of Tb3+). In this case, the temperature-dependent parameter is the luminescence intensity ratio between Tb3+: 5D47F5 transition (I542) and the Eu3+: 5D07F4 one (I690) [11]. The Sa was equal to 0.0013 in the 300 - 550 K temperature range. The efficiency of interaction between two levels rises with the temperature increase due to phonon-assisted nature of this interaction. This fact explains the temperature sensitivity of the above-mentioned system. In its turn, down-conversion optical temperature sensors based on Nd3+/Yb3+ [12,13], Pr3+/Yb3+, Er3+/Yb3+ [14] ion pair (where the first ion serves as a donor of energy) are also based on the same mechanism. In our previous work, we suggested, that for Nd3+/Yb3+:YF3 nanoparticles the thermal expansion and, as a consequence, the decrease of distance between interacting ions also contribute in the temperature sensitivity of the spectral-kinetic characteristics [8,13]. After literature analysis, we concluded, that the Eu3+/Nd3+ system in capable of demonstrating notable temperature sensitivity under Eu3+ excitation [15]. Here, the interacting energy levels are 5D3 (Eu3+) - 2P1/2 (Nd3+) and 5D0 (Eu3+) - 4G5/2 (Nd3+) under Eu3+ excitation (λexc = 394 nm corresponding to the 7F0 - 5L6 absorption band of Eu3+). However, this system is significantly less studied compared to other ion pairs based on Eu3+ and Nd3+. The objective of this work was to make conclusion about the possible application of Eu3+:YF3 and Eu3+, Nd3+:YF3 nanoparticles in optical temperature sensing analyzing such characteristics as Sa and Sr. The tasks were:
  • synthesis and physicochemical characterization of the samples (size, morphology, and the phase composition)
  • spectral-kinetic characterization to choose optimal Eu3+ and Nd3+ concentrations
  • spectral-kinetic characterization in order to understand the influence of the annealing procedure on spectral-kinetic characteristics
  • The calculation of Sa and Sr.

2. Materials and Methods

The nanoparticles were synthesized via the co-precipitation method in distilled water with subsequent hydrothermal treatment [4,16]. The detailed synthesis procedure is described in our previous work devoted to rare-earth-doped YF3 nanoparticles [8]. According to the work [17], the annealing of the obtained YF3 nanoparticles at 400 °C in air does not lead to the formation of impurity phases hence we choice the annealing at 400 °C in air for 3 hours. The excitation of the nanoparticles was performed via LOTIS TII tunable laser LT-2211A (λex (Eu3+) = 394 nm, (pulse duration and repetition were 10 ns and 10 Hz, respectively) (Belarus, Minsk). The spectra were recorded via StellarNet (CCD) spectrometer (Tampa, FL, USA). The kinetic characterizetion was carried out via monochromator connected with photomultiplier tube FEU-62 and digital oscilloscope Rhode&Schwartz with 1 GHz bandwidth (Munich, Germany). The phase composition of the samples was studied by means of X-ray diffraction (XRD) via Bruker D8 diffractometer with Cu Kα-radiation (Billerica, MA, USA). The XRD simulation was carried out using VESTA software [18]. The experiments were performed in the 10 - 320 K temperature range via so-called “cold finger” method. The temperature control was carried out via thermostatic cooler “CRYO industries” having LakeShore Model 325 (Westerville, OH, USA) temperature controller. The IR reflection measurements were carried out using a BrukerVertex80v Fourier spectrometerat near-normal (Θ≈15°) and oblique (Θ≈75°) light incidence on the sample at room temperature. The morphology of the samples was studied using Hitachi HT7700 Exalens transmission electron microscope (TEM)) with 100 kV accelerating voltage (TEM mode) (Tokyo, Japan). The average diameter of the nanoparticles was calculated from the 2D TEM images. Statistics were based on the analysis of 100 nanoparticles. To get the average diameter (D) of the nanoparticles, the area (in squire nanometers) of each nanoparticle from TEM image was equated to the area of a circle (π⋅D2/4), where π = 3.14, and D is the diameter. The obtained histogram was approximated via Lognornal function where ±1 standard deviation was determined.
There are three molar concentration values of Eu3+: 2.5, 5.0, and 7.5 %. The choice of these concentrations was based on the decision of obtaining the brightest Eu3+ luminescence. Indeed, at 1.0 mol.% the luminescence signal demonstrated low brightness, which is expected to be even lower after Nd3+ addition. In turn, the samples contained the above-mentioned concentrations demonstrated an opposite tendency. For the higher Eu3+ concentrations, the concentration quenching leads to the decrease of the Eu3+ luminescence.
We synthesized 14 samples. The list of them is presented in Table S1 of supplementary file. Briefly, there were three samples, (Eu3+: 2.5, 5.0, and 7.5 %):YF3. Then, each sample was divided into two equal parts. One part was annealed and the second was not. Based on the obtained spectral-kinetic data, we selected four samples (Eu3+: 2.5 and 5.0%):YF3 (annealed and not annealed). For these samples, we took several combinations of Eu3+/Nd3+ and selected the most convenient for further study.

3. Results and Discussion

3.1. Physicochemical Characterization of the Nanoparticles

The phase composition of the YF3 doped particles was confirmed via XRD. In particular, the normalized XRD patterns of YF3: Eu3+ (2.5 mol.%) nanoparticles before and after annealing (400 °C, 4 hours) and the YF3 simulation are presented in Figure 1.
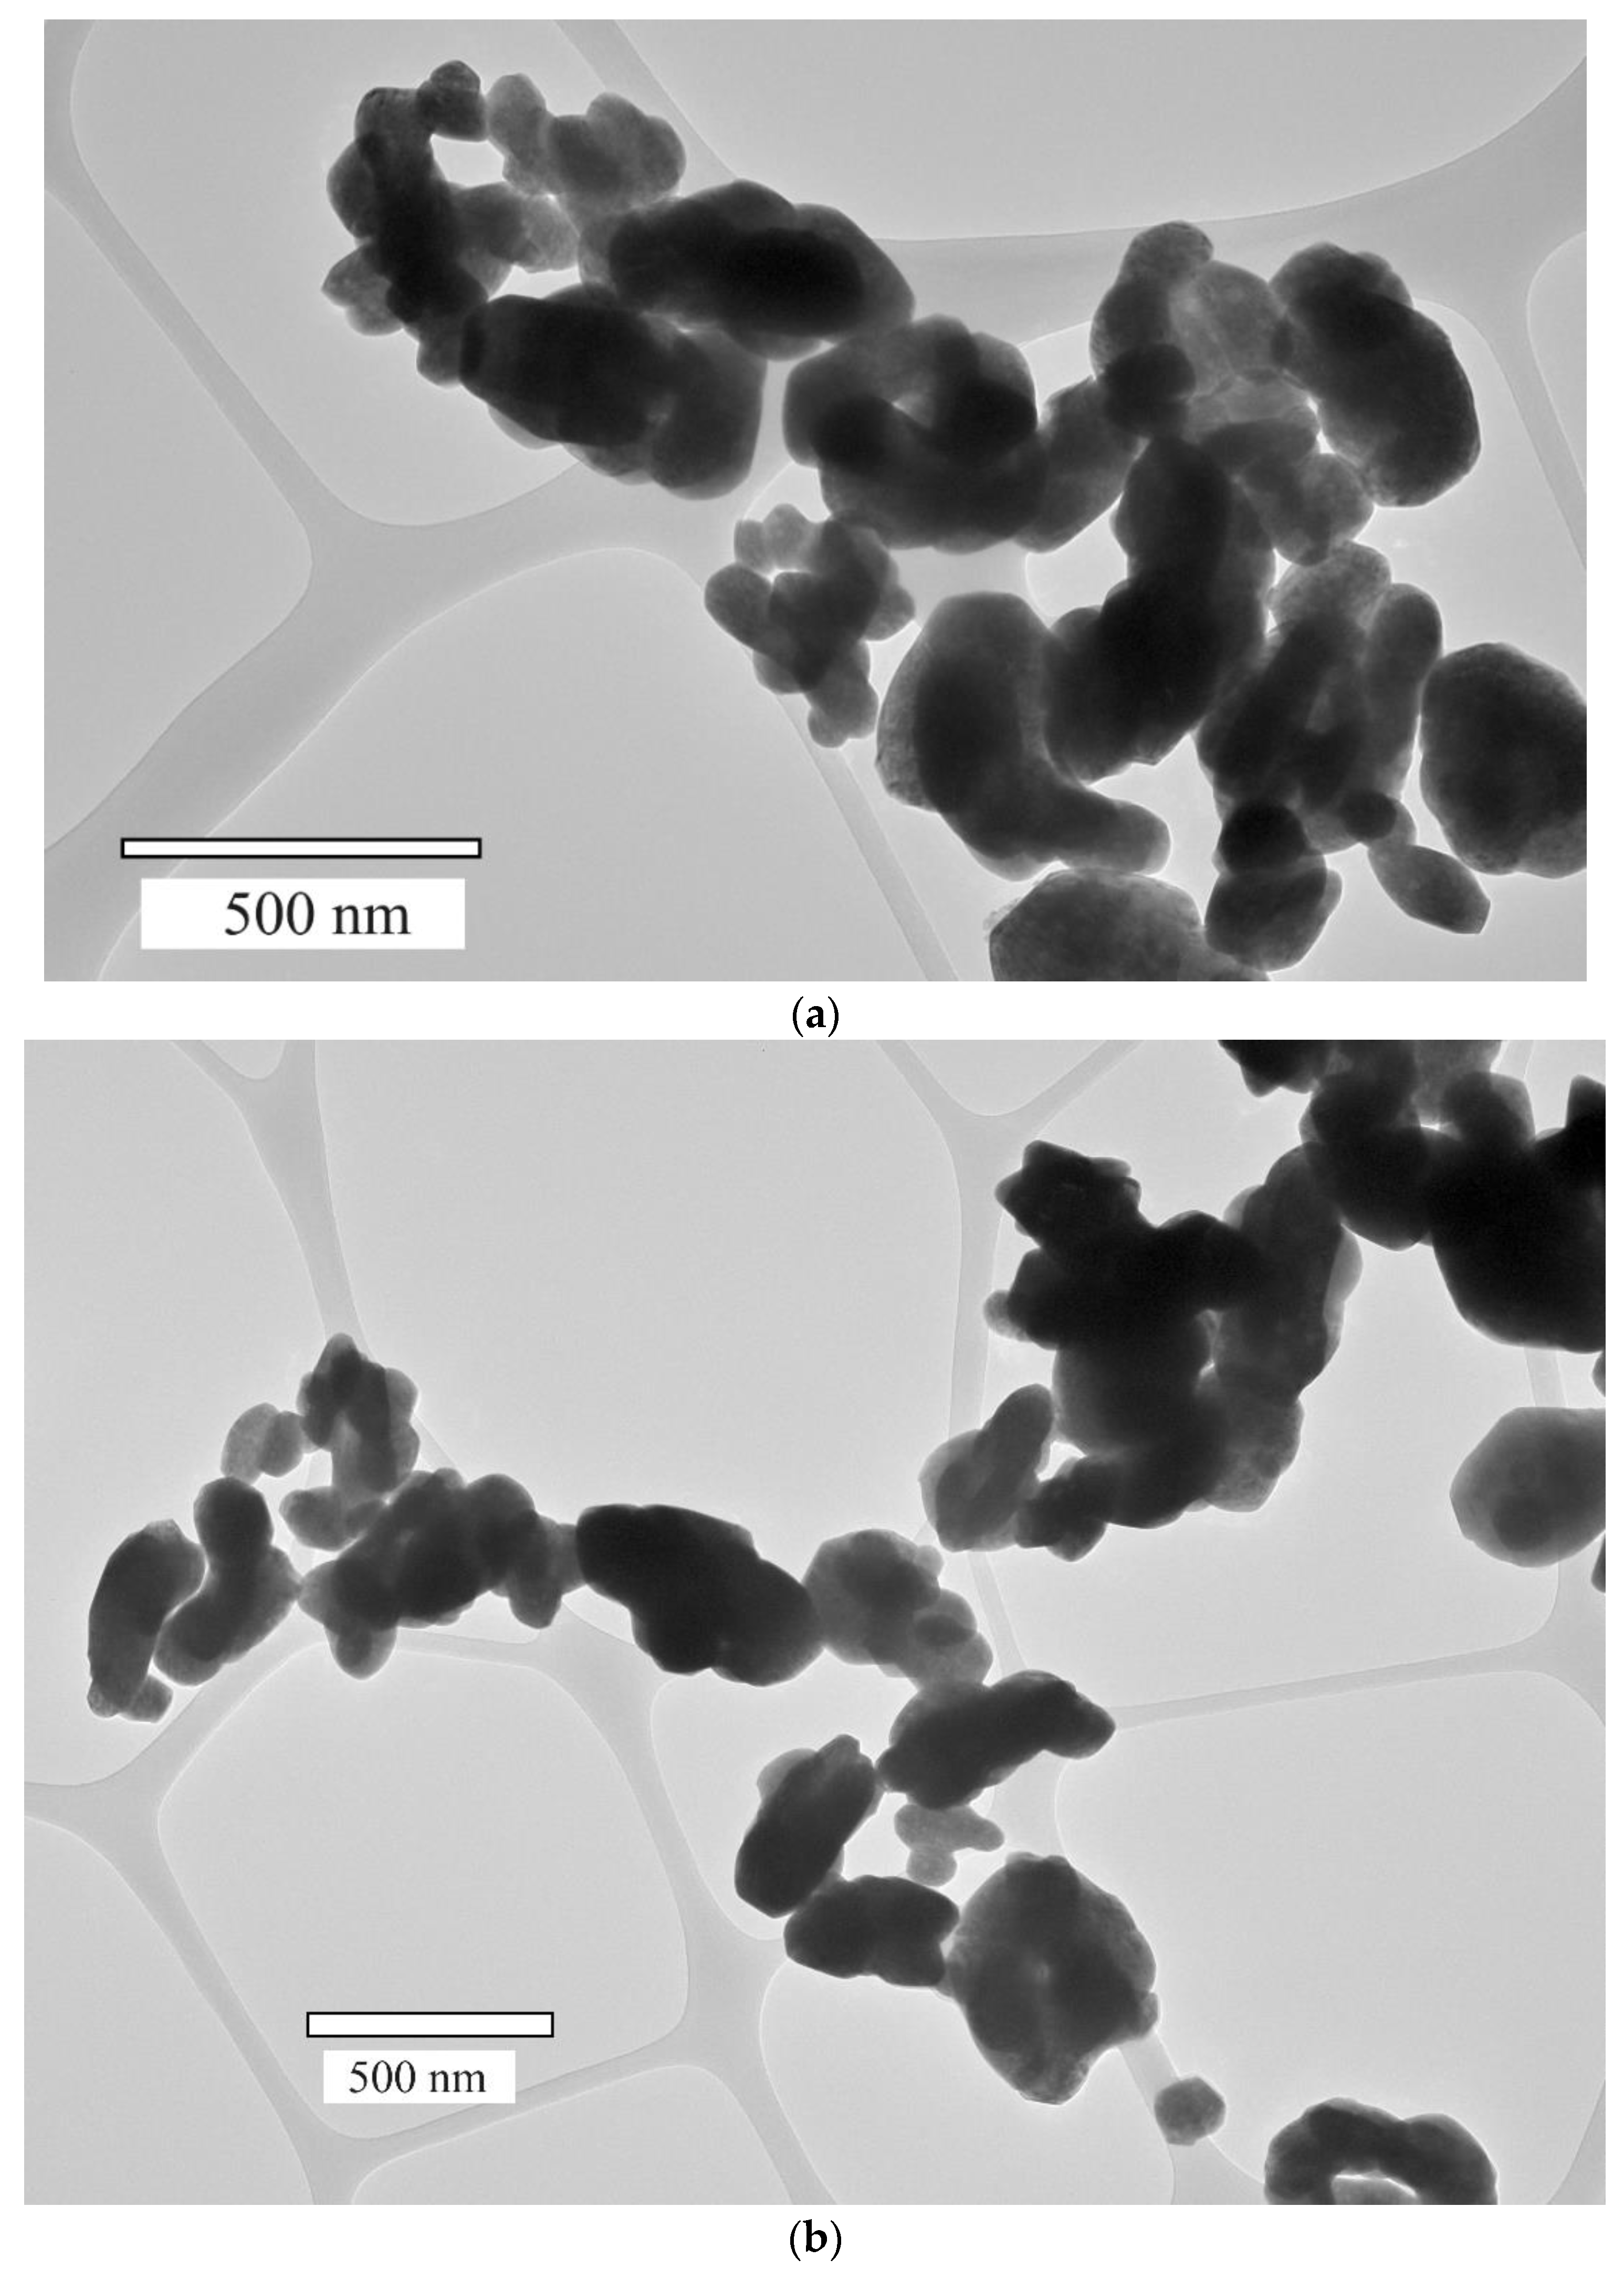
The XRD patterns of both samples located on the one plot are presented in Figure S1 of supplementary file. The X-ray diffraction patterns are consistent with the simulation and the literature data and correspond to the orthorhombic structure of YF3 [17,19] and to the number 074-0911 of the Inorganic Crystal Diffractions Database (ICDD) of orthorombic YF3 (Pnma space group). The well-defined YF3 peaks, the absence of impurity, and amorphous phases are clearly seen. It can be seen from Figure 1, that the sample after annealing has narrower diffraction peaks. The XRD peak narrowing can be related to many factors including the change in the size and the removal of the defects. To investigate the contribution of the size to XRD peak narrowing, we performed the TEM imaging of the samples. Transmission electron microscopy (TEM) images of the YF3: Eu3+ (2.5 mol.%) nanoparticles before (a) and after (b) annealing in air (400 °C, 4 hours) are presented in Figure 2a,b, respectively.
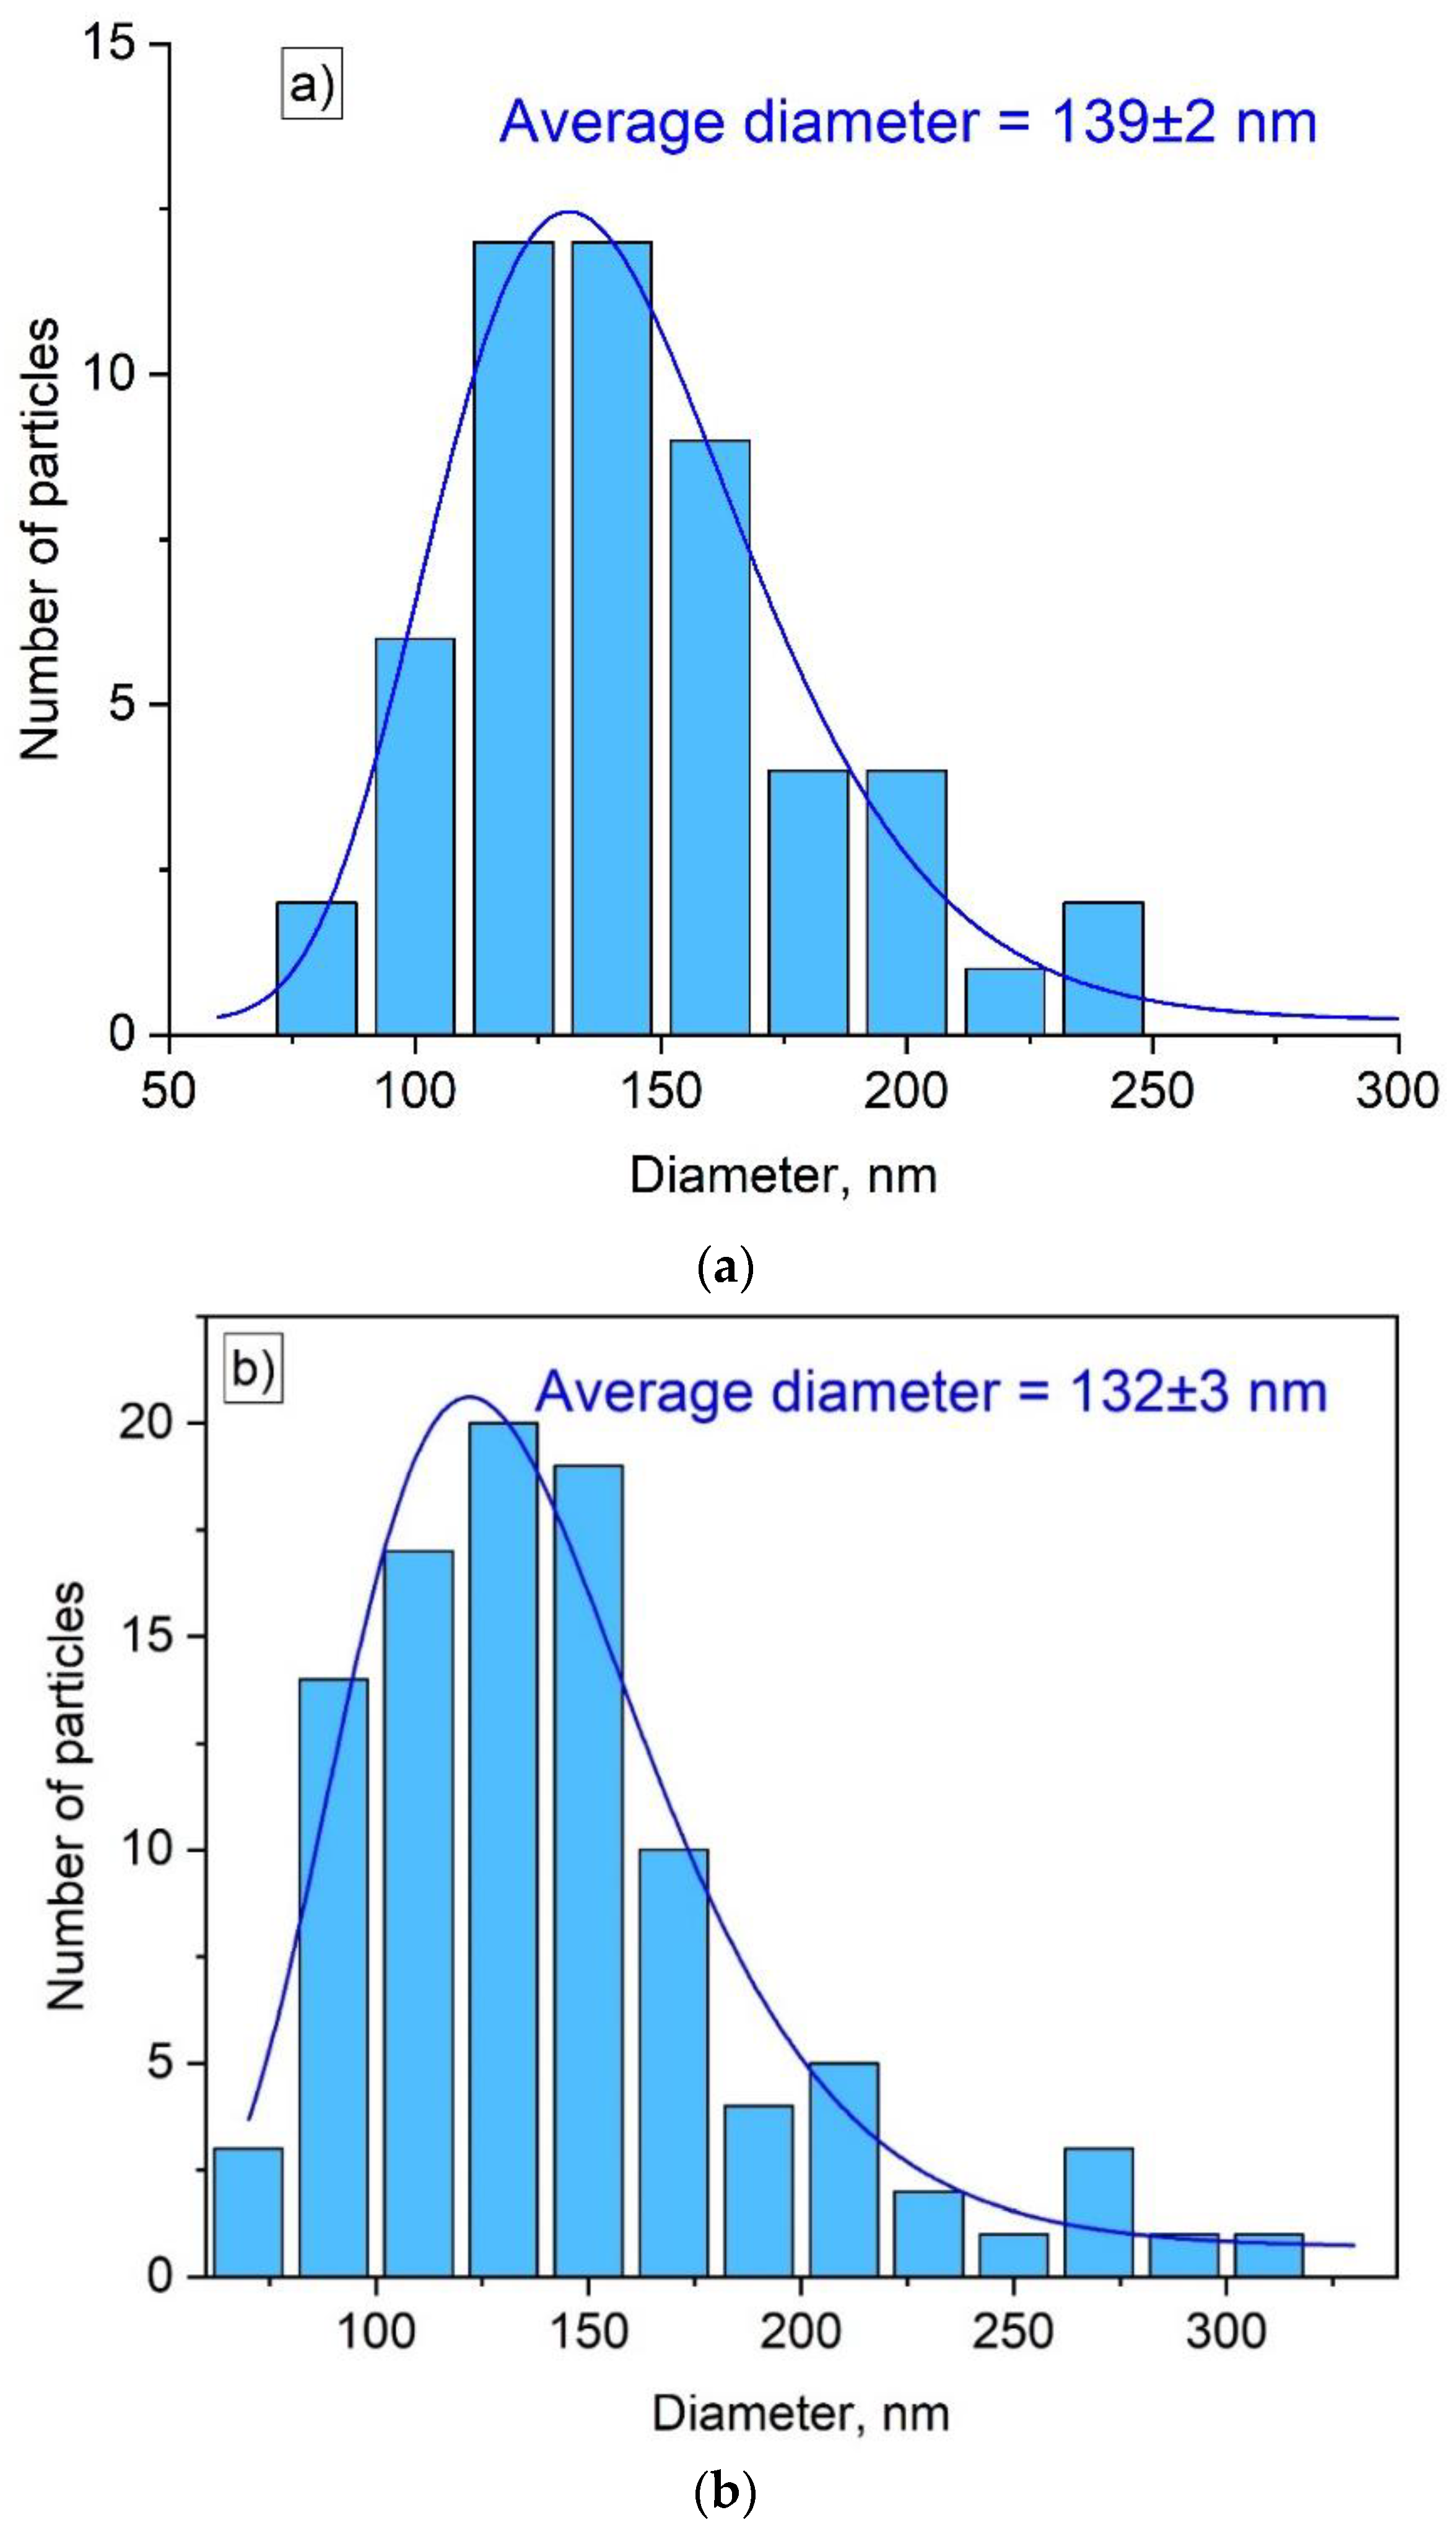
It can be seen, that the annealing procedure does not affect the morphology of the nanoparticles. Specifically, both types of nanoparticles has primary oval shape. The size distribution histograms of YF3: Eu3+ (1 mol.%) nanoparticles before and after annealing are represented in Figure 3a,b, respectively.
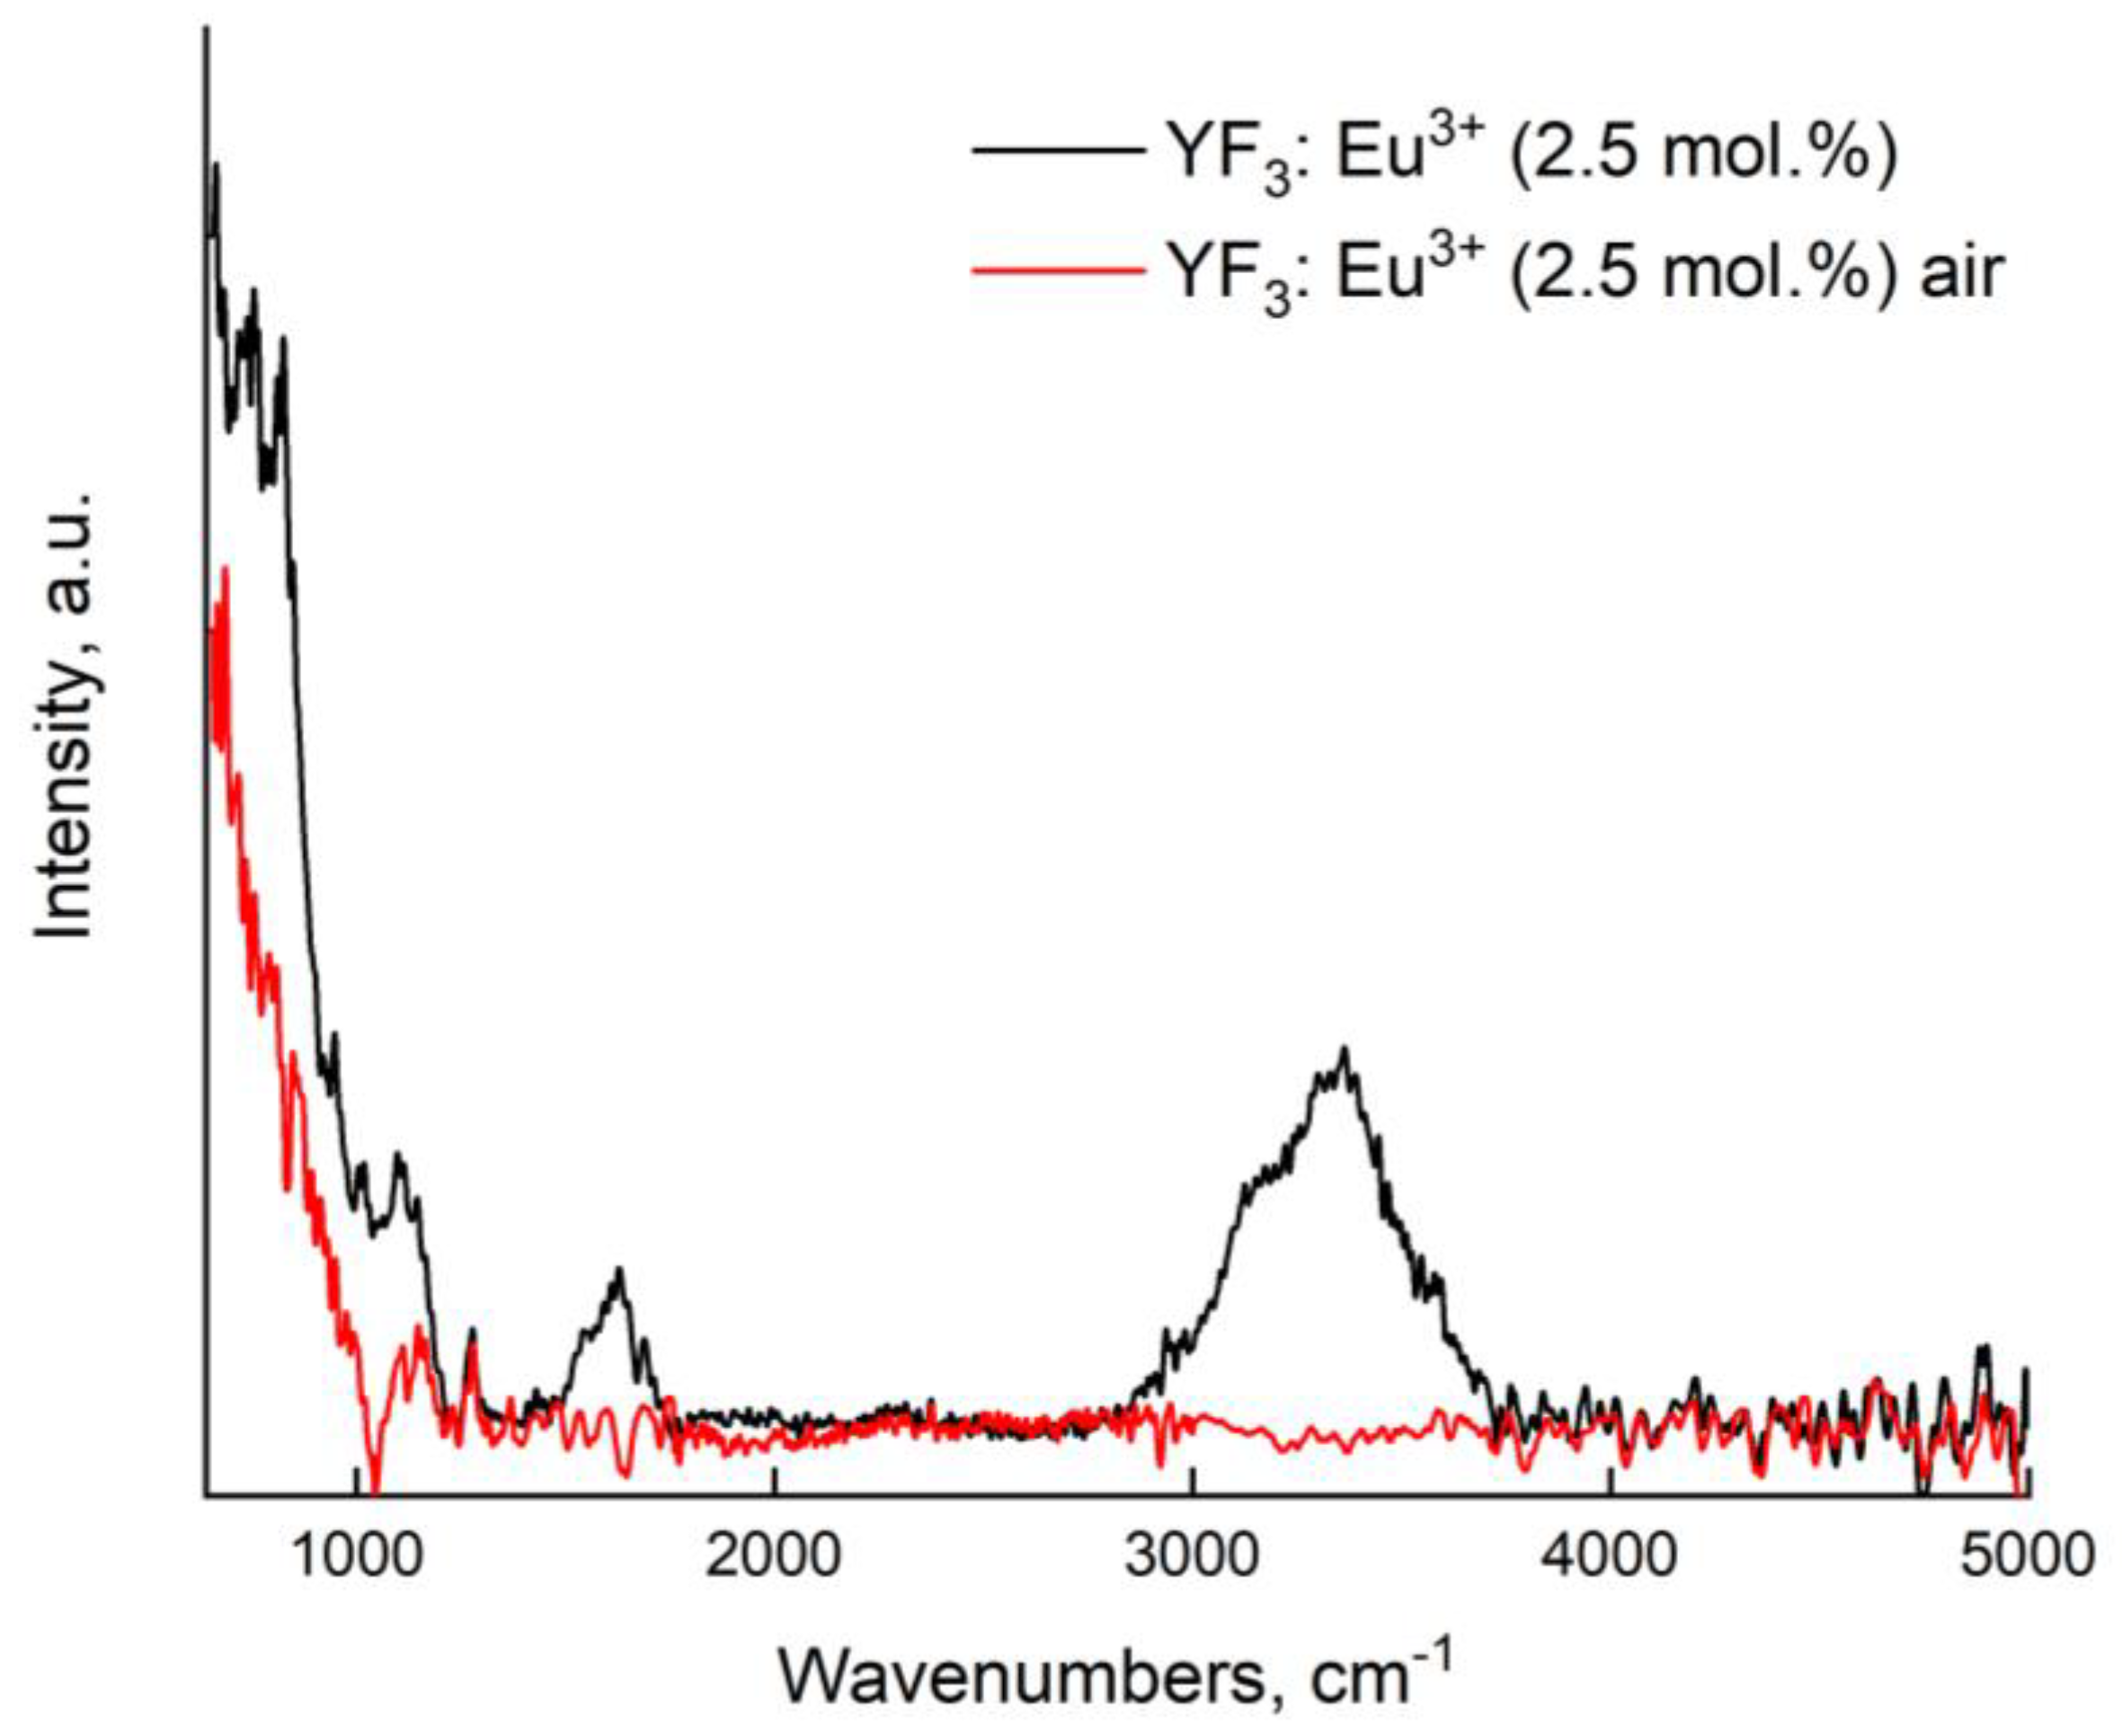
The size distribution histogram is not perfectly fitted by any peak function, probably, due to the non-spherical shape of the particles. However, the LogNormal approximation gives an estimation of the average size. The LogNormal fitting determined 139 ± 2 and 132 ± 3 nm average diameters before and after annealing, respectively. Anyway, the size of the particle is almost not changed. In addition, the diameter is larger than 15 nm, hence, the influence of the surface can be neglected [20]. Indeed, according to this work, the main unique difference between nanosized crystals and bulk ones is that the number of ions located on the surface of the nanoparticles and the number of ions located in the nanoparticle volume are comparable. The rare-earth ions located on the nanoparticle’s surface have different ligand surroundings compared to rare-earth ions inside the volume. The different surroundings lead to the different spectral-kinetic properties. However, according to the cited work, for rare-earth trifluorides, for nanoparticles larger than 15 nm, the surface ions do not make a serious contribution in the spectral-kinetic properties in opposite to volume ions and nanoparticles are more similar to bulk crystals in terms of spectral-kinetic properties. Since the size of the nanoparticles is almost not changed after the annealing, it can be suggested, that the XRD peak narrowing can be related to the removal of the defects (for instance water molecules captured during the synthesis procedure [16,21]) after annealing. To verify this assumption, infrared (IR) spectroscopy was performed (Figure 4).
The spectrum of the not annealed sample demonstrates a wide band in the 2800 - 3750 cm-1 range. This peak corresponds to the stretching frequencies of the O–H groups of water molecules. The wide peak located between 1417 and 1800 cm-1 is also explained by fluctuations in the bonds of organic groups arising from the fluorinating agent. It can be concluded, that the annealing procedure (400 °C, 4 hours in air) is effective for the removal of the molecules cantoning OH groups. Finally, it can be suggested, that the XRD peak narrowing can be related to the presence of such defects as captured water molecules. Indeed, the presence of additional impurities in the nanoparticle’s volume leads to the formation of microstrain (the fluctuations of the distances between the interatomic lattice spacing). Finally, it can be concluded, that the Eu3+:YF3 nanoparticles have a desirable orthorhombic phase composition. The annealing procedure (400 °C, 4 hours) almost does not affect the diameter of the nanoparticles (139 ± 2 and 132 ± 3 nm before and after annealing, respectively) leading to the water removal from the nanoparticles.

3.2. Temperature-Dependent Spectral-Kinetic Characterization of Single-Doped YF3: Eu3+

The energy level diagram of Eu3+/Nd3+ system is represented in Figure 5 (the Eu3+ - Nd3+ energy transfer will be discussed in the corresponding section). The optical excitation of Eu3+ is carried out at 394 nm (7F0 - 5L6 absorption band).
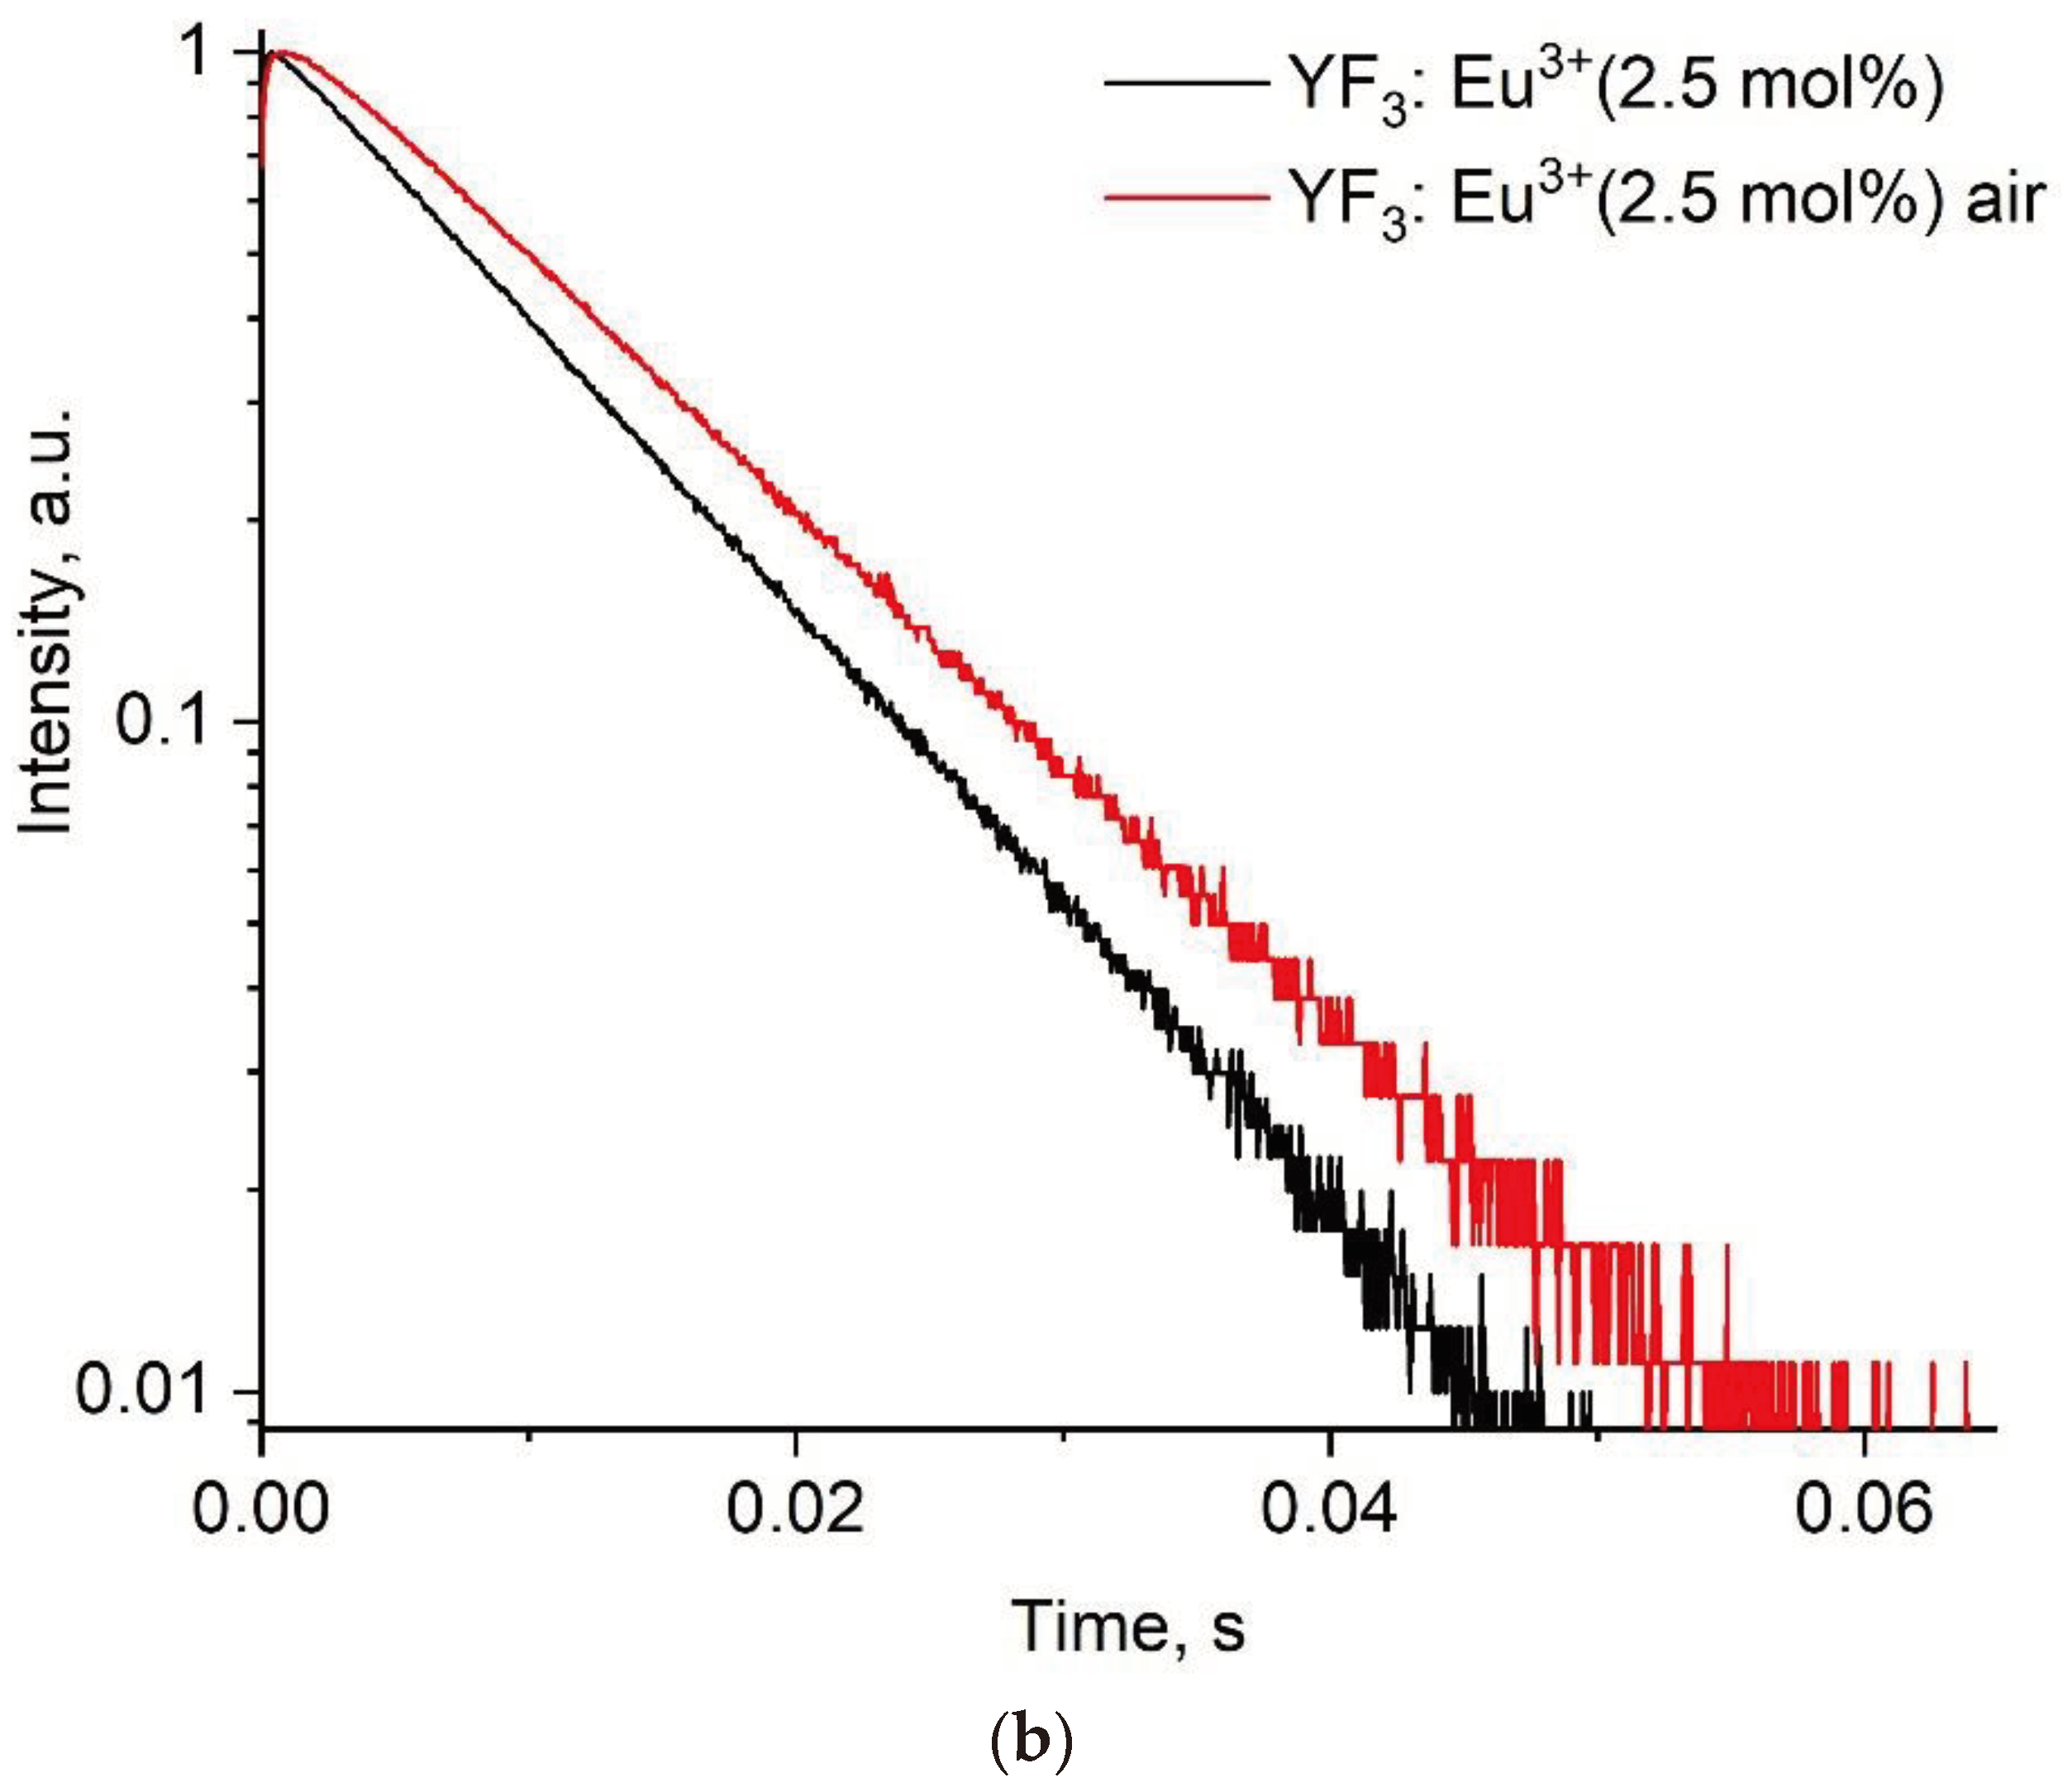
Further YF3: Eu3+ (2.5; 5.0 and 7.5 mol.%) samples were synthesized and the spectral and kinetic characteristics for YF3: Eu3+ (2.5 mol.%) annealed and after synthesis sample is shown in the Figure 6a,b, respectively.
It can be seen, that the shape of the spectra is independent of the annealing procedure. In turn, the luminescence decay curves have a one-exponential character. The luminescence decay rate decreases after annealing. We also associate this phenomenon with the partial elimination of such defects as water molecules, which were mentioned above. Thus, Eu3+ in the annealed samples has fewer channels of depopulating of excited states. The temperature evolution of the YF3: Eu3+ (2.5 mol.%) luminescence spectra is presented in Figure 7.
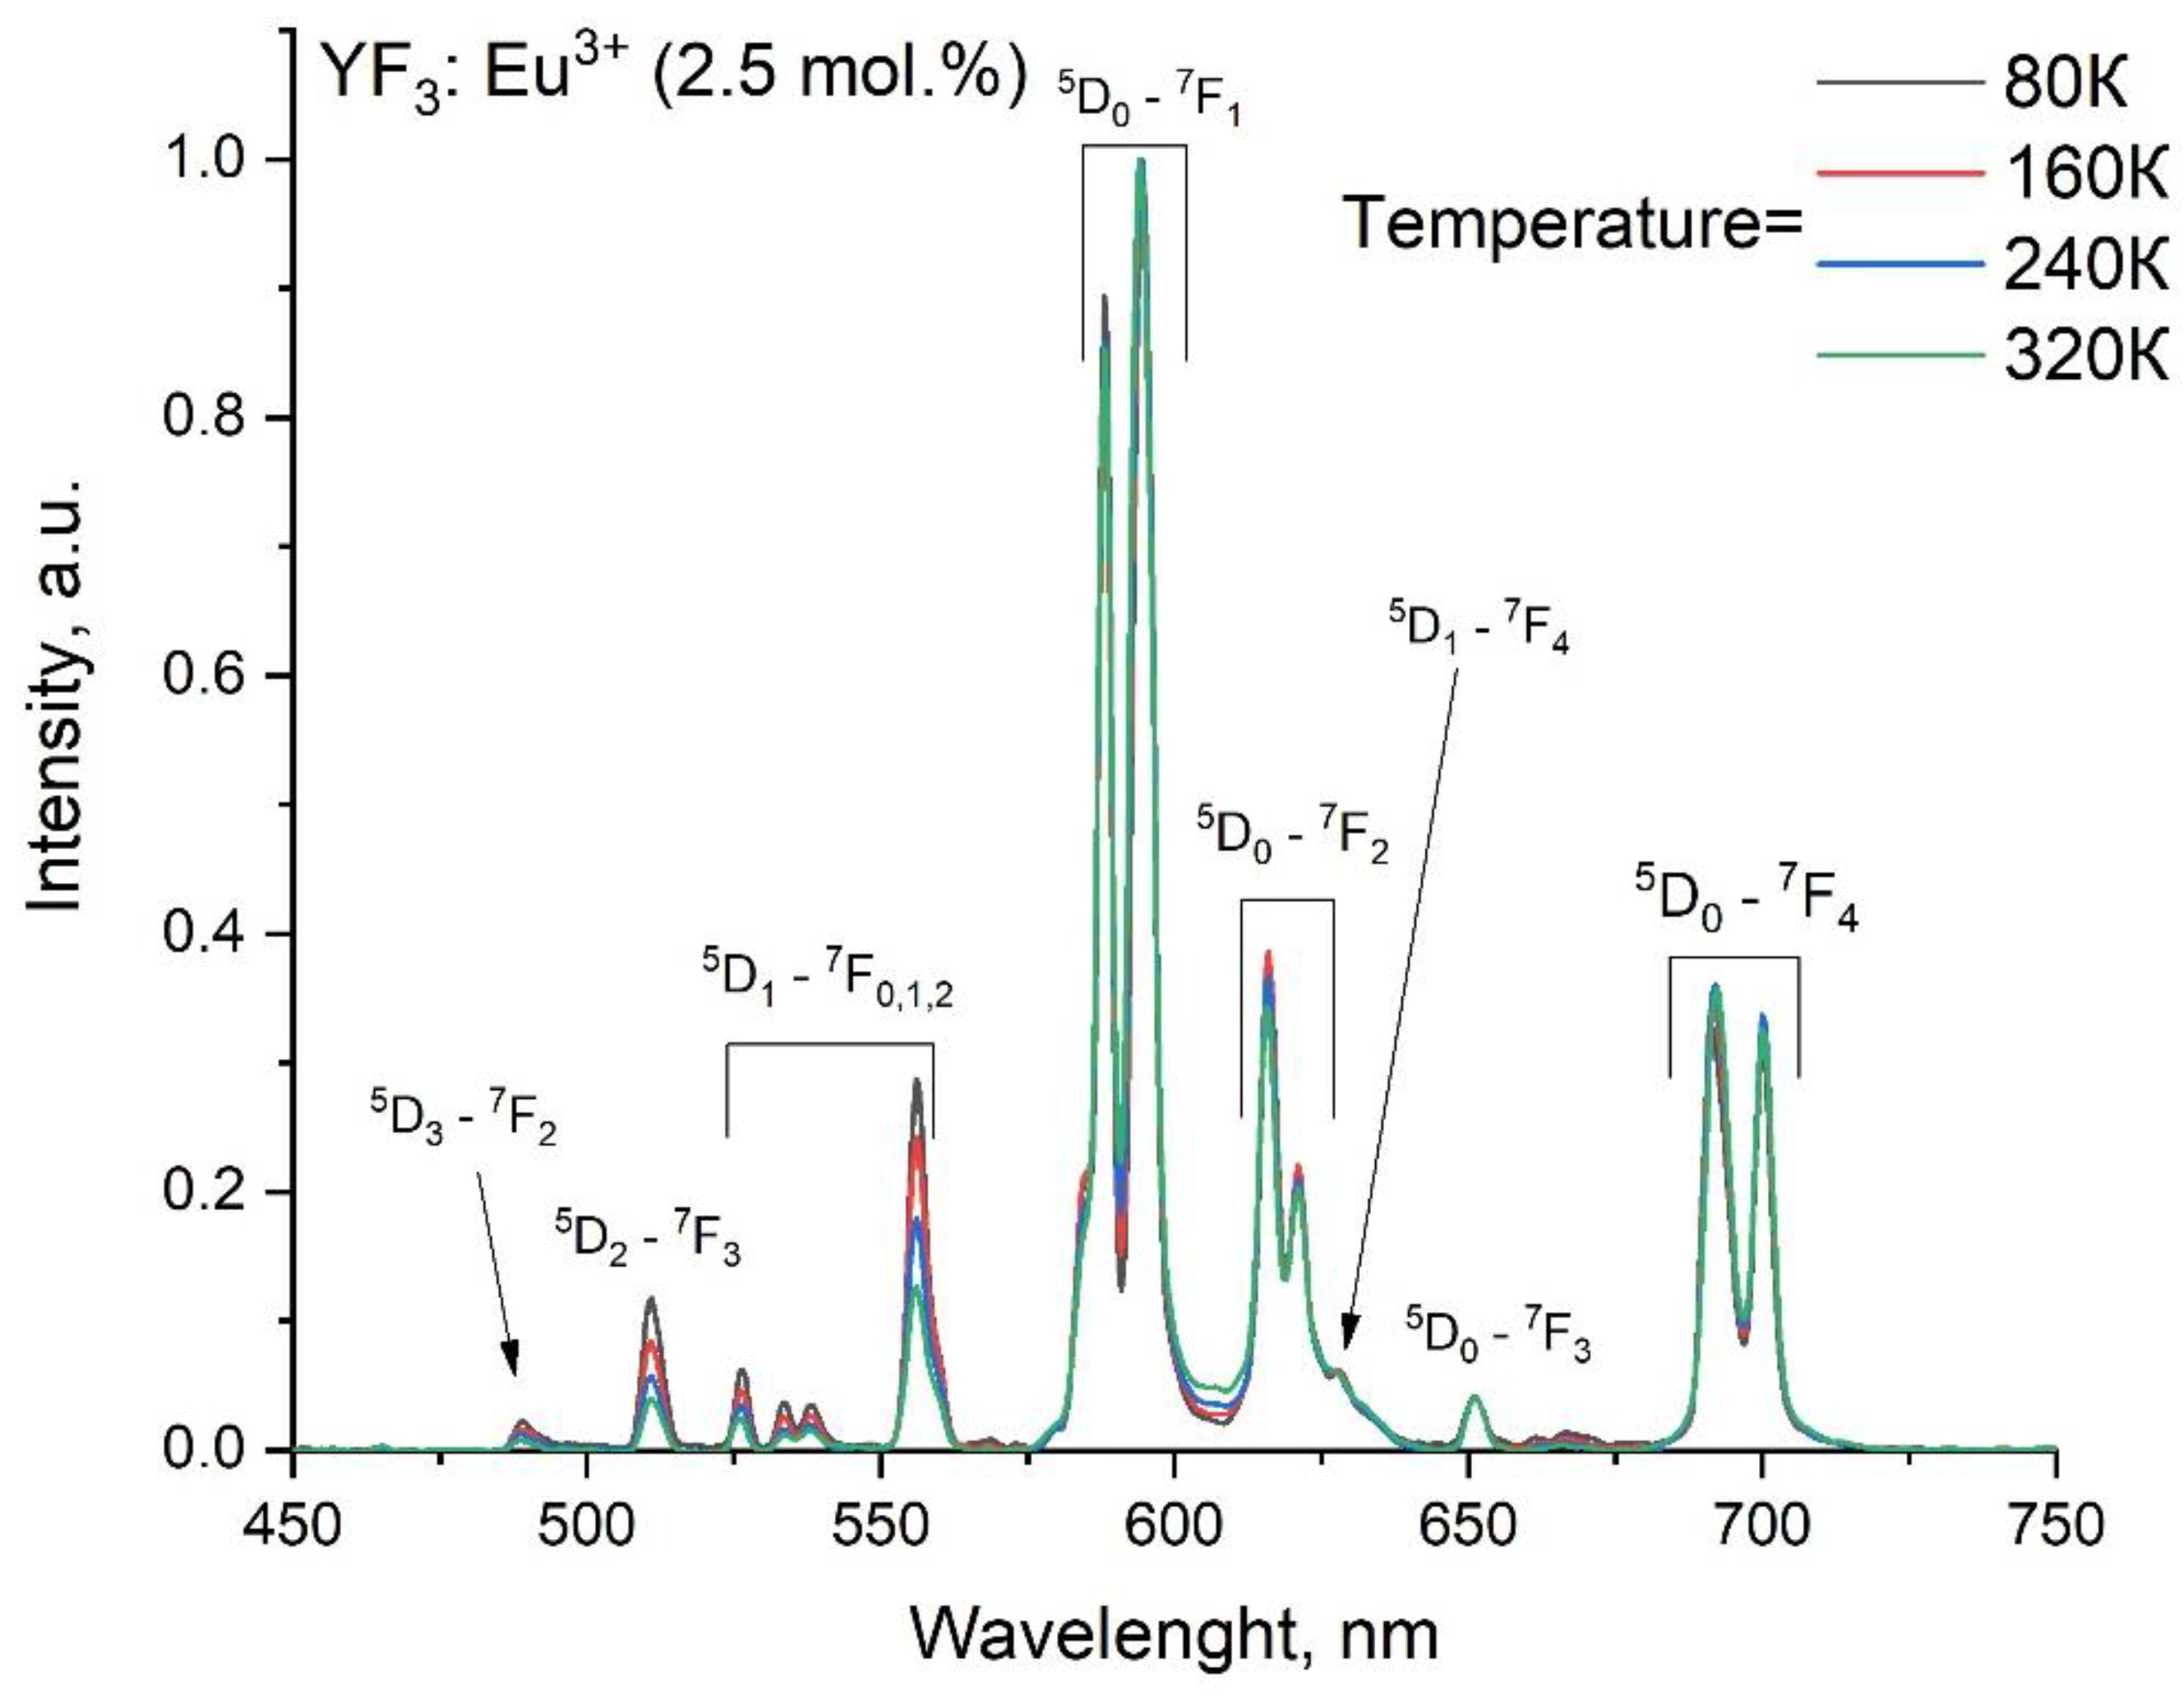
It can be seen, that the spectrum shape in the 570 - 750 nm range is independent of temperature. This phenomenon can be explained by the lack of thermally coupled electron levels in the Eu3+ energy level structure. However, in the ~ 400 - 570 nm range, there is a broadband luminescence whose intensity rises with the increase of temperature. This luminescence was observed earlier in YF3 matrix [12,17]. The broadband luminescence is associated with “rare-earth-fluoride vacancy” complex formation. This luminescence affects the intensity of Eu3+ peak at ~ 560 nm. For this reason, for kinetic characterization, we studied the luminescence peaks from 570 - 750 nm range. Figure 5 shows the luminescence decay time as function of temperature in the 80 - 320 K temperature range. The corresponding luminescence decay time curves are presented in Figure S2 of the supplementary file.
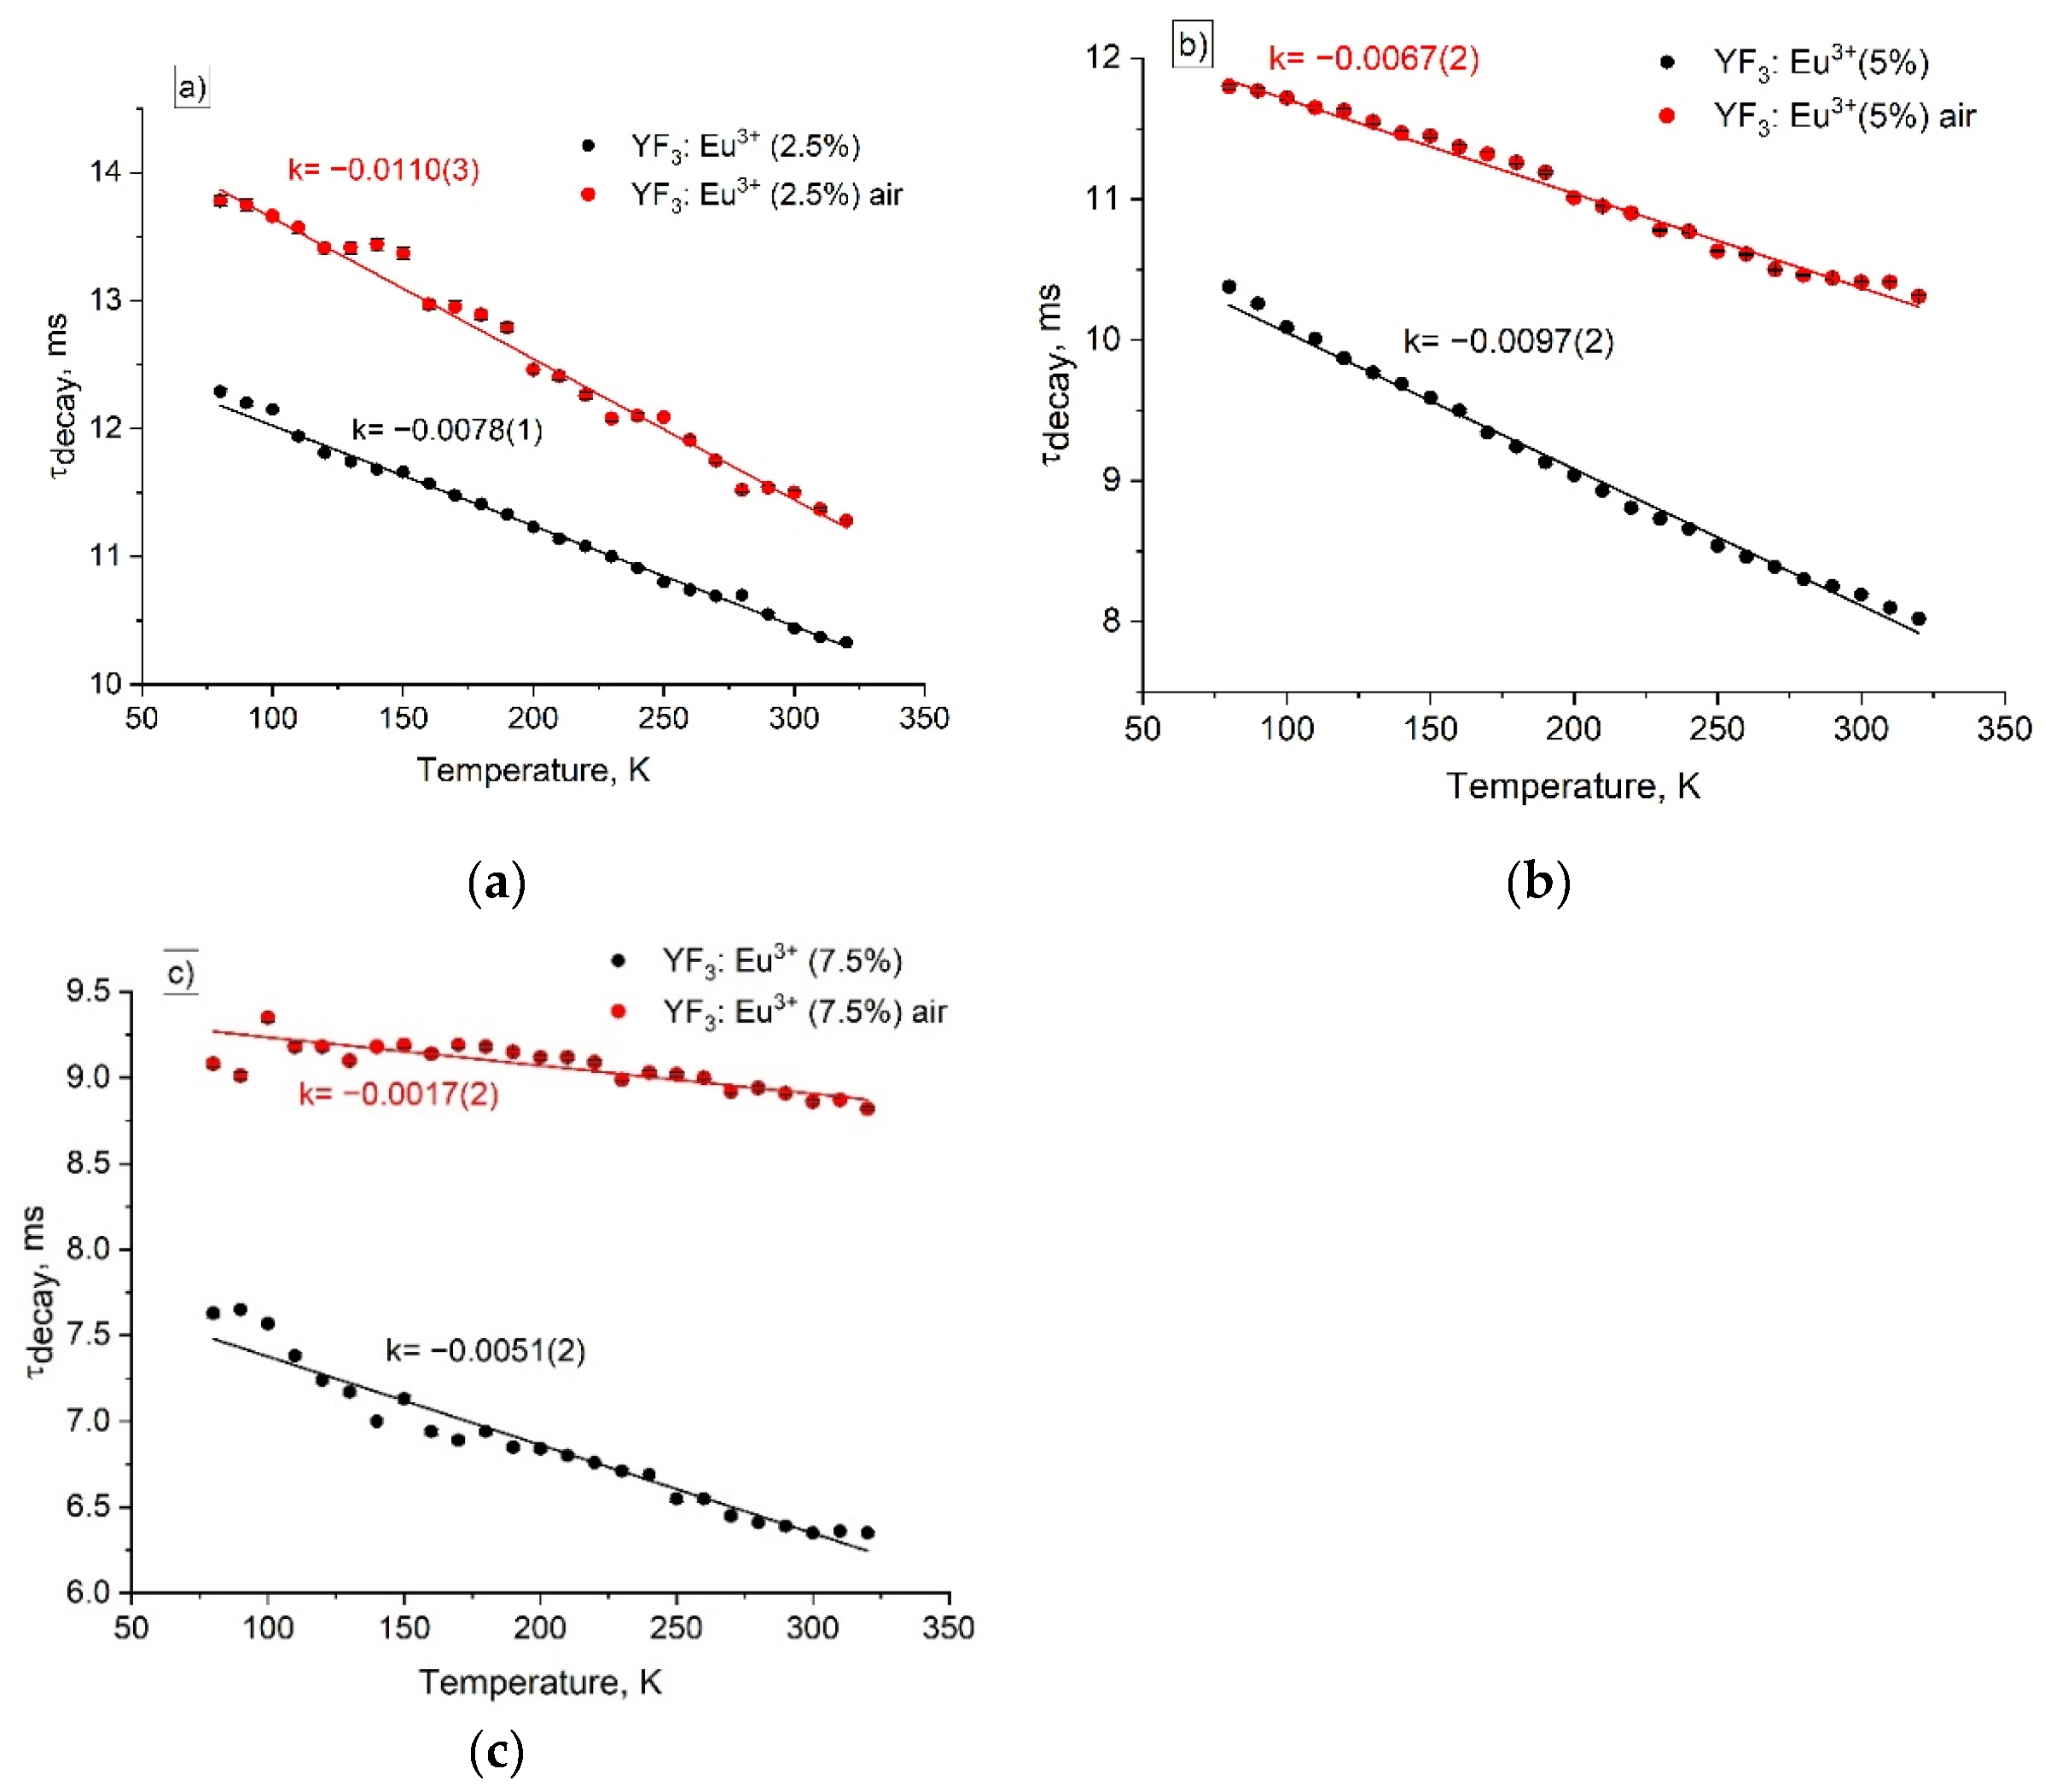
Figure 8 expresses the main tendency that the luminescence decay time linearly decreases with the increase in temperature. Usually, such a tendency is related to the increase in the probability of multiphonon relaxation with the increase of temperature. The same linear temperature dependence of luminescence decay time values for Pr3+ was observed in [22], which was also explained by multiphonon relaxation. However, the values of the slope for YF3: Eu3+ nanoparticles are slightly higher compared to the above-mentioned Pr3+-based phosphors. As it was discussed above, the annealed nanoparticles demonstrate higher values of decay time compared to the nanoparticles without annealing. The luminescence decay time values decrease with the increase of Eu3+ concentration, which can be explained by the concentration quenching. The slope values are presented in Table 1.
After annealing, the slope values decrease with the increase of Eu3+ concentration. Probably, the Eu3+ content influences on the amount of luminescence quenchers, hence, the contribution of temperature-dependent multiphonon relaxation in the temperature sensitivity of decay time decreases. For not annealed YF3: Eu3+ (5.0 and 7.5%) samples, the slope values are notably higher, which can be related to the increased amount of quenchers. Here, the contribution of temperature-dependent multiphonon relaxation on these quenchers in the temperature sensitivity of decay time is higher. Nevertheless, the difference in the slope values requires additional investigation.

3.3. Temperature-Dependent Spectral Characterization of Double-Doped YF3:(Eu3+, Nd3+)

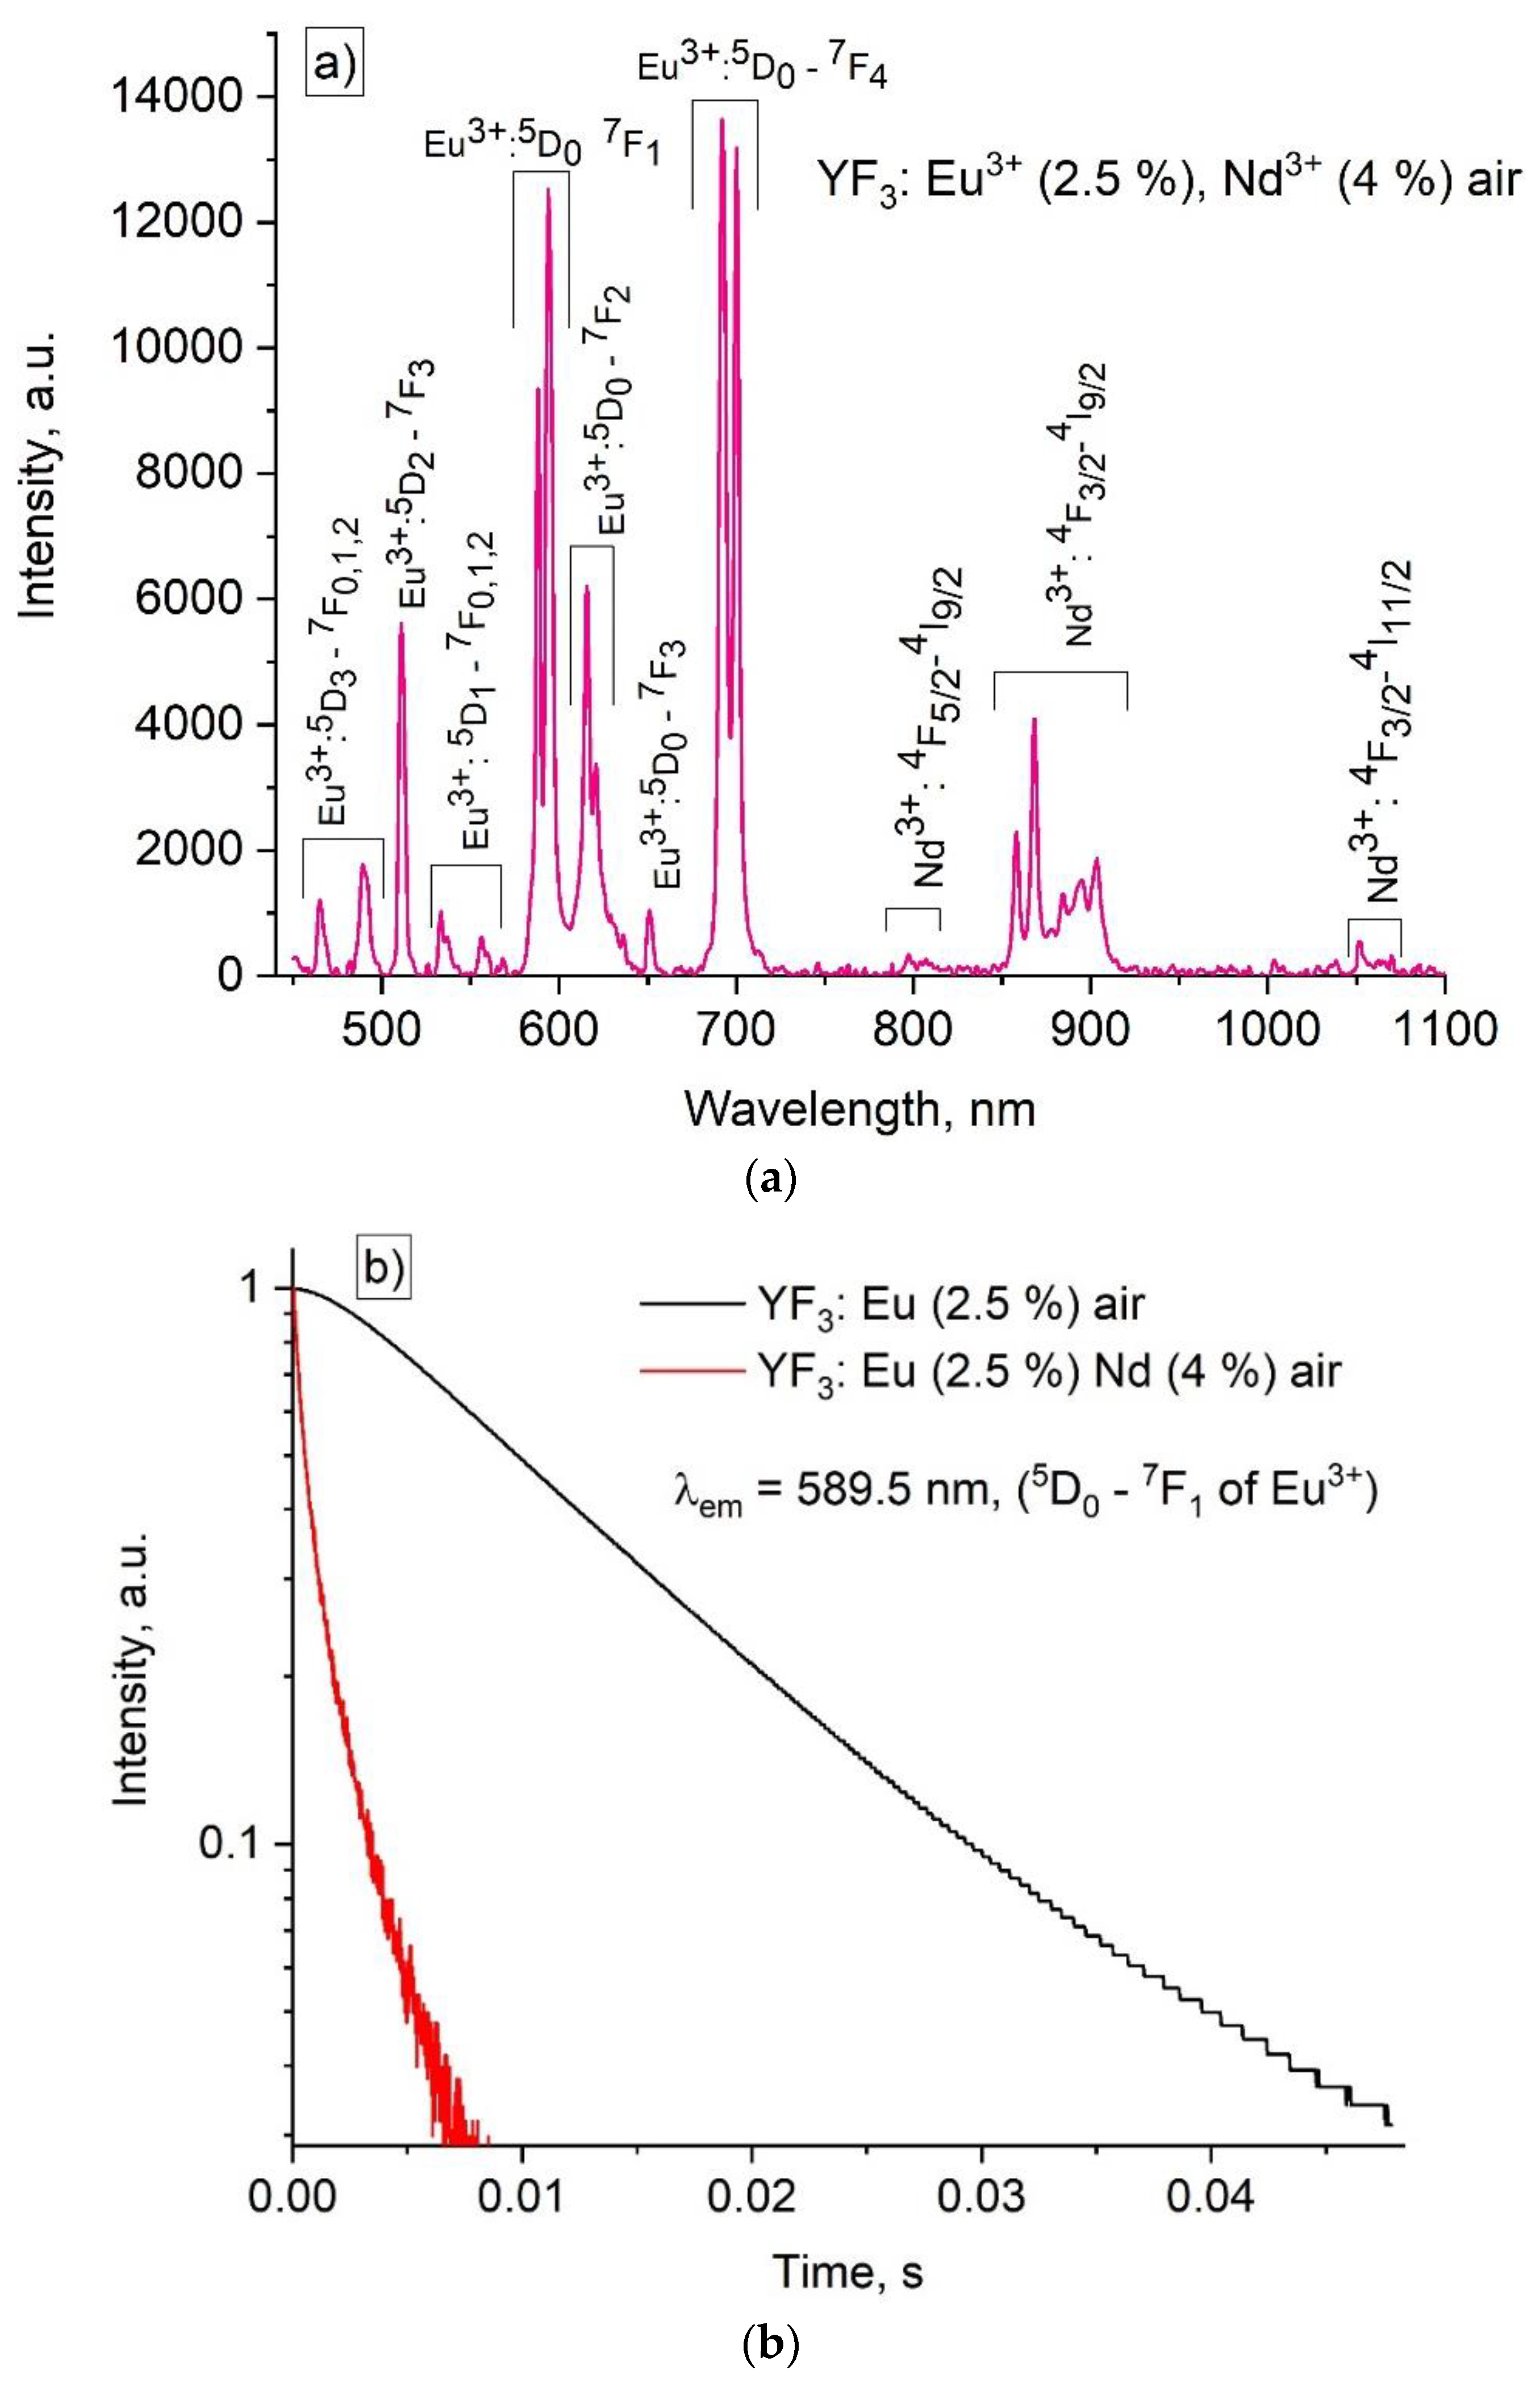
For the purposes of temperature sensing, the high temperature dependence of luminescent parameters is desirable. In this case, the YF3: Eu3+ (2.5 and 5.0 %): annealed nanoparticles the slope of the τdecay (T) function is the most pronounced (Table 1). We chose them for further doping with Nd3+ ions. Indeed, the addition of Nd3+ can lead to more pronounced temperature dependence of the YF3: Eu3+ spectral-kinetic characteristics. Specifically, it is suggested, that Nd3+ provides additional temperature-dependent channel of depopulation of 5D0 level of Eu3+. Hence, some luminescence parameters of double-doped YF3: (Eu3+, Nd3+) are expected to be more temperature-dependent. Since the electron level structure of both Eu3+ and Nd3+ ions is difficult, the Eu3+ → Nd3+ energy transfer process seems to be complex. However, according to the literature data, the energy transfer involves at least 5D3 (Eu3+) → 2P1/2 (Nd3+) and 5D0 (Eu3+) → 4G5/2 (Nd3+) energy transfer processes. We synthesized a set of samples which were also divided into two groups: before and after annealing. We did not observe the reliable signal of Nd3+ luminescence for all the not annealed samples. Probably, it is related to the fact, that some Nd3+ excited states are close to vibrational states of OH groups. Among the different combinations of Nd3+ and Eu3+ in YF3: Eu3+, Nd3+ samples, it was difficult to obtain several samples with intense luminescence signals of both Nd3+ and Eu3+ except for YF3: Eu3+ (2.5%), Nd3+ (4.0 %) sample. The spectra of YF3: Eu3+, Nd3+ samples having different combinations of the doping ions are presented in Figure S3. Specifically, the room temperature spectra of the YF3: (Eu3+ (2.5%), Nd3+ (4.0 %)) before and after annealing are presented in Figure S3a of the supplementary file). It can be seen, that the Nd3+ luminescence is significantly less intense compared to Eu3+ one for the not annealed samples. After the annealing, the intensity of Nd3+ emission is higher. In turn, the annealed YF3: (Eu3+ (2.5%), Nd3+ (2.0 %)) sample demonstrated low intense Nd3+ luminescence under Eu3+ excitation. To increase the Nd3+ luminescence we enlarged the Nd3+ concentration up to 4.0%. The room temperature spectra of the annealed YF3: (Eu3+ (2.5%), Nd3+ (4.0 %)), and luminescence decay curves of 5D0 - 7F1 transition of YF3: (Eu3+ (2.5%), Nd3+ (0 and 4.0 %)) are presented in Figure 9a,b, respectively.
It can be seen, that the YF3: (Eu3+ (2.5%), Nd3+ (4.0 %)) sample has relatively comparable emissions of both Eu3+ and Nd3+ ions. This sample was chosen for further temperature-dependent spectral-kinetic characterization. The rate of decay of the luminescence intensity significantly decreases with the addition of Nd3+ ion (4.0%) compared to the single-doped YF3: Eu3+ (2.5%) sample. This observation allows suggesting, that there is an energy transfer from 5D0 level (Eu3+) to 4G5/2 (Nd3+). In order to provide higher temperature sensitivity of LIR (luminescence intensity ratio) function, we should take luminescence peaks having opposite dependence on temperature. For example, there is 5D0 (Eu3+) → 4G5/2 (Nd3+) energy transfer which is phonon-assisted. Hence, the population of 4G5/2 of Nd3+ becomes more effective with the temperature increase via depopulation of 5D0 of Eu3+. It can be concluded, that the Eu3+ (5D0 - 7F1) intensity decreases with the temperature increase. In turn, the Nd3+ (4F3/2 - 4I9/2) demonstrated an opposite tendency. It should also be noted, that the decay curve of YF3: (Eu3+ (2.5%), Nd3+ (4.0 %)) sample is not single-exponential. It can be related to the fact, that the Eu3+ ions are surrounded by different numbers of Nd3+ ions. Hence, the rate of depopulation of Eu3+ surrounded with different numbers of Nd3+ ions is different and the luminescence decay curve becomes nonexponential. The integrated luminescence intensity ratio function (LIR) function can be determined as:
L I R = I E u I N d
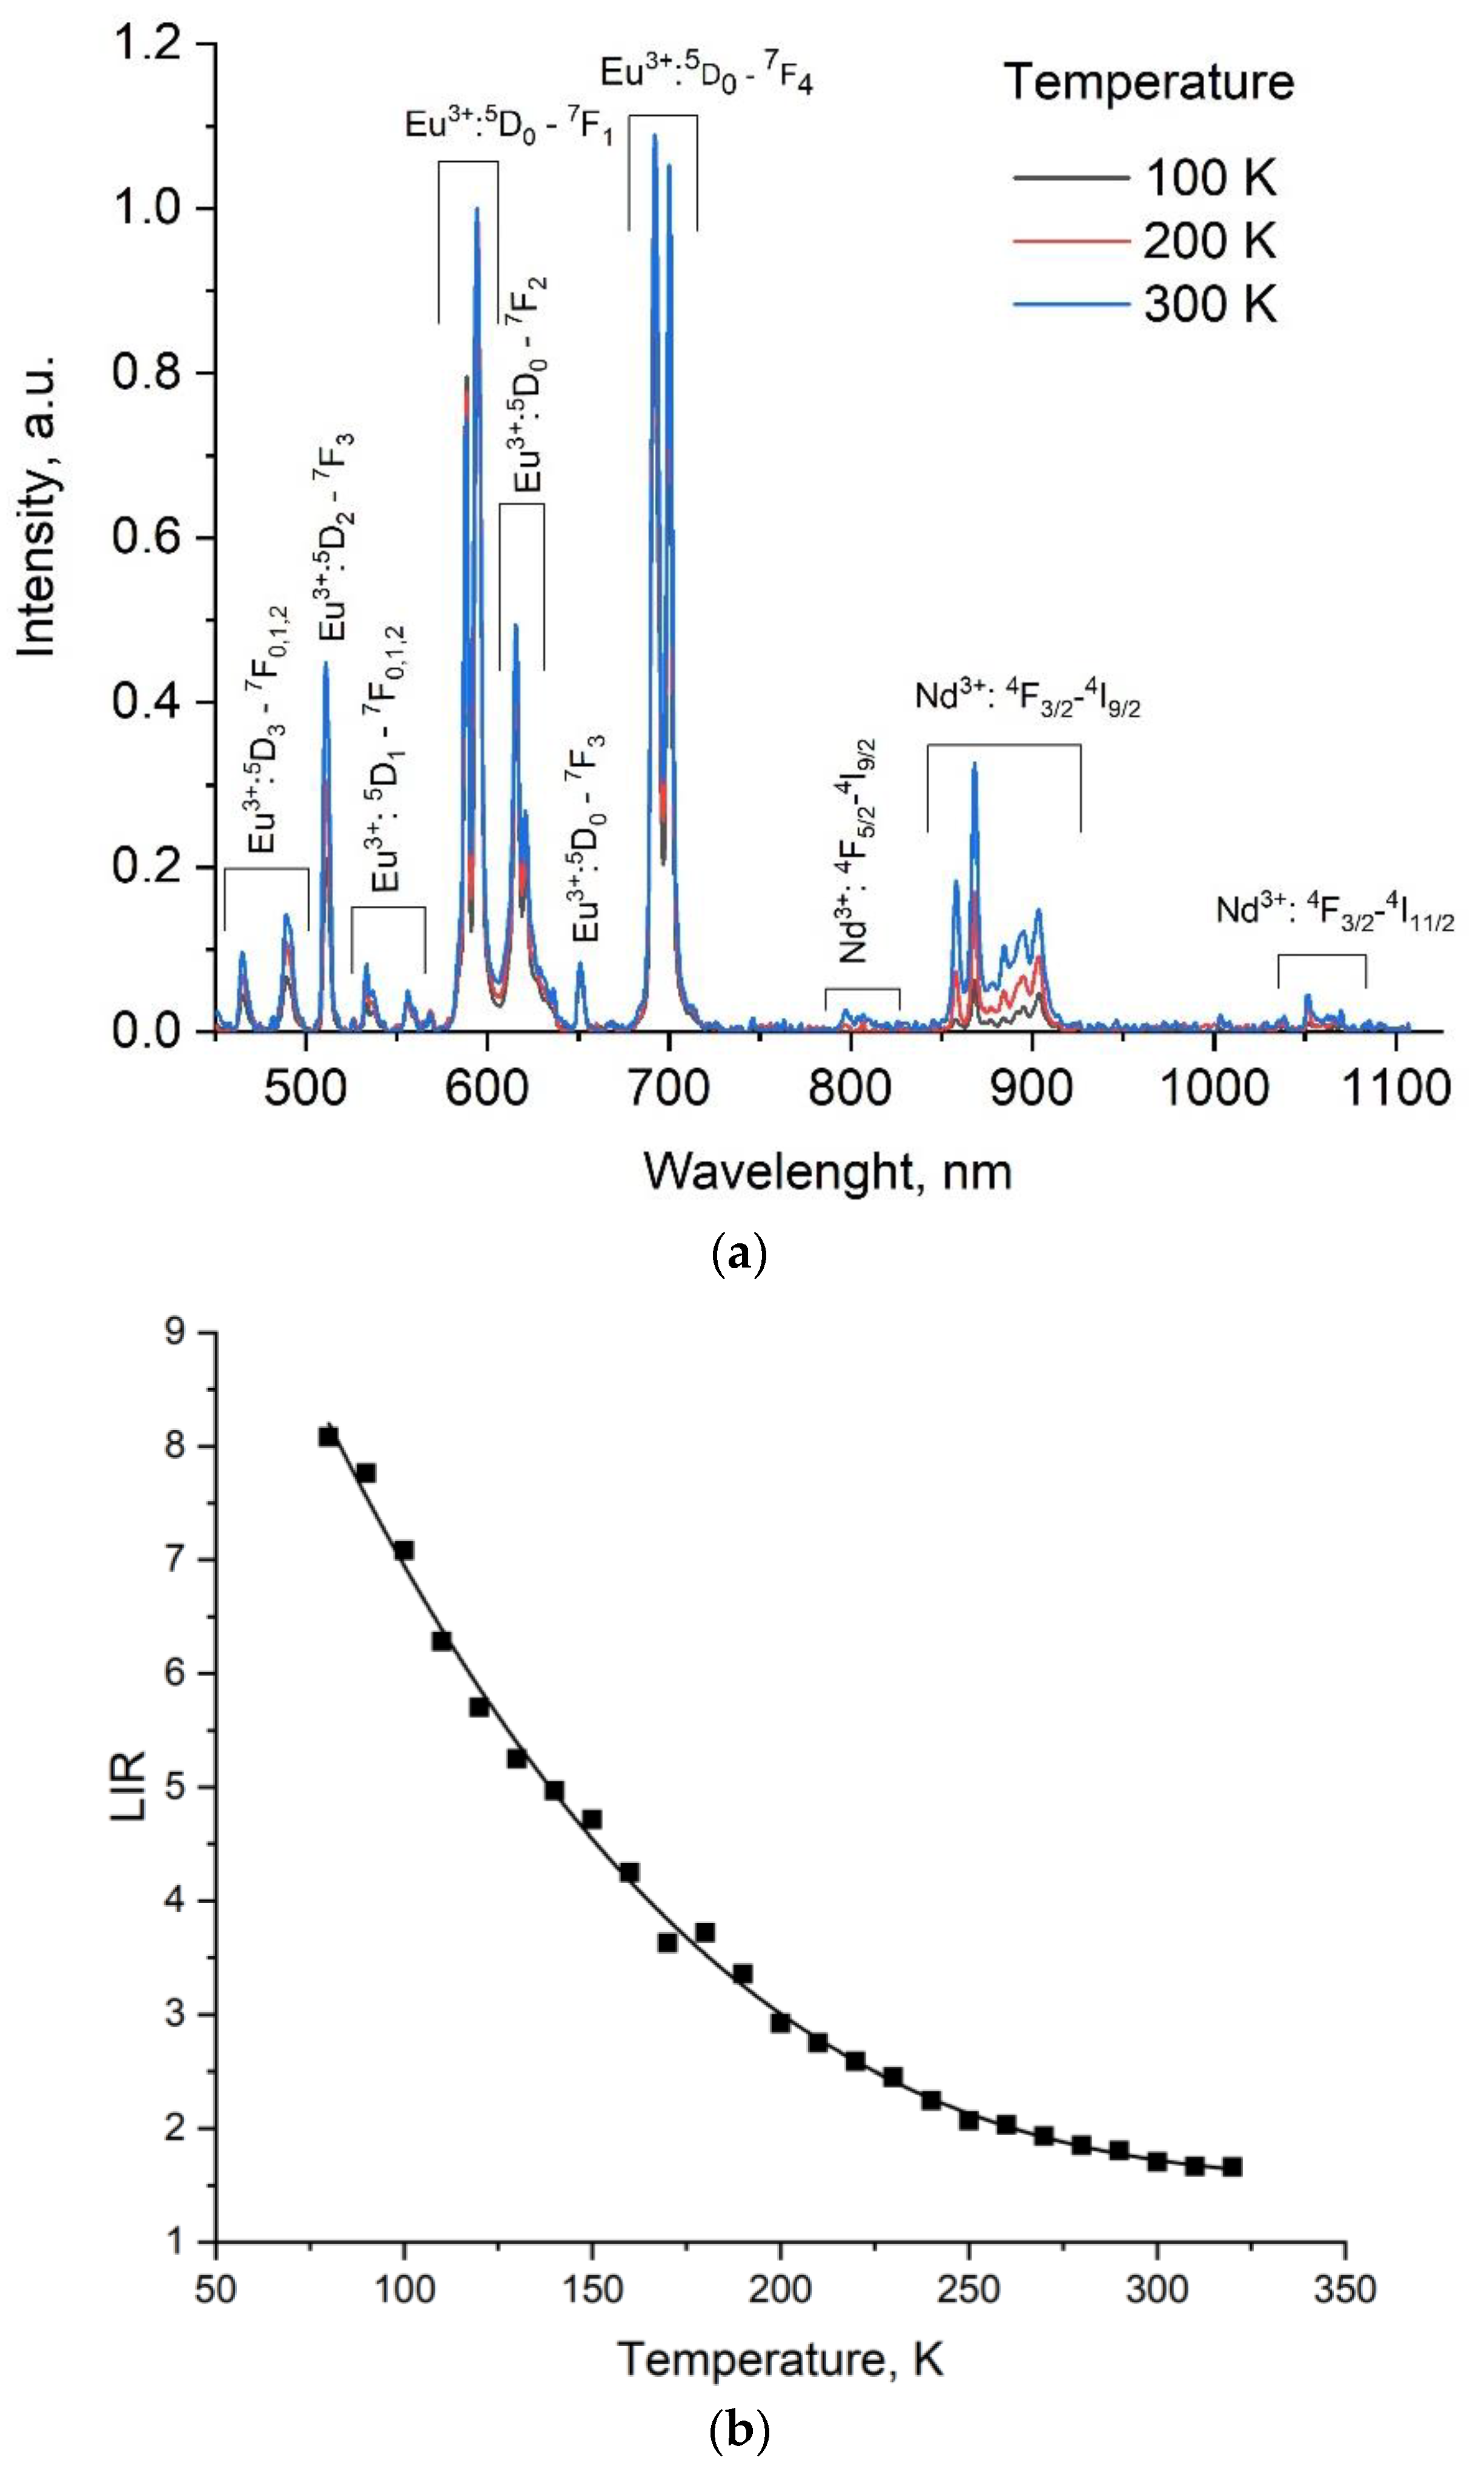
Additionally, the choice of LIR is illustrated in Figure S4 of the supplementary file. In particular, the integrated intensities for Eu3+ and Nd3+ ions were taken in the ~ 570 - 605 and 845 - 925 nm ranges, respectively. The spectra detected in 100 - 300 K range and LIR function are represented in Figure 10a,b, respectively.
It can be seen, that the LIR is a decay function which is due to the above-mentioned opposite temperature dependence of both Eu3+ (5D0 - 7F1) and Nd3+ (4F3/2 - 4I9/2) emissions. Since the Eu3+ - Nd3+ energy transfer is not resonant, it involves the crystal lattice phonons.
The absolute (Sa) and relative (Sr) temperature sensitivities can be extracted from LIR function using the equations:
S a = d ( L I R ) d T
S r = 1 L I R d ( L I R ) d T 100 %
The Sa and Sr functions are presented in Figure 11.
It can be seen, that the highest sensitivity values are in the 80 - 200 K range. The obtained Sa and Sr values are quite competitive. Specifically, the list of world analogs is presented in Table 2.

3.4. Temperature-Dependent Kinetic Characterization of Double-Doped YF3: Eu3+, Nd3+

As it was mentioned above, the decay time of the 5D0 - 7F1 (Eu3+) emission of annealed single-doped YF3: Eu3+ nanoparticles demonstrated the highest temperature sensitivity in the 80 - 320 K temperature range (Figure 8). It was suggested, that the addition of Nd3+ can increase the temperature sensitivity of the decay time of the 5D0 - 7F1 (Eu3+) emission via providing an additional temperature-dependent channel depopulating the 5D0 excited state of Eu3+. Indeed, the Nd3+ significantly shortens the rate of luminescence decay (Figure 9) indicating the energy transfer from Eu3+ to Nd3+. The 5D0 - 7F1 (Eu3+) luminescence decay curves of YF3: Eu3+ (2.5%), Nd3+ (4.0 %) sample are presented in Figure 12a.
It can be seen, that the curves are non-exponential in the whole temperature range. To compare the obtained decay time values of double-doped YF3: (Eu3+, Nd3+) nanoparticles with the single-doped YF3: Eu3+ ones, we took τdecay* as time when the normalized luminescence intensity decreases from 1 to 0.1 a.u. The τdecay* decreases with the temperature increase. This tendency is comparable to the tendency, which is observed for the LIR function (Figure 10) of the same sample. It can be explained by the two factors: the some nonradiative transitions which provided the decreasing character of decay time dependence for single-doped YF3:Eu3+ samples as well as by the additional channel of Eu3+ depopulation by Nd3+ ions (phonon-assisted energy transfer). In this case, the probability of phonon appearance and as a consequence, the efficiency of the Eu3+ decay (without Nd3+) and Eu3+ - Nd3+ energy transfer, increases with the increase of temperature. However, the rate of both LIR and τdecay* slightly decreases at elevated temperatures. It can be suggested, that there is the activation of back energy transfer from Nd3+ to Eu3+, which is observed for some donor/acceptor ion pairs at the elevated temperatures [12,28]. The calculated Sa and Sr values are presented in Figure 13.
As it was mentioned above, the main idea of Nd3+ co-doping was to increase the temperature sensitivity of the 5D0 - 7F1 (Eu3+) luminescence decay time of the single-doped YF3: Eu3+ (2.5%) nanoparticles. For the single-doped YF3: Eu3+ (2.5%) nanoparticles, the decay time linearly decreases with the temperature increase. The slope is equal to 11.0 μs/K (note, that for the lineal dependence y=kx+b, the Sa = |dy/dx| is equal to the slope value (k)). Indeed, we notably increased the Sa from in the 80 - 260 K temperature range.
Table 3. The comparison of the performances of rare-earth-doped inorganic temperature sensors. Luminescence decay time is taken as temperature-dependent parameter.
Sample Transition, wavelength, and excitation conditions Max Sa [μs/K] Max Sr [%/K] in the Ref.
annealed YF3: Eu3+,Nd3+ Emission of Eu3+ (5D0 - 7F1, ~ 590 nm), λex = 394 nm (7F0 - 5L6 absorption band) 10 - 18 in the 80 - 200 K 0.2 - 0.3, in the 80 - 200 K This work
β-NaGdF4: Nd3+,Yb3+ Yb3+ (2F5/2 - 2F7/2, ~ 980 nm),λex = 808 nm (4I9/2 - 4F5/2 abs. of Nd3+). Linear increase from 1.0 (300 K) to 2.8 (at 350 K) Increases from 0.7 (300 K) to 1.6 (at 350 K) [29]
Nd0.5RE0.4Yb0.1PO4 (RE = Y, Lu, La, Gd) Yb3+ (2F5/2 - 2F7/2, ~ 980 nm), λex = 940 nm, 2F7/2 - 2F5/2 absorption band of Yb3+. 0.4 - 1.6 at 300 K 0.5 - 1.2 at 300 K [30]
LiYXYb1-XF4: Tm3+ λex = 688 nm, 3H6 - 3F2,3 (Tm3+) absorption band of 1.2 0.36 [31]
β-PbF2: Tm3+, Yb3+ Tm3+ (1G4 - 3H6, 478 nm), (2F7/2 - 2F5/2 abs. of Yb3+) 0.20 (at 300 K) [32]
Gd2O2S: Eu3+ Eu3+, 5D0 level, λex = 375 nm (the transition is not specified) Linear decreas: 4.5 (at 280 K) to 3.0 (at 335 K) [33]
LaGdO3: Er3+/Yb3+ Er3+ (4S3/2 - 4I15/2, 530 nm), (4F9/2 - 4I15/2, 670 nm) (2F7/2 - 2F5/2 abs. of Yb3+) 1.79 (4S3/2) and 0.94 (4F9/2) in the 290 - 350 K range. [34]
TiO2: Sm3+ Sm3+ (4G5/2 - 6H7/2, 612 nm) 438 nm (matrix excitation) 10 %/ºC at 70 ºC [35]
NaPr(PO3)4 Pr3+ (emission from 3P0, the wavelength is not specified), λex = 488 nm (3H4 - 3P0 absorption band of Pr3+. Linearl increas: 44·10-4 (at 300 K) to 60·10-4 (at 365 K) [22]
LaF3: Pr3+ Pr3+ (3P0 - 3H4, 486 nm) λex = 444 nm (3H4 - 3P2 abs. of Pr3+) 0.7·10-3 in the 80 - 320 K. [36]
LaPO4: Nd3+,Er3+ Nd3+ (4F5/2 - 4F11/2 λem = 1055 nm), λex = 808 nm abs. 4I9/2 - 4F5/2) max value 0.003 at 600 K max value ~ 2.5 at 600 K [37]
MOF: Eu3+ Host excitation under 368 nm, λem = 525 nm linear decrease: ~ 550 us (at 270 K) to ~460 us (at 360 K). The estimated Sa is equal to 1.0 us/K [38]
GAG: Mn3+, Mn4+ λex = 266 nm, λem = 610 nm (5T2 - 5E″ of Mn3+) 2.08 at 249 K [39]
Pr3+:YAG Pr3+ (1D2 - 3H4, 617 nm), λex = 488 nm (3H4 - 3P0 absorption band of Pr3+. linear decrease: ~ 190 us (at 10 K) to ~ 110 us (at 1000 K). The estimated Sa is equal to 0.080 us/K [40]
CaF2: Ho3+ Ho3+ (5F5 - 5I8, λem = 650 nm), λex = 488 nm (5F3 - 5I8 absorption band of Ho3+. linear decrease: ~ 100 us (at 100 K) to ~ 40 us (at 450 K). The estimated Sa is equal to 0.17 us/K [40]
LiPr(PO3)4 Pr3+ (emission from 3P0, the wavelength is not specified) λex = 488 nm (3H4 - 3P0 absorption band of Pr3+. 0.0044 K-1 in the 300 - 365 K range The Sa increases almost linearly from 0.44 %/K (at 300 K) to 0.65 %/K (at 365 K) [22]
It can be concluded, that the studied YF3: (Eu3+,Nd3+) sample demonstrates the highest Sa values and competitive Sr ones, especially in the 80 - 200 K range. Many of the above-mentioned phosphors do not demonstrate the co competitive Sr values in this temperature range of their optical characteristics were not studied. Hence, the Optical temperature sensors, operating in this range are highly demanded in cryogenic and spices industries.

4. Conclusions

The YF3: (Eu3+, Nd3+) nanoparticles were synthesized via the co-precipitation method in distilled water with subsequent hydrothermal treatment. Then, the powders were divided into two groups: not annealed and annealed at 400 °C in air for 4 hours. The phase composition of the YF3 doped particles was confirmed via XRD. In particular, XRD patterns correspond to the orthorhombic structure of YF3 host-matrix without impurity and amorphous phases. After the annealing procedure, the samples have narrower diffraction peaks. According to the TEM imaging, the annealing procedure insignificantly affects the morphology of the nanoparticles. The average diameter was determined as 139 ± 2 and 132 ± 3 nm before and after annealing, respectively. The IR spectroscopy showed the presence of water in the not annealed nanoparticles. In turn, after annealing, the presence of the water was not observed. It was suggested, that the narrowing of the XRD peaks is related to the removal of water and to the improvement of nanoparticle crystallinity. The annealing procedure does not affect the shape of the luminescence spectrum of YF3: Eu3+ (2.5, 5.0, and 7.5 mol.%) nanoparticles. In addition, the spectrum shape of these samples is independent of temperature in the 80 - 320 K range. However, after annealing the luminescence decay time (τdecay) increases. The τdecay linearly descends with the increase of temperature. The slope values of the annealed YF3: Eu3+ (2.5 and 5.0 mol. %) nanoparticles were the highest (110·10-4 and 67·10-4, μs/K in the whole 80 - 320 K range, respectively) thus, these samples were chosen for further doping with Nd3+. Moreover, the obtained slope value 110·10-4 μs/K (Sa) is very competitive surpassing many counterparts. We synthesized a set of YF3: (Eu3+ (2.5 and 5.0 mol. %), Nd3+ (2.0, 4.0 mol.%)) annealed and not annealed samples. In the case of not annealed samples, the Nd3+ emission intensity was negligible compared to Eu3+ one for all the samples. It was explained by the fact, that water molecules quench Nd3+ emission because the Nd3+ excited states are resonant to some vibrational states of OH groups. In turn, the annealed samples shoved more intense Nd3+ emission under Eu3+ excitation. In particular, YF3: (Eu3+ (2.5%), Nd3+ (4.0 %)) sample demonstrated the highest Nd3+ intensity and it was chosen for further LIR (IEu/INd) characterization. The maximum Sa and Sr values based on the LIR function were 0.67 K-1 (at 80 K) and 0.86 %·K-1 (at 154 K), respectively. As it was mentioned above, the single-doped YF3: Eu3+ (2.5. %) nanoparticles showed the linearly decreasing τdecay (T) function (5D0 - 7F1 emission) with the slope value 110·10-4 μs/K. The main idea of Nd3+ co-doping was to increase this slope value by increasing the rate of τdecay (T) descent via the addition of one more temperature-dependent channel of 5D0 excited state depopulation. Indeed, we managed to increase the slope up to 180·10-4 μs/K at 80 K and to obtain very competitive Sr = 0.3 %/K at 80 K. This result is one of the highest compared to the world analogs.
Finally, it can be concluded that relativity new Eu3+/Nd3+ donor/acceptor ion pair showed very competitive performances via both LIR and luminescence decay time dependencies on temperature in the visible spectral range. It paves the way toward submicron temperature mapping and time-resolved temperature sensing in broad temperature range including physiological one. The notable temperature sensitivities at liquid nitrogen temperatures make the studied phosphors promising for space industry.

Supplementary Materials

The following supporting information can be downloaded at the website of this paper posted on Preprints.org.

Author Contributions

Conceptualization, MP and EO; methodology, MP, SK, EO, and OM; software OM, XX; investigation, MP, SK, EO, and OM.; resources, MP; data curation, MP, SK, EO, and OM; MP and EO; project administration, MP; funding acquisition, MP. All authors have read and agreed to the published version of the manuscript.

Funding

The research was funded by the grant from the Russian Science Foundation number 22-72-00129, https://rscf.ru/project/22-72-00129/.

Institutional Review Board Statement

Not applicable.

Informed Consent Statement

Not applicable.

Data Availability Statement

Not applicable.

Conflicts of Interest

The authors declare no conflict of interest.

References

  1. Dramićanin, M.D. Trends in luminescence thermometry. Journal of Applied Physics 2020, 128. [Google Scholar] [CrossRef]
  2. Brites, C.D.; Balabhadra, S.; Carlos, L.D. Lanthanide-based thermometers: at the cutting-edge of luminescence thermometry. Advanced Optical Materials 2019, 7, 1801239. [Google Scholar] [CrossRef]
  3. Brites, C.D.S.; Millán, A.; Carlos, L.D. Lanthanides in luminescent thermometry. In Handbook on the Physics and Chemistry of Rare Earths; 2016; Volume 49, pp. 339–427. [Google Scholar] [CrossRef]
  4. Fedorov, P.P.; Luginina, A.A.; Kuznetsov, S.V.; Osiko, V.V. Nanofluorides. Journal of Fluorine Chemistry 2011, 132, 1012–1039. [Google Scholar] [CrossRef]
  5. Nizamutdinov, A.; Lukinova, E.; Shamsutdinov, N.; Zelenikhin, P.; Khusainova, A.; Gafurov, M.; Pudovkin, M. CeF3-YF3-TbF3 nanoparticle-polymer–“radachlorin” conjugates for combined photodynamic therapy: synthesis, characterization, and biological activity. Journal of Composites Science 2023, 7, 255. [Google Scholar] [CrossRef]
  6. Pudovkin, M.S.; Zelenikhin, P.V.; Shtyreva, V.V.; Evtugyn, V.G.; Salnikov, V.V.; Nizamutdinov, A.S.; Semashko, V.V. Cellular uptake and cytotoxicity of unmodified Pr3+: LaF3 nanoparticles. Journal of Nanoparticle Research 2019, 21, 1–13. [Google Scholar] [CrossRef]
  7. Meijer, J.M.; Aarts, L.; van der Ende, B.M.; Vlugt, T.J.; Meijerink, A. Downconversion for solar cells in YF3: Nd3+, Yb3+. Physical Review B 2010, 81, 035107. [Google Scholar] [CrossRef]
  8. Pudovkin, M.; Oleynikova, E.; Kiiamov, A.; Cherosov, M.; Gafurov, M. Nd3+, Yb3+: YF3 Optical Temperature Nanosensors Operating in the Biological Windows. Materials 2022, 16, 39. [Google Scholar] [CrossRef]
  9. Piñol, R.; Brites, C.D.; Silva, N.J.; Carlos, L.D.; Millán, A. Nanoscale thermometry for hyperthermia applications. In Nanomaterials for Magnetic and Optical Hyperthermia Applications; 2019; pp. 139–172. [Google Scholar] [CrossRef]
  10. Jaque, D.; Vetrone, F. Luminescence nanothermometry. Nanoscale 2012, 4, 4301–4326. [Google Scholar] [CrossRef]
  11. Chen, D.; Wang, Z.; Zhou, Y.; Huang, P.; Ji, Z. Tb3+/Eu3+: YF3 nanophase embedded glass ceramics: Structural characterization, tunable luminescence and temperature sensing behavior. Journal of Alloys and Compounds 2015, 646, 339–344. [Google Scholar] [CrossRef]
  12. Pudovkin, M.S.; Ginkel, A.K.; Lukinova, E.V. Temperature sensitivity of Nd3+, Yb3+:YF3 ratiometric luminescent thermometers at different Yb3+ concentration. Optical Materials 2021, 119, 111328. [Google Scholar] [CrossRef]
  13. Pudovkin, M.S.; Ginkel, A.K.; Morozov, O.A.; Kiiamov, A.G.; Kuznetsov, M.D. Highly-sensitive lifetime optical thermometers based on Nd3+, Yb3+: YF3 phosphors. Journal of Luminescence 2022, 249, 119037. [Google Scholar] [CrossRef]
  14. Kaczmarek, A.M.; Kaczmarek, M.K.; Van Deun, R. Er3+-to-Yb3+ and Pr3+-to-Yb3+ energy transfer for highly efficient near-infrared cryogenic optical temperature sensing. Nanoscale 2019, 11, 833–837. [Google Scholar] [CrossRef] [PubMed]
  15. Qi, Y.; Li, S.; Min, Q.; Lu, W.; Xu, X.; Zhou, D.; Yu, X. Optical temperature sensing properties of KLu2F7: Yb3+/Er3+/Nd3+ nanoparticles under NIR excitation. Journal of Alloys and Compounds 2018, 742, 497–503. [Google Scholar] [CrossRef]
  16. Alakshin, E.M.; Klochkov, A.V.; Kondratyeva, E.I.; Korableva, S.L.; Kiiamov, A.G.; Nuzhina, D.S.; Stanislavovas, A.A.; Tagirov, M.S.; Zakharov, M.Y.; Kodjikian, S. Microwave-assisted hydrothermal synthesis and annealing of DyF3 nanoparticles. Journal of Nanomaterials 2016, 2016, 7148307. [Google Scholar] [CrossRef]
  17. Tan, M.C.; Kumar, G.A.; Riman, R.E.; Brik, M.G.; Brown, E.; Hommerich, U. Synthesis and optical properties of infrared-emitting YF3:Nd nanoparticles. Journal of Applied Physics 2009, 106. [Google Scholar] [CrossRef]
  18. Momma, K.; Izumi, F. VESTA 3 for three-dimensional visualization of crystal, volumetric and morphology data. Journal of applied crystallography 2011, 44, 1272–1276. [Google Scholar] [CrossRef]
  19. Wang, X.; Sheng, T.; Fu, Z.; Li, W. Highly uniform YF3: Ln3+ (Ln = Ce3+, Tb3+) walnut-like microcrystals: Hydrothermal synthesis and luminescent properties. Materials Research Bulletin 2013, 48. [Google Scholar] [CrossRef]
  20. Vanetsev, A.; Kaldvee, K.; Puust, L.; Keevend, K.; Nefedova, A.; Fedorenko, S.; Orlovskii, Y. Relation of Crystallinity and Fluorescent Properties of LaF3: Nd3+ Nanoparticles Synthesized with Different Water-Based Techniques. ChemistrySelect 2017, 2, 4874–4881. [Google Scholar] [CrossRef]
  21. Alakshin, E.M.; Blokhin, D.S.; Sabitova, A.M.; Klochkov, A.V.; Klochkov, V.V.E.; Kono, K.; Tagirov, M.S. Experimental proof of the existence of water clusters in fullerene-like PrF3 nanoparticles. JETP letters 2012, 96, 181–183. [Google Scholar] [CrossRef]
  22. Gharouel, S.; Labrador-Páez, L.; Haro-González, P.; Horchani-Naifer, K.; Férid, M. Fluorescence intensity ratio and lifetime thermometry of praseodymium phosphates for temperature sensing. Journal of Luminescence 2018, 201, 372–383. [Google Scholar] [CrossRef]
  23. Liu, J.; Van Deun, R.; Kaczmarek, A.M. Eu3+, Tb3+-and Er3+, Yb3+-doped α-MoO3 nanosheets for optical luminescent thermometry. Nanomaterials 2019, 9, 646. [Google Scholar] [CrossRef] [PubMed]
  24. Hu, F.; Zhao, Z.; Chi, F.; Wei, X.; Yin, M. Structural characterization and temperature-dependent luminescence of CaF2: Tb3+/Eu3+ glass ceramics. Journal of Rare Earths 2017, 35, 536–541. [Google Scholar] [CrossRef]
  25. Zhou, A.; Song, F.; Song, F.; Feng, M.; Adnan, K.; Ju, D.; Wang, X. Optical thermometry using fluorescence intensities multi-ratios in NaGdTiO4: Yb3+/Tm3+ phosphors. Optical Materials 2018, 78, 438–444. [Google Scholar] [CrossRef]
  26. Maciejewska, K.; Bednarkiewicz, A.; Marciniak, L. NIR luminescence lifetime nanothermometry based on phonon assisted Yb3+–Nd3+ energy transfer. Nanoscale Advances 2021, 3, 4918–4925. [Google Scholar] [CrossRef] [PubMed]
  27. Pudovkin, M.S.; Kuznetsov, S.V.; Proydakova, V.Y.; Voronov, V.V.; Semashko, V.V. Luminescent thermometry based on Ba4Y3F17: Pr3+ and Ba4Y3F17:Pr3+,Yb3+ nanoparticles. Ceramics International 2020, 46, 11658–11666. [Google Scholar] [CrossRef]
  28. Bednarkiewicz, A.; Stefanski, M.; Tomala, R.; Hreniak, D.; Strek, W. Near infrared absorbing near infrared emitting highly-sensitive luminescent nanothermometer based on Nd3+ to Yb3+ energy transfer. Physical Chemistry Chemical Physics 2015, 17, 24315–24321. [Google Scholar] [CrossRef]
  29. Ji, Z.; Cheng, Y.; Cui, X.; Lin, H.; Xu, J.; Wang, Y. Heating-induced abnormal increase in Yb3+ excited state lifetime and its potential application in lifetime luminescence nanothermometry. Inorganic Chemistry Frontiers 2019, 6, 110–116. [Google Scholar] [CrossRef]
  30. Maciejewska, K.; Bednarkiewicz, A.; Marciniak, L. NIR luminescence lifetime nanothermometry based on phonon assisted Yb3+–Nd3+ energy transfer. Nanoscale Advances 2021, 3, 4918–4925. [Google Scholar] [CrossRef]
  31. Khadiev, A.R.; Korableva, S.L.; Ginkel, A.K.; Morozov, O.A.; Nizamutdinov, A.S.; Semashko, V.V.; Pudovkin, M.S. Down-conversion based Tm3+: LiY1-XYbXF4 temperature sensors. Optical Materials 2022, 134, 113118. [Google Scholar] [CrossRef]
  32. Fu, Y.; Zhao, L.; Guo, Y.; Yu, H. Up-conversion luminescence lifetime thermometry based on the 1G4 state of Tm3+ modulated by cross relaxation processes. Dalton Transactions 2019, 48, 16034–16040. [Google Scholar] [CrossRef]
  33. Katumo, N.; Gao, G.; Laufer, F.; Richards, B.S.; Howard, I.A. Smartphone-based luminescent thermometry via temperature-sensitive delayed fluorescence from Gd2O2S: Eu3+. Advanced Optical Materials 2020, 8, 2000507. [Google Scholar] [CrossRef]
  34. Siaï, A.; Haro-González, P.; Naifer, K.H.; Férid, M. Optical temperature sensing of Er3+/Yb3+ doped LaGdO3 based on fluorescence intensity ratio and lifetime thermometry. Optical Materials 2018, 76, 34–41. [Google Scholar] [CrossRef]
  35. Dramićanin, M.D.; Antić, Ž.; Ćulubrk, S.; Ahrenkiel, S.P.; Nedeljković, J.M. Self-referenced luminescence thermometry with Sm3+ doped TiO2 nanoparticles. Nanotechnology 2014, 25, 485501. [Google Scholar] [CrossRef] [PubMed]
  36. Pudovkin, M.S.; Koryakovtseva, D.A.; Lukinova, E.V.; Korableva, S.L.; Khusnutdinova, R.S.; Kiiamov, A.G.; Semashko, V.V. Luminescence nanothermometry based on Pr3+: LaF3 single core and Pr3+:LaF3/LaF3 core/shell nanoparticles. Advances in Materials Science and Engineering 2019, 2019, 2618307. [Google Scholar] [CrossRef]
  37. Maciejewska, K.; Bednarkiewicz, A.; Marciniak, L. The influence of the Er3+ dopant concentration in LaPO4: Nd3+, Er3+ on thermometric properties of ratiometric and kinetic-based luminescent thermometers operating in NIR II and NIR III optical windows. Physica B: Condensed Matter 2021, 620, 413247. [Google Scholar] [CrossRef]
  38. Zhou, Y.; Yan, B. Ratiometric detection of temperature using responsive dual-emissive MOF hybrids. Journal of Materials Chemistry C 2015, 3, 9353–9358. [Google Scholar] [CrossRef]
  39. Marciniak, L.; Trejgis, K. Luminescence lifetime thermometry with Mn3+–Mn4+ co-doped nanocrystals. Journal of Materials Chemistry C 2018, 6, 7092–7100. [Google Scholar] [CrossRef]
  40. Kamma, I.; Kommidi, P.; Reddy, B.R. High temperature measurement using luminescence of Pr3+ doped YAG and Ho3+ doped CaF2. Physica Status Solidi C 2009, 6 (S1 1), S187–S190. [Google Scholar] [CrossRef]
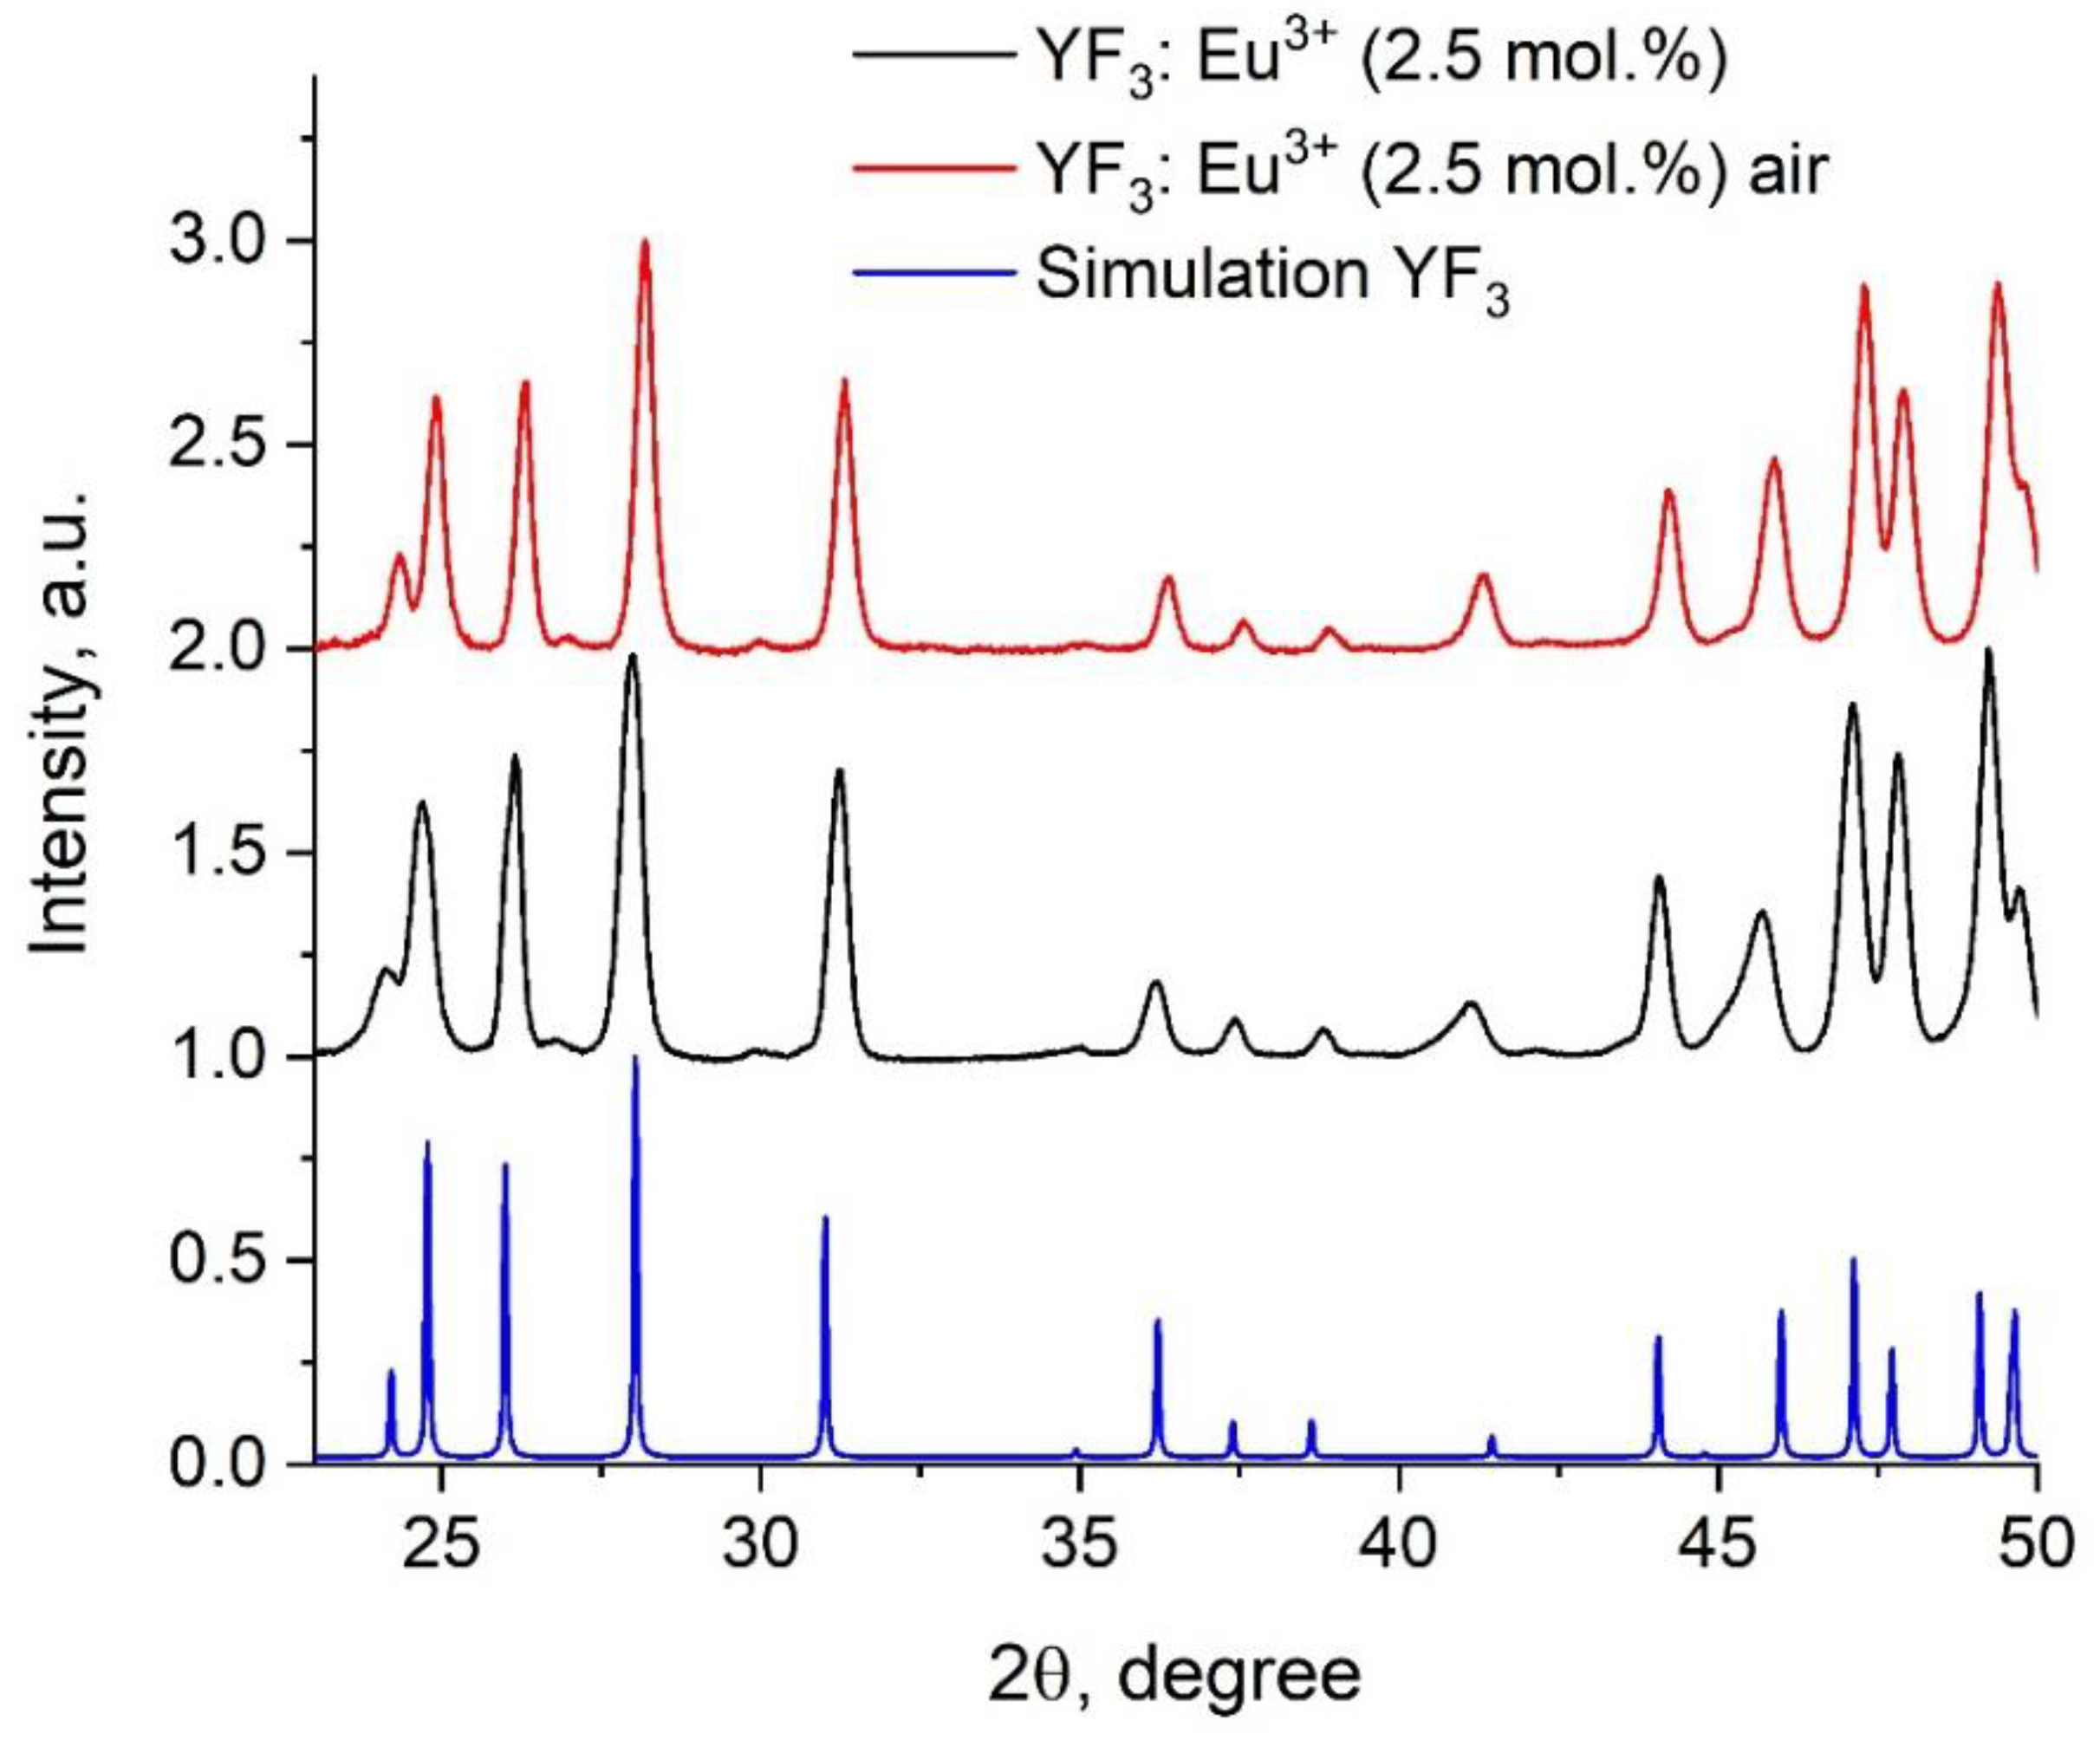
Figure 1. XRD patterns of YF3: Eu3+ (2.5 mol.%) nanoparticles before (black) and after (red) annealing in air (400 °C, 4 hours).
Preprints 101334 g001
Figure 2. TEM image of YF3: Eu3+ (2.5 mol.%) nanoparticles before (a) and after (b) annealing in air (400 °C, 4 hours).
Preprints 101334 g002
Figure 3. TEM image of YF3: Eu3+ (2.5 mol.%) nanoparticles size distribution histograms of YF3: Eu3+ (2.5 mol.%) nanoparticles before (a) and after (b) annealing in air (400 °C, 4 hours).
Preprints 101334 g003
Figure 4. IR spectroscopy of Eu3+:YF3 nanoparticles before and after annealing in air (400 °C, 4 hours).
Preprints 101334 g004
Figure 5. The energy level diagram of Eu3+/Nd3+ system. The optical excitation of Eu3+ is carried out at 394 nm (7F0 - 5L6 absorption band). NR - nonradiative transition, WET - energy transfer. Note, that we did not observe the Nd3+ emission in single-doped YF3:Nd3+ under 394 nm excitation.
Preprints 101334 g005
Figure 6. Room temperature emission spectra and luminescence decay curves detected at 589.5 nm for YF3: Eu3+ (2.5 mol.%) samples without annealing (black) and YF3: Eu3+ (2.5 mol.%) annealed in air (red). The optical excitation of Eu3+ is carried out at 394 nm (7F0 - 5L6 absorption band).
Preprints 101334 g006aPreprints 101334 g006b
Figure 7. The normalized luminescence spectra of the annealed YF3: Eu3+ (2.5%) nanoparticles detected in the 80 - 320 K temperature range. The optical excitation of Eu3+ is carried out at 394 nm (7F0 - 5L6 absorption band).
Preprints 101334 g007
Figure 8. Luminescence decay time (τdecay) at 589.5 nm (5D0 - 7F1 transition) for YF3: Eu3+ (a) 2.5; b) 5.0 and c) 7.5 mol.%) samples without annealing (black) and with annealing in air (red) in the temperature range 80 - 320 K. The data points were approximated with the linear function τdecay = k·T + b, where k is the slope of the function.
Preprints 101334 g008
Figure 9. Room temperature spectra of the annealed YF3: (Eu3+ (2.5%), Nd3+ (4.0 %)) and luminescence decay curves of 5D0 - 7F1 transitions of YF3: (Eu3+ (2.5%), Nd3+ (0 and 4.0 %)). The optical excitation of Eu3+ is carried out at 394 nm (7F0 - 5L6 absorption band).
Preprints 101334 g009
Figure 10. The LIR function of the YF3: (Eu3+ (2.5%), Nd3+ (4.0 %)) sample.
Preprints 101334 g010
Figure 11. The Sa and Sr functions of the annealed YF3: (Eu3+ (2.5%), Nd3+ (4.0 %)) sample.
Preprints 101334 g011
Figure 12. The 5D0 - 7F1 (Eu3+) luminescence decay curves of the annealed YF3: (Eu3+ (2.5%), Nd3+ (4.0 %)) nanoparticles (a) and luminescence decay time (τdecay*) as function of temperature (b). Since the decay curves are nonexponential, the τdecay* is taken as the time when the normalized luminescence intensity decreases from 1 to 0.1 a.u.
Preprints 101334 g012
Figure 13. The Sa and Sr functions of the annealed YF3: (Eu3+ (2.5%), Nd3+ (4.0 %)) sample.
Preprints 101334 g013
Table 1. The slope (μs/K) values of the luminescence decay time function of temperature approximated with linear function.
Sample YF3: Eu3+ 2.5% YF3: Eu3+ 5.0% YF3: Eu3+ 7.5%
Before annealing 78·10-4 97·10-4 51·10-4
After annealing 110·10-4 67·10-4 17·10-4
Table 2. The comparison of luminescence thermometer performances of rare-earth-doped inorganic phosphors. LIR is taken as a temperature-dependent parameter.
Sample Transitions and wavelengths for LIR (I1/I2) and optical excitation conditions Maximum Sa [K-1] in the 100 - 220 K range Maximum Sr [%K-1] in the 100 - 220 K range Ref.
annealed YF3: Eu3+,Nd3+ Nd3+ (4F3/2 - 4I9/2, ~ 866 nm), Eu3+ (5D0 - 7F1, ~ 590 nm) is carried out at 394 nm (7F0 - 5L6 absorption band) 0.065 (80 K) 0.85 (160 K) This work
α-MoO3:Eu3+, Tb3+ ITb (5D4 - 7F5, ~ 548 nm)/IEu (5D0 - 7F2, ~ 621 nm) ~10-3 at 105 K, not studied at higher temperatures ~ 0.50 at 105 K, not studied at higher temperatures [23]
Tb3+, Eu3+:CaF2 ITb (5D4 - 7F5, ~ 545 nm)/IEu (5D0 - 7F2, ~ 615 nm), λex = 485 nm pulse laser 4.0·10-3 [24]
Tb3+(6.0%),Eu3+(8.0%):Ca5(PO4)3F ITb (5D4 - 7F5, ~ 548 nm)/IEu (5D0 - 7F2, ~ 621 nm), λex = 299 nm, laser 1.31·10-3 0.40 [24]
Yb3+,Tm3+:NaGdTiO4 ITm (3H4 (1) →3H6, 812 nm)/ ITm (3H4 (2) →3H6, 798 nm), λex = 980 nm, CW laser 2.0·10-3 at 100 K and 1.0·10-3 at 200 K [25]
Nd3+(1%),Yb3+(0.5-5%):LiLaP4O12 INd (4F3/2 - 4I9/2, ~ 866 nm)/IYb (2F5/2 - 2F7/2, ~ 980 nm), λex = 808 nm, CW laser From 0.05 to 0.25 (depends on the Yb3+ concentration) [26]
Pr3+(0.1%),Yb3+(10.0%):Ba4Y3F17 IPr (2P0 - 4H6)/IYb (2F5/2 - 2F7/2), λex = 442 nm, pulse laser 1.0·10-3 0.20 [27]
Disclaimer/Publisher’s Note: The statements, opinions and data contained in all publications are solely those of the individual author(s) and contributor(s) and not of MDPI and/or the editor(s). MDPI and/or the editor(s) disclaim responsibility for any injury to people or property resulting from any ideas, methods, instructions or products referred to in the content.
Copyright: This open access article is published under a Creative Commons CC BY 4.0 license, which permit the free download, distribution, and reuse, provided that the author and preprint are cited in any reuse.
Alerts
Prerpints.org logo

Preprints.org is a free preprint server supported by MDPI in Basel, Switzerland.

Subscribe

© 2025 MDPI (Basel, Switzerland) unless otherwise stated