1. Introduction
Rice occupies an important position in China, being both a major food crop and one of the key commodity grains. Different varieties of rice differ in nutritional composition, with high-quality rice containing richer nutrients. However, high-quality and inferior rice are mixed in the market, and it is difficult for consumers to distinguish them with the naked eye.
Although rice varieties may appear similar in appearance, differences in their composition directly affect their quality. While chemical measurement analysis can distinguish between rice varieties, these methods are time-consuming, low in precision, and cumbersome to operate, unable to meet the need for rapid detection. Therefore, there is a need for a rapid and non-destructive detection technology for rice varieties.
Hyperspectral imaging technology, as a non-destructive detection technology, can reveal the physicochemical characteristics and morphological features of samples. In recent years, this technology has been widely used in the quality and variety detection of various seeds, such as corn, wheat, rice, soybeans, and goji berries. To some extent, image analysis technology and hyperspectral imaging technology have improved the accuracy of non-destructive detection of seeds. However, the use of spectral features alone cannot describe the spatial distribution characteristics of the overall seed, and the use of image texture features alone cannot accurately reflect the internal composition of the seed. The comprehensive utilization of spectral information and image information from hyperspectral images can improve the reliability and accuracy of the results. In the application of hyperspectral imaging technology, there have been multi-feature fusion techniques used for the classification of crop varieties.
As early as 2014, scholars used hyperspectral imaging technology to collect spectral and image data of rice, combined with the BPNN algorithm for variety and quality identification. The classification accuracy of this study, conducted by Lu Wang in 2014, surpassed that based on spectral data. Weng Shizhuang and others further combined hyperspectral imaging technology with spectral and image features, using convolutional neural networks (CNN) for non-destructive identification of high-quality rice. The comparison showed that the performance of CNN was significantly better than traditional machine learning methods such as K-nearest neighbors (KNN) and random forests (RF).
Jie used hyperspectral imaging equipment to collect spectral and image data of goji berries. By fusing spectral and texture data and combining them with the CNN algorithm, they successfully identified the origin of the goji berries. Jin Baichuan and others used near-infrared hyperspectral imaging technology and deep learning to model and classify different varieties and types of rice, comparing the performance differences between deep learning and traditional machine learning. Luan Xinxin took a different approach, combining near-infrared spectroscopy, mid-infrared spectroscopy, and Raman spectroscopy, using chemometric analysis methods to study the origin identification of 186 rice samples from different regions. The experimental results showed that compared to single-spectrum models, the spectral information fusion model had a higher recognition accuracy. Liu Yande and Wang Shun, based on spectral information, image information, and fusion information collected by hyperspectral imaging, conducted extensive non-destructive detection research on navel oranges. Sun Jun and others used BOSS, VISSA, SPA, and PCA to select feature variables from original spectral and image data. The accuracy of the models established was 91.48% and 70%, respectively, with low classification accuracy and recognition rates, indicating that the classification effect using only hyperspectral image or spectral feature morphology was not good. However, the performance of the support vector machine model based on fusion features was significantly improved, with a model accuracy of 97.22%, indicating that fusing spectral and image information from hyperspectral images can effectively improve classification detection accuracy. Ye Wenchao and others used different preprocessing methods to process near-infrared spectroscopy. After comparison, they found that the one-dimensional convolutional neural network classification model after preprocessing with the convolutional smoothing algorithm had the best effect. Subsequently, they used the random forest algorithm to select feature wavelengths and constructed VGG and ResNet hybrid rice seed classification models based on single-wavelength grayscale image and three-wavelength reconstructed pseudo-color image datasets. The research results showed that the VGG model based on the pseudo-color image dataset had the best classification effect.
Although many experts and scholars mostly rely on single-feature classification model algorithms when processing hyperspectral images, few studies focus on the construction of models using multi-feature fusion methods. To address this issue, this article takes rice as the research object and establishes a seed classification prediction model based on fusion features, aiming to achieve rapid and non-destructive classification detection of rice varieties.
2. Materials and Methods
2.1. Samples Source and Experimental Equipment
2.1.1. Samples Source
In this study, rice samples were provided by the Jilin Academy of Agricultural Sciences, and a total of six varieties were selected as experimental samples, which were harvested in the autumn of 2022. The varieties included 525, 809, Qiu Guang CK, 528, 816, and Ji 81. To ensure the accuracy of the research results, the samples were selected to have full grains and no obvious color difference, and were milled into milled rice for distinction. Before the experiment, the six groups of samples were stored at room temperature. 100 grains were randomly selected from each variety, and a total of 600 grains were used in this experiment.
2.1.2. Experimental Equipment
The experimental equipment used was a computer equipped with an Intel
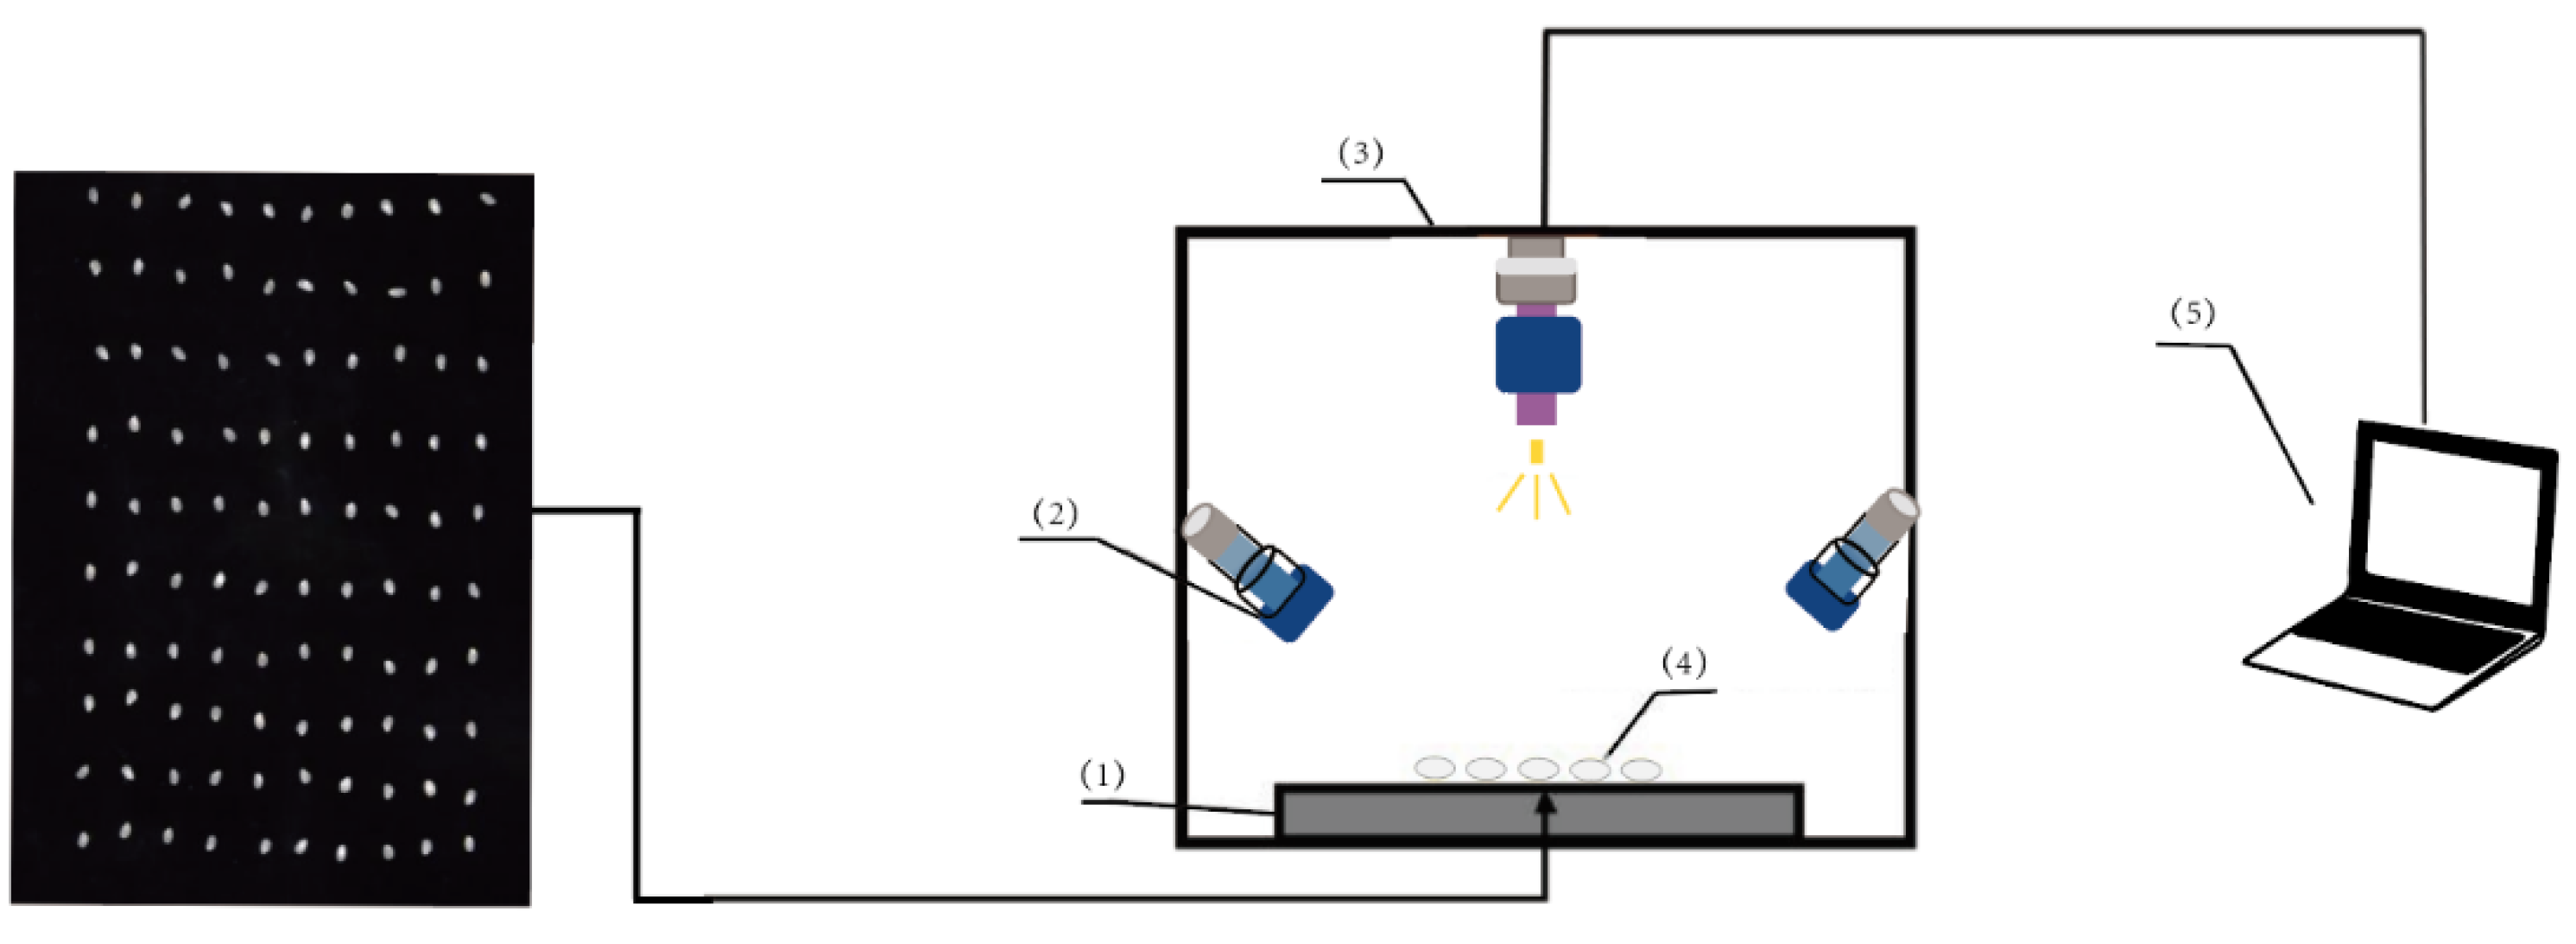
® Core™ i9-9900 3.10 GHz processor and 16GB RAM, running on the Windows 10 operating system. The code was executed in a Python 3.8 environment, and the scikit-learn version 0.23.2 was used as the base library. To obtain hyperspectral data of rice, a hyperspectral imaging system (as shown in
Figure 1) was utilized in this study. Before collecting data, the spectrometer was preheated to ensure stable illumination. For the specific structure of the hyperspectral imaging system, please refer to
Figure 1.
2.2. Hyperspectral Image Acquisition and Correction
The system acquires hyperspectral images using a push-broom imaging method. During the experiment, the rice samples to be tested were placed on a moving platform, and the hyperspectral image data of the samples were successfully obtained by precisely controlling the movement of the moving platform. To ensure the integrity and accuracy of the data, all samples were scanned once in this study. During image acquisition, the rice samples were placed on a black carrier board, and the entire acquisition process was conducted in a closed black box to minimize interference from external light sources.
This experiment used the Pika XC2 hyperspectral instrument (produced by Resonon Inc. in Bozeman, USA), with a spectral range covering 400-1000nm and a spectral resolution of 1.3nm. Due to the uneven distribution of light source intensity and the presence of dark current noise, black-and-white calibration was performed on each sample before scanning to improve the signal-to-noise ratio of the acquired images [
13].
To correct for uneven illumination distribution and dark current effects, the reference image (Rw) of the reflective white board and the dark image (Rb) were first acquired by turning off the light source and covering the camera lens. Then, the original hyperspectral image (Rs) of the sample was used for calculation to obtain the corrected hyperspectral image (Rc). The calculation formula is as follows:
2.3. Data Extraction and Preprocessing
In this experiment, an image processing flow was adopted to process rice images. The process includes steps such as binarization, Gaussian denoising, threshold segmentation, and morphological transformation, aiming to remove background information and noise information in the image, so as to accurately extract data from the target area of rice. This effectively reduces invalid information in the image and ensures the accuracy and integrity of data extraction. Hyperspectral image data contains image information at various wavelengths and spectral information of each pixel in the image, reflecting both the external characteristics and physical structure of the sample, as well as the internal chemical composition.
2.3.1. Hyperspectral Data Extraction
The main components of rice include fatty acids, proteins, and starch, and there are differences in the content of these components among different varieties of rice [
18]. To study the spectral characteristics of rice, we selected the rice grain image as the region of interest (ROI) and calculated the average spectrum by taking the average of all pixel spectral values within the ROI.
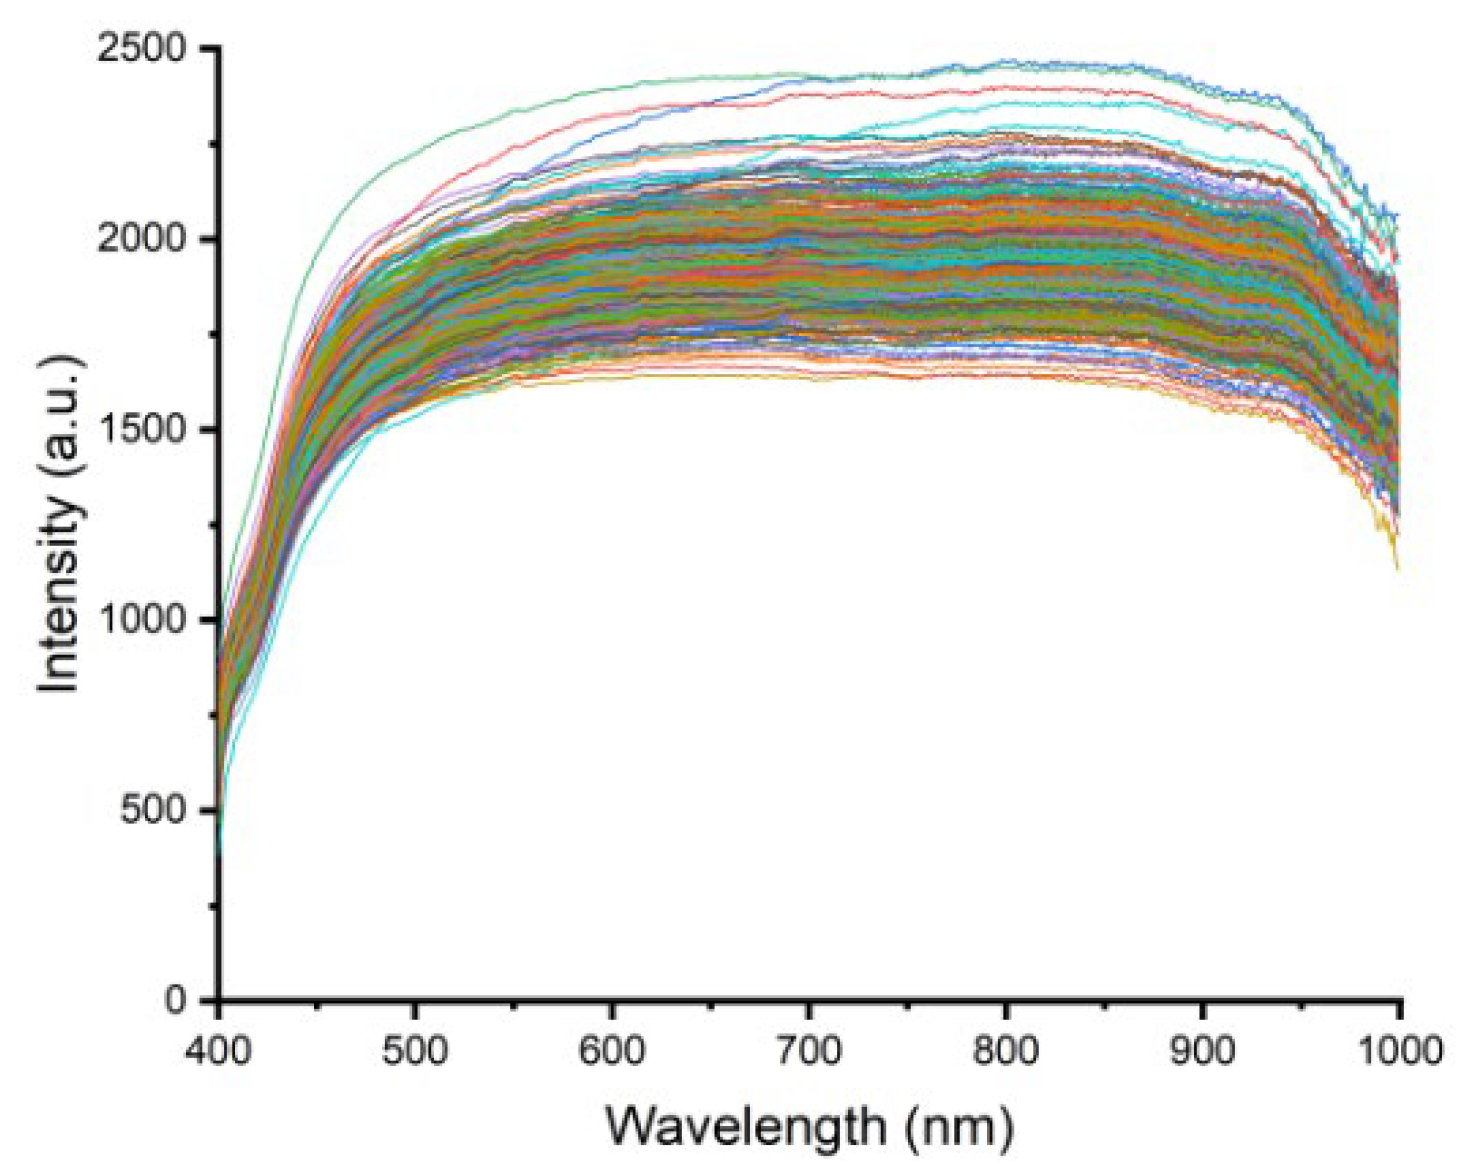
Figure 2 shows the original spectral curves of six types of rice in the wavenumber range of 400-1000nm. Although the shapes of the rice spectra are very similar, there are differences in reflectance values. Although the overall reflectance spectral curves do not exhibit significant fluctuations or distinct peaks and troughs, there are minor absorption peaks at 780 and 990nm [
19].
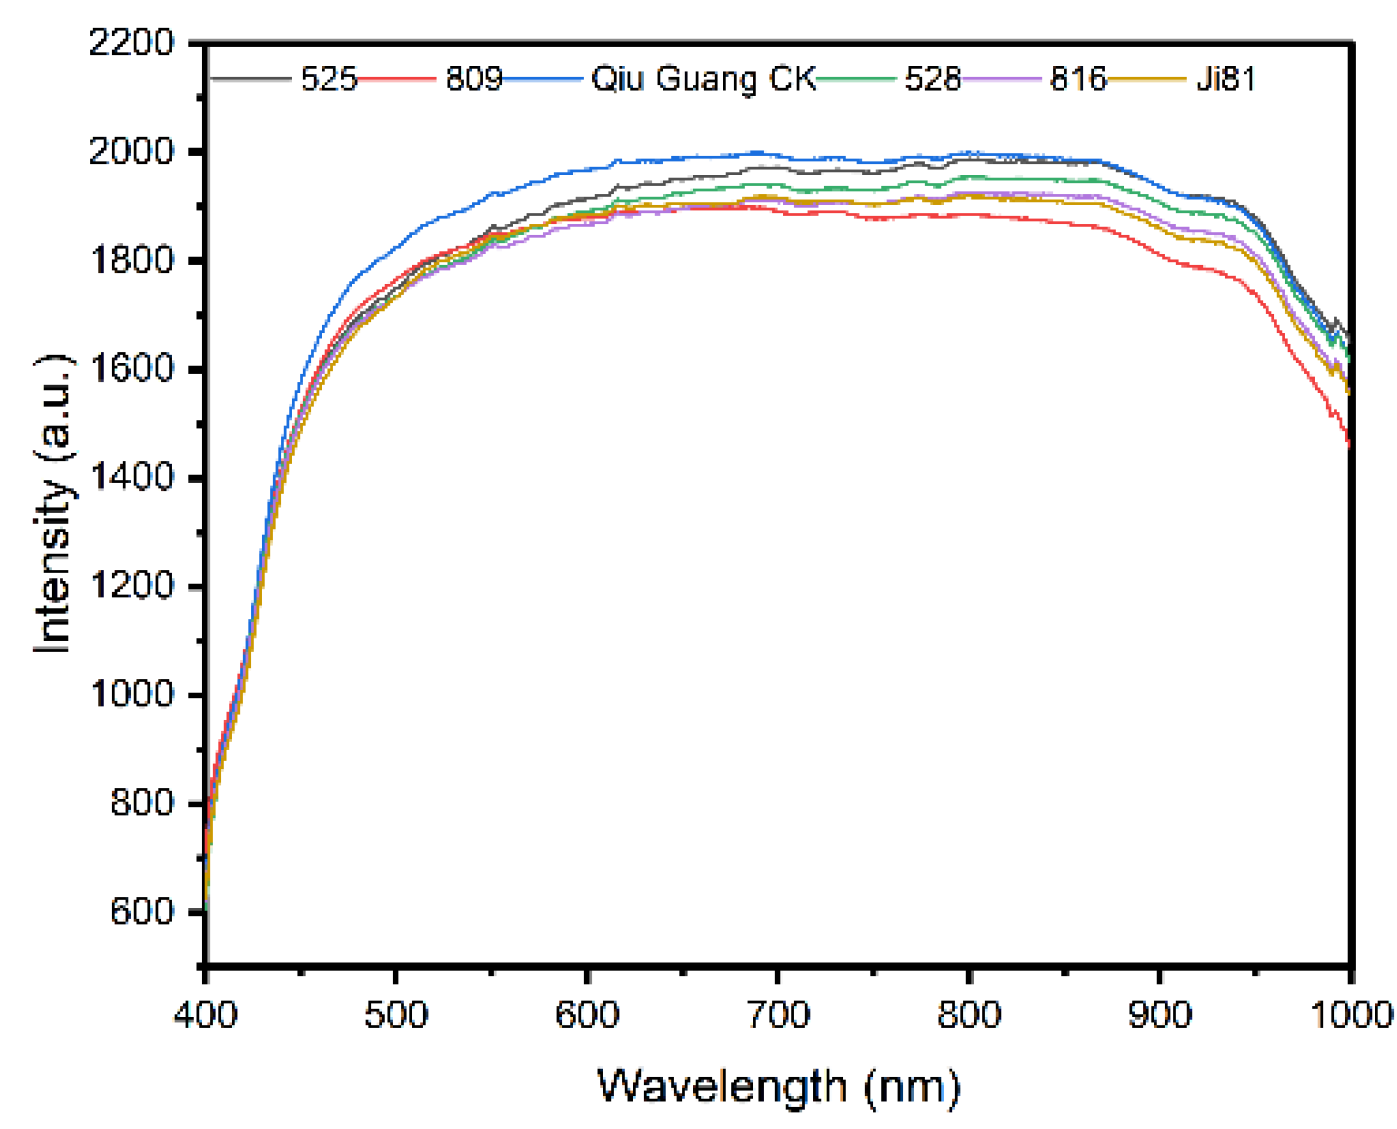
To visually distinguish differences in spectral intensity values among the groups, we performed mean processing on the spectral intensity values of 100 seed samples from each group, resulting in average spectral intensity value curves for each group (as shown in
Figure 3b).
Figure 3 displays the average spectral curves of rice. The overall trends of the spectral curves are similar, but each curve represents the characteristic average value of its respective category. These curves exhibit differences at multiple points, which not only reflect differences in the content of internal components of rice but also serve as important characteristics for distinguishing between different types of rice.
2.3.2. Extraction of Texture Information from Hyperspectral Images
Image information encompasses various aspects such as the size, shape, color, and texture of the sample. For different varieties of rice, their textures exhibit significant differences in terms of coarseness, size, and direction. The Gray-Level Co-occurrence Matrix (GLCM) is a crucial feature in the field of image analysis [
20]. Due to differences in texture scales, GLCM can vary significantly among different images. Texture is a local structured feature of an image that reflects the gray-level properties and spatial topological relationships of the target image. Nine types of texture information were extracted using GLCM, including mean, standard deviation, contrast, dissimilarity, homogeneity/inverse variance, angular second moment, energy, entropy, and maximum probability. Changes in protein content in rice can lead to corresponding changes in its color, texture, and transparency [
21].
The mean reflects the average gray level. The standard deviation measures the deviation of pixel values from the mean. When there is a significant change in gray levels within an image, the standard deviation is higher. Contrast reflects the clarity of the texture. Dissimilarity calculates contrast with weights that increase exponentially with the distance from matrix elements to the diagonal; if the increase is linear, dissimilarity is obtained. Homogeneity or inverse variance assesses the local uniformity of the image, with higher values for uniform images and lower values for non-uniform images. The angular second moment reflects the concentration of gray-level distribution in the image, with higher values indicating more uniform gray-level distribution. Energy is the sum of squared values of the elements in the gray-level co-occurrence matrix. It measures the stability of gray-level changes in the image texture and reflects the uniformity of gray-level distribution and the fineness of the texture. Entropy, as another measurement, also depicts the degree of confusion in the gray-level distribution of the image. A high entropy value indicates diverse gray-level changes and complex textures. Maximum probability represents the most frequently occurring texture feature in the image.
2.3.3. Hyperspectral Data Preprocessing
Spectral reflectance at different wavelengths is often affected by noise, resulting in a sawtooth pattern in adjacent bands. To improve the accuracy of information extraction, this study employed preprocessing techniques such as convolutional smoothing (Savitzky-Golay, SG) and multiplicative scatter correction (MSC) on the spectral data. These preprocessing techniques help smoothen the data, reduce noise, and improve the quality of spectral data, providing a more reliable foundation for subsequent analysis.
As evident from
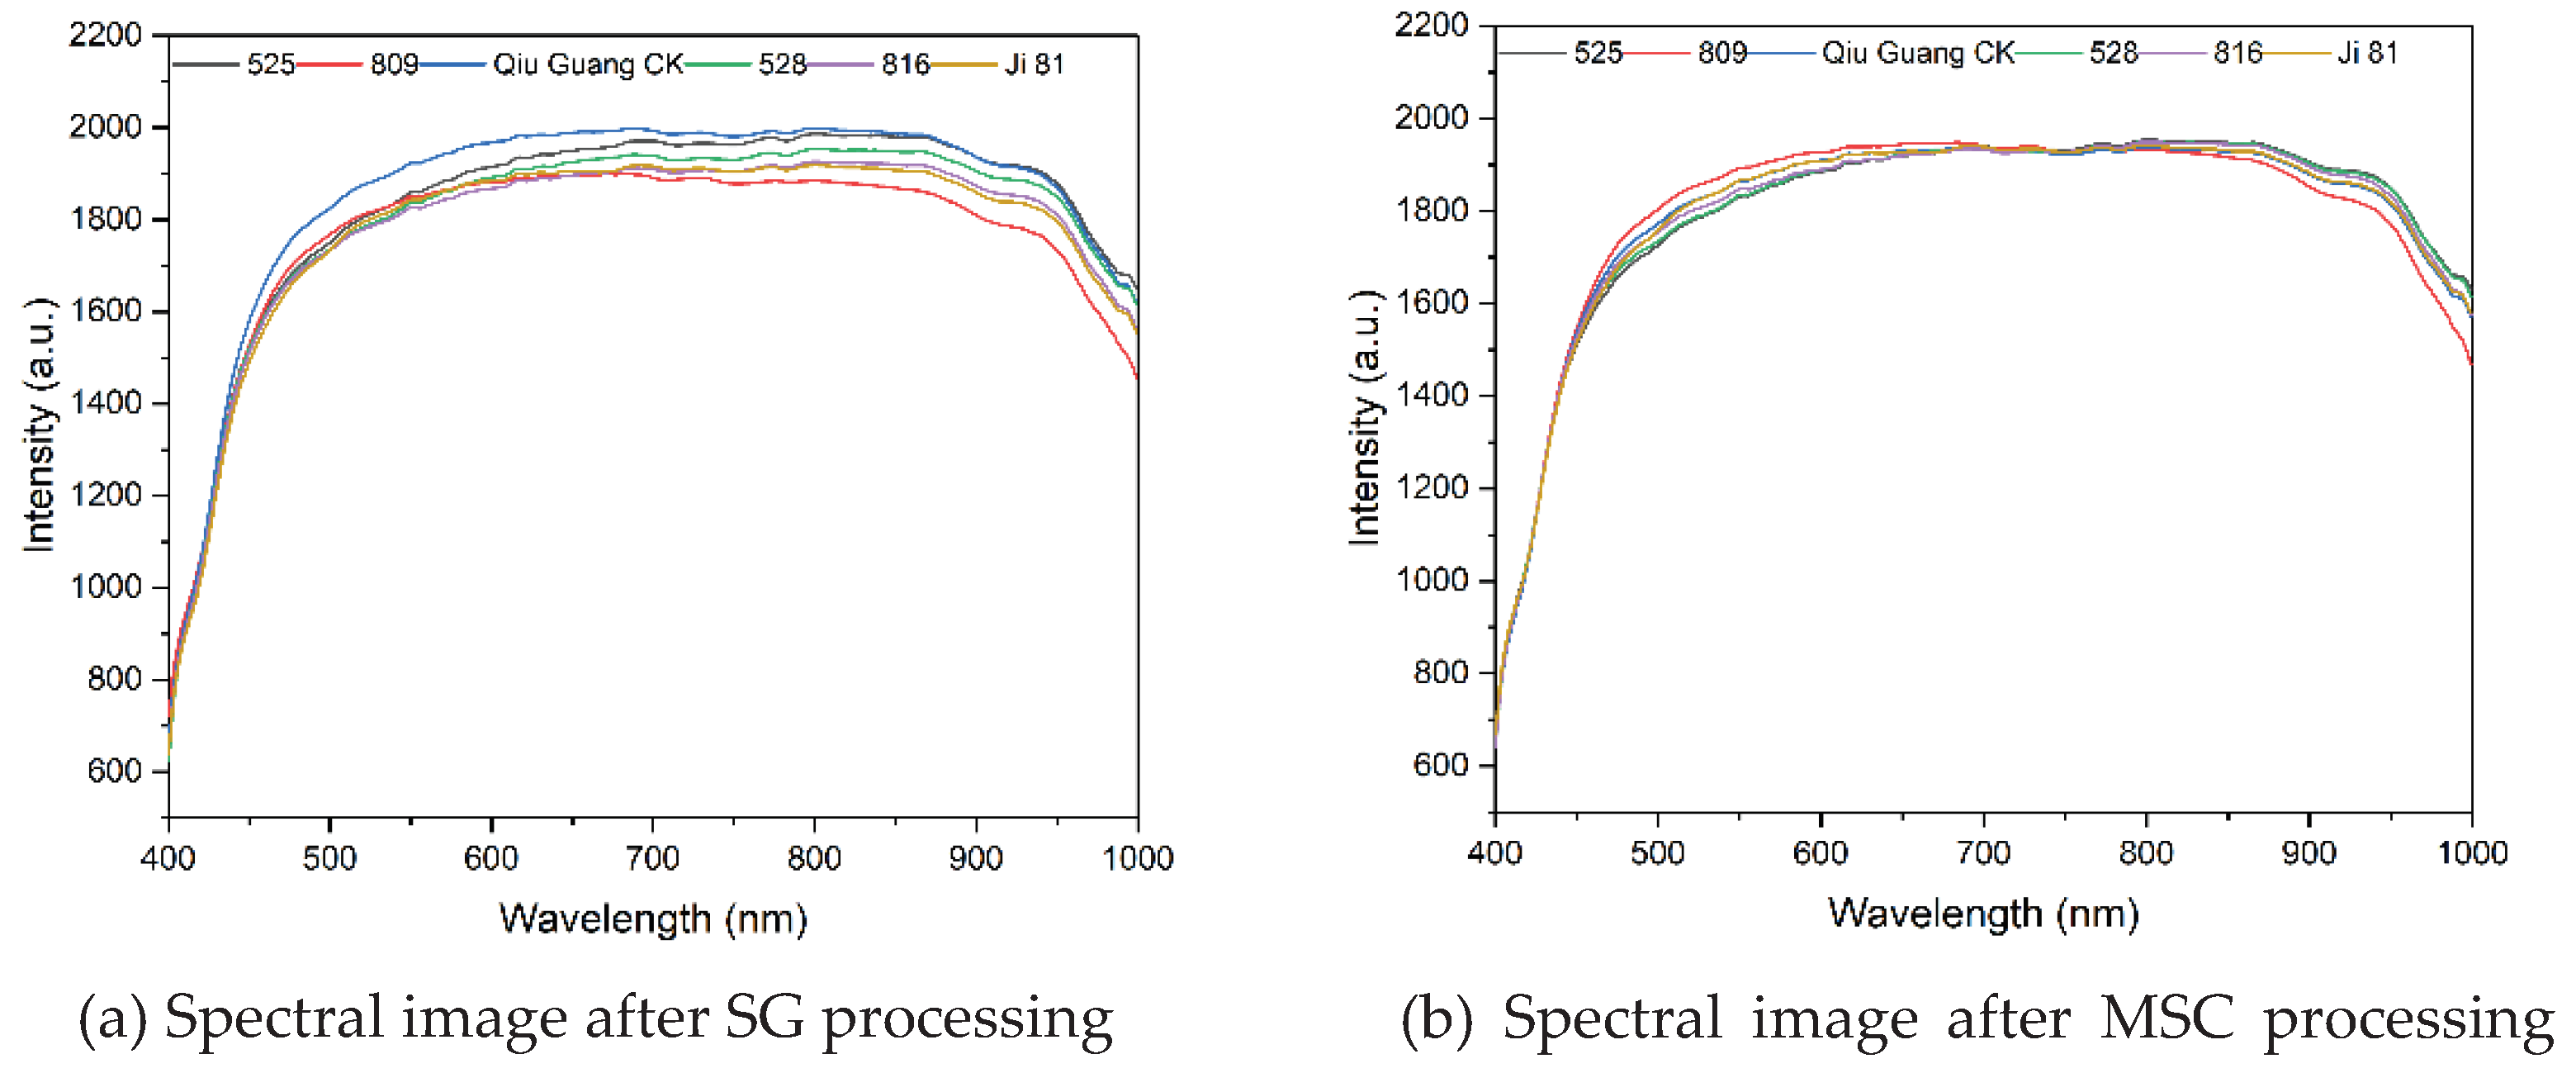
Figure 1, the sample data was significantly affected by noise, resulting in an unsmooth original spectral curve. To address this issue, we applied the SG method for preprocessing the spectral data. After SG preprocessing, the spectral curve of the original spectral data became smoother, as shown in
Figure 4a.
To eliminate other potential factors and reduce interference from irrelevant information, MSC preprocessing was introduced. The spectral data after MSC preprocessing is shown in
Figure 4b. By comparing
Figure 4a,b, it can be observed that the gap between the hyperspectral curves after SG and MSC preprocessing has significantly narrowed. The spectral curves are not only smoother but also more concentrated, with more pronounced features of peaks and troughs. This indicates that the preprocessing effectively reduced spectral errors caused by particle scattering among samples and achieved the desired effect, providing a more reliable data foundation for subsequent spectral analysis and feature extraction.
2.4. Fusion of Spectral Data and Image Texture
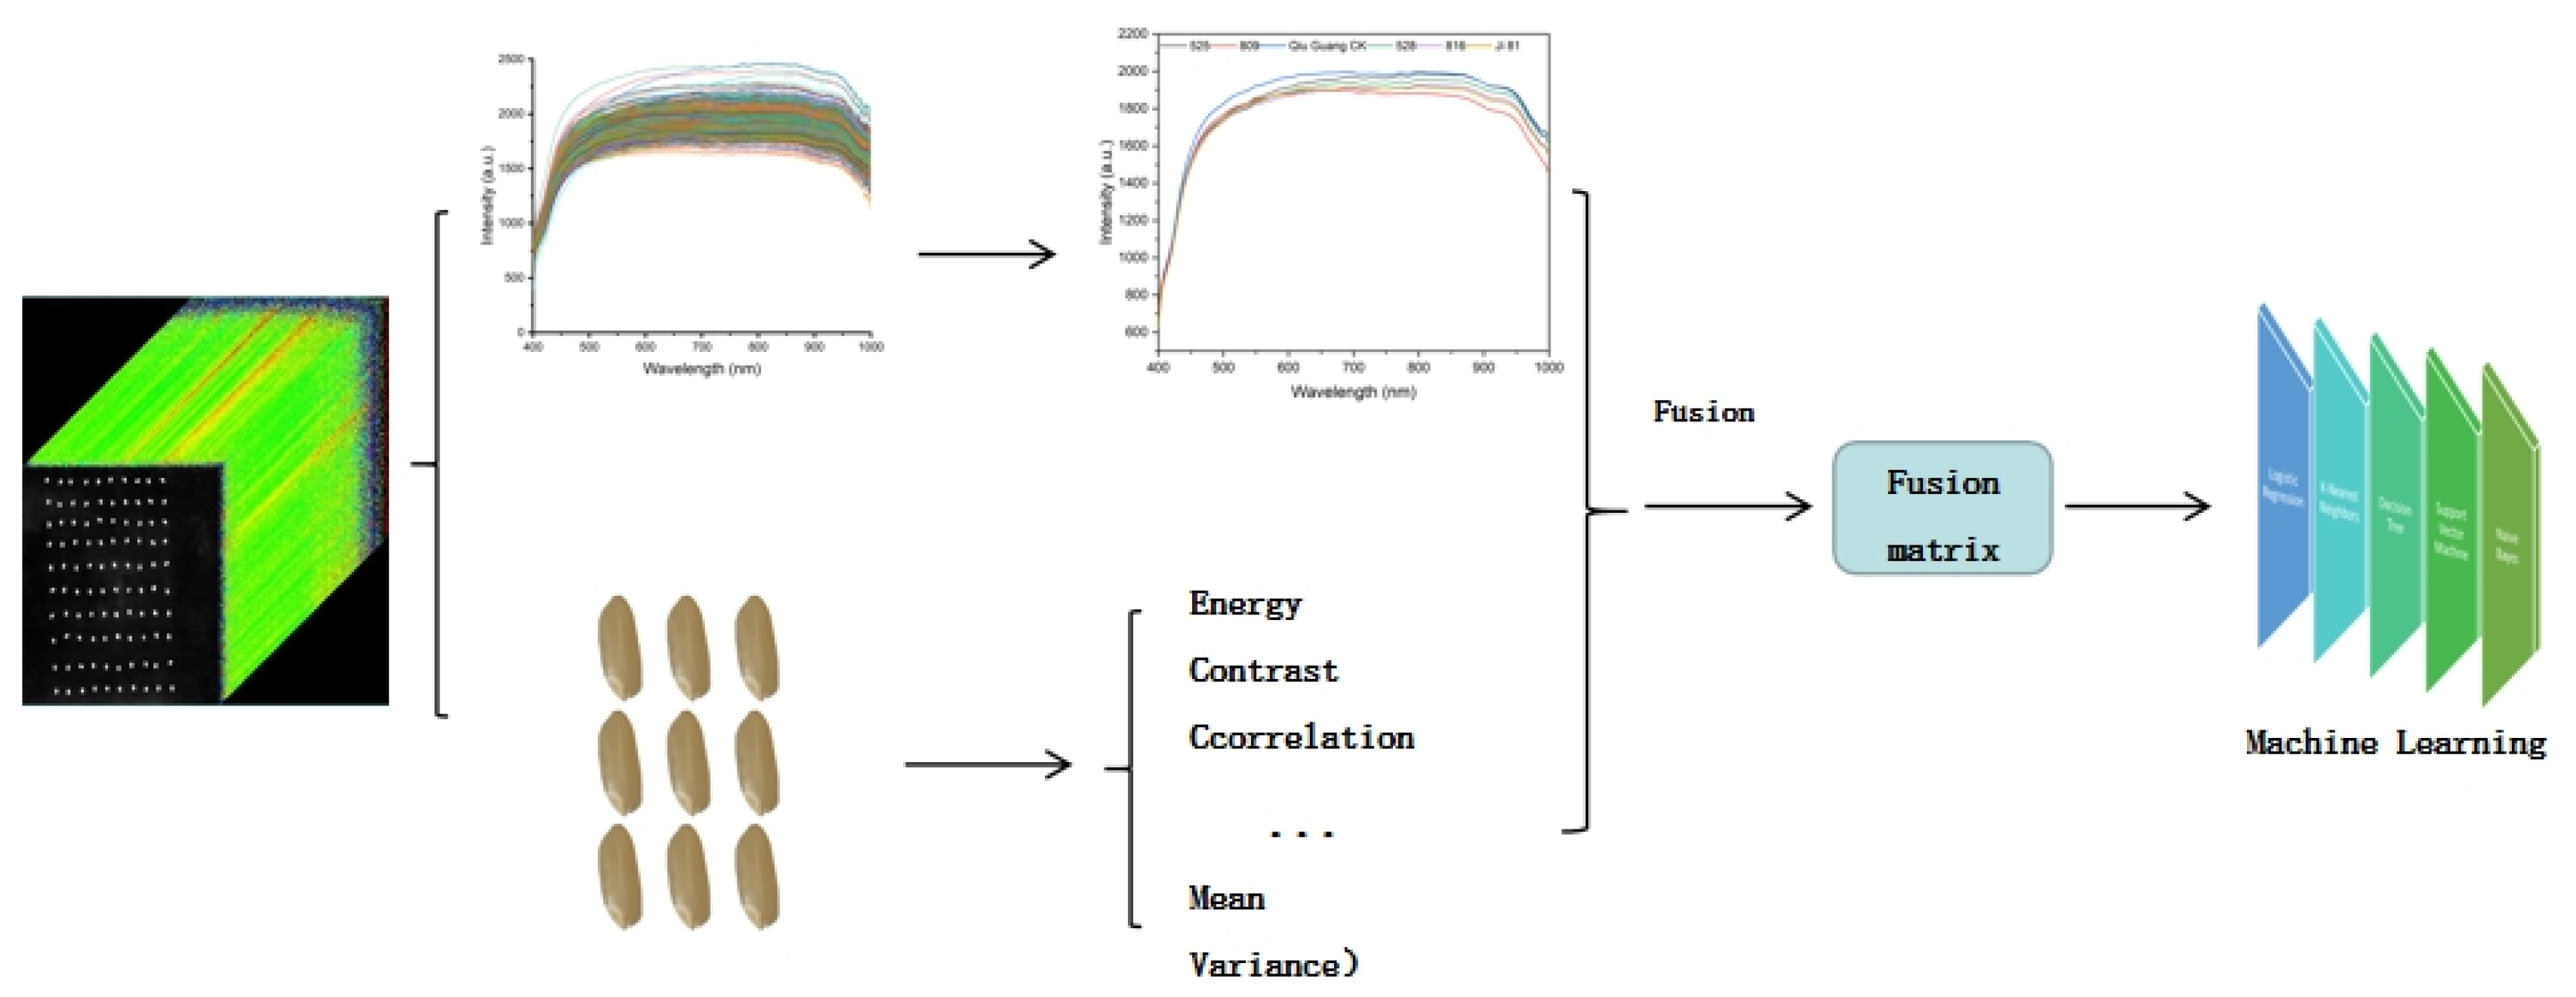
This study created a new data matrix by integrating full-spectrum and texture values. The methodology for the data fusion process is illustrated in
Figure 5. Using the preprocessed spectral data with 462 bands’ intensity values and the nine texture values extracted from the images, a dataset was constructed for modeling and analysis. This dataset served as the input for a machine learning classification model.
2.5. Introduction to Discriminant Analysis Method
In this study, three different varieties of classification models were constructed, based on spectral information, image texture information, and the fusion of spectral and texture information, respectively. Due to the randomness of initial model parameters, there may be variations in prediction results each time, affecting the accuracy and stability of the models. To comprehensively evaluate the performance of the models, 30 random simulation trials were conducted in this study, and the results of each trial were averaged to serve as the basis for model evaluation.
During the model construction process, three supervised learning algorithms were employed: Support Vector Machine (SVM), k-Nearest Neighbor (KNN), and Logistic Regression (LR).
SVM, a machine learning algorithm based on the principle of structural risk minimization, is particularly suitable for nonlinear classification problems with small-scale samples [
14,
15]. SVM has been widely used in spectral data classification. This study aims to classify different varieties of rice using SVM, hoping to provide a new method for rice quality detection and classification.
Logistic Regression (LR) is a generalized linear regression analysis model that falls within the category of supervised learning [
16]. With its simple idea, easy implementation, and rapid modeling, LR is suitable for handling small amounts of data and simple relationships. LR optimizes the error function in the form of least squares through gradient descent, primarily used for binary classification problems but also extendable to multi-class tasks.
The k-Nearest Neighbor (KNN) algorithm is an instance-based learning algorithm. Its core idea is that if the majority of the k nearest neighbors of a sample in the feature space belong to a certain category, then the sample also belongs to that category [
17]. Classification is achieved by calculating the distance between sample features, making it a non-parametric classification and regression method.
3. Classification Prediction Result
Before modeling, the SG method was employed to eliminate noise information from the data, and the MSC technique was utilized to correct spectral errors caused by scattering. These preprocessing steps provided a more reliable foundation for subsequent data modeling. The preprocessed data were then applied to SVM, LR, and KNN algorithms for modeling analysis.
Through experimental validation, for the SVM classifier, the best classification results were achieved when the polynomial kernel function was selected and the value of C was set to 2. For the LR classifier, the optimal classification results were obtained when the value of C was set to 0.4. And for the KNN classifier, the best classification results were achieved when the value of p was set to 7.
3.1. Establishment of Regression Model Based on Hyperspectral Characteristics
Using full-spectrum spectral data based on different varieties of rice, we constructed three classification models: SVM, LR, and KNN, after preprocessing with SG and MSC. The modeling results are shown in
Table 1. From the data in the table, the average classification accuracies of the SVM, LR, and KNN models were 91.58%, 93.51%, and 41.91%, respectively. In terms of model classification results, the LR model exhibited higher classification accuracy, indicating that using full-spectrum hyperspectral data for modeling achieved good results.
3.2. Establishment of a Regression Model Based on Image Texture Information
In this study, multiple texture features were extracted from the images under test, including mean, standard deviation, contrast, dissimilarity, homogeneity/inverse variance, angular second moment, energy, entropy, and maximum probability. These features were used as the primary descriptors to determine the classification of the images. The classification results based on these texture features are presented in
Table 1. As can be seen from the table, the accuracies of SVM, LR, and KNN were 33.29%, 34.83%, and 24.39%, respectively. Although these texture features play a certain role in image classification, their performance on this dataset was not ideal.
3.3. Establishment of a Regression Model Based on the Fusion of Spectral Data and Image Texture Information
The classification accuracy of image feature-based models is significantly lower than that of models based on spectral data, indicating that spectral information contains more discriminative features than image features. To fully leverage the advantages of both information sources, further exploration was conducted on the fusion method of spectral data and image texture information. The classification results based on the fusion of spectral data and image texture information are presented in
Table 1. Through the fusion of data, the classification performance was significantly improved, with the accuracy of SVM, LR, and KNN increasing to 94.81%, 96.14%, and 58.95%, respectively.
3.4. Discussion
From the perspective of the fusion data classification results, the integration of spectral and texture information has significantly improved the effectiveness of model evaluation and detection accuracy compared to using spectral or texture information alone. However, the high-dimensional data generated by data fusion complicates the classification models, increases the amount of data processing, and may reduce the processing speed of the models. Despite limited improvement in classification accuracy by adding texture information, its potential in hyperspectral image features for variety classification remains significant and can serve as an important feature input. This study demonstrates that combining multiple information sources, such as spectral and texture information, can enhance classification performance in rice variety identification.
In this study, a new data matrix was created by fusing full-spectrum and texture values. The specific method for this fusion process is illustrated in
Figure 5. Using the preprocessed spectral data with 462 bands’ intensity values and the image’s nine texture values, a dataset was constructed for modeling and analysis. This dataset was then used as input for machine learning classification models.
4. Conclusion
This study utilized hyperspectral imaging technology to acquire spectral, image, and fused information features from rice hyperspectral images. Classification models were constructed for six different varieties of rice using machine learning methods such as logistic regression (LR), support vector machines (SVM), and k-nearest neighbors (KNN). The classification accuracy of the three models was compared. The results showed that the accuracy of both the SVM and LR classification models exceeded 90%, with the LR model performing optimally and efficiently classifying rice varieties.
The findings indicated that a single feature is insufficient to comprehensively reflect the similarities and differences among rice seeds. Therefore, the adoption of multi-feature fusion as input data for the models enhanced their prediction accuracy. Additionally, the combination of hyperspectral imaging technology and machine learning, utilizing spectral, texture, and fused data to establish classification models, provided a reliable basis for rice variety classification. This study demonstrates the potential of hyperspectral imaging in precision agriculture, particularly in crop variety identification and classification tasks.
Funding
This work was supported by the Natural Science Foundation of Jilin Province (YDZJ202201ZYTS510,20230101187JC).
Data Availability
Data underlying the results presented in this paper are not publicly available at this time but may be obtained from the authors upon reasonable request.
Disclosures
The authors declare no conflicts of interest.
References
- Su, Q (Su Qian);Wu, WJ (Wu Wen-jin);Wang, HW (Wang Hong-wu);Wang, K (Wang Ku);An, D (An Dong).Fast discrimination of varieties of corn based on near infrared spectra and biomimetic pattern recognition.[J].Guangpuxue Yu Guangpu Fenxi,2010,Vol.29(9): 2413-2416. [CrossRef]
- Cong, SL (Cong Sunli);Sun, J (Sun Jun);Mao, HP (Mao Hanping);Wu, XH (Wu Xiaohong);Wang, P (Wang Pei);Zhang, XD (Zhang Xiaodong).Non-destructive detection for mold colonies in rice based on hyperspectra and GWO-SVR.[J].J Sci Food Agric,2018,Vol.98(4): 1453-1459. [CrossRef]
- Mishra P, Cordella C B Y, Rutledge D N, et al. Application of independent components analysis with the JADE algorithm and NIR hyperspectral imaging for revealing food adulteration[J]. Journal of Food Engineering, 2016, 168: 7-15. [CrossRef]
- Yan Mingzhuang, Wang Haoyun, Wu Yuanyuan, Cao Xuelian, Xu Huanliang. Detection of Chlorophyll Content in Epipremnum aureum Based on Spectral and Texture Feature Fusion[J]. Journal of Nanjing Agricultural University, 2021, Vol. 44, No. 3, P568-575 1000-2030.
- Wang, L.; Liu, D.; Pu, H.; Sun, D.-W.; Gao, W.; Xiong, Z. Use of hyperspectral imaging to discriminate the variety and quality of rice[J].Food Anal. Methods 2015, 8, 515−523. [CrossRef]
- Weng Shizhuang, Tang Peipei, Zhang Xueyan, Xu Chao, Zheng Ling, Huang Linsheng, Zhao Jinling. Nondestructive Identification of Famous and Excellent Rice Based on Spectral Characteristics of Hyperspectral Imaging and Convolutional Neural Network[J]. Spectroscopy and Spectral Analysis, 2020, Vol. 40, No. 9, P2826-2833, 1000-0593.
- Jie Hao;Fujia Dong;Yalei Li;Songlei Wang;Jiarui Cui;Zhifeng Zhang;Kangning Wu.Investigation of the data fusion of spectral and textural data from hyperspectral imaging for the near geographical origin discrimination of wolfberries using 2D-CNN algorithms[J]. Infrared Physics & Technology 2022 Vol.125 P104286 1350-4495. [CrossRef]
- Baichuan Jin, Chu Zhang, Liangquan Jia, Qizhe Tang, Lu Gao, Guangwu Zhao, Hengnian Qi Identification of Rice Seed Varieties Based on Near-Infrared Hyperspectral Imaging Technology Combined with Deep Learning[J].ACS omega 2022 Vol.7 No.6 P4735-4749 2470-1343. [CrossRef]
- Luan Xinxin, Zhai Chen, An Huanjiong, Qian Chengjing, Shi Xiaomei, Wang Wenxiu, Hu Liming. Application of Molecular Spectroscopy Information Fusion to Discriminate Rice from Different Origins [J]. Spectroscopy and Spectral Analysis, 2023, Vol. 43 (9): 2818-2824.
- Liu Yande, Wang Shun. Non-destructive detection of navel orange shelf life based on image and spectroscopy fusion hyperspectral imaging[J]. Spectroscopy and Spectral Analysis, 2022, Vol. 42, Issue 6, P1792-1797, 1000-0593.
- Sun, Jun; Zhang, Lin; Zhou, Xin; Yao, Kunshan; Tian, Yan; Nirere, Adria.A method of information fusion for identification of rice seed varieties based on hyperspectral imaging technology[J].Journal of Food Process Engineering,2021,Vol.44(9): e13797. [CrossRef]
- Xia, Chao;Yang, Sai;Huang, Min;Zhu, Qibing;Guo, Ya;Qin, Jianwei. Maize seed classification using hyperspectral image coupled with multi-linear discriminant analysis[J]. Infrared Physics & Technology 2019 Vol.103 P103077 1350-4495. [CrossRef]
- Abbaszadeh M, Hezarkhani A, Soltani-Mohammadi S. Proposing drilling locations based on the 3D modeling results of fluid inclusion data using the support vector regression method[J]. Journal of Geochemical Exploration, 2016, 165:23-34. [CrossRef]
- Sun, J., Zhou, X., Hu, Y., Wu, X., Zhang, X., & Wang, P. (2019). Visualizing distribution of moisture content in tea leaves using optimization algorithms and NIR hyperspectral imaging[J]. Computers and Electronics in Agriculture, 160, 153– 159. [CrossRef]
- Abbaszadeh M, Hezarkhani A, Soltani-Mohammadi S. Proposing drilling locations based on the 3D modeling results of fluid inclusion data using the support vector regression method[J]. Journal of Geochemical Exploration, 2016, 165:23-34. [CrossRef]
- Lavalley M P. Logistic regression [J]. Circulation, 2008, 117(18): 2395-9. [CrossRef]
- Xu Liying. Research on Video Texture Recognition Algorithm Based on LBP and KNN [D]. Changchun: Jilin University, 2015: 1-39.
- Awanthi,M.G.G., Jinendra, B.M.S.,Navaratne,S.B.,& Navaratne,C.M.(2019).Adaptation of visible and short wave near infrared (VIS-SW-NIR) common PLS model for quantifying paddy hardness. Journal of Cereal Science, 89, 102795. [CrossRef]
- Sun Jun. Prediction Model of Rice Protein Content Based on Hyperspectral Imaging and Deep Features [J]. Transactions of the Chinese Society of Agricultural Engineering, 2019, 35(15): 295-303.
- Li Nan; Liang Ming; Huo Hong; Fang Tao. High resolution remote sensing image segmentation based on improved JSEG algorithm [J]. Journal of Xi’an University of Science and Technology, 2007, (1):58-62.
- Ye Wenchao, Luo Shuiyang, Li Jinhao, Li Zhaorong, Fan Zhiwen, Xu Haitao, Zhao Jing, Lan Yubin, Deng Haidong, Long Yongbing. Classification Method of Hybrid Rice Seeds Based on the Fusion of NIR Spectroscopy and Imaging [J]. Spectroscopy and Spectral Analysis, 2023, Vol. 43 (9): 2935-2941.
|
Disclaimer/Publisher’s Note: The statements, opinions and data contained in all publications are solely those of the individual author(s) and contributor(s) and not of MDPI and/or the editor(s). MDPI and/or the editor(s) disclaim responsibility for any injury to people or property resulting from any ideas, methods, instructions or products referred to in the content. |
© 2024 by the authors. Licensee MDPI, Basel, Switzerland. This article is an open access article distributed under the terms and conditions of the Creative Commons Attribution (CC BY) license (http://creativecommons.org/licenses/by/4.0/).
