Preprint
Article

Optimization of Process Parameters of Friction Stir Welded Dissimilar Aluminium Alloys (AA6061 and AA8011) Using Response Surface Methodology

Altmetrics

Downloads

112

Views

39

Comments

0

This version is not peer-reviewed

Submitted:

12 March 2024

Posted:

15 March 2024

You are already at the latest version

Alerts
Abstract
Friction stir welding (FSW) is a solid state welding process for joining metallic alloys and dissimilar metals. It has emerged as an alternative technology for welding high strength alloys that are difficult to join with conventional techniques. FSW is used to produce products with better mechanical properties. Now a days aluminum alloys have been widely used in several industrial applications such as aerospace, marine, automobile and commercial applications due to their light weight structure, better mechanical properties and high corrosion resistance.In this work, three welding parameters such as spindle speed, welding speed and plunge depth were considered for friction stir welding. FSW was carried out between dissimilar aluminum alloy plates (AA6061 and AA 8011) to produce butt joint.A Box-Behnken design with three factors and three levels was chosen to minimize the number of experimental conditions .The tensile strength and hardness of the welded regions were evaluated. The optimum level settings and the major parameters that influence the joint strength were obtained by Box-Behnken design.
Keywords: 
Subject: Engineering  -   Mechanical Engineering

1. Introduction

Friction-stir welding (FSW) is a solid-state joining process (meaning the metal is not melted during the process). Friction stir welding also produces a plasticized region of material, but in a different manner. A non-consumable rotating tool is pushed into the materials to be welded and then the central pin, or probe, followed by the shoulder, is brought into contact with the two parts to be joined. The rotation of the tool heats up and plasticizes the materials it is in contact with and, as the tool moves along the joint line, material from the front of the tool is swept around this plasticized annulus to the rear, so eliminating the interface. C.Elanchezhian et al., [1] have studied parameter optimization of friction stir welding of AA8011-6062 using mathematical method. It was identified that main influence parameter in FSW is rotational speed welding traversing speed and pressure applied against the joint. The results are analyzed by using ANOVA statistical tools shows the best weld quality by comparing the result obtained from tensile testing, impact testing and by micro-hardness testing. Ramanjaneyulu kadaganchi et al., [2] have studied the optimization of process parameters of aluminum alloy AA 2014-t6 friction stir welds by response surface methodology. This work presents the formulation of a mathematical model with process parameters and tool geometry to predict the responses of friction stir welds of AA 2014-T6 aluminum alloy, viz yield strength, tensile strength and ductility. The most influential process parameters considered are spindle speed, welding speed, tilt angle and tool pin profile. Manas Ranjan Panda et al., [3] have studied the parametric investigation of friction stir welding on AA6061 using Taguchi technique. This work proposes an experimental investigation, to analyze the effect of welding parameters such as welding speed, tool rotational speed and tool profile on welding strength. The experimental architecture was planned as per Taguchi’s L9 orthogonal array so as to extract maximum information with minimum experimental runs. The study revealed that welding speed is an important parameter for the variation of tensile strength. R.Padmanaban et al., [4] have studied the parameter optimization for friction stir welding of dissimilar aluminium alloys based on stimulated annealing. In this study, friction stir welding of dissimilar aluminium alloys AA2024-AA707 was performed at different tool rotation speeds and welding speeds as per central composite design with three factors and three levels for each factor. Response surface methodology used as a mathematical model for predicting the tensile strength of the resulting joints. Jawdat A et al., [5] have studied the FSW parameters such as tool rotational speed, welding speed, welding tool shoulder diameter, and welded plate thickness play a major role in determining the strength of joints. A central composite rotatable design with four factors and five levels was chosen to minimize the number of experimental conditions. Empirical relationship was established to predict the yield tensile strength and the hardness of friction stir welded aluminium alloys by incorporating independently controllable FSW process parameters. Response surface methodology (RSM) was applied to optimize the FSW parameters to attain maximum yield strength of a welded joints. G. Elatharasan et al.,[6] have studied the experimental analysis and optimization of process parameter on friction stir welding of AA 6061-T6 aluminum alloy using RSM. In this investigation central composite design technique and mathematical model was developed by response surface methodology with three parameters, three levels and 20 runs, was used to develop the relationship between the FSW parameters (rotational speed, traverse speed, axial force,) and the responses (tensile strength, Yield strength (YS) and %Elongation (%E) were established. H.Bisadi et al.,[7] have studied the experiments were performed to investigate the effects of FSW process parameter including rotational and welding speed on the microstructure and mechanical properties of aluminium 5083 alloy in butt joint welding and different joint effects were analyzed. It was observed that the nugget area had the best grain size and also the higher hardness in compare with the other welding area. Also, the best joint properties were achieved at the rotational speed of 825rpm and welding speed of 32mm/min.

2. Methodology

2.1. Response Surface Methodology

Response surface methodology (RSM) is a combination of experimental designs and statistical techniques for empirical model building and optimization. RSM was originally developed for the model-fitting of physical experiments by Box and Draper and later extended to other fields. RSM is very useful for modeling and analysis where a response of interest is influenced by several variables and the objective is to optimize this response. By conducting experiments and the posterior application of regression analysis a model of the response variable of interest is obtained. The real relationship between the response and the independent variables is unknown. For that reason, the first step in RSM is to find an approximation of the true functional relationship between the response and the independent variables. The observed response y, can be written as a function of the independent variables X1, X2, X3 ...XK, as follows
Y =f (X1, X2, X3…… XK) +ε
where ε is a random error. Plotting the expected response y, a surface known as the response surface is obtained. In this study, we use Box-Behnken design which are a class of rotatable or nearly rotatable second-order designs based on three-level incomplete factorial designs. Box-Behnken design have proposed some five-level designs for constructing response surfaces. These designs are formed by combining 2k factorials with incomplete block designs. Thus, Central composite design does not include any points at the vertices created by the upper and lower limits for each variable. This could be advantageous when the points on the corners of the cube represent factor-level combinations that are difficult or impossible to test because of physical process constraints.

3. Experimental Procedure

The experiments were conducted on a vertical milling machine (kodi 40) where a tool is mounted in an arbor with a suitable collate shown in the Figure 1. The vertical tool head can be moved along the vertical guide way (Z axis), the horizontal bed can be moved along X and Y axis. The aluminium alloy (AA6061and AA8011) chosen for the experimental study were 3mm thick plate of commercially available aluminium alloy (composition as given in Table 1). The weld faces of the test plates are machined on the same machine to obtain a perfect square butt joint and clamped in horizontal bed with zero root gaps aligned with the centre line of the FSW tool with the help of a special designed fixture and back plate as the plates needs to be tightly clamped to one another.

3.1. Dimensions of Butt Joint

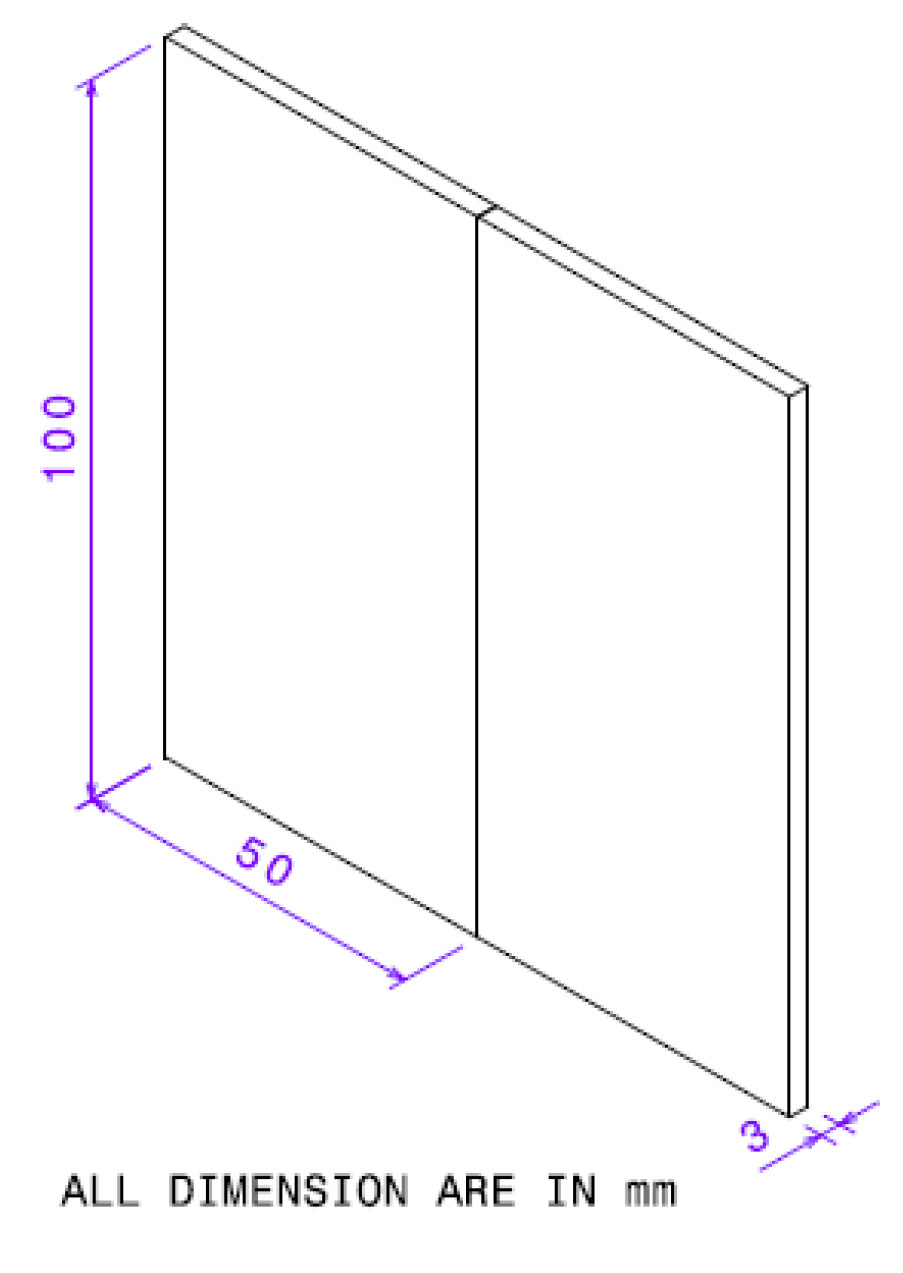
The Aluminium alloy plates (AA6061 and AA8011) has been cut into the required size (100×50×3mm) by power hacksaw cutting, butt joint was configured. Before welding the plates were weld side and edge are prepared to fabricate FSW joints.
Figure 2. Dimension for Butt joint.
Preprints 101198 g002

3.2. Tool Design

For the FSW tool the main components are pin and shoulder. The primary function of the pin is to deform the material around the tool and secondary function is to generate heat due to friction. In this investigation, the pin possesses the cylindrical face to increase friction and threaded with a shoulder diameter of 17.5mm, pin diameter of 5mm and height 4.65mm. Shoulder is the primary means of generating heat as it is in contact with the top surface of the joint while in motion and it prevents softening material to come out of the weld pool and assists material movement around the tool. It is necessary that the melting point temperature of the tool material should be higher than that of the work piece material to reduce the chances of tool wear. To minimize the HAZ in the present investigation a smaller diameter (17.5 mm) shoulder was chosen. The H-13 tool steel with a series of heat treatment processes to increase its machinability and hardness is used for the present investigation

4. Design of Experiments

Response surface methodology (RSM) is a collection of mathematical and statistical techniques useful for analysing the problems in which several independent variables influence a response. The objective of the response surface methodology is to find those settings of process parameters that give an optimum value of the response. The parameters identified for investigation are Spindle speed, welding speed, Plunge depth. Each of the above process parameters consists of three different levels. The process parameter and their levels are shown in Table 2.

4.1. Specimen Preparation for Tensile Strength

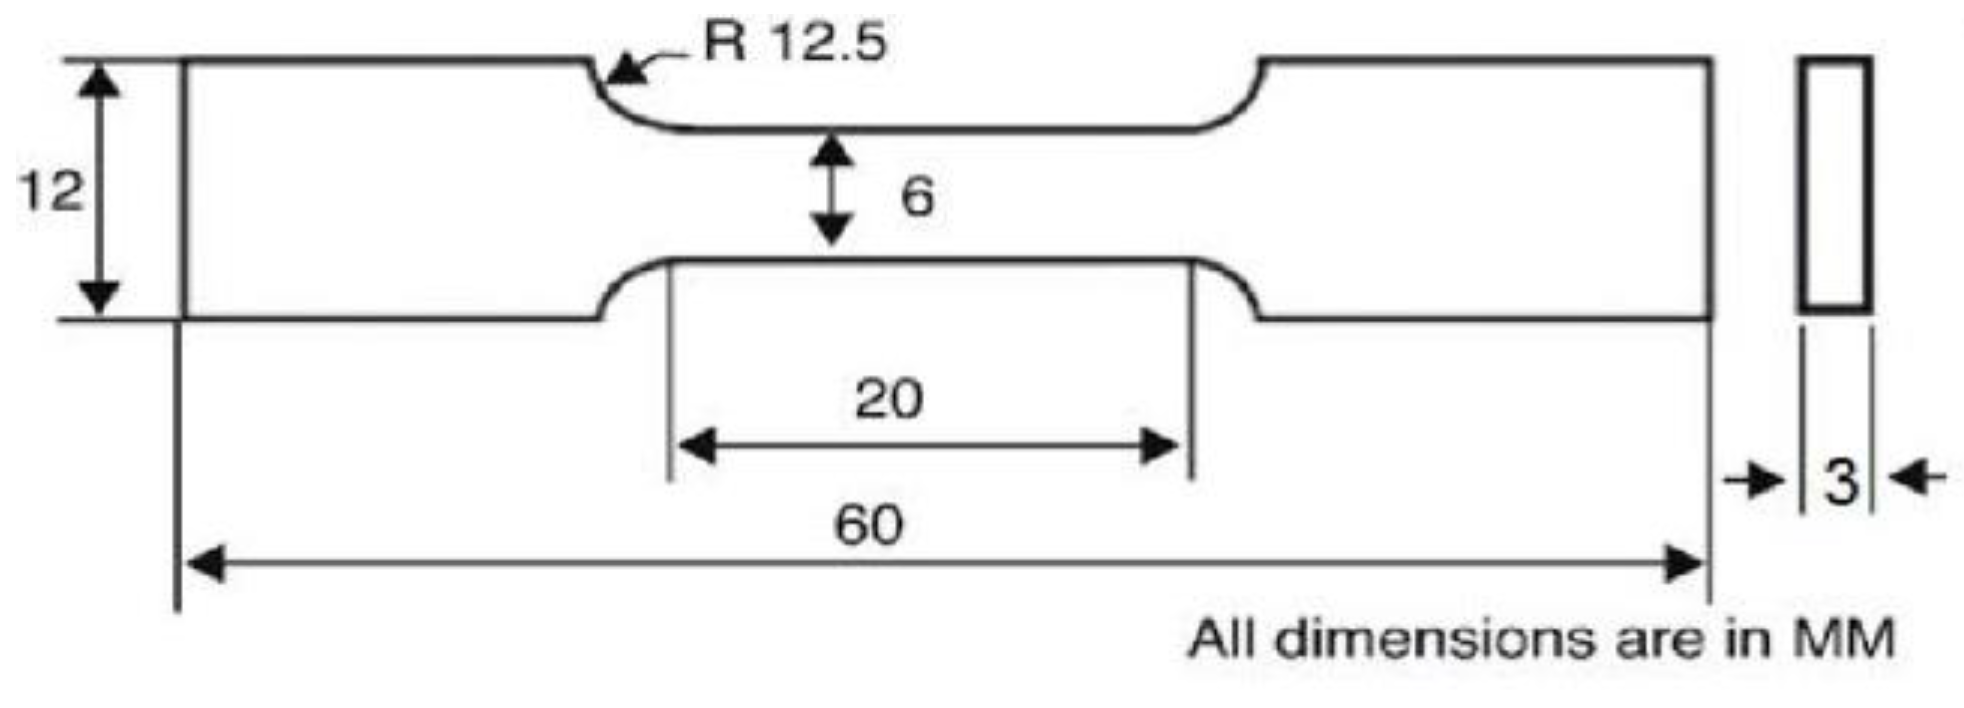
The welded joints are sliced using power hacksaw and then machined to the required dimensions to prepare tensile specimen as shown in Figure 3, these specimens are taken in the normal direction of the weld. The specimen is loaded and tensile specimen undergoes deformation. The tensile test on butt joint was conducted by using UTM (Universal testing machine).

4.2. Specimen Preparation for Hardness

The welded joints are cut by using power hacksaw and then machined the welded region to the remove burr. The welded surface is polished by using belt polishing machine. The hardness test was performed by using Brinell hardness testing machine. The diameter of the spherical indenter in will be 5 mm, the imposed load will be 15 Kg and the time of loading will be 15sec.

5. Results and Discussion

5.1. Optimization Software

Stat-Ease version 8 of Design-Expert software is used to optimize the parameters. This software provides highly efficient design of experiments (DOE) for:
  • Factorial Designs – Identify the vital factors that affect your process or product. Then you can make breakthrough improvements.
  • Response Surface Methods (RSM) – Find the ideal process settings. Achieve optimal performance.
  • Mixture design techniques – Discover the optimal formulation.
  • Combined designs - Combine process variables, mixture components and categoric factors in one design.

5.2. Design Matrix with Responses

Design matrix of the welding parameters were given by Design Expert software as shown in Table 4. In this study, Box-Behnken design of Response surface methodology was carried out and the total experiments selected was seventeen. The Number of centre blocks selected was one.

5.3. Checking for Adequacy of Model

The adequacy of the developed model is tested using the analysis of variance (ANOVA) technique and the results of second order response surface model fitting in the form of analysis of variance. ANOVA for tensile strength and hardness are shown in Table 5 and Table 6 respectively. If the calculated value of Fratio of the developed model is less than the standard Fratio (from F-table) value at a desired level of confidence 95%, then the model is said to be adequate within the confidence level. The value of prob > F for three developed models is less than 0.05 (95% Confidence level), which indicates that the model is significant and lack of fit is not significant, as desired. All the above considerations indicate an excellent adequacy of the regression models. All the coefficients were estimated and tested by applying ‘F-test’ using trial version of Design-Expert software for their significance at a 95% confidence level. After determining the significant coefficients, the final model was developed to predict the ultimate tensile strength (Eq (2))and hardness (Eq (3)) of FSW joints of AA6061 and AA8011 aluminium alloys as given below:
Tensile strength= +58.43125-0.049062x1-19.975x2-285.25x3+0.095750x1x2
-0.245x1x3-87.00x2x3+2.50000E-006x12-42.7x22+3500.00x32
Hardness= +219.34375+0.21813x1-16.75x2+67.50x3-5.00000E-003x1x2
+2.39860E-016x1x3-50.00x2x3+8.43750E-005x12+12.500x22 -150.00x32
where y=Tensile strength (UTS) or Hardness, X1=Spindle speed, X2=Welding speed, X3=Plunge depth
From the regression models, the effects of friction stir welding process parameters viz. tool rotational speed, welding speed and plunge depth on ultimate tensile strength and hardness of friction stir welded joints were evaluated. The three operating parameters considered directly affect on generation of frictional heat and causes the plastic flow of the material. It is observed that when the combinations of parameters create very low or very high frictional heat and material flow, then lower tensile strength is observed. Therefore, the friction stir welded joints of aluminum alloys have lower tensile elongation than that of the base metal. The possible causes for the effects of different welding parameters on tensile strength and hardness are interpreted as follows.

5.4. Effect of Process Parameters on Tensile Strength

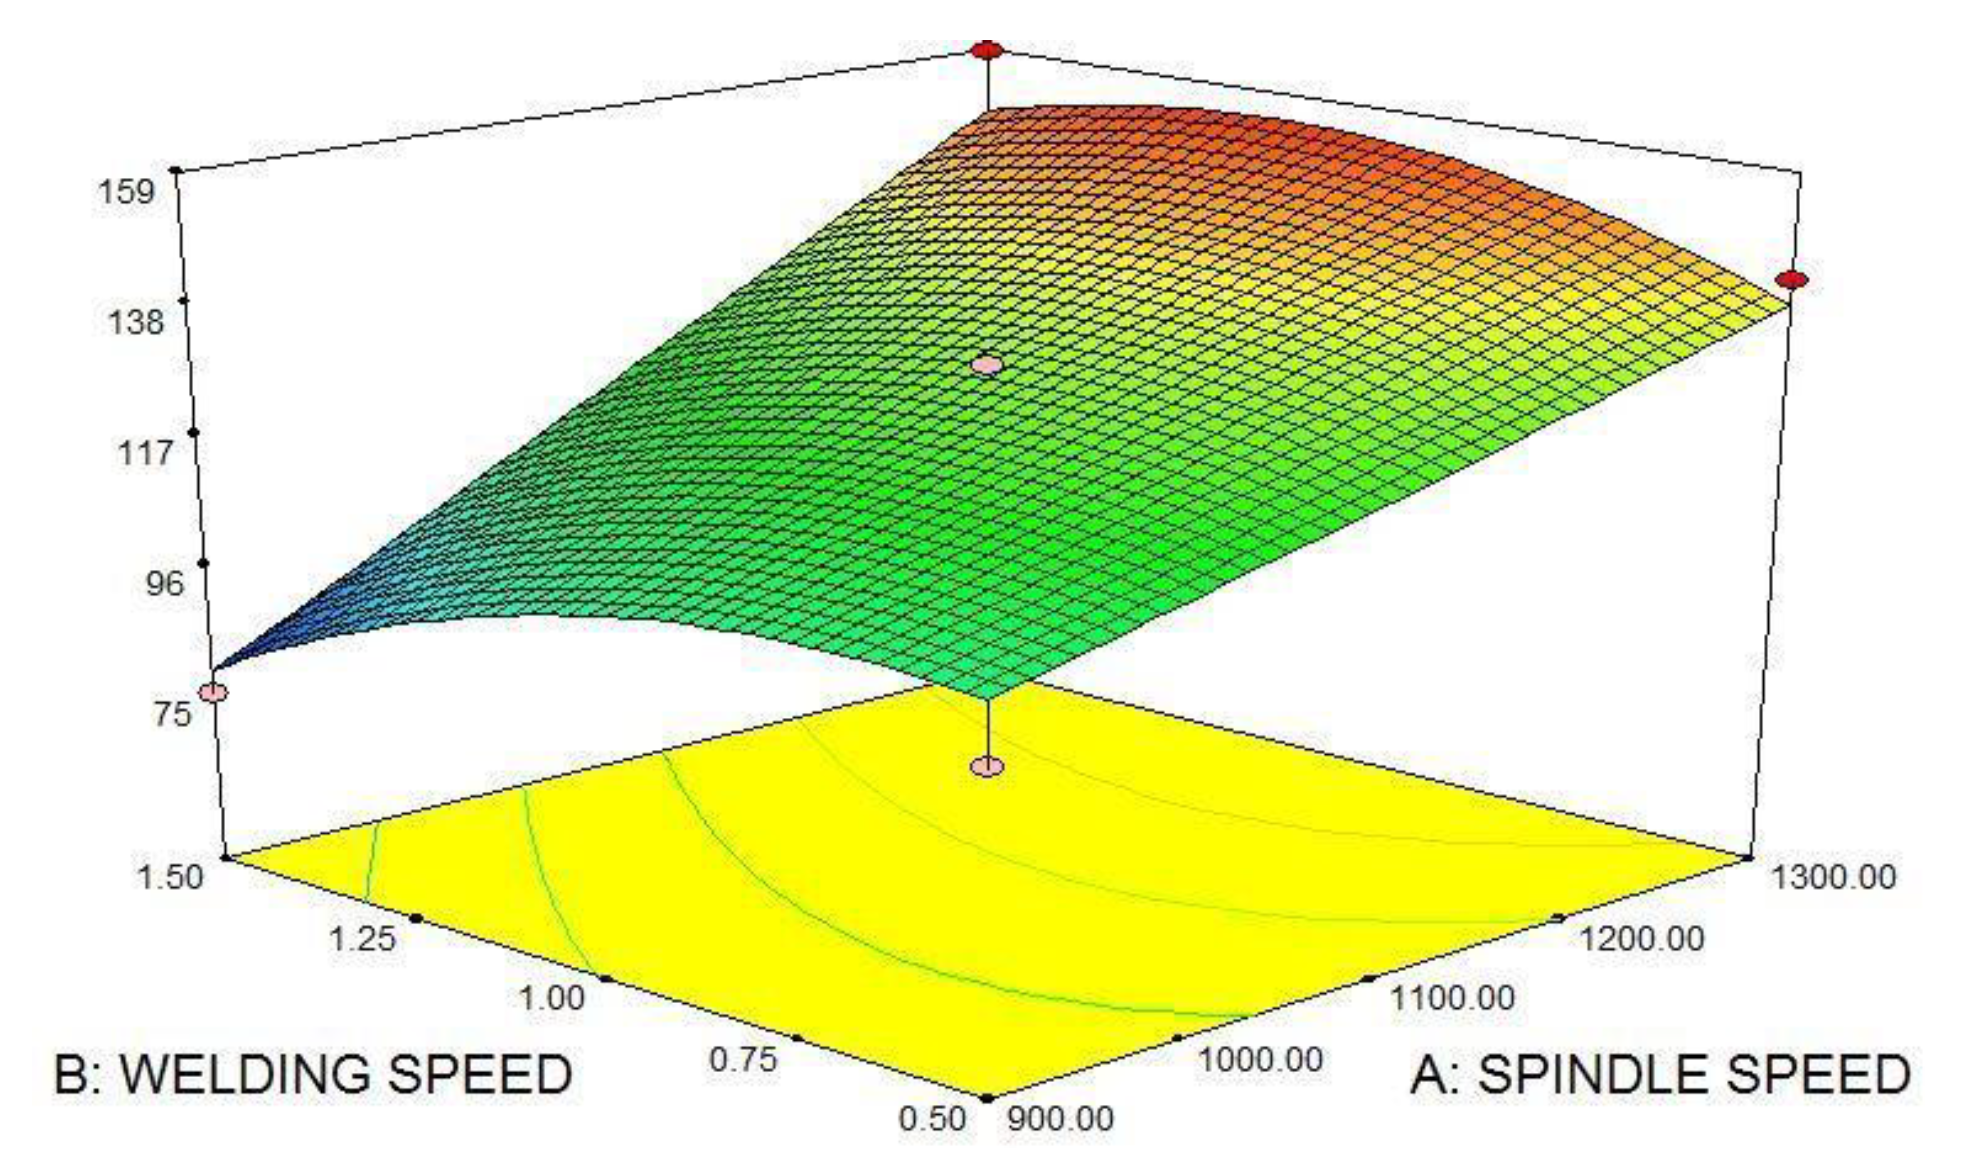
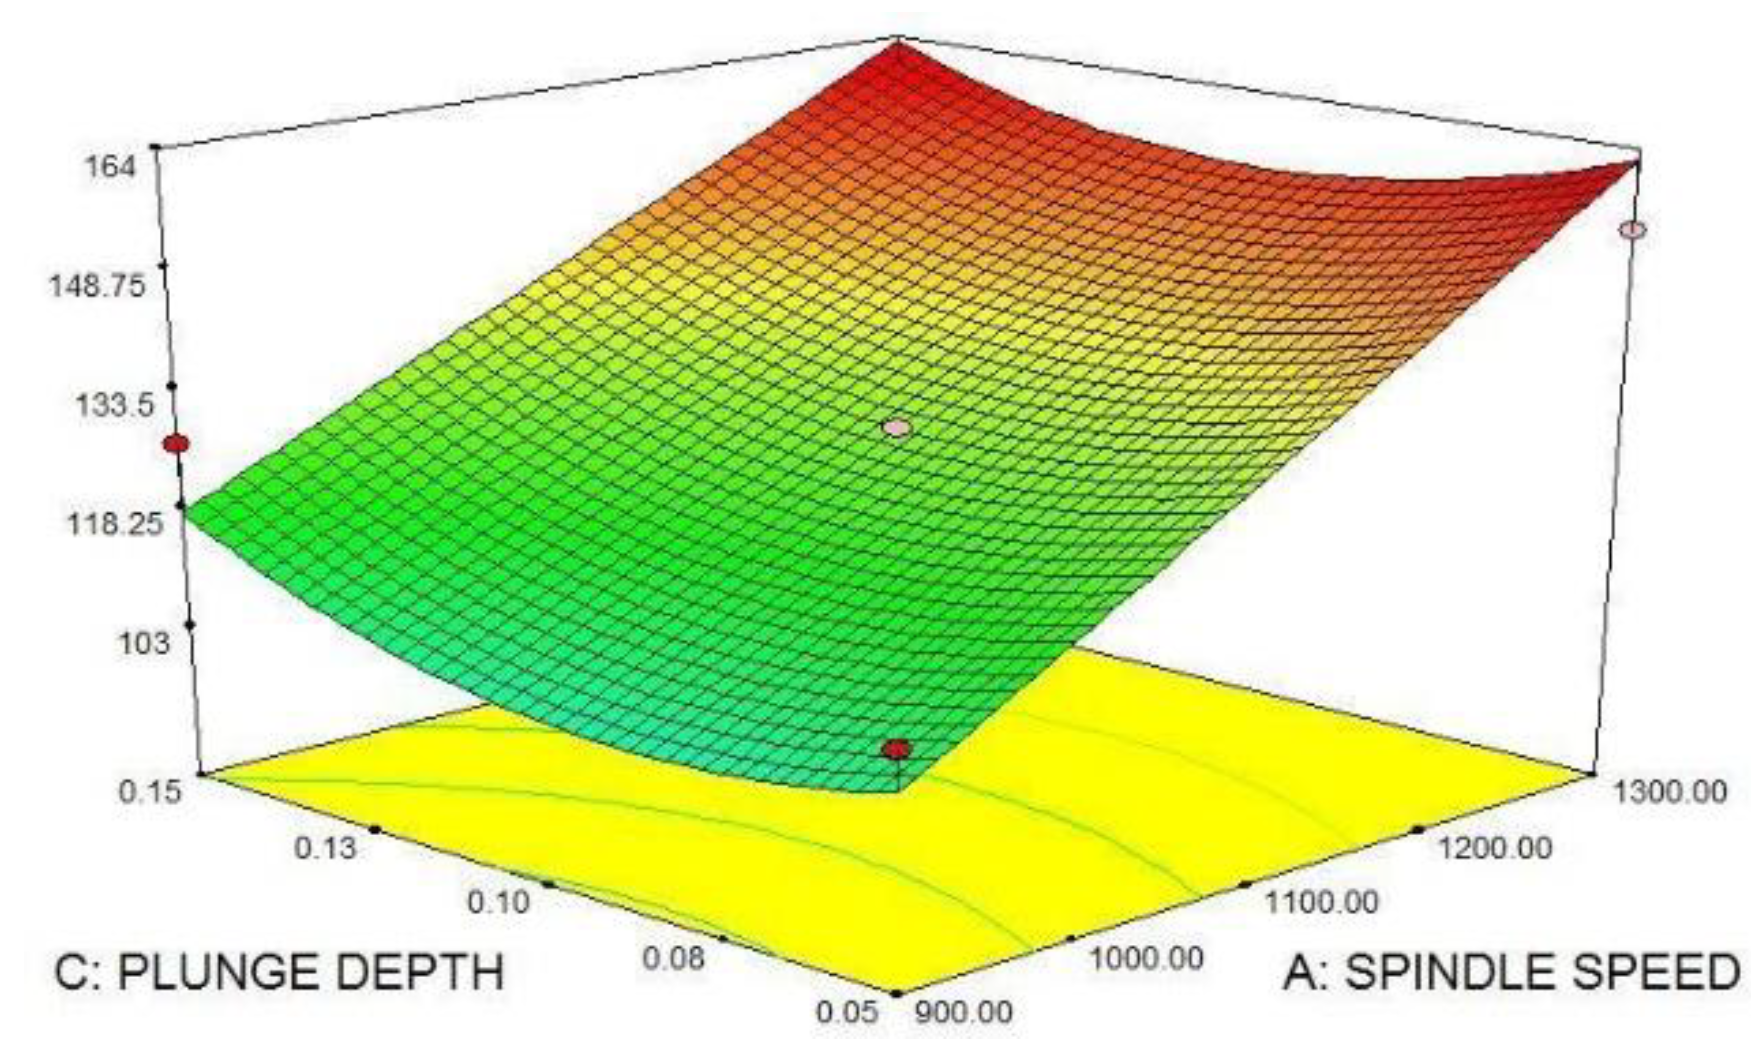
The significant terms identified based on Eq.(2), are spindle speed(x1),welding speed (x2), plunge depth(x3) interaction effect of spindle speed & welding speed (x1x2), welding speed & plunge depth (x2x3),spindle speed & plunge depth(x1x3). Based on Eq. (2) and Figure 4, Figure 5 and Figure 6 the effects of tool rotational speed and traverse speed on ultimate tensile strength can be analyzed, the increase in tool rotational speed with traverse speed resulted in the increased tensile strength of friction stir welded joints. Based on the ANOVA Table 5, the welding speed and plunge depth does not significant effect on the tensile strength.

5.5. Effect of Process Parameters on Hardness

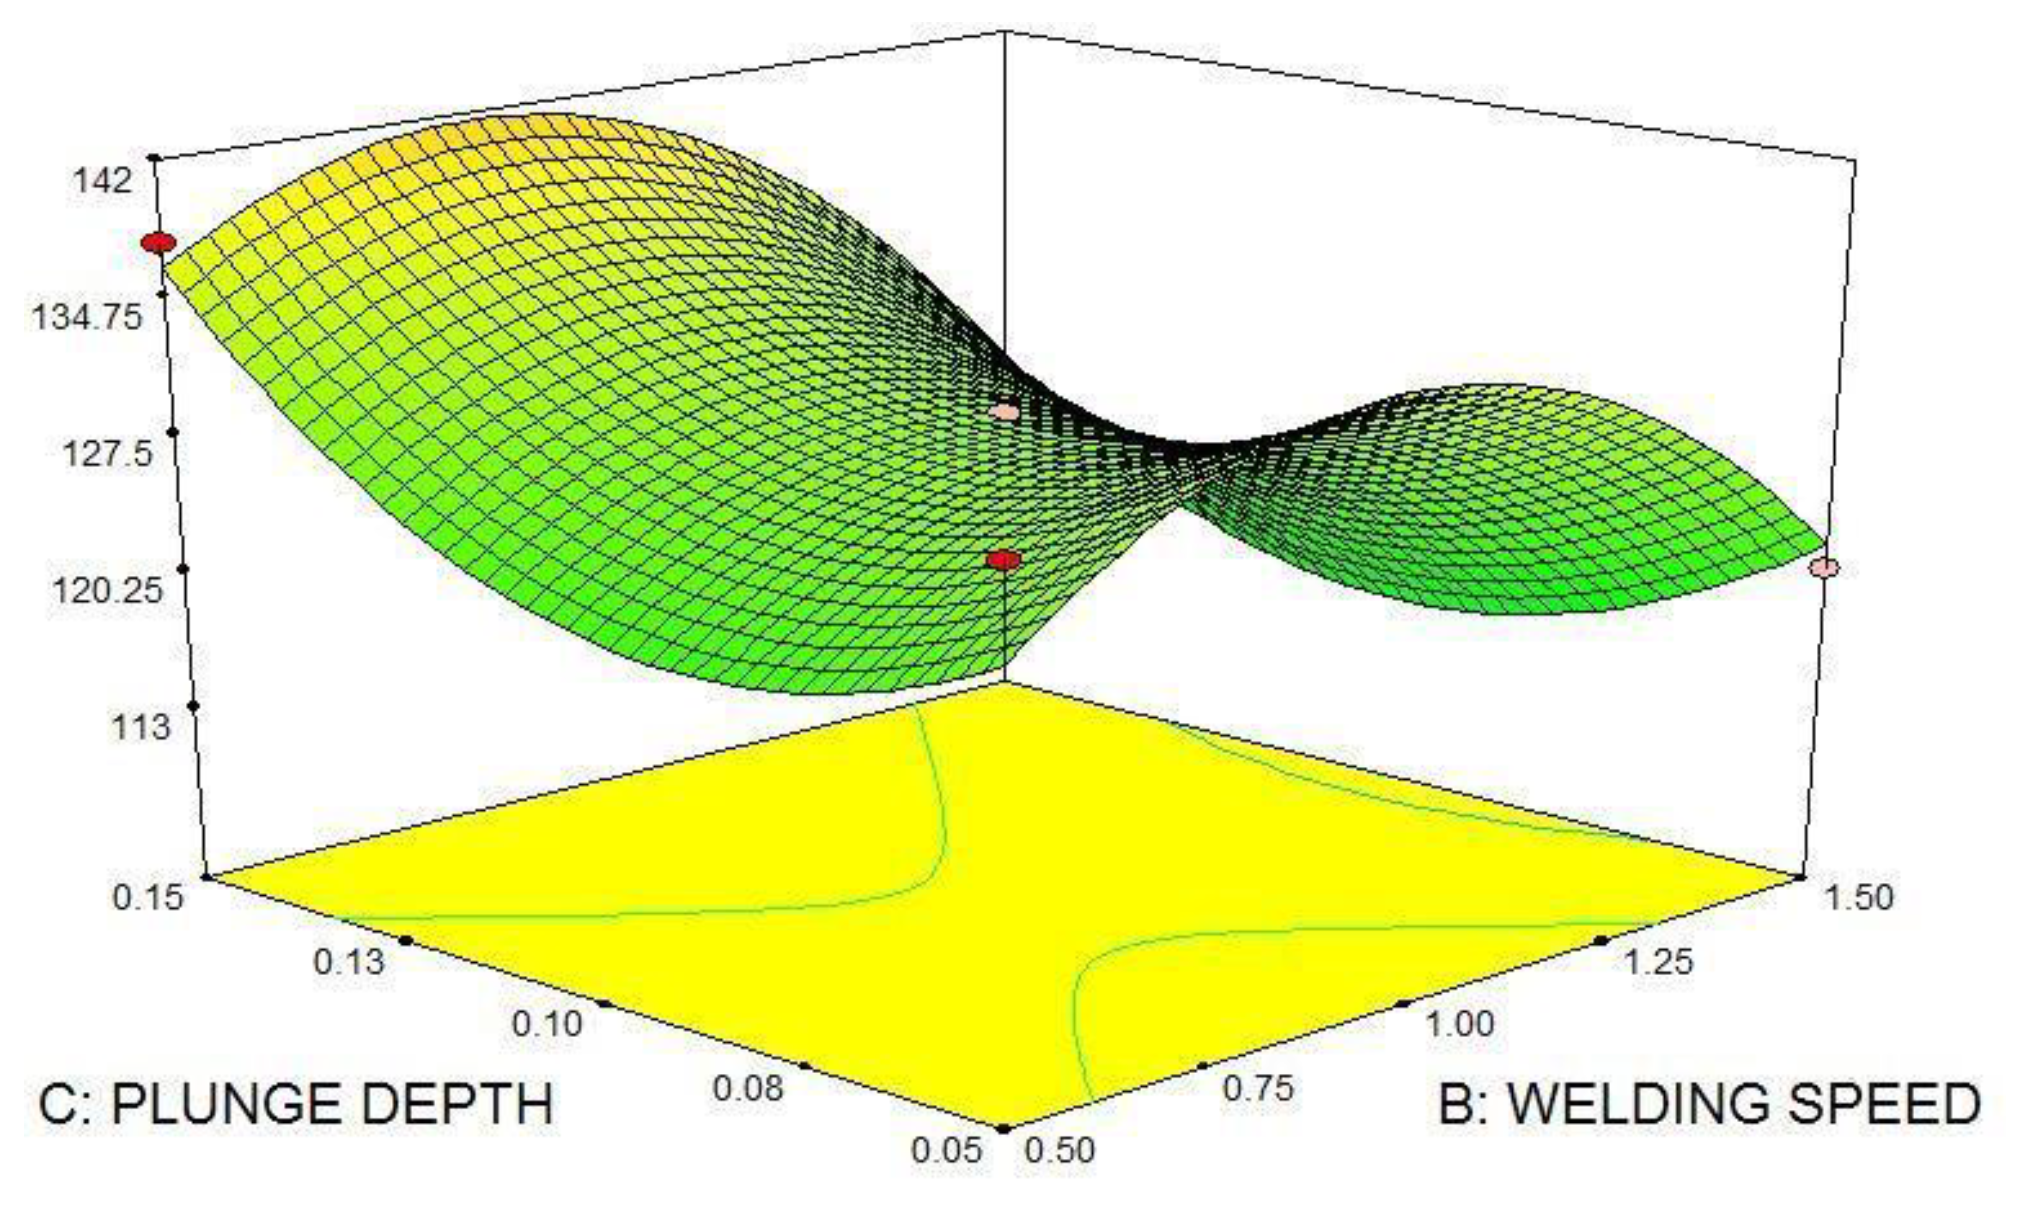
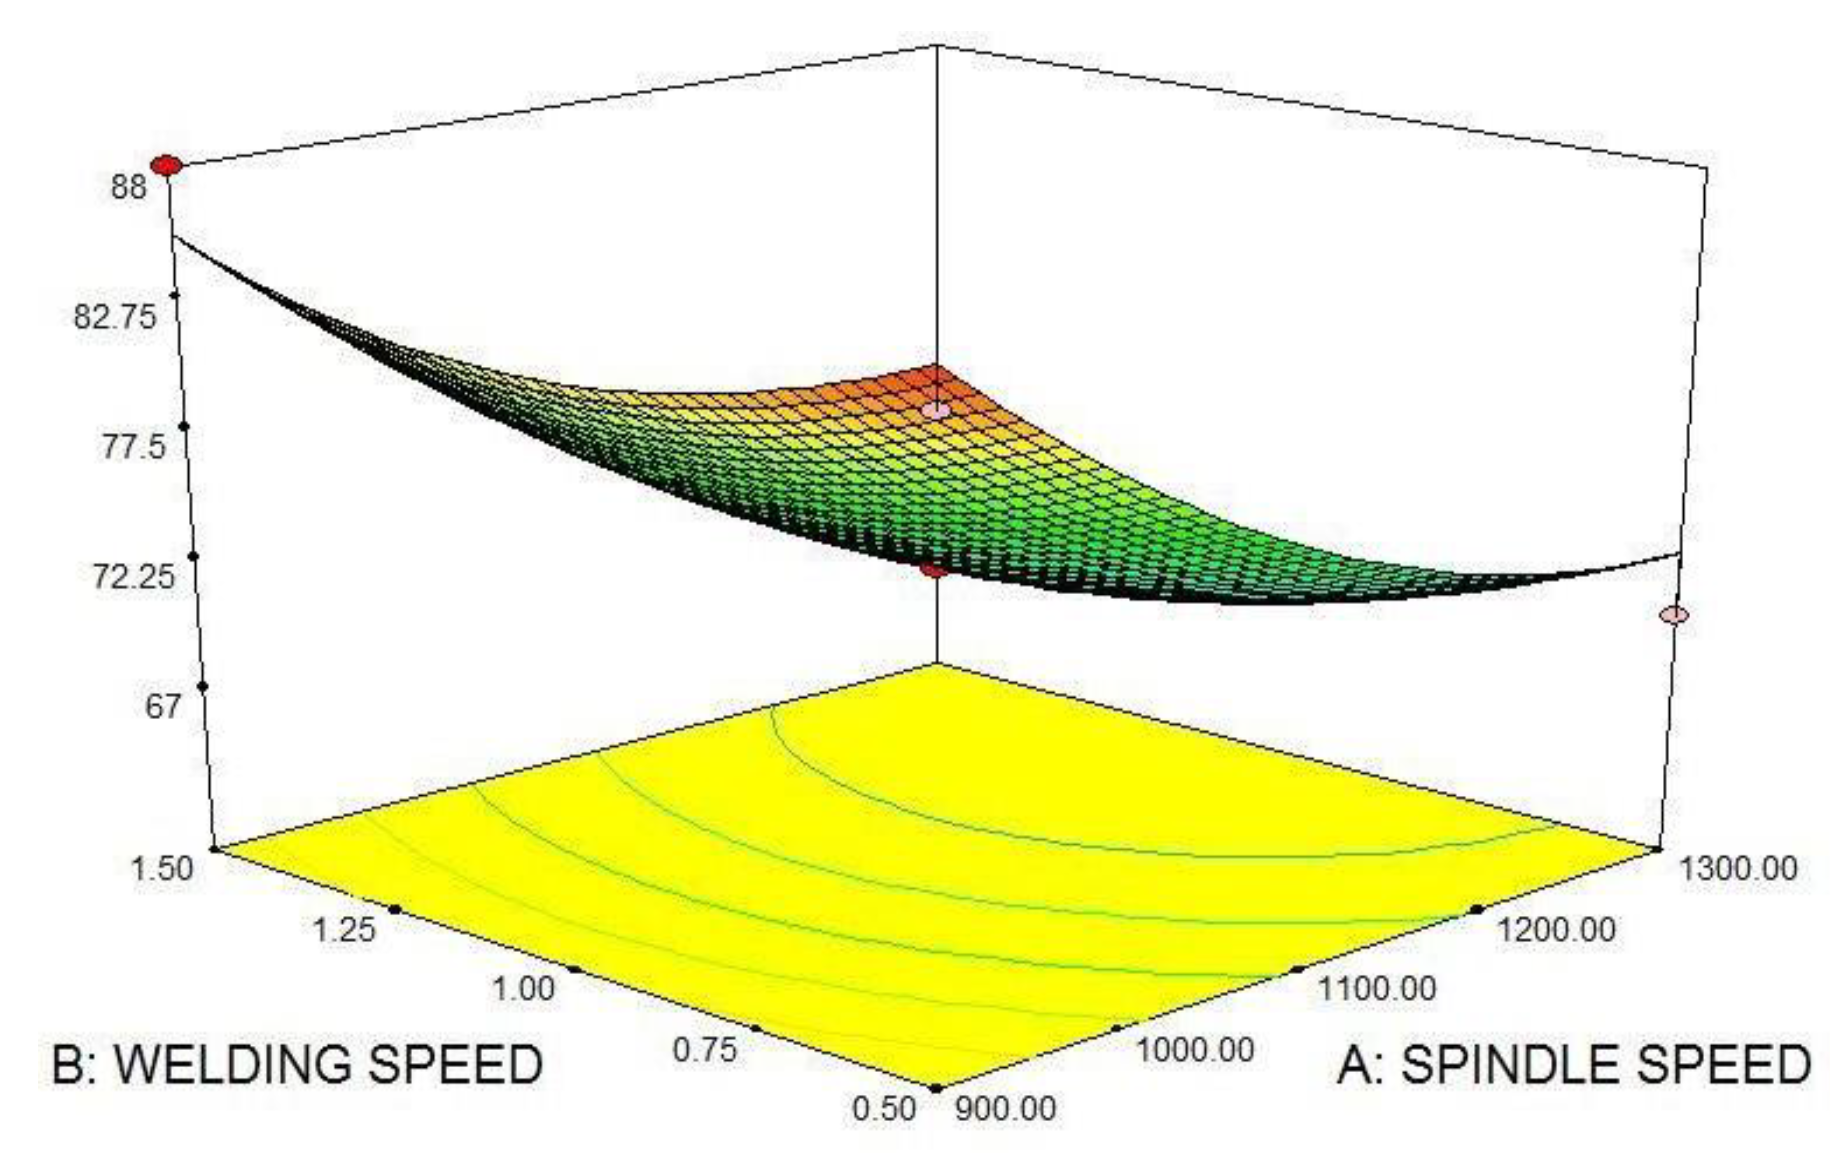
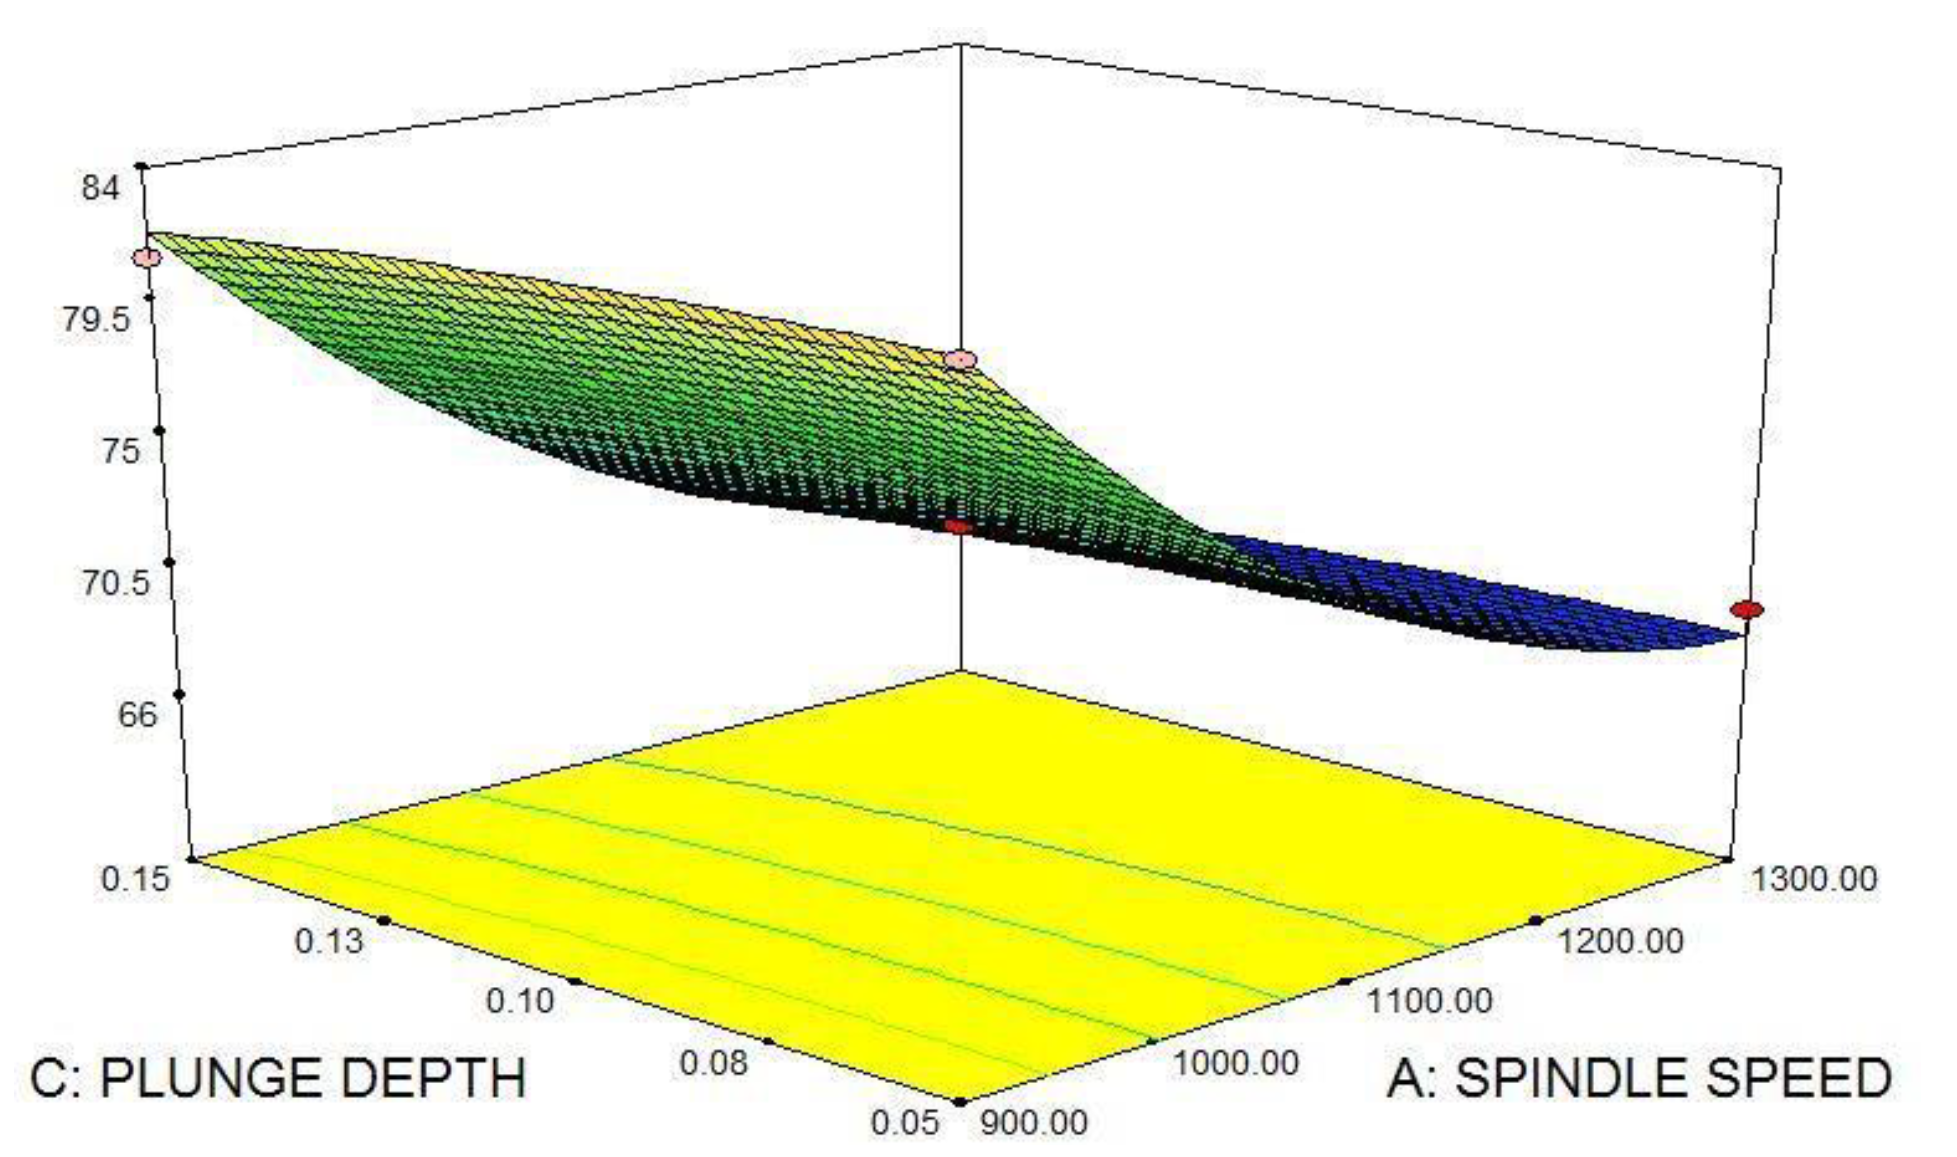
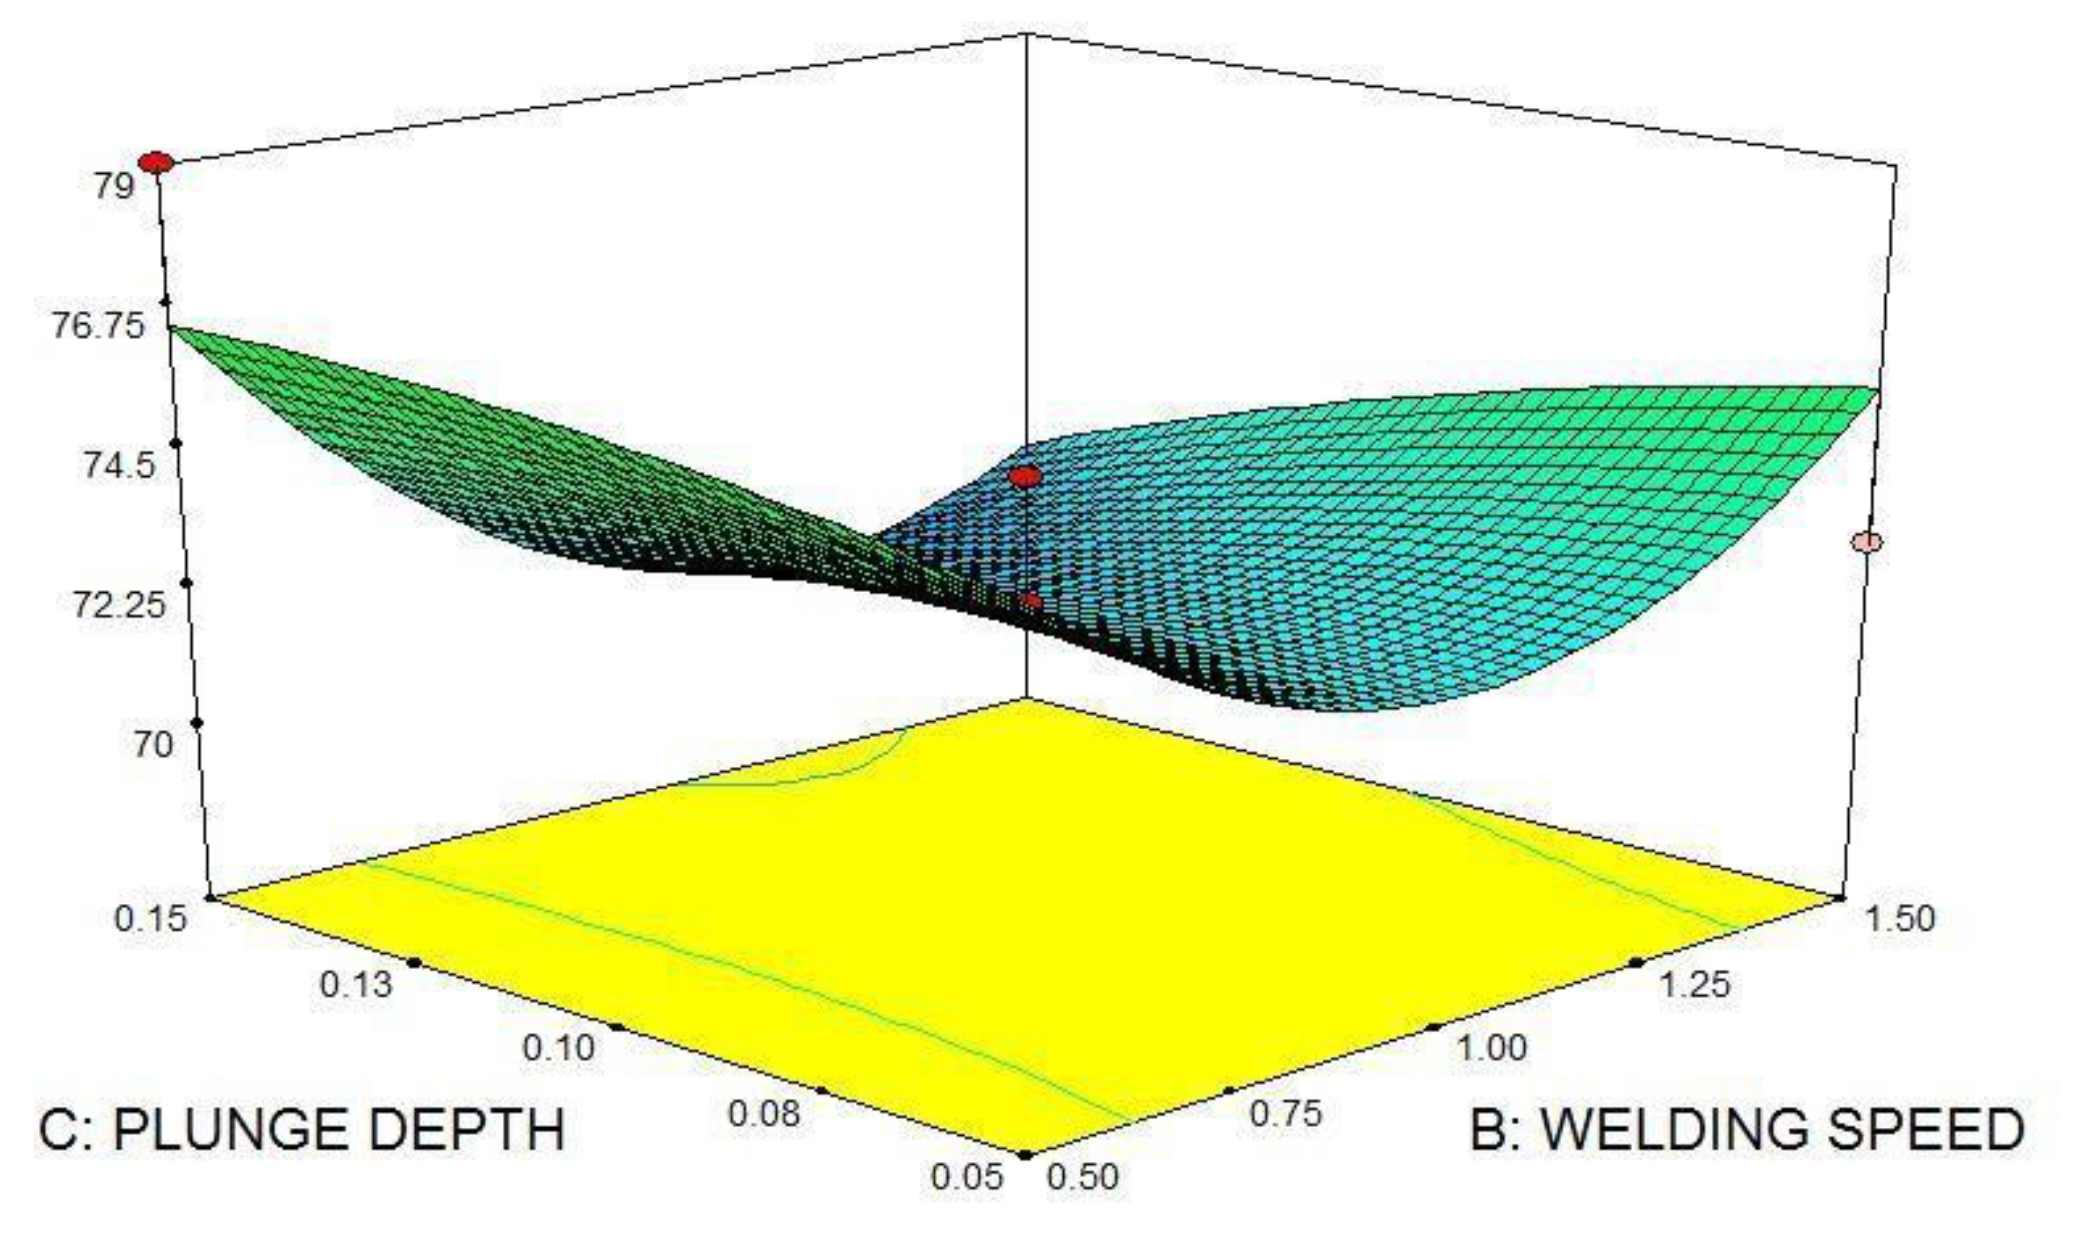
The significant terms identified based on Eq. (3), are spindle speed(x1), welding speed (x2), plunge depth(x3) interaction effect of spindle speed & welding speed (x1x2), welding speed & plunge depth (x2x3),spindle speed & plunge depth(x1x3). Based on Eq. (3) and Figure 7, Figure 8 and Figure 9 the effects of tool rotational speed and traverse speed on hardness can be analyzed, the increase in tool rotational speed with traverse speed resulted in the decreased hardness of friction stir welded joints. Based on the ANOVA Table 6, the welding speed and plunge depth does not significant effect on the hardness.

5.6. Optimizing the Process Parameters
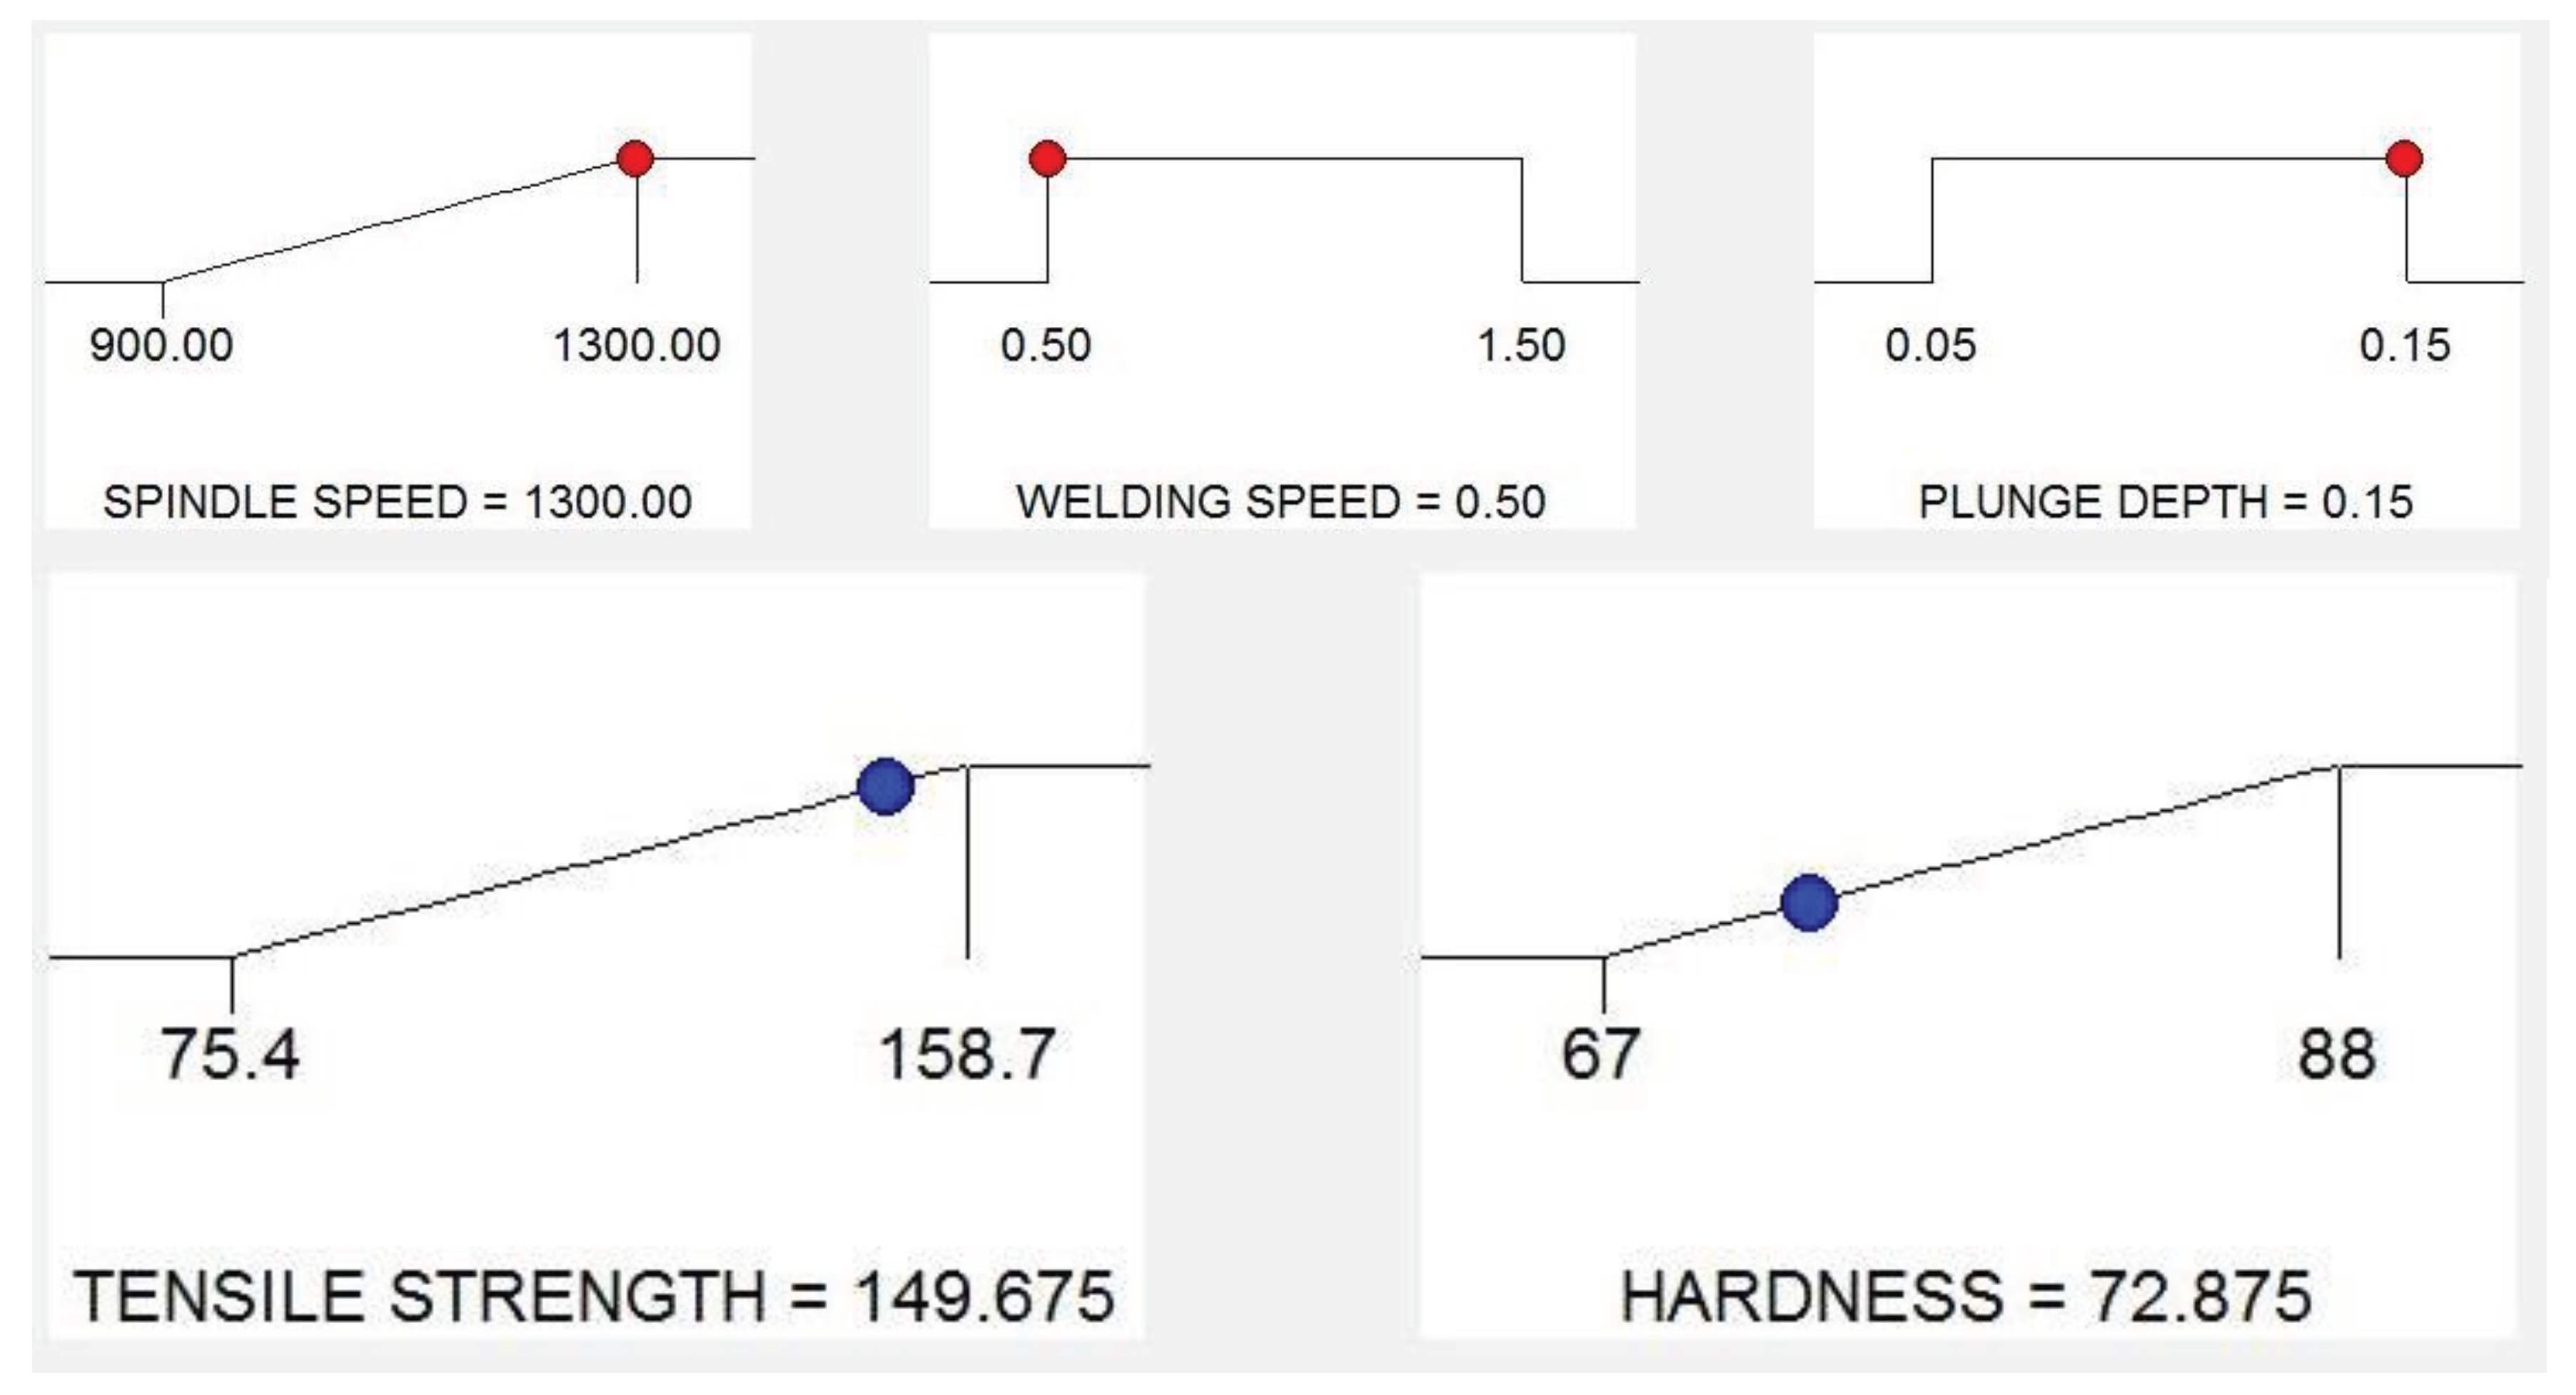
One of the most important aims of this investigation was to maximize the tensile strength and hardness of Friction stir welded joints of AA6061 and AA8011 and also, find the optimum process parameters from the mathematical model developed. Derringer and Suich describes a multiple response method called desirability this method used to solve multiple response optimization problems, combines multiple responses into a dimensionless measure of performance called the overall desirability function. In which the desirability ranges between 0 and1. The optimum mechanical properties (tensile strength and hardness) obtained from above technique are 149.65 MPa and 72.875 BHN respectively.
Figure 10. Optimal solution for mechanical properties.
Preprints 101198 g010

6. Conclusions

The optimization of friction stir welding process parameters for dissimilar aluminium alloys by using Box-Behnken design has been completed successfully. Experiments were conducted for various combinations by Spindle speed, welding speed and plunge depth at 3 levels. The tensile strength, hardness of the joint was analyzed. Regression equations were developed based on the experimental values of ultimate tensile strength and hardness of the friction stir welded joints of aluminum alloy AA 6061 and AA8011. Spindle speed has been found to be the most significant parameter which affects tensile strength and hardness. Tensile strength of friction stir welded joints increased with the increase of spindle speed up to a maximum value, and then decreased. Hardness of friction stir welded joints decreased with the increase of spindle speed. The optimal mechanical properties (tensile strength and hardness) obtained from the response surface model obtained at spindle speed of 1300 rpm, welding speed of 0.5 mm/s and plunge depth of 0.15mm is found to be 149.675Mpa and 72.875 BHN respectively

References

  1. C.Elanchezhian, B.Vijaya Ramnath, P.Venkatesan, S.Sathish,T.Vignesh, R.V.Siddharth, B.Vinay, K. Gopinath “Parameter Optimization of Friction Stir Welding Of AA8011-6062Using Mathematical Method”12th Global Congress On Manufacturing And Management, Gcmm 2014.
  2. Kadaganchi, R.; Gankidi, M.R.; Gokhale, H. Optimization of process parameters of aluminum alloy AA 2014-T6 friction stir welds by response surface methodology. Def. Technol. 2015, 11, 209–219. [Google Scholar] [CrossRef]
  3. Panda, M.R.; Mahapatraand, S.S.; Mohanty, C.P. Parametric Investigation of Friction Stir Welding on AA6061 Using Taguchi technique. Mater. Today: Proc. 2015, 2, 2399–2406. [Google Scholar] [CrossRef]
  4. Padmanaban, R.; Balusamy, V.; Saikrishna, V.; Niranthar, K.G. Simulated Annealing Based Parameter Optimization for Friction Stir Welding of Dissimilar Aluminum Alloys. Procedia Eng. 2014, 97, 864–870. [Google Scholar] [CrossRef]
  5. Al-Jarrah, J.A.; Swalha, S.; Abu Mansour, T.; Ibrahim, M.; Al-Rashdan, M.; Al-Qahsi, D.A. Optimization of friction stir welding parameters for joining Aluminum alloys using RSM. Adv. Theor. Appl. Mech. 2013, 6, 13–26. [Google Scholar] [CrossRef]
  6. Elatharasan, G.; Kumar, V.S. An Experimental Analysis and Optimization of Process Parameter on Friction Stir Welding of AA 6061-T6 Aluminum Alloy using RSM. Procedia Eng. 2013, 64, 1227–1234. [Google Scholar] [CrossRef]
  7. Bisadi, H.; Tavakoli, A.; Sangsaraki, M.T.; Sangsaraki, K.T. The influences of rotational and welding speeds on microstructures and mechanical properties of friction stir welded Al5083 and commercially pure copper sheets lap joints. Mater. Des. 2013, 43, 80–88. [Google Scholar] [CrossRef]
  8. Palanivel, R.; Mathews, P.K.; Dinaharan, I.; Murugan, N. Mechanical and metallurgical properties of dissimilar friction stir welded AA5083-H111 and AA6351-T6 aluminum alloys. Trans. Nonferrous Met. Soc. China 2014, 24, 58–65. [Google Scholar] [CrossRef]
  9. Aval, H.J.; Serajzadeh, S.; Kokabi, A. Evolution of microstructures and mechanical properties in similar and dissimilar friction stir welding of AA5086 and AA6061. Mater. Sci. Eng. A 2011, 528, 8071–8083. [Google Scholar] [CrossRef]
  10. Vaidyanathan, R.M.; Patel, M.; Raman, N.S.; Tedwors, D. EFFECTS OF PROCESS PARAMETERS ON FRICTION STIR WELDING OF 6063 ALUMINUM ALLOY. Int. J. Des. Manuf. Technol. 2015, 6. [Google Scholar] [CrossRef]
  11. RajKumar, V.; VenkateshKannan, M.; Sadeesh, P.; Arivazhagan, N.; Ramkumar, K.D. Studies on Effect of Tool Design and Welding Parameters on the Friction Stir Welding of Dissimilar Aluminium Alloys AA 5052 – AA 6061. Procedia Eng. 2014, 75, 93–97. [Google Scholar] [CrossRef]
  12. Prasanna, P.; Penchalayya, C.H.; Rao, D.A. Effect of tool pin profiles and heat treatment process in the friction stir welding of AA 6061 aluminium alloy. Am. J. Eng. Res. 2013, 2, 7–15. [Google Scholar]
  13. Tolephih, M.H.; Mahmood, H.M.; Hashem, A.H.; Abdullah, E.T. Effect of tool offset and tilt angle on weld strength of butt joint friction stir welded specimens of AA2024 aluminum alloy welded to commercial pure cupper. Chem. Mater. Res 2013, 3, 49–58. [Google Scholar]
  14. Kumbhar, N.T.; Bhanumurthy, K. Friction stir welding of Al 5052 with Al 6061 alloys. J. Metall. 2012, 2012, 112–119. [Google Scholar] [CrossRef]
  15. Gungor, B.; Kaluc, E.; Taban, E.; Sik, A. Mechanical, fatigue and microstructural properties of friction stir welded 5083-H111 and 6082-T651 aluminum alloys. Mater. Des. 2014, 56, 84–90. [Google Scholar] [CrossRef]
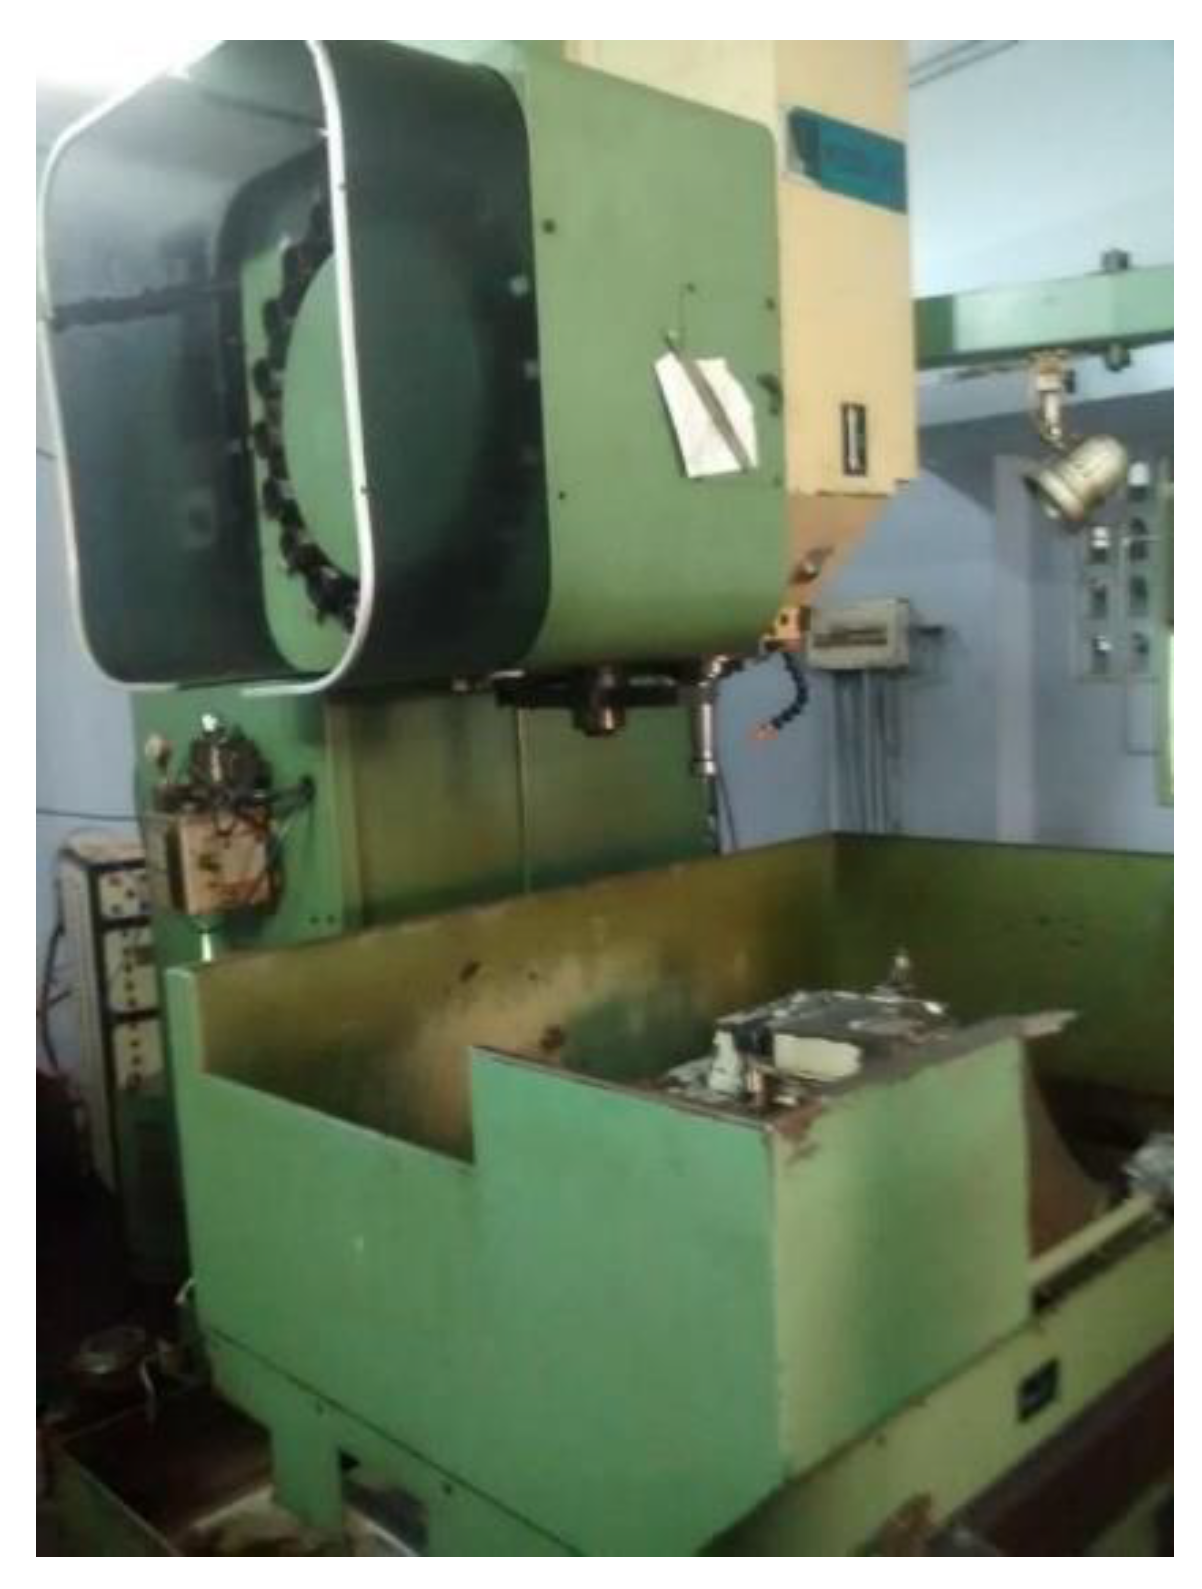
Figure 1. Vertical Machining Centre (Lmw Kodi 40).
Preprints 101198 g001
Figure 3. Dimension of tensile specimen.
Preprints 101198 g003
Figure 4. Effect of WS & SS on tensile strength.
Preprints 101198 g004
Figure 5. Effect of PD & SS on tensile strength.
Preprints 101198 g005
Figure 6. Effect of PD & WS on tensile strength.
Preprints 101198 g006
Figure 7. Effect of WS & SS on hardness.
Preprints 101198 g007
Figure 8. Effect of PD & SS on hardness.
Preprints 101198 g008
Figure 9. Effect of PD & WS on hardness.
Preprints 101198 g009
Table 1. Composition of AA 6061 and AA8011.
Material Mg Si Mn Cr Fe Cu Zn Ti Al
AA6061 1.2 0.8 0.15 0.35 0.7 0.4 0.25 0.15 Bal
AA8011 0.05 0.9 0.2 - 1 0.1 0.1 0.08 Bal
Table 2. Process parameter values and their levels.
Parameters Level -1 Level 0 Level 1
Spindle speed(rpm) 900 1100 1300
Welding speed(mm/sec) 0.5 1.0 1.5
Plunge depth(mm) 0.05 0.10 0.15
Table 3. Orthogonal Array L17(33) of the Experimental Reading.
RUN SPINDLE SPEED,
(rpm)
WELDING SPEED,
(mm/s)
PLUNGE DEPTH,
(mm)
1 1300.00 1.00 0.15
2 1100.00 1.00 0.10
3 900.00 0.50 0.10
4 1300.00 1.00 0.05
5 900.00 1.00 0.15
6 1100.00 1.00 0.10
7 1100.00 1.50 0.15
8 1100.00 1.00 0.10
9 900.00 1.50 0.10
10 1100.00 0.50 0.15
11 1100.00 1.00 0.10
12 1300.00 0.50 0.10
13 1100.00 1.50 0.05
14 1100.00 0.50 0.05
15 1300.00 1.50 0.10
16 900.00 1.00 0.05
17 1100.00 1.00 0.10
Table 4. Design Matrix with Response.
RUN SPINDLE SPEED,
(rpm)
WELDING SPEED,
(mm/s)
PLUNGE DEPTH,
(mm)
HARDNESS, (BHN) TENSILE STRENGTH, (MPa)
1 1300.00 1.00 0.15 69 158.3
2 1100.00 1.00 0.10 77 128.9
3 900.00 0.50 0.10 88 97.1
4 1300.00 1.00 0.05 79 153.7
5 900.00 1.00 0.15 72 126.7
6 1100.00 1.00 0.10 72 128.9
7 1100.00 1.50 0.15 67 118.4
8 1100.00 1.00 0.10 72 128.9
9 900.00 1.50 0.10 73 75.4
10 1100.00 0.50 0.15 85 137.7
11 1100.00 1.00 0.10 72 128.9
12 1300.00 0.50 0.10 72 142.1
13 1100.00 1.50 0.05 70 120.6
14 1100.00 0.50 0.05 71 131.2
15 1300.00 1.50 0.10 83 158.7
16 900.00 1.00 0.05 81 112.3
17 1100.00 1.00 0.10 70 128.9
Table 5. ANOVA for Tensile strength (Quadratic Model).
Source Sum of Squares df Mean Square F Value p-value Prob > F
Model 6458.75 9 717.64 10.33 0.0028
A-SPINDLE SPEED 5065.21 1 5065.21 72.93 < 0.0001
B-WELDING SPEED 153.12 1 153.12 2.20 0.1812
C-PLUNGE DEPTH 67.86 1 67.86 0.98 0.3558
AB 366.72 1 366.72 5.28 0.0552
AC 24.01 1 24.01 0.35 0.5750
BC 18.92 1 18.92 0.27 0.6178
A2 0.042 1 0.042 6.063E-004 0.9810
B2 479.81 1 479.81 6.91 0.0340
C2 322.37 1 322.37 4.64 0.0682
Residual 486.15 7 69.45
Lack of Fit 486.15 3 162.05
Pure Error 0.000 4 0.000
Cor Error 6944.90 16
Table 6. ANOVA for Hardness (Quadratic Model).
Source Sum of Squares df Mean Square F Value p-value Prob > F
Model 564.51 9 62.72 11.19 0.0022
A-SPINDLE SPEED 450.00 1 450.00 80.25 < 0.0001
B-WELDING SPEED 10.12 1 10.12 1.81 0.2209
C-PLUNGE DEPTH 3.13 1 3.13 0.56 0.4797
AB 1.00 1 1.00 0.18 0.6855
AC 0.000 1 0.000 0.000 1.0000
BC 6.25 1 6.25 1.11 0.3261
A2 47.96 1 47.96 8.55 0.0222
B2 41.12 1 41.12 7.33 0.0303
C2 0.59 1 0.59 0.11 0.7547
Residual 39.25 7 5.61
Lack of Fit 39.25 3 13.08
Pure Error 0.000 4 0.000
Cor Total 603.76 16
Disclaimer/Publisher’s Note: The statements, opinions and data contained in all publications are solely those of the individual author(s) and contributor(s) and not of MDPI and/or the editor(s). MDPI and/or the editor(s) disclaim responsibility for any injury to people or property resulting from any ideas, methods, instructions or products referred to in the content.
Copyright: This open access article is published under a Creative Commons CC BY 4.0 license, which permit the free download, distribution, and reuse, provided that the author and preprint are cited in any reuse.
Prerpints.org logo

Preprints.org is a free preprint server supported by MDPI in Basel, Switzerland.

Subscribe

© 2024 MDPI (Basel, Switzerland) unless otherwise stated