1. Introduction
The ecological balance of natural lakes consists of a delicate equilibrium of nutrient supply and biological uptake within a water body which notably includes uptake by the primary producers such as emerged and submerged macrophytes, attached and planktonic microalgae, and bacteria. Nutrients transfer upward through the food chain where they get fully or, more often, partially recycled throughout the ecosystem. As a result, organic-rich sediments accumulate over time. Natural eutrophication in shallow lakes thus slowly results in an ecosystem change. For example, the accumulation of organic sediment over centuries leads to shifts from lake to wetland to wet meadow and finally to a terrestrial system [
1]. However, cultural eutrophication from both allochthonous and autochthonous sources of nitrogen and phosphorus nutrient loading accelerates the natural processes of eutrophication [
2,
3]. These excessive nutrient influxes force the ecosystem to evolve into various endpoint states including the unfortunately too commonly observed hypereutrophic state characterized by turbid waters dominated by prolific microbial communities commonly accompanied by harmful algae blooms (HABs) [
4,
5,
6]. High organic sediment and flocculate accumulation/sedimentation rates result in a lack of aquatic vegetation, anoxia, and/or toxin releases, causing fish kills [
7,
8,
9].
Impaired water bodies in a hypereutrophic state thus necessitate remediation to reestablish the nutrient balance and improve the health of the ecosystem [
10]. Cultural eutrophication is likely the Earth’s most widespread water quality problem and is the second leading cause of waterbody impairment under the Clean Water Act [
11] for lakes in the United States [
2,
12,
13].
Investigations of the causes and effects of nutrient imbalances in lakes requires the development of nutrient budgets, which, in turn, creates the need to develop a detailed water budget for the subject water body [
14]. Combined nutrient and water balance models are typically implemented in lentic systems, such as lakes and wetlands, to identify sources of loading and eutrophication [
15,
16,
17,
18]. Understanding the lake water and nutrient budgets prior to implementing remedial strategies is necessary or some unexpected results may occur.
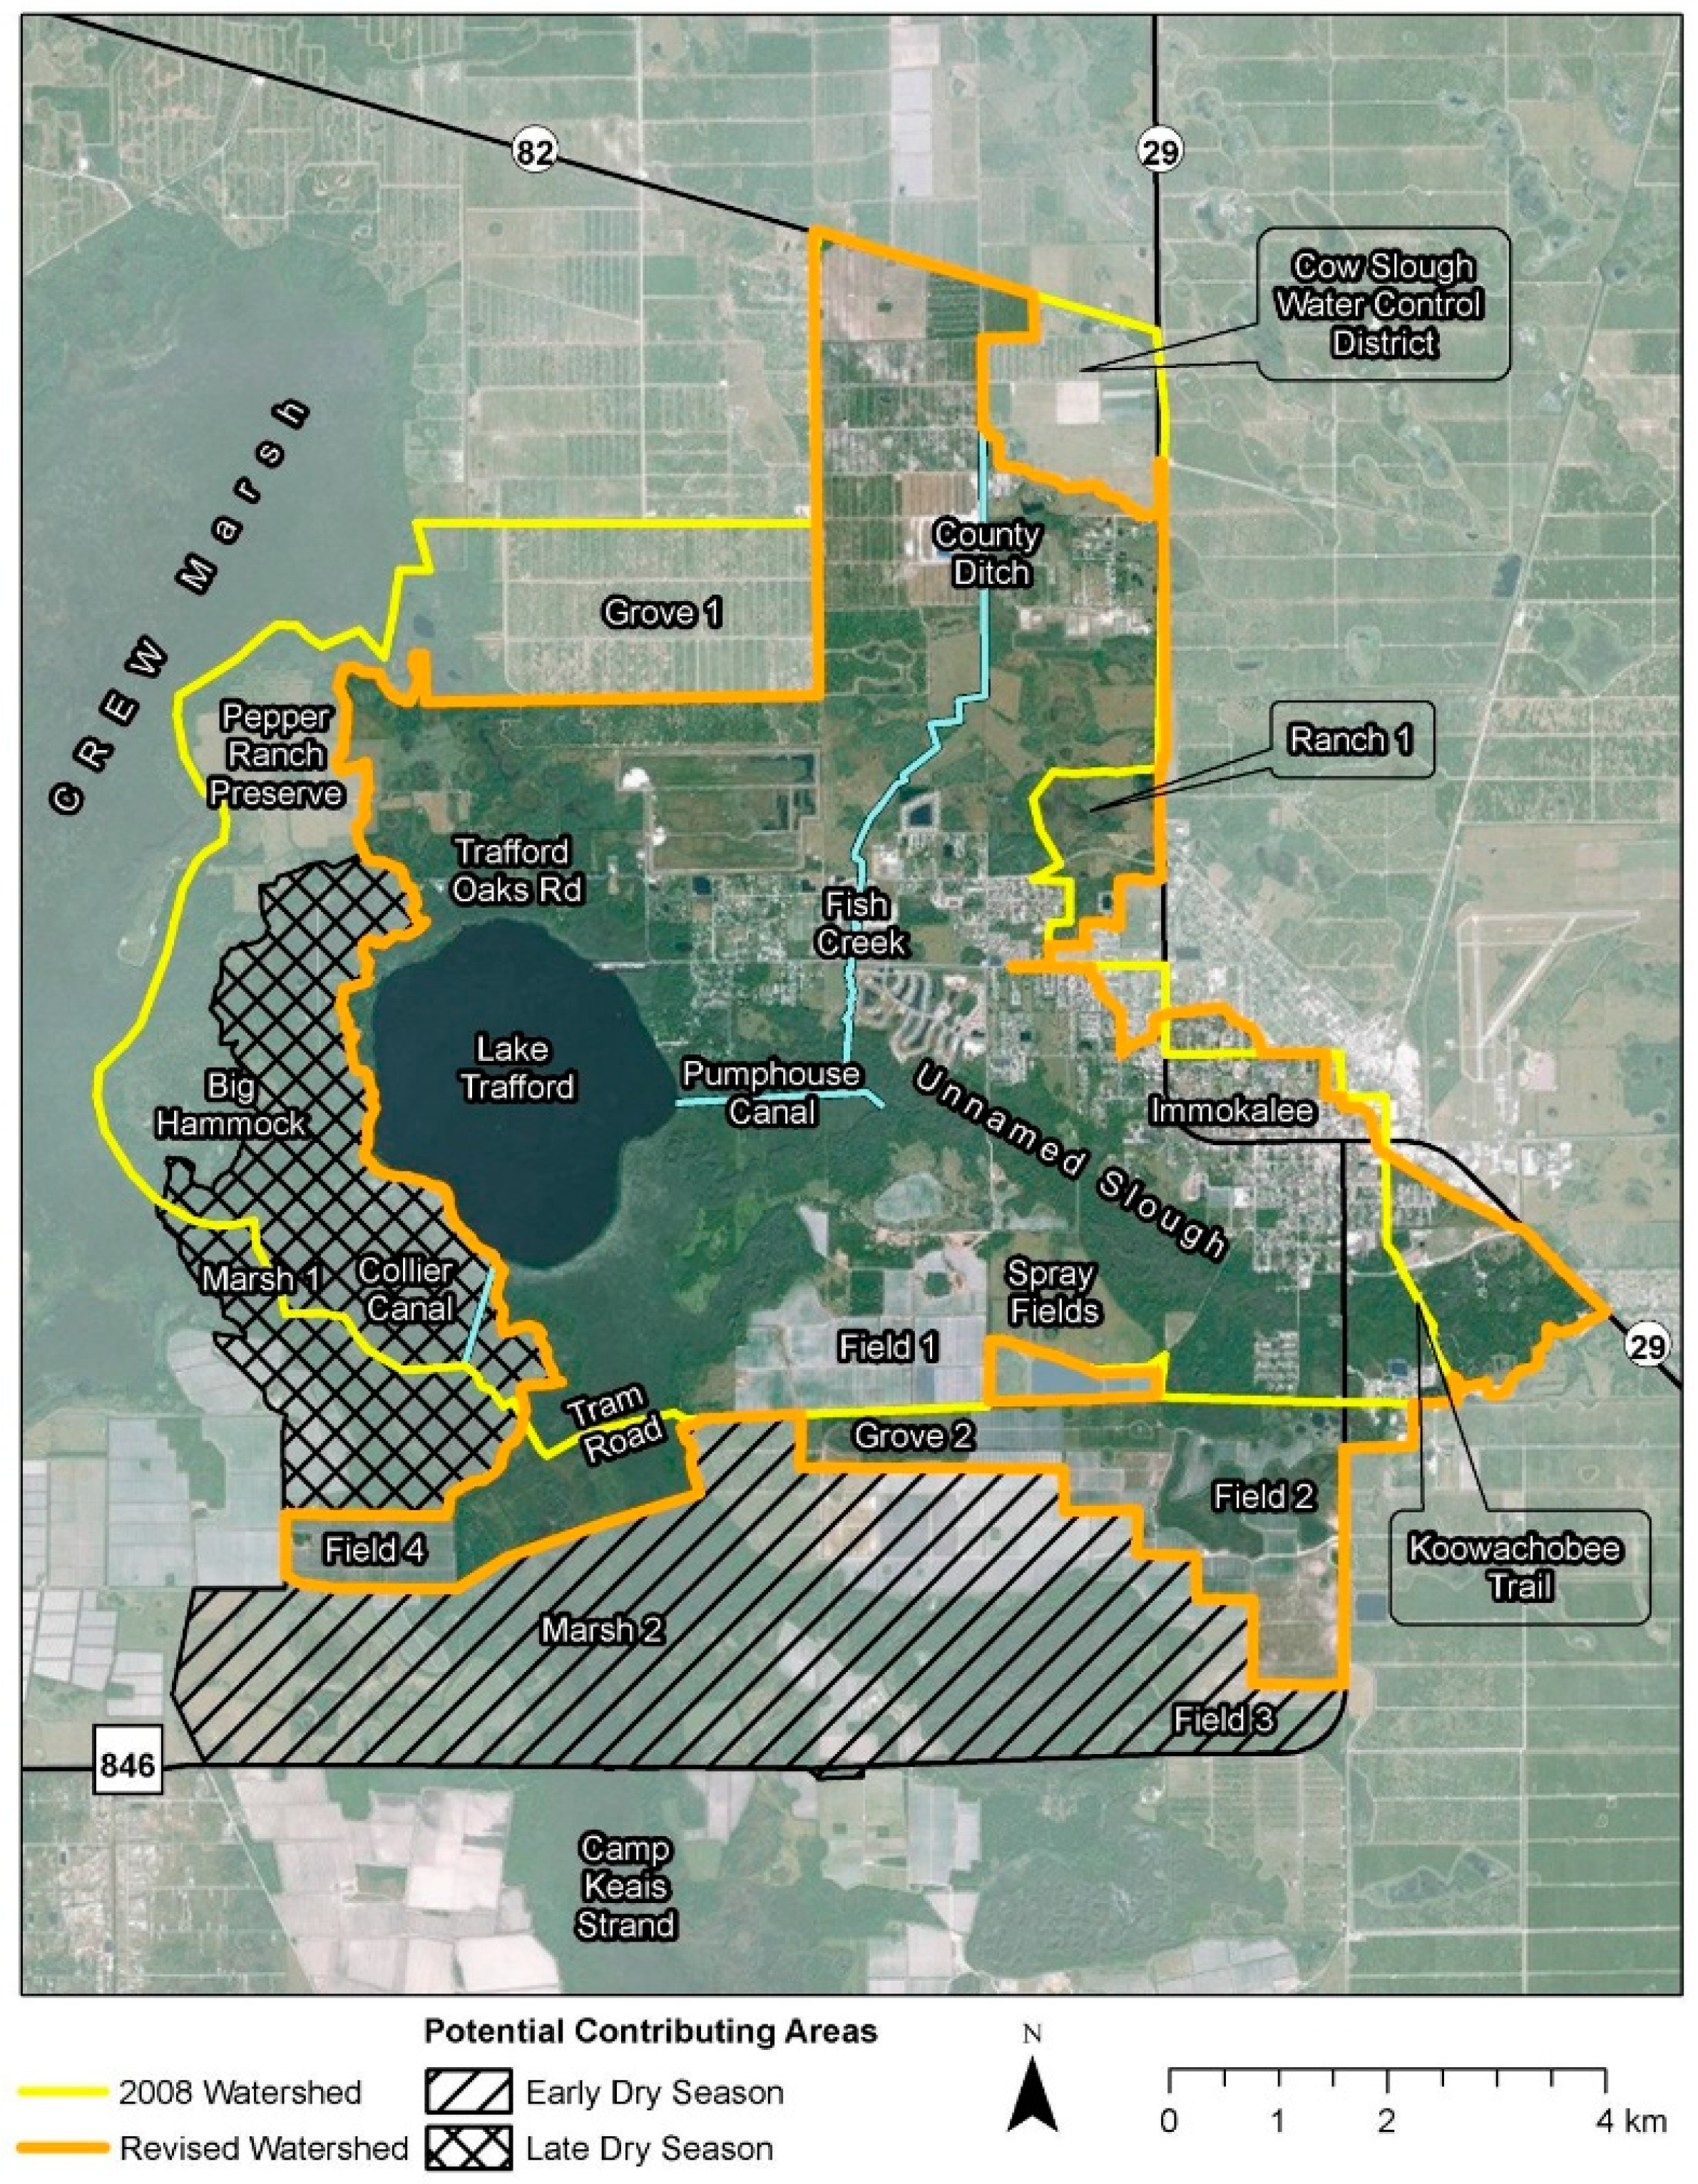
Lake Trafford is a shallow, subtropical lake located near the unincorporated community of Immokalee in Collier County, Florida (
Figure 1). Lake Trafford is the center low spot of a shallow 81.2 km
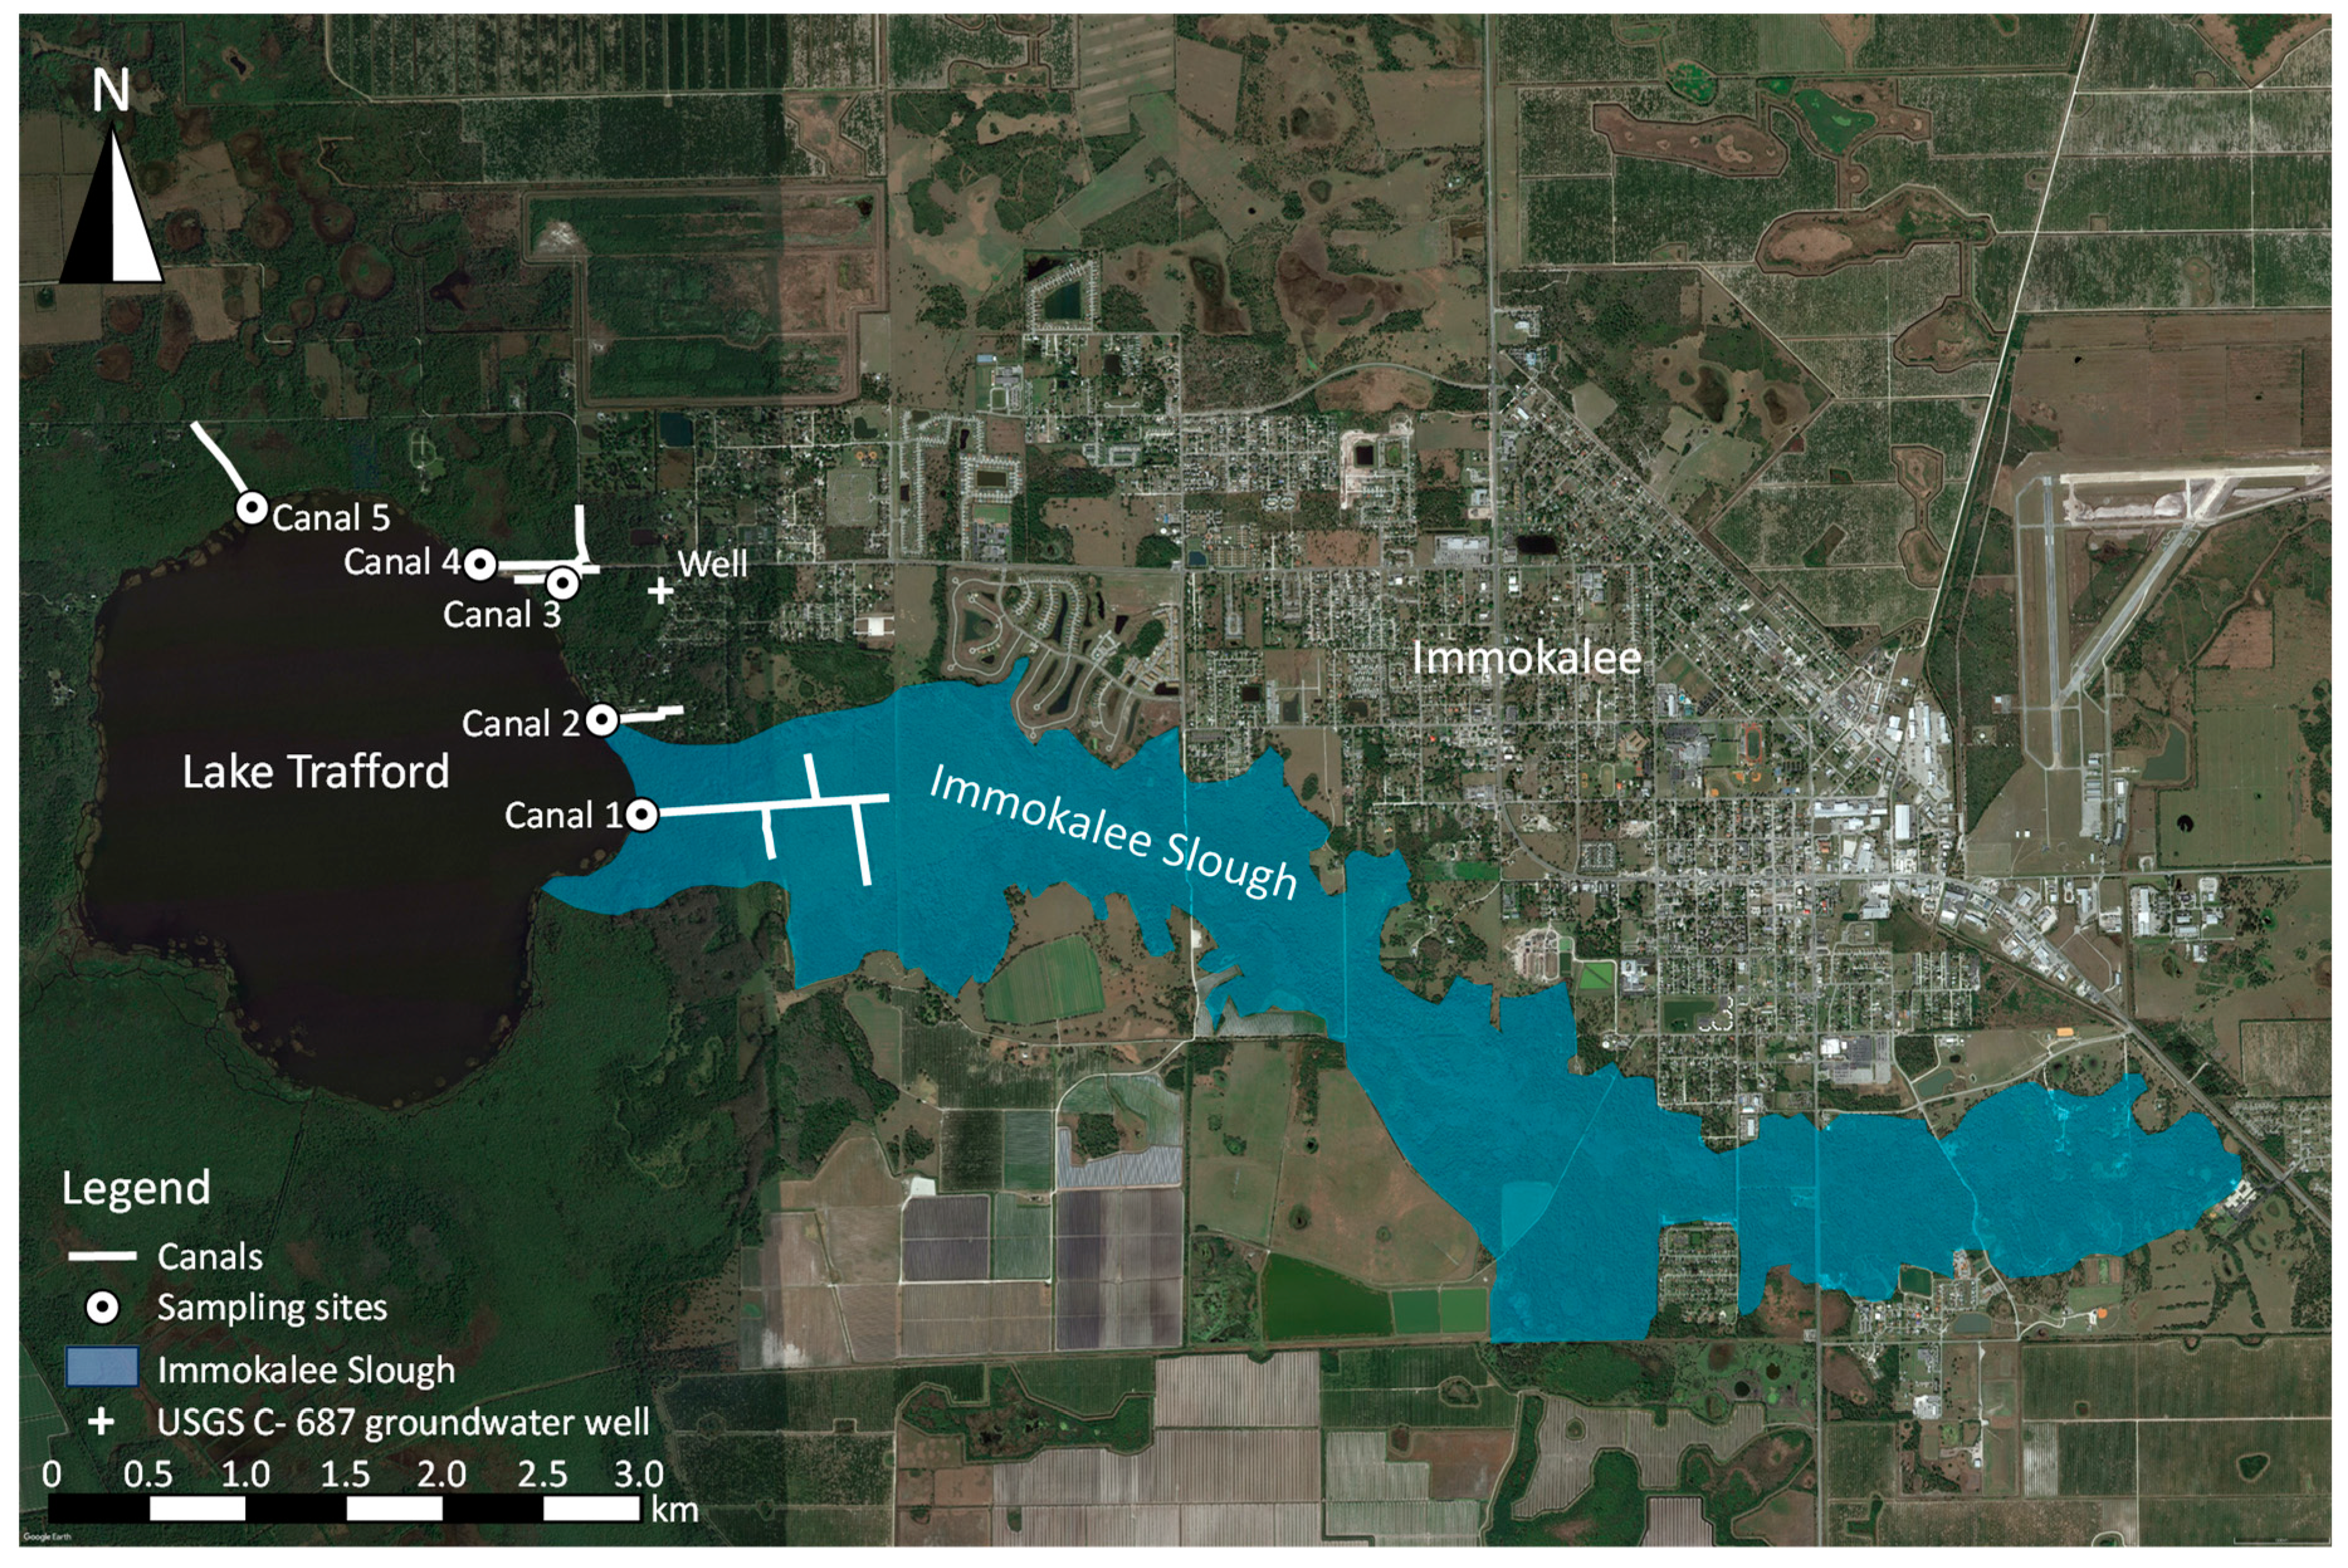
2 basin and is a discharge basin for the local unconfined aquifer. While the lake has no defined tributaries, it is the headwaters of the Corkscrew Swamp and the Imperial and Cocohatchee River watersheds. It contributes shallow seepage to these areas during the dry season and overflows its banks when water levels reach an altitude of 6.0 m NAVD’88. When water levels are above this threshold, water discharges to Corkscrew Swamp as well as south through Camp Keais Strand and Stumpy Strands, thus impacting the Fakahatchee Strand and Golden Gate Estates Critical Project Area. Water eventually makes its way to the coast through the 10,000 Islands (
Figure 2) [
19,
20].
Lake Trafford was historically known as the premier freshwater boating and fishing destination in Southwest Florida after the first public boat ramp opened in the early 1960’s [
19]. The lake was known for its clear water, sandy bottom, and diverse and expansive coverage of submerged and emergent aquatic vegetation. Over the years, local development and the establishment of many farms caused anthropogenic nutrient loading to Lake Trafford to increase and led to the extensive proliferation of the submerged rooted macrophyte
Hydrilla verticillata. Hydrilla is an invasive exotic from the warmer regions of Asia which was accidentally introduced into the lake in 1969. With optimal conditions of light, temperature and nutrients, this plant can grow up to 2.5 cm/day and a single tuber can grow more than 6000 new tubers per m
2 [
23].
Hydrilla beds can smother native vegetation (e.g.
Vallisneria americana and
Potamogeton illinoensis) and reduce habitat suitability of fish at elevated densities [
24].
Hydrilla can grow in dark, turbid waters, requiring only 0.75% of incoming solar radiation [
25]. It can also grow in a wide variety of conditions and has been known to double its water body coverage in as little as six weeks, which occurred at Lake Trafford [
25].
To control
Hydrilla growth, Lake Trafford was treated with herbicides from the 1970’s to the 90’s. The subsequent death and decay of
Hydrilla caused increased organic sediment accumulation on the lake bottom. This increased internal nutrient loading and allowed for the perpetual disturbance of the bottom sediment due to the lack of rooted vegetation, leading to decreasing water clarity [
26]. Consequently, Lake Trafford experienced an ecological regime shift from a clear water state to a turbid, phytoplankton dominated state with no submerged aquatic vegetation to compete for nutrients or stabilize organic sediment once the
Hydrilla was eradicated (i.e., the turbid state of the alternative stable states as described and summarized in Scheffer et al. [
27]. The large amounts of organic sediment that had accumulated from the decaying
Hydrilla created an average 0.74 m thick organic sediment layer with up to 2 m accumulating in some areas [
28]. The results were a reduction in the lake water volume, increased BOD, recurrent algae blooms, which collectively led to massive fish kills (e.g. 50,000 fishes in 1996) [
19]. Lake Trafford was then added to the State of Florida 303(d) list of impaired waterbodies in 2002 due to chronic hypoxia and elevated concentrations of unionized ammonia typical of dystrophic lakes [
22]. The decline of recreation in and around Lake Trafford as well as increasing public outcry from residents spurred the start of a restoration effort beginning in 1996.
Reversing the nutrient rich turbid state of a lake dominated by phytoplankton to its previous clear state dominated by native plants poses a great challenge since the effort involved for such a shift is greater than what it took to initially make the hydrosystem shift to the turbid state (a phenomenon called hysteresis [
27]). One of the remedial methods applied to the lake was removal of the excess organic sediment by dredging. Per the muck measurement performed in January 2004 [
28], all the estimated 4.8 x 10
6 m
3 of accumulated organic muck was removed by dredging from 2006 to 2010. Other measures were taken in the lake drainage basin to reduce nutrient discharges.
Sediment dredging can induce a switch towards the initial clear state, although this strategy may have unexpected or negative impacts [
20,
29,
30]. While the restoration effort for Lake Trafford has been an important curative step in the lake recovery with encouraging results including growth of bass population, with some notably large specimens, the lake continues to exhibit cyanobacterial algae blooms and
Hydrilla growth over the native vegetation [
31]. In addition, the hydrology of the lake has been changed by the dredging activity, which has unknown consequences.
It is the purpose of this research to measure the post-dredging water budget of Lake Trafford to ascertain what changes occurred in the inflow and outflow processes of the lake by removal of the low hydraulic conductivity organic sediment. There are few investigations of natural, shallow subtropical lakes (solution lakes as termed by Hutchinson [
32]) in terms of hydrology and water budgets. This documentation will be useful to other scientists and engineers involved in lake restoration and management and clearly illustrates how unexpected impacts can complicate the restoration process.
2. Materials and Methods
2.1. Hydrogeology of Lake Trafford
Lake Trafford lies within the water-table aquifer, which is the uppermost aquifer in the Surficial Aquifer System [
33]. This aquifer is unconfined and consists of an upper layer of medium to fine grained quartz sand overlying shell, coralline limestone, and a variety of other limestone lithologies. Where the elevation of land surface is below 7.6 m, the quartz sand unit occurs with the Fort Thompson Formation of Late Pleistocene age with the underlying shell and limestone occurring with the Pinecrest Member of the Tamiami Formation of Late Pliocene age [
34,
35]. In higher elevations, the quartz sand is also part of the Tamiami Formation. Shell deposits are commonly found below the former organic deposits in Lake Trafford [
36].
The hydraulic conductivity of the sediments in connection to Lake Trafford ranges from 30 to >1000 m d
-1 [
33]. Bennett [
36] developed a groundwater flow model of the Surficial Aquifer System using the MODFLOW code. This model indicates an area of lateral groundwater flow beneath the Lake Trafford Watershed caused by changes in land surface altitude east of the lake. Based on the model, groundwater influx into the lake is expected to be strongest on the northern and eastern banks.
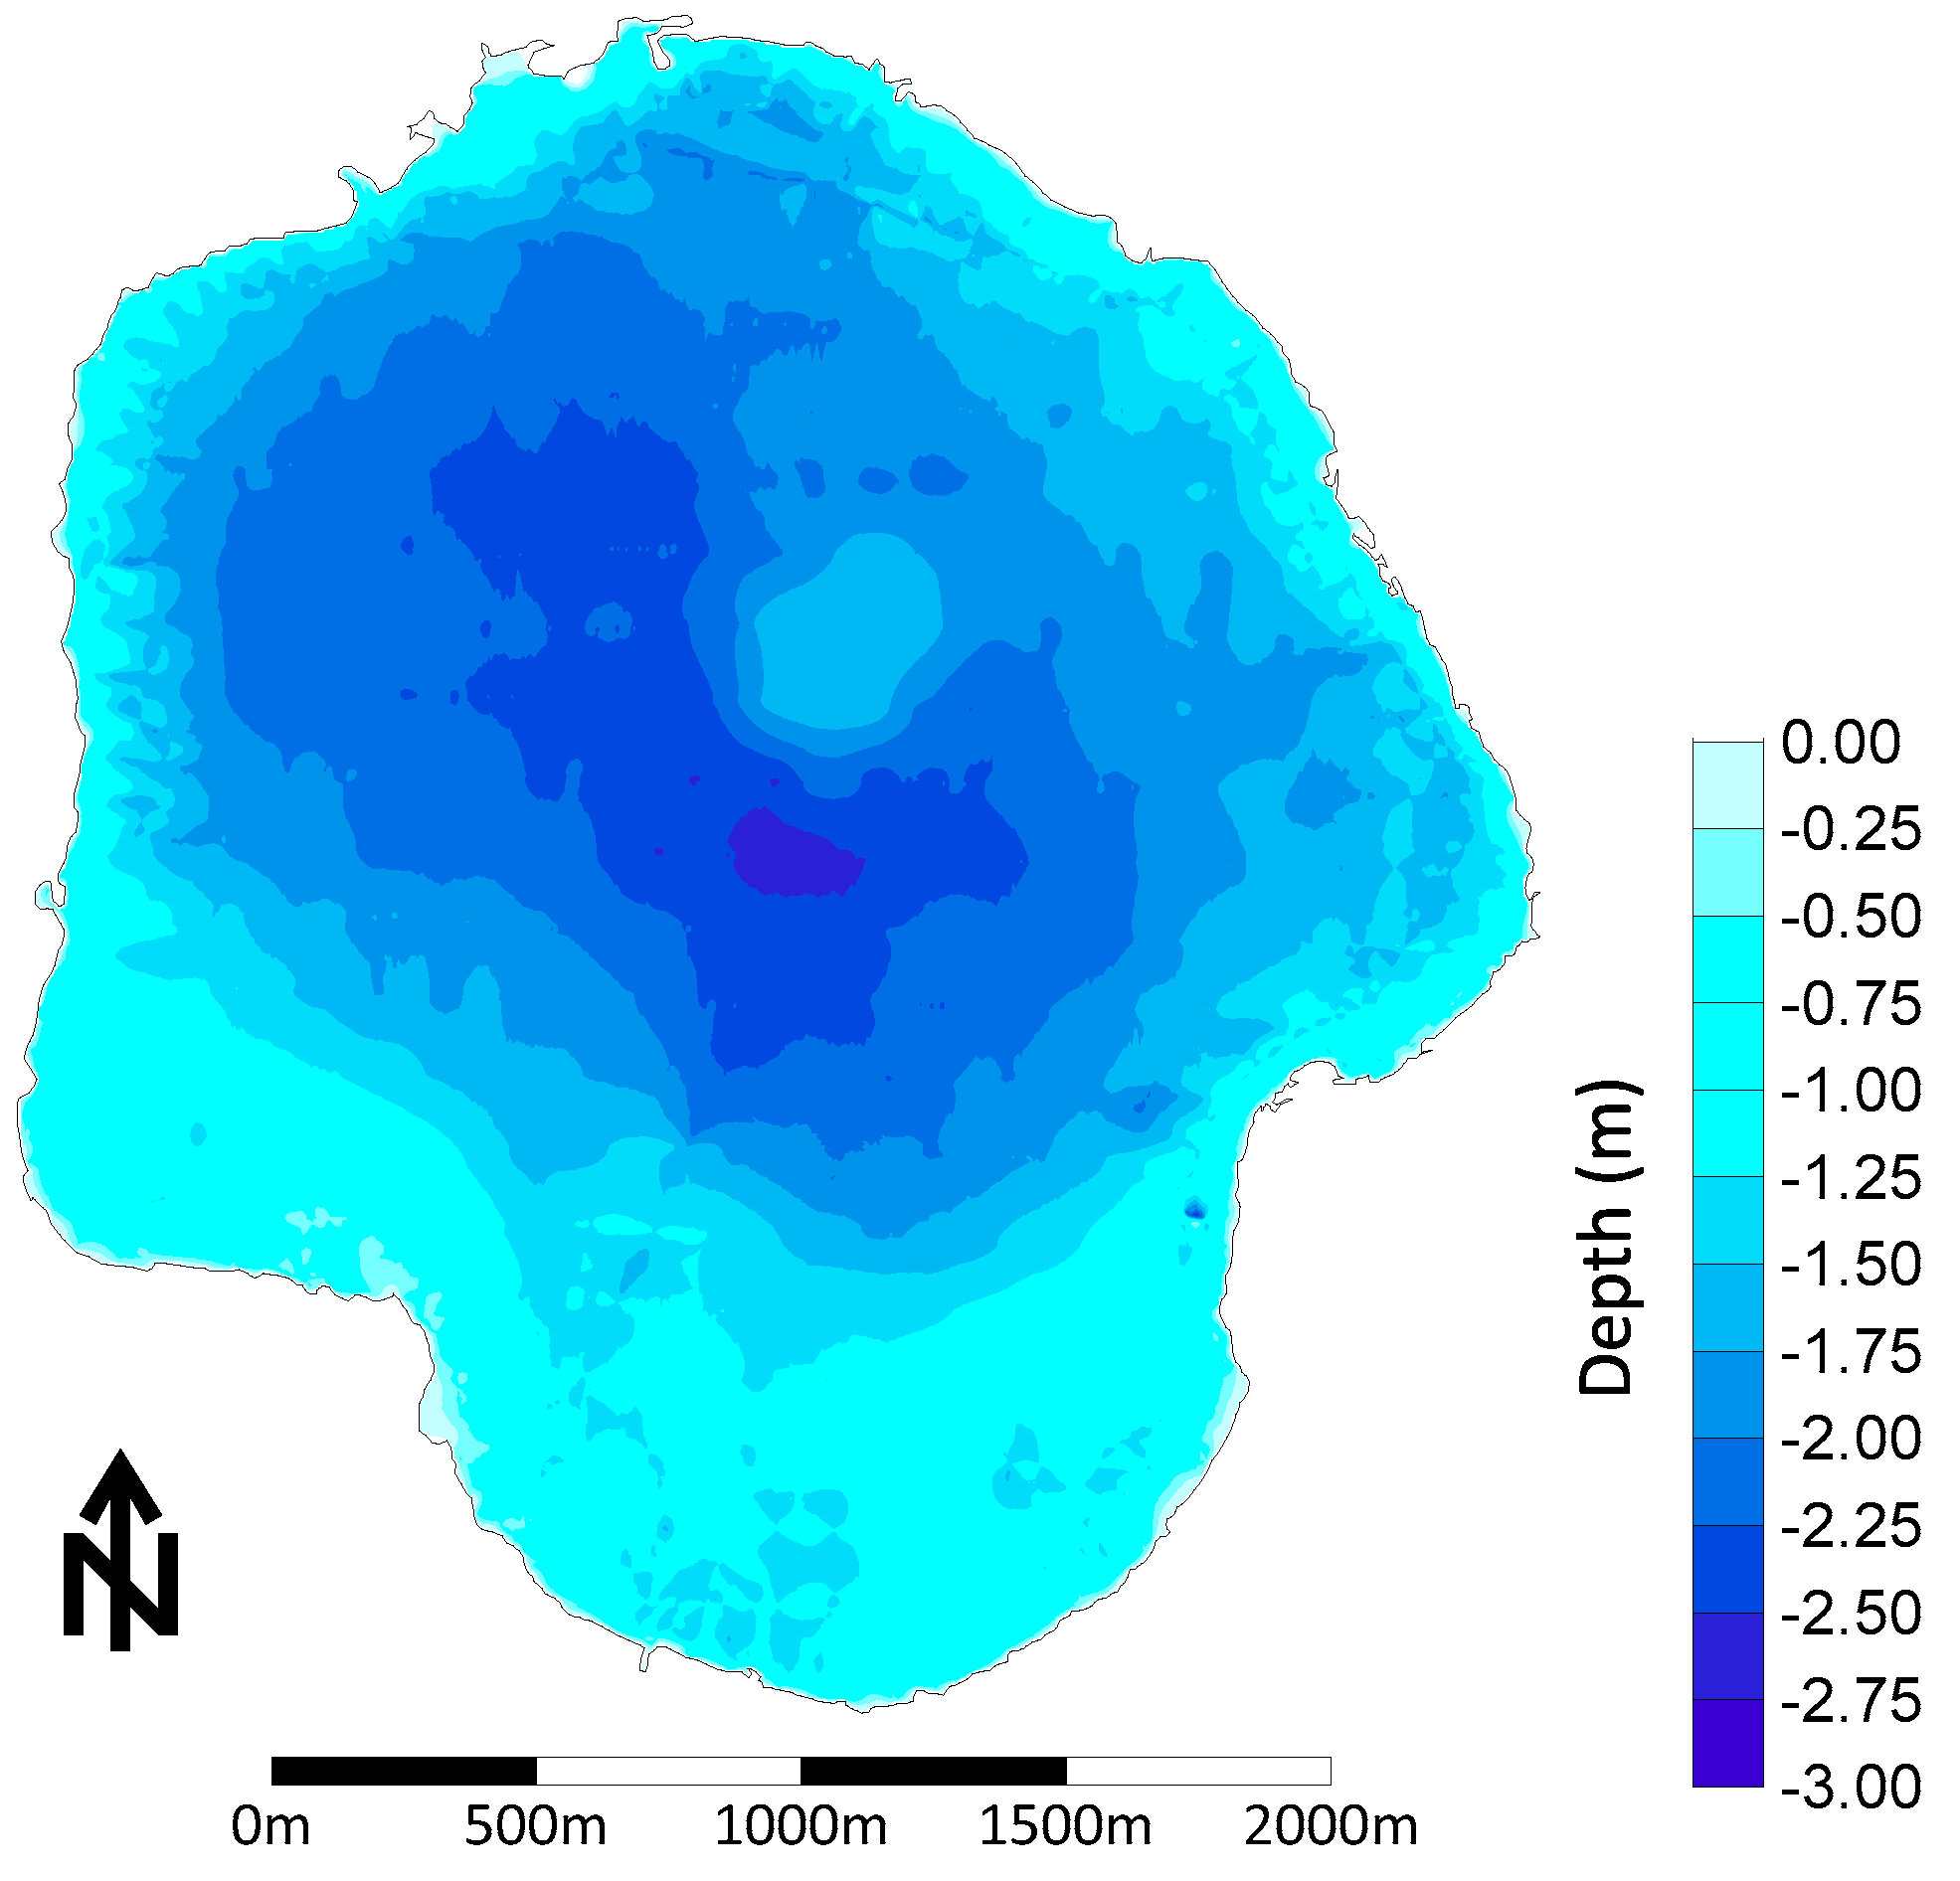
2.2. Measurement of the Lake Bathymetry
The post-dredging bathymetry survey of Lake Trafford was done in June 2015 from a Tracker® topper 1436 aluminum Jon boat outfitted with a tiler Lehr 5HP outboard using a Lowrance HDS-7 Gen2 console coupled with a Point-1 GNSS directly mounted on top of a 200kHz SONAR transducer with 22 degrees beamwidth. Over the course of three consecutive days, the boat covered the entire lake at a speed of less than 8 km/h and with tracks equidistant of about 10 to 20 m. The soundings data were uploaded to cloud computing software
www.biobasemaps.com to extract the raw data as a comma separated file. After correction from the depth of the transducer (0.16m), the sounding depths were then computed in NAVD’88 elevation format using the elevation of Lake Trafford water surface recorded by the USGS station 02291200 located across water quality station Canal 2 (
Figure 2). The soundings for the average NAVD’88 lake elevation at 5.53 m were then computed and interpolated in Surfer 20 (
www.goldensoftware.com) using the kriging interpolation method and the appropriate variogram. Volumes and planar surface areas for various NAVD’88 lake levels were also computed in Surfer 20 and their reciprocal relationships fitted with a fourth order (volumes) and second order (planar surface areas) polynomial regressions in Microsoft Excel.
2.3. Sediment and Floc Accumulation in Lake Trafford
The combined pre-dredging sediment and floc accumulation (i.e., muck) in Lake Trafford was measured by ART Engineering LLC (
www.art-engineering.com) during the month of January 2004 using AquaScan Radar Survey Technology [
28]. Since the raw data were not available, the map of pre-dredging muck accumulation was digitized and the isocontour values on a two-dimensional map were determined using the “2D XY” feature of the free online software PlotDigitizer (
www.plotdigitizer.com). These generated data for each isocontour were then combined and interpolated in Surfer 20 using the kriging method and the appropriate variogram. As a verification method, the volume of muck was computed in Surfer 20 and compared to the one determined by ART Engineering LLC [
28]. Since the post-dredging muck accumulation was not planned to be completed, fifty-seven geotagged locations were cored in March 2012 with a homemade handheld push corer. The coring device consisted of a 4 m long 5.08 cm ID schedule 40 PVC pipe, which was fitted with a PVC one-way check valve at its base to create suction in the core barrel when coring. A flexible rubber coupling was affixed to the bottom of the check valve using a stainless-steel hose clamp and the top of a clear 5.08 cm O.D. acrylic core barrel (0.635cm wall thickness) was secured inside the rubber coupling with another hose clamp. Coring was done from a boat by lowering the core barrel in the water column and by pushing by hand the corer until refusal. The core barrel was then rapidly brought to the surface and its bottom was plugged with a rubber stopper #11. The outside of the core barrel was then wiped clean with a cotton rag and the amount of sediment and floc were measured with a meter stick to the nearest 0.5 cm.
2.4. Measured Components of the Lake Trafford Water Budget
A water budget for a natural lake was created using a basic relationship which quantifies the hydrological inputs and outputs of the system (Eq. 1). The relationship is as follows:
where ∆S is the change in storage of the lake,
Pgross is the precipitation into the lake, GW
in is the inflow of groundwater, SW
in is surface water runoff/inflow, ET is evapotranspiration, GW
out is the outflow water into the ground, and SW
out is surface water outflow [
14,
18]. Each facet of the water budget was measured for Lake Trafford either experimentally, by modeling, or through subtraction and deduction. Water budgeting for lakes requires that the bathymetry and total volume of the lake be known to determine the change in water storage (
Section 2.2).
2.5. Measurement of Groundwater Fluxes In and Out of the Lake
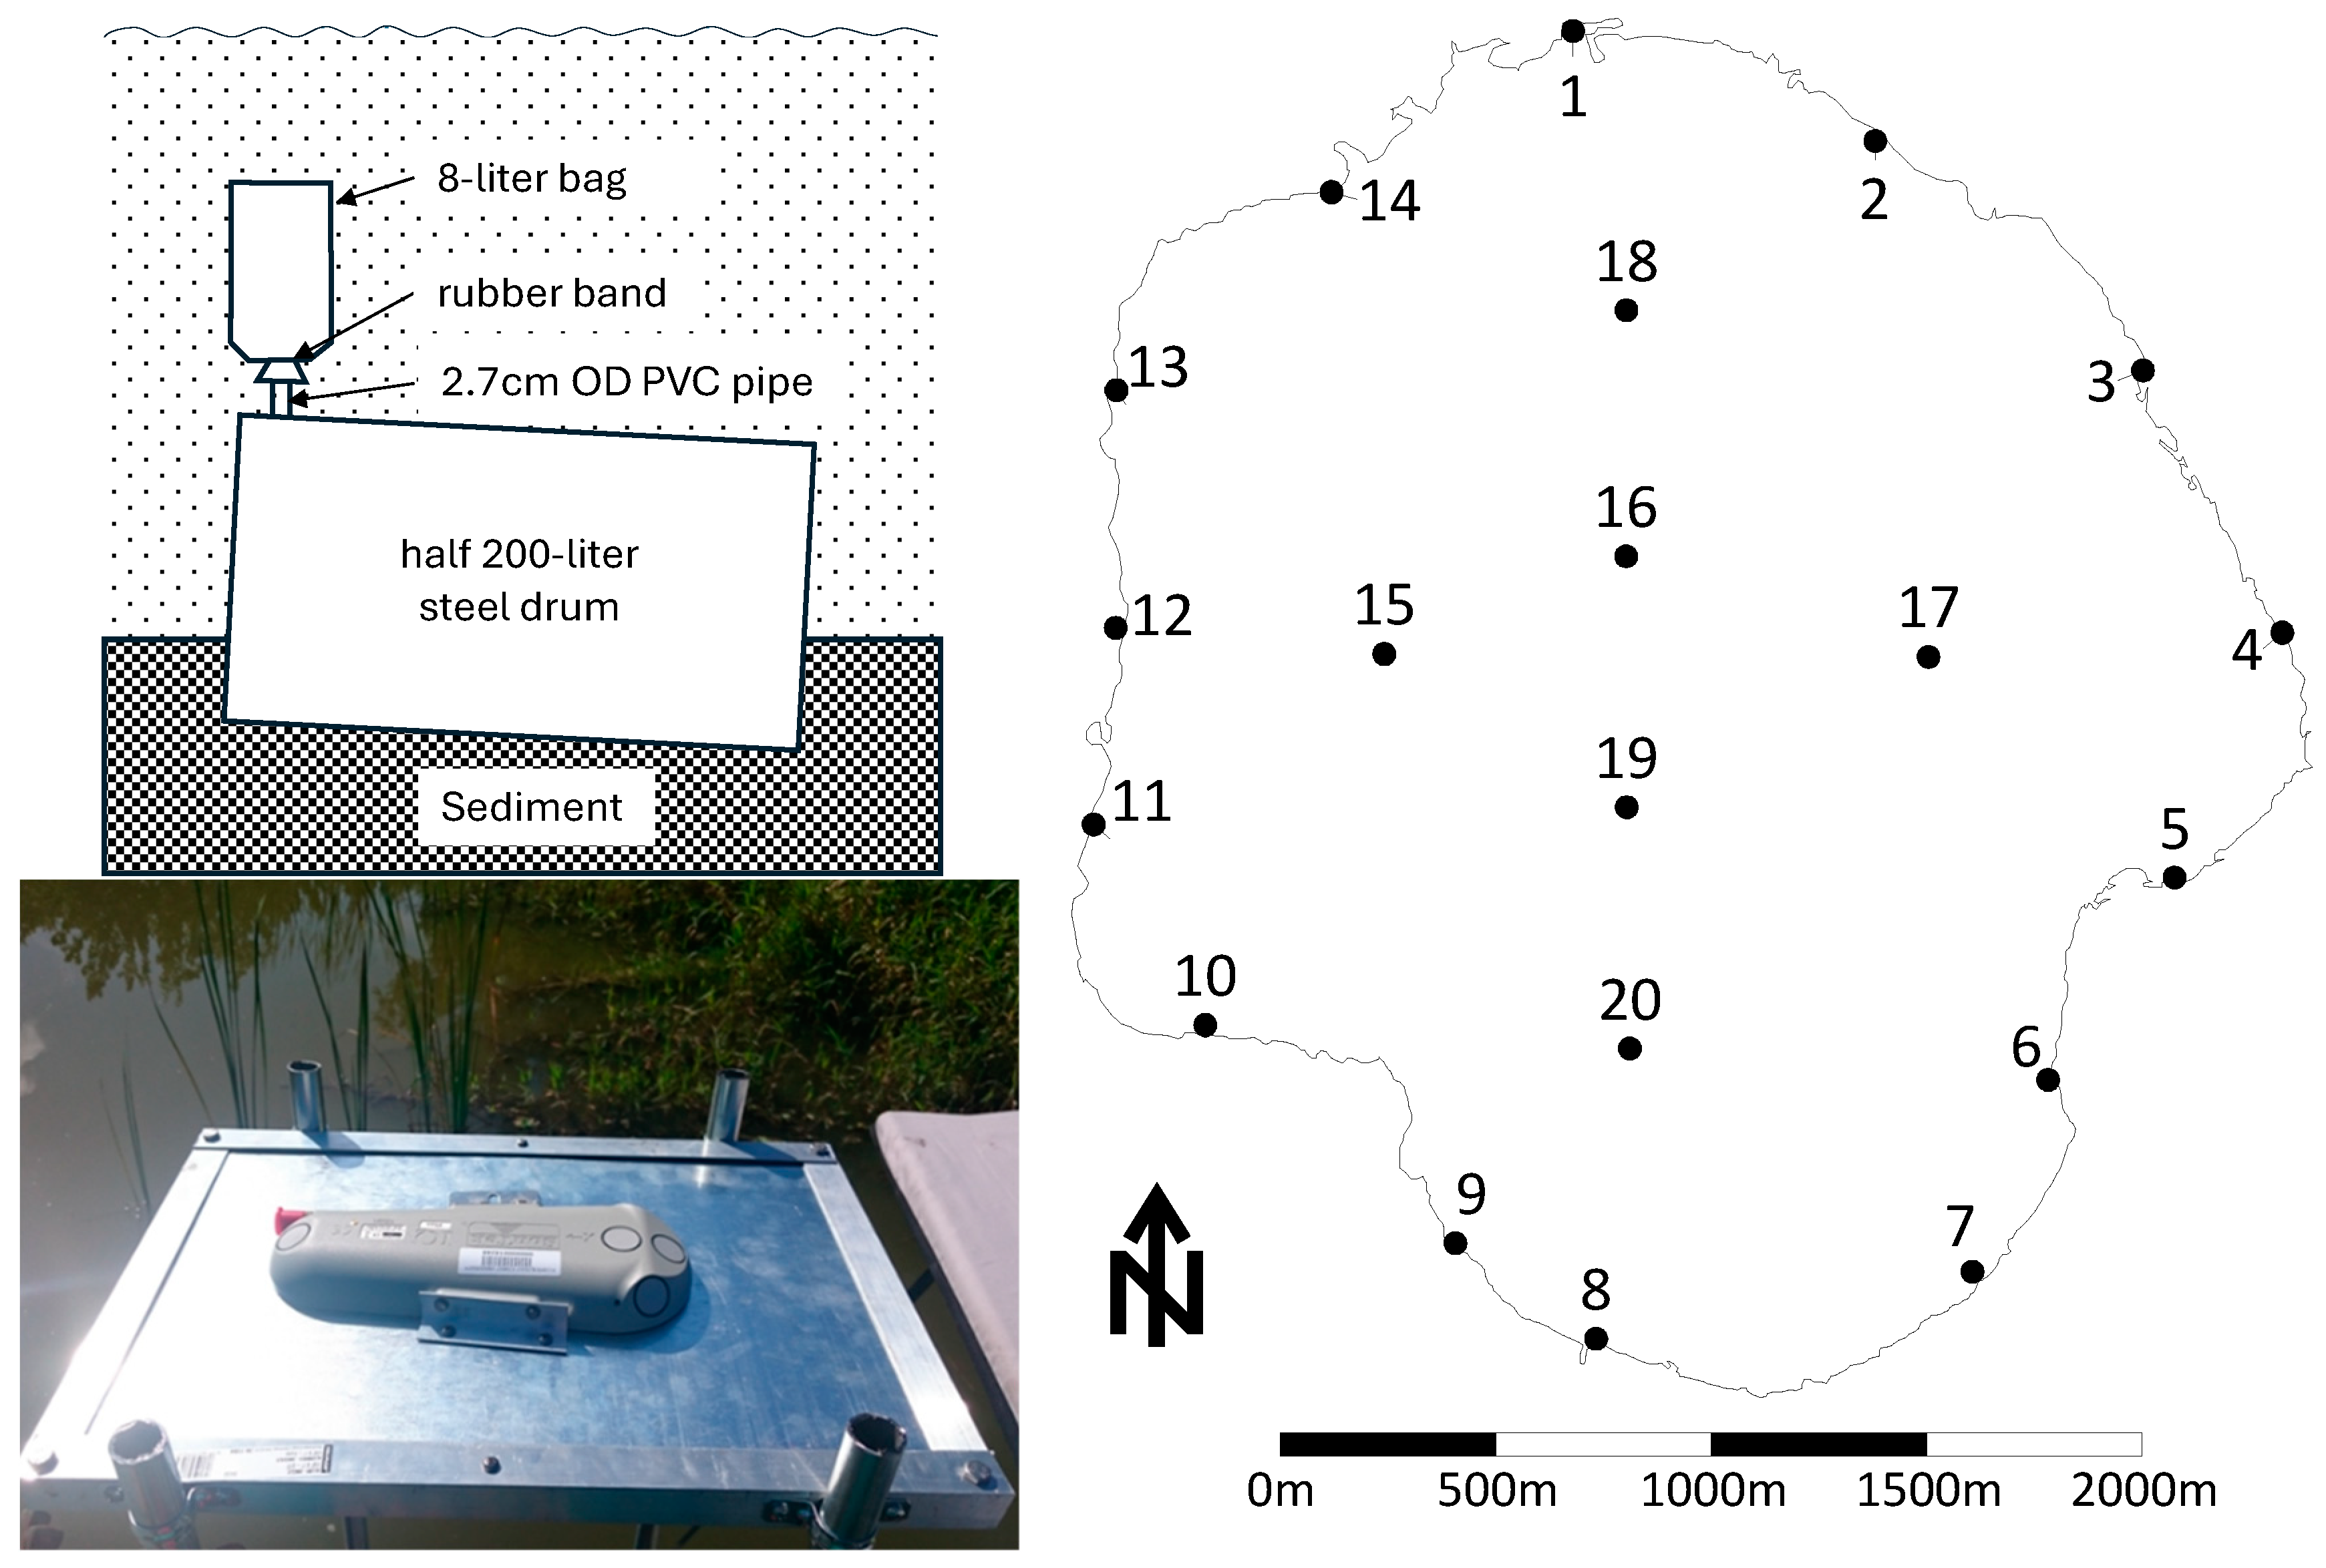
Upward and downward fluxes of groundwater were quantified every other week from 10/14/2015-10/15/2015 (event 1) to 10/24/2016-10/25/2016 (event 28) using homemade groundwater seepage meters (
Figure 3). Each meter was made from half of a standard steel 200-L drum (0.85m tall and 0.58m ID) which was transversally cut with an angle grinder equipped with a cutting wheel. A hole was then made near the rim of the drum to insert a bulkhead connector into which a 10 cm long 2.7 cm OD schedule 40 PVC tube was glued. This snorkel allowed the volumetric loss or gain of water to an eight-L 1.5 mil (0.04 mm wall thickness) clear polypropylene bag. Its opening was secured with thick rubber bands over the snorkel (
Figure 3). Groundwater fluxes were measured every other week (i.e., twice a month) from a total of 25 seepage meters placed at 20 locations throughout the lake. Meters 1-14 were situated within the littoral zone, while meters 15-20 were in open, deeper water (
Figure 3). More meters were used in the littoral zone of the lake where most groundwater exchanges typically occur [
37,
38]. Five sites received duplicate seepage meters which were placed directly adjacent to one another. These duplicate meters were used to assess the precision of the duplicate groundwater flux measurements in proximity using Root-Mean-Square Error (RMSE). A total of four duplicate meters were used to assess the shallow water meter accuracy (Sites 3, 5, 10, and 13) and one was used to assess the deep-water meters accuracy (Site 15).
Littoral seepage meters were spaced evenly around the lake perimeter in June 2015 when water levels were lowest, and they were placed as shallow as possible. Depth and spacing around the lake were the primary drivers of meter placement, but other factors influenced positioning as well. For example, large stands of emergent vegetation often forced meters to be placed further from shore or further down the bank. Additionally, an airboat tour company operating in Lake Trafford created many “airboat trails” where their boats frequently traveled. These areas were avoided to prevent collisions with meters and erroneous fluxes from boat pressure waves.
Each seepage meter was pounded with a rubber mallet at an angle into the sediment to have a complete seal around the bottom with the lakebed (
Figure 3). The small tilt of the meter allowed gases to escape through the snorkel. The deep meters were installed with the use of SCUBA gear while the shallow meters were installed on foot. The shallow meters were marked with four 2.5 m long schedule 40 2.1 cm OD PVC pipes extending above the water surface and attached together near their apex and with their feet pushed to refusal in the sediment to form a “tipi”. Each pipe was also marked with red/white Department of Transportation (DOT) reflective tape. The shape of these markers helped to prevent boaters from approaching the meters too closely and causing erroneous measurements or unintended collisions. Deep water meter sites were marked with a single 3.5 m long 5.08 cm OD schedule 40 PVC pipe marked with reflective tape at its apex. These markers were driven into the lakebed until refusal, roughly two meters away from the seepage meter location. All seepage meters were allowed to settle for three months before official sampling began; long enough for adequate settling and accurate flow results [
38,
39,
40,
41,
42].
Seepage rates were measured every other week for a period of 24-hours each time. For each sampling event, the eight-L black polypropylene bag was filled with 1 L of lake water, except for two randomly chosen sites per sampling event which bags received deionized (DI) water.
After twenty-four hours, each bag was removed and measured volumetrically. Bags which were filled with DI water were also measured for specific conductance to determine the conductivity of the groundwater flux.
The volumetric flow rate (
Q) for each site was then determined using Equation 2 as:
where
Vfinal is the volume final in the bag,
Vstart is the initial volume in the bag and
dt is the elapsed time. Flux velocity was also calculated by dividing Q by the cross-sectional area of the seepage meter (0.26 m
2) which is useful for comparing flux rates between systems with varying meter designs. A correction coefficient of 1.10 was applied to all flow rates [
38].
For each event, spatial changes of groundwater flow rates were mapped via kriging interpolation with Surfer 20. Additionally, using the average flow rate for the 28 events, an average flow rate map was also produced. Surfer 20 was also used to calculate the groundwater discharge and recharge (i.e., the summation of all flow rates for the whole lake) for each event as well as averaged for all 28 events and expressed in m
3 d
-1. Further, Groundwater discharge and recharge was interpolated between sampling dates was interpolated using a daily time step using a Bessel spline interpolation using the SRS1 cubic spline Add-Ins for Microsoft Excel (
www.srs1software.com). The interpolated values were then used in the daily water budget model.
2.6. Measurement of Surface Water Influx from Canals
Each of Lake Trafford’s five dead-end, runoff collection canals were equipped with a Xylem Sontek IQ (Canals 1, 4, and 5,
www.xylem.com) or Sontek IQ+ (Canals 2 and 3) to record flow. The IQ and IQ+ models are ideal for measuring water velocity and discharge in shallow canals and culverts. The cross-sectional bathymetry of each canal was measured manually using a surveyor level and stadia rod and entered into the Sontek-IQ software. This allowed the software to calculate
Q through each canal by monitoring stage and water velocity. IQ/IQ+ units were placed in areas where the canal was straight with well-defined banks (as much as possible). The IQ/IQ+ units were mounted on platforms constructed of angle and sheet aluminum attached to four mounting legs made of galvanized piping (
Figure 3). The platforms were adjusted so that their height was approximately 10 cm from the top of the sediment. The true height off the bottom for each IQ/IQ+ unit was input into the Sontek-IQ Software, allowing the software to adjust to the true stage of the canal. The noise in the flow data was elevated originally, with high up and down readings within the span of 10 minutes. After months of troubleshooting with the manufacturer, this was remedied by disabling the two side-mounted acoustic beams and using only the two center line beams for velocity measurements beginning in April 2016. Data collected before April was used for all Canals with the exception of Canal 3 which had much higher noise due to an incidental change in tilt from an unknown causality. Data for Canal 3 was transfromed to reduce noise during that period due to high noise within the daily averages (
Supplementary Materials,
Figure S1). Daily averages for the other four canals were deemed representative despite noise in the raw data.
Each IQ/IQ+ unit was connected via SDI-12 communication to a Xylem WaterLOG Storm3 data logger to record canal discharge every ten minutes with a five-minute scanning duration. Flow rate (Q; m3 s-1), mean velocity (m s-1), water level (m), and water temperature (°C) were all recorded. Storm3 data loggers and the IQ/IQ+ power adapters were housed in weatherproof electrical NEMA boxes mounted onto a platform on the shore. All equipment was powered with a 12V 105Ah deep cycle marine battery housed in a lockable box which battery was swapped every two weeks.
2.7. Measurement of Rainfall into the Lake and Estimation of Evapotranspiration
Ambient weather data were collected using various devices, all mounted to a permanent platform located in the southern portion of the lake and powered by a 12V deep cycle battery which was kept charged using a south facing 100-watt solar panel. A Davis Instruments wireless weather station Vantage Pro2 (
www.davisintruments.com) equipped with air and soil temperature sensors, a humidity sensor, a rain gauge, and an anemometer (wind speed and direction), was used to collect the bulk of meteorological data. Standard anemometer placement is at a height of 10 m above the lake stage with a distance of at least four times the height of the obstruction away from any potential wind breaks [
43]. However, infrastructure and budgetary restraints limited the placement height of the anemometer to 1/3 of standard height (3.3 m) from the water surface at the high-water level mark (i.e., 6.0 m NAVD’88). The soil temperature sensor was affixed to a platform leg, approximately 1 m below the high-water level mark. Rainfall rates were measured using the standard tipping bucket found on the Davis Vantage Pro2 (1 tip = 0.2 mm rainfall). Bird activity was problematic during very early data collection, but the addition of bird spikes around the edge of the rain bucket helped prevent it from clogging with bird droppings. Additionally, a Teledyne ISCO 674 rain gauge (
www.teledyneisco.com, 1 tip = 0.1 mm) was used as a backup and to cross-check rainfall rates between the two rain gauges. This rain gauge was connected via analog connection to a Strom3 data logger.
A Kipp & Zonen NR Lite 2 Net Radiometer (
www.kippzonene.com) was used to monitor both incoming and reflected solar radiation, producing a net radiation value. The Kipp & Zonen
TM NR Lite 2 net radiometer was connected via analog connection to a Strom3 data logger. The unit has two thermopile sensors facing opposite directions (one facing the sky and one facing the water’s surface below). The unit produces a reading in volts that was then converted to watts of net radiation per square meter. The measurement of the net radiation is valuable for determining evaporation rates.
Data from the weather station were logged every fifteen minutes into the Davis Instruments WeatherLink® USB data logger which was plugged into the weather station console housed inside a waterproof box. The logger was connected via USB connection to an ECS LIVA mini-PC (
www.ecs.com.tw) tethered to a 4G LTE modem and running the WeatherLink® software so that data could be downloaded to the mini-PC and uploaded to an FTP site. A USB camera was also connected to the mini-PC so that weather data and videos were livestreamed on a created website. This was done to avoid vandalism as videos were backed up and the public was made aware of the study and of the livestream by a conspicuous signage at the boat ramp.
Using the data collected from the weather station, three evaporation models could then be applied to the surface of the lake. Although evaporation from lakes and reservoirs is often estimated from pan evaporation, such measurements are subject to many potential errors including pan environment bias, operator bias, estimation of rainfall on the pan, reading error, data recording errors, and others [
44,
45]. Thus, evaporation from water surfaces is rarely measured experimentally [
46]. Therefore, evaporation rates were determined via modeling.
To estimate evaporation from Lake Trafford, three models were used: the Modified Turc Model [
47]; Equation 3), the Simple Method [
45]; Equation 4) and the Abtew Marsh Model [45; Equation 5). These three evaporation estimation models are considered the most appropriate tools to estimate evaporation of open water bodies located in subtropical South Florida [
45] and they are written as:
Radiation-temperature based model (simple method)
Abtew Marsh model
where, E = lake evaporation (mm d
-1); K
1 = a coefficient dependent on surface type (0.53 for open water); R
S = solar radiation (MJ m
-2 day
-1); T
max = maximum daily air temperature at 2 m height (°C); K
2 = a coefficient, 0.0123; K
3 = a coefficient (°C), 52.6 °C was selected for a shallow lake in the south Florida region; and λ = latent heat of vaporization of water (MJ kg
-1).
Evaporation rates (mm d-1) were then applied to the planar surface area of the lake at the time of weather data collection. This was done using the lake stage-surface planar area curve described in section 2.2.
2.8. Change in Storage
The water surface elevation was measured using the USGS Site ID 02291200 station and an additional backup pressure transducer Solinst Levelogger® 3001 was fitted inside a perforated 5.08 cm OD schedule 40 PVC pipe which was attached to one of the legs of the platform supporting the weather station. The NGVD’29 elevation of the transducer in the water column was determined using a Trimble R8 GNSS receiver (
www.trimble.com). Data were downloaded every other week manually onto a laptop PC via RS232 connection. All surface water elevations were transformed to NAVD’88 format and computed so that they were relative to the average Lake Trafford surface water level of NAVD'88 5.53m. Water volume could then be determined using the relation described in section 2.2.
2.9. Final Water Budget
The final water budget for Lake Trafford used the measured or computed water fluxes to determine the unknown flux volume of surface runoff as sheet flow. Sheet flow for this study is considered diffuse runoff directly into the lake (not into the five canals) and surface water outflow to the surrounding wetlands during high water levels. Sheet flow was calculated as the difference between the measured net water flux and the true change in storage. Using this method, only net sheet flow could be calculated. Thus, it is unknown what the true percentage of the total water influx entering Lake Trafford is runoff and what percentage of the true water efflux is sheet flow.
4. Discussion
4.1. Influence of Groundwater Flow
Groundwater discharge and recharge values for Lake Trafford are within the normal range of values typical of Florida lakes [
37,
48]. Groundwater flow measurements throughout the course of the study indicated that groundwater flow was occurring in all areas of Lake Trafford at some point throughout data collection, including deep water sites. In most cases, groundwater discharge occurs in the shallow areas of lakes, where lake level and groundwater level discrepancies are most pronounced.
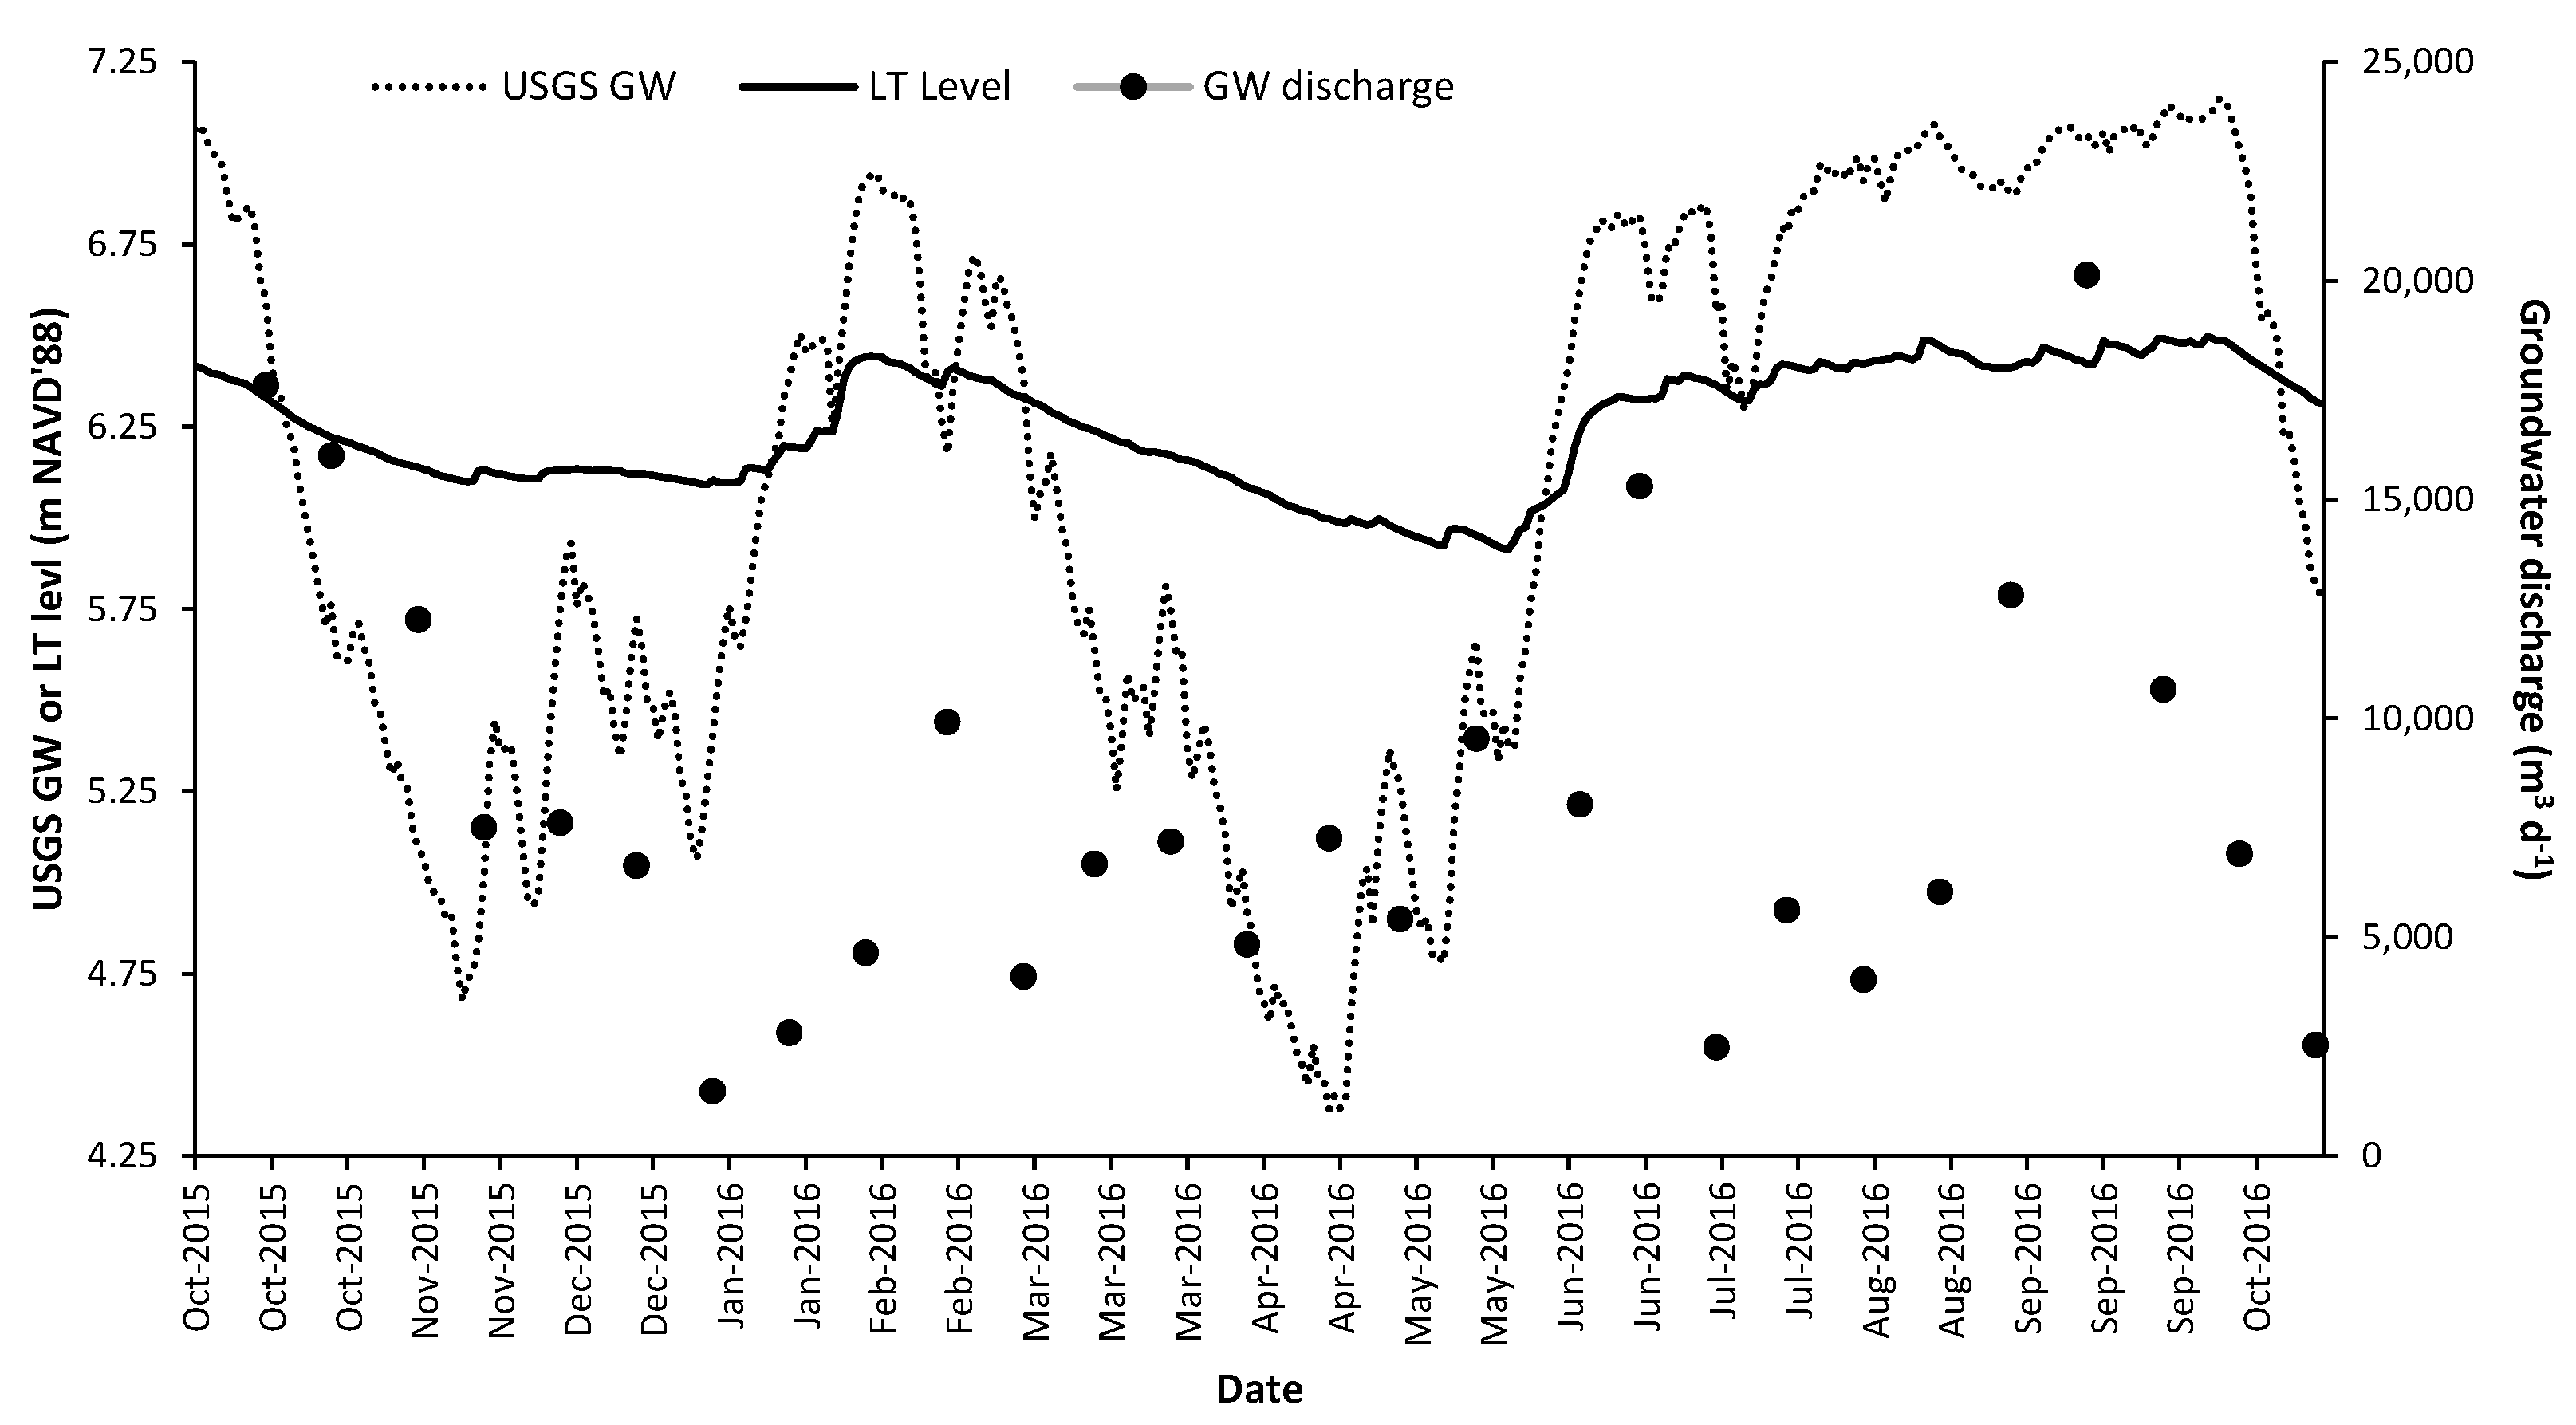
Figure 19 shows the difference in water level and groundwater level from a nearby USGS monitoring well (USGS 262554081283801 C- 687) during the study. Water level elevation discrepancies were as high as one meter, and groundwater elevation was found to be both above and below lake level elevation at various points during the study period. Groundwater discharge closely mirrored the groundwater elevation at the beginning of the study but became less correlated as El-Niño related rains began in January. This may be due to rainfall and sampling time biases.
Time of sampling relative to rainfall was a driver in measured groundwater seepage, with flow rates taken days after rainfall being low or mostly negative compared to sampling events with no rainfall. This paradigm is expected as Schiffer [
49] points out that rainfall can increase lake water elevation faster than groundwater elevation, thus creating a negative or balanced hydraulic head, limiting groundwater discharge into a waterbody. It is unknown if groundwater discharge would have increased to higher levels in the days after sampling. This single day of sampling was used as the average flow rate for each biweekly event. Because of this, groundwater inflow may be much higher than indicated during each biweekly event and may correlate better with local groundwater elevations.
Deep seepage meters were the most predictable of all the sampling locations, with seepage bag volumes increasing in almost every event. This is an atypical occurrence in most lakes [
49,
50]. Groundwater discharge in the center of lakes is typically indicative of a high potentiometric head moving water upward from deeper in the aquifer. This condition is less common, and it is unclear if Lake Trafford falls into this category. However, the very shallow depth of the lake likely limits the impacts of deep seepage. Furthermore, with all five (plus the duplicate) seepage meters showing groundwater discharge in these areas, it is unlikely that this measured flow is erroneous. The latest hydrogeological report for Collier County indicates that the base of the Surficial Aquifer System is deep in this area, and the Lower Tamiami confining unit is absent or insignificant [
33]. The heterogeneity of the hydraulically connected aquifer influences the potential for deep upward seepage in that the uppermost quartz sand unit has a vertical hydraulic conductivity at least two orders of magnitude less than the underlying shell and limestone.
Another possible reason for the atypical spatial patterns of groundwater discharge is the influence of sediment dredging. Genereux and Bandopadhyay [
51] found that increased discharge further offshore in shallow lakes typically occurs when the lakebed is covered with dense organic sediment with a low hydraulic conductivity. Mapping of the sediment thickness was conducted in Lake Trafford (this study) and compared with the sediment thickness prior to dredging [
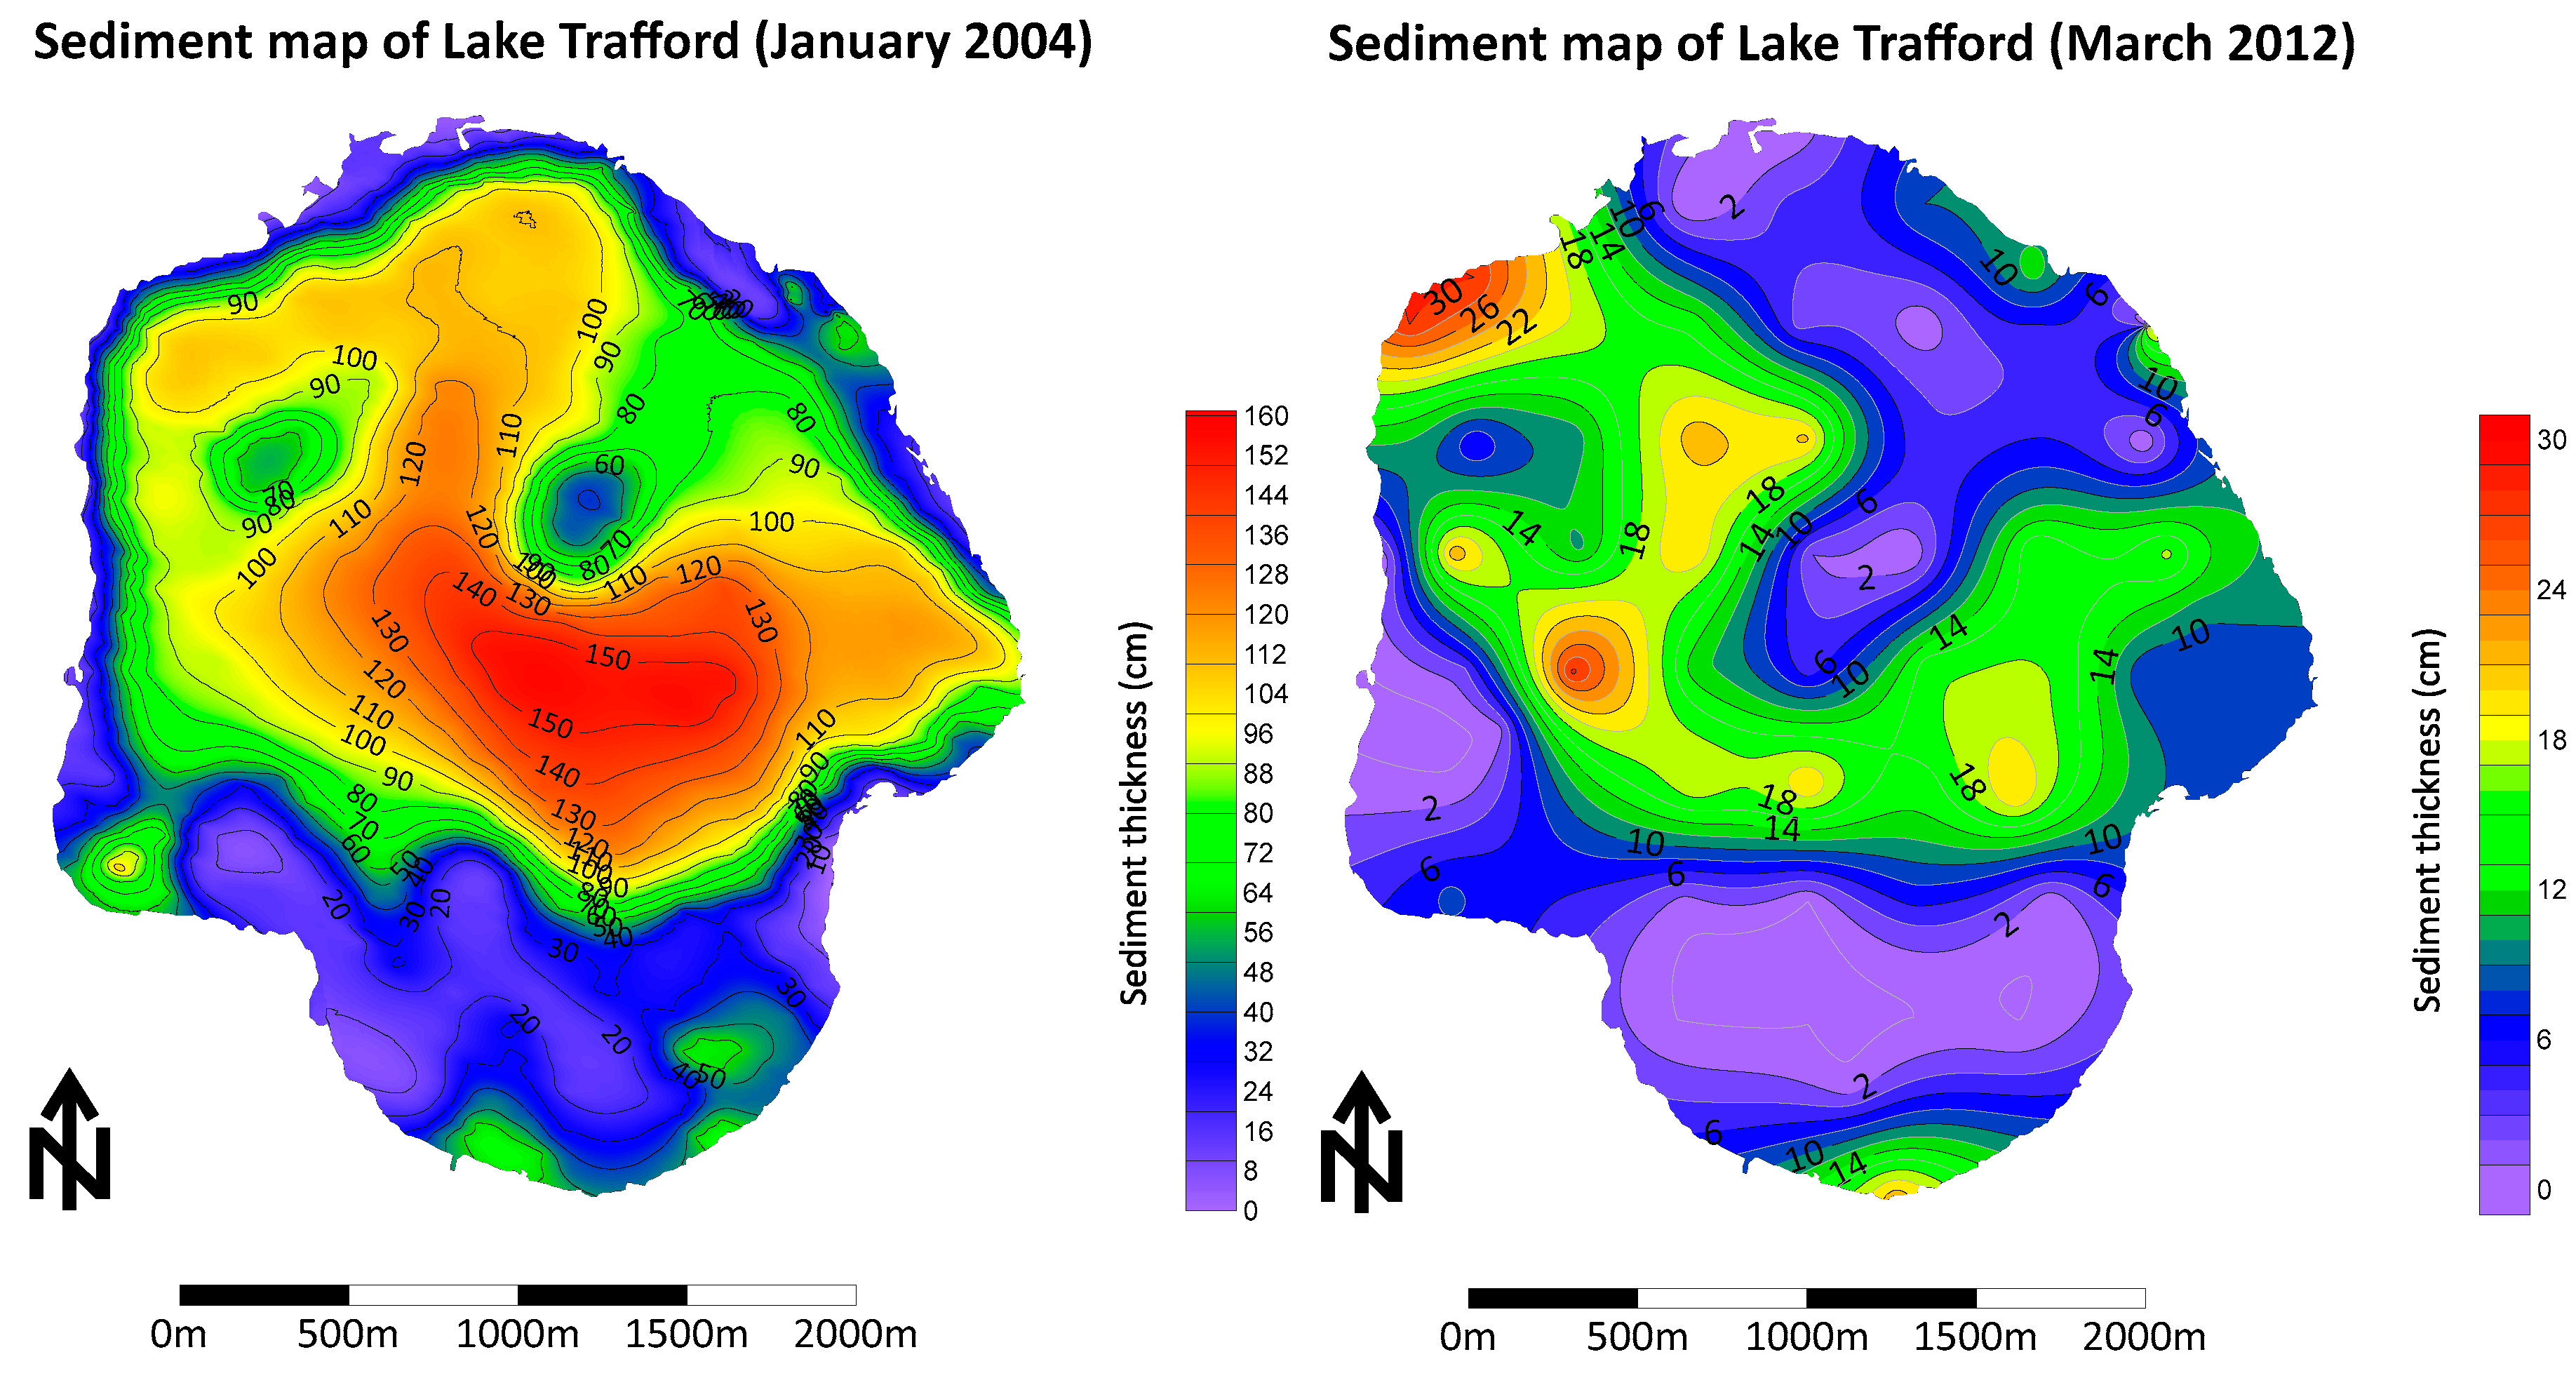
28] and showed the expected reduction in organic sediment accumulation in especially the central portion of the lake (
Figure 18). In addition to the lower thickness of the organic sediment, it is likely that the density of the organic material was lessened during dredging. This also increases the vertical hydraulic conductivity and allows less inhibition for groundwater inflow. The alteration of the vertical hydraulic conductivity in the center of the lake merits further investigation.
4.2. Usage of Groundwater Seepage Meters
The use of groundwater seepage meters is often accompanied by a plethora of problems, such as bag breakage or loss [
52]. However, in this study, seepage measurements were mostly successful with only 23 lost/detached or broken bags out of 685 total bag deployments (96.6% successful bag deployments). Only eight meters needed to be reseated due to “blowout,” and 3 meters lost their marker buoy. This is a much lower unsuccessful bag deployment ratio than other studies using groundwater seepage meters (e.g. Harper [
48]; 55% of bags lost). The relative success likely stems from the short sampling period of groundwater flow limited to 24-hours. This short duration, while ideal for bag preservation, introduces other issues. For example, shorter sampling durations lack temporal resolution compared to extended bag placement times and may be more influenced by temporary conditions, such as hydraulic head loss post rainfall.
Flow through the seepage meters may also have been lower due to the relatively high-water levels experienced during the study period. Seepage meters were placed in June of 2015 when water levels were approximately 5.1 m NAVD’88. Lake stage never fell below 5.5 m NAVD’88 during sample collection, leaving meters deeper and further from the true boundary of the lake than would have been ideal [
50]. Having several groups of seepage meters to be used at various levels of lake stage would have solved this issue [
53] but would have been costly and especially difficult to implement since the lake boundary is very undefined as it extends to a densely vegetated flood plain/wetland when lake water level is high.
4.3. Canal Influence
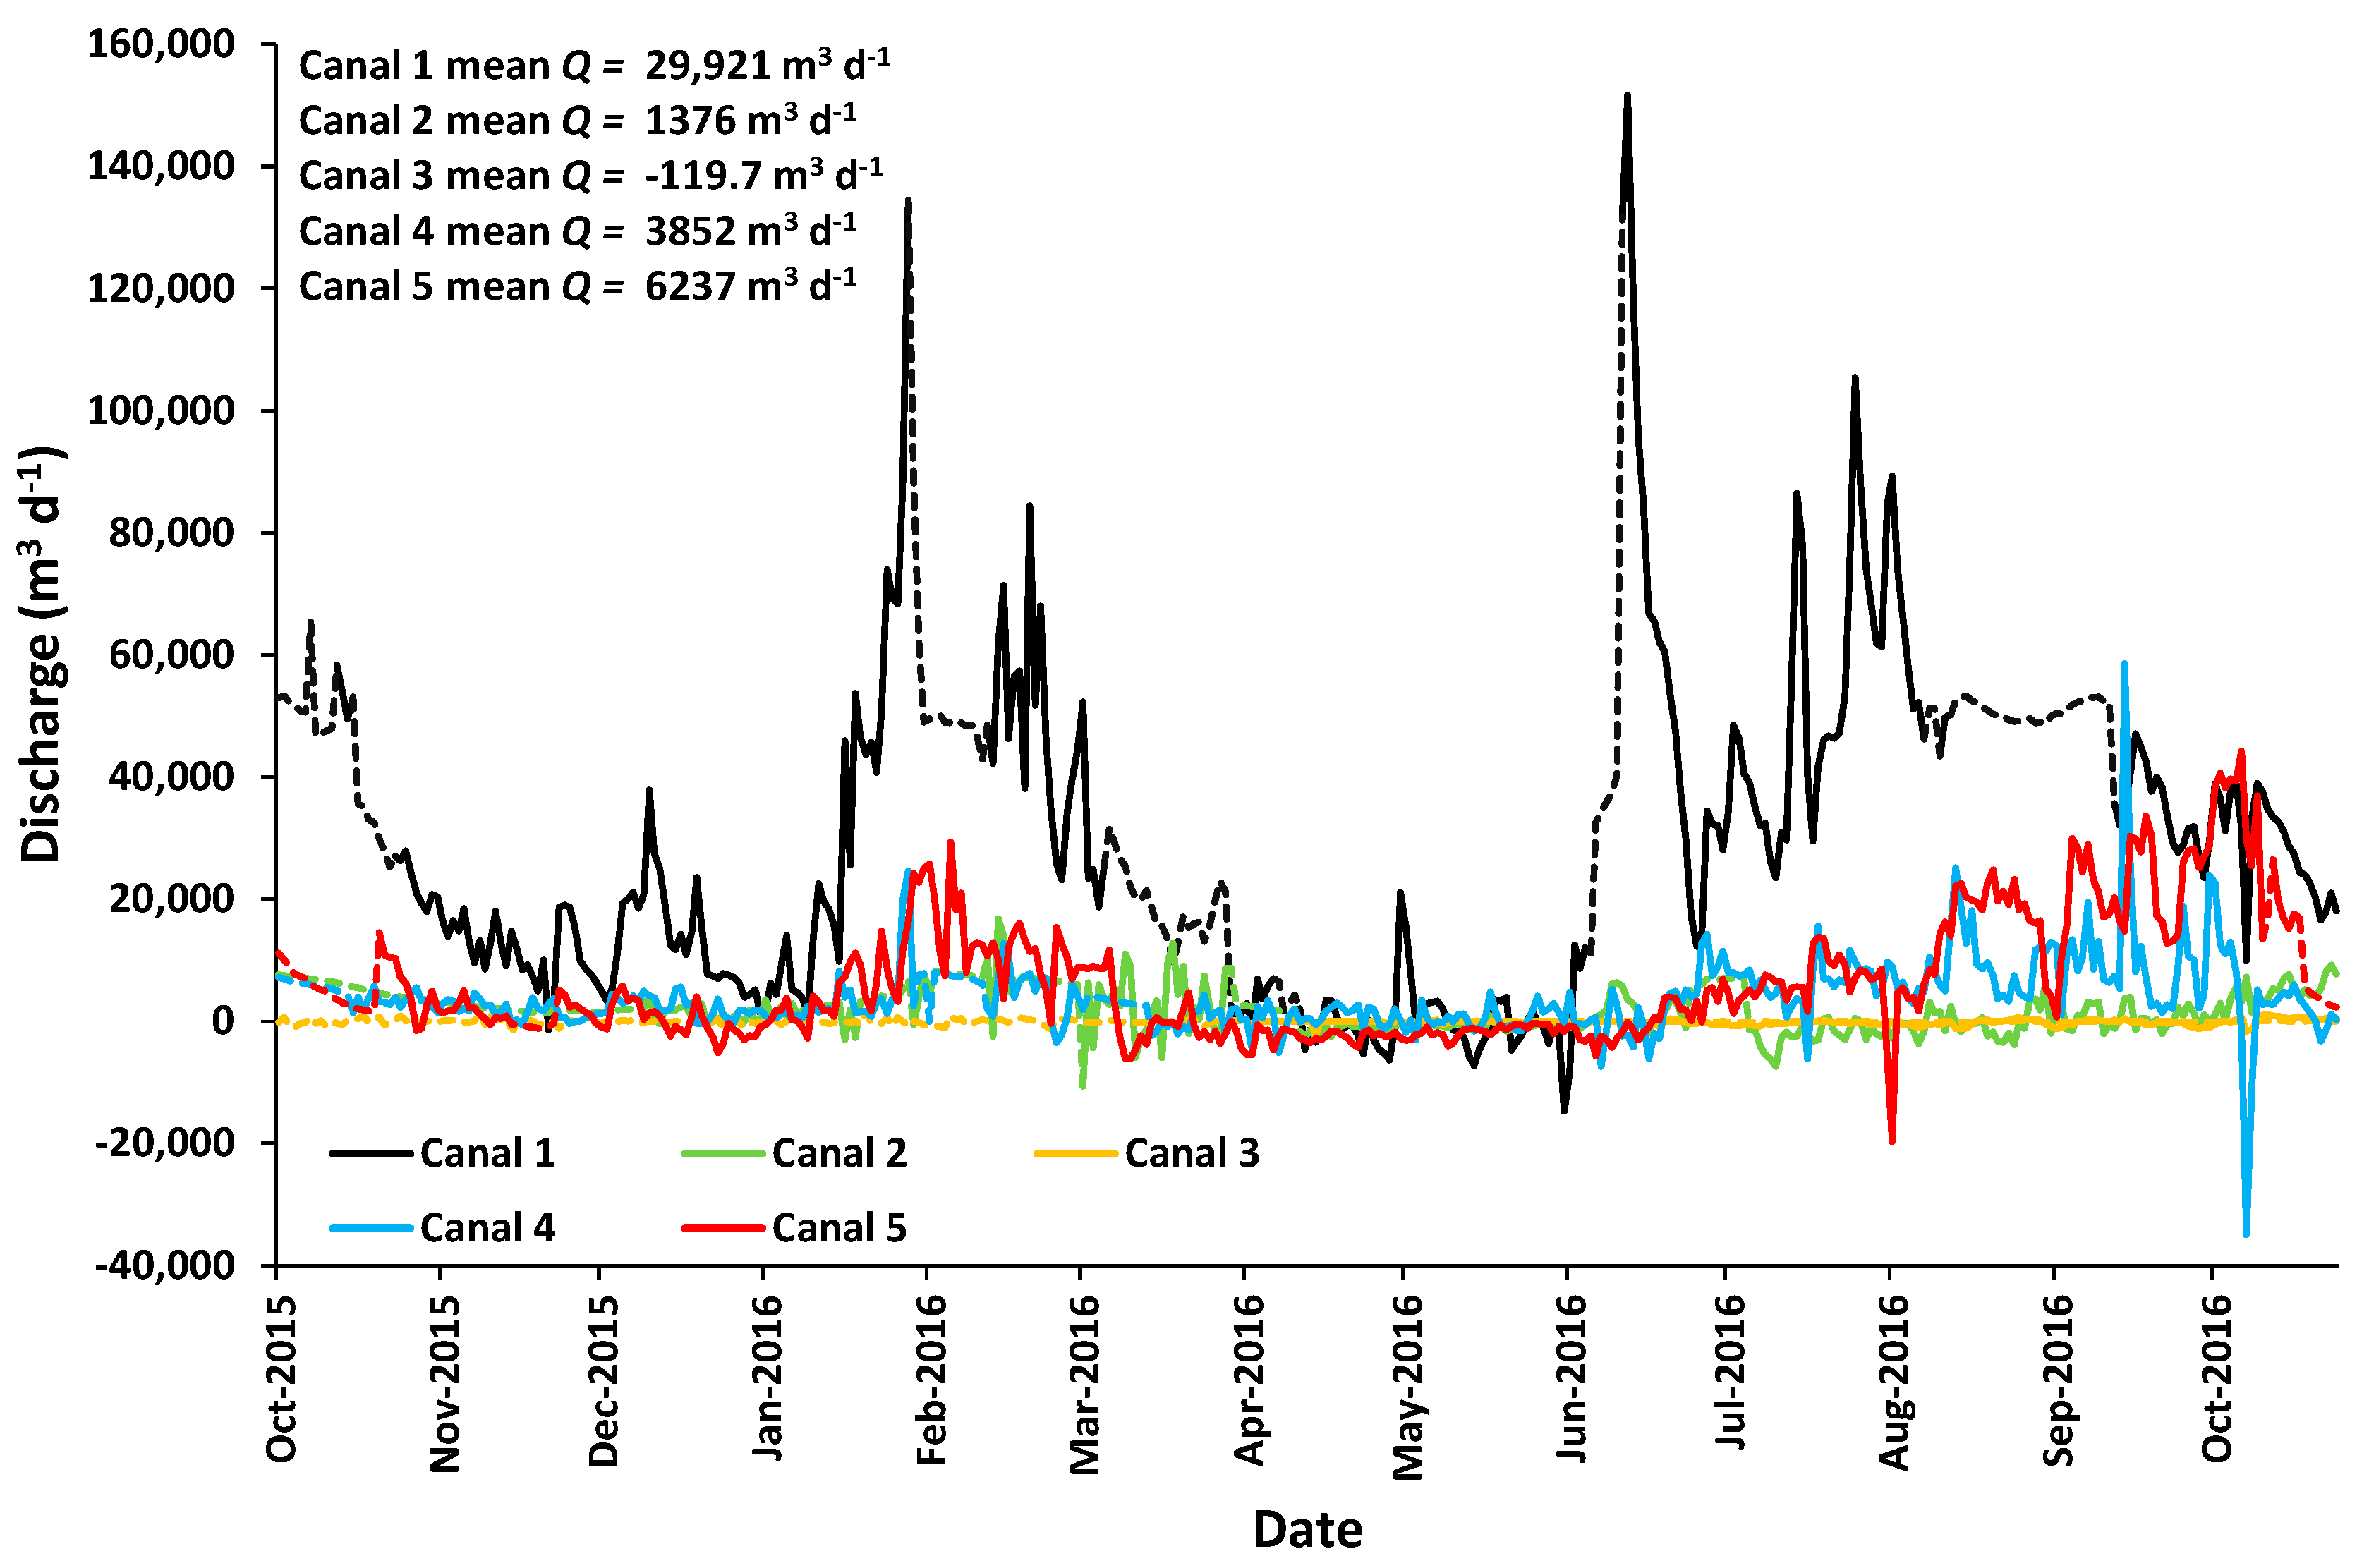
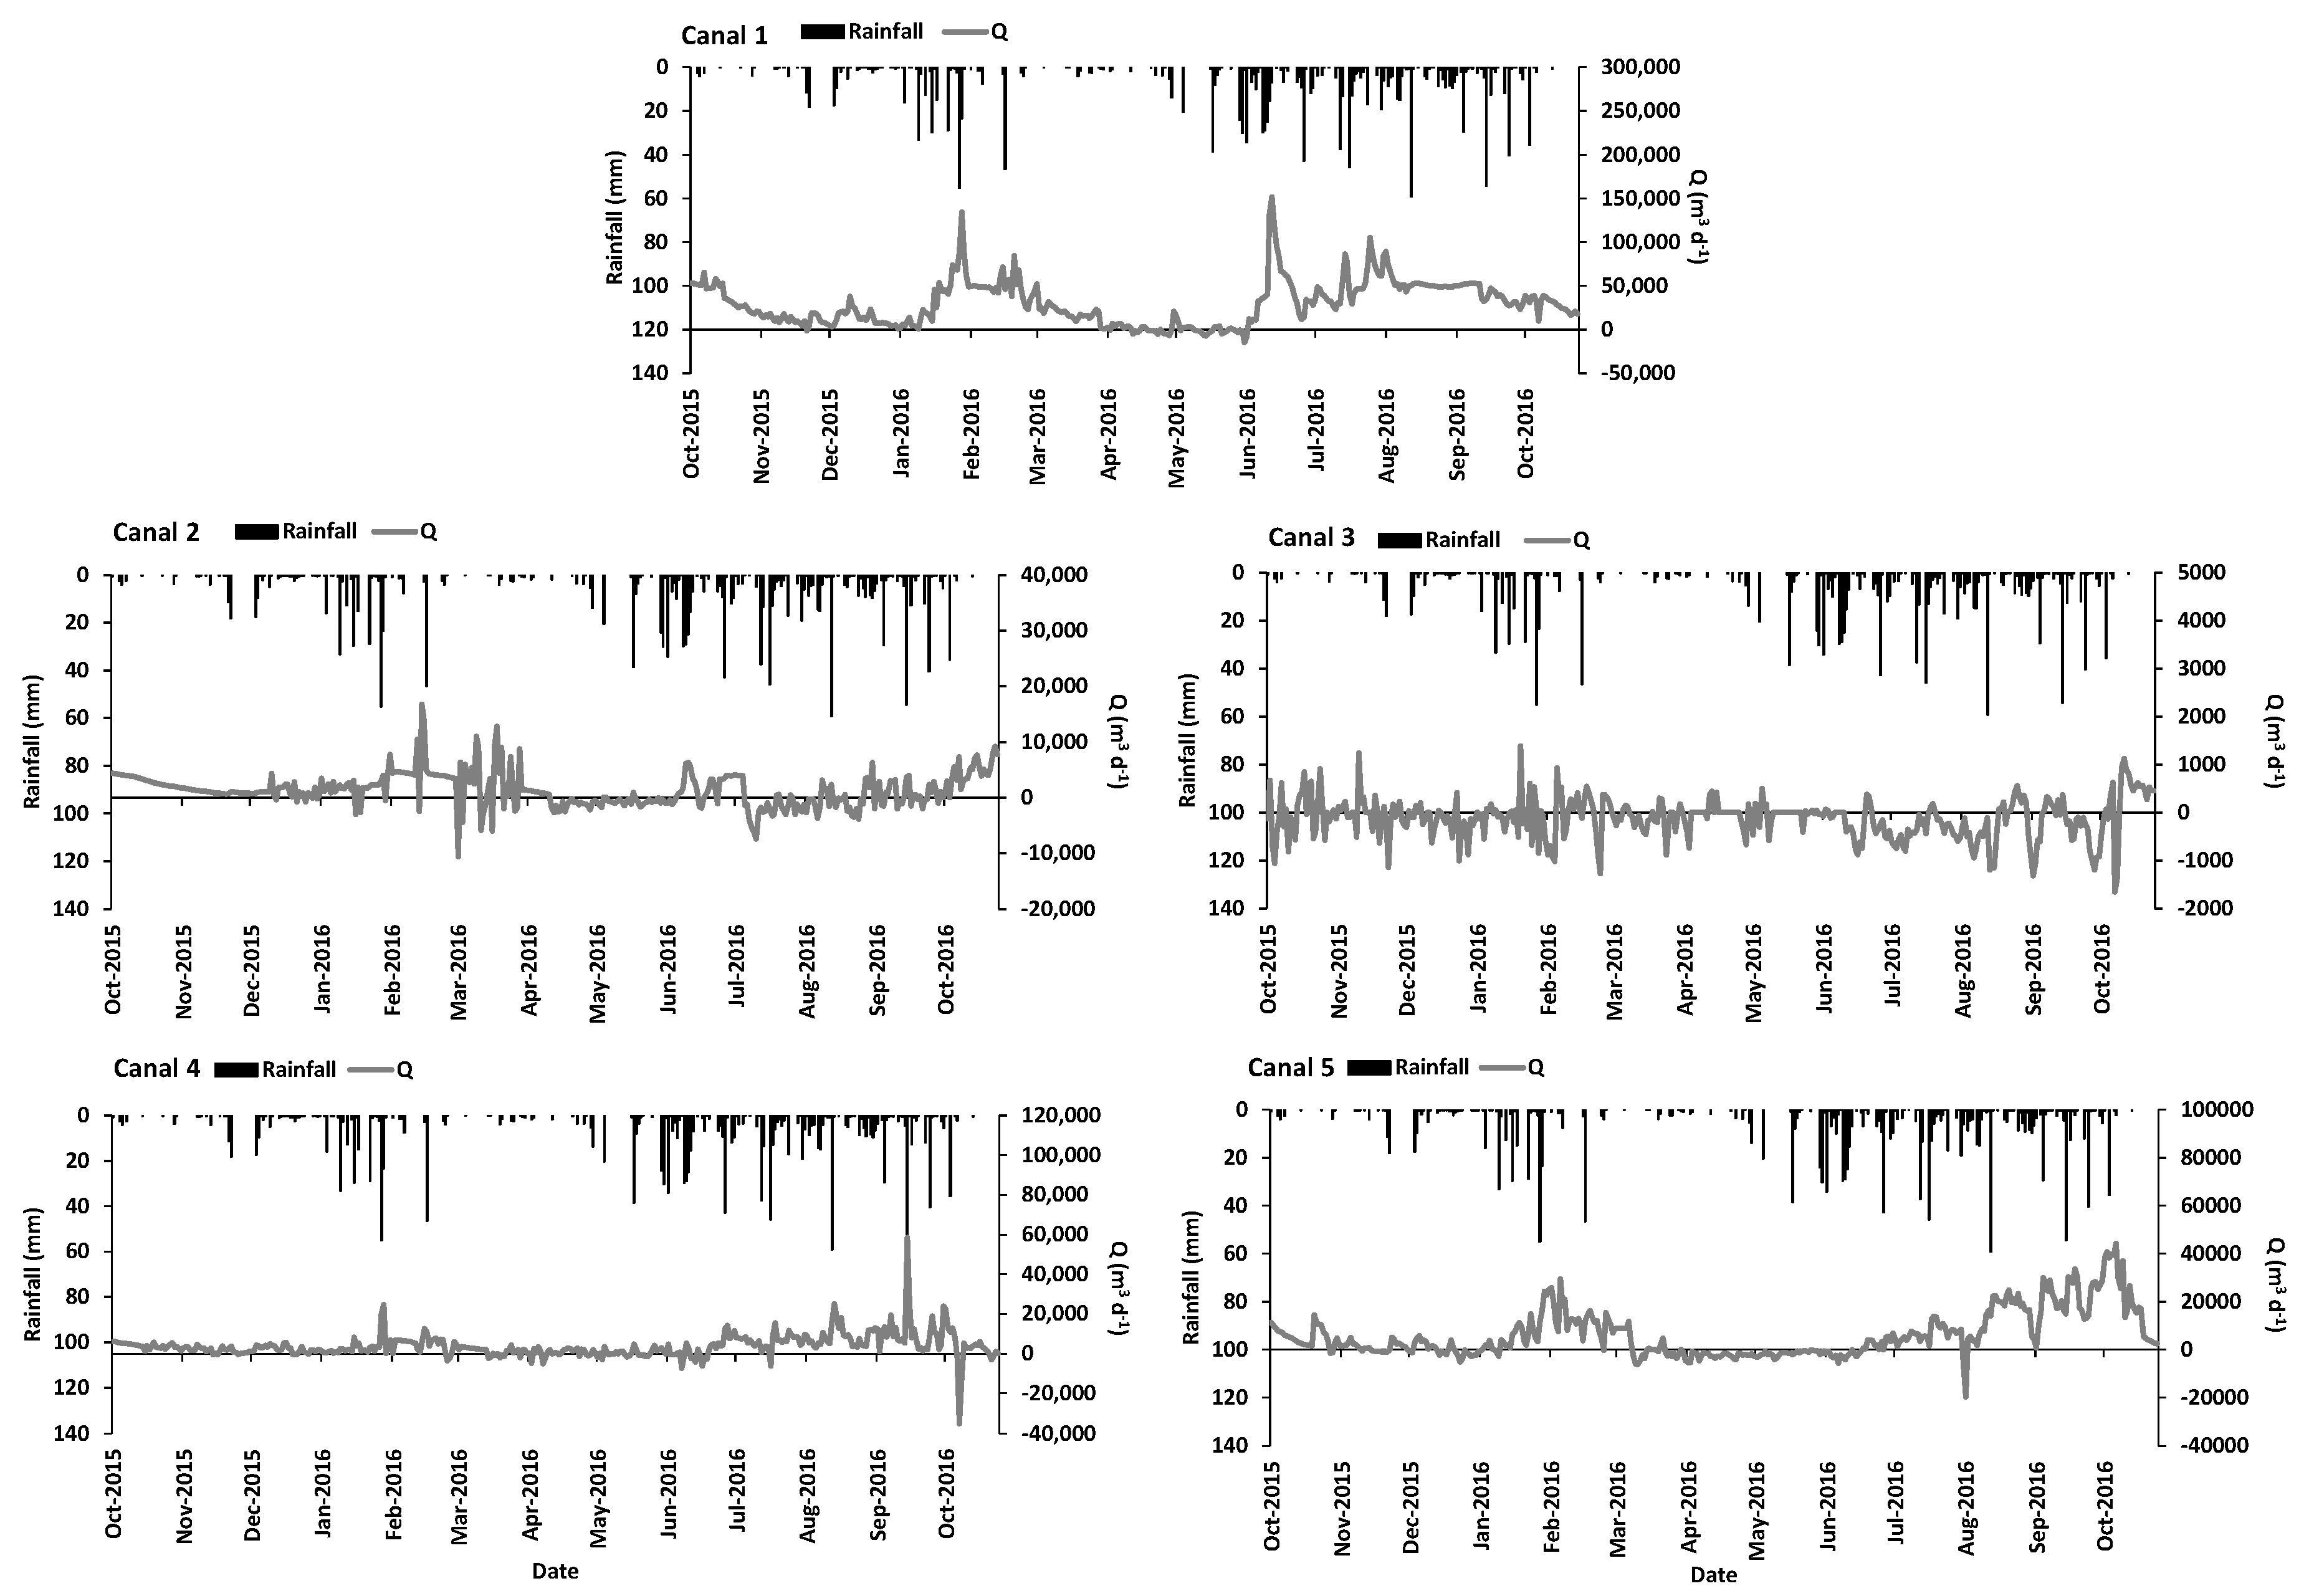
Canal discharge was, as expected, dependent on rainfall, with flows mostly stagnant during extended dry periods. Data quality was good, but the Sontek IQ units were often unreliable and led to many gaps in Q data when they needed to be removed for repair. The vast majority of discharge occurred from Canal 1, which also had the highest concentrations of nitrogen and phosphorus, making it a substantial source of water and nutrients into Lake Trafford.
It is hypothesized that Canal 1 may experience much more flow due to its connection with the Immokalee Slough (
Figure 2), a wetland area that extends east from Lake Trafford, meandering its way between farmland to the south and the City of Immokalee to the north. This area is clearly within the Lake Trafford drainage basin and is likely the reason for the higher
Q and nutrient concentrations in Canal 1. Increased impervious surface area from the City of Immokalee and agricultural runoff from the lands to the south are potentially the source of the excessive nutrients, especially stormwater runoff which is likely channeled into the slough.
It is likely that higher positive sheet flow volumes would have been observed under a more typical hydrological pattern for this area (i.e., for a non-El-Niño year), with a lower stage during the winter and spring months. Using the final water budget inputs, the lake water volume turns over 2.13 times a year for a residence time of 171 days.
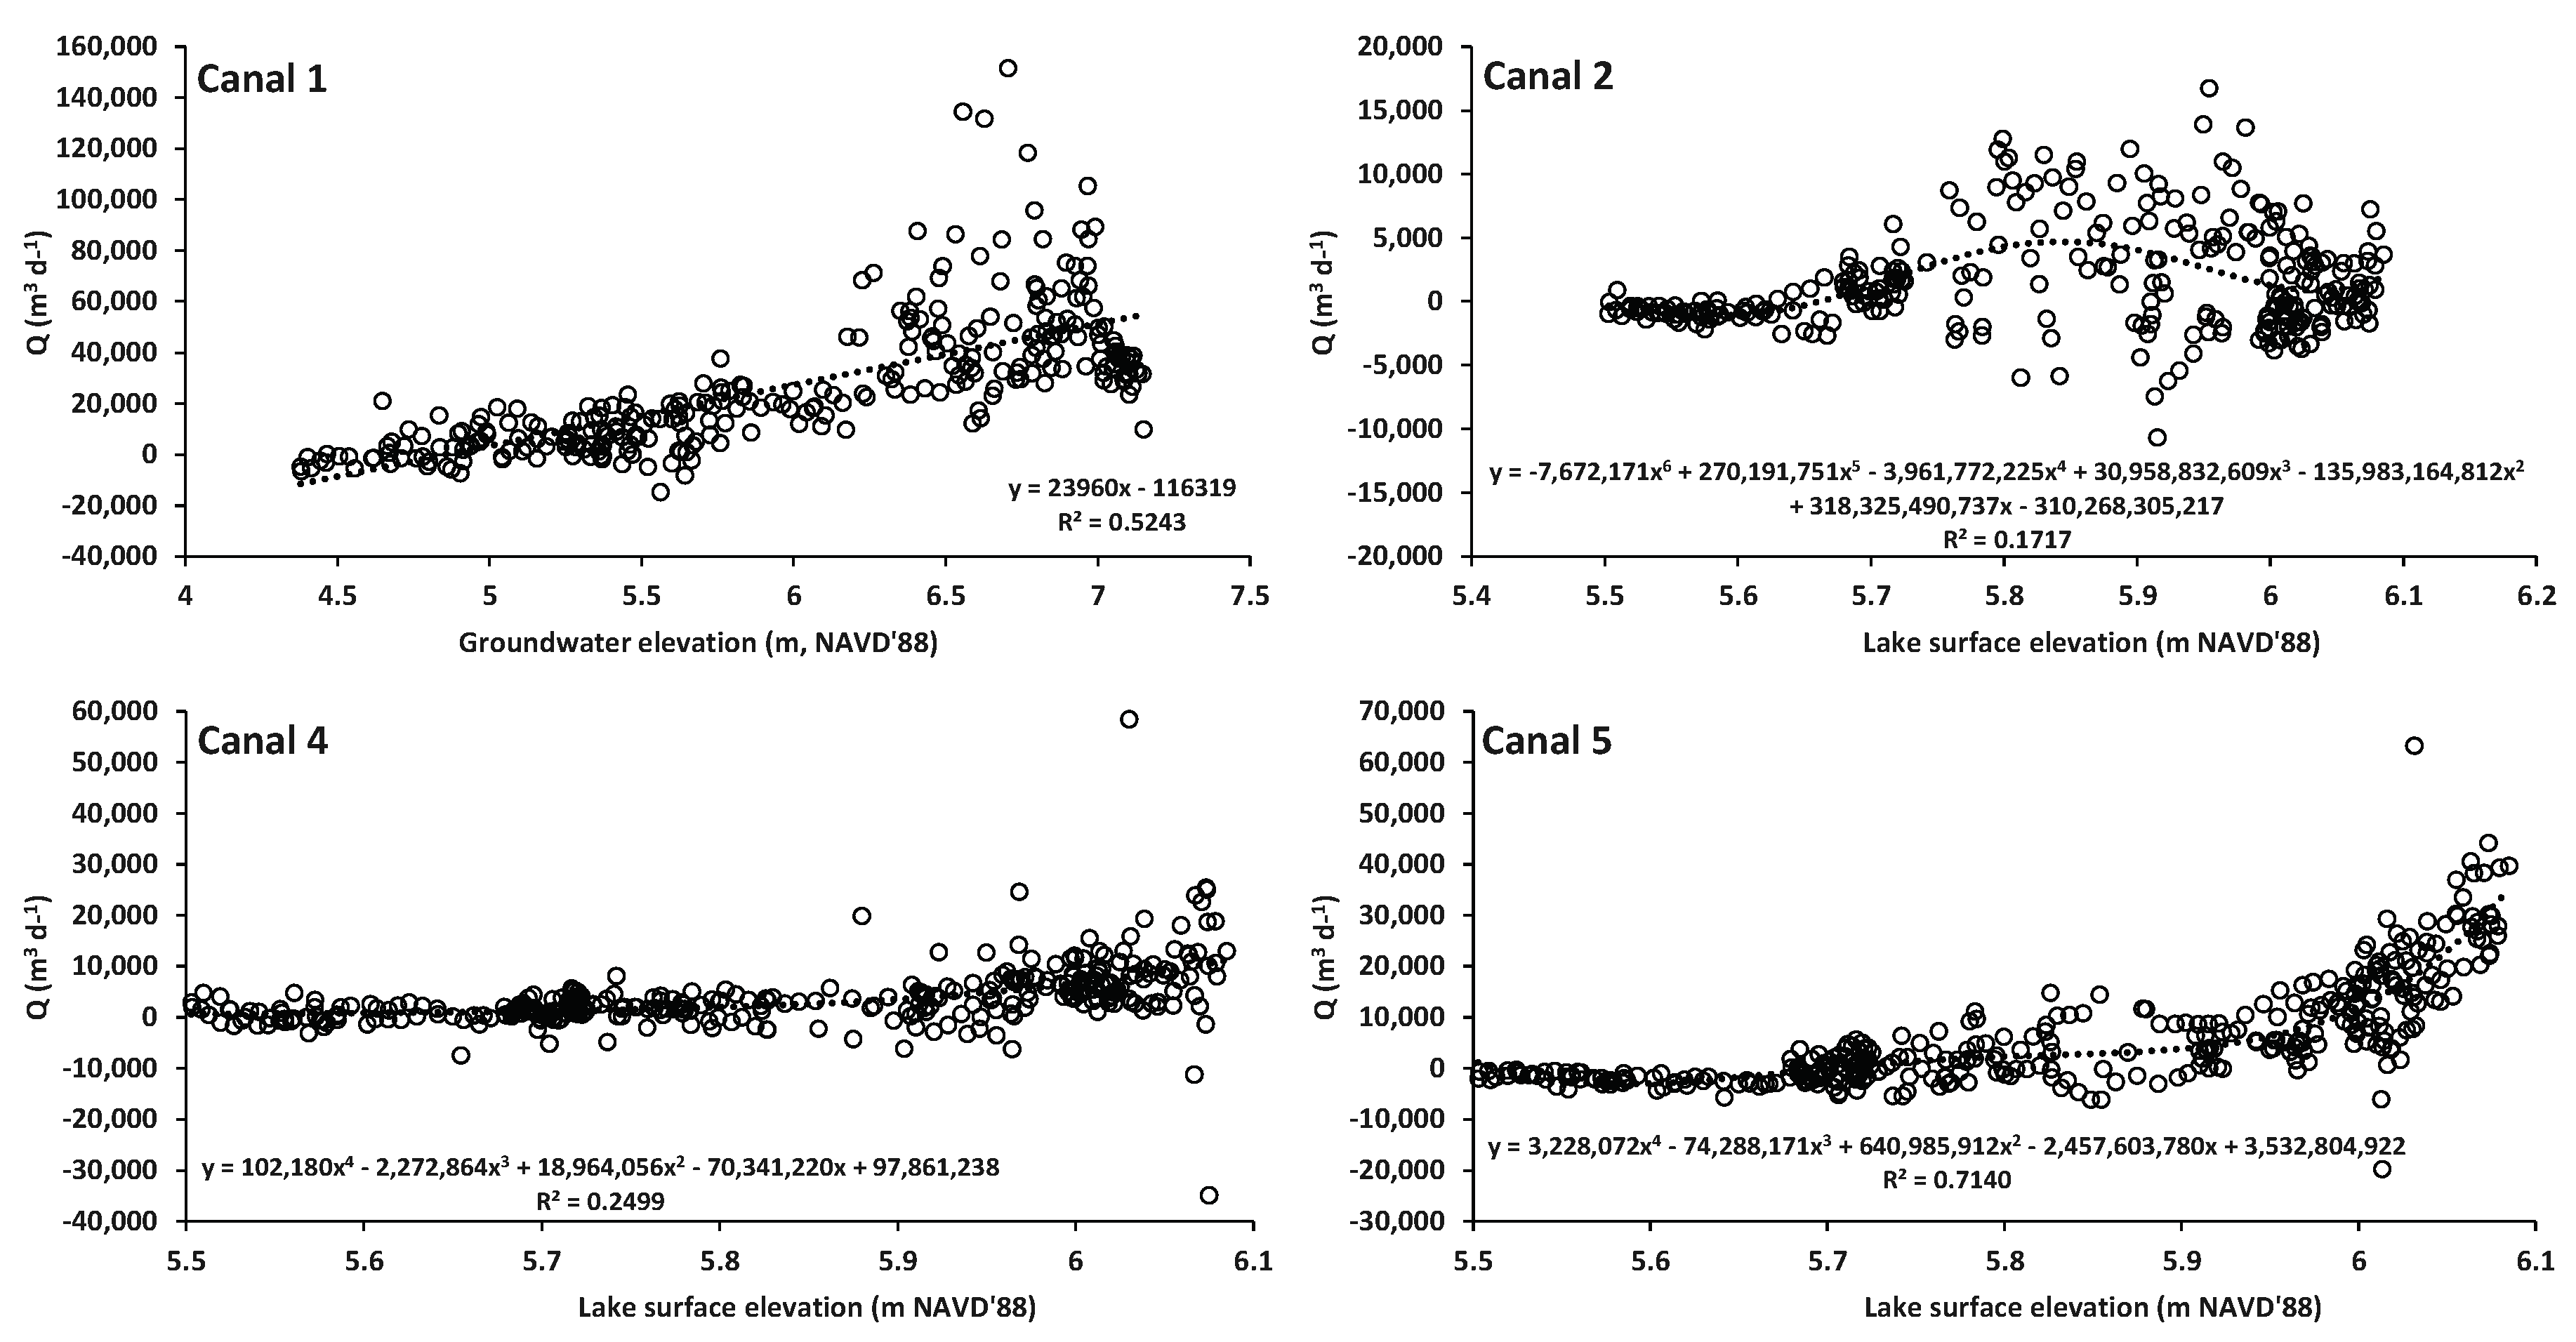
Canal flow was measured directly in this study and the data may be useful for modeling flow from these canals in the future. The canals correlated well with groundwater level and rainfall. Using Automated Neural Networks (ANN), a more accurate estimation of canal discharge would likely be possible using known groundwater levels, rainfall totals, and other engineered data features.
4.4. Rainfall
Rainfall totals in the Corkscrew area (SFWMD station name “CORK.HQ_R”, Latitude North 262301.294, Longitude West 813459.278) averaged 1484 mm per year from 1959 to 2007 (DBHYDRO, 2007). The rainfall total during the 2015-2016 study period was found to be 1222 mm measured at the installed weather station on Lake Trafford and 1582 mm at IFAS Immokalee FAWN station. Rainfall during the wet season followed the typical historical patterns while the dry season was much wetter than average. Using statistical modeling methods from South Florida Water Management District [
54], the amount of rainfall measured between November 2015 and May of 2016 is considered a “1 in 10-year event” or an event that only occurs in 10% of years. Rain gauges equipped with a tipping bucket underestimate rainfall
a fortiori when the rainfall rate is high over a short period of time. This could partially explain the lower-than-average rainfall during summer 2016 recorded at the installed weather stations. Algorithms are often used to estimate the correct rainfall during said high precipitation events.
4.5. Water Budget
The final calculated water budget showed groundwater to be a relatively small contributor and was measured at only 30% of the rate estimated in the TMDL HSPF model [
22]. However, true groundwater discharge may be higher than recorded as previously discussed. Evaporation and sheet flow are the primary hydrological outputs from Lake Trafford, with groundwater recharge only accounting for 0.5% of the outflow. Evaporation estimates agree with the TMDL report estimates, differing by only 2.3%. The average evaporation rate observed was very similar to other lakes in Florida (Lake Trafford: 3.59 mm d
-1, Lake Okeechobee, 3.61 mm d
-1; [
55]).
There is a very clear relationship between lake stage and sheet flow. As stage increases, net sheet flow becomes increasingly negative. As stage decreases, net sheet flow becomes more positive. This fits logically with the assertion that Lake Trafford feeds the wetlands to its south and west with overflowing water when water levels approach 6.0 m NAVD’88. Net sheet flow values become increasingly negative as lake stage increased above 5.7 m NAVD’88, reaching its highest value around 6.0 m NAVD’88. Rainfall also appears to drive positive sheet flow with diffuse runoff entering the lake after rain events. This can be seen as an upward spike in net sheet flow following larger rain events. These spikes can also be found in the stage elevation, as runoff and direct precipitation increased lake levels.
Negative net sheet flow was the norm during the study period, again related to the much wetter than average winter of 2015-2016. Due to the methodology used in this study, it is unknown how much of the net sheet flow calculated was incoming and outgoing sheet flow. It is possible that the higher water levels not only increased outgoing sheet flow, but the increased rainfall also increased incoming sheet flow, but to a lesser degree. The lack of resolution in this regard is a limitation of this project. Moreover, it is unclear how much runoff is channeled by the five canals before entering the lake. It is possible that the amount of direct surface runoff outside of the canals is small, and somewhat insignificant. This hypothesis may be backed up by the Lake Trafford adopted TMDL. Using a wet year from the TMDL sampling period to better compare with the conditions of this study (2005 – 1,650 mm rainfall), the daily runoff average was estimated to be 38,358 m
3 d
-1 [
22]. Discharge from the canals in this study has averaged 35,066 m
3 d
-1. More data would be useful to confirm that the majority of runoff entering Lake Trafford enters through the canals. If true, it would also make remediation and load reduction projects easier to accomplish.
4.6. Future Study
Further areas of study that could prove to be valuable have been highlighted by this project. Because the Lake Trafford boundary is often ambiguous and highly vegetated, a piezometer study with sites that extend beyond the lake boundary into the surrounding wetlands may be better suited for monitoring groundwater discharge and recharge around the lake than seepage meters alone. Ion and radio isotope research on the groundwater entering Lake Trafford could also be valuable for determining the sources of inflowing groundwater and potentially point to sources of groundwater pollution. Additionally, studying the hydrogeology beneath Lake Trafford may explain the unusual flow patterns.
5. Conclusions
Lake Trafford is a small subtropical lake with an average volume of 11,483,252 m3 located in southern Florida. It has been impacted by cultural eutrophication caused by excessive loading of nutrients. A key aspect of lake restoration is the understanding of the water balance of the lake, so remedial actions can be designed to improve water quality. Therefore, a detailed investigation of the water budget was conducted with direct measurements made on the groundwater influx and exit, the surface water influx via canals, the direct rainfall input, measurements of various parameters that control free surface evaporation, modeling of the evaporation loss, and an estimate of the sheet flow of surface water out as a residual parameter of the calculated water balance. Based upon a thorough literature review, this one-year investigation was one of the most detailed ever made for any subtropical lake.
Inflow into the lake was dominated by surface water flows via canal and amounted to 61% of the total influx. Groundwater was found to contribute only about 30% of the inflow to the lake and rainfall contributed the remaining 9%. Inflows from the lake were evaporation, groundwater recharge, and surface flow during high water periods. Discharge from the lake was dominated by evapotranspiration at 30.5 % and sheet flow at 61 %. Groundwater recharge exiting the lake was about 0.5% of the outflow. Sheet-flow only occurred when the lake stage exceeded 6.0 m NAVD’88 with wet season rainfall being the primary factor controlling the lake stage increase leading to sheet-flow exit. Estimation of seasonal sheet flow was the primary limitation to this investigation in that there is no means of measuring it directly.
Removal of 30 M metric tons of organic sediment seems to have impacted the interaction of groundwater with the lake. It likely increased the flow rate in the deeper parts of the lake and had mixed results along the lake banks. The current post-remedial lake condition may have led to the rather unusual pattern of groundwater entry into the lake.
Figure 1.
Lake Trafford watershed boundary delineated in 2017 [
21] and revised from Kang and Gilbert [
22] watershed delineation.
Figure 1.
Lake Trafford watershed boundary delineated in 2017 [
21] and revised from Kang and Gilbert [
22] watershed delineation.
Figure 2.
Satellite image of Lake Trafford and the adjacent land to its east. The Immokalee Slough is highlighted in opaque blue. Each canal is delineated with a white line and the sampling stations in those canals are marked with white circles. Canal 1 can be seen in the terminating area of the slough.
Figure 3.
Top left: Diagram of the slightly tilted groundwater seepage meter with its collecting bag attached. Bottom left: Sontek IQ flow velocimeter for canal water flow measurement. Right: Location of the seepage meters (closed dots) within Lake Trafford. Meters 3, 5, 10 and 13 were used to estimate seepage variation for a given location.
Figure 4.
Bathymetric map of Lake Trafford for a surface water elevation of NAVD’88 5.53m. Bathymetry data were used to determine volumes and planar surface areas at various lake levels using Surfer 26.
Figure 4.
Bathymetric map of Lake Trafford for a surface water elevation of NAVD’88 5.53m. Bathymetry data were used to determine volumes and planar surface areas at various lake levels using Surfer 26.
Figure 5.
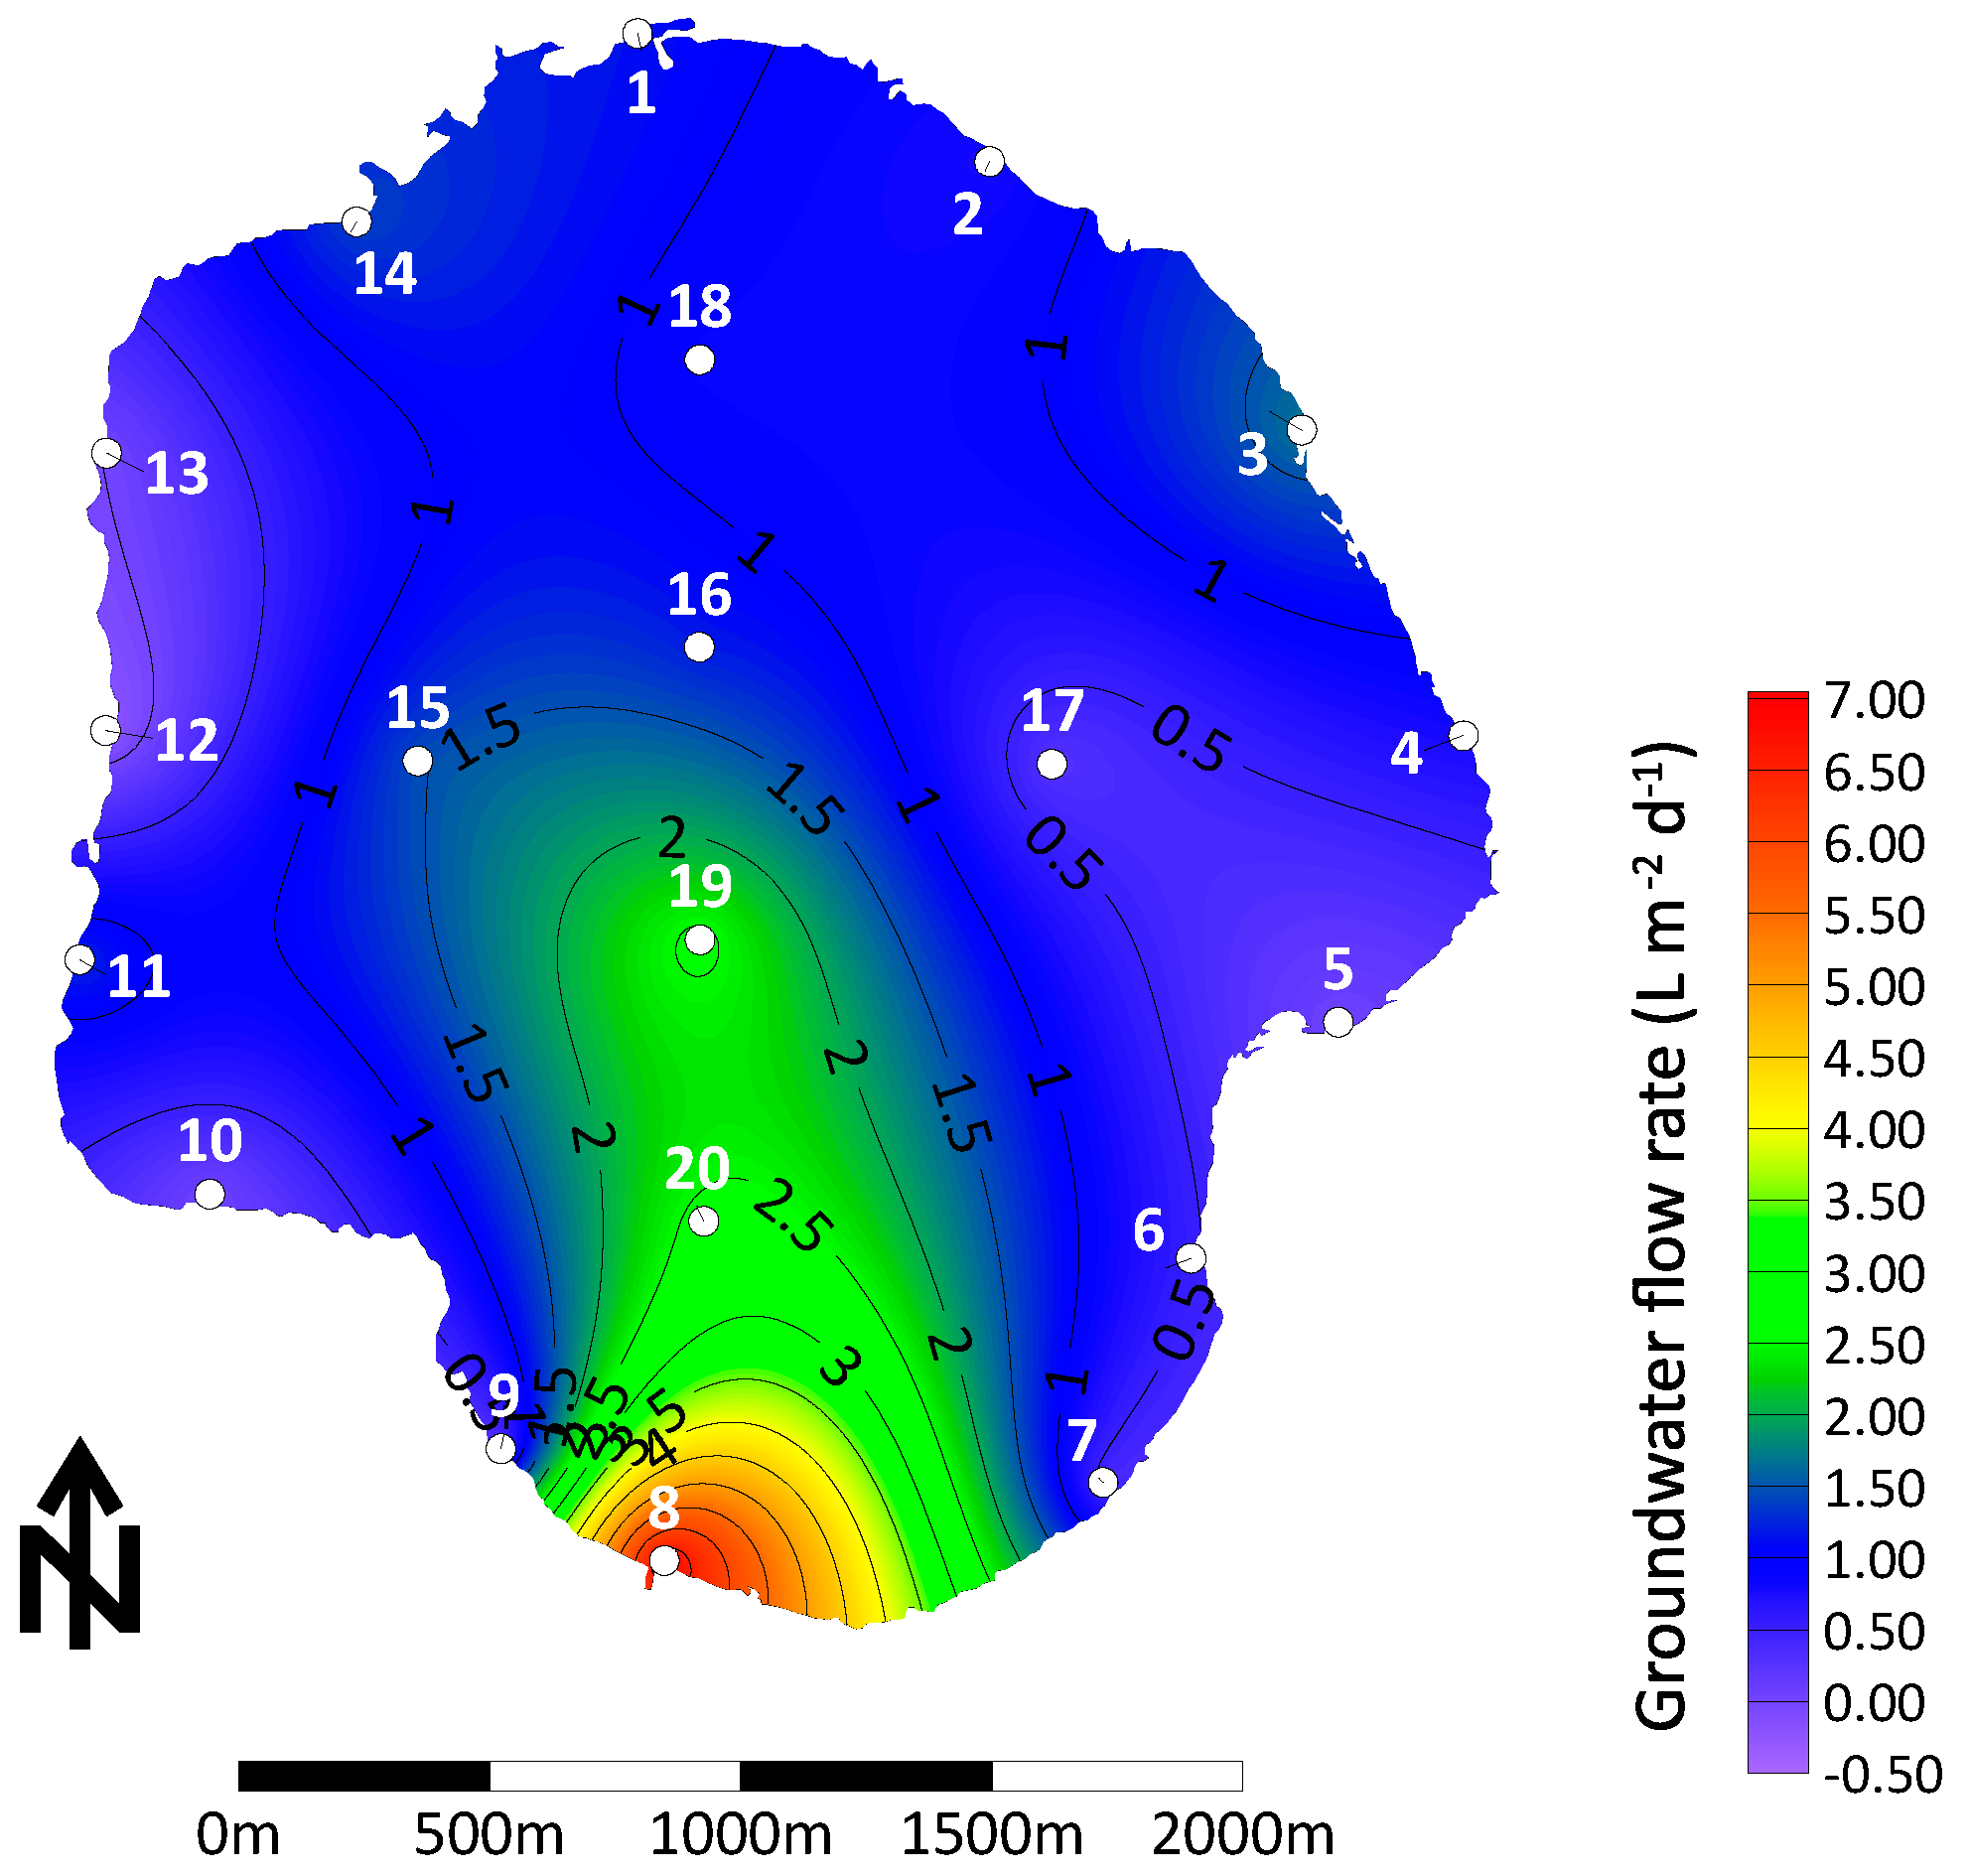
Map of the average groundwater flow rate (L m-2 d-1) using all flow data from the 28 sampling events. Note meters 8, 19, and 20 which had high positive flow averages, while meters 2, 3, 5, 6, 10, 12, and 13 had low or negative averages. Meter numbers are shown on the map next to their locations (closed white dots).
Figure 6.
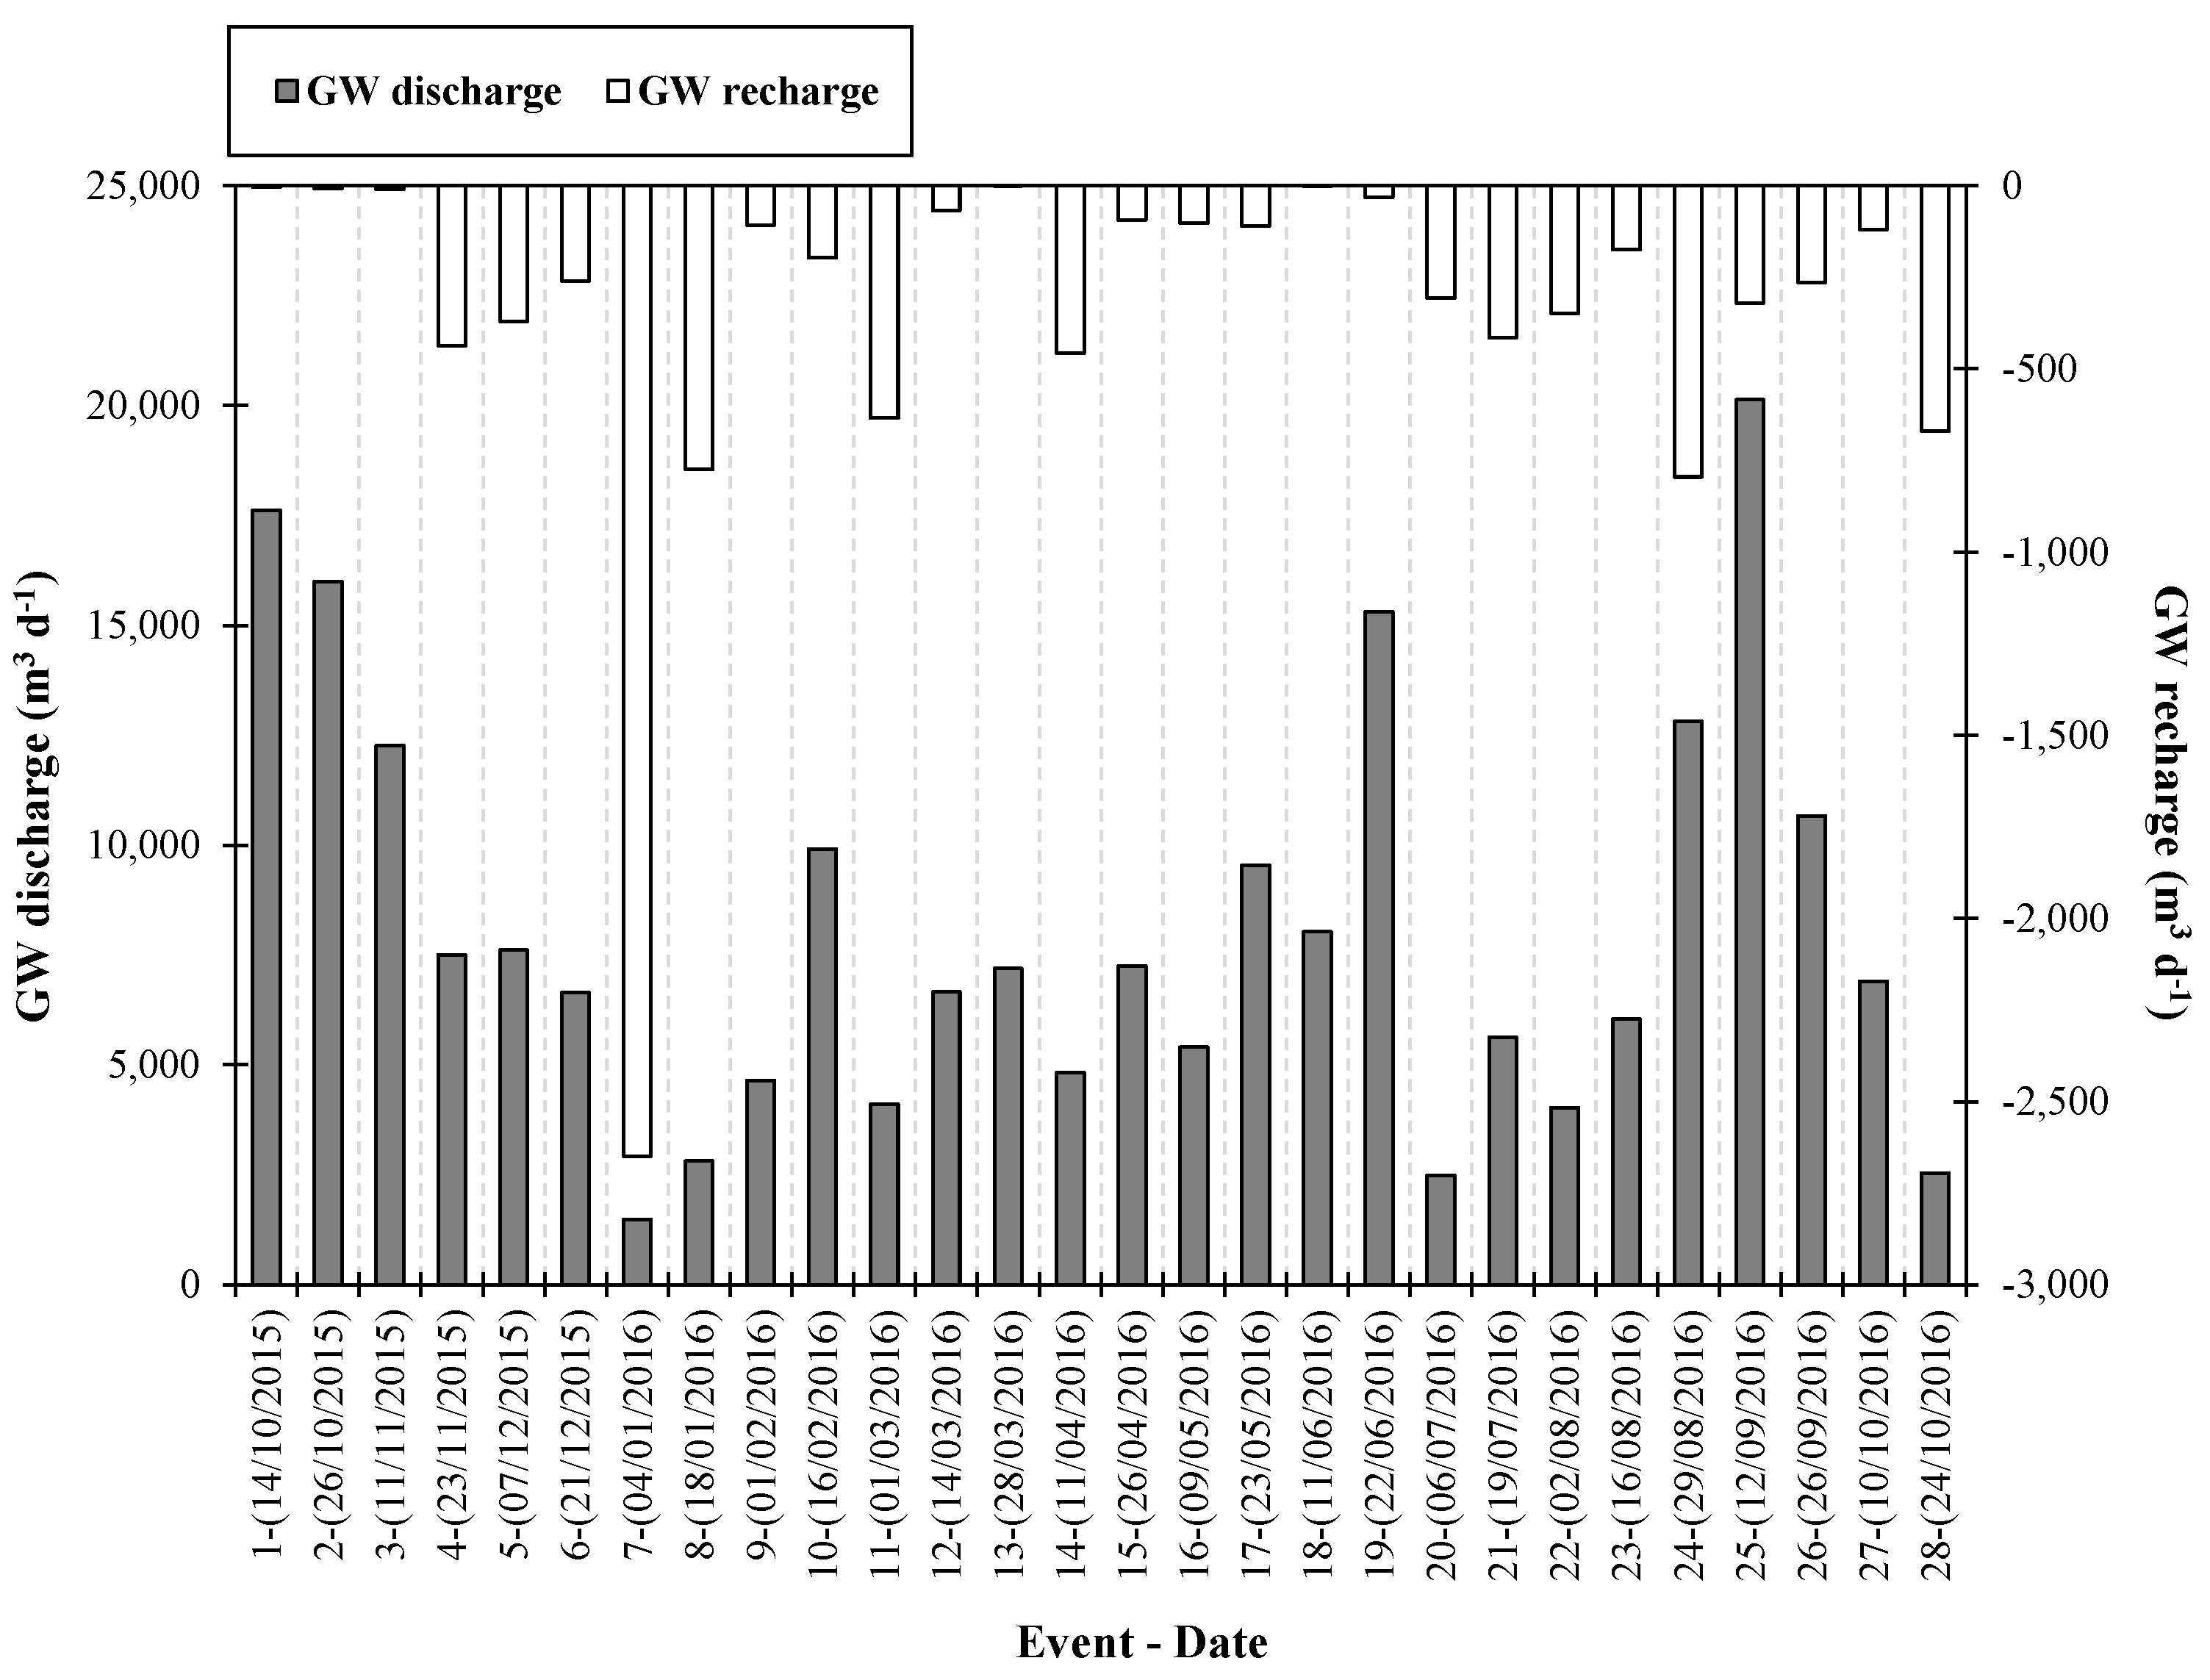
Total groundwater discharge (gray bars) and recharge (white bars) in m3 d-1 for each sampling event 1 through 28 (associated date in parentheses).
Figure 6.
Total groundwater discharge (gray bars) and recharge (white bars) in m3 d-1 for each sampling event 1 through 28 (associated date in parentheses).
Figure 7.
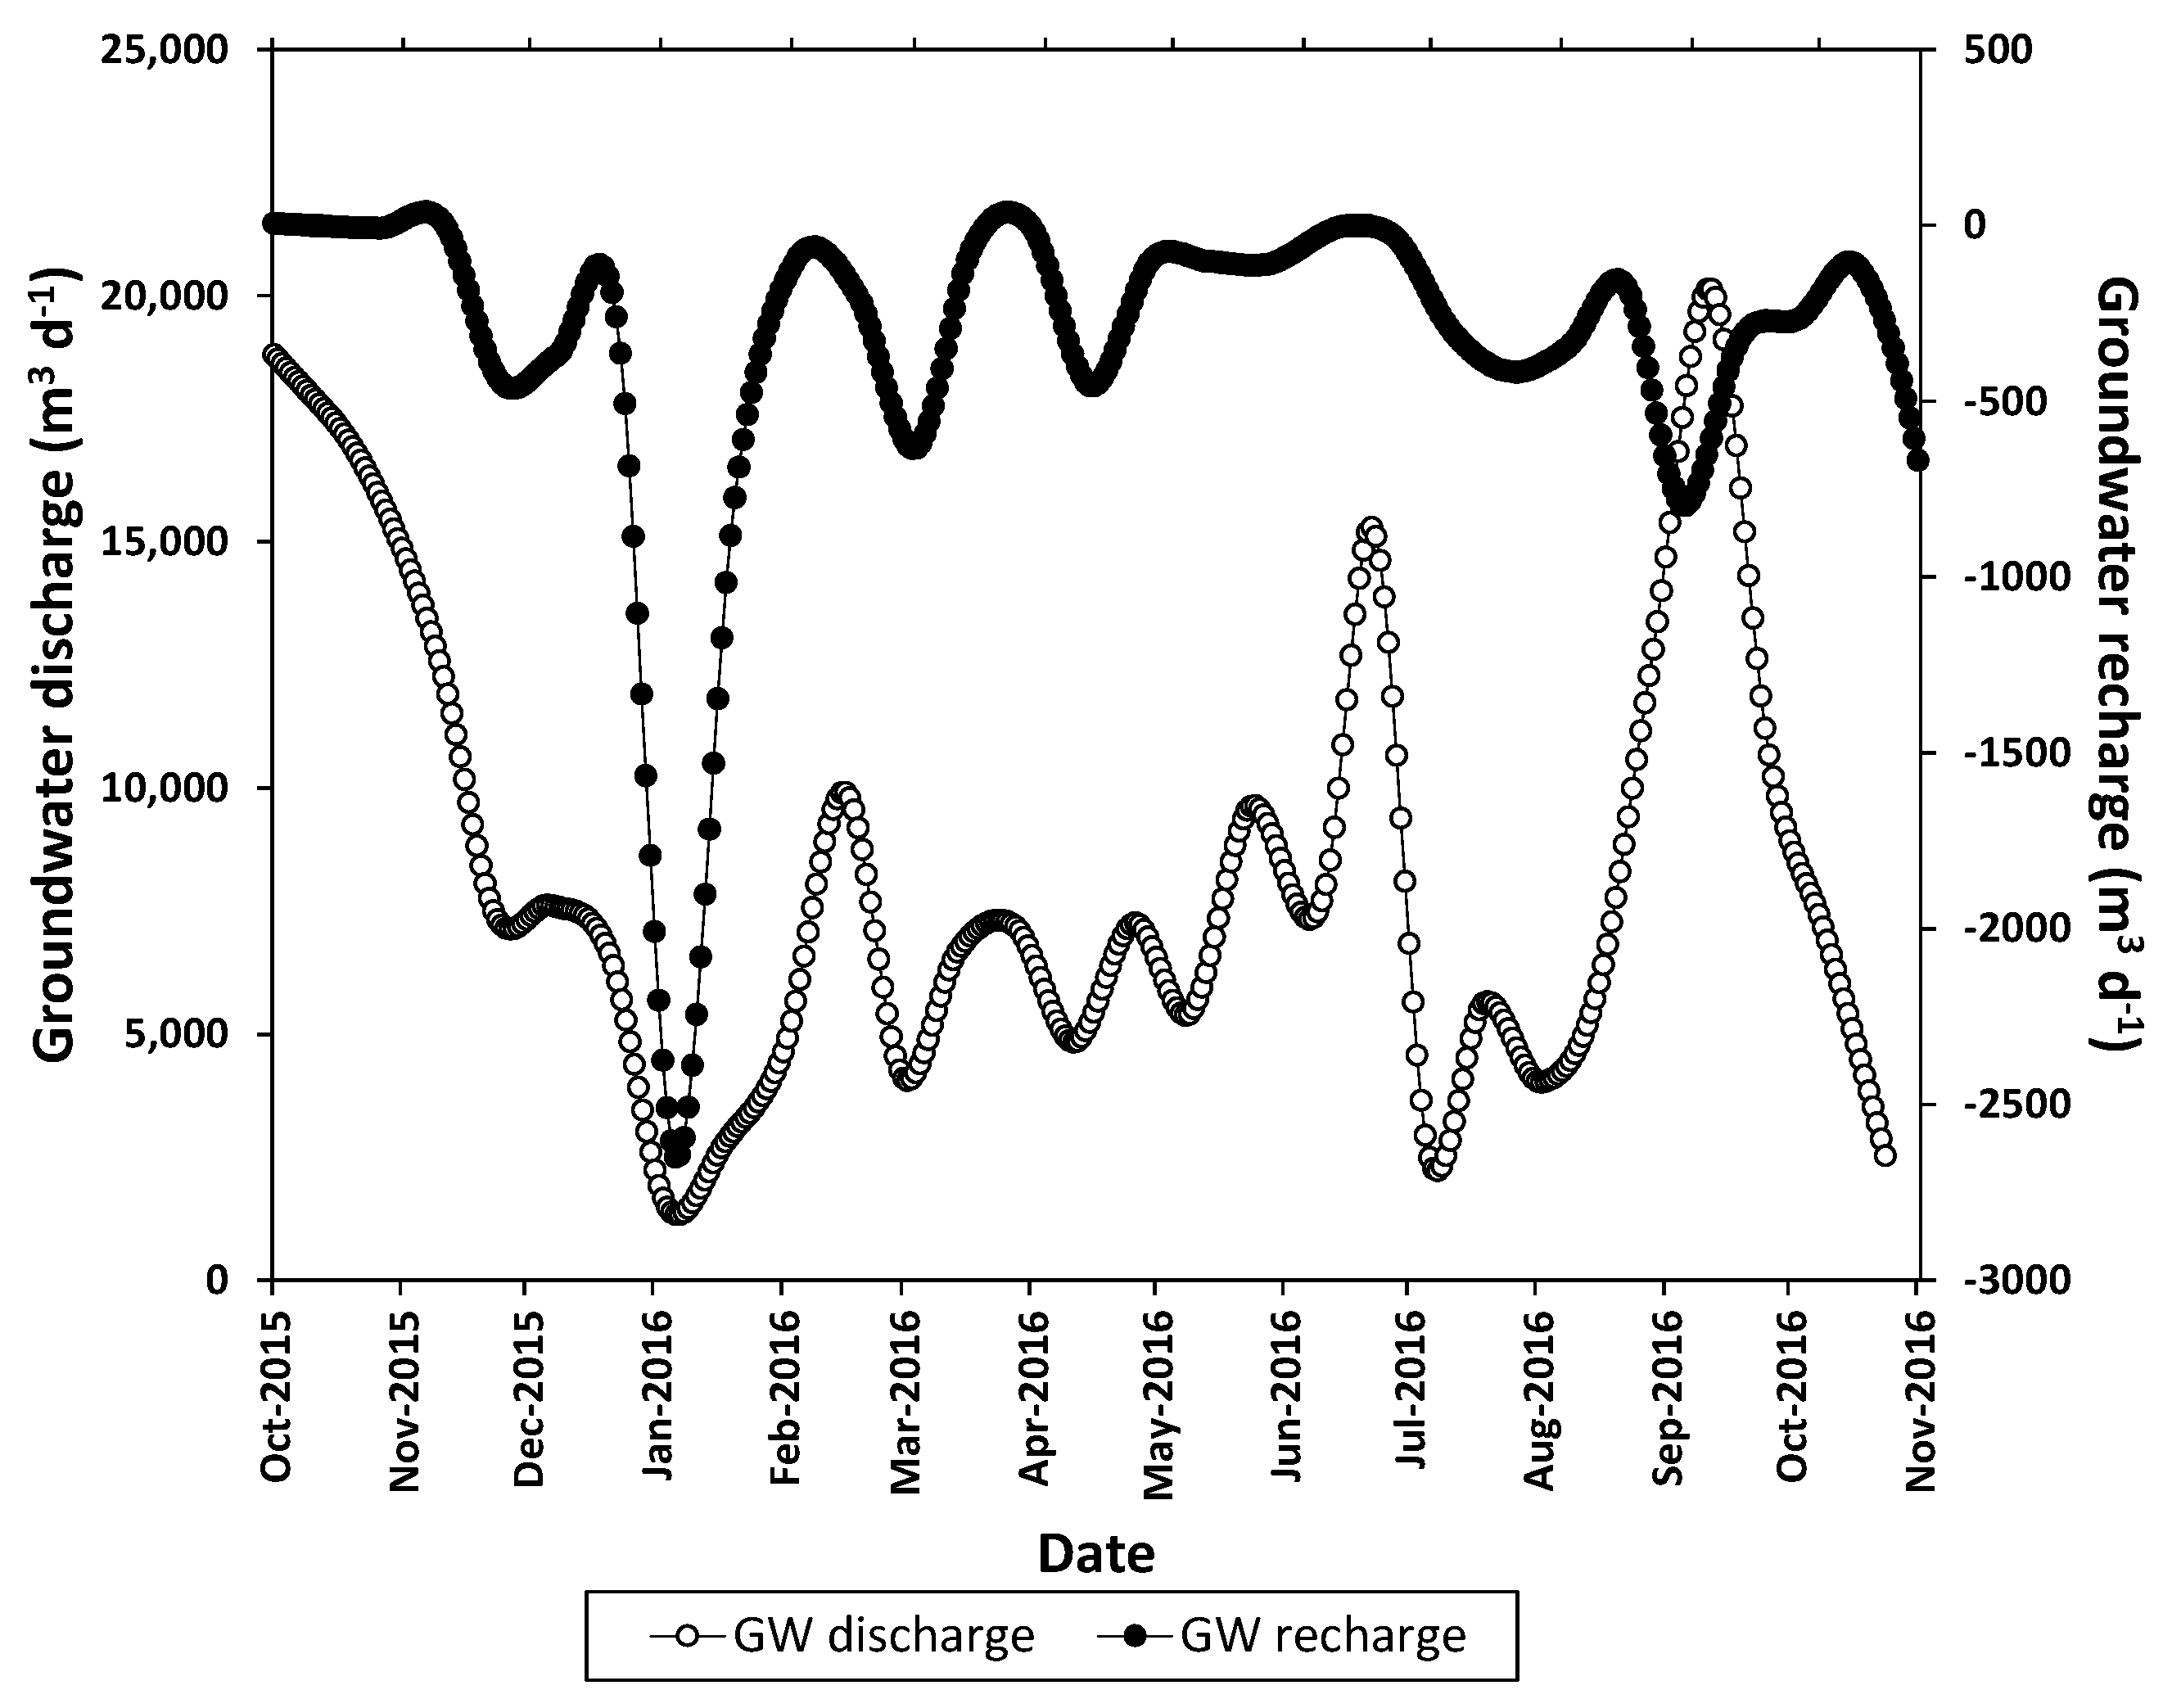
Groundwater discharge (closed black circles) and recharge (open circles) interpolated between biweekly sampling events using a Bessel spline function.
Figure 7.
Groundwater discharge (closed black circles) and recharge (open circles) interpolated between biweekly sampling events using a Bessel spline function.
Figure 8.
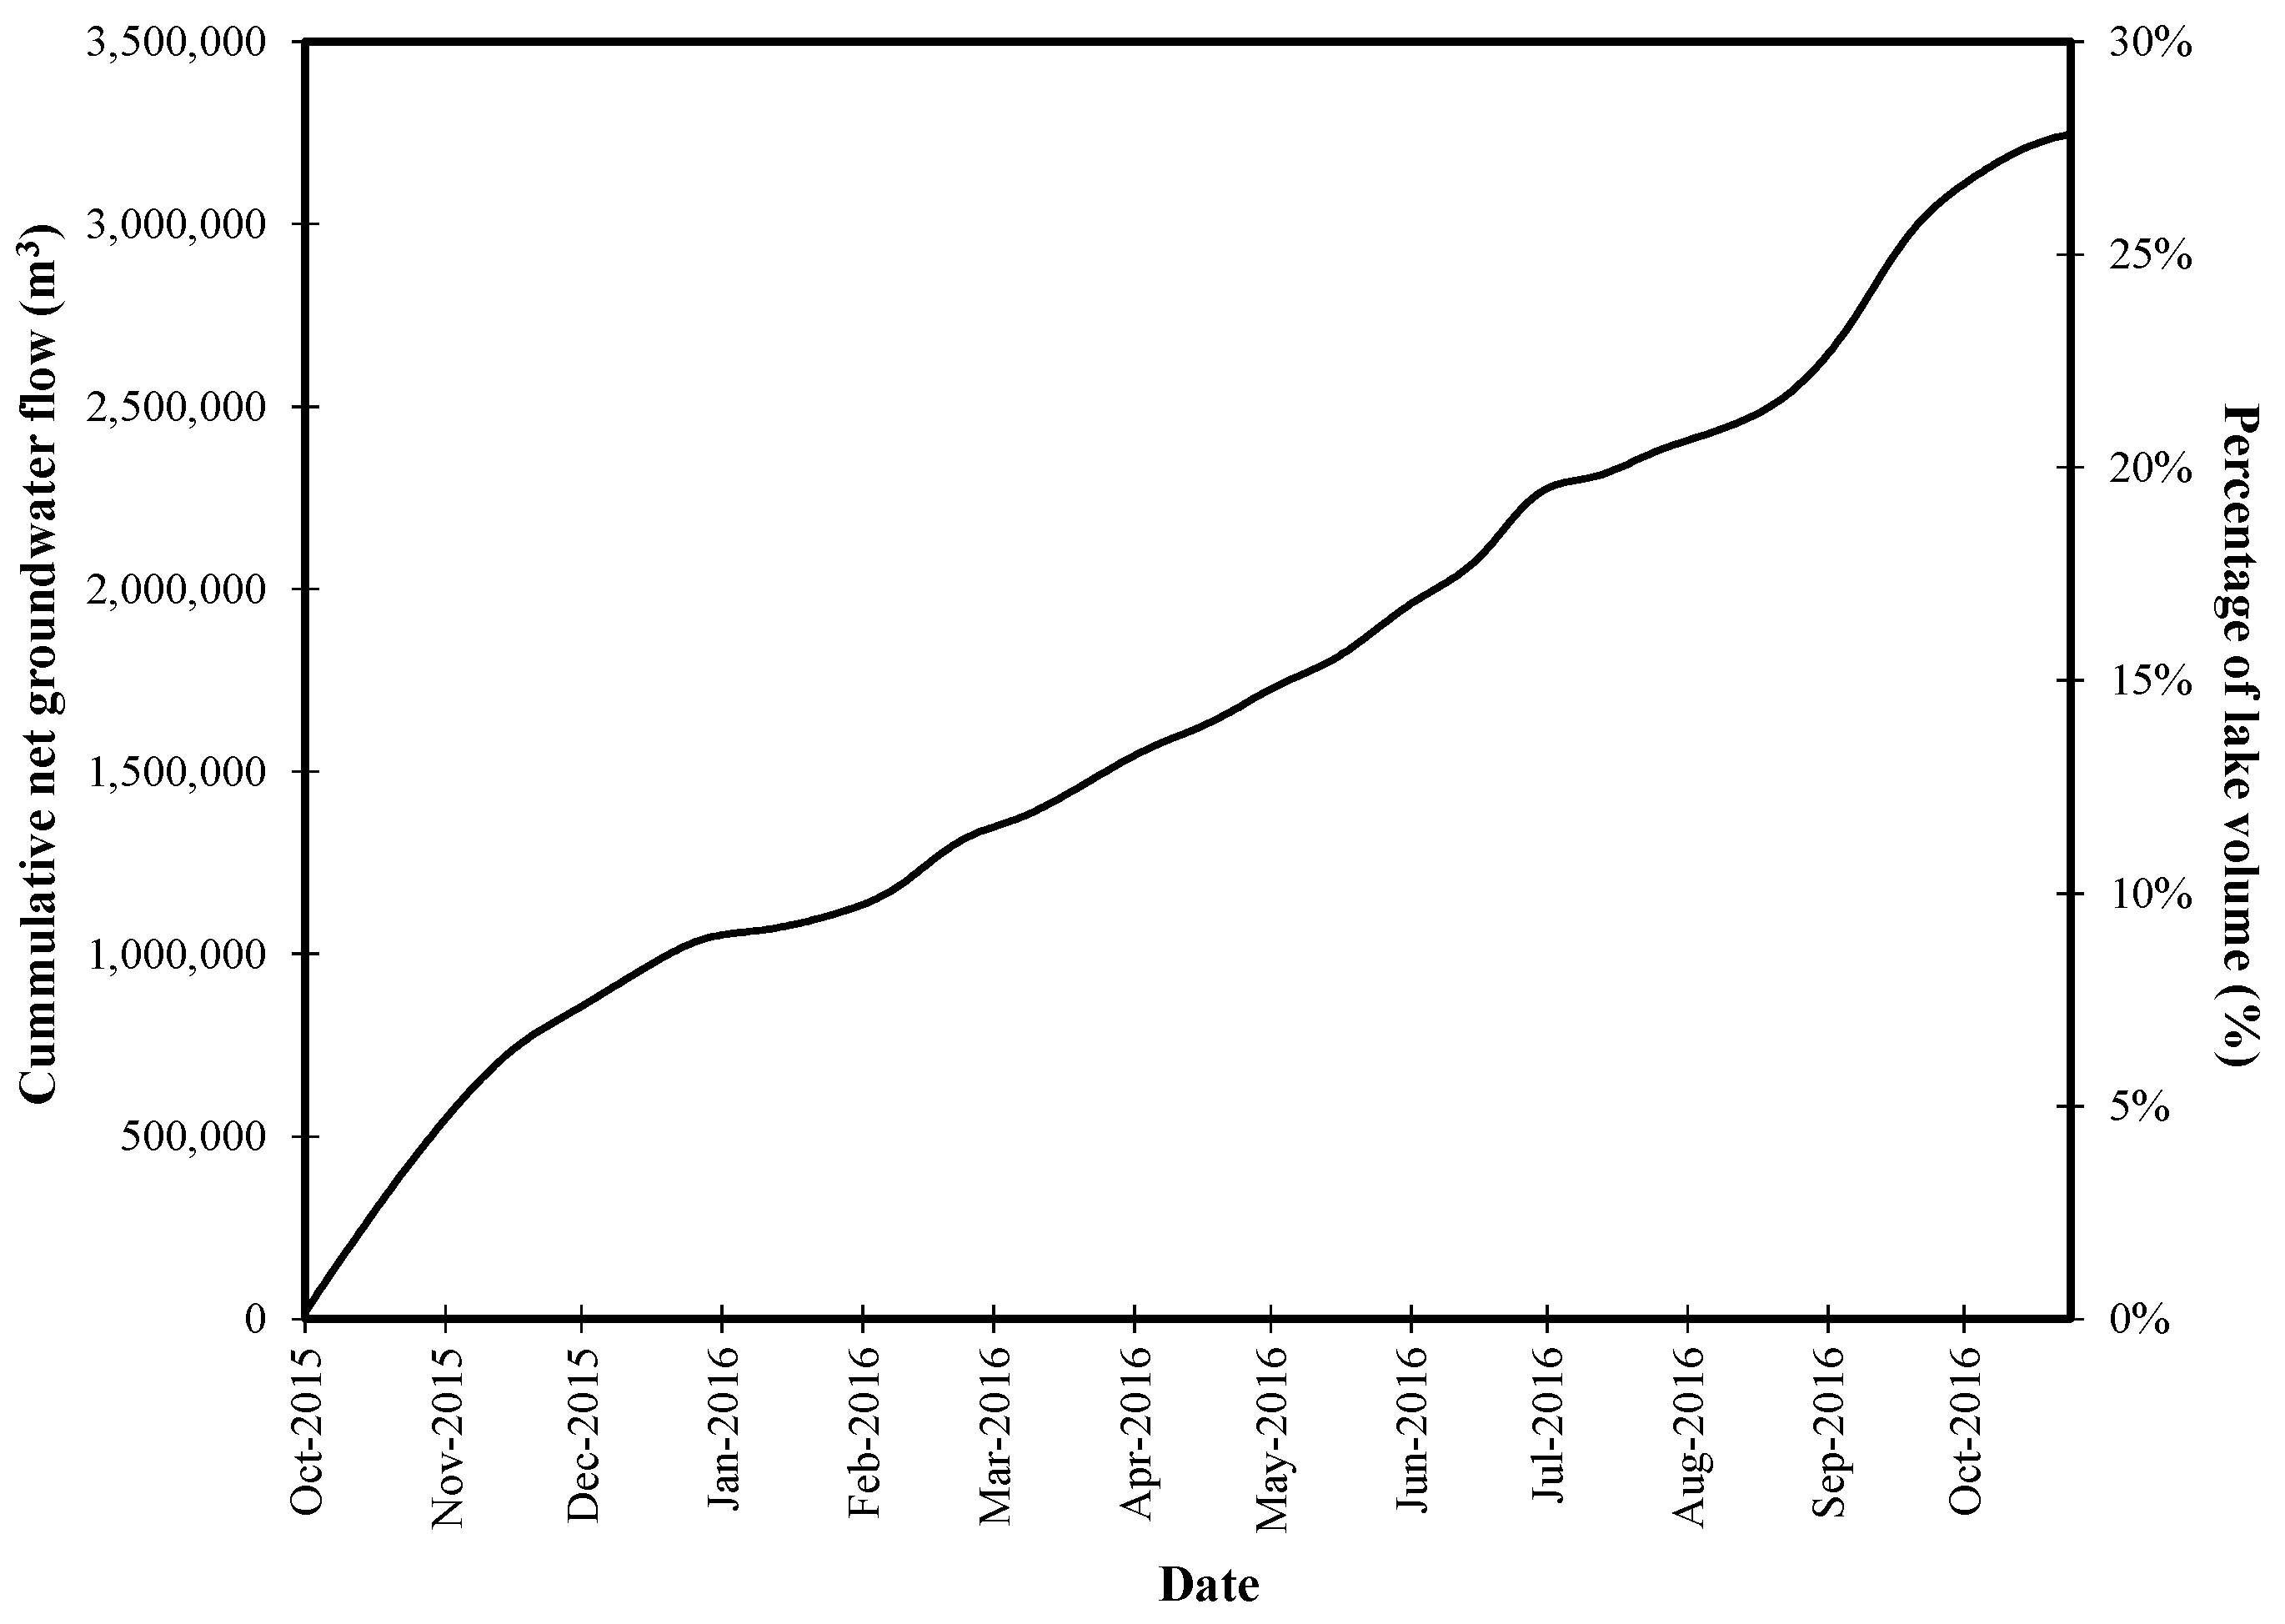
Time series of cumulative net groundwater flow in both total cubic meters (m3) and percent (%) of average lake volume. A total of 26.3% of the average lake volume entered the lake via groundwater net flow over the course of data collection.
Figure 8.
Time series of cumulative net groundwater flow in both total cubic meters (m3) and percent (%) of average lake volume. A total of 26.3% of the average lake volume entered the lake via groundwater net flow over the course of data collection.
Figure 9.
Hydrographs of each of the canal discharges (Q, m3 d-1) from 10/1/2015 to 10/24/2016. Mean daily Q is also reported for comparisons. Estimated portions of the hydrographs appear as dashed lines (cf. text for more information).
Figure 9.
Hydrographs of each of the canal discharges (Q, m3 d-1) from 10/1/2015 to 10/24/2016. Mean daily Q is also reported for comparisons. Estimated portions of the hydrographs appear as dashed lines (cf. text for more information).
Figure 10.
Canal discharge plotted over rainfall for all five canals. Note that the scales for Q are not standardized to best show response of discharge to rainfall. Canals 1, 4, and 5 appear to be most responsive to rain events.
Figure 10.
Canal discharge plotted over rainfall for all five canals. Note that the scales for Q are not standardized to best show response of discharge to rainfall. Canals 1, 4, and 5 appear to be most responsive to rain events.
Figure 11.
Scatterplots comparing groundwater level or lake stage to canal discharge (Q). Dashed line indicates a best fit linear or polynomial function. Canal 2 had very low discharge throughout the study period and thus a strong predictive relationship was not found. Note that Canal 3 is not featured because its discharge was around zero.
Figure 12.
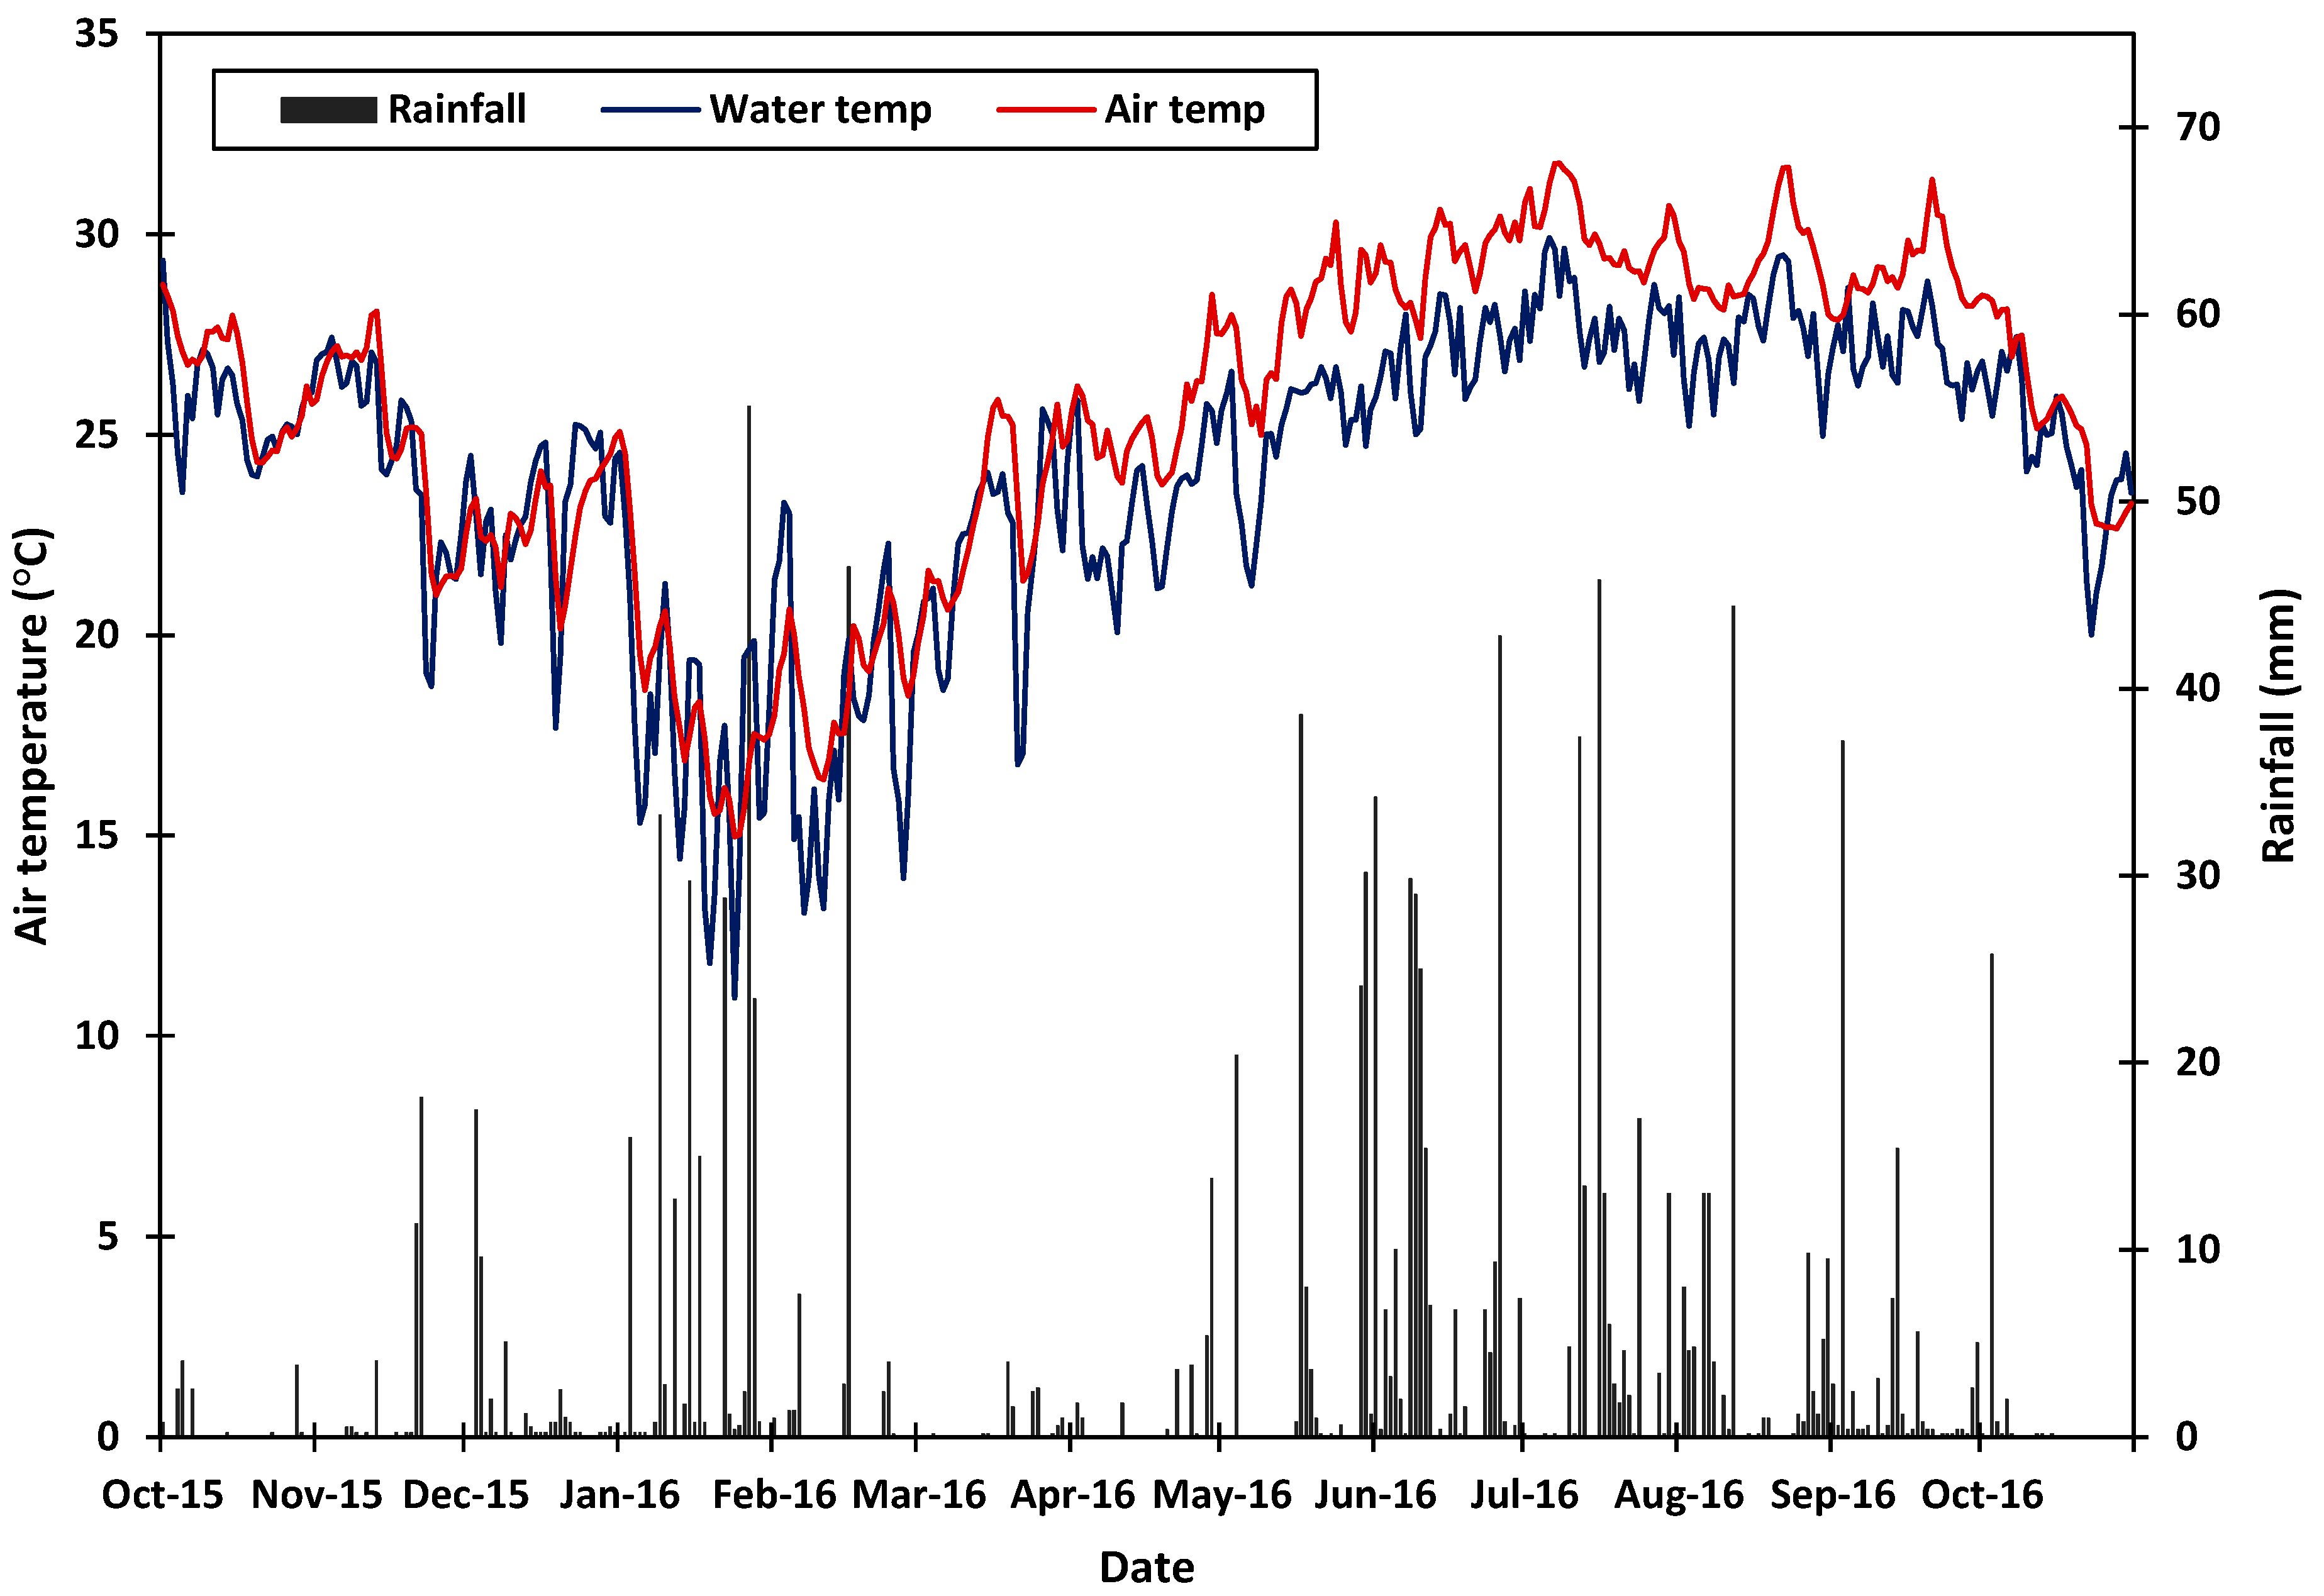
Air temperature (red line) and water temperature (blue line) plotted with rainfall (gray bars). Water temperature and air temperature reached their lowest points in January, which also unexpectedly saw the highest amounts of rainfall.
Figure 12.
Air temperature (red line) and water temperature (blue line) plotted with rainfall (gray bars). Water temperature and air temperature reached their lowest points in January, which also unexpectedly saw the highest amounts of rainfall.
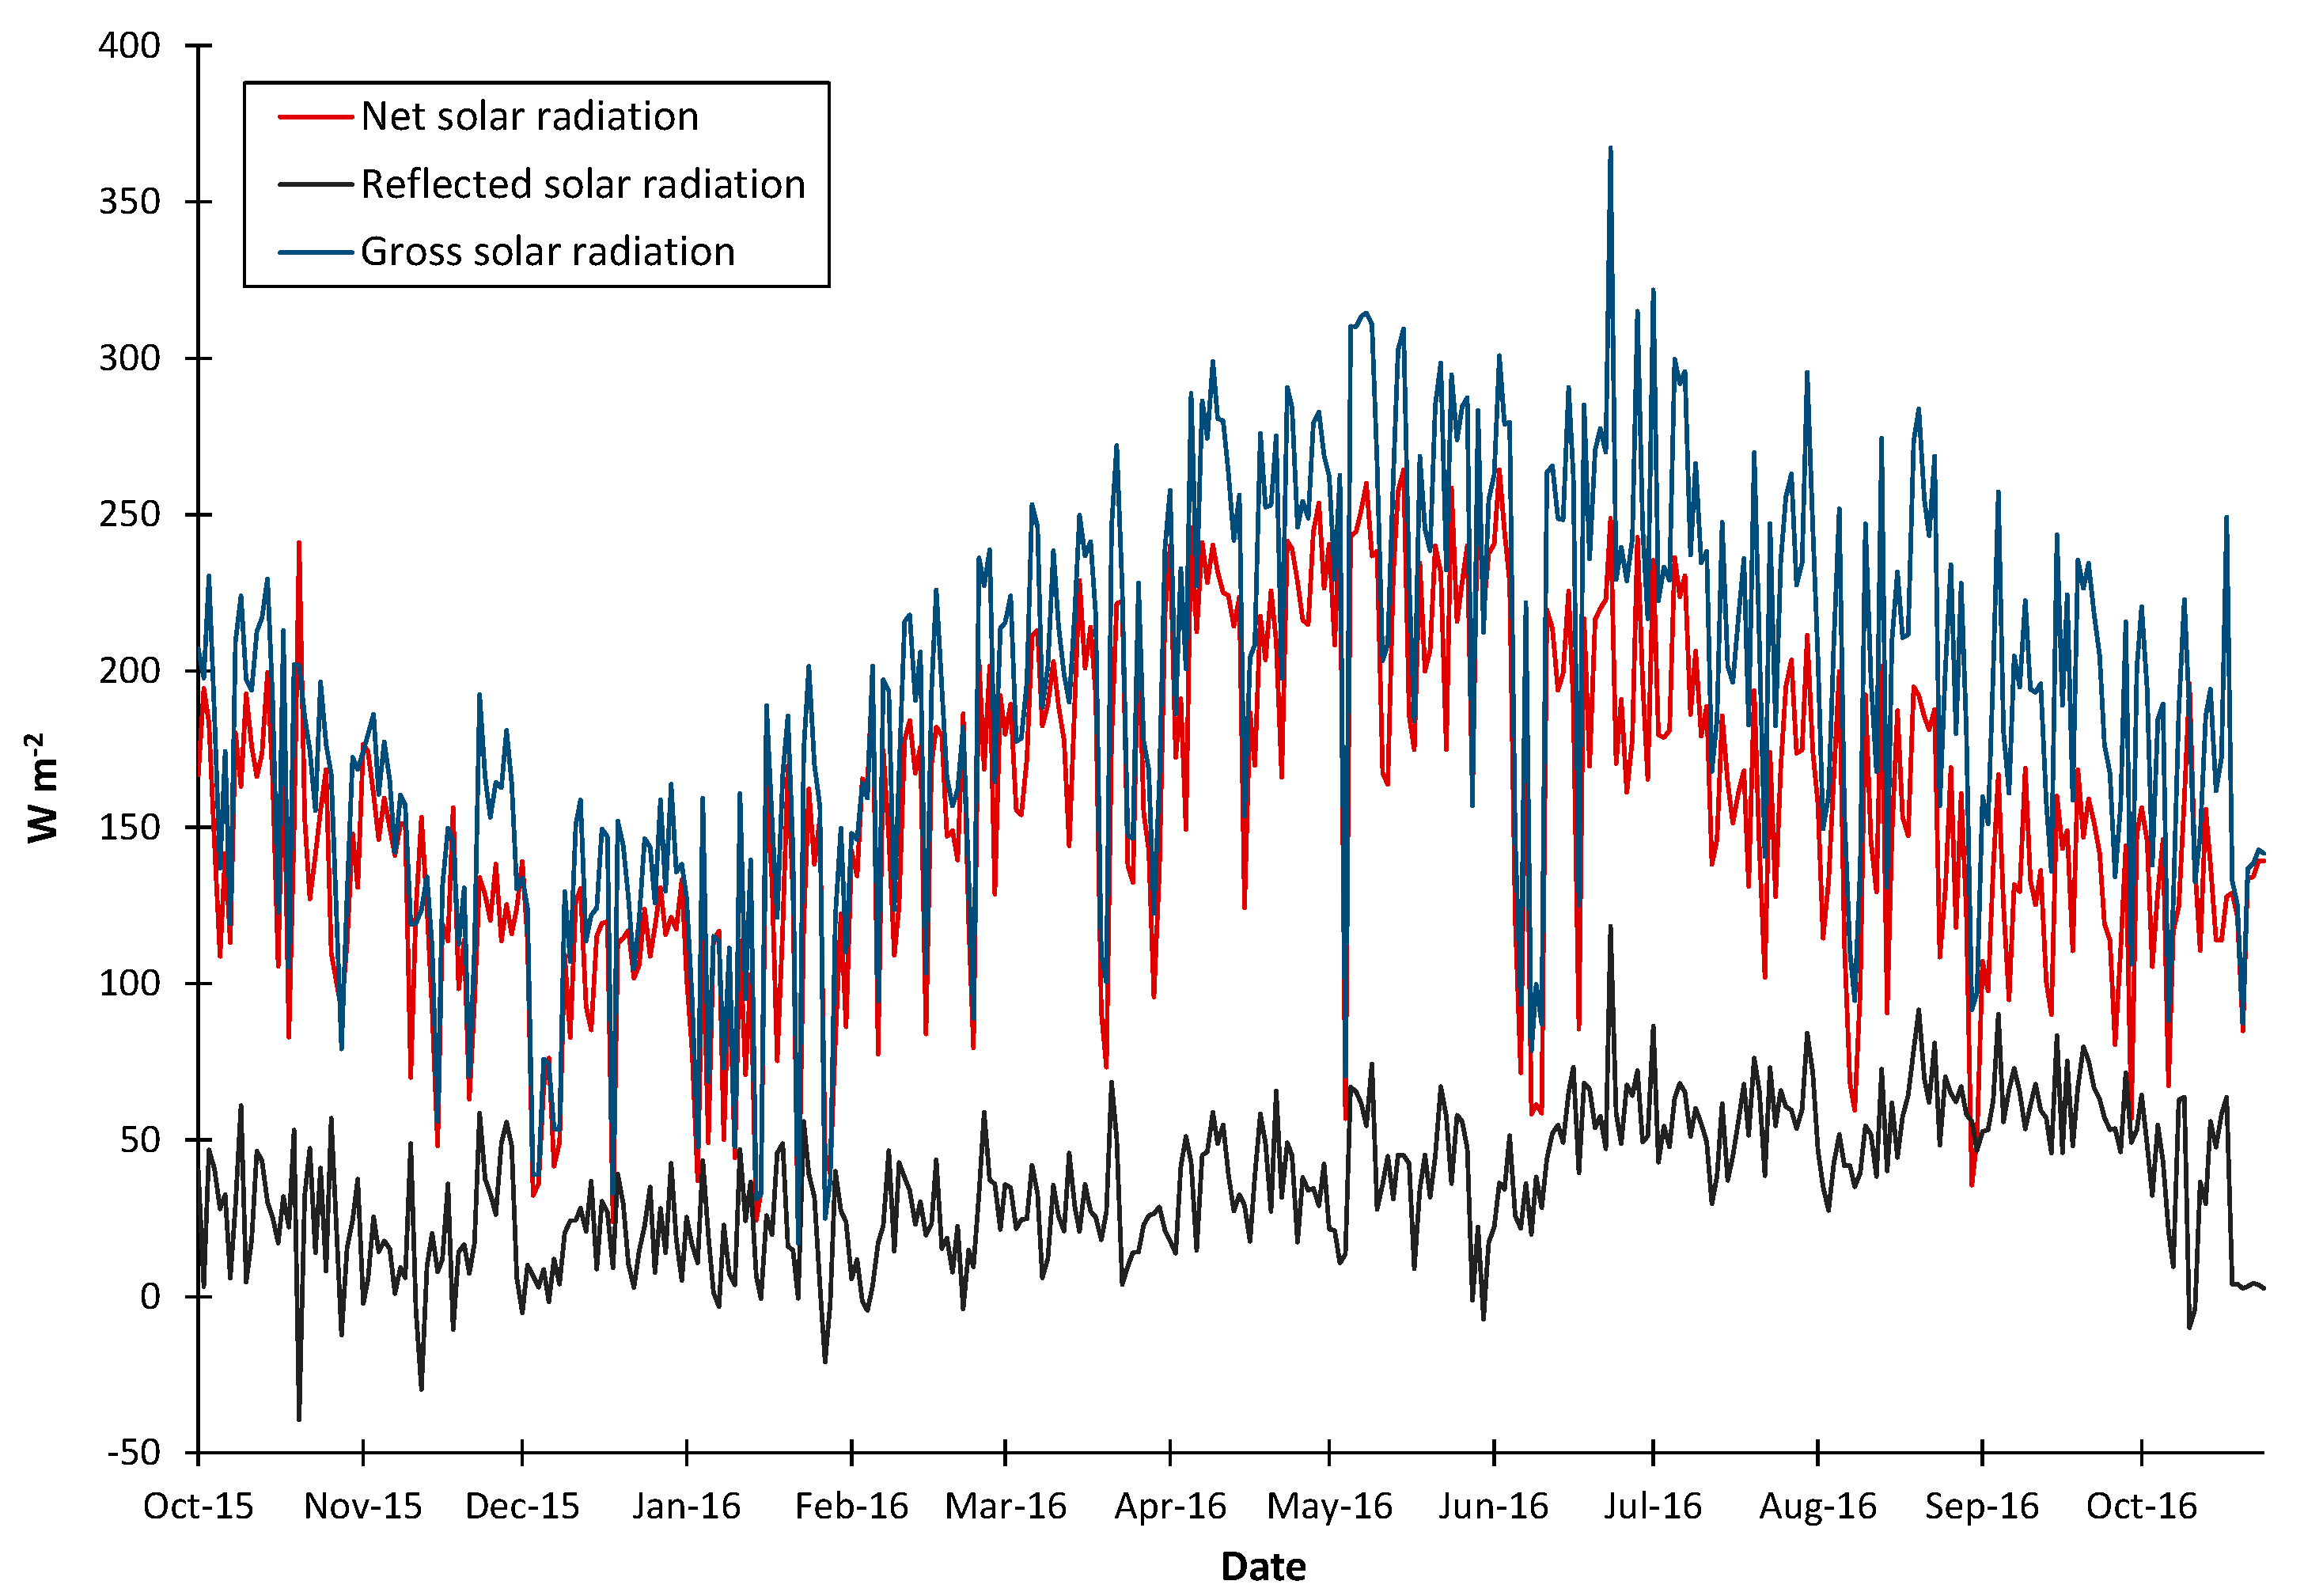
Figure 13.
Changes in gross solar radiation, net solar radiation, and reflected solar radiation over time. Note the points of negative reflected solar radiation where perching birds likely shaded the gross solar radiation sensor.
Figure 13.
Changes in gross solar radiation, net solar radiation, and reflected solar radiation over time. Note the points of negative reflected solar radiation where perching birds likely shaded the gross solar radiation sensor.
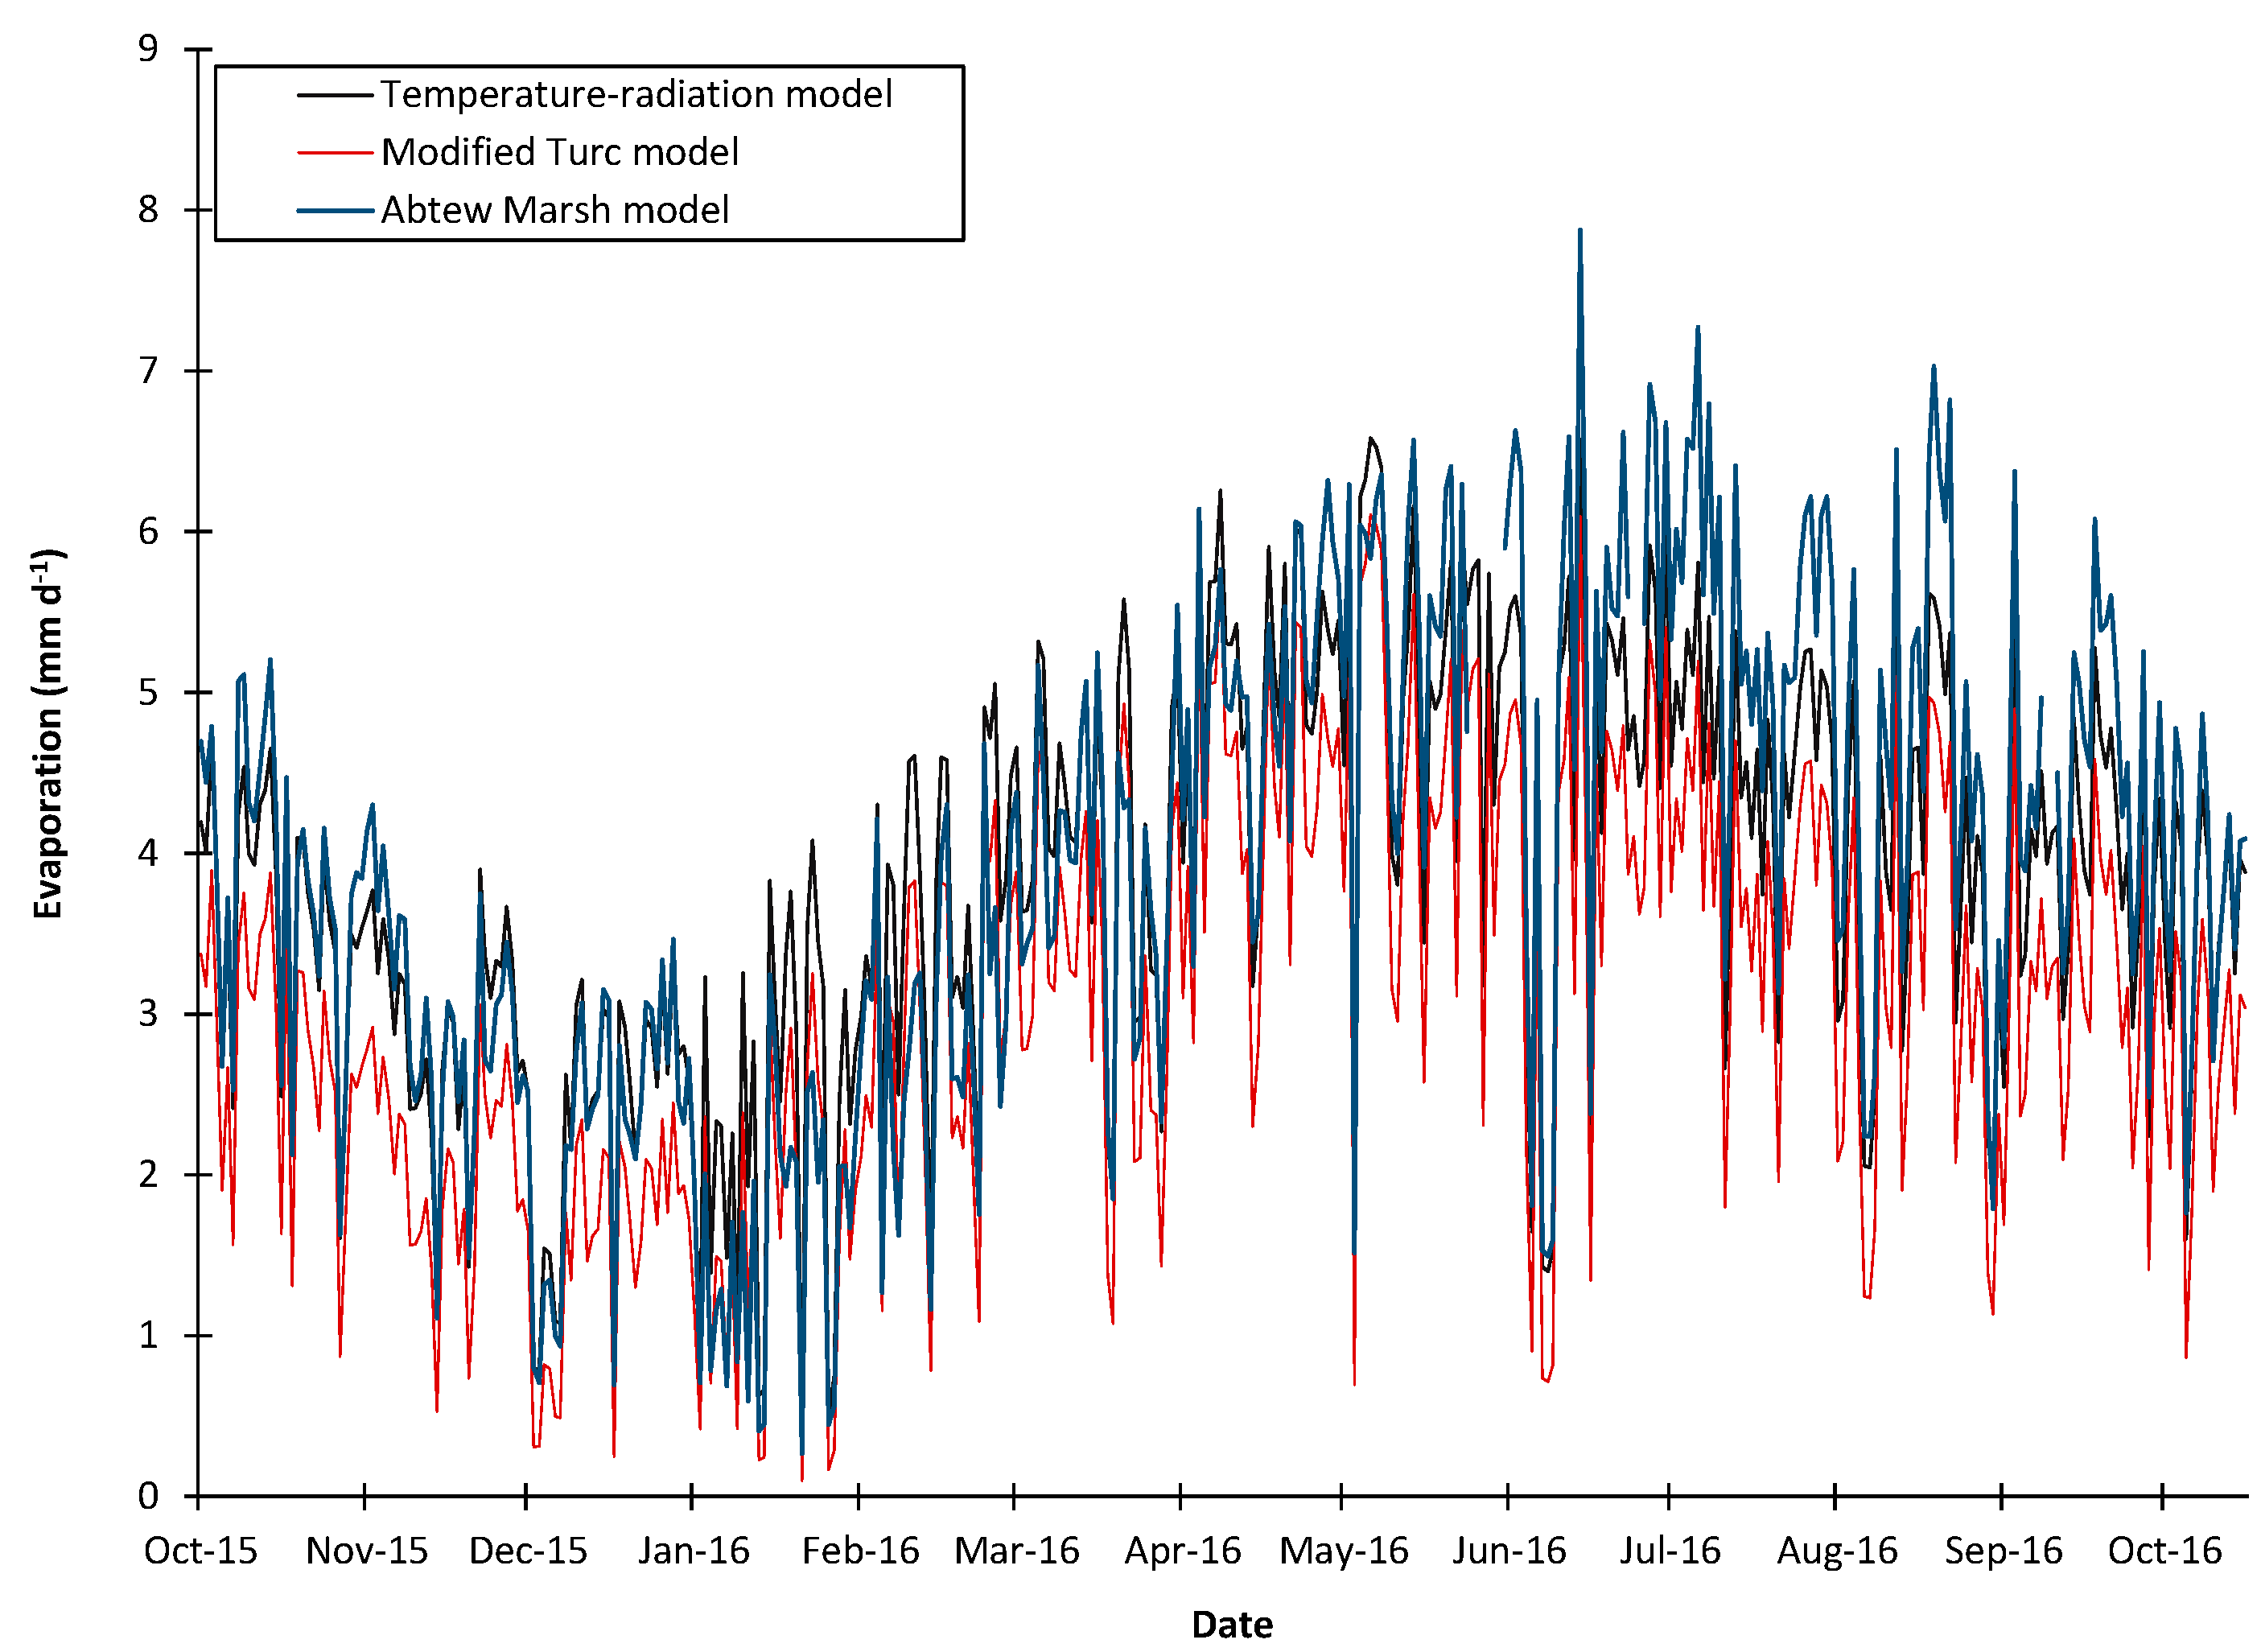
Figure 14.
Results of the three evaporation models (“E”) applied to Lake Trafford. An expected seasonal trend is present, with decreased evaporation rates in the winter months, increasing throughout the spring. Heavy rains and cloud cover caused several days of minimal evaporation in late June.
Figure 14.
Results of the three evaporation models (“E”) applied to Lake Trafford. An expected seasonal trend is present, with decreased evaporation rates in the winter months, increasing throughout the spring. Heavy rains and cloud cover caused several days of minimal evaporation in late June.
Figure 15.
Top graph: Time series of lake surface elevation (USGS 02291200) over the past nine years with the bold dotted line representing the average stage over that period and the thin dotted lines indicating z-sores of +1 and -1. Bottom left graph: Time series of lake surface elevation during this study. The lake level was highest at the start of the project, in February after El-Niño rains, and throughout the rainy season (June through October 2016). Lake stage was higher than average throughout the entire study period. A stage-volume curve and a stage-planar surface area curve were established for Lake Trafford to calculate lake volumes and surface areas based on lake stage (bottom right graph).
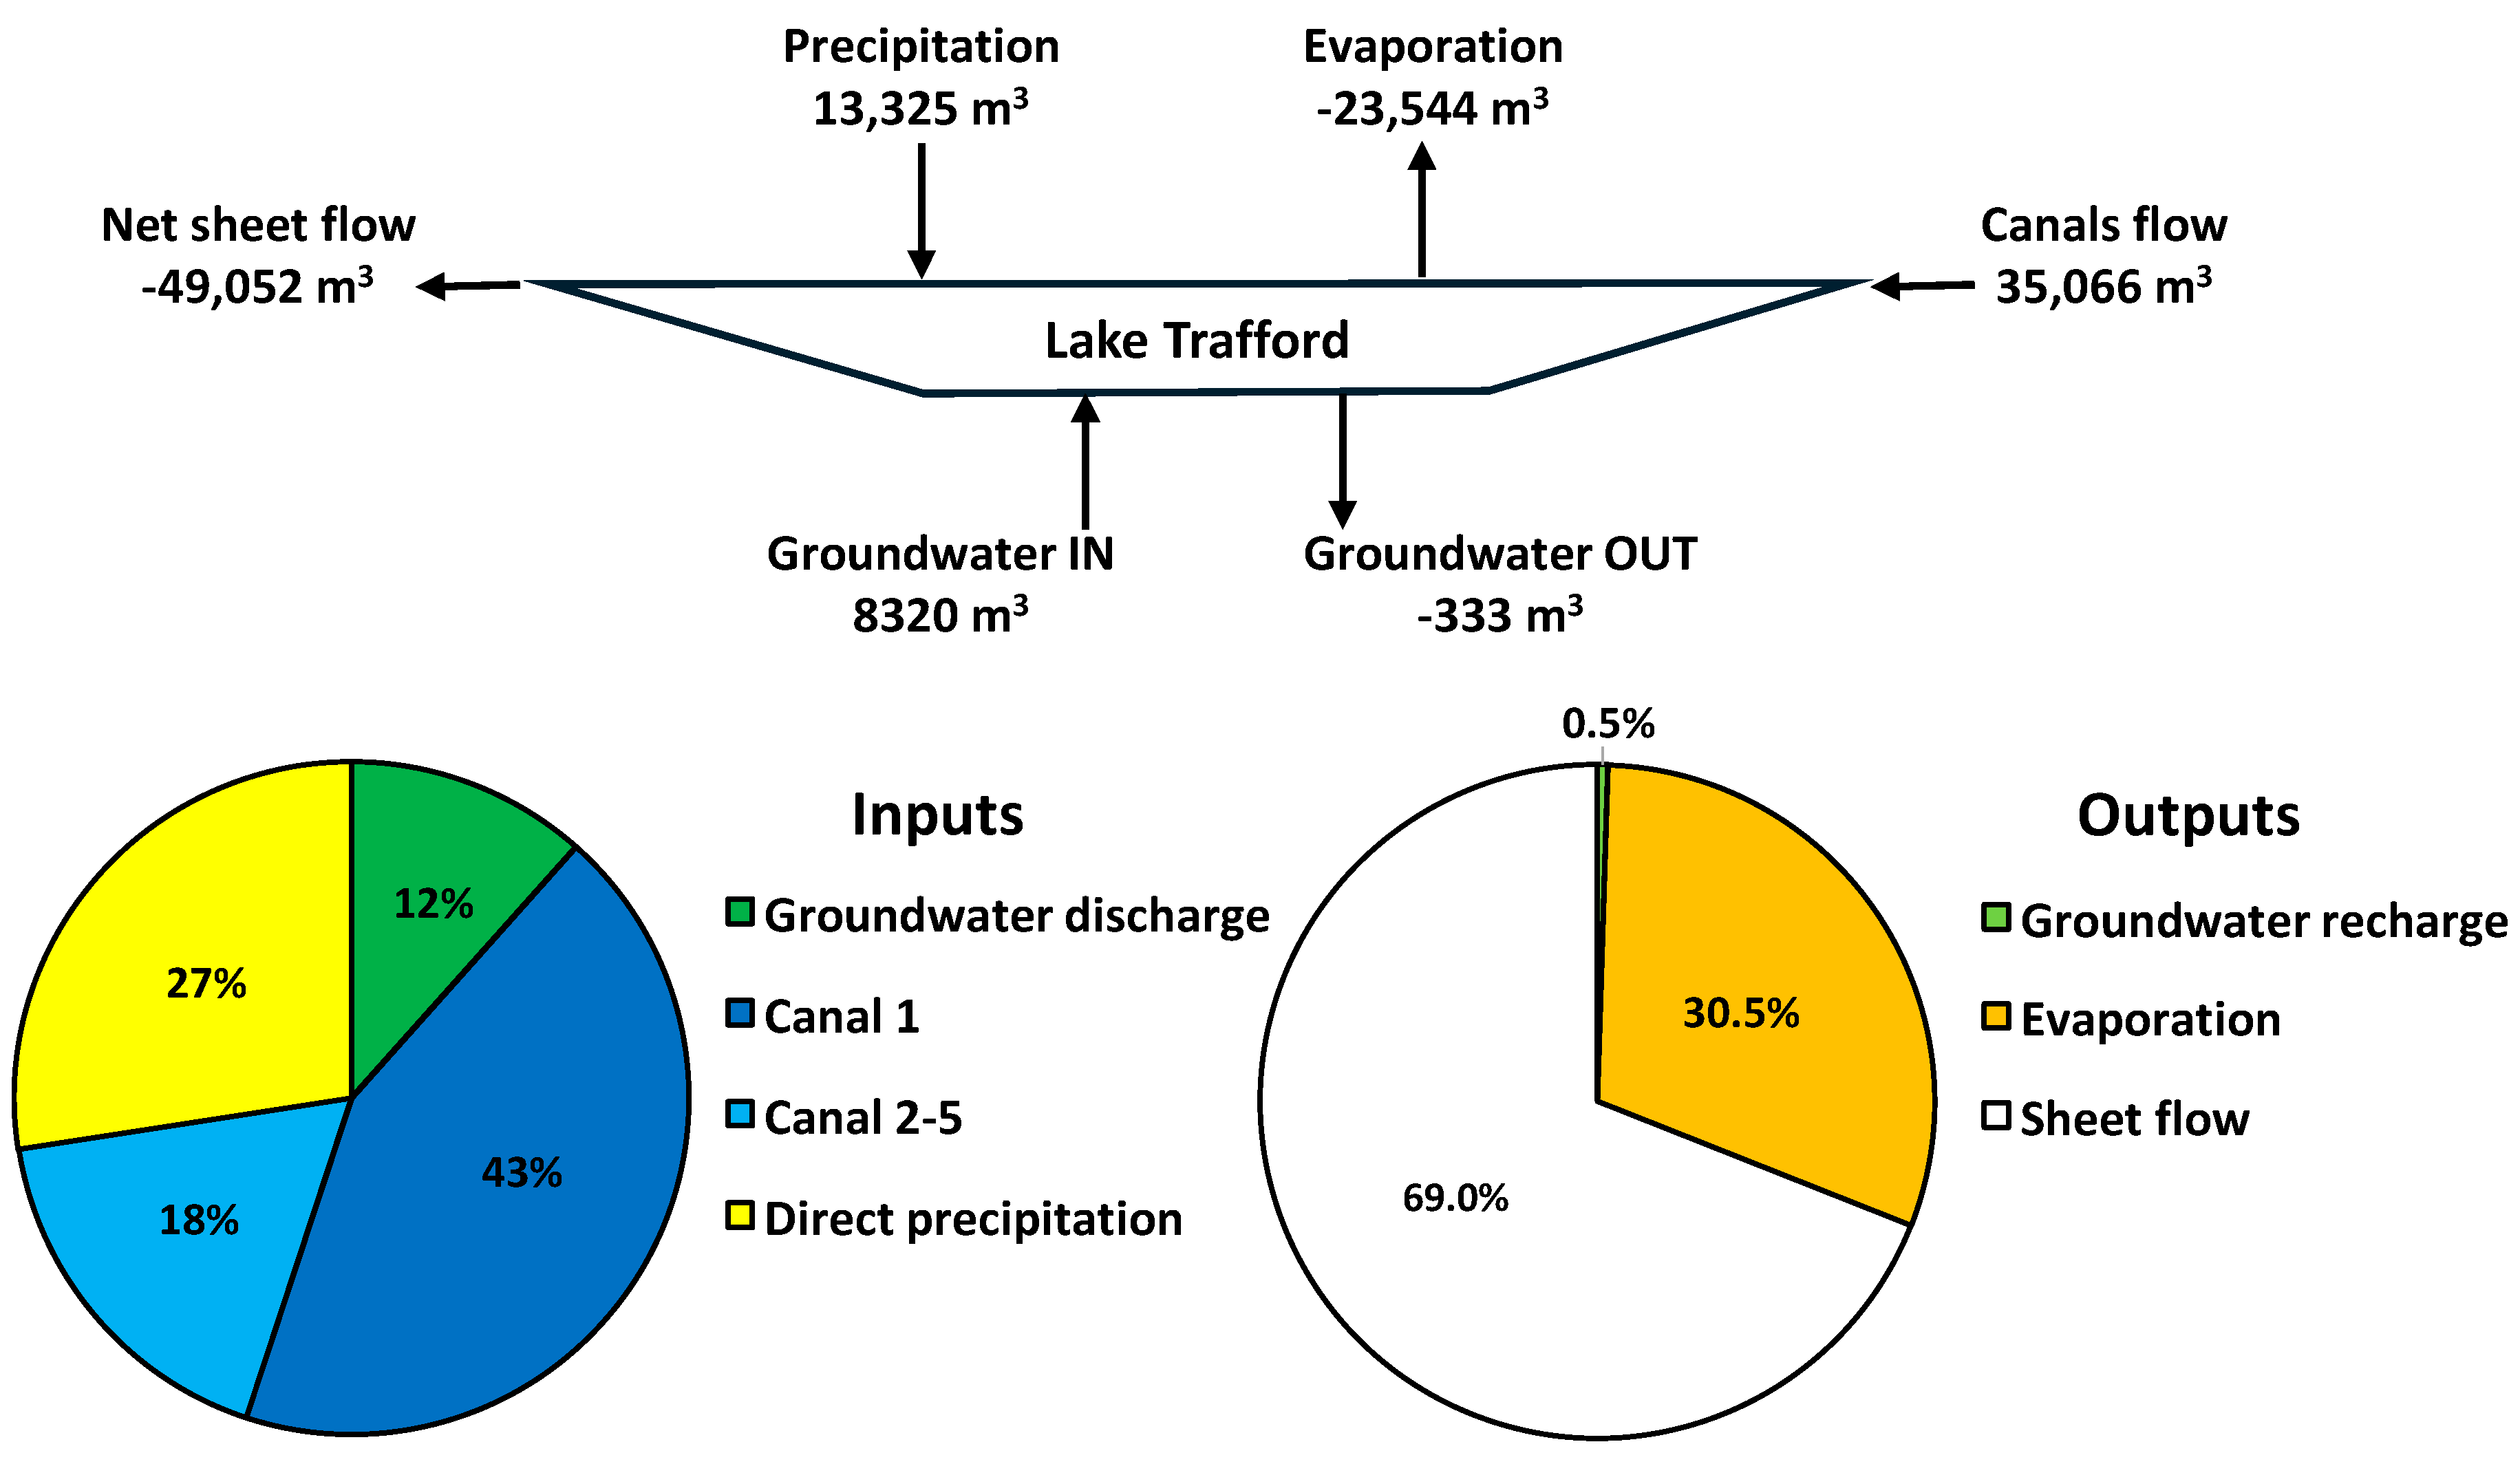
Figure 16.
Top diagram: Final water budget of all fluxes for Lake Trafford over the course of the study period. Mean net sheet flow was negative and was thus depicted as an efflux. Bottom pie chart: Relative percentage of inputs and outputs for the water budget. Sheet flow is only represented in the outputs chart due to the inability to separate positive and negative flows from the calculated net sheet flow. Discharge from Canal 1 is separated from Canals 2 through 5 to show its magnitude compared to the other incoming water fluxes.
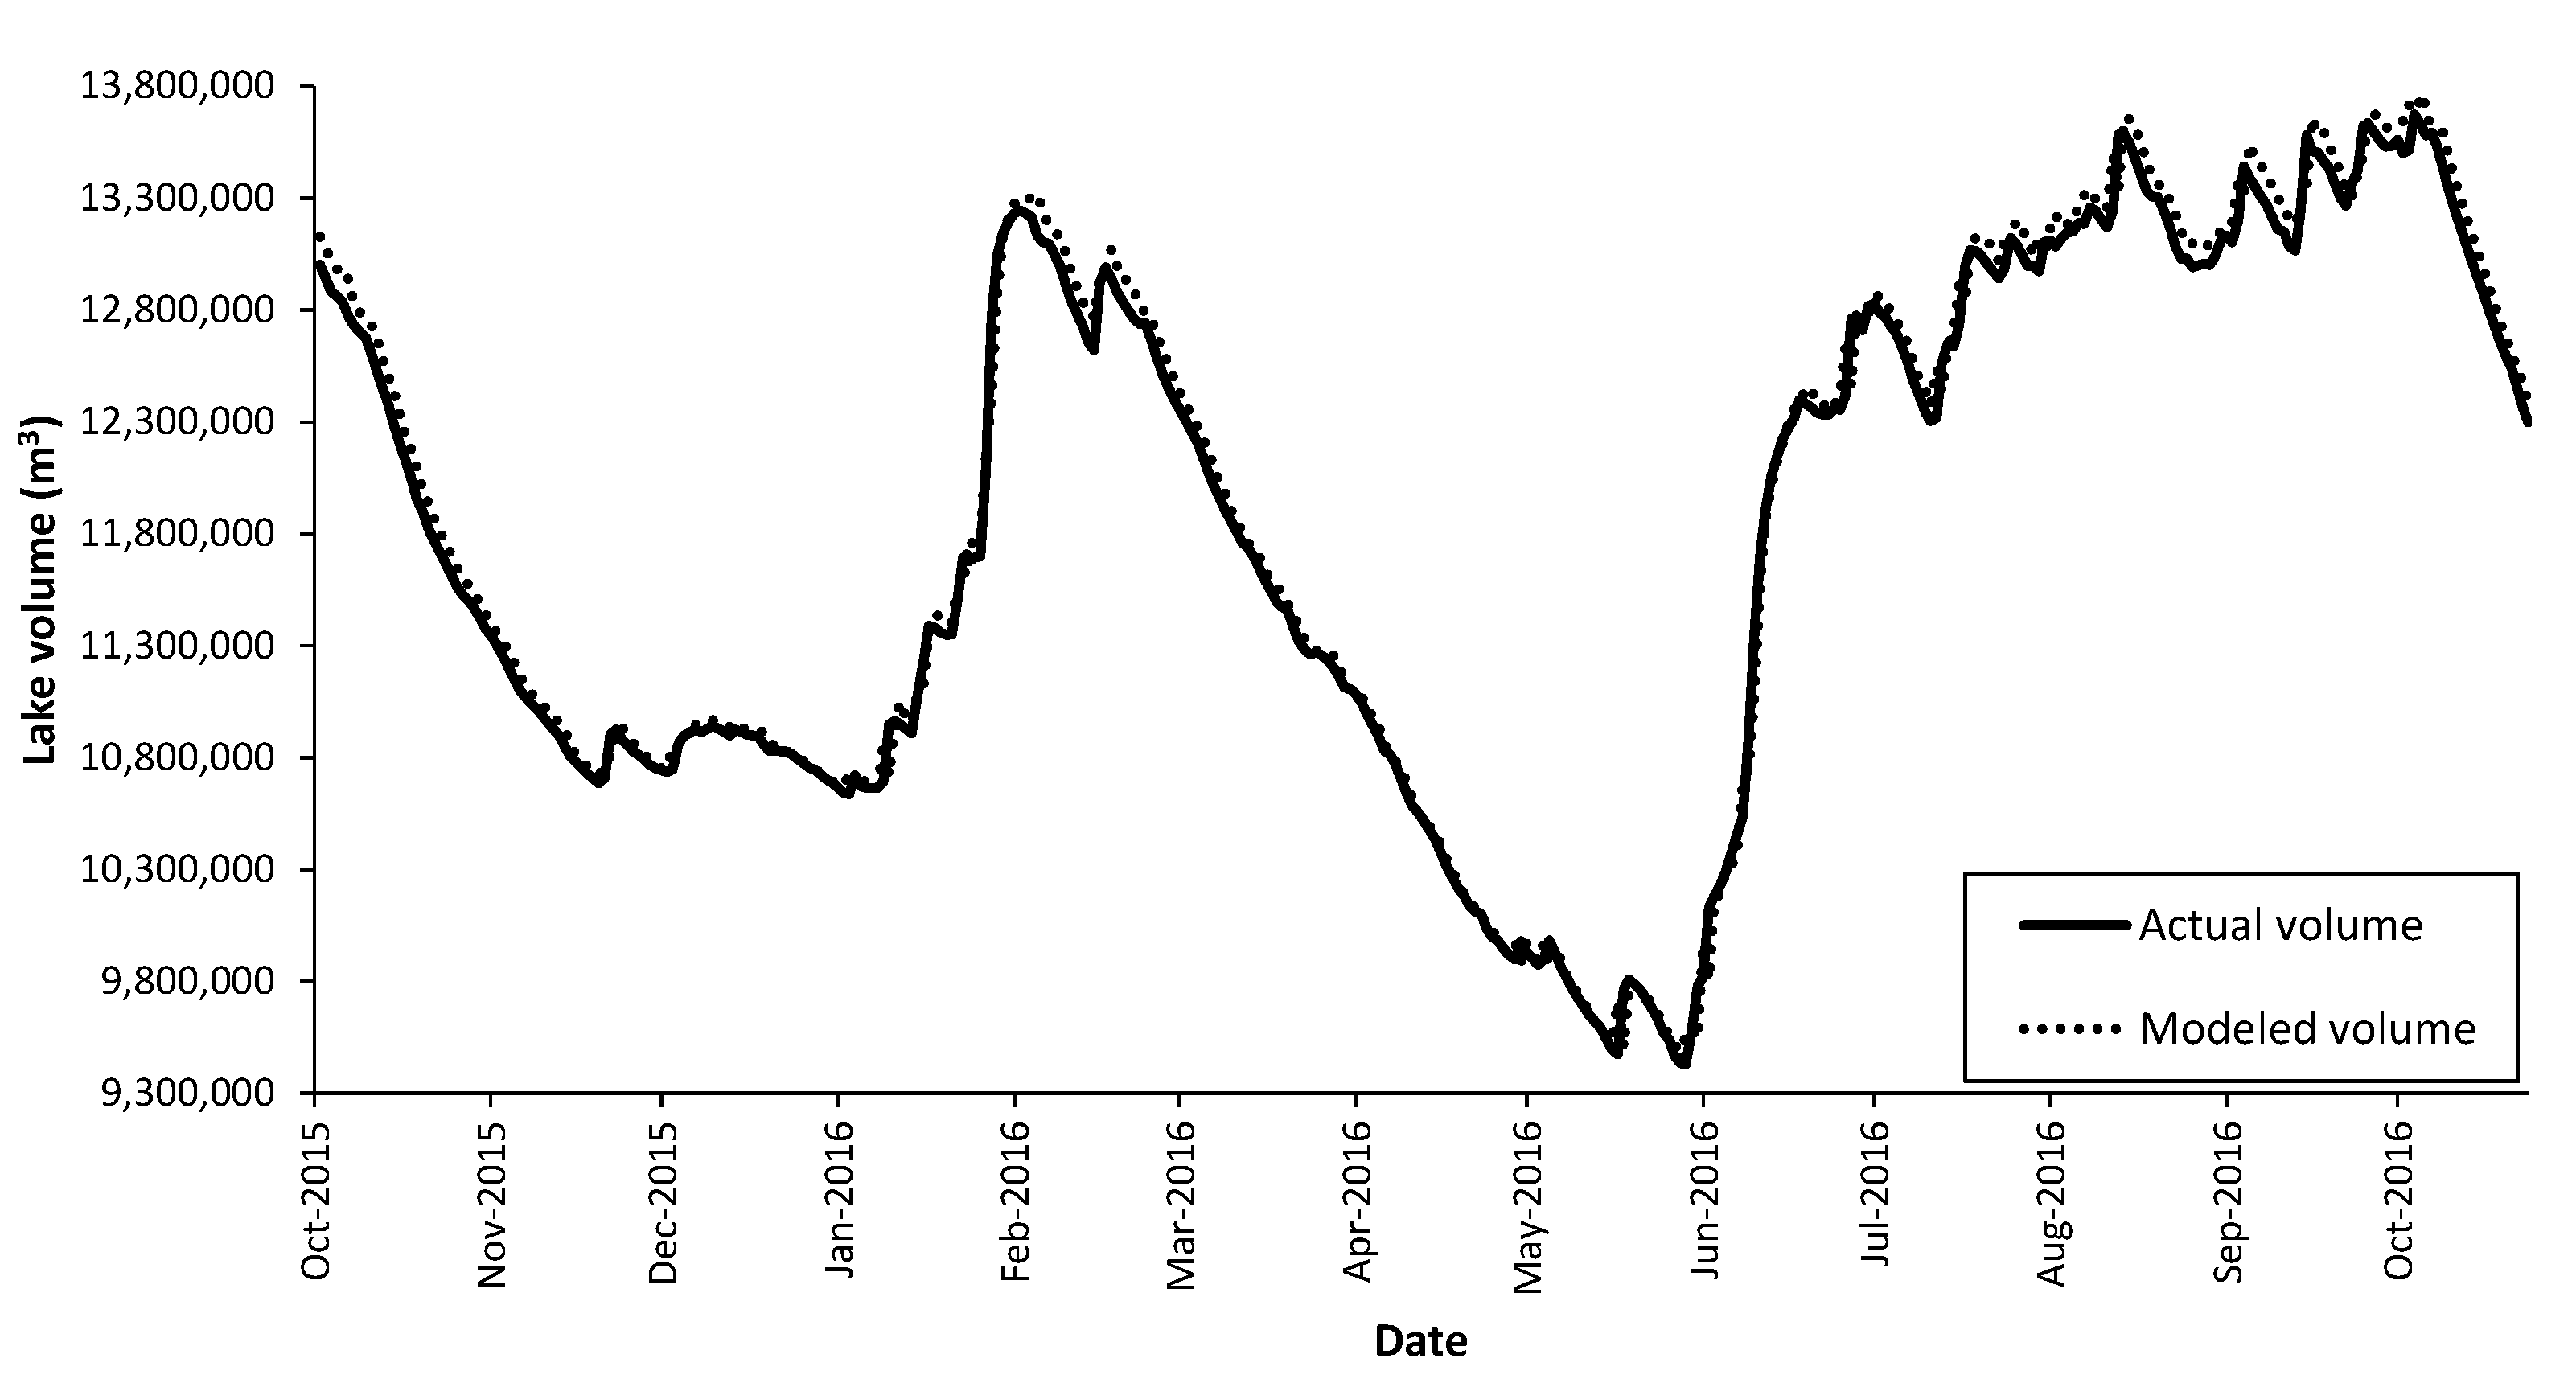
Figure 17.
Time series of both the actual volume in Lake Trafford and the modeled volume as a sum of the measured water budget components. The difference between the modeled volume and the actual volume was used to calculate the net sheet flow. Time periods where the modeled volume is higher than the actual volume, indicate a net negative sheet flow moving out of the lake. Time periods where the modeled volume is lower than the true volume indicate net positive sheet flow.
Figure 18.
Organic sediment accumulation pre- (2004 left map) and post- (2012 right map) dredging of Lake Trafford. Dredging occurred between 2006 and 2010. Note the 5 times discrepancies between the scales.
Figure 18.
Organic sediment accumulation pre- (2004 left map) and post- (2012 right map) dredging of Lake Trafford. Dredging occurred between 2006 and 2010. Note the 5 times discrepancies between the scales.
Figure 19.
Changes in groundwater and lake elevations over the course of the study, along with measured groundwater discharge (black dots). Increased groundwater discharge should be expected when groundwater elevation (dotted line) is higher than lake water elevation (black line).
Figure 19.
Changes in groundwater and lake elevations over the course of the study, along with measured groundwater discharge (black dots). Increased groundwater discharge should be expected when groundwater elevation (dotted line) is higher than lake water elevation (black line).
Table 1.
RMSE values for each pair of duplicates, grouped by sampling site. Lower RMSE values indicate better replication between two meters.
Table 1.
RMSE values for each pair of duplicates, grouped by sampling site. Lower RMSE values indicate better replication between two meters.
| Groundwater Site |
Meter A (mean flux
(L m-2 d-1) |
Meter B
(L m-2 d-1) |
RMSE |
| 3 |
1.607 |
1.518 |
2.201 |
| 5 |
0.058 |
0.262 |
0.782 |
| 10 |
0.326 |
-0.231 |
1.152 |
| 13 |
-0.008 |
-0.004 |
0.695 |
| 15 |
1.308 |
1.718 |
2.034 |
Table 2.
Mean, standard deviation (S.D.), and min/max values for each facet of the water budget. Q from all five canals was pooled. Values were rounded to the nearest cubic meter.
Table 2.
Mean, standard deviation (S.D.), and min/max values for each facet of the water budget. Q from all five canals was pooled. Values were rounded to the nearest cubic meter.
| Statistics |
Lake Volume (m3) |
Rainfall Volume (m3 d-1) |
Canals
(m3 d-1) |
GW In
(m3 d-1) |
GW out
(m3 d-1) |
ET
(m3 d-1) |
Net sheet flow
(m3 d-1) |
| Average |
11,483,262 |
13,325 |
35,066 |
8320 |
-333 |
23,544 |
-49,052 |
| S.D. |
884,197 |
44,892 |
40,237 |
4600 |
464 |
15,004 |
80,441 |
| Min |
9,792,532 |
0 |
-13,508 |
1322 |
-2,649 |
2,522 |
-243,249 |
| Max |
13,188,166 |
331,501 |
185,919 |
20,135 |
0 |
70,280 |
355,396 |
