1. Introduction
Chironomids are one of the aquatic insect families with the highest species numbers, including up to 15000 described species, often contributing to the highest observed diversity in the sample, including species tolerant to environmental extreme conditions. [
1].
It is clear that species respond to a suite of different environmental (=abiotic) factors, such as water temperature, salinity, sediment composition [
2], but biotic factors (competition, predation) were also considered as relevant [
3].
Interactions between different factors vary in different situations confounding the interpretation of results. Spatial and temporal contiguities are surely responsible of species abundances making the interpretation of the real causes of species distribution questionable. The situation can be still more intriguing in unstable habitats as Mediterranean waters [
4] where relevant fluctuations are observable in different years, actually still more exacerbated by global climatic change [
5]. Historical (biogeographic) factors influence chironomid species composition only at very large spatial scale [
6], but in special habitats as headwaters it can be supposed they act at smaller spatial scale, even if a clear evidence was given only considering other insects orders as Trichoptera [
7]. Despite the complexity of situations, often few factors were emphasized to account for the largest proportion of variation [
8].
The scarcity of samples available, different sampling tools used, different taxonomic expertize of researchers contributed to increase the uncertainty in interpreting results.
The response of chironomid species at different spatial scales [
9,
10] was rarely investigated in the past, and factors operating at small spatial scales were generally considered prevalent ([
11,
12].
The aim of the present review is to confirm the importance of environmental factors acting at low spatial scales and to analyze the possible importance of factors acting at larger spatial scales using the most recent tools used to analyze data based on Moran’s eigenvector maps (MEM) [
13], which, starting from a geographical coordinates distance matrix, are able to extract an eigenvectors matrix explaining species distribution at different spatial scales.
2. Materials and Methods
The input data matrix included 788 samples collected in 11 different habitats (Table 1) from lotic and lentic waters, the former classified according to [
14], the latter according to [
15,
16]. The samples were collected with different tools according to their habitat type. Kick sample was generally used in kryal, krenal and rhithral, drift samples were collected in potamal, a ponar dredge was used in AL03, AL04,AL05, AL06 and ME lakes, an Ekman dredge was used in Alpine lakes (ALalp). The data are from samples collected in Italy [
2,
8], Austria and Germany [
17], Switzerland [
18,
19], Montenegro [
20], Greece [
21], Algeria [
22,
23], France (Garonna River, unpublished data).
Raw data included 19531 samples and 255 variables. Only sites including values of at least 10 variables and variables present in at least 100 samples were retained. This selection left 782 sites with 101 species and 9 environmental variables: altitude, distance from the source, conductivity, dissolved oxygen, oxygen % saturation, pH, total phosphorous, ammonium hydroxide. Four spatial extensions (regional, country, water basin, sampling site), habitat type, year and month were also included as factors in database.
Data were analyzed with a partial correspondence analysis (pCCA) after log(x+1) transformation of species matrix and standardization of environmental variables. The pCCA was carried out with species matrix as dependent variables, the 9 environmental variables as constraining variables and spatial coordinates as conditioning variables (covariates). Forward and backward selection of environmental variables was performed to select the variables accounting for the largest source of variation.
To analyze the usefulness of habitat type in driving species composition a multiple discriminant analysis was performed with species as dependent variables and habitat type as discriminant factor.
To analyze the influence of spatial factors, the sites having the same spatial coordinates, but sampled in more than one date, were pooled into a single record, leaving a matrix with 264 sites, with 54 species present in at least 50 sites. The spatial coordinates were expressed in the coordinate reference system WGS 84 / UTM zone 32.
Univariate Moran’s I spatial correlograms of each environmental variable and of each species were calculated. Multivariate Mantel’s correlograms for the full set of environmental variables and species assemblage were also calculated [
25].
A spatial distribution was then analyzed with the R-packages adespatial, spdep, vegan, to calculate the Moran’s Eigenvector Maps (MEM) using the function mem [
26]. The correlation coefficients between the environmental variables and Moran’s I eigenvectors matrix were then calculated. The species matrix was then submitted to a Multiscale Pattern Analysis (MSPA) [
27] using the function mspa, to calculate the spatial structure of the data and identifying the main scales of spatial variation.
A Spatial Weighting Matrix (SWM) was selected using the functions mem.select, listw.candidates, listw.select included in adespatial package [
28]; two SWM for which the subset of MEMs yields the highest adjusted R2 with species table were chosen.
As a last step a canonical analysis (redundancy analysis using the function pcaiv of package ade4) was used to explain the structure of species table constrained by MEM spatial variables selected starting from the best spatial weighting matrix (SWM). See Figure 1 in [
27] for a detailed explanation of all these steps.
Diversity was calculated: 1- as the mean species number present at each spatial scale (alpha diversity), 2- the total number of species present (gamma diversity), 3- ratio between gamma and alpha diversity (beta diversity).
3. Results
The full matrix of environmental and species data with sites as rows and variables as columns is in Appendix S1.
The list of the species included in data analysis is in Table 2.
A partial canonical constrained ordination (pCCA) analysis was carried out using environmental variables as constraining variables and spatial factors as conditioning variables. Results of pCCA and its inverse, that is with spatial variables as constraining variables and environmental variables as conditioning variables are in Table 3. pCCA confirmed results of previous investigations [
2], with a clear separation of high altitudes sites, with low water temperature from all the other sites (Figure 1). The separation was evident along the first axis and was explained by an altitudinal – temperature gradient; the second axis emphasized a clear trophic gradient, with sites rich in total phosphorus and with a low oxygen concentration separated from sites with low TP and high oxygen concentration.
Figure 1.
The plot of sites evidenced a clear habitat separation (Figure 2), with kryal sites separated on the left and potamal sites on the right bottom. The alpine lakes at high altitude were plotted on the right of the kryal sites. The separation of lowland lakes from rhithral sites was less evident, but rhithral sites showed a crowding of sites in the center of the graph, while sites sampled in lakes surrounded them. The plot of species (Figure 3) show the species preferring the different habitats, separating species characteristic of kryal and alpine lakes (on the left of the Figure) from species characterizing potamal and rhithral. The separation of species preferring krenal or littoral of lakes is less evident here.
Figure 2.
Figure 3.
An inverse partial cca carried out using spatial coordinated as constraining variables and environmental variables as conditioning variables emphasized that the second axis separated sites and species according to latitude (Y axis), and longitude (X axis) (Figure 4).
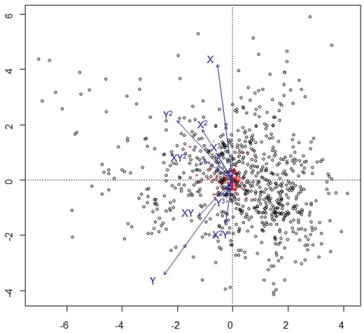 Figure 4
.
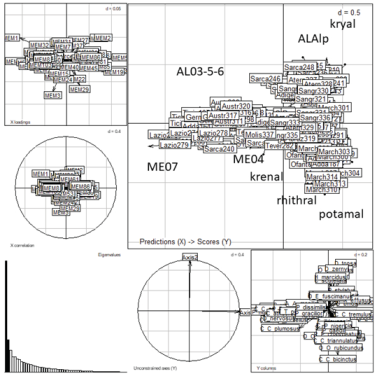
Discriminant analysis using habitat types as factors still better emphasized the separation of habitats with a very good agreement between expected and observed classification (Figure 5, Table 4, Appendix S2). It can be seen that some habitat as rhithral have more sites predicted than assigned while others as lakes AL05-AL06 have a lower number of predicted sites than initially assigned.
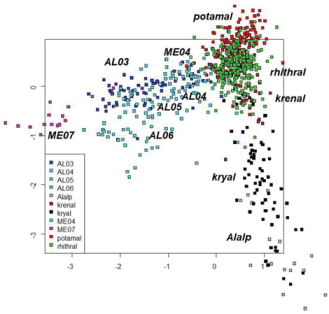 Figure 5.
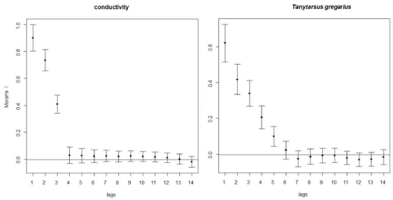
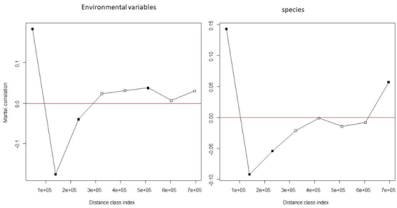
The univariate spatial correlograms showed that spatial autocorrelation decreases rapidly with increasing distance class both with environmental variables and species; the highest autocorrelation for environmental variables was observed with conductivity (Figure 6a), for species with T. gregarius (Figure 6b). The mantel correlograms showed that Mantel’s autocorrelation vanished just after the first distance class (Figure 7a,b).
Figure 6.
Figure 7.
The most significant Moran’s eigenvectors (MEM) generated from spatial weighting matrix (SWM) were calculated and plotted in the European map. The full matrix of MEM is given in Appendix S3. The eigenvector values of the most significant MEM were divided into 5 classes of values and marked with five different colors for their representation (Figure 8). The MEM of the 1
st axis was related to latitude, the MEM of the 2
nd and 3
rd to longitude, while the interpretation of the other axes was not clear. Few significant correlations between environmental variables and MEM eigenvectors were observed (Appendix S4). The R
2 correlations between the species matrix and MEM spatial predictors, calculated from the best SWM (see Data analysis), were filed in decreasing order according to R
2 values (Table 5). In Appendix S5 the R
2 correlations calculated from another SWM are given [
27]. Redundancy analysis (RDA) was carried out to relate the sites x species matrix with spatial MEM eigenvectors; results are in Figure 9. A separation of sites according to habitat (lake type, running water type) is still apparent, but it does not seem that spatial factors aid substantial information. The detailed results of MSPA with the scores of species, sites and MEM variables are in Appendix S6.
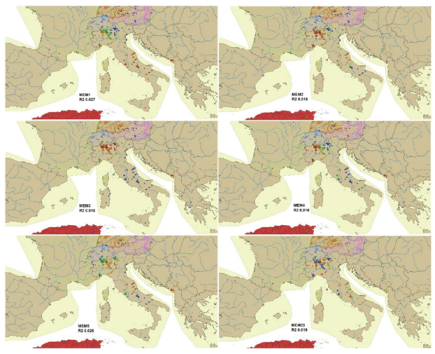
Figure 8.
Figure 9.
The highest beta and gamma diversity were observed in rhithral and potamal samples, the lowest in volcanic lakes, while the highest alpha diversity was observed in lakes AL06 and the lowest in alpine lakes ALalps. The highest gamma diversity (93 species) was observed in Sarca river basin, the highest beta in Adda river basin, at a lower spatial scale the highest gamma diversity (77 species) was observed in Lambro stream, the highest beta in Bormida stream (Appendix S7).
4. Discussion
The present study focused on the influence of environmental variables and spatial factors to taxonomic composition of chironomid assemblage.
Taxonomic composition was considered too much cumbersome in ecological studies by many authors in recent years, who tried to substitute or accompany taxonomic composition with functional composition descriptors [
30] or with species traits analysis [
31,
32]. The choice influenced the interpretation of results at different spatial scales. For example it was emphasized [
5] that traits species composition could be less affected by regional scale than taxonomic composition, while ecoregion and season accounted for 20.5% of the variance of functional composition, but only 10.9% of the variance of taxonomic structure [
9].
There are few or no contribution that can be compared with our study. Feld & Hering [
9] investigated the benthic macroinvertebrates at different spatial scales(ecoregion, catchment, reach, site) in four different countries (Sweden, the Netherlands, Germany and Poland). Mykräet al. [
10] focused their study on Fennoscandia bioregion and, following a pCCA analysis, concluded that local factors are prevalent in explaining macroinvertebrate distribution, but regional factors should in any case be considered at a larger spatial scale. In the present analysis many countries were included, i.e. Italy, France, Switzerland, Austria, Germany, Greece, Montenegro, and Algeria, even if samples from Italy were largely prevalent including West, Central, East Alps, Prealps, lowland Po River, different rivers in Central and South Italy (Appendix S1).
A comparison of our results with other studies having analysis of spatial factors as the main objective [
9] are not easy because of 3 important differences:
[
9] analyzed only running waters samples, while here both lotic and lentic samples were included,
[
9] considered the whole macrofauna, while here only the chironomid family was analyzed,
[
9] included in the analysis 31 variables at 4 different spatial scales (mega, macro, meso, micro), while in the present analysis only 9 environmental variables and 2 spatial variables were included,
[
9] used both functional and taxonomic variables, while here only taxonomic variables (species) were included as dependent variables.
Feld & Hering [
9] concluded that interactions at different spatial scales confounded the interpretation of results, but in any case reach scales (meso scale) were the variables accounting for the largest source of variation. Despite the different experimental design in the two studies, variables at small spatial scale confirmed their prevalent effect in both cases.
It is evident from the Moran’s maps that there is a spatial separation of species according to latitude and longitude, but it is surely an indirect effect, because the sites at highest altitudes are more frequent in the west part of the sampled area (West Alps), while the separation according to latitude is clearly bound to the fact the sites at the lower latitude have higher temperatures than the northern sites and effect of temperature on chironomid distribution is well documented [
33,
34]. The factors more responsible of chironomids species distribution are confirmed to be a joint combination of substrate, water temperature, conductivity, current velocity, dissolved oxygen[
2,
8] effects, which can be efficiently described using the terms kryal, krenal, rhithral, potamal, lentic or lotic habitat, clearing summarizing preferences to different factors interacting to each other. Discriminant analysis emphasized that there is a very good agreement between the ‘a priori’ and ‘a posteriori’ site classification, even if some ubiquitous species are present together specialists. The anthropogenic stress emphasized a clear response of chironomids to oxygen shortage [
2,
8,
18], while it is difficult to establish the effect of toxic substances [
35].
The present analysis shows that spatial factors generally have only indirect effect, mediated by the environmental factors present at a low spatial scale.
A very debated point is the effect of spatial scale on diversity of communities, with gamma diversity acting at larger spatial scale than alpha diversity [
36].
The sampling design of the present database is not suitable to estimate diversity, because of the differences in sampling effort in different samples. [
11,
12] analyzed the influence of spatial factors on macroinvertebrates diversity considering the effect of river order on diversity of chironomid assemblages and concluded that streams of intermediate order, more than large and low order ones had the highest diversity, suggesting that factors at intermediate spatial scale are more relevant that factors at large and small spatial scale, supporting the old intermediate disturbance hypothesis [
37]. The present database is not suitable to estimate diversity in streams of different order; we can only observe that there are no substantial differences in alpha, beta and gamma diversity at three different spatial scales.
It is obvious that the present conclusions are a consequence of the database available. For example, it is well known that at larger spatial scales, that is considering chironomid species present in different world areas (Palaearctic, Nearctic, Oriental, Neotropic, Australian) the species composition is quite different, but within the restricted area considered, which includes countries of the Mediterranean-Alpine area, the spatial factors should have no influence, if not mediated by other factors (altitude, water temperature etc.).
Supplementary Materials
The following supporting information can be downloaded at the website of this paper posted on Preprints.org, Table S1: input data of multivariate and spatial analysis, Table S2: multiple discriminant analysis results, Table S3: factors and eigenvector map values of 264 sites, Table S4: correlations between environmental variables and eigenvector values, Table S5: R2 between species matrix and MEM eigenvector matrix calculated from two different SWM distance matrices, Table S6: RDA results from species matrix constrained to eigenvector matrix, Table S7: alpha, beta and gamma diversity groups according to habitat and stations.
Author Contributions
Conceptualization, B.R.; investigation, B.R., L.M.; methodology, software, data curation, B.R.; writing—Original Draft Preparation, B.R.; Writing—Review & Editing,L.M. and B.R. All authors have read and agreed to the published version of the manuscript.
Funding
This research received no external funding.
Data Availability Statement
All specimens analyzed and the related data and all the Figures produced are deposited at the University of Milan and can be requested to the first author..
Acknowledgments
We wish to thank Angela Boggero, Nadjla Chaib, Gary Free, Piotr Gadawski, Brigitte Lod-Crozet, Chrysoula Ntislidou, Boudjéma Samraoui, Karima Zergouine for collaboration in previously published papers including data used in the present research and Régis Cereghino for the samples from the Garonna river.
Conflicts of Interest
The authors declare no conflict of interest.
References
- rmitage, P.; Cranston, P.; Pinder, C. (Eds.) The Chironomidae. Biology and Ecology of Non-Biting Midges; Chapman Hall: Lond., Glasgow, Weinheim, N. Y., Melbourne, Madras, 1995; ISBN 0. [Google Scholar]
- Rossaro, B. , Marziali, L., Boggero, A. Response of Chironomids to Key Environmental Factors: Perspective for Biomonitoring. Insects 2022, 13, 1–22. [Google Scholar] [CrossRef]
- Flory, E. A. , Milner, A. M. The Role of Competition in Invertebrate Community Development in a Recently Formed Stream in Glacier Bay National Park, Alaska. Aquat Ecol 1999, 33, 175–184. [Google Scholar] [CrossRef]
- Bonada, N.; Resh, V.H. Mediterranean-Climate Streams and Rivers: Geographically Separated but Ecologically Comparable Freshwater Systems. Hydrobiologia 2013, 719, 1–29. [Google Scholar] [CrossRef]
- Bonada, N.; Dolédec, S.; Statzner, B. Taxonomic and Biological Trait Differences of Stream Macroinvertebrate Communities between Mediterranean and Temperate Regions: Implications for Future Climatic Scenarios. Glob. Change Biol. 2007, 13, 1658–1671. [Google Scholar] [CrossRef]
- Brundin, L. Transantarctic Relationships and Their Significance, as Evidenced by Chironomid Midges. With a Monograph of the Subfamilies Podonominae and Aphroteniinae and the Austral Heptagyiae. K. Sven. Vetenskapsakad Handl 1966, 11, 1–472. [Google Scholar]
- Bonada, N.; Múrria, C.; Zamora-Muñoz, C.; El Alami, M.; Poquet, J.M.; Puntí, T.; Moreno, J.L.; Bennas, N.; Alba-Tercedor, J.; Ribera, C.; et al. Using Community and Population Approaches to Understand How Contemporary and Historical Factors Have Shaped Species Distribution in River Ecosystems. Glob. Ecol. Biogeogr. 2009, 18, 202–213. [Google Scholar] [CrossRef]
- Rossaro, B. , Marziali, L., Montagna, M., Magoga, G., Zaupa, S., Boggero, A. Factors Controlling Morphotaxa Distributions of Diptera Chironomidae in Freshwaters. Water 2022, 14, 1–23. [Google Scholar] [CrossRef]
- Feld, C. K. and Hering, D. Community Structure or Function: Effects of Environmental Stress on Benthic Macroinvertebrates at Different Spatial Scales. Freshwat Biol 2007, 52, 1380–1399. [Google Scholar] [CrossRef]
- Mykrä, H.; Heino, J.; Muotka, T. Scale-related Patterns in the Spatial and Environmental Components of Stream Macroinvertebrate Assemblage Variation. Glob. Ecol. Biogeogr. 2007, 16, 149–159. [Google Scholar] [CrossRef]
- Leszczynska, J. , Glowacki, L., Grzybkowska, M., Przybylski, M. Chironomid Riverine Assemblages at the Regional Temperate Scale – Compositional Distance and Species Diversity. Eur Zool J 2021, 88, 731–748. [Google Scholar] [CrossRef]
- Leszczynska, J. , Grzybkowska, M., Glowacki, L., Dukowska, M. Environmental Variables Influencing Chironomid Assemblages (Diptera: Chironomidae) in Lowland Rivers of Central Poland. Envir Ent 2019, 48, 988–997. [Google Scholar] [CrossRef]
- Dray,S. , R. Pe´ Lissier, P. Couteron, M.-J. Fortin, P. Legendre, P. R. Peres-Neto, E. Bellier, R. Bivand, F. G. Blanchet, M. De Caceres A.-B. Dufour, E. Heegaard, T. Jombart, F. Munoz, J. Oksanen, J. Thioulouse, And H. H. Wagner Community Ecology in the Age of Multivariate Multiscale Spatial Analysis. Ecol. Monogr. 2012, 82, 257–275. [Google Scholar]
- Illies, J. & Botosaneanu L. Problème et Méthodes de La Classification et de La Zonation Écologique Des Eaux Courantes, Considérées Surtout Du Point de Vue Faunistique..; Mitteilungen der IVL.; Wissenschaftsverlage Schweizerbart und Gebr. Borntraeger: Stuttgart, Germany, 1963; ISBN 978-3-510-52012-1. [Google Scholar]
- Buraschi, E.; Salerno, F.; Monguzzi, C.; Barbiero, G.; Tartari, G. Characterization of the Italian Lake-Types and Identification of Their Reference Sites Using Anthropogenic Pressure Factors. J Limnol 2005, 64, 75–84. [Google Scholar] [CrossRef]
- Tartari, G.; Buraschi, E.; Legnani, E.; Previtali, L.; Pagnotta, R.; Marchetto, A. Tipizzazione Dei Laghi Italiani Secondo Il Sistema B Della Direttiva 2000/60/CE. In Documento Presentato al Ministero Dell’Ambiente e Della Tutela Del Territorio e Del Mare; Roma, Italy, 2006; pp. 1–20;
- Free, G.; Solimini, A.; Rossaro, B.; Marziali, L.; Giacchini, R.; Paracchini, B.; Ghiani, M.; Vaccaro, S.; Gawlik, B.; Fresner, R.; et al. Modelling Lake Macroinvertebrate Species in the Shallow Sublittoral: Relative Roles of Habitat Lake Morphology Aquatic Chemistry and Sediment Composition. Hydrobiologia 2009, 633, 123–136. [Google Scholar] [CrossRef]
- Rossaro, B.; Boggero, A.; Crozet, B.L.; Free, G.; Lencioni, V.; Marziali, L. A Comparison of Different Biotic Indices Based on Benthic Macroinvertebrates in Italian Lakes. J. Limnol. 2011, 70, 109–122. [Google Scholar] [CrossRef]
- Lods-Crozet, B. Long-Term Biomonitoring of Invertebrate Neozoans in Lake Geneva. Arch. Sci. 2014, 67, 101–108. [Google Scholar] [CrossRef]
- Gadawski, P.; Montagna, M.; Rossaro, B.; Giłka, W.; Pešić, V.; Grabowski, M.; Magoga, G. DNA Barcoding of Chironomidae from the Lake Skadar Region: Reference Library and a Comparative Analysis of the European Fauna. Divers. Distrib. 2022, 28, 2838–2857. [Google Scholar] [CrossRef]
- Ntitslidou, C.; Rossaro, B.; Lazaridou, M.; Bobori, D.C. What Drives Benthic Macroinvertebrate Dispersal in Different Lake Substrata? The Case of Three Mediterranean Lakes. Aquat. Ecol. 2021, 55, 1033–1050. [Google Scholar] [CrossRef]
- Boulaaba, S.; Zrelli, S.; Boumaiza, M.; Rossaro, B. Relationships between Physical and Chemical Factors and Aquatic Macroinvertebrates in Perennial Streams in the Arid Northern Mountain Basin El Batina. J. Entomol. Acarol. Res. 2014, 46, 50–58. [Google Scholar] [CrossRef]
- Zerguine, K.; Samraoui, B.; Rossaro, B. A Survey of Chironomids from Seasonal Ponds of Numidia Northeastern Algeria. Boll. Zool. Agrar. E Bachic. 2009, 41, 167–174. [Google Scholar] [CrossRef]
- QGIS. org QGIS Geographic Information System. Open Source Geospatial Foundation Project. 2009.
- Borcard, D.; Gillet, F.; Legendre, P. Numerical Ecology with R; Use R!, 2nd (Eds.) ; Springer International Publishing: Cham, Switzerland, ISBN 978-3-319-71403-5. 2018. [Google Scholar]
- Griffith, Daniel A Spatial Autocorrelation and Eigenfunctions of the Geographic Weights. Can. Geogr. 1996, 40, 351–367. [CrossRef]
- Jombart T, Dray S, and Dufour, A-B. Finding Essential Scales of Spatial Variation in Ecological Data: A Multivariate Approach. Ecography 2009, 32, 161–168. [Google Scholar] [CrossRef]
- Bauman, D, T Drouet, M J Fortin, and S Dray. Optimizing the Choice of a Spatial Weighting Matrix in Eigenvector-Based Methods. Ecology 2018, 99, 2159–66. [Google Scholar] [CrossRef]
- Stéphane Dray Moran’s Eigenvector Maps and Related Methods for the Spatial Multiscale Analysis of Ecological Data 2023.
- Coffman, W. P. , Cummins, K. W., Wuycheck, J. C. Energy Flow in a Woodland Stream Ecosystem: I. Tissue Support Trophic Structure of the Autumnal Community. Arch Hydrobiol.
- Resh, V.H.; Hildrew, A.G.; Statzner, B.; Townsend, C.R. Theoretical Habitat Templets, Species Traits, and Species Richness: A Synthesis of Long-term Ecological Research on the Upper Rhône River in the Context of Concurrently Developed Ecological Theory. Freshw. Biol. 1994, 31, 539–554. [Google Scholar] [CrossRef]
- Serra, S.R.Q.; Graça, M.A.S.; Dolédec, S.; Feio, M.J. Chironomidae of the Holarctic Region: A Comparison of Ecological and Functional Traits between North America and Europe. Hydrobiologia 2017, 794, 273–285. [Google Scholar] [CrossRef]
- Marziali, L.; Rossaro, B. Quantitative Response of Chironomid Species to Water Temperature: Effects on Species Distribution in Specific Habitats. J. Entomol. Acarol. Res. 2013, 45, 73–89. [Google Scholar] [CrossRef]
- Rossaro, B. Chironomids and Water Temperature. Aquat. Insects 1991, 13, 87–98. [Google Scholar] [CrossRef]
- Marziali, L. , Pirola, N., Schiavon, A., Rossaro, B. Response of Chironomidae (Diptera) to DDT, Mercury, and Arsenic Legacy Pollution in Sediments of the Toce River (Northern Italy). Insects 2024, 15. [Google Scholar] [CrossRef]
- Tuomisto, H. A Diversity of Beta Diversities: Straightening up a Concept Gone Awry. Part 1. Defining Beta Diversity as a Function of Alpha and Gamma Diversity. Ecography 2010, 33, 2–22. [Google Scholar] [CrossRef]
- Connell, J.H. Diversity in Tropical Rain Forests and Coral Reefs. Science 1978, 199. [Google Scholar] [CrossRef] [PubMed]
|
Disclaimer/Publisher’s Note: The statements, opinions and data contained in all publications are solely those of the individual author(s) and contributor(s) and not of MDPI and/or the editor(s). MDPI and/or the editor(s) disclaim responsibility for any injury to people or property resulting from any ideas, methods, instructions or products referred to in the content. |
© 2024 by the authors. Licensee MDPI, Basel, Switzerland. This article is an open access article distributed under the terms and conditions of the Creative Commons Attribution (CC BY) license (http://creativecommons.org/licenses/by/4.0/).
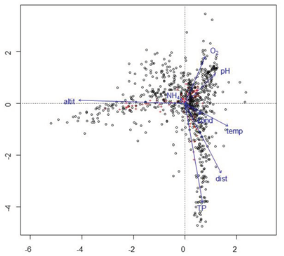
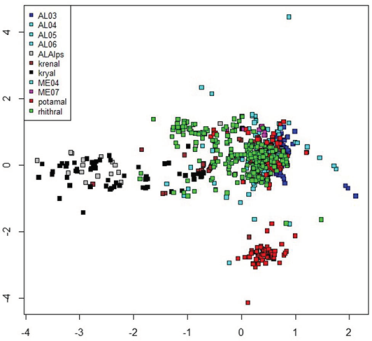
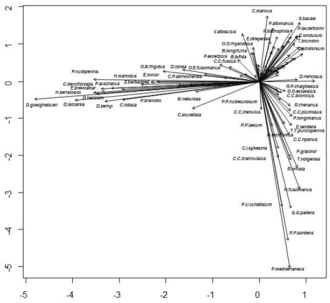
 Figure 4.
 Figure 5.
