1. Introduction
Multi-layered components are one class of composite engineering components that are highly attractive in the automobile and aerospace industries due to their mechanical and physical properties such as increased effective strength and stiffness, lower weight, corrosion resistance etc. [
1,
2]. Multi-layer structures are fabricated by bonding several metallic layers together and thus, it is theoretically possible to tailor the effective properties of the composite by choosing an optimal combination of material and layer thickness [
3,
4]. There are two main types of bonding processes reported in the literature, mechanical bonding (such as mechanical clinching, and self-pierce riveting) and metallurgical bonding (such as welding and adhesive bonding) with the latter obtained by diffusion processes [
5]. The time required for generating a mechanical bonding is short but generally results in a weak interface bond strength compared to metallurgical bonding. On the other hand, metallurgical bonding commonly requires a long dwelling time at the specific temperature due to the time required for diffusion processes between the layers to take place [
6]. One promising method for obtaining a strong metallurgical bond in short time scales is joining by hot plastic deformation [
7,
8,
9,
10]. The mechanism of bond formation during hot plastic deformation can be divided into two parts.
I) Deformation of surface asperities which leads to fracture of surface oxide layers and greater metal to metal contact.
II) Atomic diffusion across the interface in conjunction with additional plastic deformation which gradually shrinks the voids along the interface [
11].
From a theoretical viewpoint, there are several factors which influence the bond strength in plastic deformation processes. Temperature, time, plastic strain and plastic strain rate, surface roughness and bonding environment all govern the quality of the bond [
12]. Nevertheless, the exact relationship between these parameters and the resulting bond strength in hot deformation bonding is still an open question.
Several different solid state bonding criteria are reported in the literature. These can be divided into pressure based criteria [
13,
14,
15], strain based criteria [
16] and criteria which take both the strain and the pressure into consideration [
17]. Recent models even consider the hydrostatic pressure gradient that drives the atomic diffusion processes [
18]. On promising criterion for assessing the quality of bond formation which takes into account both the strain, strain rate, temperature and stress is the J criterion [
10,
19]. The quality of the bond is determined by computing a history dependent scalar parameter J which takes the form:
Where is a coefficient related to material and surface conditions for metal bonding, and are the hydrostatic stress and equivalent stress respectively, is the universal gas constant [J/(mol K)], is the diffusion activation energy [J/mol], is the temperature in [K] and is the strain rate [1/sec].
In [
7] Al7075/AZ31B/Al7075 laminated composites were fabricated using roll bonding at different temperatures and reduction ratios. Finite element analysis was used to study the roll bonding process and compute the strain and stress history at the interface between the layers. A critical strain was suggested for attaining the bond and a critical stress was suggested for maintaining the bond throughout the rolling process. The authors state that the material yield strain can be taken as the critical strain for bond formation and that the critical stress is governed by the yield stress of the weaker material in the bond and the rolling reduction. The authors report good agreement between the experiments and the bond criterion, but the comparison is only made regarding seperation of the layers during the rolling process and not via mechanical testing. It is interesting to note that the temperature does not play an explicit role in the bonding criterion and is only taken into consideration by the effect it has on the material flow stress. In [
8], truncated Al-Steel parts were bonded using a friction stir assisted double sided incremental forming method. In this method two cup shaped sheets are held together, one inside another, while a revolving rigid tool deforms the two sheets in an incremental form. A numerical model was utilized to compute the thermo-mechanical fields which develop during the process. The bond strength was measured by a subsequent peeling experiment. A pressure-strain based bonding criterion (the Q criterion) was used to estimate the bond strength. It is reported that a Q value of 1 is required for bond formation but that a value of Q greater than 1.4 results in bond strength reduction due to the formation of Fe-Al intermetallic. In [
9] cylindrical specimens of a Al-Cu-Li alloy were joined by hot compression bonding at temperatures of 450-550ᵒC and strain rates of 0.01-1 [1/sec]. Tensile specimens were machined from the bonded pairs and tested until failure. A variation of the J criterion which assumed constant interface pressure and strain rate during the bonding process was used to estimate the bond quality. It was demonstrated that a value of J greater than 1.2 results in a relative bond strength of 0.8 compared to the materials ultimate stress. It was also reported that specimens bonded at higher strain rates had higher interface bond strength. This finding was attributed to the increase in material flow stress, at higher strain rates, which leads to greater interface pressure values.
As shown, determining the relation between the bond strength and the conditions during the hot deformation bonding process requires computing some bonding criterion value and comparing this value to the results of the bond strength determined by a mechanical test that breaks the bond. Most studies in the litrature assume that one value of the given bonding criterion can be used to represent the whole bonded surface. Also it is assumed that the whole interface is bonded for the purpose of calculating the bond strength. These assumptions may not be correct in hot deformation bonding processes due to the inhomogeneity of the thermo-mechancial fields across the interface as demonstrated in [
20] for roll bonding and in [
10] for compression bonding.
In the current study, an experimental-computational approach consisting of three main stages was utilized to investigate the bonding process of AA6061 specimen pairs. In the first stage, the temperature and rate dependent flow-stress of the AA6061 alloy used in the study was determined using hot compression tests. The second stage focused on creating bonded AA6061 specimen pairs using hot compression bonding experiments at different temperatures and loading rates. Mechanical testing of the bond was conducted, in stage three, in order to quntify the bond strength. Thermo-mechanical finite element models were utilized in order to compute the time dependent thermo-mechanical fields which develop at the bonded interface. Metallurgical charcterization was carried out in order to examine the true bonding area achived for each temperature and loading rate.
The goal of the current study was to investigate how the inhomogenous thermo-mechanical fields influence the true bonding area achieved in the bonding processes at different temperatures and compression rates. It is also examined if a spatial maping of the J criterion across the interface can be used to predict the true bonding area, and as a result, the true bond strength.
Following this introduction, section 2 describes the experiments and finite element models utilized in this study.
Section 3 describes the experimental and computational results with a through discussion of the results given in
Section 4. Summary and conclusions are given in
Section 5.
2. Materials and Methods
2.1. Experiments
As mensioned in the introduction, in order to investigate the actual size of the bonded areas created during bonding processes, compression experiments were conducted at different temperatures and compression rates. Pairs of AA6061-T6 specimens were compressed together in order to create a metallurgical bond. Then, subsequent debonding experiments were conducted. The experimental setups are detailed herein.
2.1.1. Experimental Setup of Hot Compression Bonding
Beam-shaped specimen pairs of AA6061-T6 were used for the bonding experiments (see
Figure 1, (b1-b3)). The specimens were machined from an AA6061-T6 plate. The dimensions of the beams were 50x21x6.3 [mm]. The hot compression experiments were conducted using a MTS exceed system machine with a maximal load of 300kN, combined with a furnace capable of reaching temperatures of up to
.
As a preliminary step, the material flow-stress was evaluated from compression of cuboid specimens (see
Figure 1, (a1-a3)). These specimens were machined from the beam specimens using electrical discharge machining (EDM) apparatus.
The experimental parameters of both compression of beam pairs and of cuboids were temperature and loading rate. Both experiments were conducted at , and , and under loading rates of 7.2 and 72 [mm/min].
2.1.2. Experiemtnal Setup of the Debonding Tests
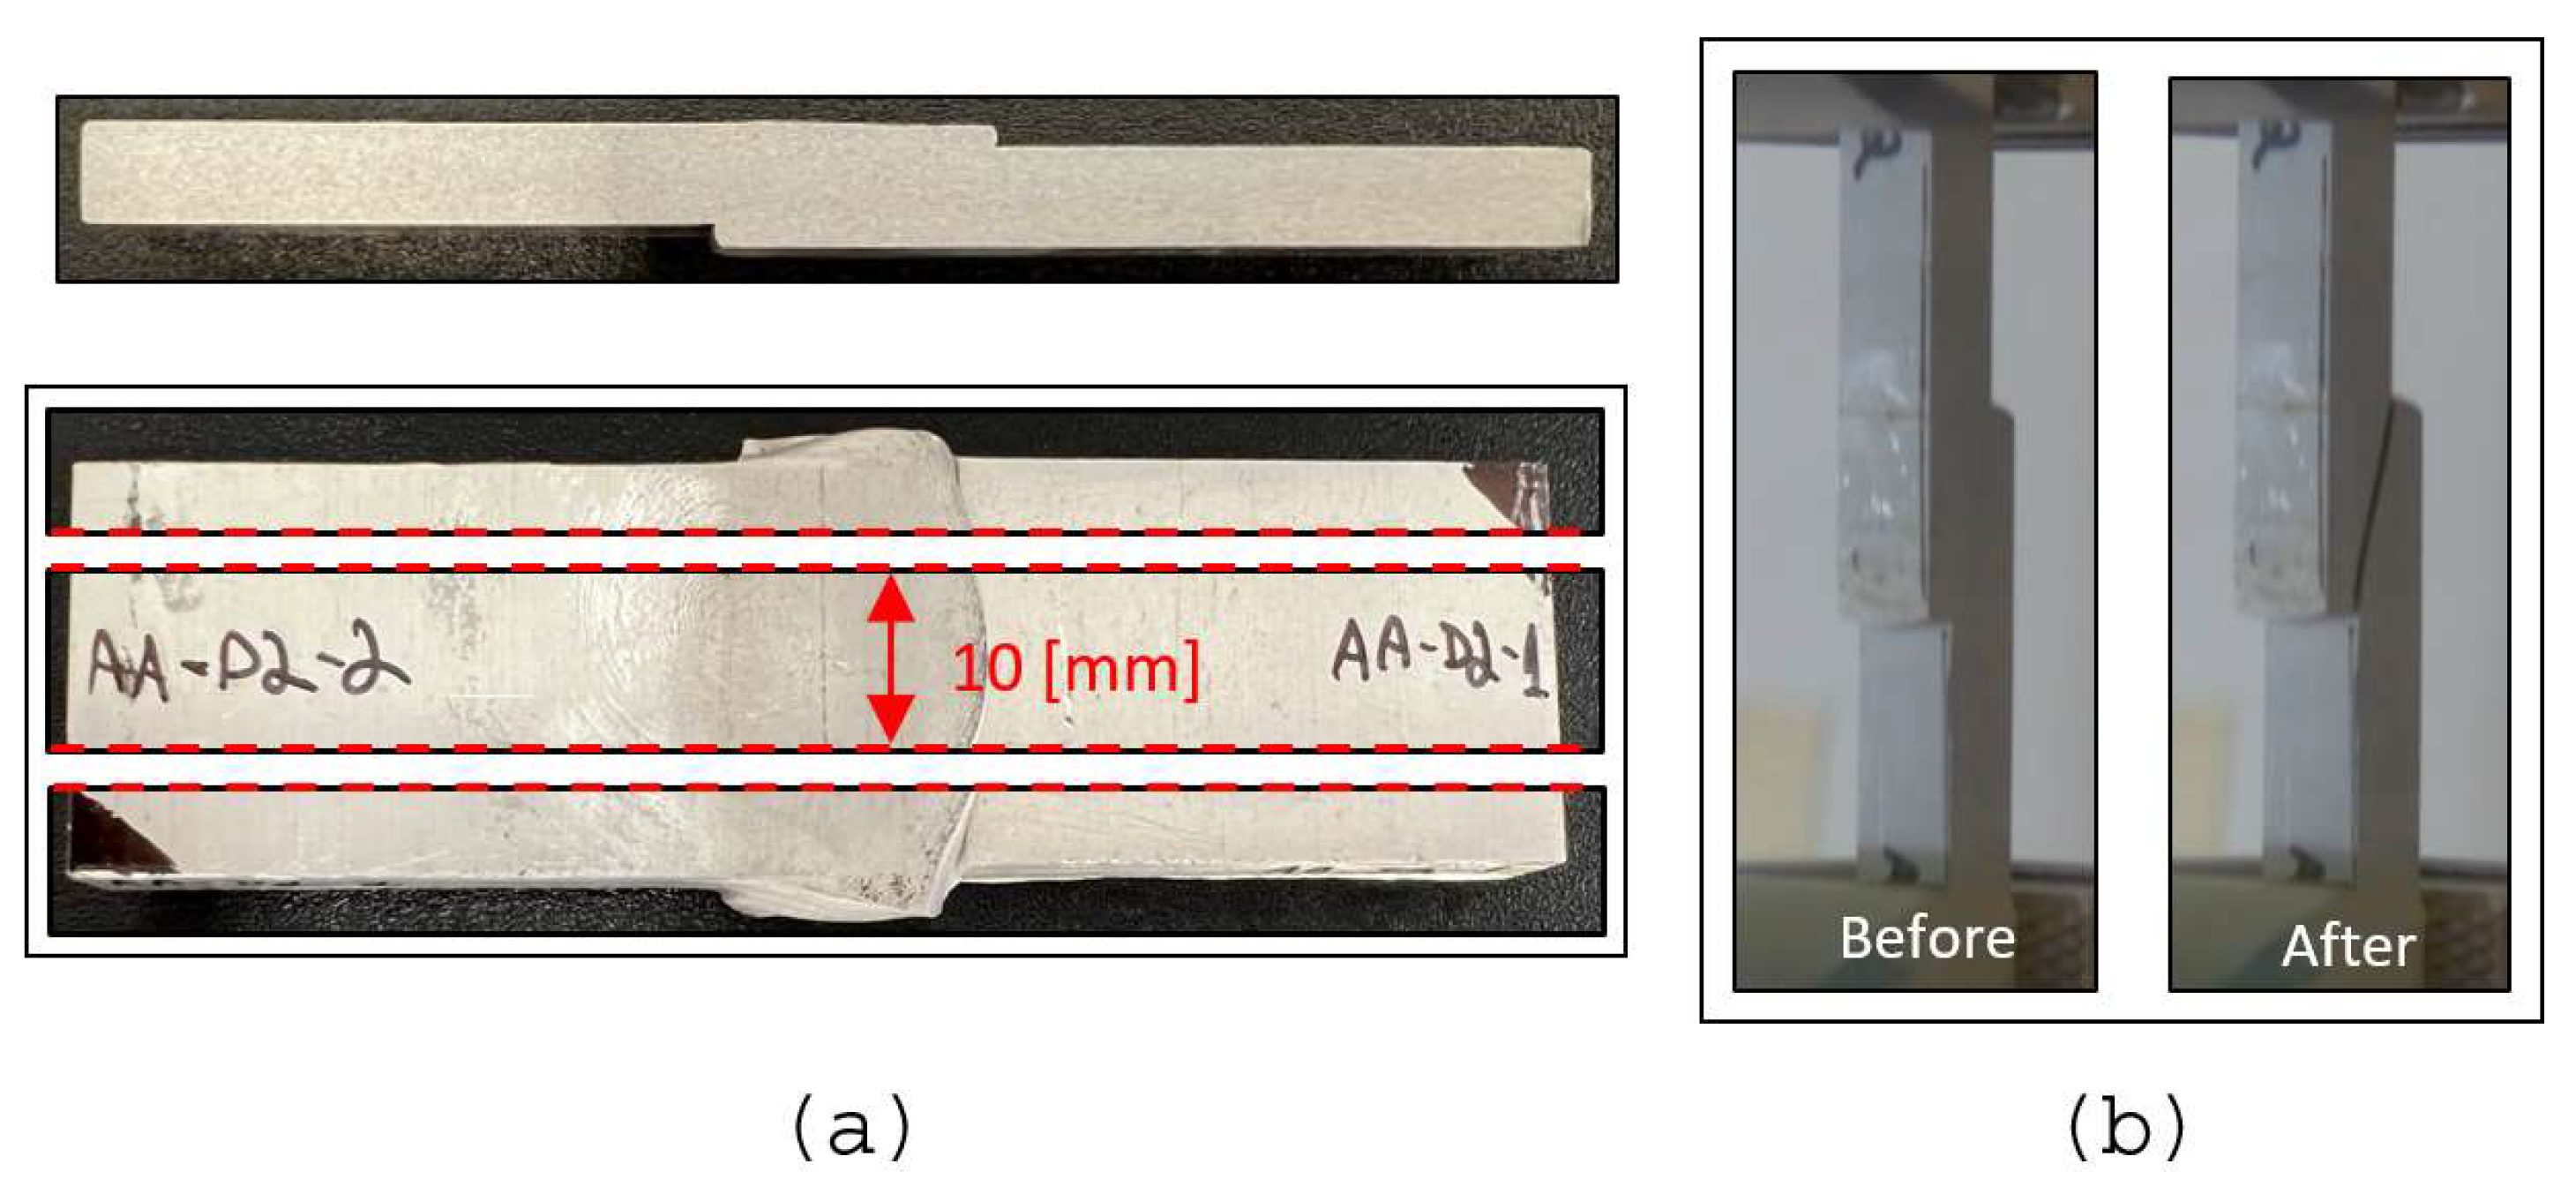
The compression tests, which resulted in bonding of the beam pairs, were followed by debonding experiments, aimed to quantify the interface bonding strength as well as the true size of the bonded interface. The debonding stage was carried out in the form of a tension test. However, the dimensions of the beam pairs obtained from the compression tests varied. In order to obtain uniform tensile test specimens, with similar dimensions, the compression bonded beams were precisely machined using EDM. A 10 [mm]-wide middle section was used in the tensile test, as can be seen in
Figure 2.
All tensile experiments were conducted at room temperature and at constant loading rate of 1 [mm/min].
2.2. Computational Models
To study the bonding process, thermo-mechanical finite element models were developed using the commercial finite element code ABAQUS [
21]. The models were used to simulate both the hot compression tests of the cuboid specimens and the hot compression bonding of the specimen beam pairs. In both cases, the solution requires solving the momentum (presented here in the weak form) and the heat transfer equations:
In the weak form of the momentum equation given by (1),
are the cauchy stress and the rate of deformation tensor,
are the body force and traction boundary conditions and
are the density and acceleration. In the heat transfer equation,
is the temperature,
are the conductivity, density and heat capacity. Equations (1) and (2) are coupled since in general, the material flow stress and physical and thermal constants are temperature dependent. Also, for large plastic deformations, local heat is generated by dissipation of the deformation energy. This is incorporated through a local heat source which depends on the stress, plastic strain rate and the Taylor-Quinney coefficent
which specifies the fraction of plastic work converted into heat [
23].
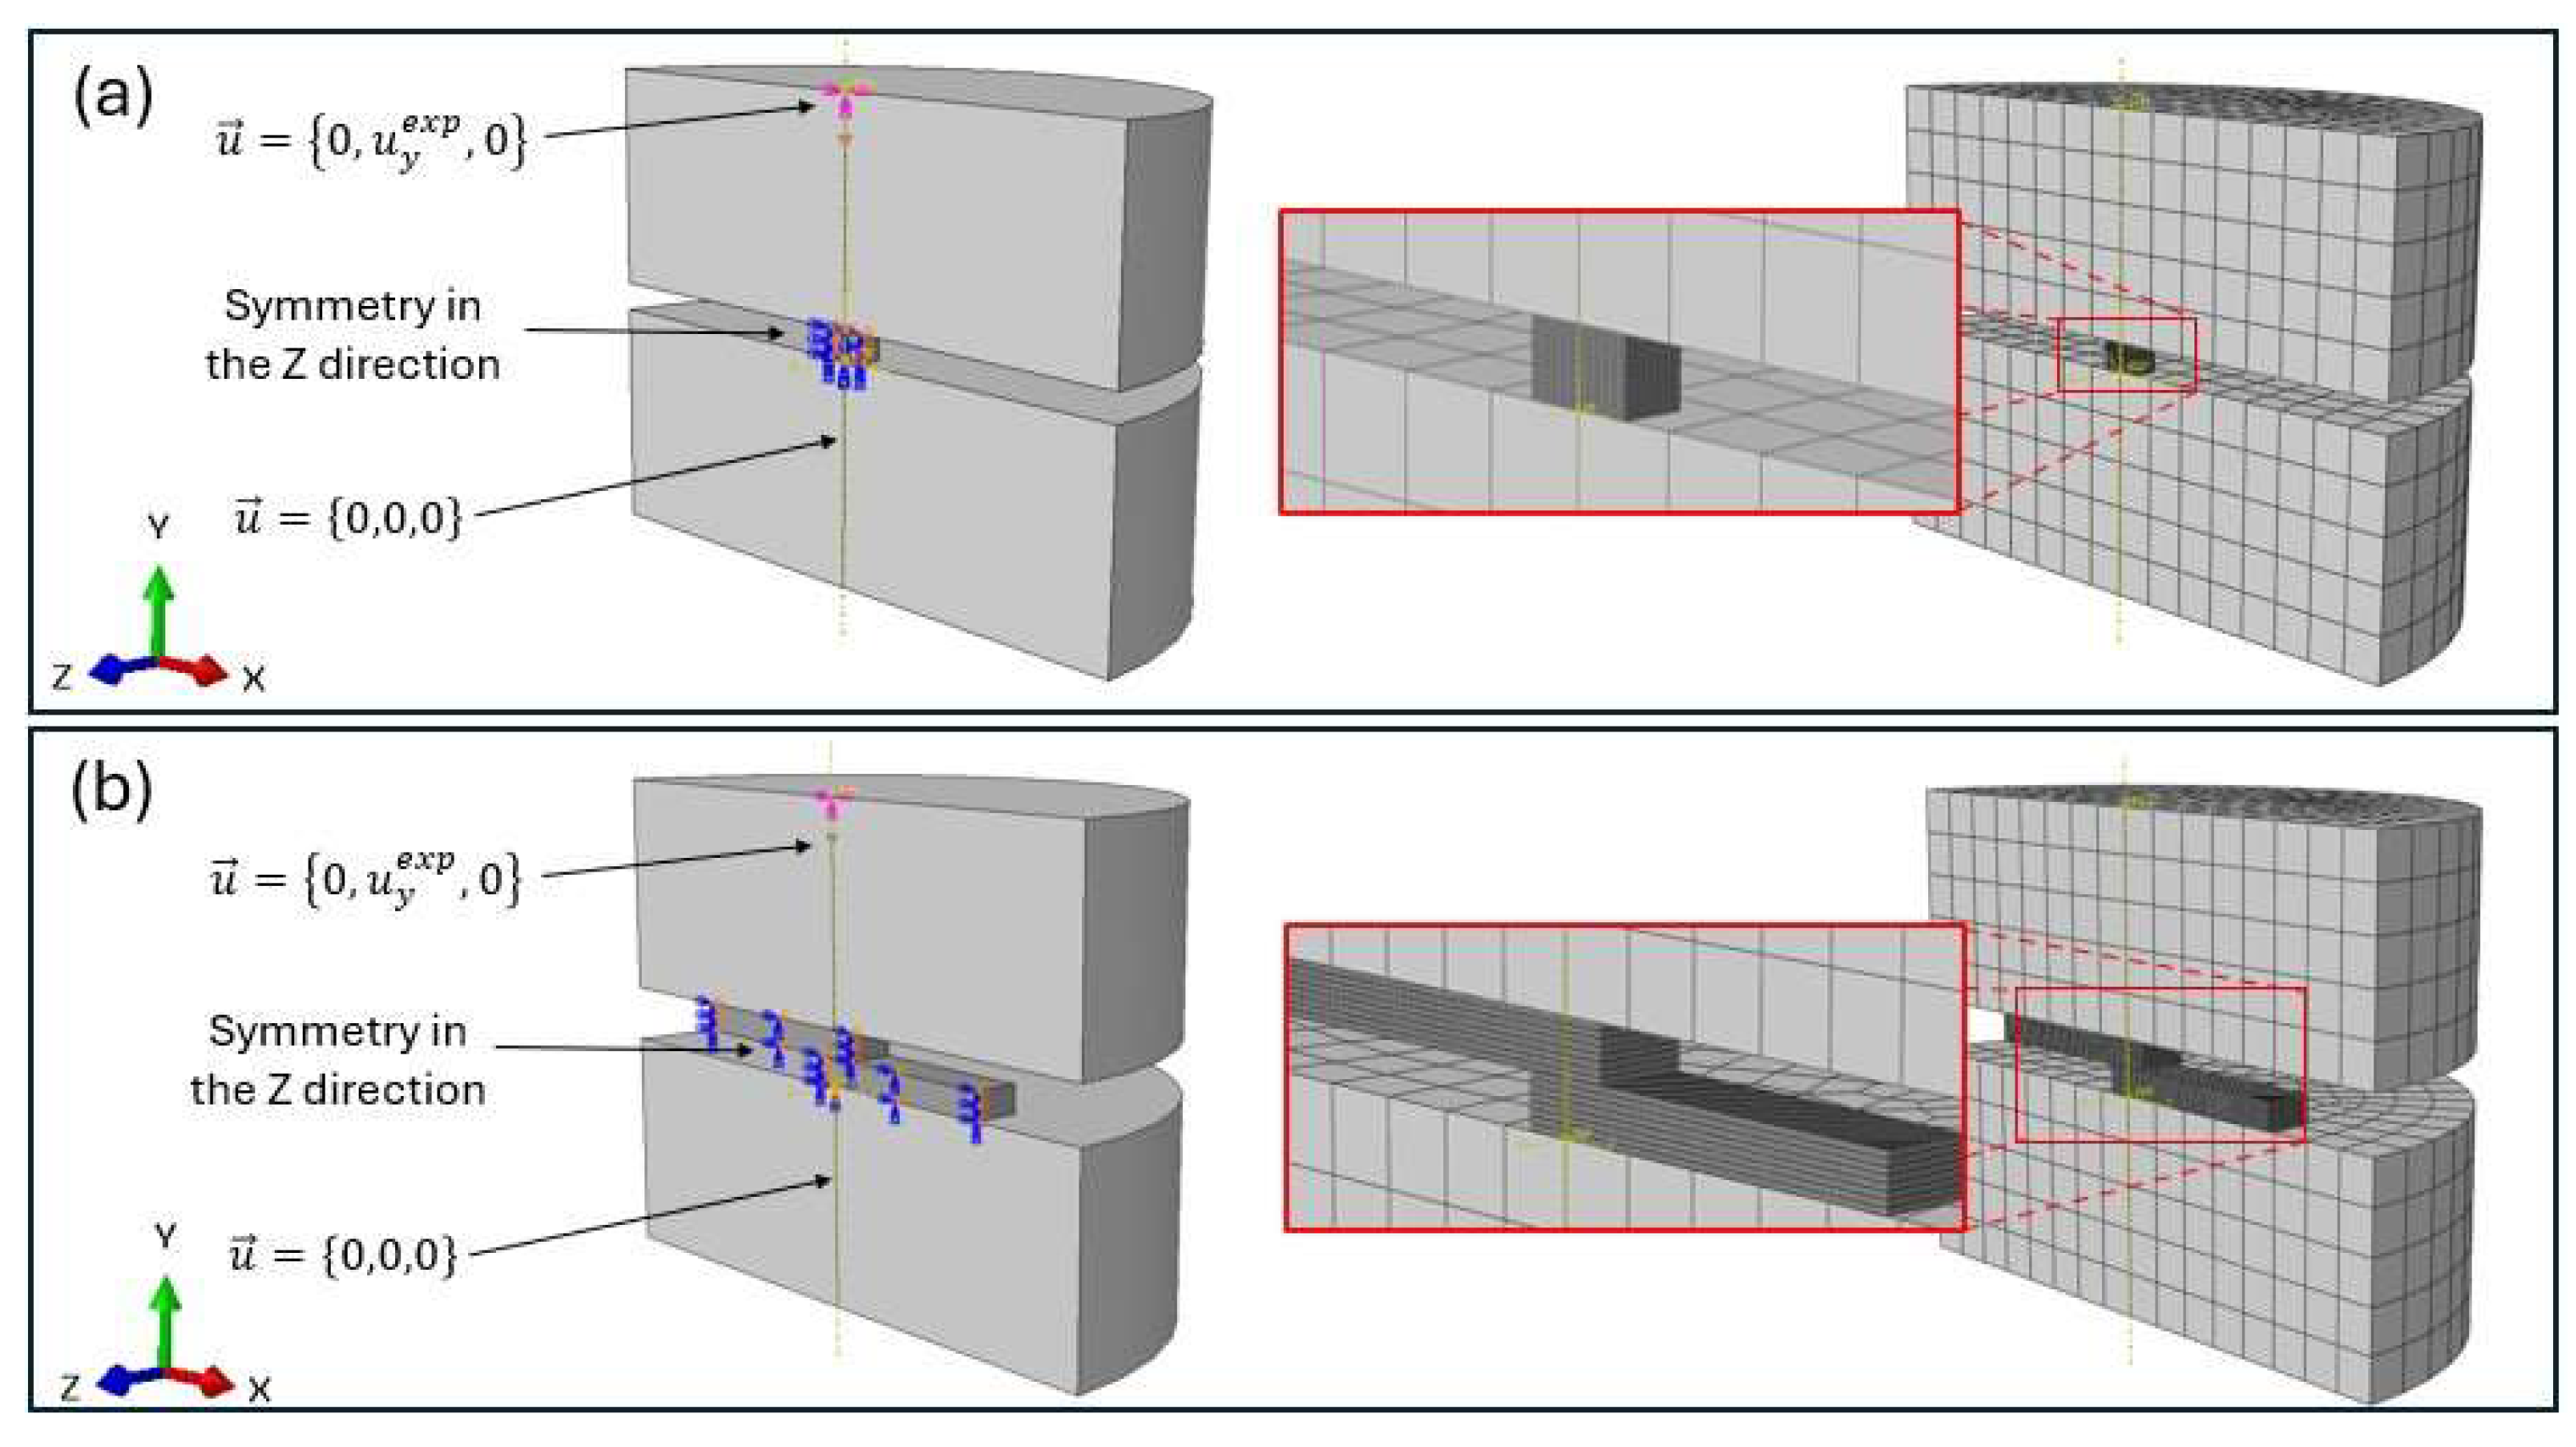
Due to the geometry of the specimens, the models were defined as 3D but only half of the system was modeled due to symmetry. A dynamic implicit solver was used for the cuboid specimens, while a dynamic explicit solver was used for the beam bonding simulations. The reason for using an explicit solver for the bonding simulations was to enable the utilization of mass scaling which can greatly expedite the CPU time required for obtaining a converged solution. It was verified that the kinetic energy is two orders of magnitude lower than the internal energy in order to ensure that the used mass scaling did not introduce artificial accelerations which can influence the solution for the mechanical fields. A penalty-type contact constraint was defined between the specimen and the rams with a constant friction coefficient at all temperatures previously determined by the authors in [
22]. In addition, hard contact was defined at the normal direction (no penetration was allowed). The Al6061 was defined as an elasto-plastic material using the J
2 yielding criterion with isotropic hardening. The temperature and strain rate dependent flow stress for the Al6061 was determined from the hot compression experiments as will be discussed in the next section. The Taylor-Quinney coefficient was taken as
while the thermal and properties of AA6061 were taken from [
6]. The steel rams were defined as rigid bodies since they do not experience notable deformation compared to the specimens. Being rigid, the rams were coarsely meshed with respect to the specimen. The mesh was constructed from 8-noded thermally coupled elements with reduced integration and hourglass control (termed C3D8RT in ABAQUS). The boundary conditions (BC) were defined according to the experiments with a constant upper ram velocity and a fixed lower ram. Initial conditions (IC) for the temperature were also defined according to the experiments. Since the experiments were conducted inside the furnace and the specimen temperature is similar to the temperature inside the furnace, it was assumed that convection heat transfer during the compression experiment can be neglected. This was verified later on by observing the computed local increase in temperature due to plastic work dissipation. The model, boundary conditions and a representative mesh are presented in
Figure 2.
All models underwent solution verification by conducting mesh convergence studies. It was ensured that convergence was attained in both global variables such as compression force and internal energy, and local values such as local plastic strain and equivalent Misses stress.
3. Results
3.1. Determining the Flow Stress for Different Temperatures and Loading Rates
The flow stress was characterized for each of the three temperatures - , and , and two loading rates - 7.2 and 72 [mm/min]. For every combination of the tested parameters, two experiments were performed, and their results were averaged for the flow stress determination process.
Using a computational iterative approach, the FE models of the hot compression tests were used to characterize the flow stress. The flow stress for a given temperature and strain rate can be described by the Ludwik form:
Assuming an initial guess for the three parameters
, the computational model is used to computed the force-displacement response and the observed specimen deformation. An objective function is defined, which quntifies the error between the computed and measured values. The iterative process involves conducting subsequent computations for changing values of the models parameters, until the error between computed and measured values is less then 5%. A detailed example of such a process, reported previously by the authors for determining the flow stress values for hot compression forming can be found in [
22,
24].
Table 1 provides the parameters for the Ludwik form identified for each temperature and loading rate.
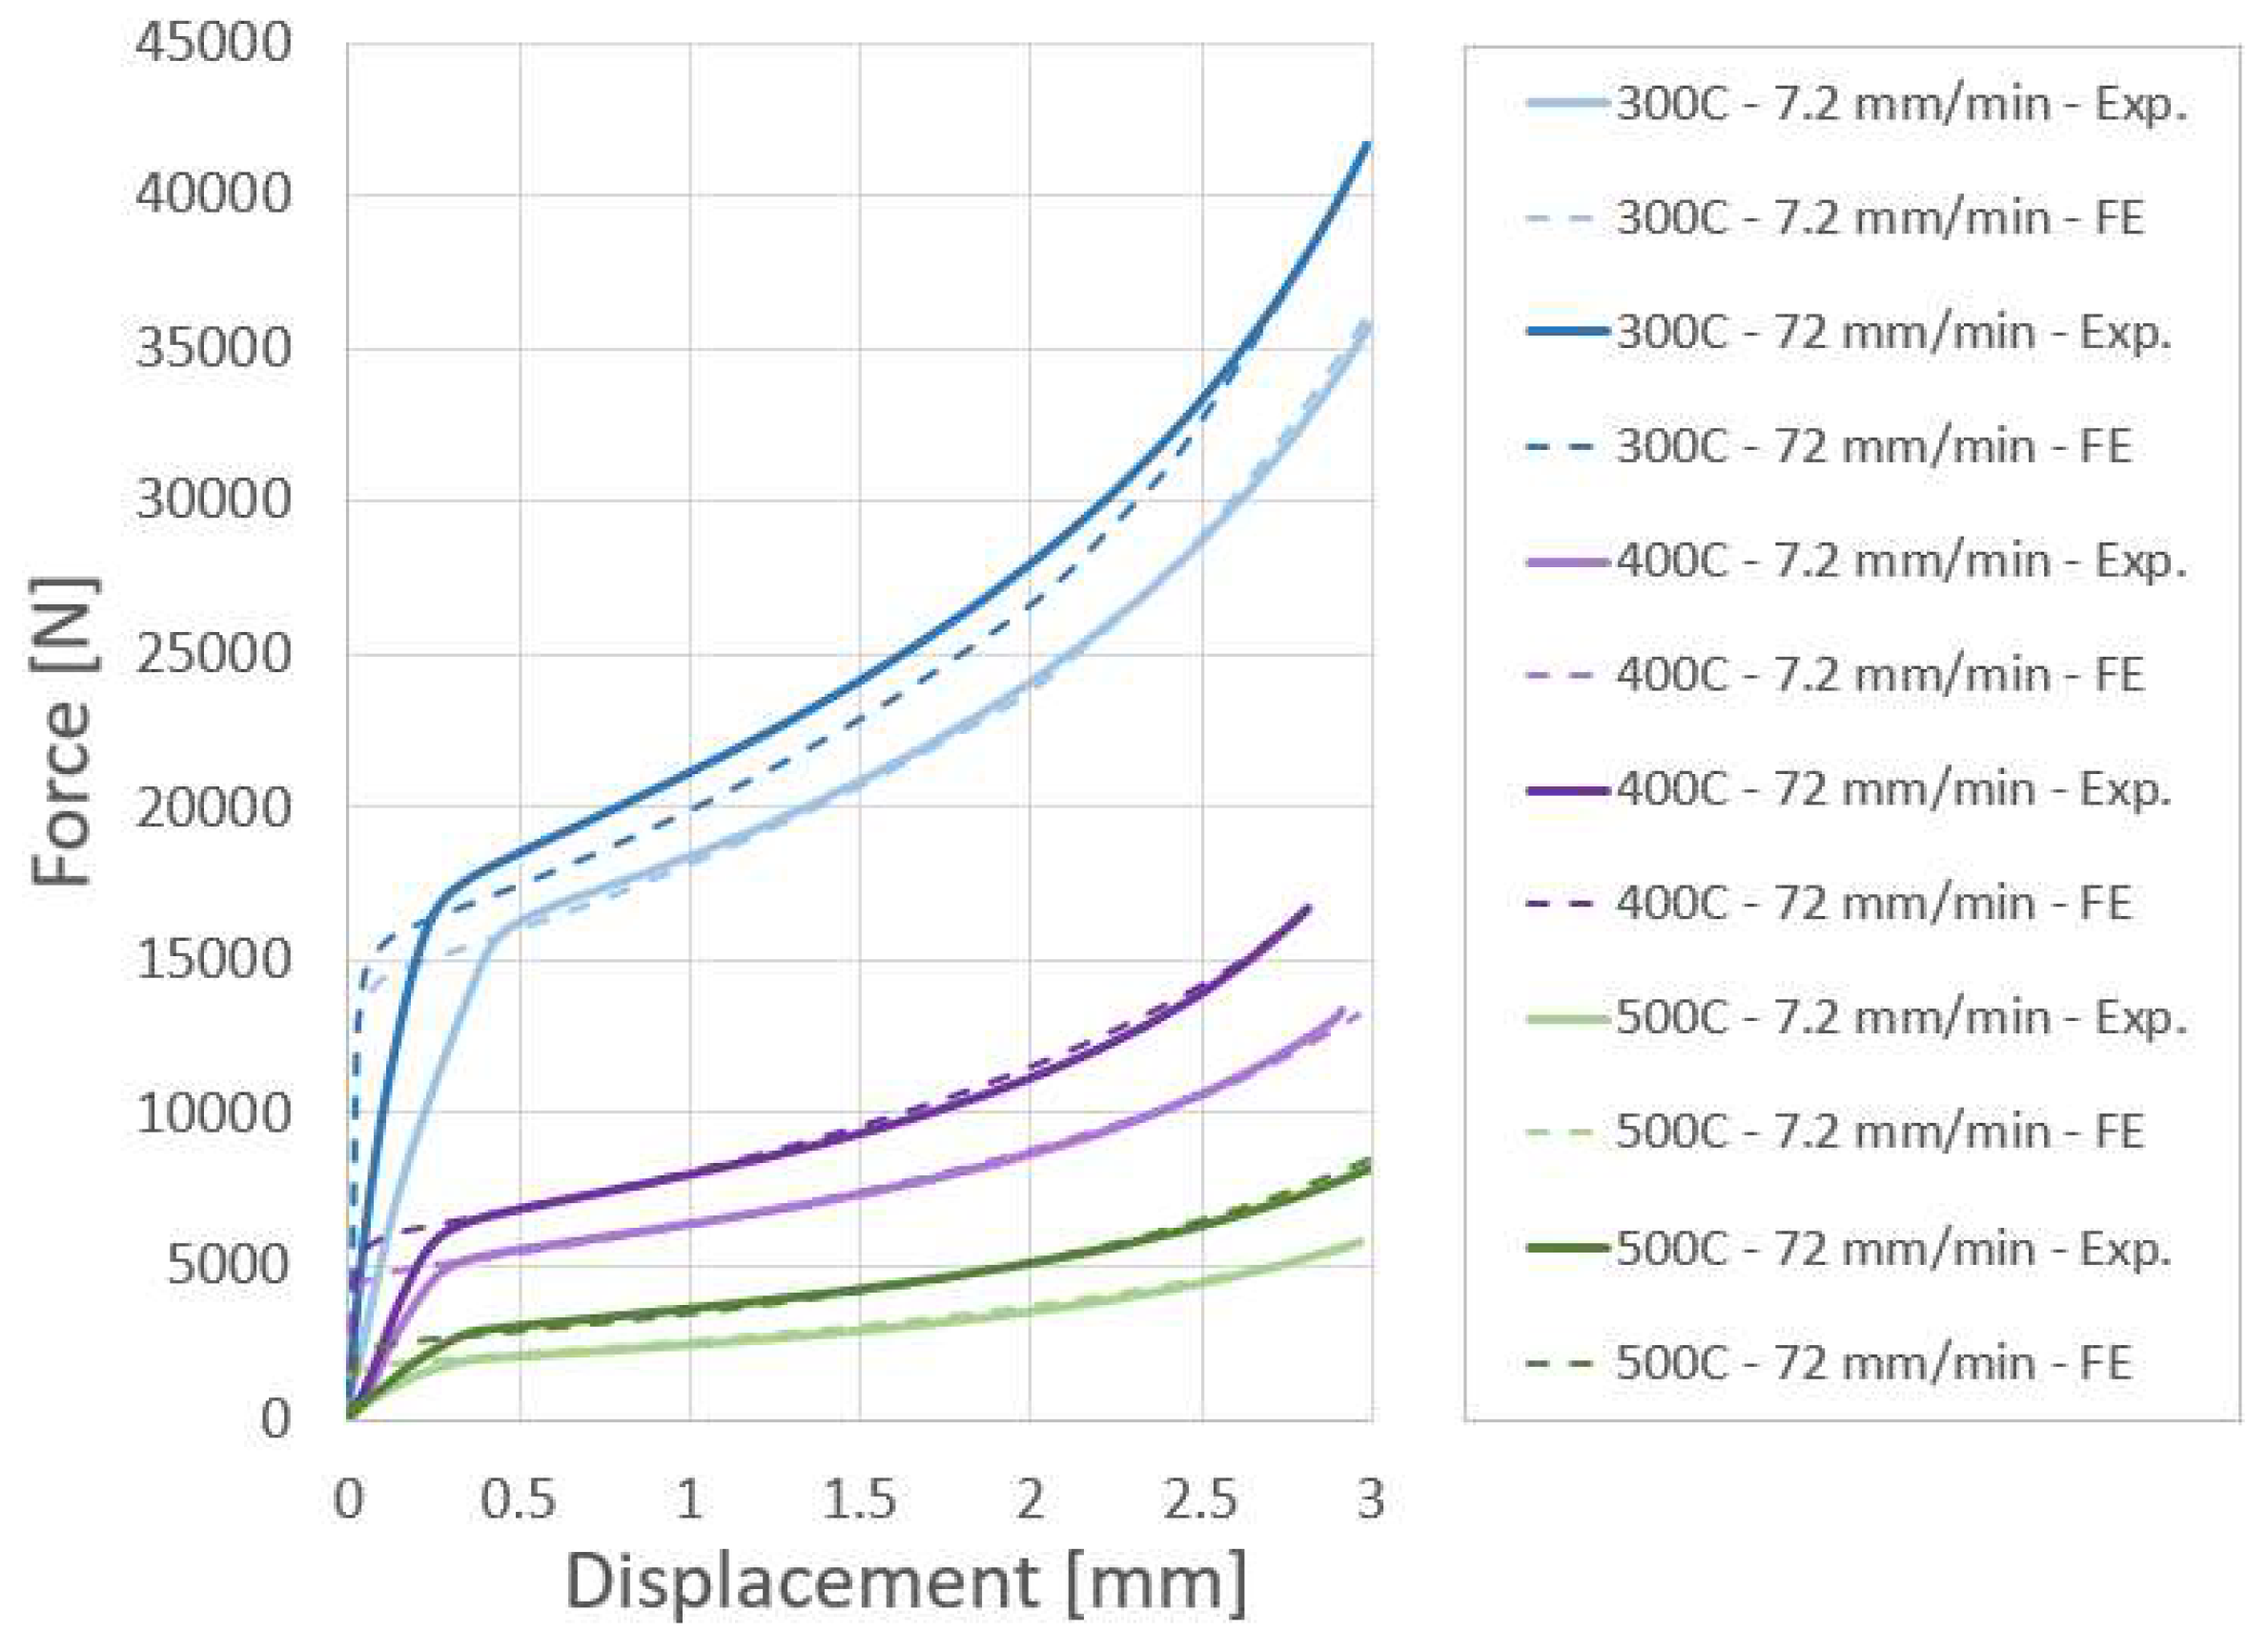
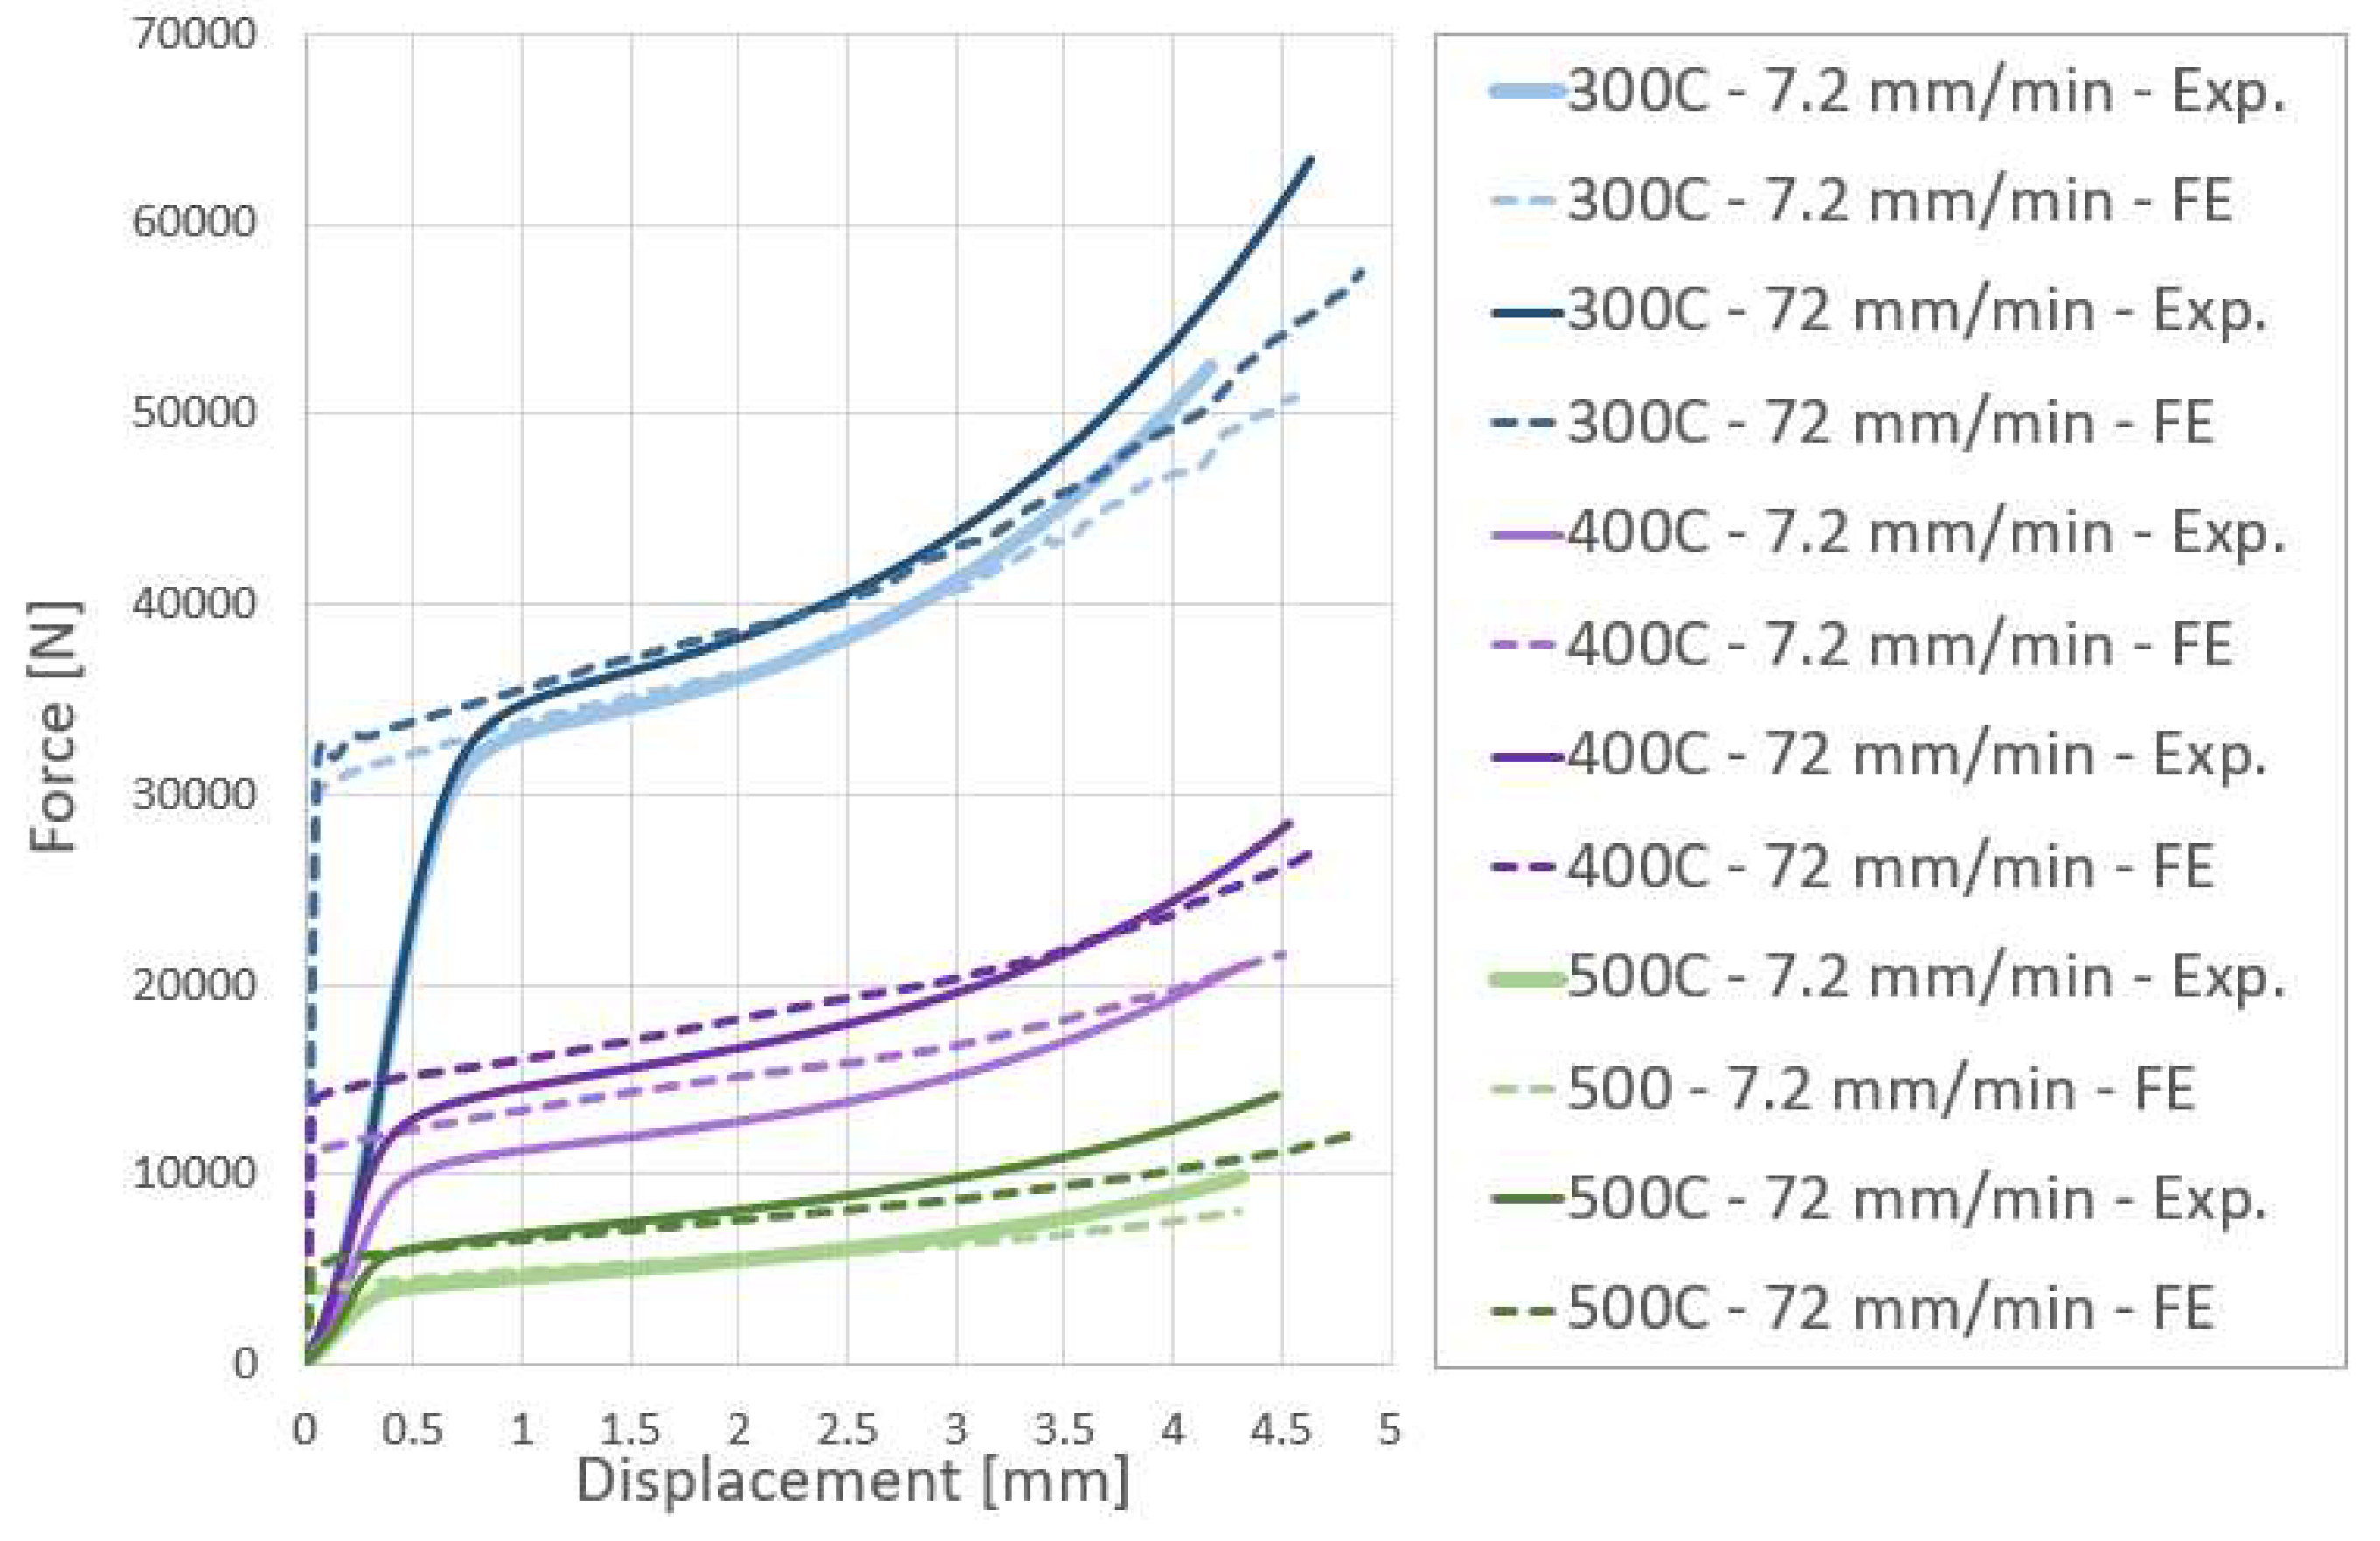
The force-displacement curves obtained from the numerical models are compared with the experimental results in
Figure 4.
As demonstrated in
Figure 4, there is a good agreement between the computed and experimentally measured load-displacement curves, for all temperatures and loading rates. Although it should be noted, that at the initial stage of the loading, it was difficult to accurately measure the displacement since no extensometer could be used due to the small size of the specimen. Alternative methods for measuring the displacement such as Digital Image Correlation (DIC) could also not be utilized due the fact that the viewing window in the furnace in not sufficiently large.
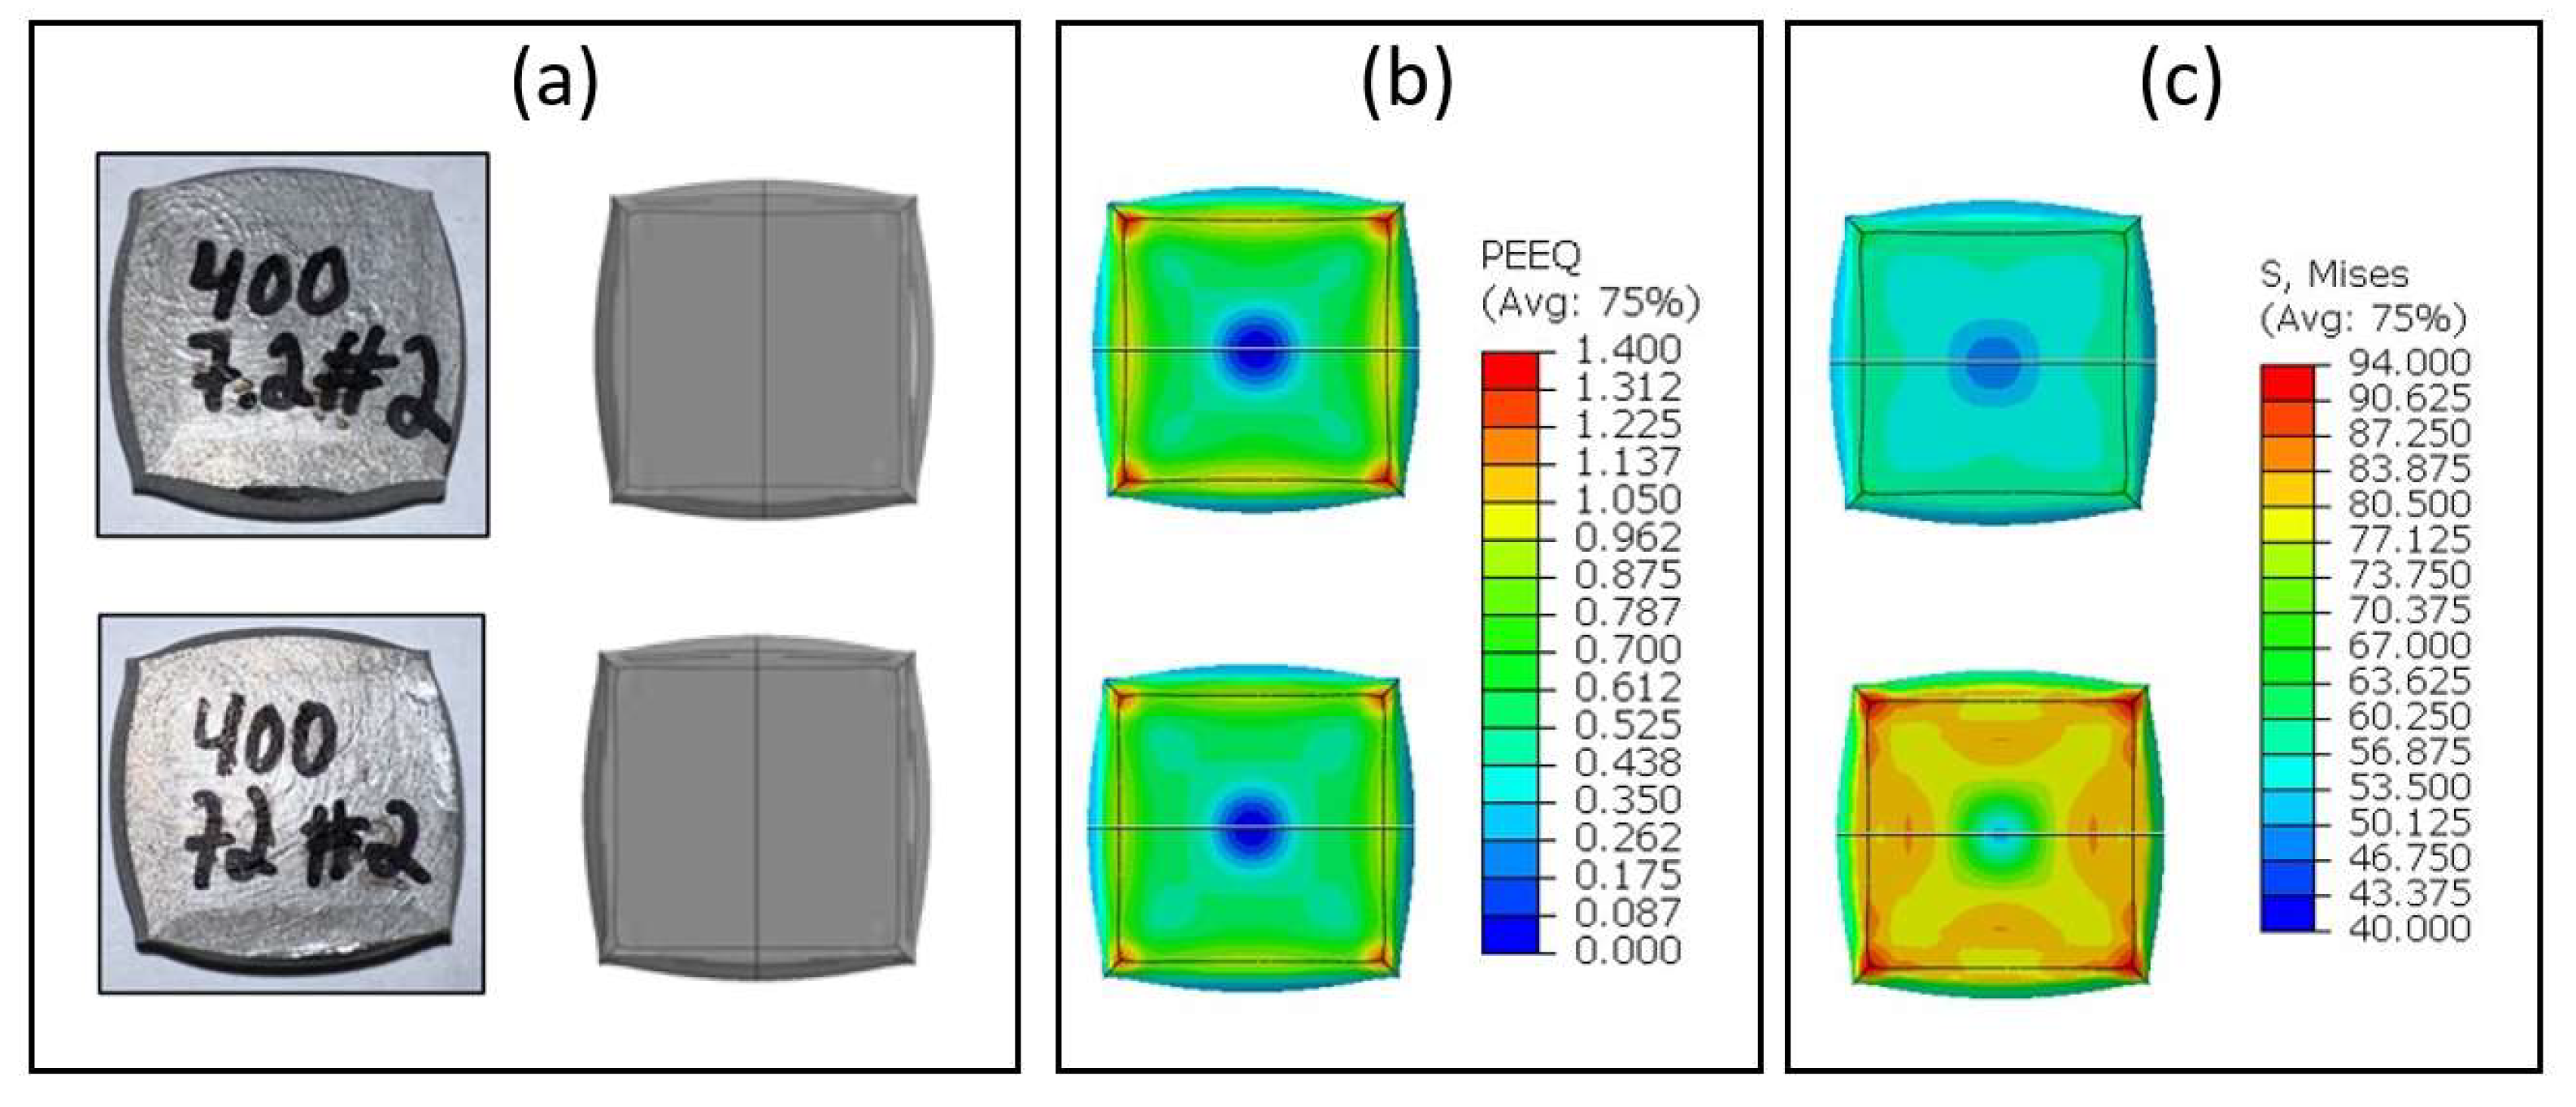
As a validation of the characterized flow stress, the computed and experimentally observed deformed configuration and dimensions of the cuboid specimens were compared. A representative example of the specimens compressed at 400ᵒC is presented in
Figure 5. One can observe, that the deformation contours obtained from the FE computations closely match those of the deformed specimens. In addition, it can be seen that there is no significant difference in equivalent plastic strain field but there is a significant difference in the equivalent stress. These results are not surprising due to the fact that the experiments were conducted so that the final reduction in all tests would be similar. Therefore, a similar plastic strain is expected. The stress response, however, is significantly affected by the loading rate.
3.2. Results of Bonding Experiments
Following the characterization of the flow stress, the beam specimen pairs were bonded by hot compression. The experimental dataset consisted of 36 experiments in total, 6 tests for each combination of experimental parameters (temperature and loading rate). The averaged experimental force-displacement curves are compared to the numerically obtained curves in
Figure 6. The previously characterized flow stress was incorporated into the numerical models representing the beam pairs hot compression tests.
It can be observed in
Figure 6, that the computational results follow the trends of the experimental load-displacement curves: decreasing temperatures result in an increased load, and, at the same temperature, higher loading rates result in higher loads as well.
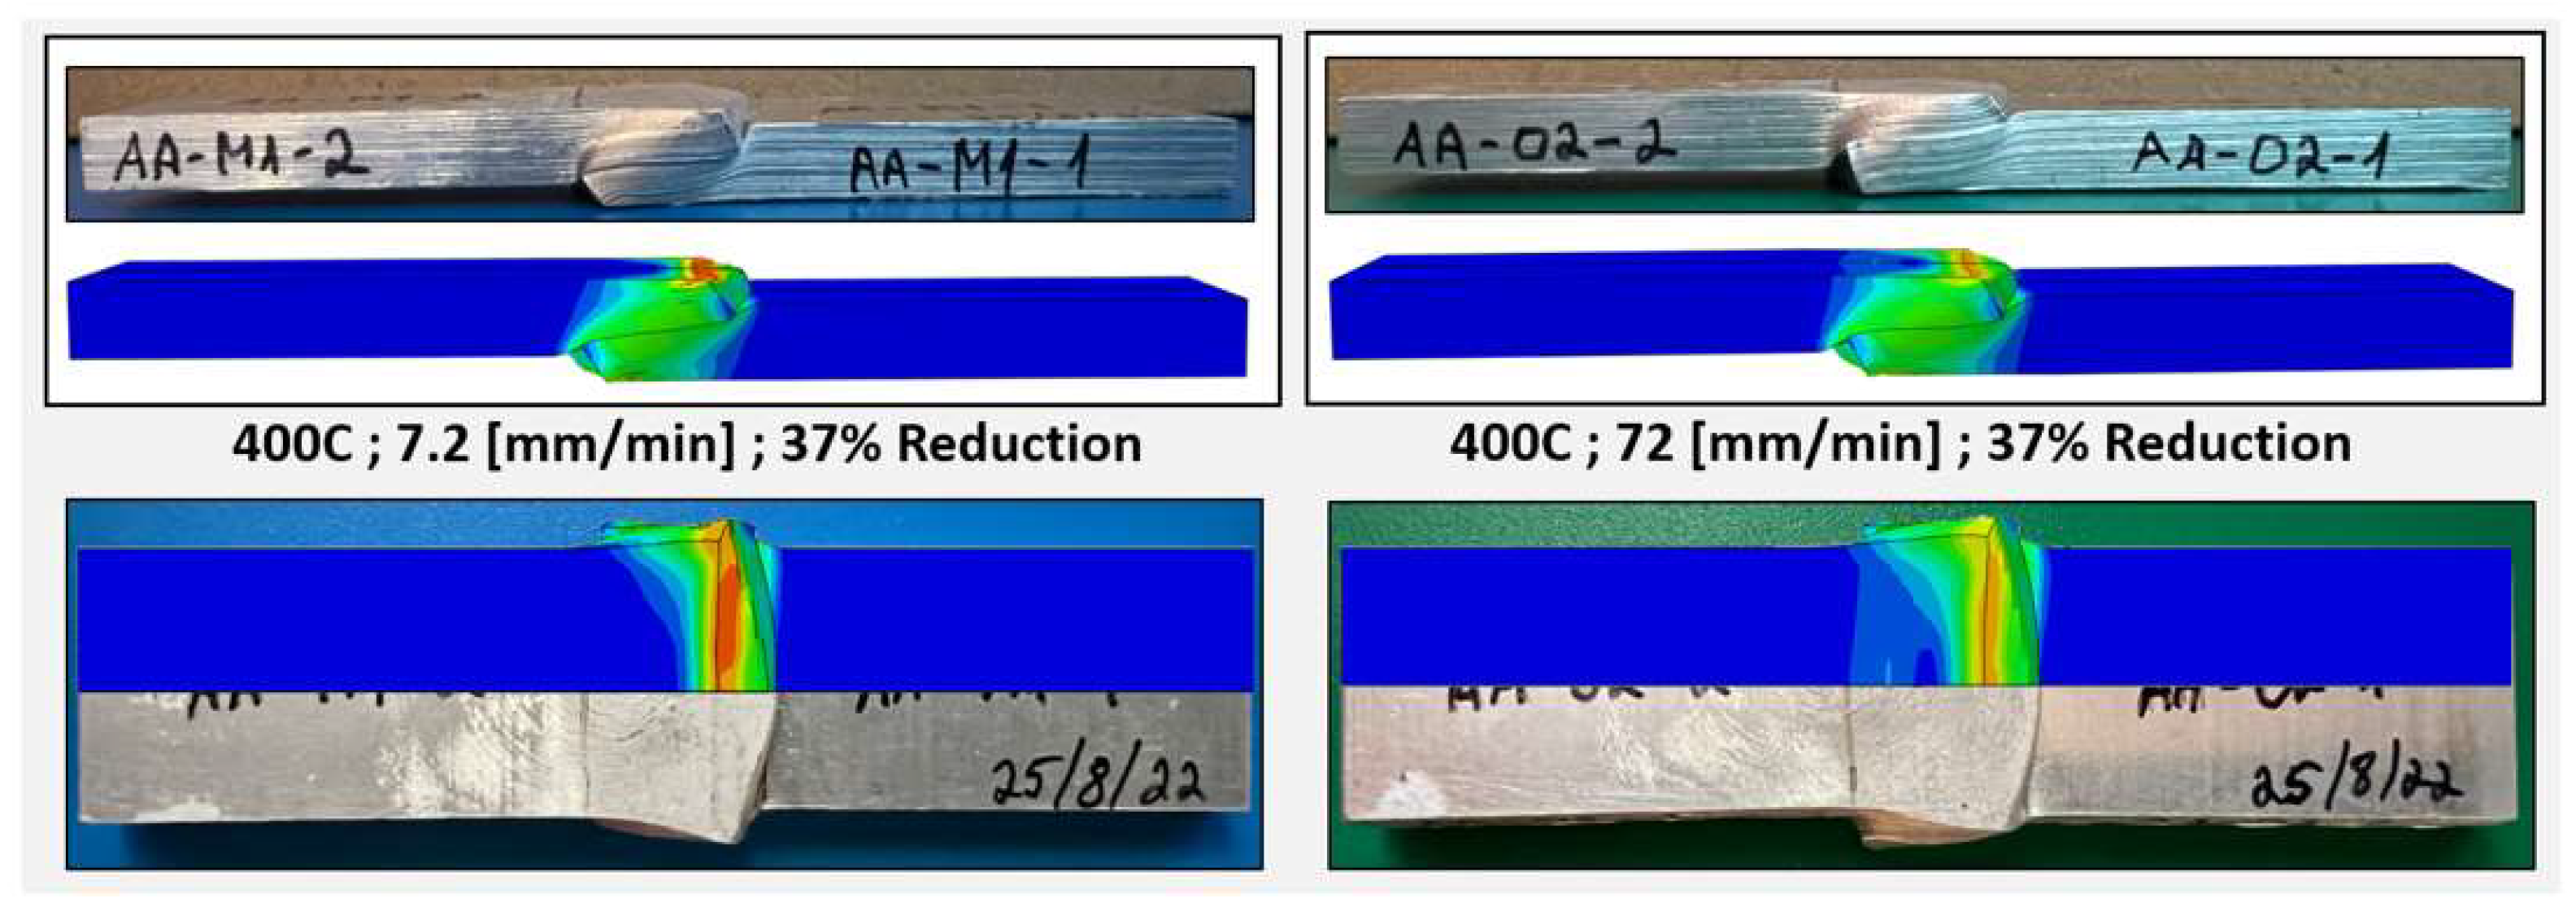
As before, part of the validation process of the FE models relies on comparing the deformed configuration and dimensions to those obtained experimentally. This is shown in
Figure 7, from the specimen's top and front views. A good agreement may be observed between the computed and observed deformed configuration.
Using the finite element models, the bonding process can be investigated. As an example, the evolution of the specimen's deformed shape is shown in
Figure 8, during hot compression at
and a loading rate of 7.2 [mm/min].
3.3. Results of the Debonding Experiments
As previously mentioned, the bonding stage by compression was followed by tensile debonding experiments aimed to quantify the interface bonding strength and the true size of the bonded portion of the interface. In
Figure 2, an example of the middle section machined from the compressed specimen is shown. This part serves as the specimen for the tensile test.
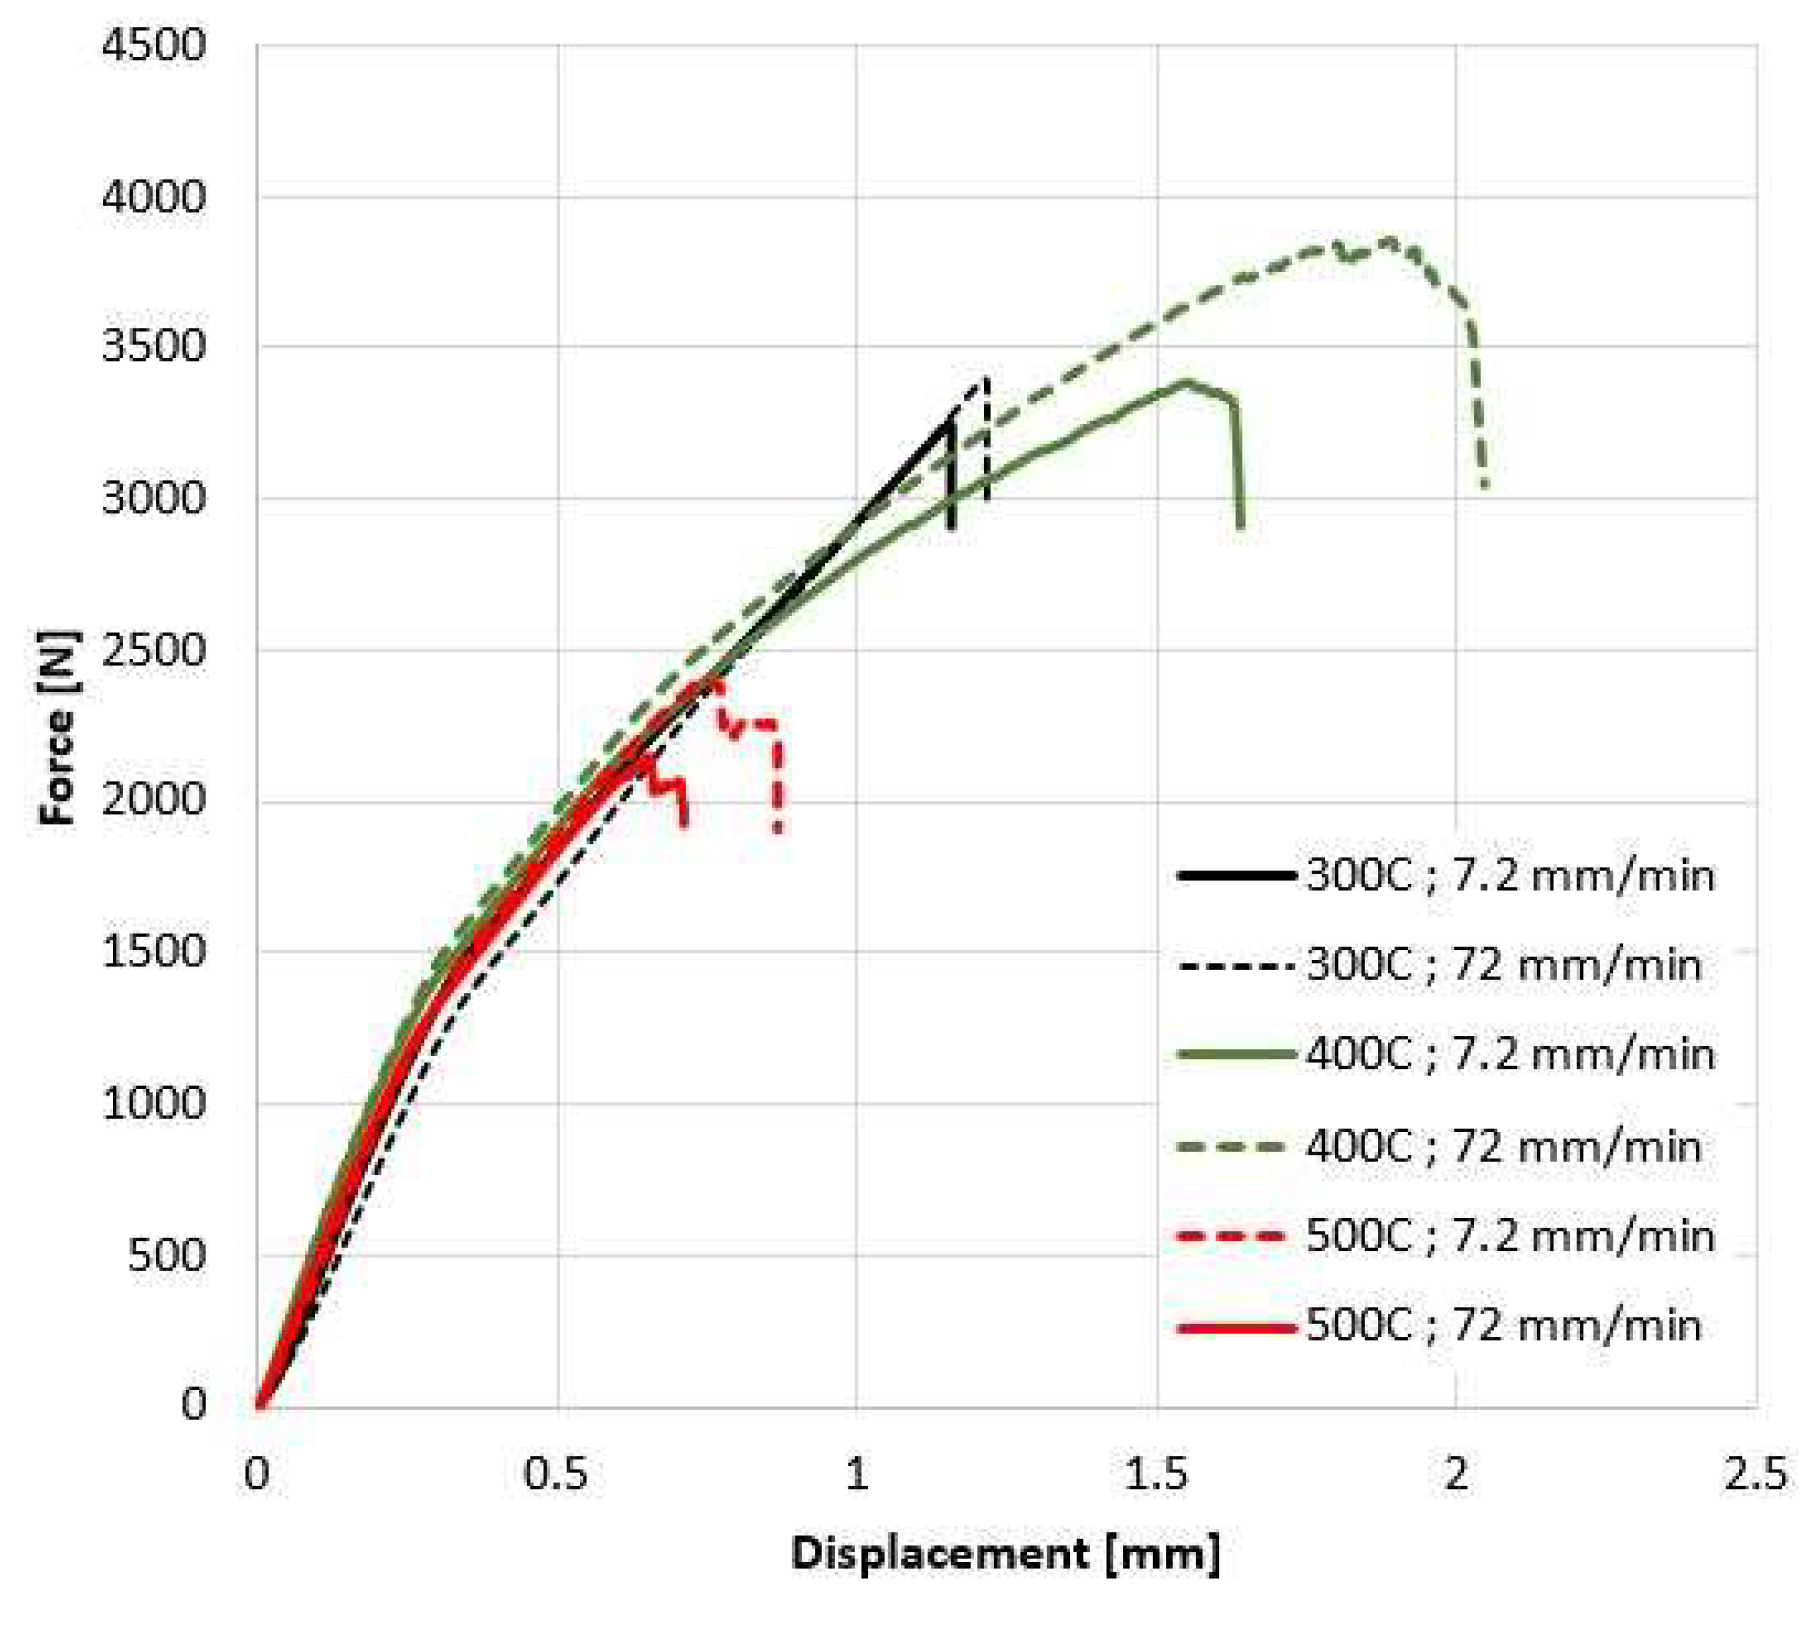
The tensile tests were conducted at room temperature and at constant loading rate of 1 [mm/min]. A representative example of the obtained force-displacement curve is presented in
Figure 9.
The average debonding force
for the bond created at each temperature and loading rate is given in
Table 2.
Using the average force at debonding (
) from the tensile tests, a simplified initial approximation of the bonding shear strength was calculated by:
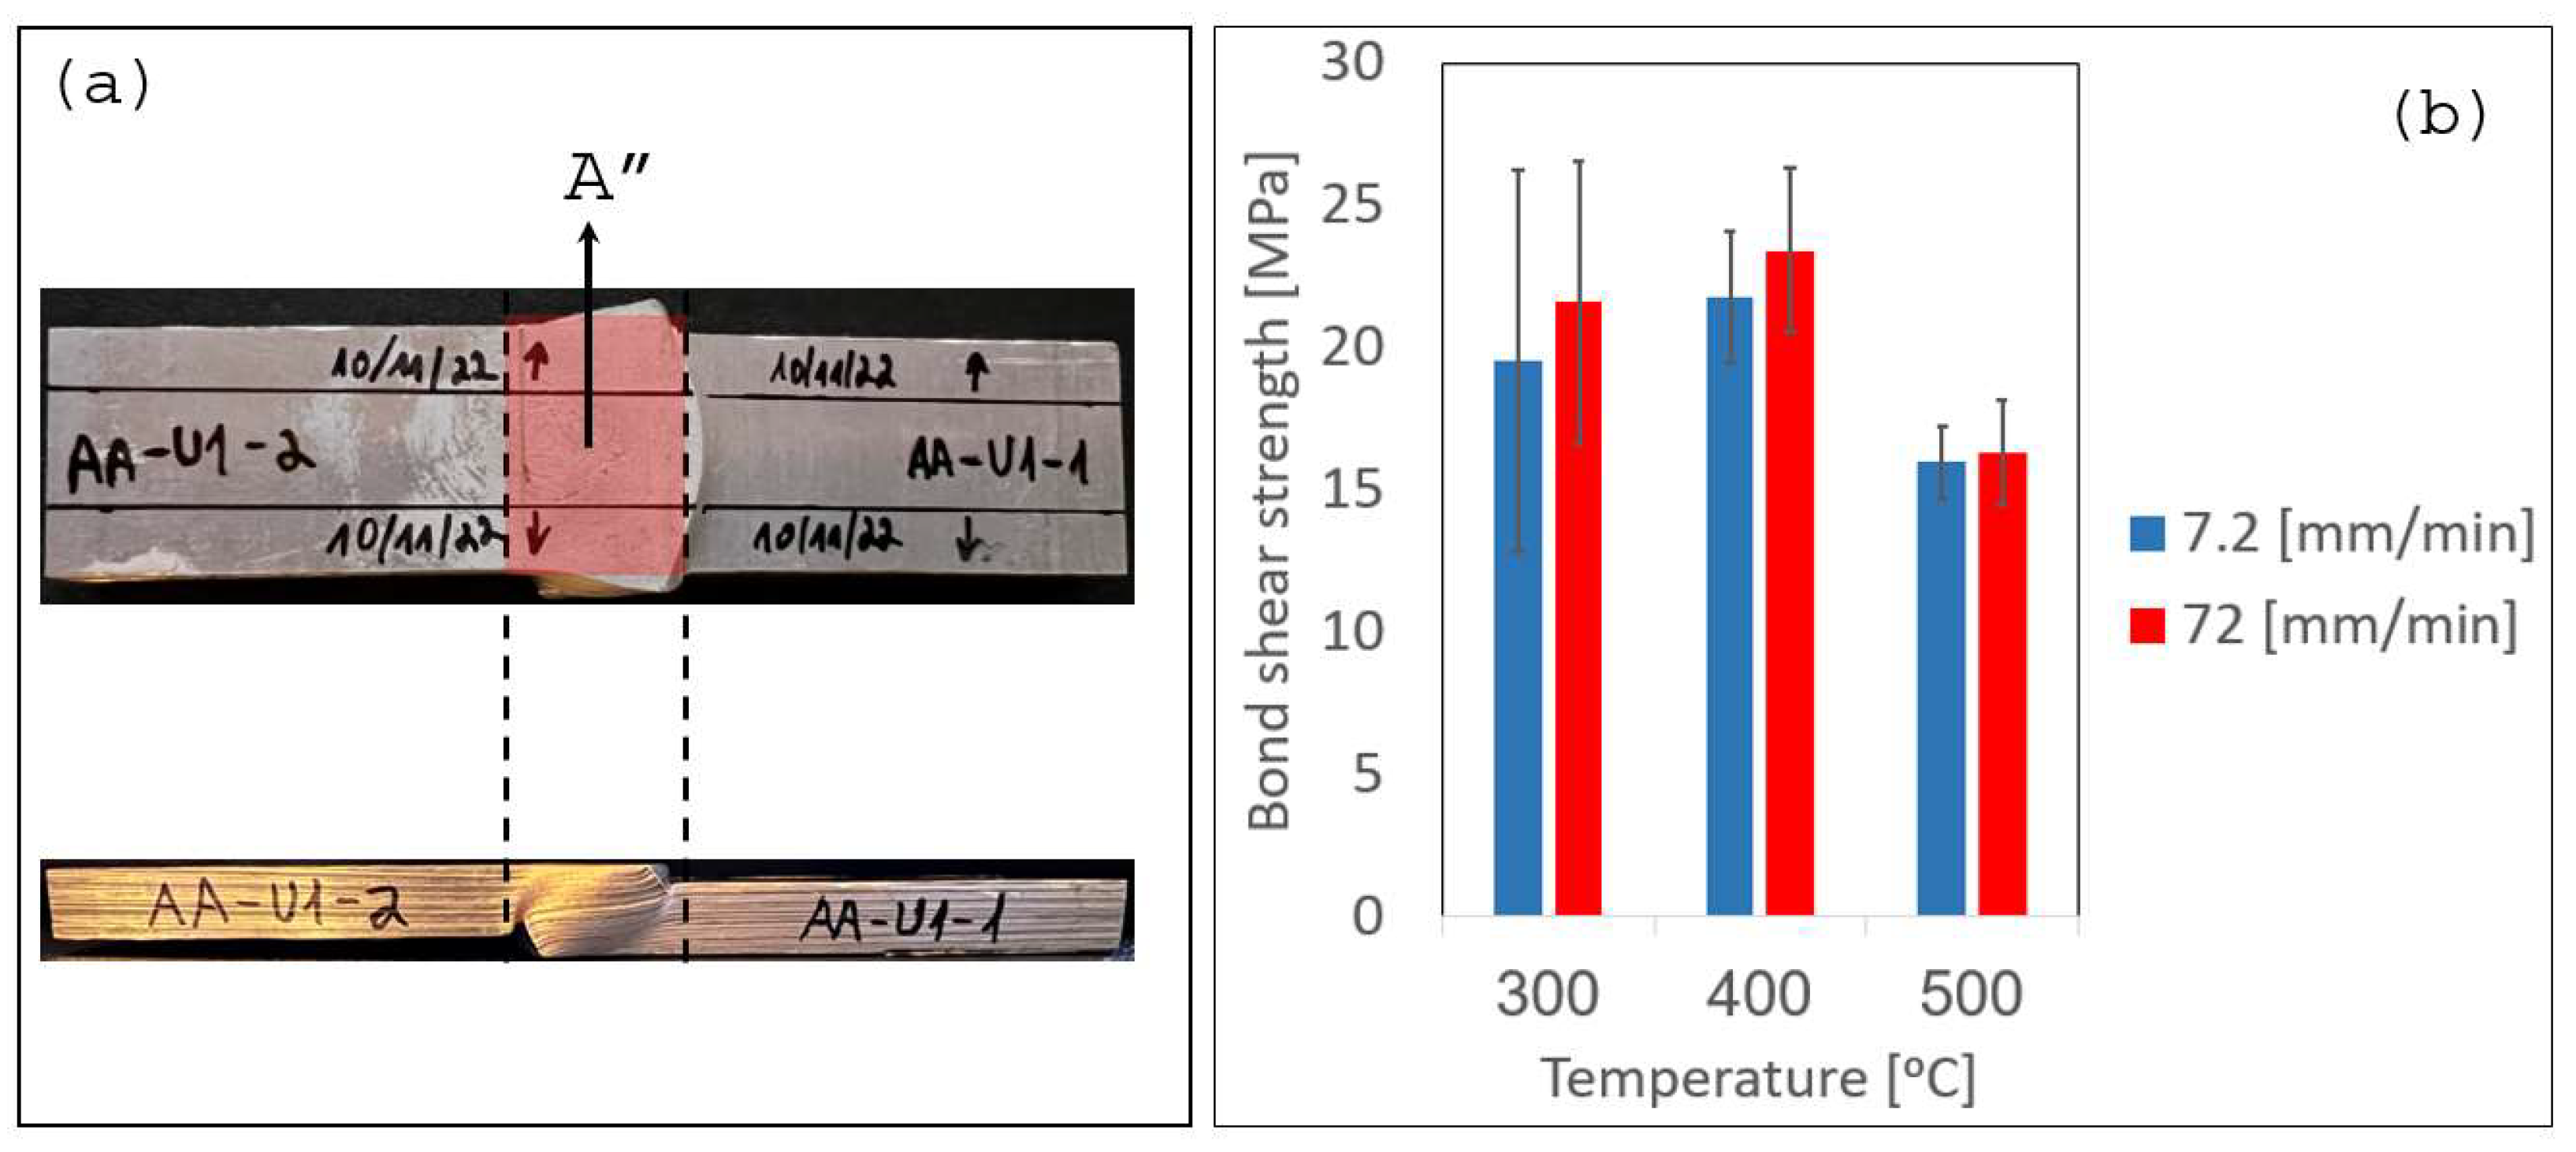
Where A" is the approximate overlapping area measured after the hot compression tests. The preliminary results in
Figure 10 were made under the assumption, that the entire overlapping area A" was bonded, and also – that the bonding strength is uniform over A". The bonding strength is therefore averaged over A".
Figure 10 shows the average bond shear strength for each temperature and loading rate combination of the compression tests where the bond was created. In addition, the range of bonding shear strength values from all the experiments is indicated by the error bars. It is demonstrated that in all cases the bond strength increases with the loading rate. The influence of the loading rate is more apparent at
and
. It can also be seen that at
, a large range of calculated bond strength is obtained. This can be attributed to the formation of a more inhomogeneous bond interface. The highest bonding strength was obtained at
, which indicates the within the examined range, the diffusion conditions are optimal at that temperature. The bond strength obtained at
is relatively low. It is known that the oxidation layer at the surface grows thicker with temperature increase [
10]. The decrease in bond strength at
is assumed to be a result of the need to break a thicker layer in order to enable contact between the base metals [
12]. The results also demonstrate that an increase in loading rate, although limiting the duration at which the interface is subjected to the high stress, strain and temperature still lead to a bond strength comparable and even slightly higher than the bond obtained a lower loading rate. This finding is attributed to the increase in flow stress values at the higher strain rates.
4. Discussion
The bond shear strength computed by (5) and shown in
Figure 10, assumes that the whole interface area underwent diffusion bonding. It should be noted however, that even if diffusion takes place across the entire interface, the bond strength is not expected to be similar at all temperatures. Although the hot compression process itself takes a few seconds, the specimen pairs are heated in the furnace to the target temperature for about 20 minutes. As a result of the heating, changes in the mechanical properties of the material will occur, and these changes will influence the measured bond strength.
Table 3 shows the ultimate stress values reported in [
25] for Al6061 after heat treatment within 300-500ᵒC (as in the current study).
Assuming that the maximal shear stress value is
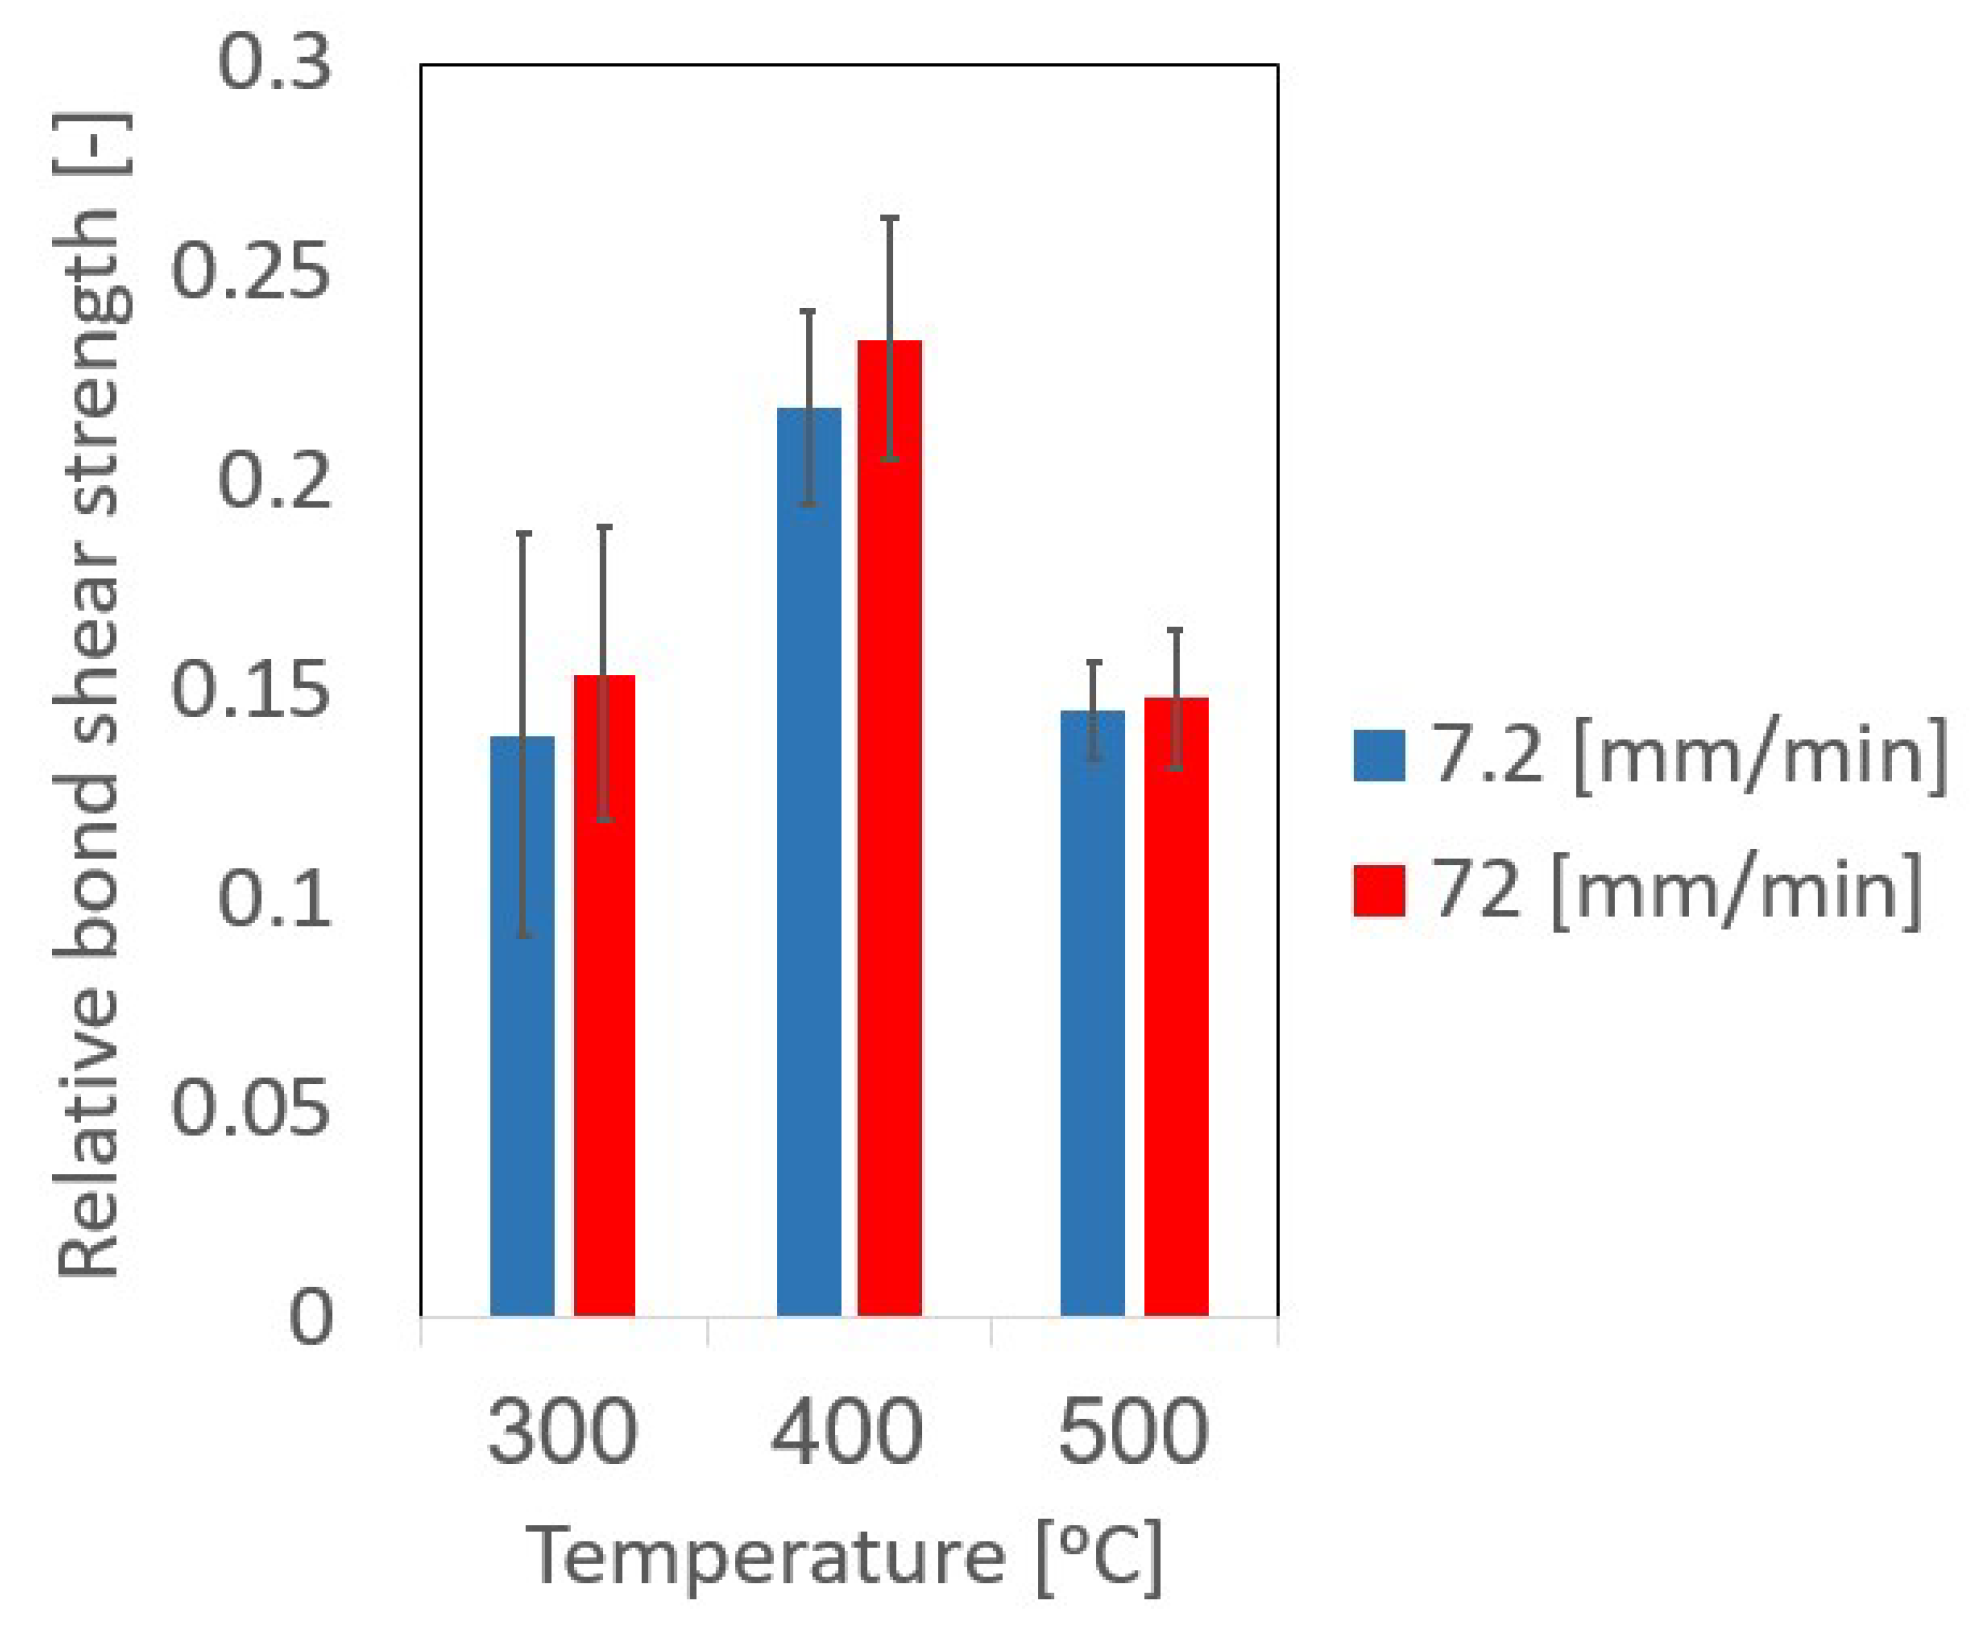
, it is possible to estimate the relative bonding shear strength with respect to the expected changes in material strength due to the heat treatment. This relative bonding shear strength is presented in
Figure 11.
It can be seen from
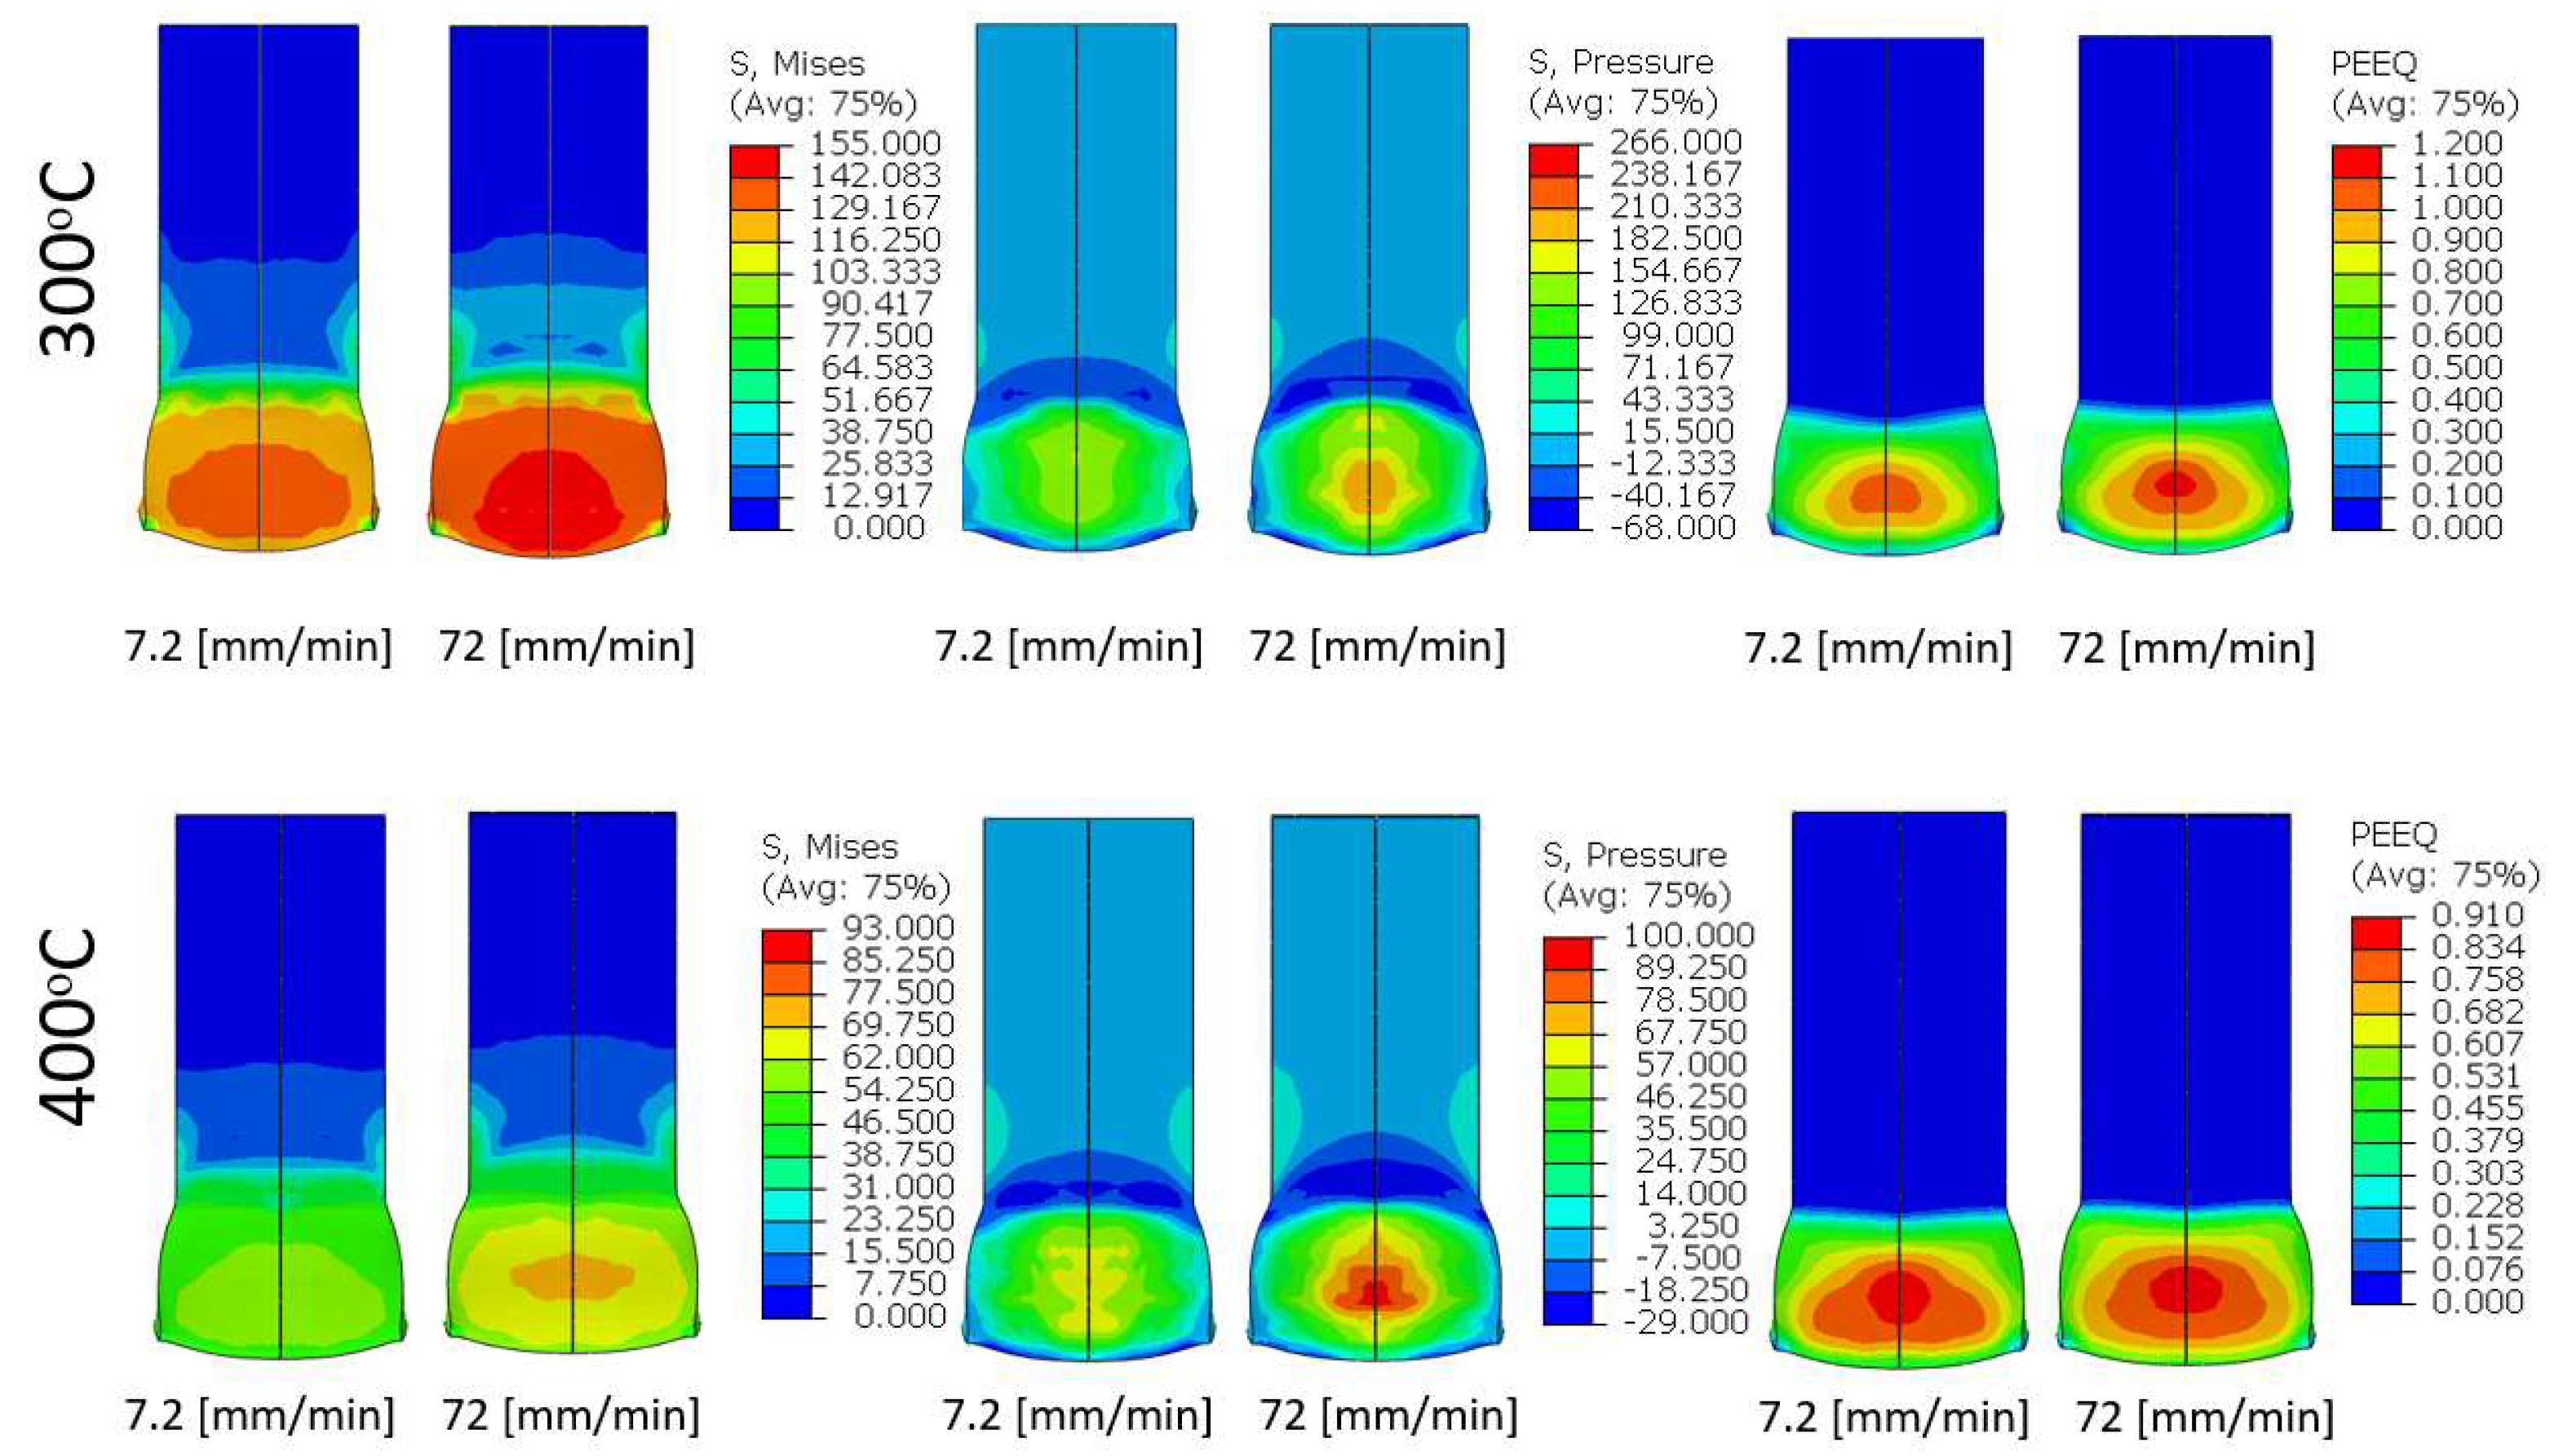
Figure 11, that from a relative viewpoint with respect to the strength of the Al6061 with different thermo-mechanical histories, the influence of the temperature on the resulting bond strength is even more pronounce. Nevertheless, it is clear that the averaged values computed by (5), which are commonly reported in the literature, cannot represent the true interface bond strength. To gain more insight with regard to the bonding process, the parameters which are known to govern the bond formation were computed using the finite element models of the bonding experiments. In
Figure 12, the equivalent stress, hydrostatic stress component (pressure) and the equivalent plastic strain distribution across the interface are shown at the final stage of the hot compression bonding experiments.
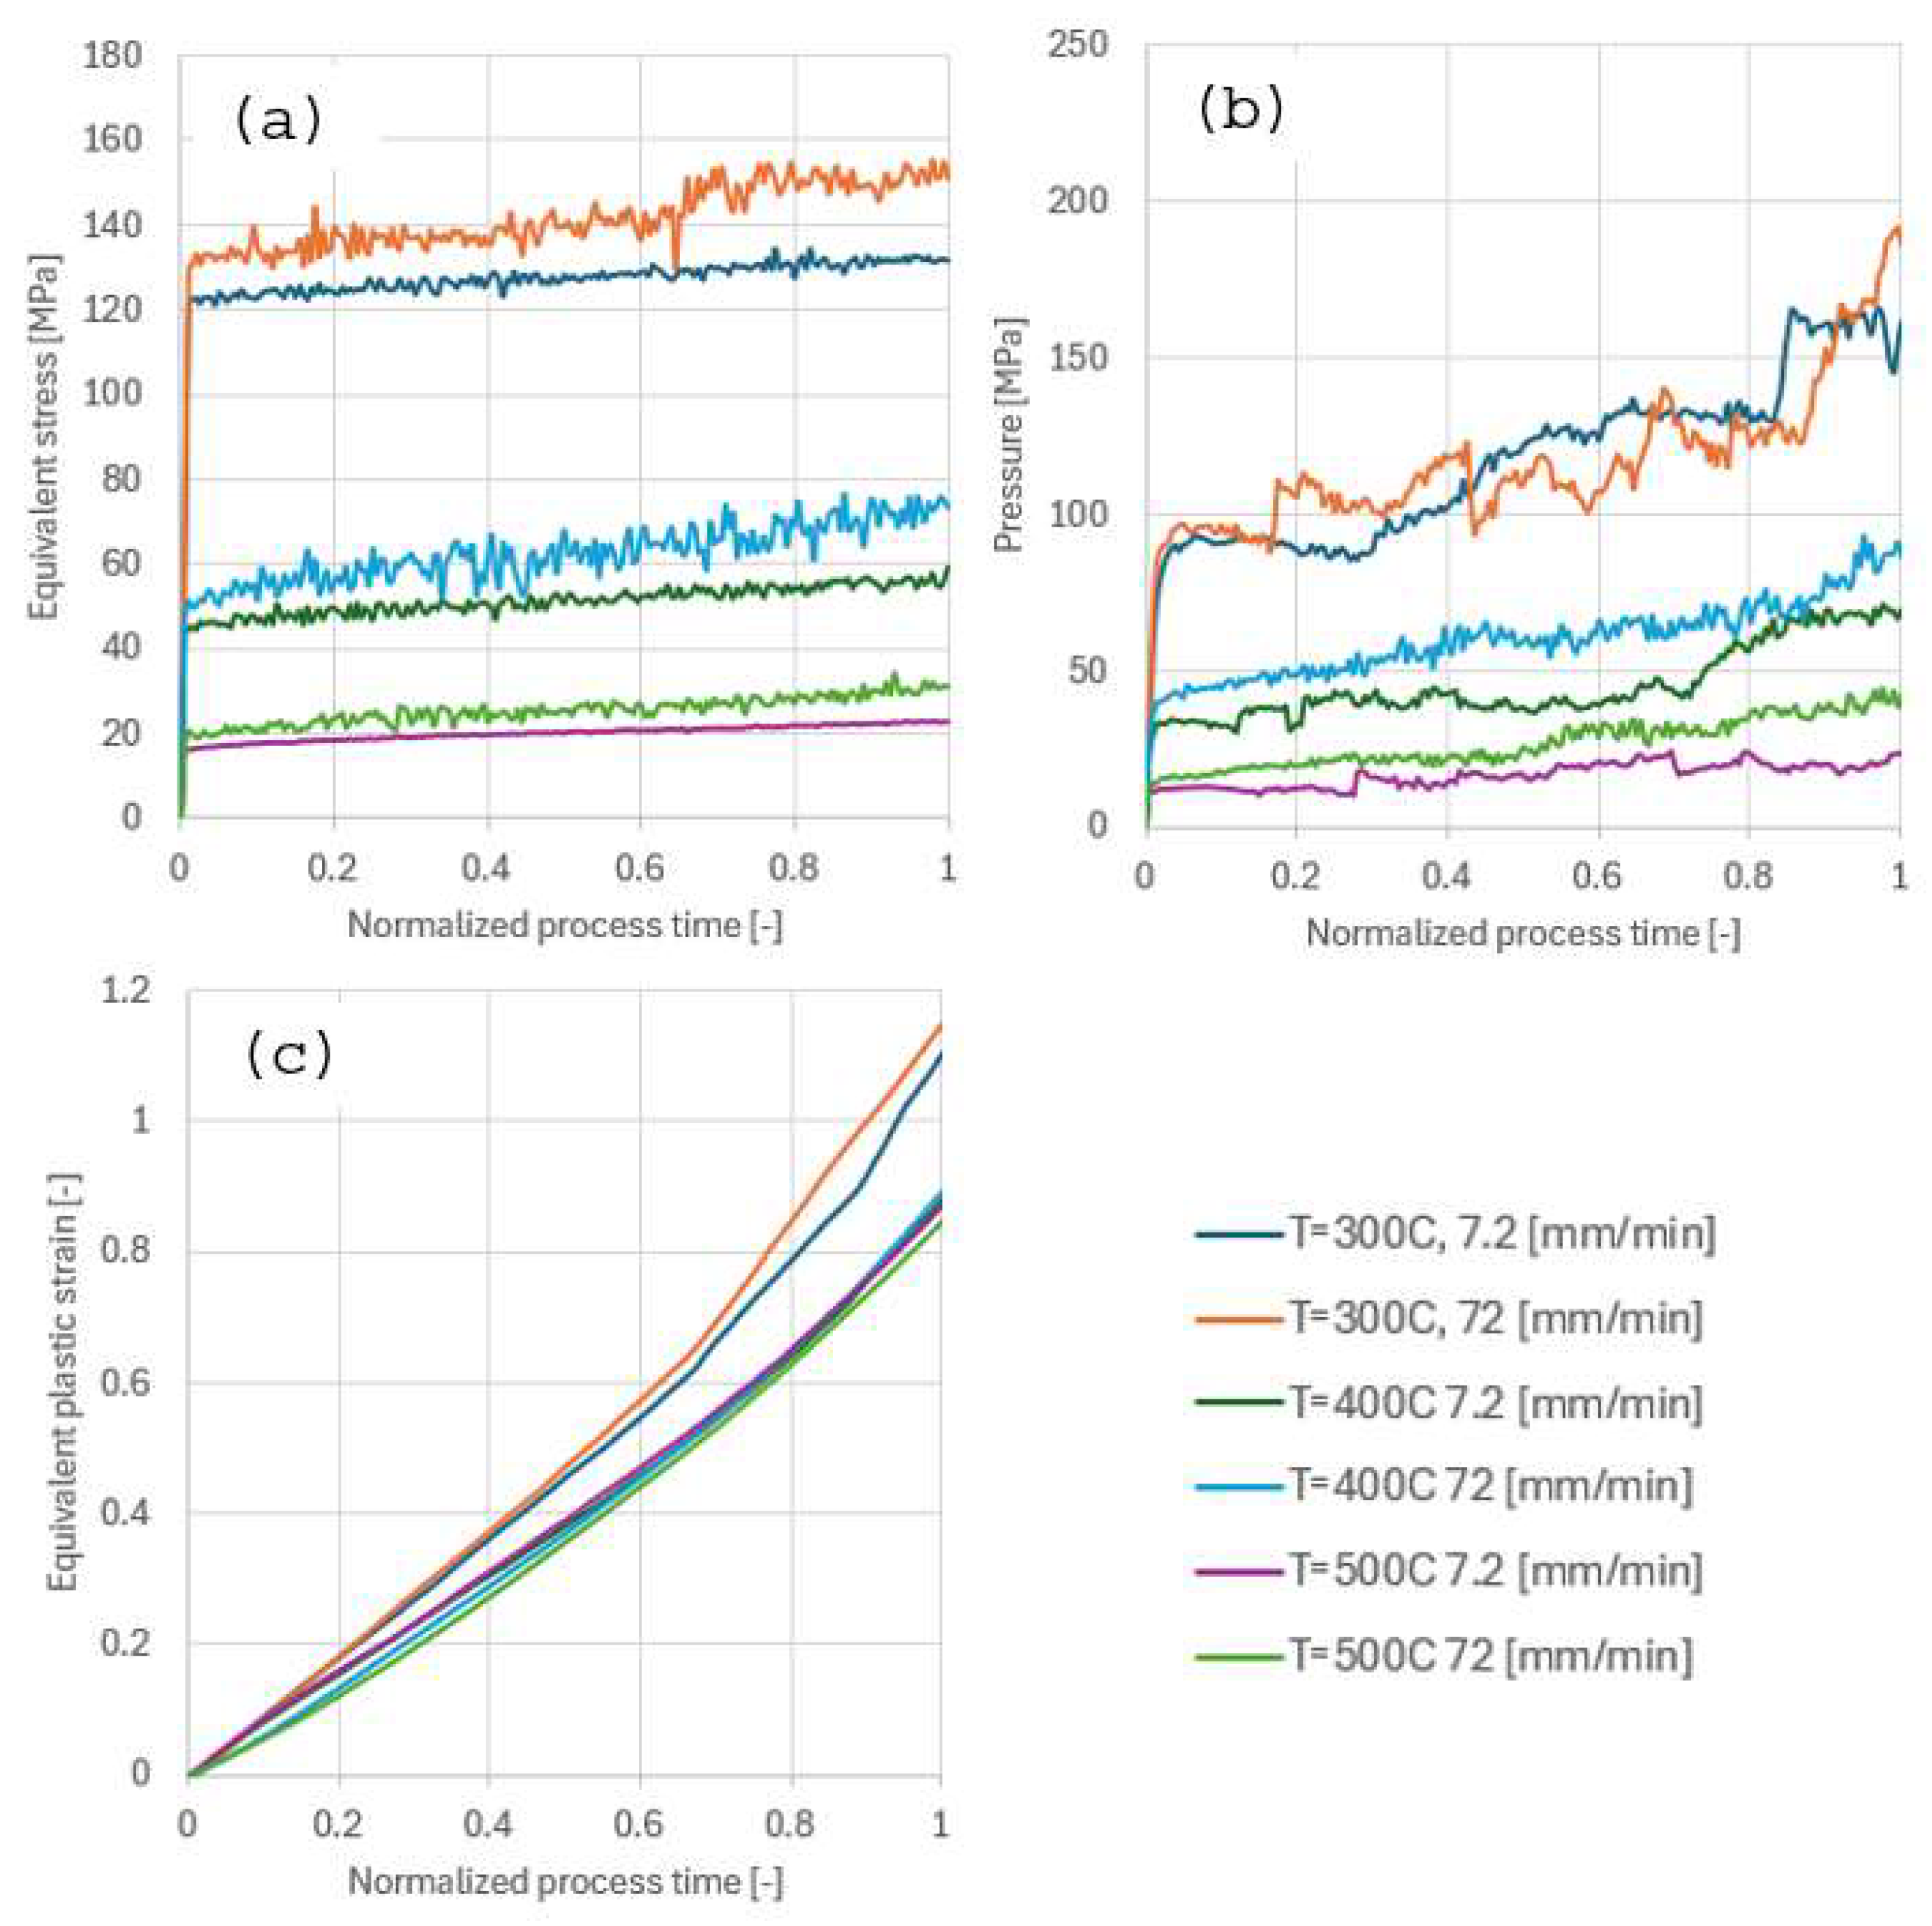
The computations show that in all cases, a higher stress value (equivalent or pressure) develops at the higher loading rate. It is also evident, that the highest stress values develop at the center of the interface surface. With regard to the change in temperature due to dissipation of plastic work into heat, the local temperature increase was only on the order of several degrees for all bonding conditions. As a consequence, its seems that the local heat generation due to plastic dissipation has not significant influence on the bonding mechanism for the conditions examined in the current study. The computed time dependent values of the equivalent stress, pressure and equivalent plastic strain, are presented in
Figure 13 for each bonding condition, as a function of normalized process time, at the center of the bonded interface.
As seen in
Figure 13, the main difference in mechanical fields between the different temperatures and loading rates is the stress value. Nevertheless, most bonding criteria do not correlate between local bonding and local equivalent stress or any given single stress component. From a micromechanical perspective, following initial deformation of the surface asperities, closure of any voids remaining at the interface is governed by local stress triaxiality. Stress triaxiality is the ratio between the pressure component of the Cauchy stress tensor and the equivalent stress and has long been associated with void closure or growth mechanisms in ductile failure of metals [
26,
27]. As a result, higher stress values at the interface are not directly correlated to a stronger bond formation. Furthermore, the plastic strain and temperature also play a part in facilitating the diffusion mechanism [
11]. As discussed in the introduction, one of the leading criteria for bonding in hot forming processes is the J criterion given in equation (1). The computational models of the bonding process were used to map the value of J across the interface.
For calculating J at each integration point on the interface surface, the integral form of (1) was converted into a discrete form:
Values of
and
[kJ/mol] (for 300,400,500ᵒC, respectively), are similar to the values used by the authors in a previous study on Al6061 bonding [
10]. In
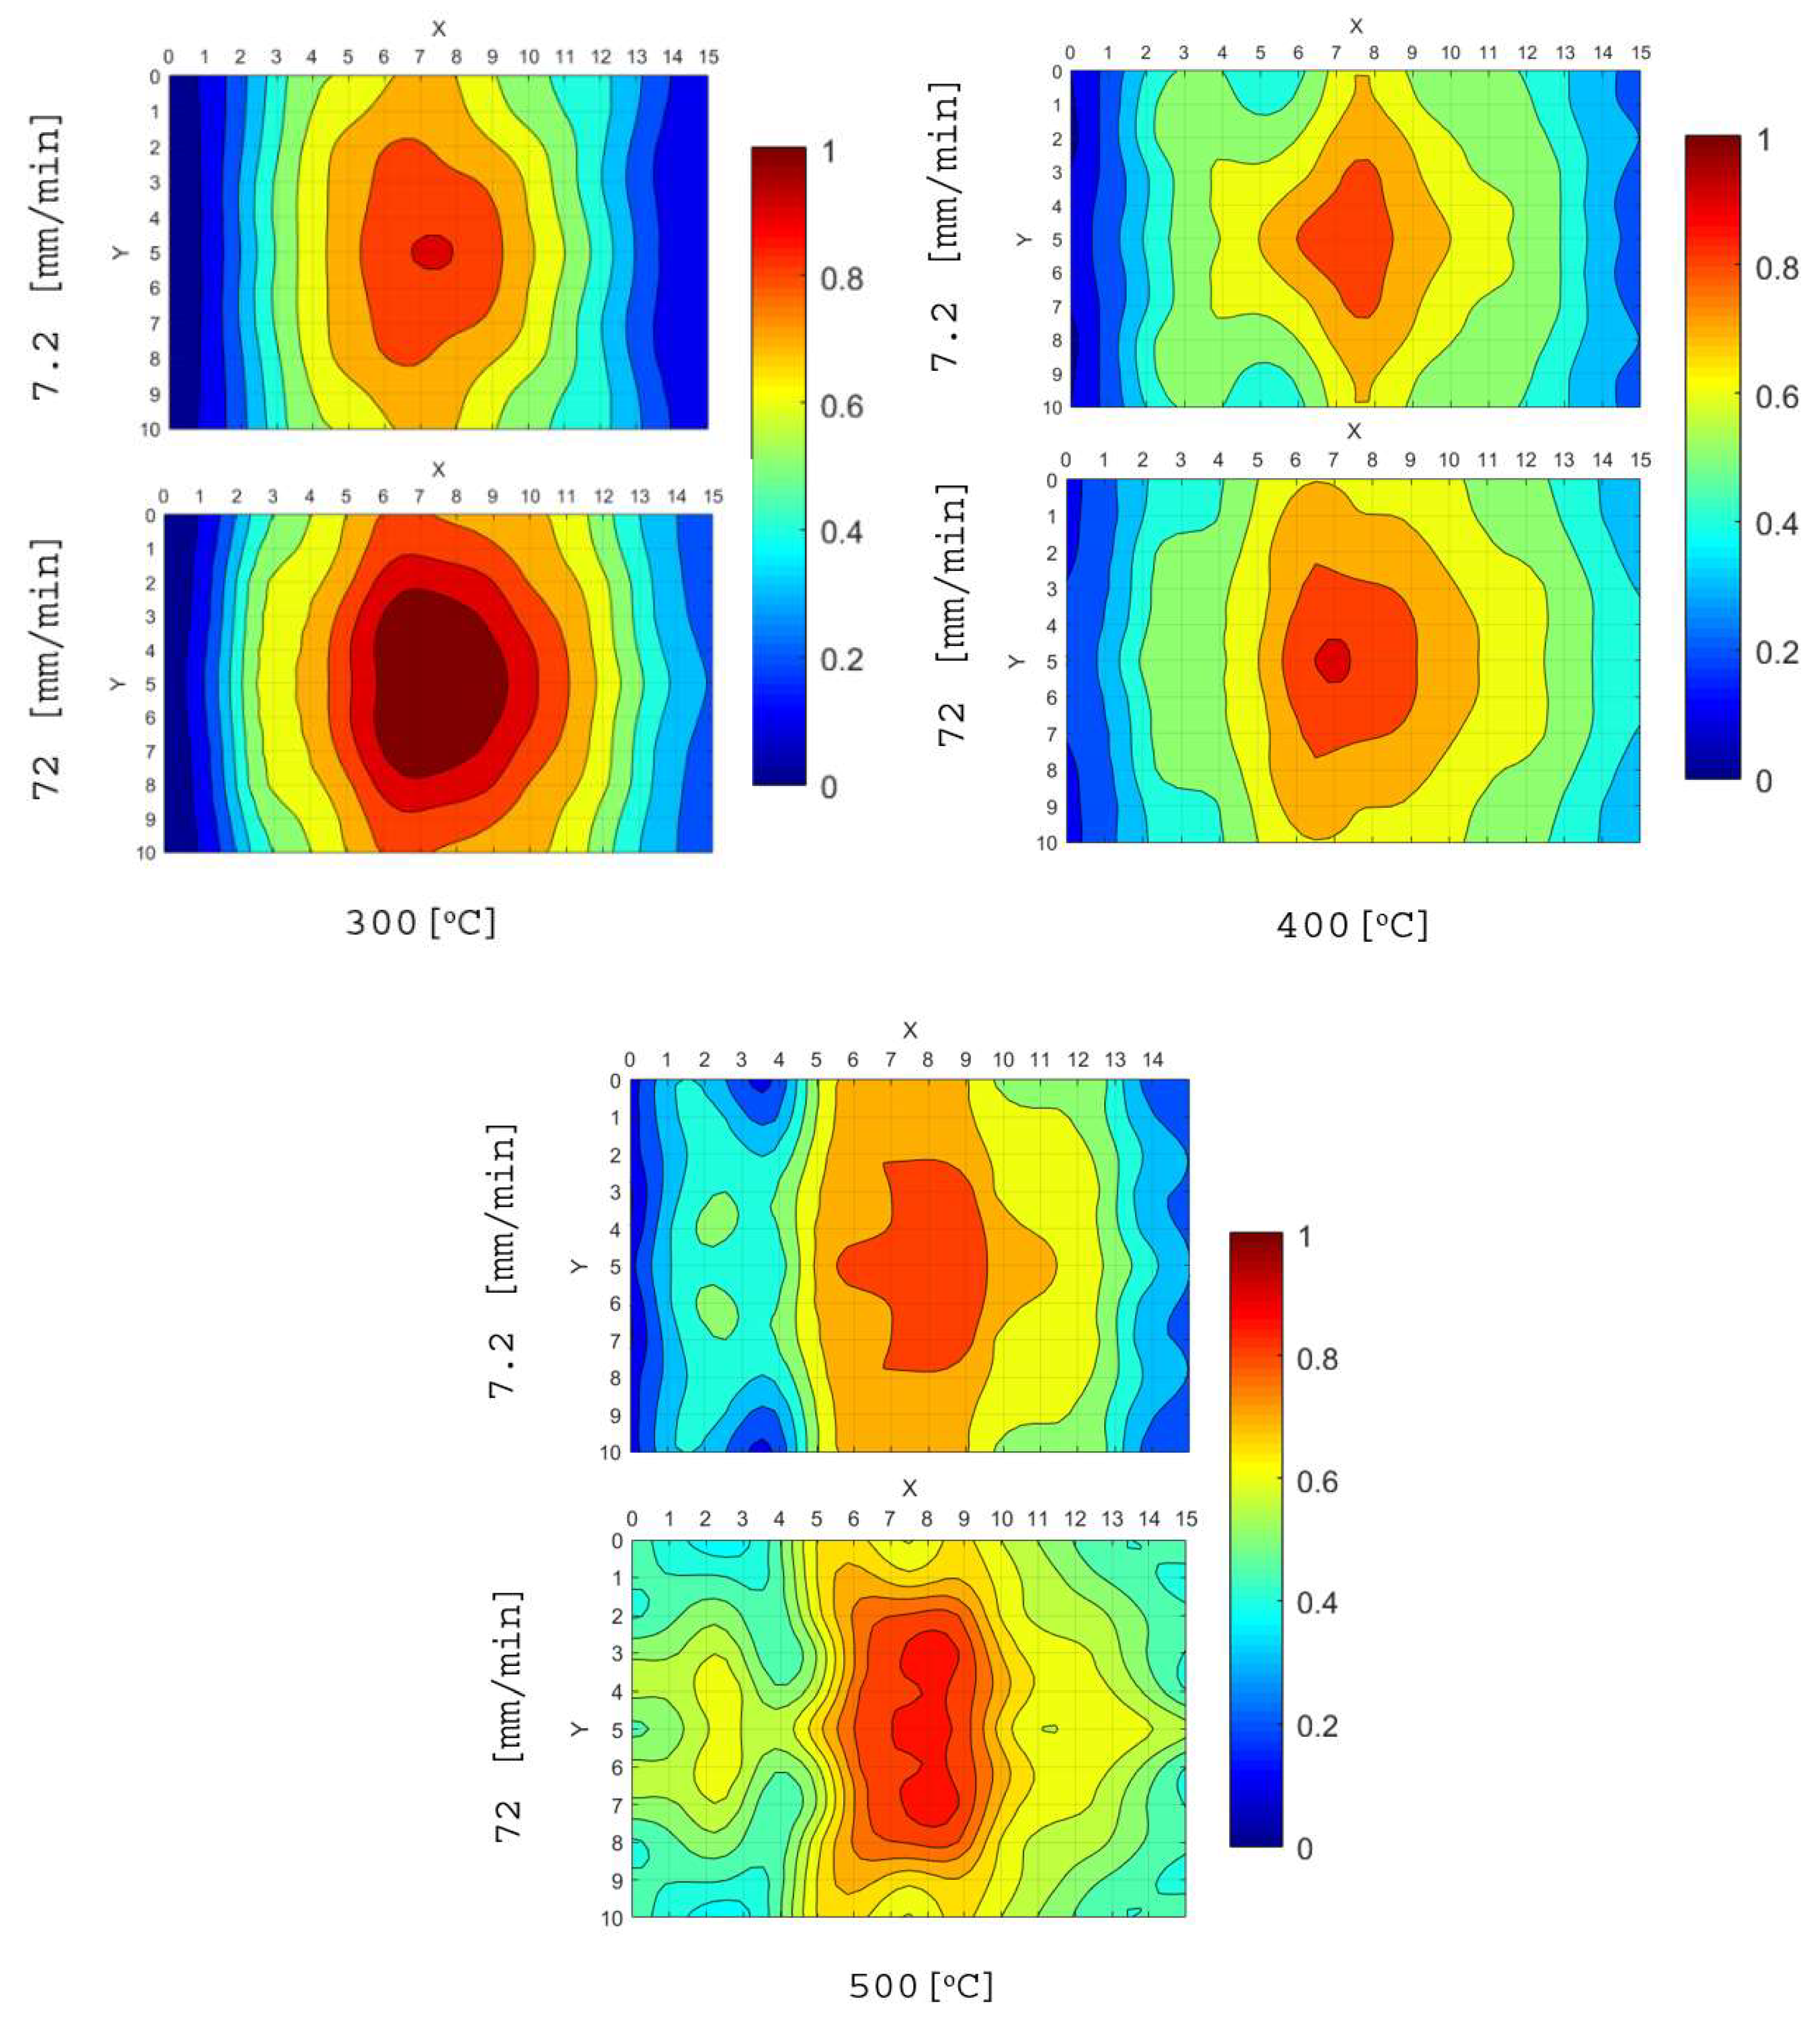
Figure 14 the distribution of J across the interface is shown for each of the bonding conditions.
It can be seen, that the value of the bonding parameter J is highest at the center of the bonding interface, and it decreases when moving outwards from the center. At 300 ᵒC this decrease is significant, especially in the length direction. At 400ᵒC, and even more so at 500ᵒC, the spatial gradients in J value are smaller. In order to determine if bonding occurs, the local J value needs to reach some critical value J
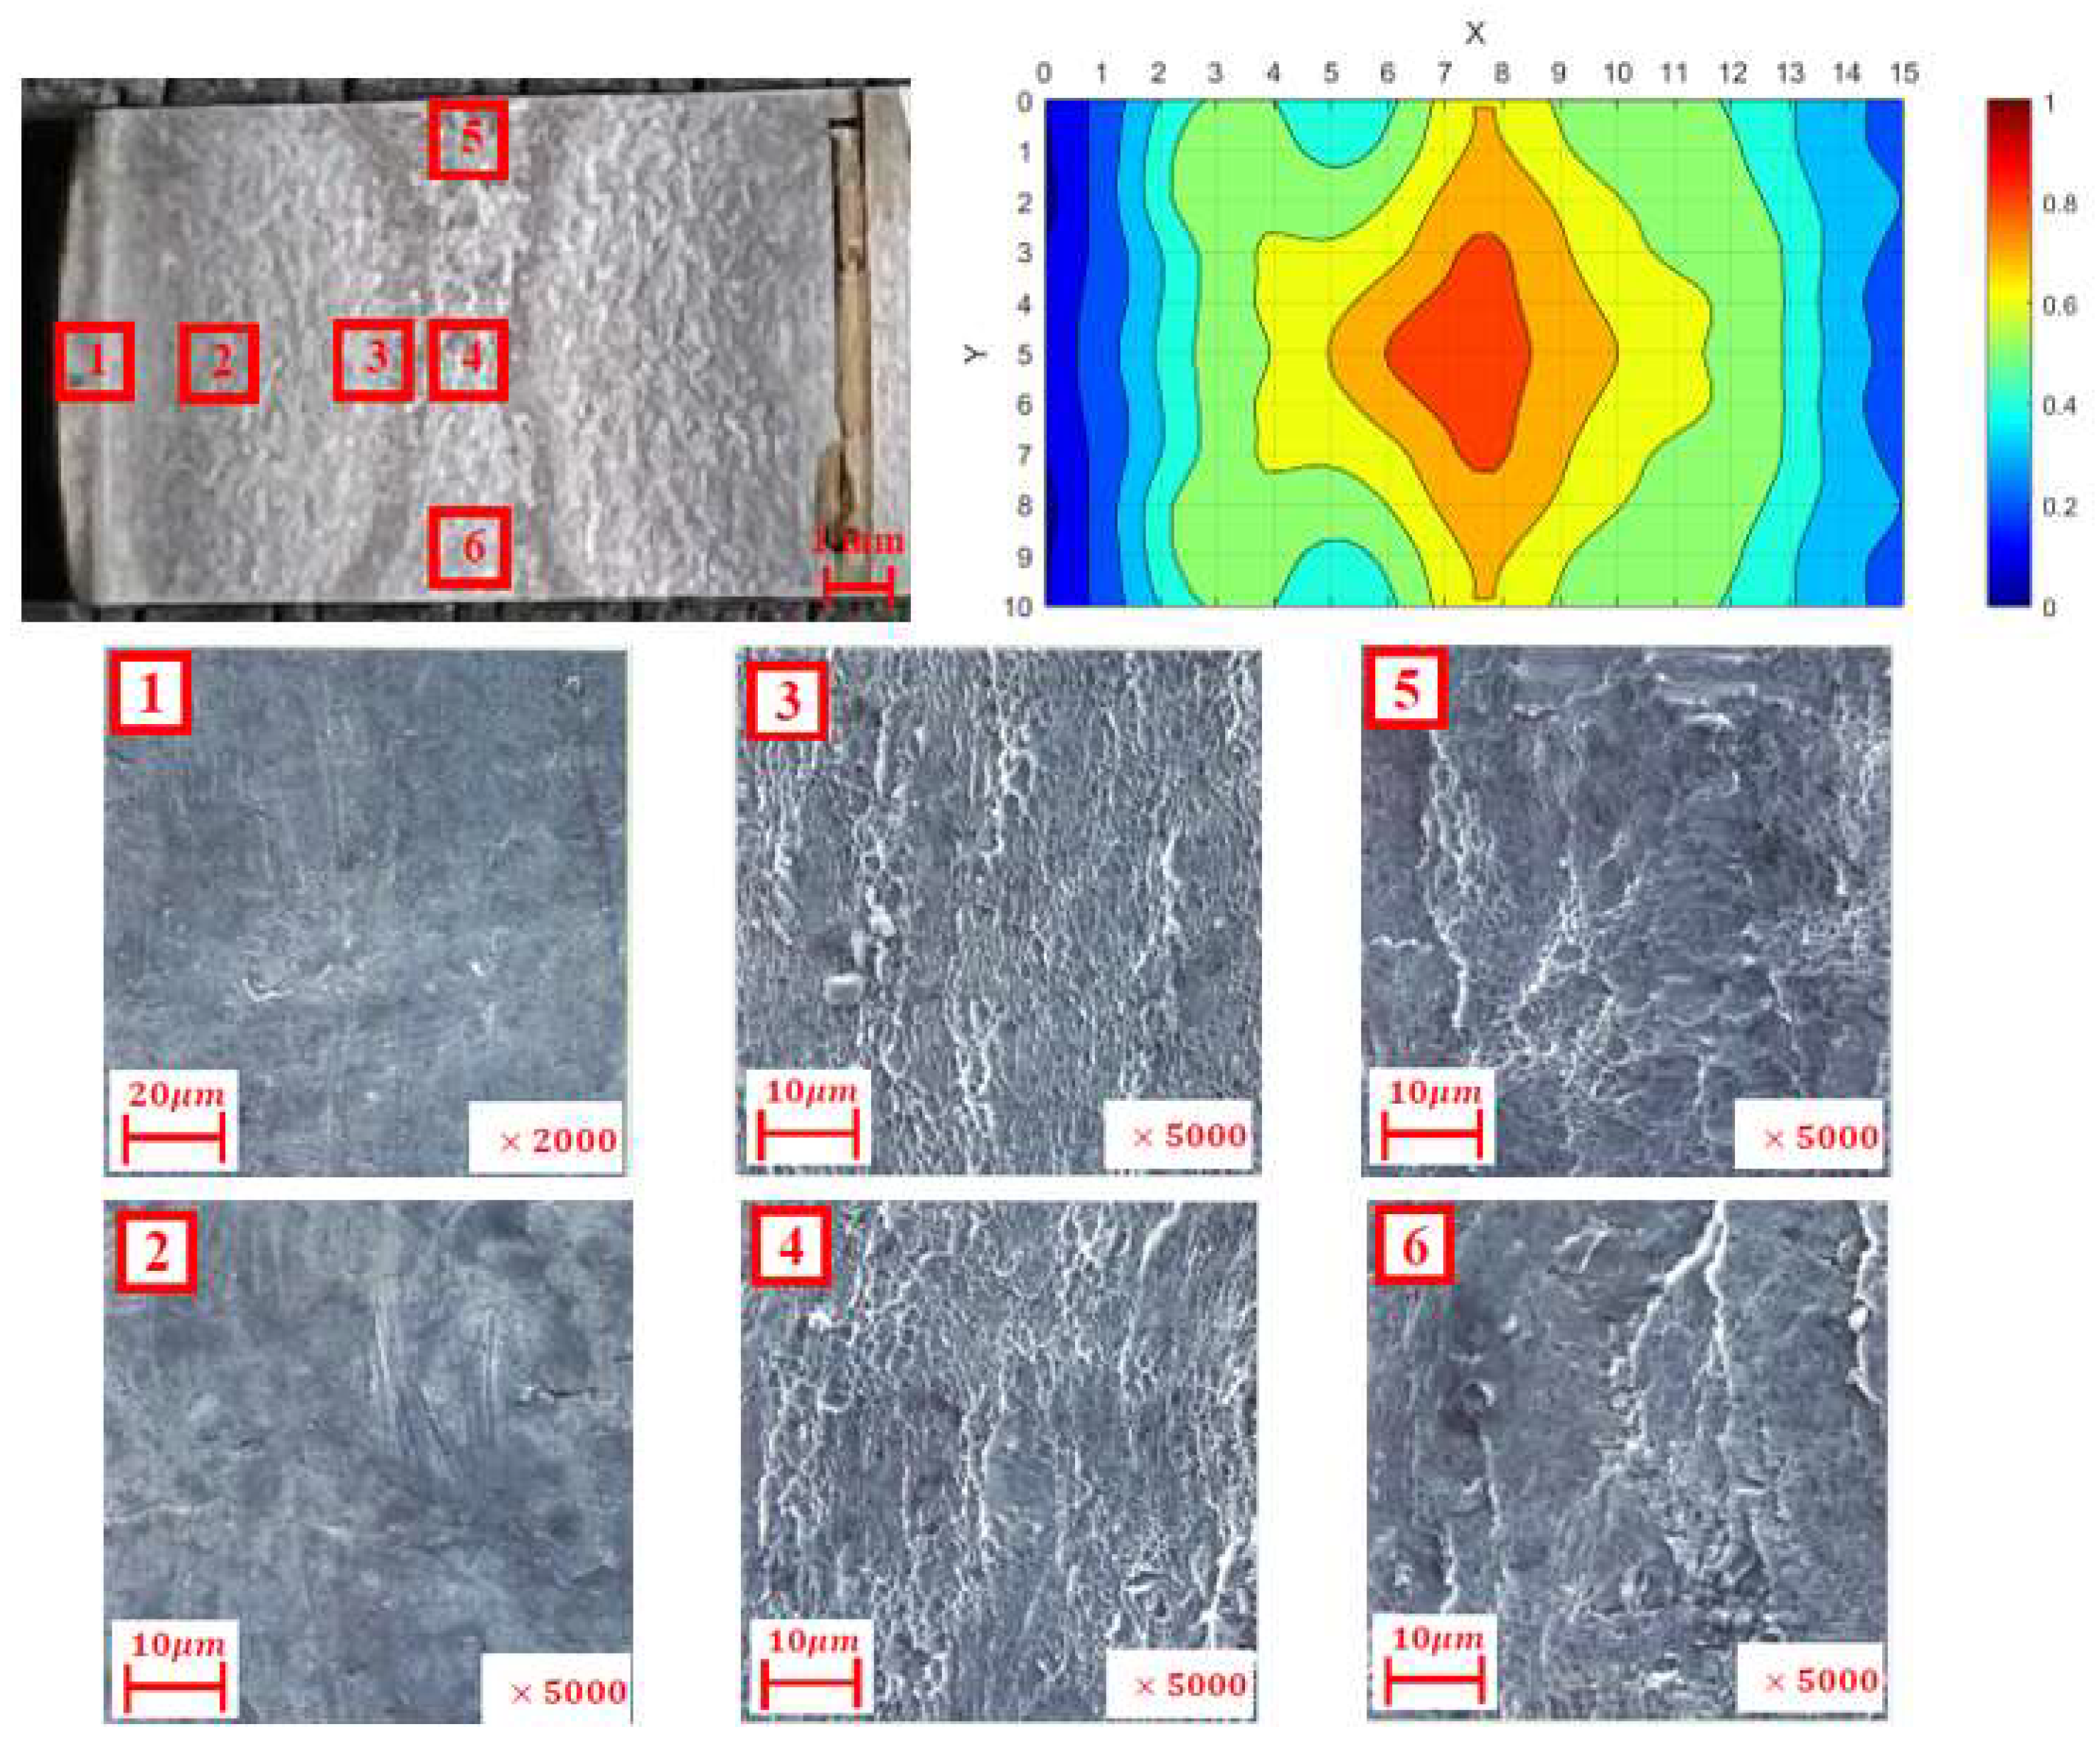
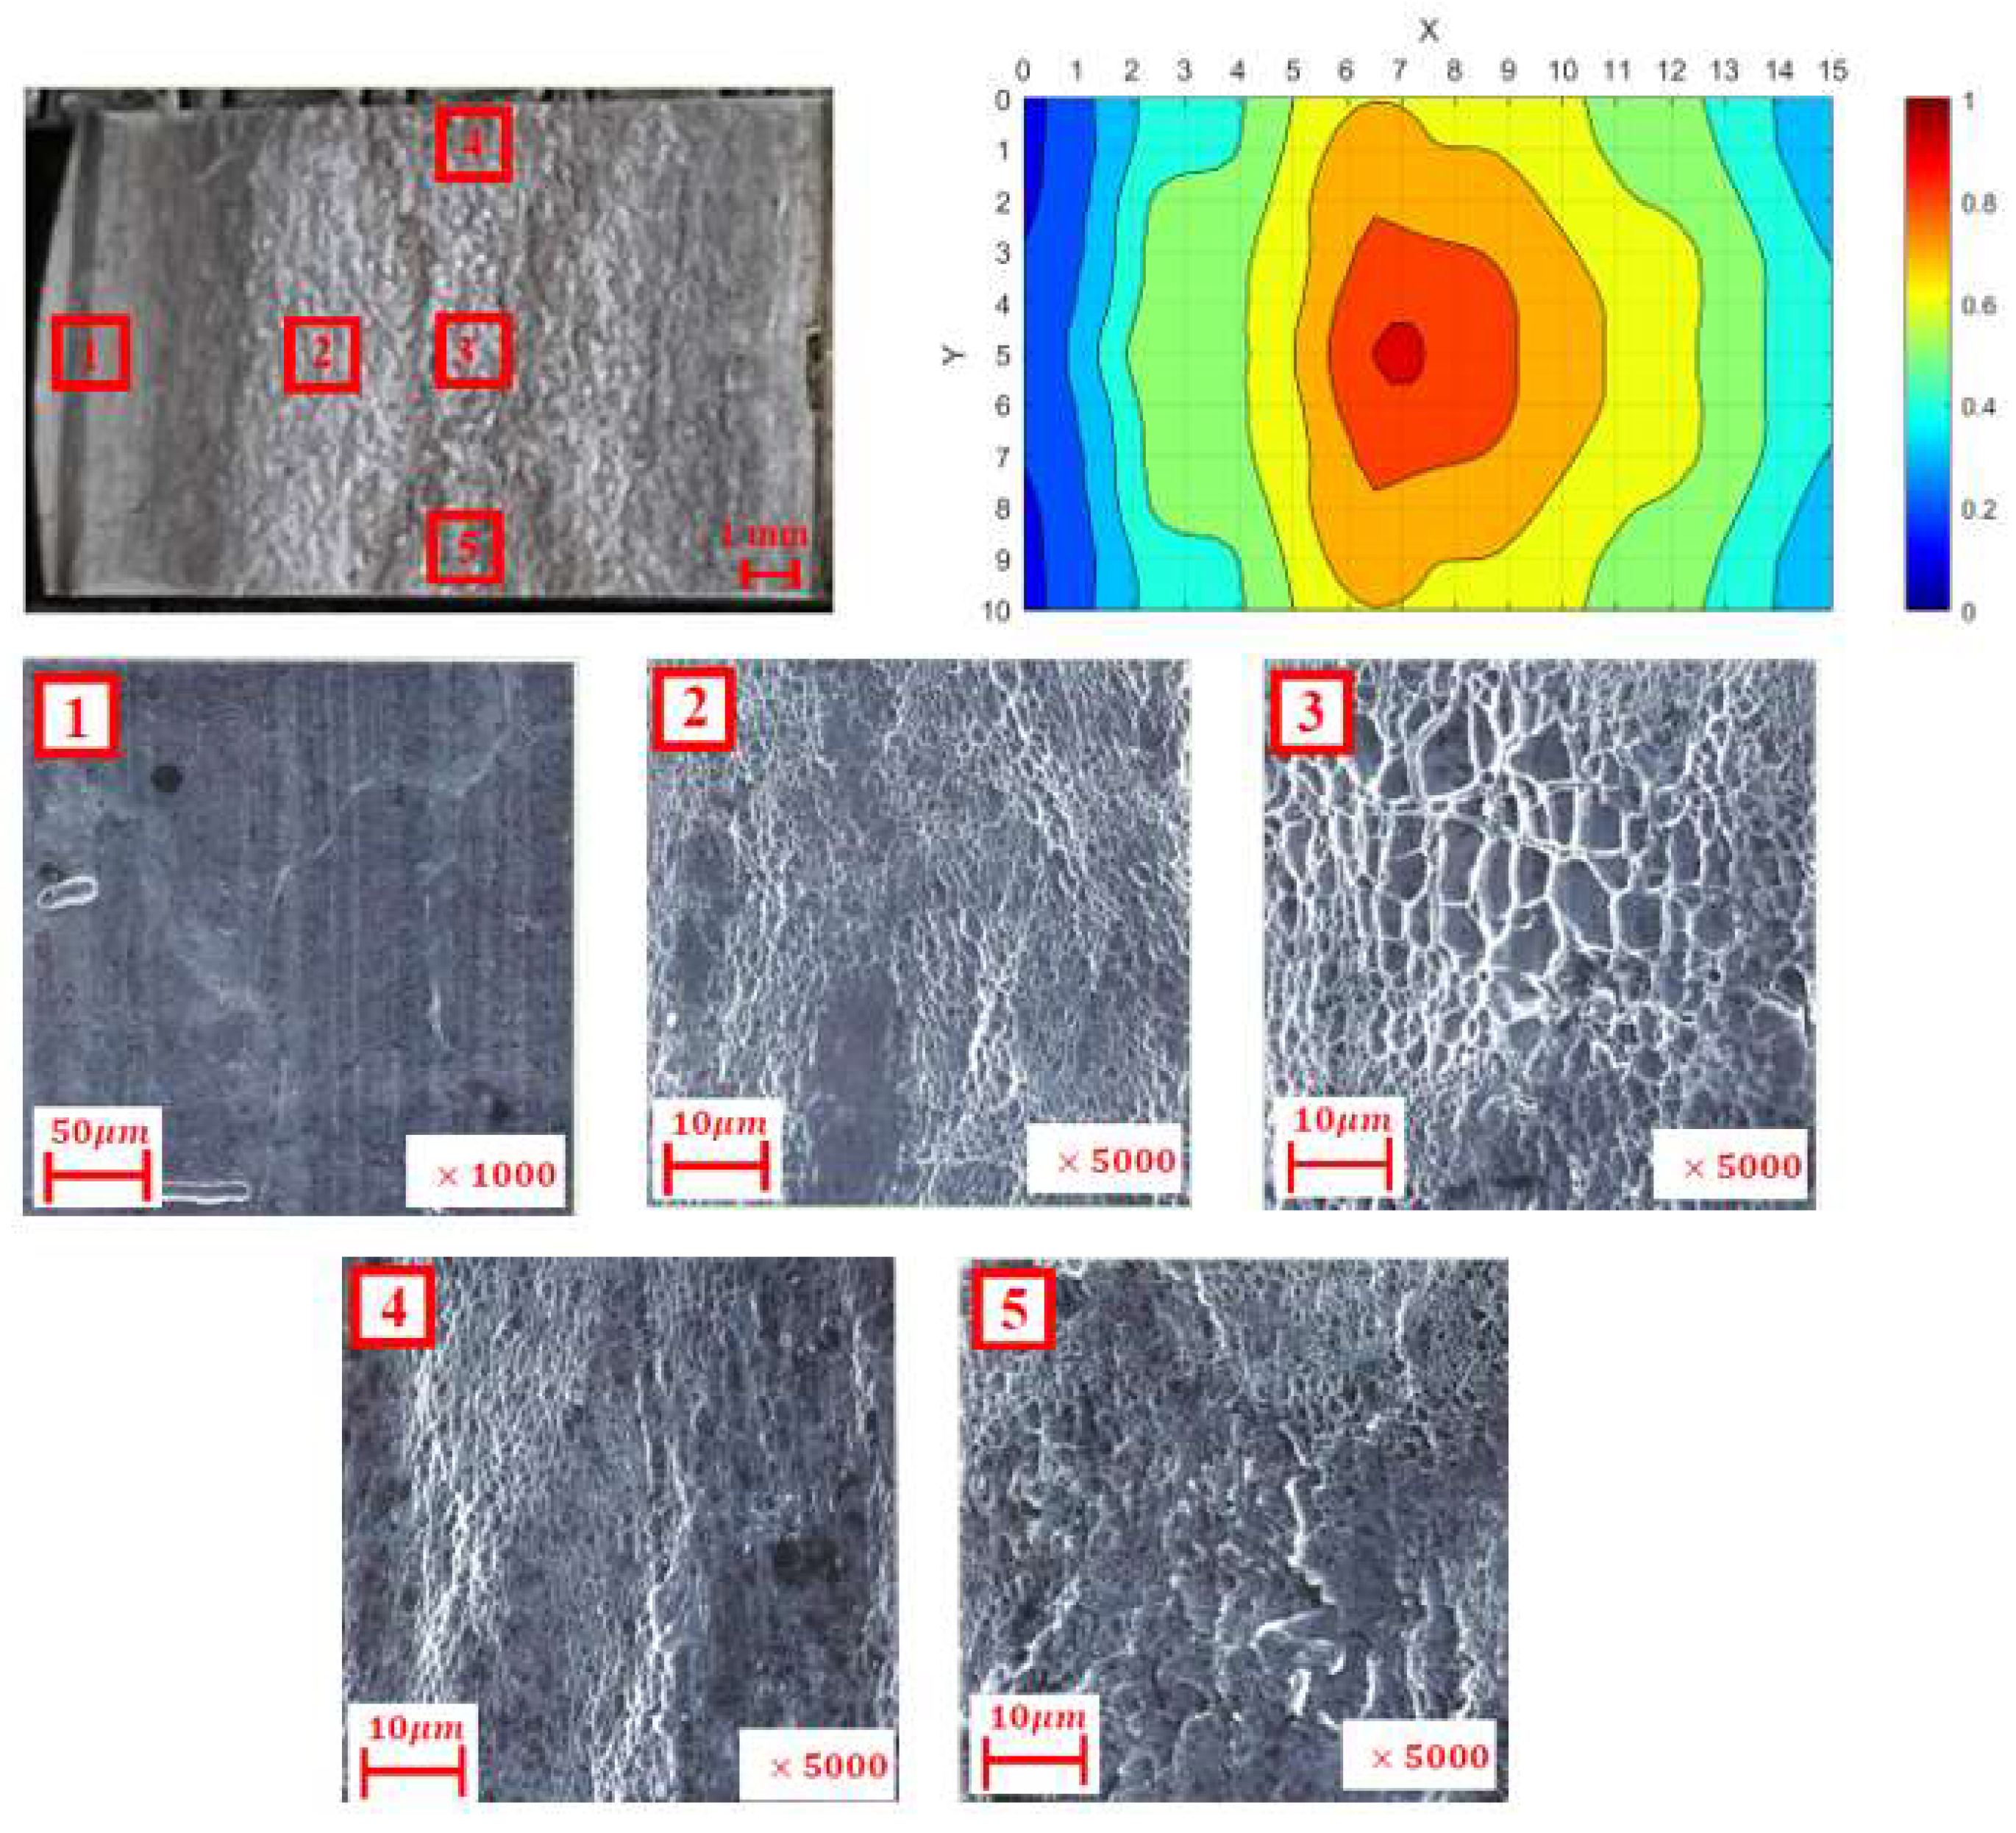
c. In order to identify this critical value, the interface between the specimens which was revealed during the tensile experiments was examined using a Scanning Electron Microscopy (SEM). In
Figure 15 and
Figure 16 the computed J distribution are compared to the metallurgical observations.
In all of the examined cases, a strong correlation was observed between the regions with high values of J and locations in which the microscopic examination revealed dimples. These dimples are evidence that a bond was created between the surfaces which underwent ductile failure during the tensile testing. In other regions, in which the values of J are smaller, the metallurgical examination showed flat surfaces with no evidence of ductile failure, indicating that in that region there was no bond formation.
The ultimate stress values from the literature (see Table II), together with the average debonding forces from the experiments, enable to approximate the true bonded area A’ for each combination of the temperature and loading rate in the compression bonding experiments:
On the other hand, the actually bonded area is the relative part from the total area (A”):
The spatial mapping of J shown in
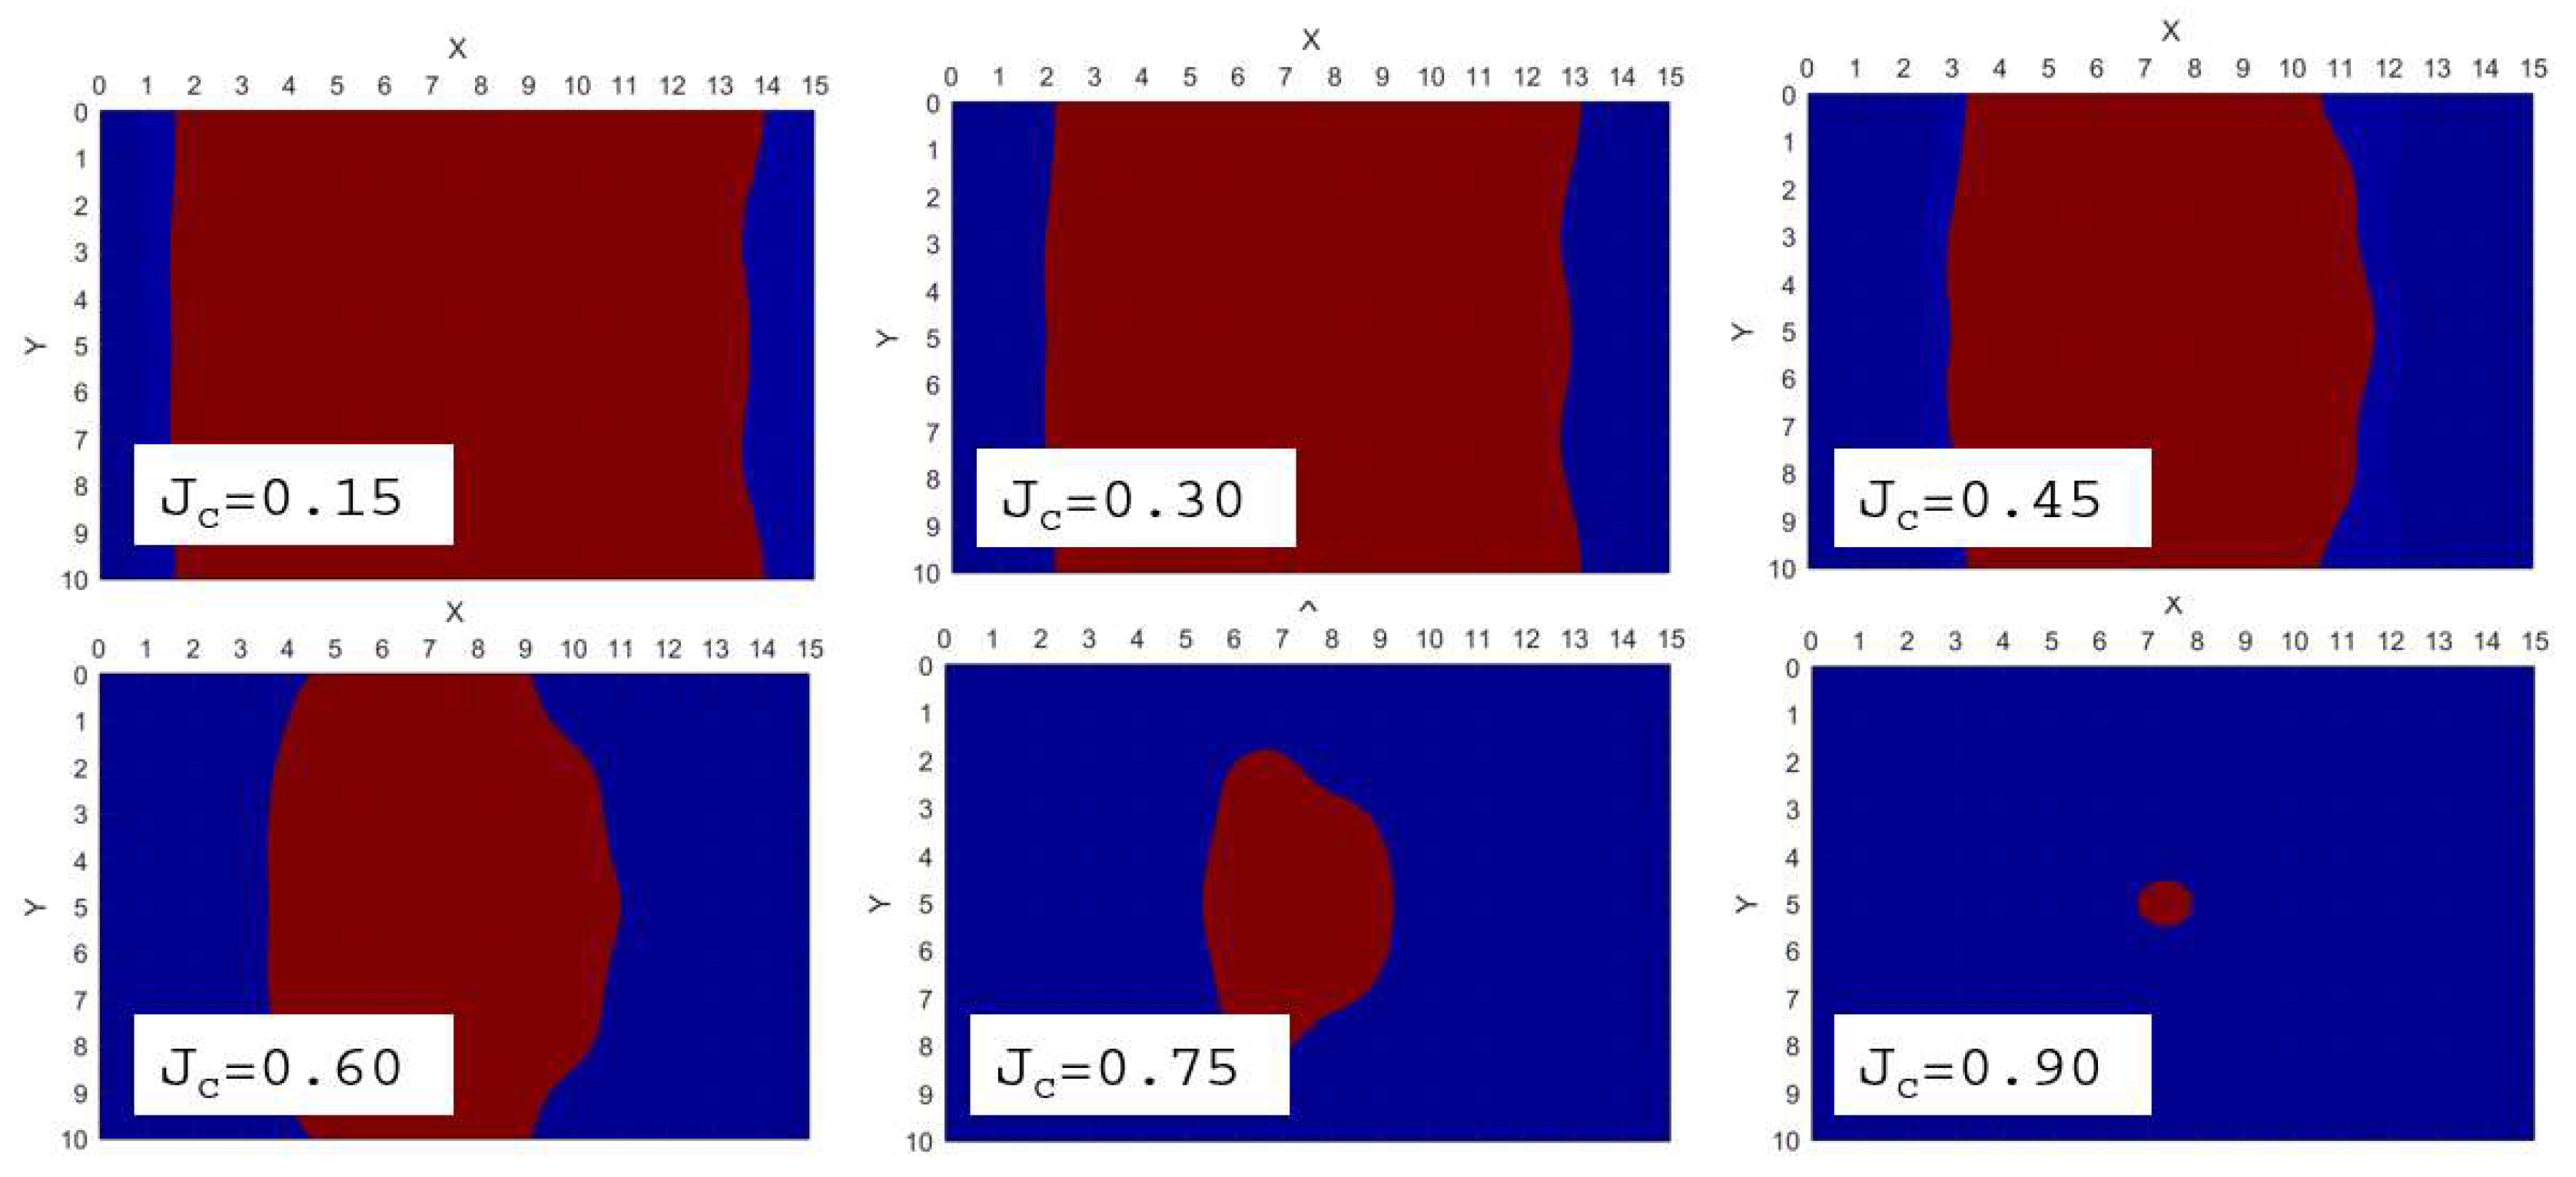
Figure 14 was used to determine a possible critical J value for all the experimental bonding conditions assuming that local bonding is created once J≥Jc. As an example, in
Figure 17 the interface area which satisfies J≥Jc for different values of Jc is shown for the case of 300ᵒC and a loading rate of 7.2 mm/min.
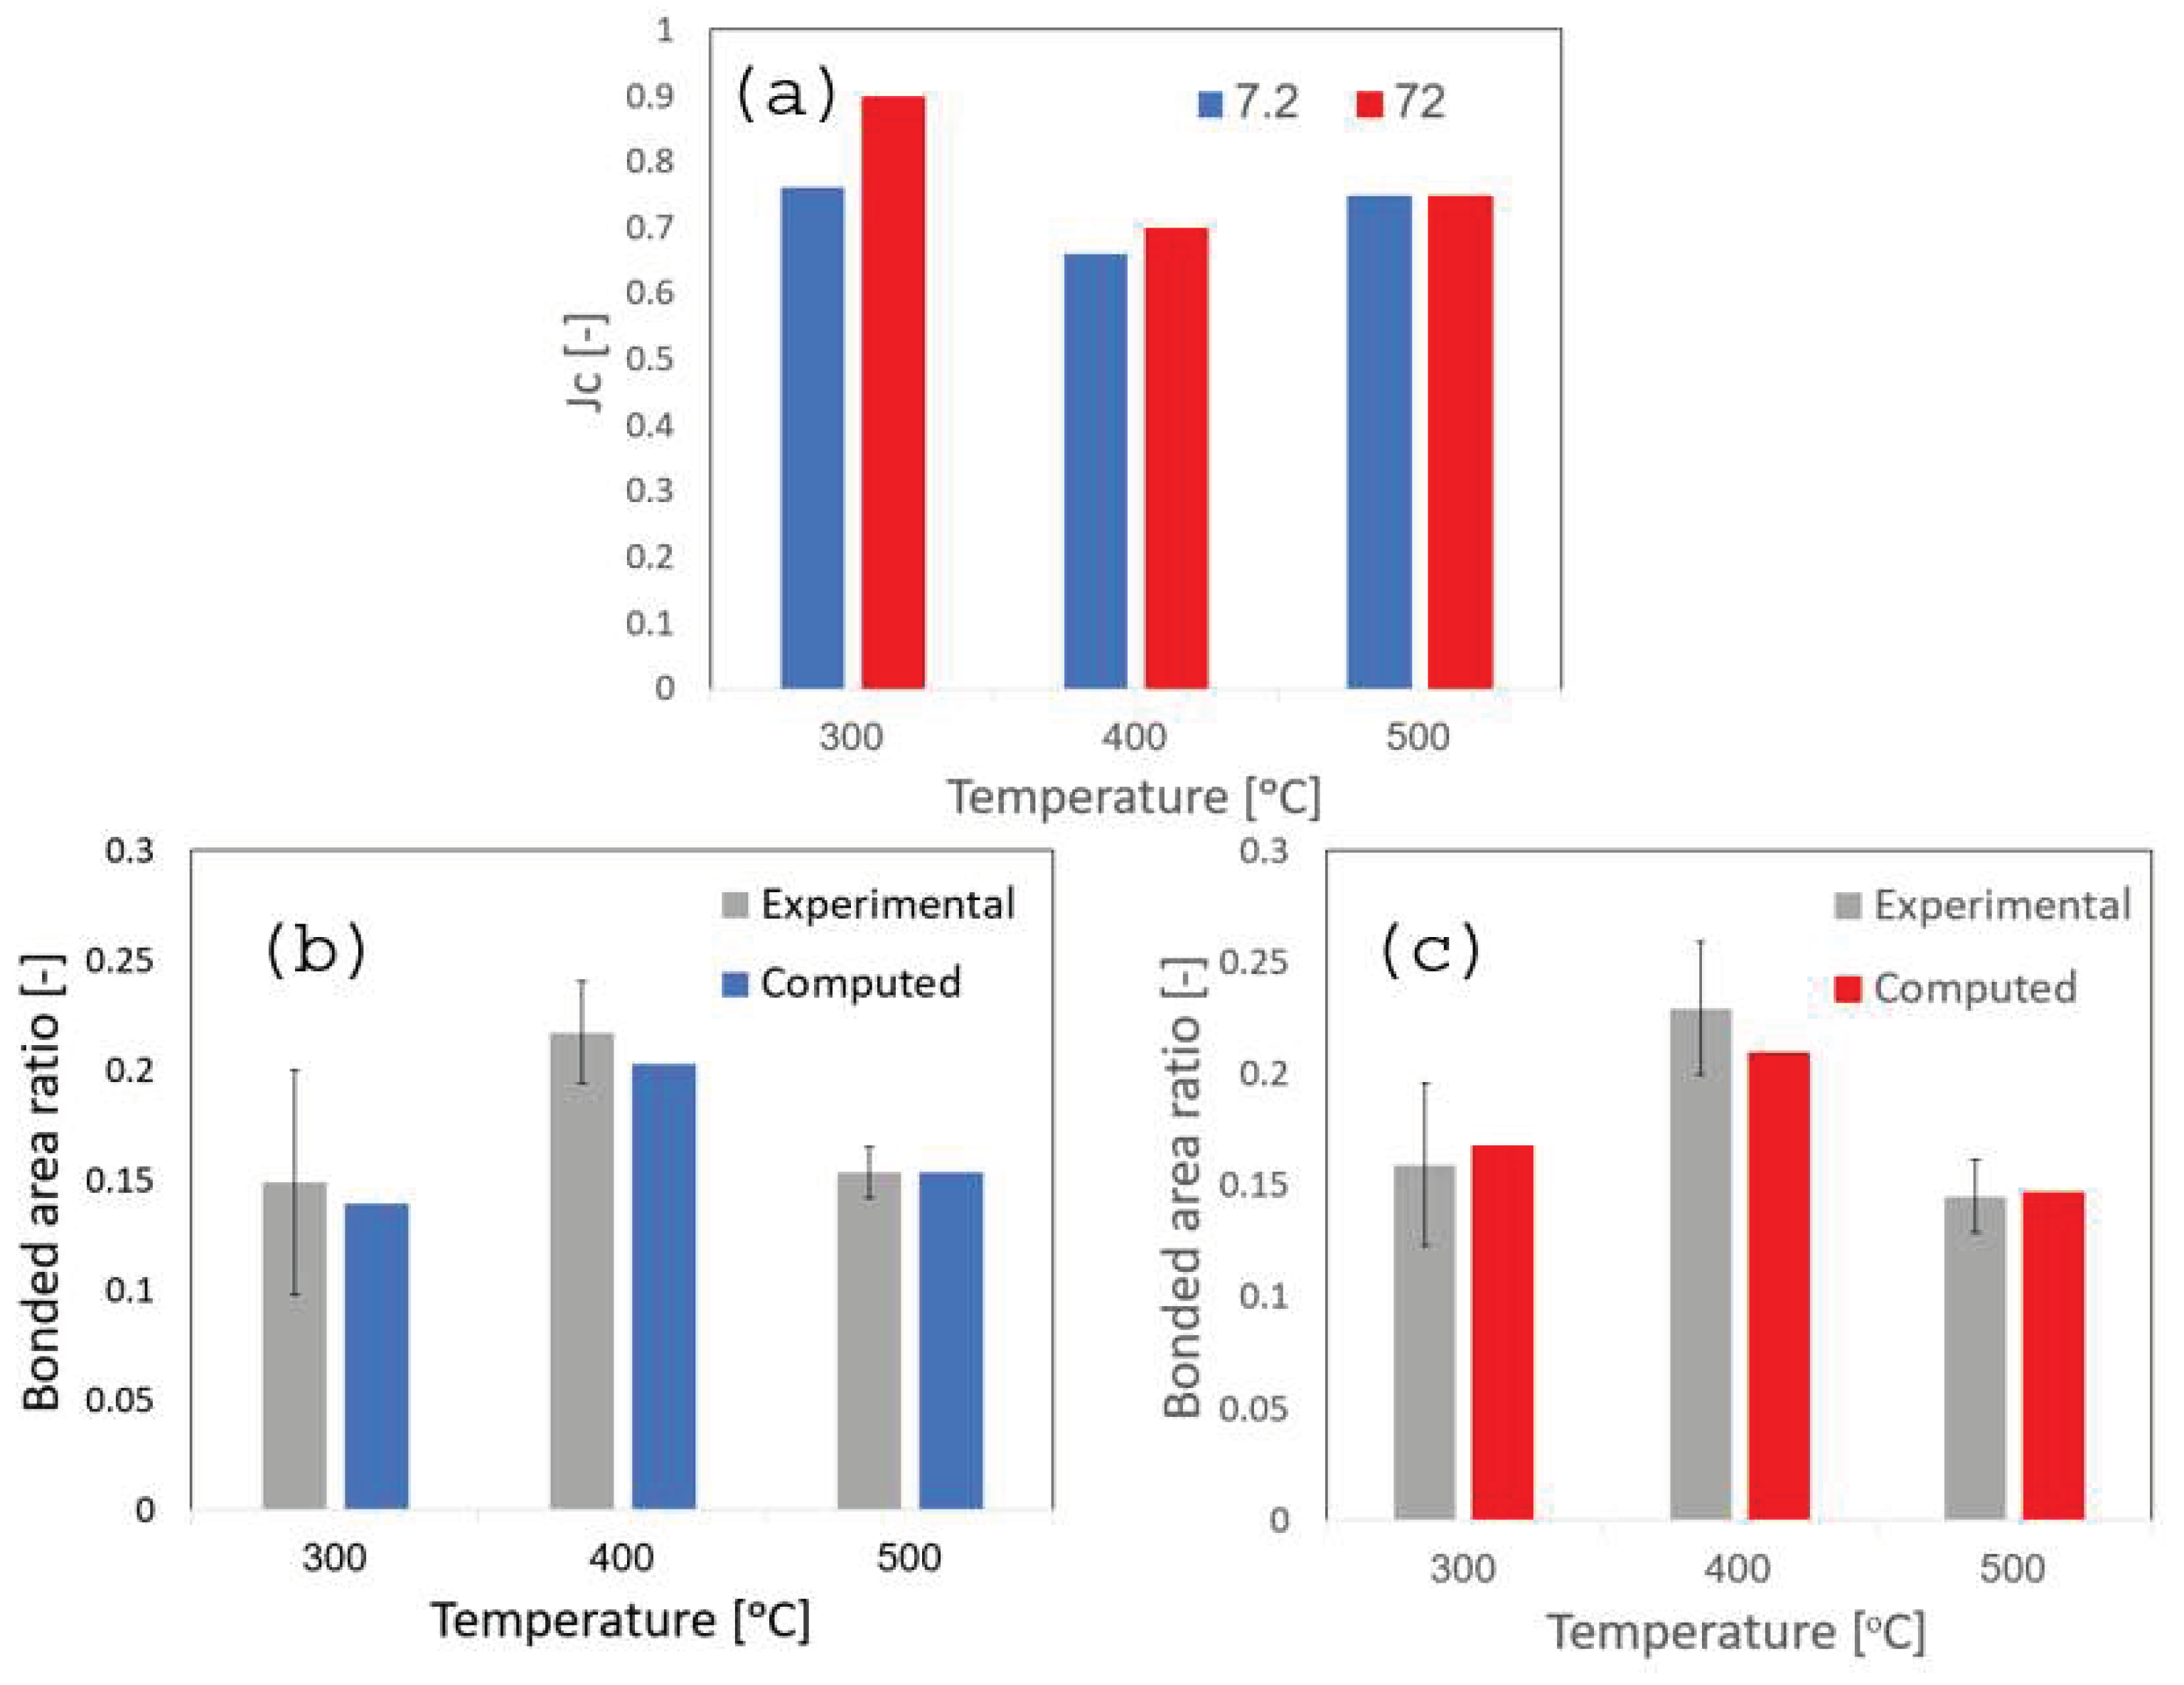
Hence, the critical value for J was determined by equating the actual size of the bonded area (A’) approximated from the experiments from equation (7), with the predicted bonding area calculated from the J mapping over the bonding interface. In
Figure 18, the value of J
c is given for all bonding experiments conducted. In addition, the bonded area ratio A' is also presented for the given J
c, and compared to the approximated area ratio from equation (7).
As shown in
Figure 18, for all bonding conditions a local value of Jc≥0.7 is sufficient for a metallurgical bond to occur.
5. Conclusions
Bonding by hot compression of Al6061 beam pairs was investigated using a combined experimental-computational methodology including metallurgical characterization. First, initial hot compression tests were used in conjunction with finite element analysis to determine the temperature and rate dependent Al6061 flow stress. Next, bonding was conducted at temperatures ranging from to and at two loading rates of 7.2 [mm/min] and 72 [mm/min] (average strain rates of ). Following the formation of the metallurgical bond, mechanical testing was conducted in order to measure the bond strength and expose the bonded interface.
Following initial verification and validation of the finite element models, the thermo-mechanical fields which develop at the interface of the bonded specimens were computed for all bonding conditions. The computational results were used to map the spatial distribution of a scalar bonding parameter J which is a function of the history of local stress triaxiality, strain rate and temperature. A strong correlation was shown to exist between areas of high J values and locations which were shown to have metallurgically bonded in SEM examinations. By using the mapped J fields, a critical J value of about 0.7 was shown to result in the creation of a metallurgical bond at the interface. The results also demonstrate, that an increase in loading rate, still leads to a bond strength comparable and even slightly higher than the bond obtained a lower loading rate. This, in spite of the considerably shorter duration in which the interface is subjected to the high stress, strain and temperature conditions. This finding is attributed to the increase in flow stress values at the higher strain rates.
Author Contributions
Conceptualization, E.P, B.M, J.B; methodology, E.P, B.M.; formal analysis, M.K., B.M; investigation, M.K, D.F., M.B.H.; resources, M.B.H.; writing—original draft preparation, M.K.; writing—review and editing, M.K, B.M., E.P., J.B; supervision, E.P, J.B.; funding acquisition, E.P. All authors have read and agreed to the published version of the manuscript.
Funding
This research was funded by the IAEC, Grant no.4300011151 and the PAZI foundation Grant no. 389.
Data Availability Statement
The data presented in this study are available on request from the corresponding author.
Acknowledgments
The authors would like to express their gratitude to Yair Yacobi from the NRCN for the valuable assistance provided in the machining of the tensile specimens.
Conflicts of Interest
The authors declare no conflict of interest.
References
- Priel, E.; Ungrish, Z.; Navi, N.U. Co-extrusion of a Mg/Al Composite Billet: A Computational Study Validated by Experiments. J. Mater. Process. Technol. 2016, 236, 103–113. [Google Scholar] [CrossRef]
- Degner, M.; Bohm, W.; Herrmann, J.; Kohler, M.; Merklein, M. Manufacturing and Characterization of Multilayered 7000-Series Aluminum with Improved Corrosion Behavior Processed via Accumulative Roll Bonding. Mater. Today Proc. 2019, 10, 368–375. [Google Scholar] [CrossRef]
- Benedyk, J.C. Aluminum alloys for lightweight automotive structures. Materials, Design and Manufacturing for Lightweight Vehicles. Woodhead Publishing Series in Composites Science and Engineering, 2010, 79–113.
- Brischetto, S. Innovative multilayered structure for a new generation of aircraft and spacecraft. J. Aeronaut. Aerosp. Eng. 2015, 4, 4–5. [Google Scholar] [CrossRef]
- Helmut, M. Diffusion in solids: Fundamental, Methods, Materials, Diffusion-Controlled Processes, 2nd ed.; Springer: Berlin/Heidelberg, Germany, 2009; pp. 127–147. [Google Scholar]
- Ben-Haroush, M.; Mittelman, B.; Shneck, R.; Priel, E. The influence of time, atmosphere and surface roughness on the interface strength and microstructure of AA6061-AA-1050 diffusion bonded components. Materials 2023, 16, 769. [Google Scholar] [CrossRef]
- Zhang, X.P.; Yang, T.H.; Castagne, S.; Gu, C.F.; Wang, J.T. Proposal of bond criterion for hot roll bonding and its application. Materials and Design 2011, 32, 2239–2245. [Google Scholar] [CrossRef]
- Wang, Y.; Liu, Y.; Pay, S.D.; Lan, B.; Jiang, J. A study of solid state bonding by hot deformation mechanism in Inconel 718. Journal of Materials Processing Technology 2021, 295. [Google Scholar] [CrossRef]
- Xu, X.; Ma, X.; Yu, S.; Zhao, G.; Wang, Y.; Chen, X. Bonding mechanism and mechanical properties of 2196 Al-Cu-Li alloy joined by hot compression deformation. Mater. Charact. 2020, 167, 110486. [Google Scholar] [CrossRef]
- Mittelman, B.; Ben-Haroush, M.; Aloush, I.; Mordechay, L; Priel, E. Bonding of Al6061 by Hot Compression Forming: A Computational and Experimental Study of Interface Conditions at Bonded Surfaces. Materials 2021, 14, 3598. [Google Scholar] [CrossRef]
- Yu, J.; Zhao, G.; Chen, L. Analysis of longitudinal weld seam defects and investigation of solid-state bonding criteria in porthole die extrusion process of aluminum alloy profiles. Journal of Materials Processing Technology 2016, 237, 31–47. [Google Scholar] [CrossRef]
- Mori, K.I.; Bay, N.; Fratini, L; Micari, F.; Tekkaya, A.E. Joining by plastic deformation. CIRP Ann. Manuf. Technol. 2013.
- Akeret, R. Properties of pressure welds in extruded aluminum alloy sections. 1972.
- Plata, M.; Piwnik, J. Theoretical and experimental analysis of seam weld formation in hot extrusion of aluminum alloys. In Proceedings of the Seventh International Aluminum Extrusion Technology, Chicago, IL, USA, 16–19 May 2000. [Google Scholar]
- Donati, I.; Tomesani, L. The predication of seam welds quality in aluminum extrusion. Journal of Materials Processing Technology 2004, 153–154, 366–373. [Google Scholar] [CrossRef]
- Zhang, X.P.; Yang, T.H.; Castagne, S.; Gu, C.F.; Wang, J.T. Proposal of bond criterion for hot roll bonding and its application. Materials and Design 2011, 32, 2239–2245. [Google Scholar] [CrossRef]
- Wu, R.H.; Li, M.; Liu, X.; Yang, Z.; Chen, J. Interfacial quality prediction model for Al/steel sheets during friction stir assisted double sided incremental forming with synchronous bonding. The International Journal of Advanced Manufacturing Technology 2022, 119, 733–743. [Google Scholar] [CrossRef]
- Bai, S.; Fang, G.; Jiang, B. An extrusion-welding criterion of magnesium alloy considering interfacial void shrinkage driven by plastic deformation and atomic diffusion. Materials and Design 2022, 222, 111107. [Google Scholar] [CrossRef]
- Xie, B.; Sun, M.; Xu, B.; Wang, C.; Zhang, J.; Zhao, L.; Li, D.; Li, Y. Evolution of interfacial characteristics and mechanical properties for 316LN stainless steel joints manufactured by hot-compression bonding. J. Mater. Process. Technol. 2020, 283, 116733. [Google Scholar] [CrossRef]
- Mittleman, B.; Guttmann, G.M.; Priel, E. A computational analysis of thermo-mechanical fields in hot roll bonding of aluminum validated by experiments. Journal of Minerals, Metals and Materials Society 2019, 72, 718–728. [Google Scholar] [CrossRef]
- ABAQUS 2021, Dassault Systèmes, Providence, RI, USA.
- Mittelman, B.; Priel, E.; Navi, N.U. A finite element study of thermo-mechanical fields and their relation to friction conditions in Al1050 ring components tests. J. Manuf. Mater. Process. 2018, 2, 83. [Google Scholar]
- Taylor, G.; Quinney, H. The latent energy remaining in a metal after cold working. Proc. R. Soc. Lond. A. 1934, 143, 307–326. [Google Scholar]
- Priel, E.; Mittelman, B.; Trabelsi, N.; Cohen, Y.; Koptiar, Y.; Padan, R. A computational study of equal channel angular pressing of molybdenum validated by experiments. Journal of Materials Processing Technology 2019, 264, 469–485. [Google Scholar] [CrossRef]
- Summers, P.T.; Chen, Y.; Rippe, C.M.; Allen, B.; Mouritz, A.P.; Case, S.W.; Lattimer, B. Overview of aluminum alloy mechanical properties during and after fires. Fire science review 2015, 4, 3. [Google Scholar] [CrossRef]
- Zhang, Q.; Niu, L.; Liang, Z.; Cao, M.; Zhou, T. A porosity closure model considering stress triaxiality ratio and lode stress parameter. Journal of Materials Processing Technology 2020, 286, 116924. [Google Scholar] [CrossRef]
- Rom, N.; Bortman, J.; Priel, E. Predicting ductile failure of aluminum components under general loading conditions: Computational implementation, model verification and experimental validation. International Journal of Solids and Structures 2023, 275, 112295. [Google Scholar] [CrossRef]
Figure 1.
Hot compression experiments – representative examples: Cuboid specimens for flow stress determination (a1), their compression experiments (a2), and the specimens after deformation (a3). Beam specimens for bonding experiments (b1), hot compression bonding (b2) and the beams following the bonding process (b3).
Figure 2.
A tensile specimen prepared from a beam pair bonded by hot compression (a), mounted in the tensile machine (b).
Figure 2.
A tensile specimen prepared from a beam pair bonded by hot compression (a), mounted in the tensile machine (b).
Figure 3.
The geometry, boundary conditions and a representetive mesh of: (a) a cuboid specimen compression model, and (b) a beam bonding compression model.
Figure 3.
The geometry, boundary conditions and a representetive mesh of: (a) a cuboid specimen compression model, and (b) a beam bonding compression model.
Figure 4.
Experimental and computed force-displacement curves of the Al6061 specimens at different temperatures and loading rates.
Figure 4.
Experimental and computed force-displacement curves of the Al6061 specimens at different temperatures and loading rates.
Figure 5.
Representative examples of cuboid compression processes at - experimental results (a) are compared to FE model results of equivalent strain (b) and equivalent stress (c).
Figure 5.
Representative examples of cuboid compression processes at - experimental results (a) are compared to FE model results of equivalent strain (b) and equivalent stress (c).
Figure 6.
Bonding by hot compression - experimental vs. numerical results of the force-displacement curves for different temperatures (, and ) and different loading rates.
Figure 6.
Bonding by hot compression - experimental vs. numerical results of the force-displacement curves for different temperatures (, and ) and different loading rates.
Figure 7.
Comparison between computed and observed final deformed state of the beam pairs after bonding by hot compression at and loading rates of 7.2,72 [mm/min], and the respective FE model.
Figure 7.
Comparison between computed and observed final deformed state of the beam pairs after bonding by hot compression at and loading rates of 7.2,72 [mm/min], and the respective FE model.
Figure 8.
Computed equvilent stress distribution, over the deformed specimen shape and zoom-in on the interface area at the symmetry plane at different stages (I-IV) of the hot compression bonding process conducted at , loading rate of 7.2 [mm/min].
Figure 8.
Computed equvilent stress distribution, over the deformed specimen shape and zoom-in on the interface area at the symmetry plane at different stages (I-IV) of the hot compression bonding process conducted at , loading rate of 7.2 [mm/min].
Figure 9.
Force-displacement curves obtained from the tensile tests. A representative example for , and and the two loading rates.
Figure 9.
Force-displacement curves obtained from the tensile tests. A representative example for , and and the two loading rates.
Figure 10.
A representation of the overlapping area A" (a), average bond shear strength calculated for specimens bonded at and different loading rates. The error bars indicate minimum and maximum values calculated.
Figure 10.
A representation of the overlapping area A" (a), average bond shear strength calculated for specimens bonded at and different loading rates. The error bars indicate minimum and maximum values calculated.
Figure 11.
Relative bonding shear strength for , and and the two loading rates.
Figure 11.
Relative bonding shear strength for , and and the two loading rates.
Figure 12.
Equivalent stress, pressure and equivalent plastic strain distribution across the bonding interface at , and and the two loading rates.
Figure 12.
Equivalent stress, pressure and equivalent plastic strain distribution across the bonding interface at , and and the two loading rates.
Figure 13.
Equivalent stress (a), pressure (b) and equivalent plastic strain (c) at the center of the bonded interface for different normalized process time at , and and the two loading rates.
Figure 13.
Equivalent stress (a), pressure (b) and equivalent plastic strain (c) at the center of the bonded interface for different normalized process time at , and and the two loading rates.
Figure 14.
Distribution of the computed bonding parameter J across the interface for the different bonding conditions studied.
Figure 14.
Distribution of the computed bonding parameter J across the interface for the different bonding conditions studied.
Figure 15.
Comparison between J distribution and metallurgical examination of the interface surface for a specimen bonded at 400ᵒC and 7.2 [mm/min].
Figure 15.
Comparison between J distribution and metallurgical examination of the interface surface for a specimen bonded at 400ᵒC and 7.2 [mm/min].
Figure 16.
Comparison between J distribution and metallurgical examination of the interface surface for a specimen bonded at 400ᵒC and 72 [mm/min].
Figure 16.
Comparison between J distribution and metallurgical examination of the interface surface for a specimen bonded at 400ᵒC and 72 [mm/min].
Figure 17.
Bonded area (red) predicted by the J criterion for different values of Jc, for hot compression bonding at 300ᵒC and 7.2 [mm/min].
Figure 17.
Bonded area (red) predicted by the J criterion for different values of Jc, for hot compression bonding at 300ᵒC and 7.2 [mm/min].
Figure 18.
Values of Jc for all bonding conditions examined in the current study and the predicted area ratio compared to the area ratio approximated from the experiments.
Figure 18.
Values of Jc for all bonding conditions examined in the current study and the predicted area ratio compared to the area ratio approximated from the experiments.
Table 1.
Ludwik form of the flow stress for each temperature and loading rate tested.
Table 1.
Ludwik form of the flow stress for each temperature and loading rate tested.
| Temperature [C] |
300 |
400 |
500 |
| 7.2 [mm/min] |
|
|
|
| 72 [mm/min] |
|
|
|
Table 2.
Average debonding force for the different conditions of the hot compression bonding experiments.
Table 2.
Average debonding force for the different conditions of the hot compression bonding experiments.
| Temperature [ᵒC] |
300 |
400 |
500 |
| 7.2 [mm/min] |
3131±1075 [N] |
3261±350 [N] |
2346±189[N] |
| 72 [mm/min] |
3344±766[N] |
3614±449[N] |
2395±270[N] |
Table 3.
Maximum tensile stress of Al6061 following exposure to T=300-500ᵒC [
25].
Table 3.
Maximum tensile stress of Al6061 following exposure to T=300-500ᵒC [
25].
| Temperature [C] |
300 |
400 |
500 |
|
280 |
200 |
220 |
|
Disclaimer/Publisher’s Note: The statements, opinions and data contained in all publications are solely those of the individual author(s) and contributor(s) and not of MDPI and/or the editor(s). MDPI and/or the editor(s) disclaim responsibility for any injury to people or property resulting from any ideas, methods, instructions or products referred to in the content. |
© 2024 by the authors. Licensee MDPI, Basel, Switzerland. This article is an open access article distributed under the terms and conditions of the Creative Commons Attribution (CC BY) license (http://creativecommons.org/licenses/by/4.0/).

