Submitted:
16 March 2024
Posted:
18 March 2024
You are already at the latest version
Abstract
Keywords:
1. Introduction
2. Materials and Methods
2.1. Mouse Study Design
2.2. Whole Body Composition Analysis
2.3. Tissue Extraction
2.4. Protein Extraction
2.5. Protein Quantification
2.6. Visceral Fat Tissue Harvest for Organ Culture
2.7. Adipocytokine Analysis from Organoid Cultures
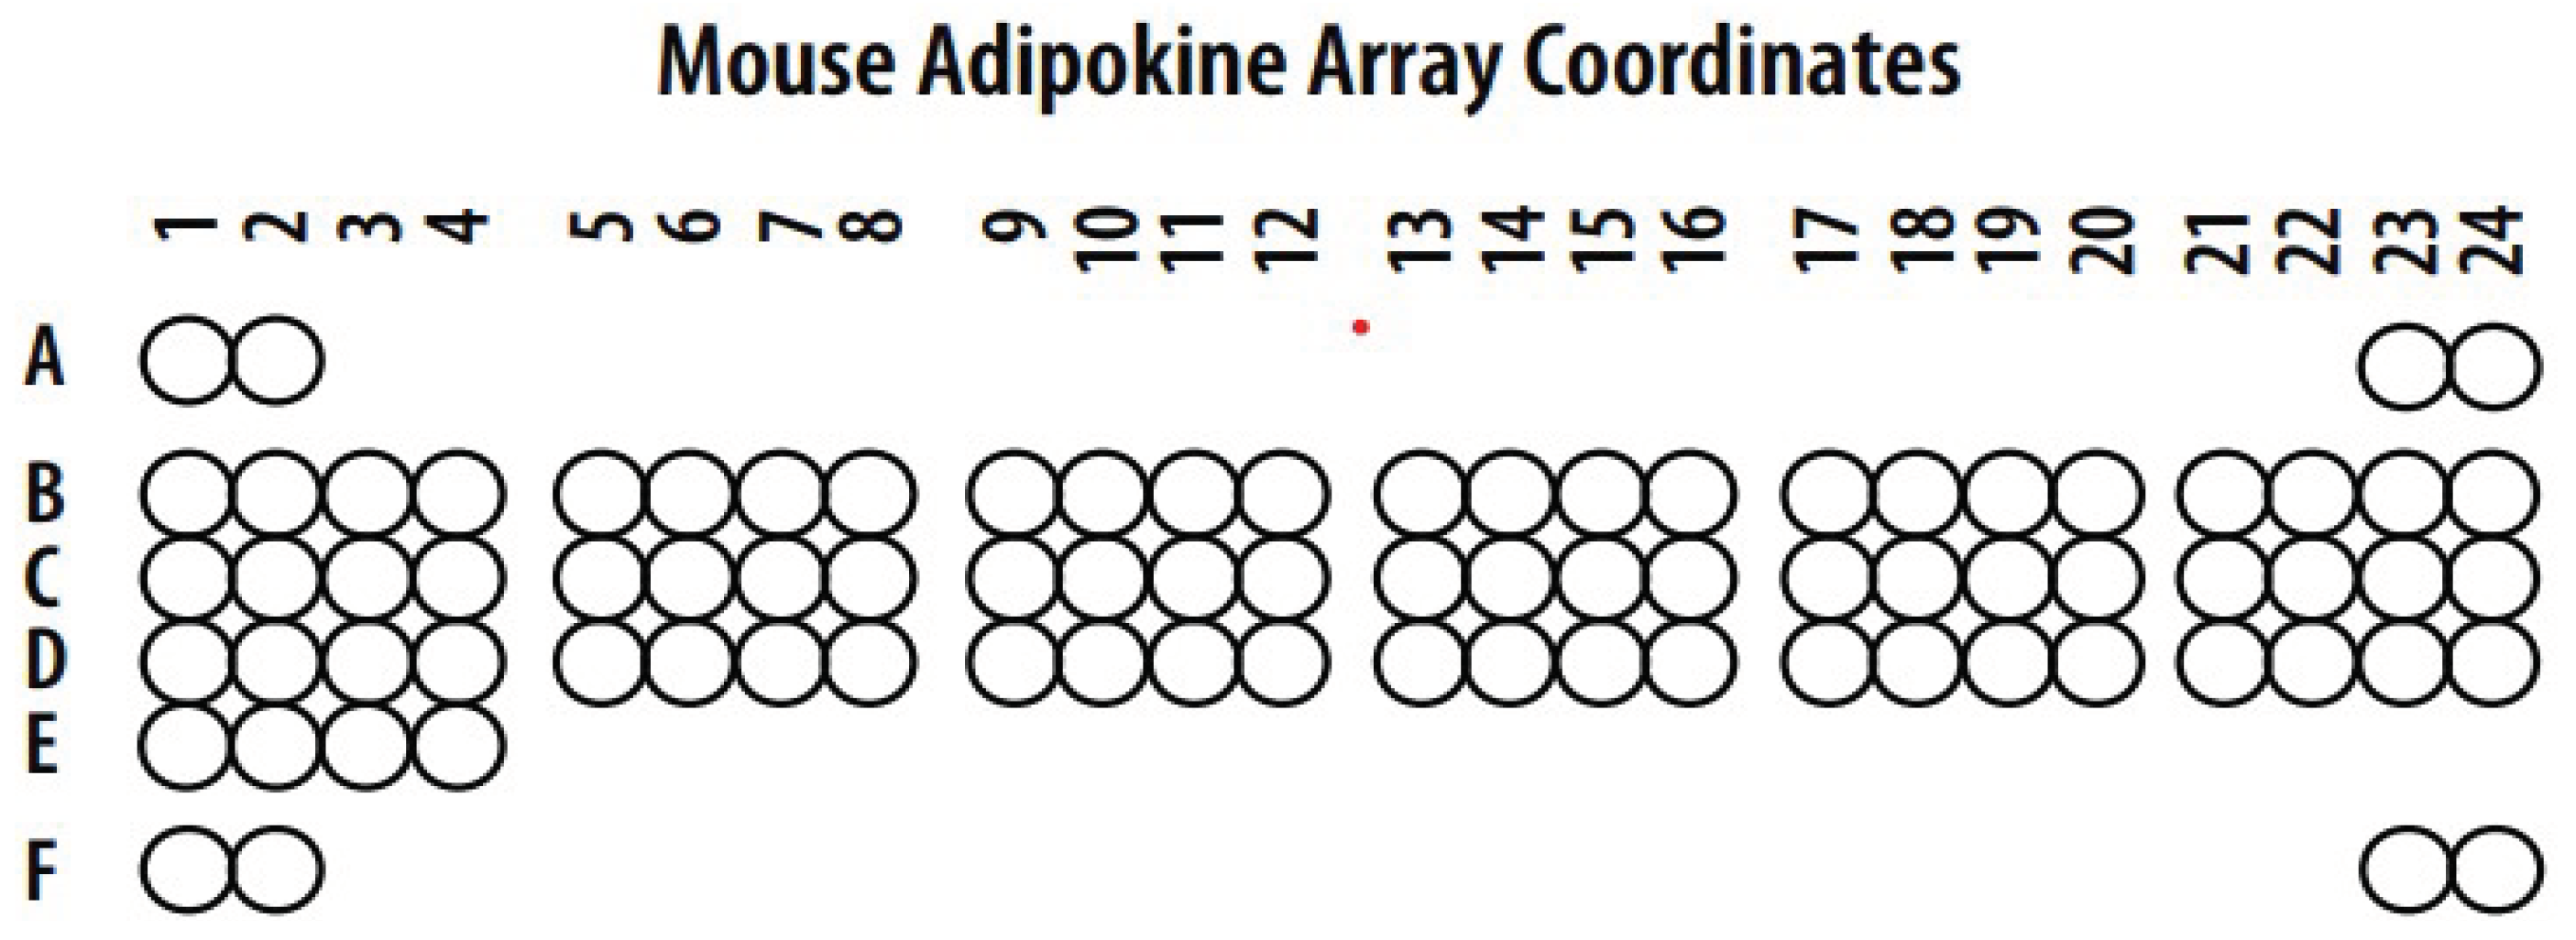
| Coordinate | Adipokine | Coordinate | Adipokine |
|---|---|---|---|
| A1, A2 | Reference spots | C15, C16 | IL-10 |
| A23, A24 | Reference spots | C17, C18 | IL-11 |
| B1, B2 | Adiponectin | C19, C20 | Leptin |
| B3, B4 | AgRP | C21, C22 | LIF |
| B5, B6 | ANGPT-L1 | C23, C24 | Lipocalin-2 |
| B7, B8 | C-Reactive Protein | D1, D2 | MCP-1 |
| B9, B10 | DPPIV | D3, D4 | M-CSF |
| B11, B12 | Endocan | D5, D6 | Oncostatin M |
| B13, B14 | Fetuin A | D7, D8 | Pentraxin 2 |
| B15, B16 | FGF Acidic | D9, D10 | Pentraxin-3 |
| B17, B18 | FGF-21 | D11, D12 | Pref-1 |
| B19, B20 | HGF | D13, D14 | RAGE |
| B21, B22 | ICAM-1 | D15, D16 | RANTES |
| B23, B24 | IGF-I | D17, D18 | RBP4 |
| C1, C2 | IGF-II | D19, D20 | Resistin |
| C3, C4 | IGFBP-1 | D21, D22 | Serpin E1 |
| C5, C6 | IGFBP-2 | D23, D24 | TIMP-1 |
| C7, C8 | IGFBP-3 | E1, E2 | TNF-α |
| C9, C10 | IGFBP-5 | E3, E4 | VEGF-A |
| C11, C12 | IGFBP-6 | F1, F2 | Reference Spots |
| C13, C14 | IL-6 | F23, F24 | PBS (negative Control) |
2.8. Adipocytokine Protein Levels from Flash-Frozen Tissue Samples
2.9. Statistical Analysis
3. Results
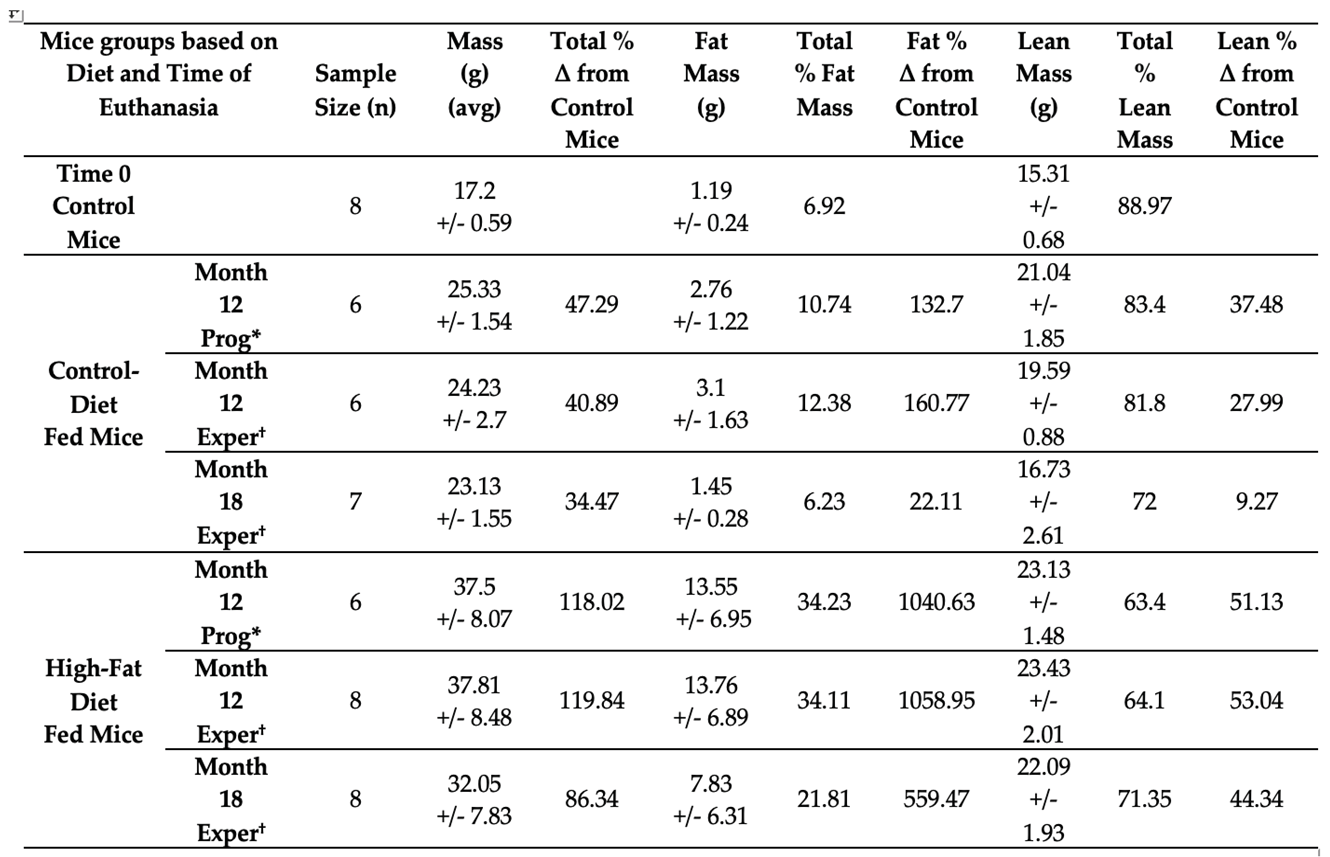
3.1. Changes in Weight and Body Composition in Control Fat and High-Fat Fed Mice
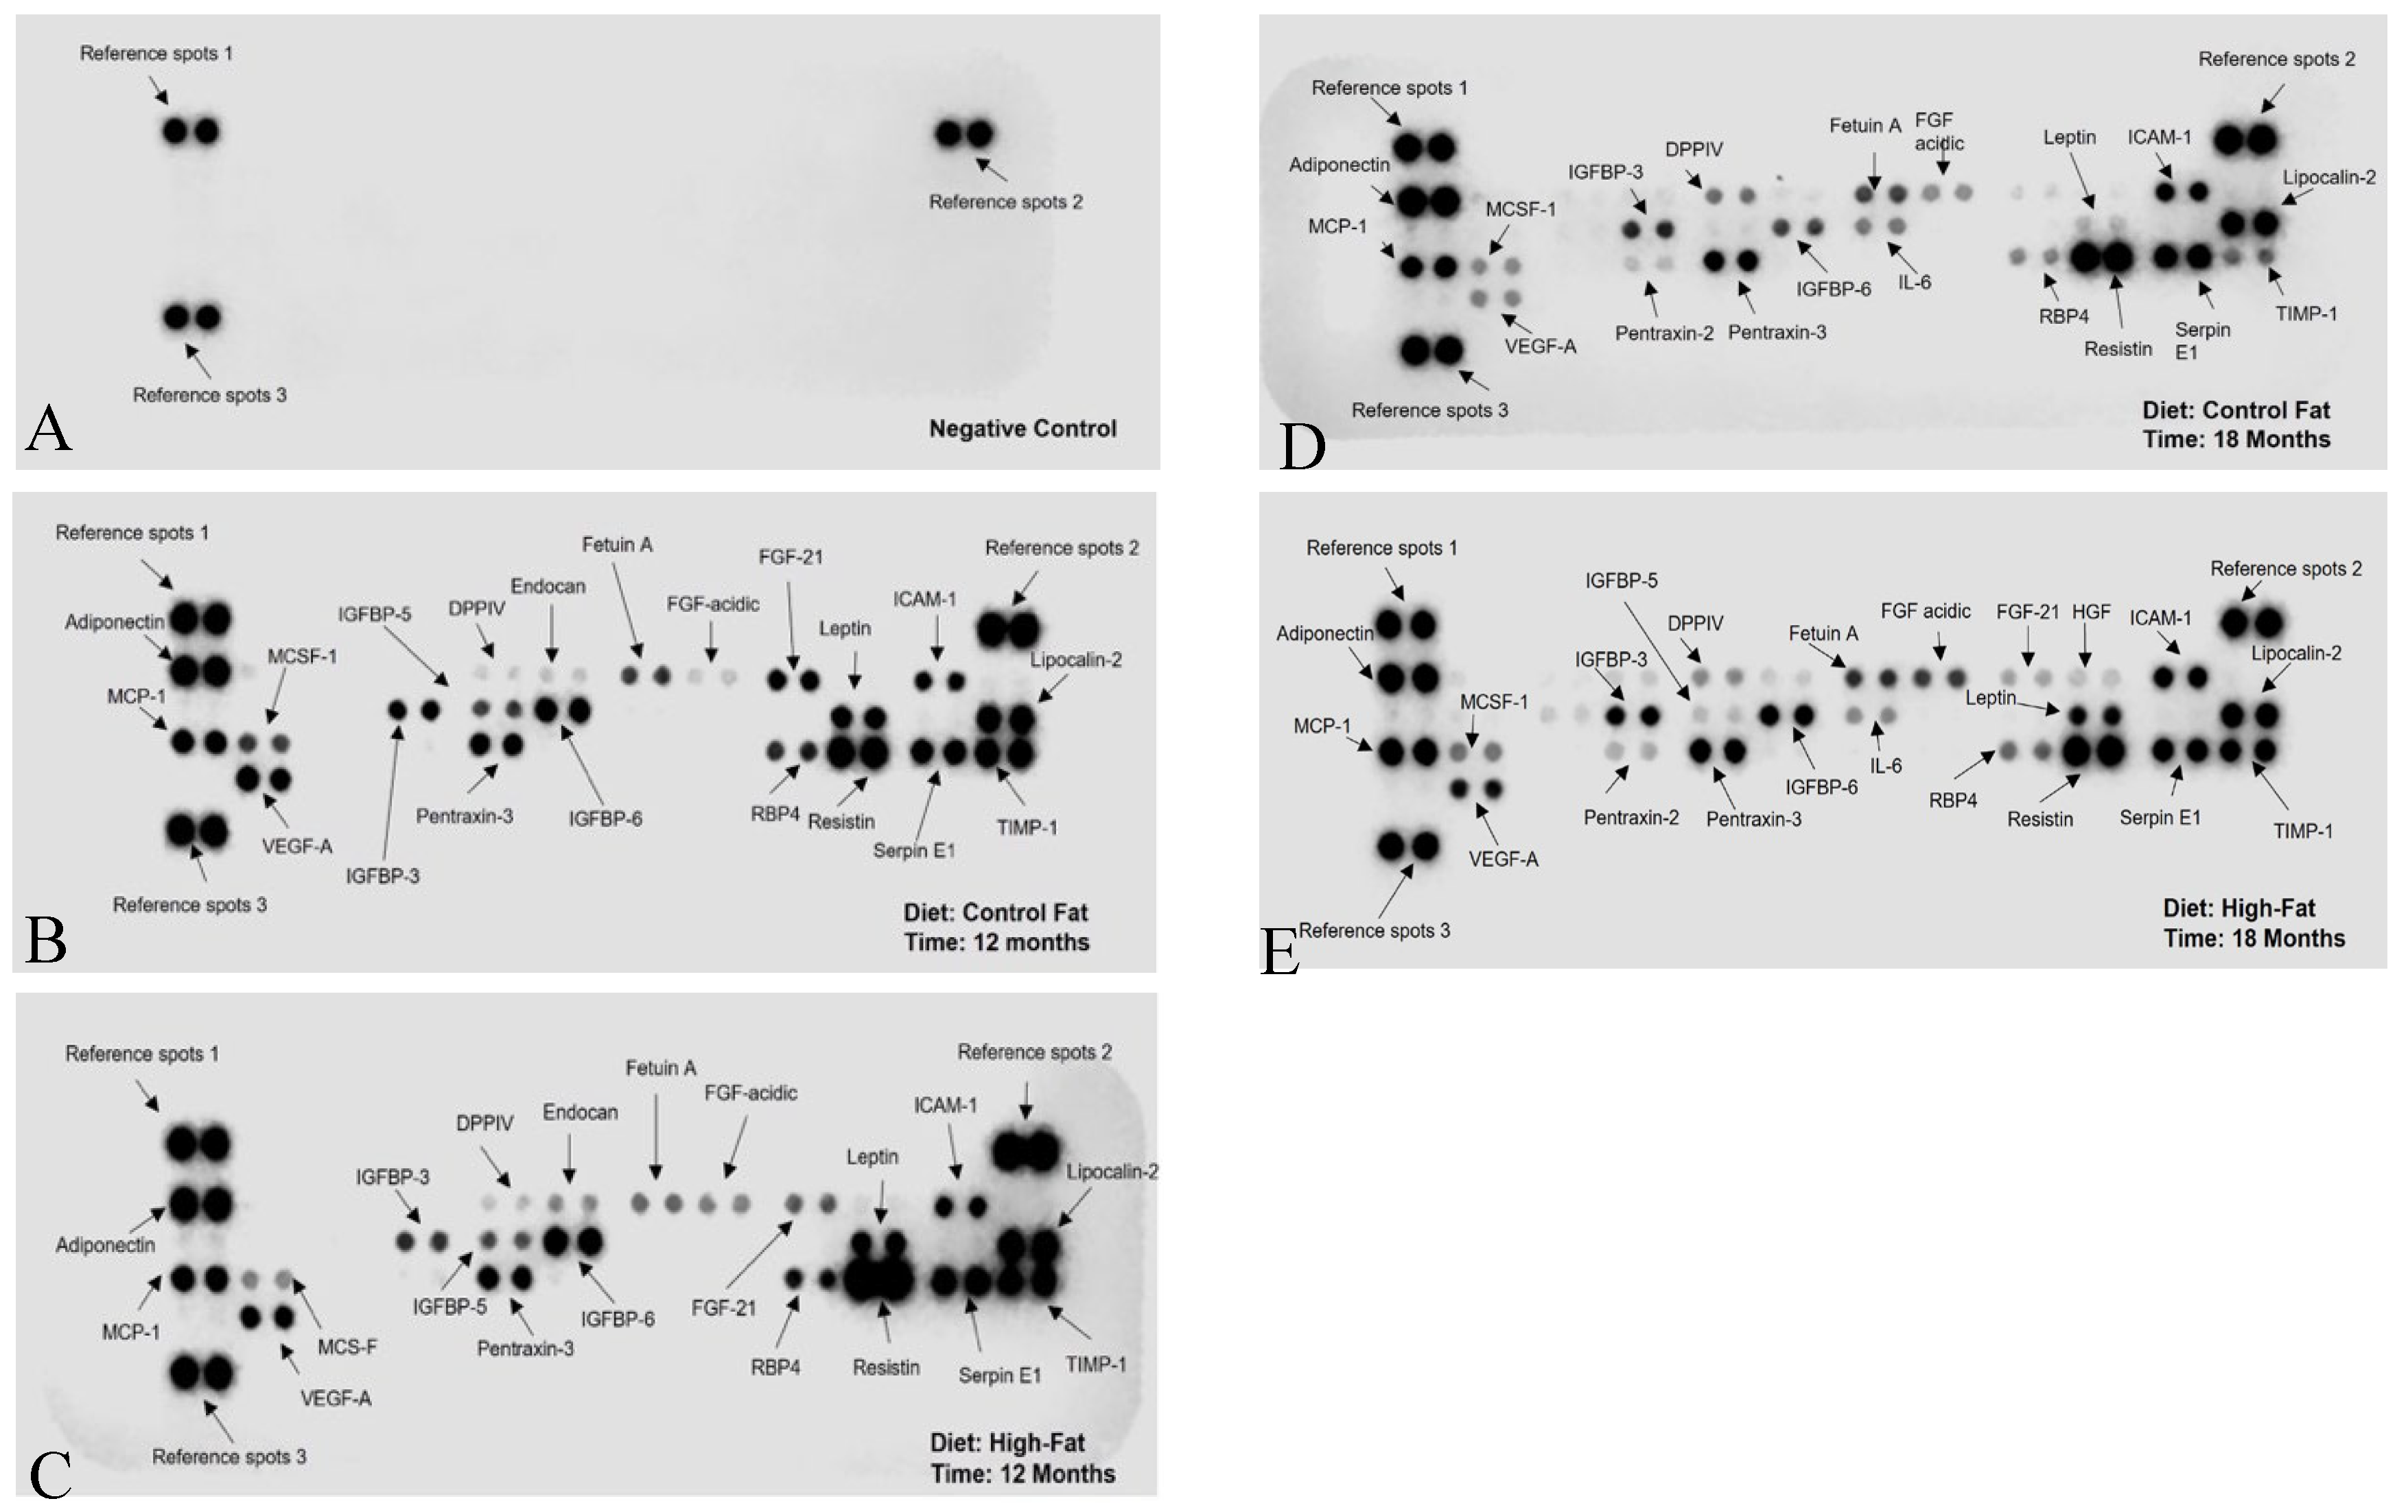
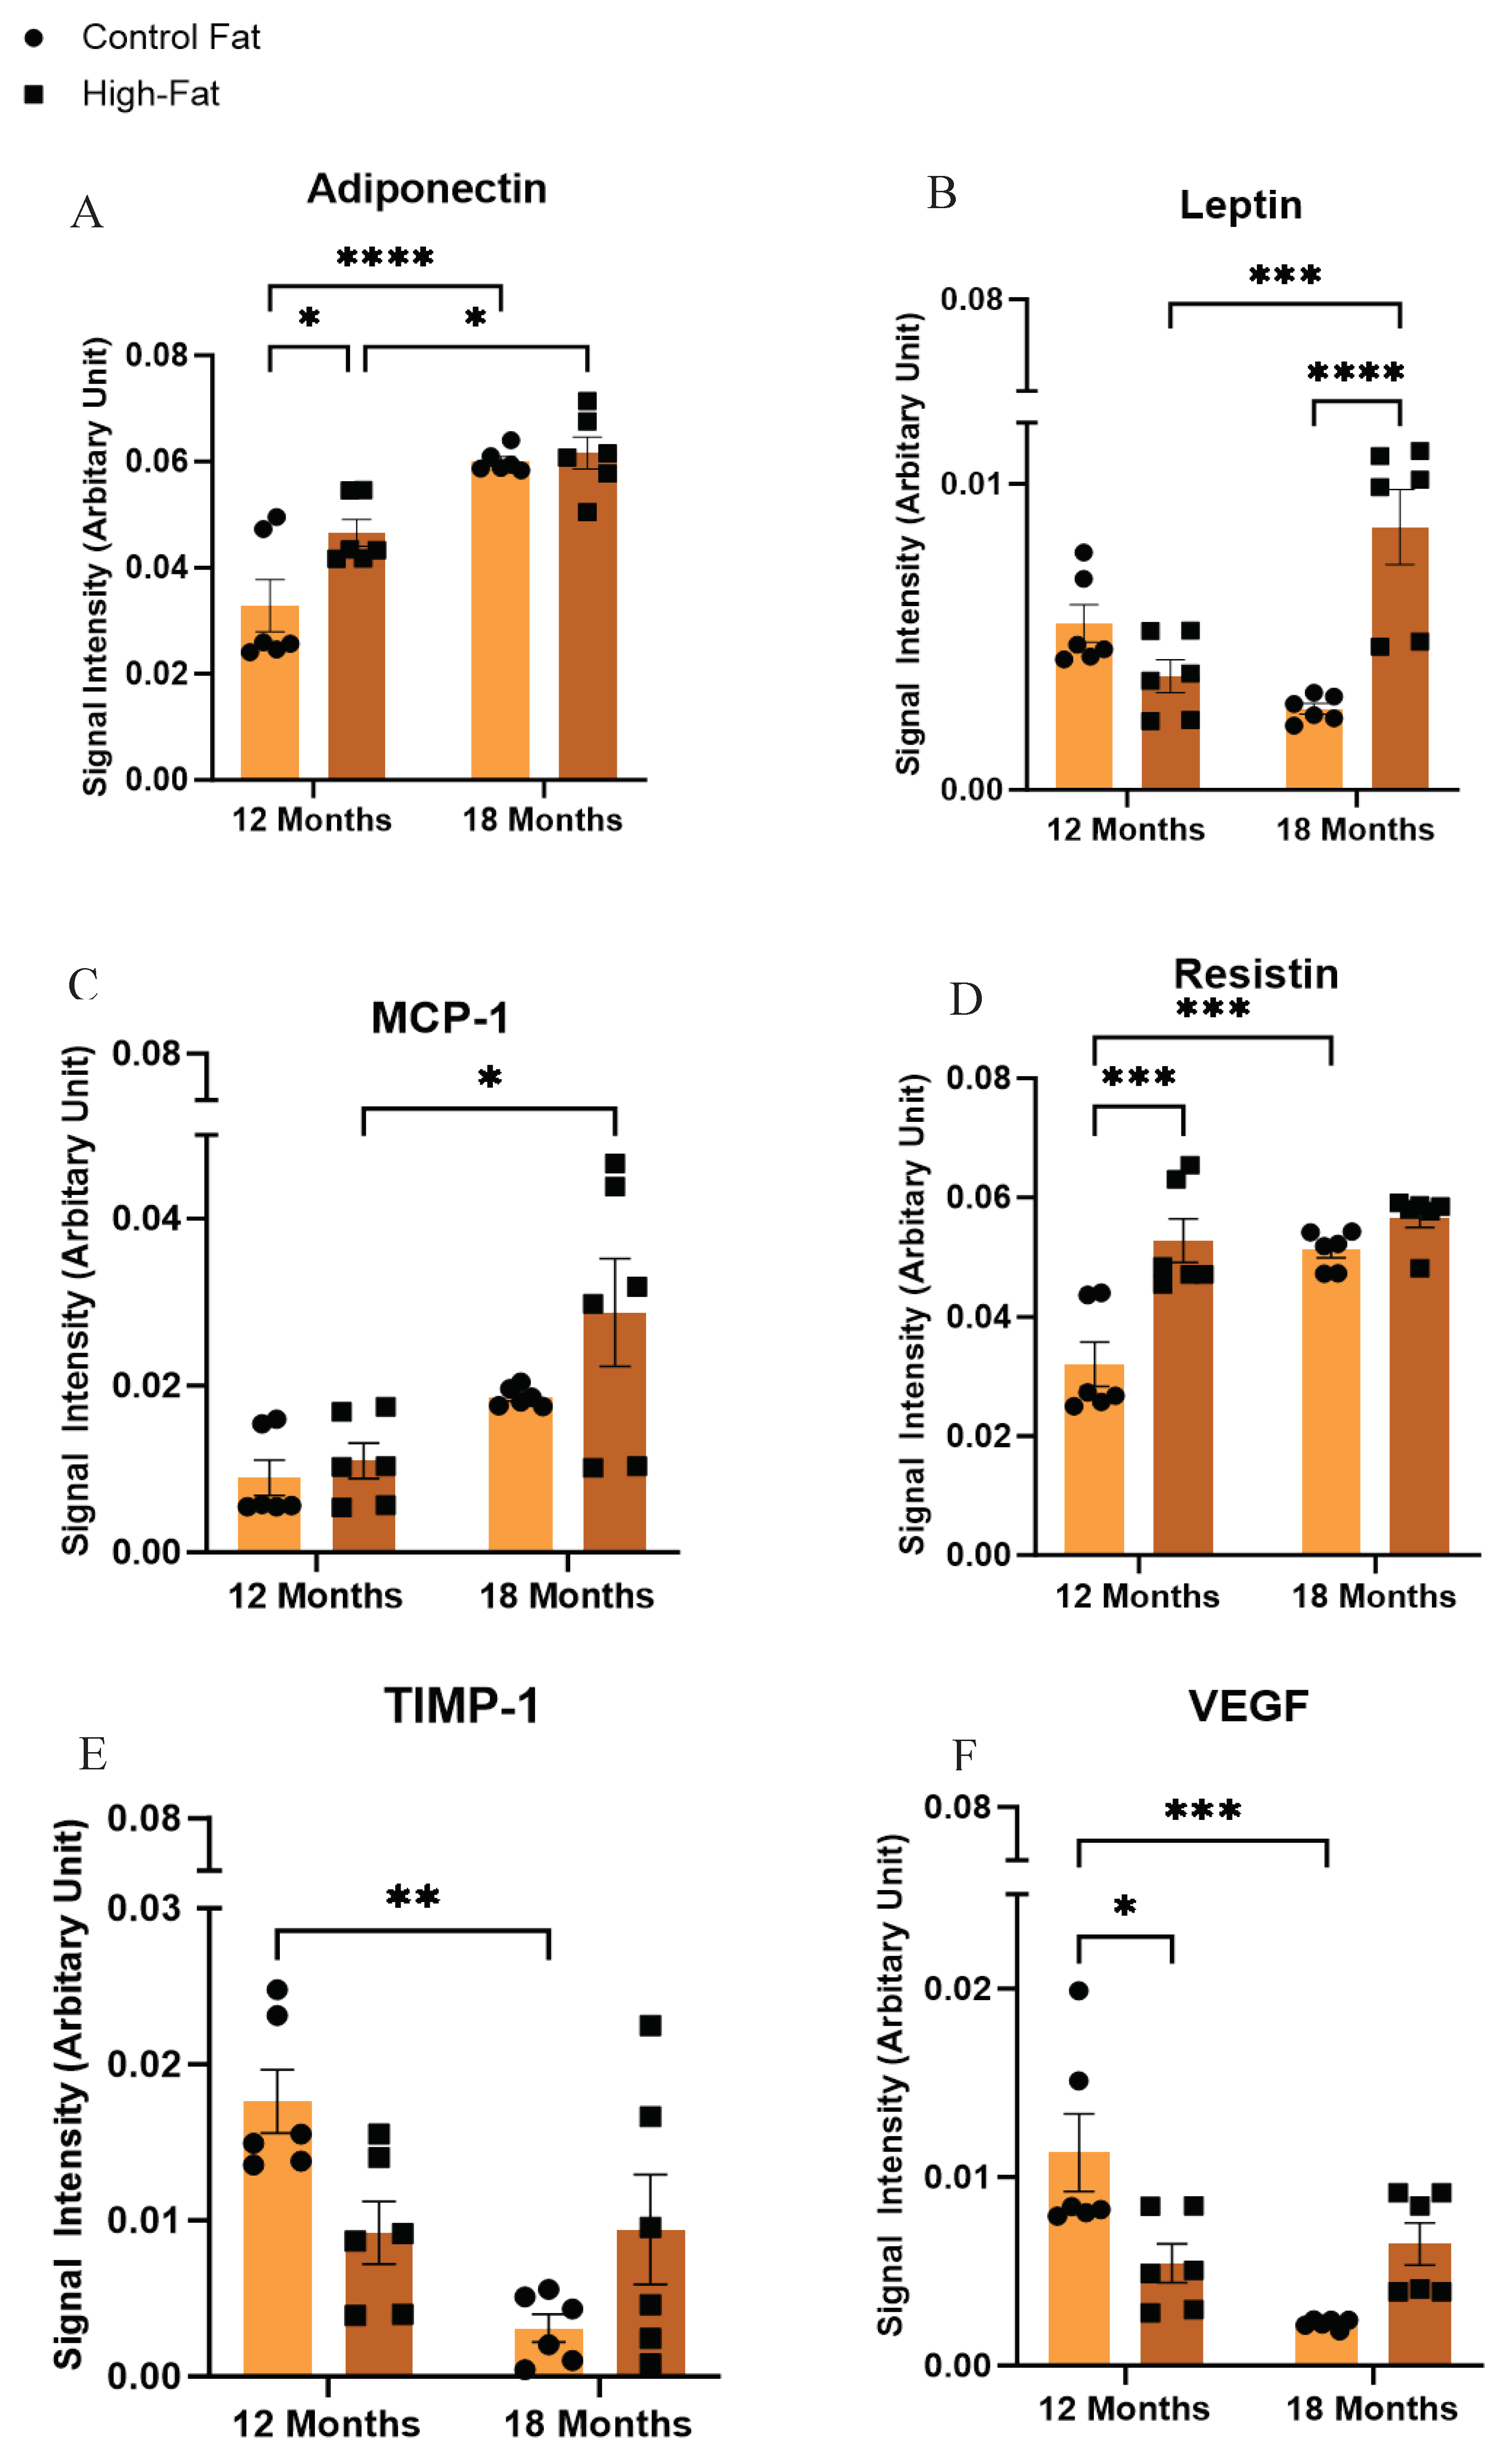
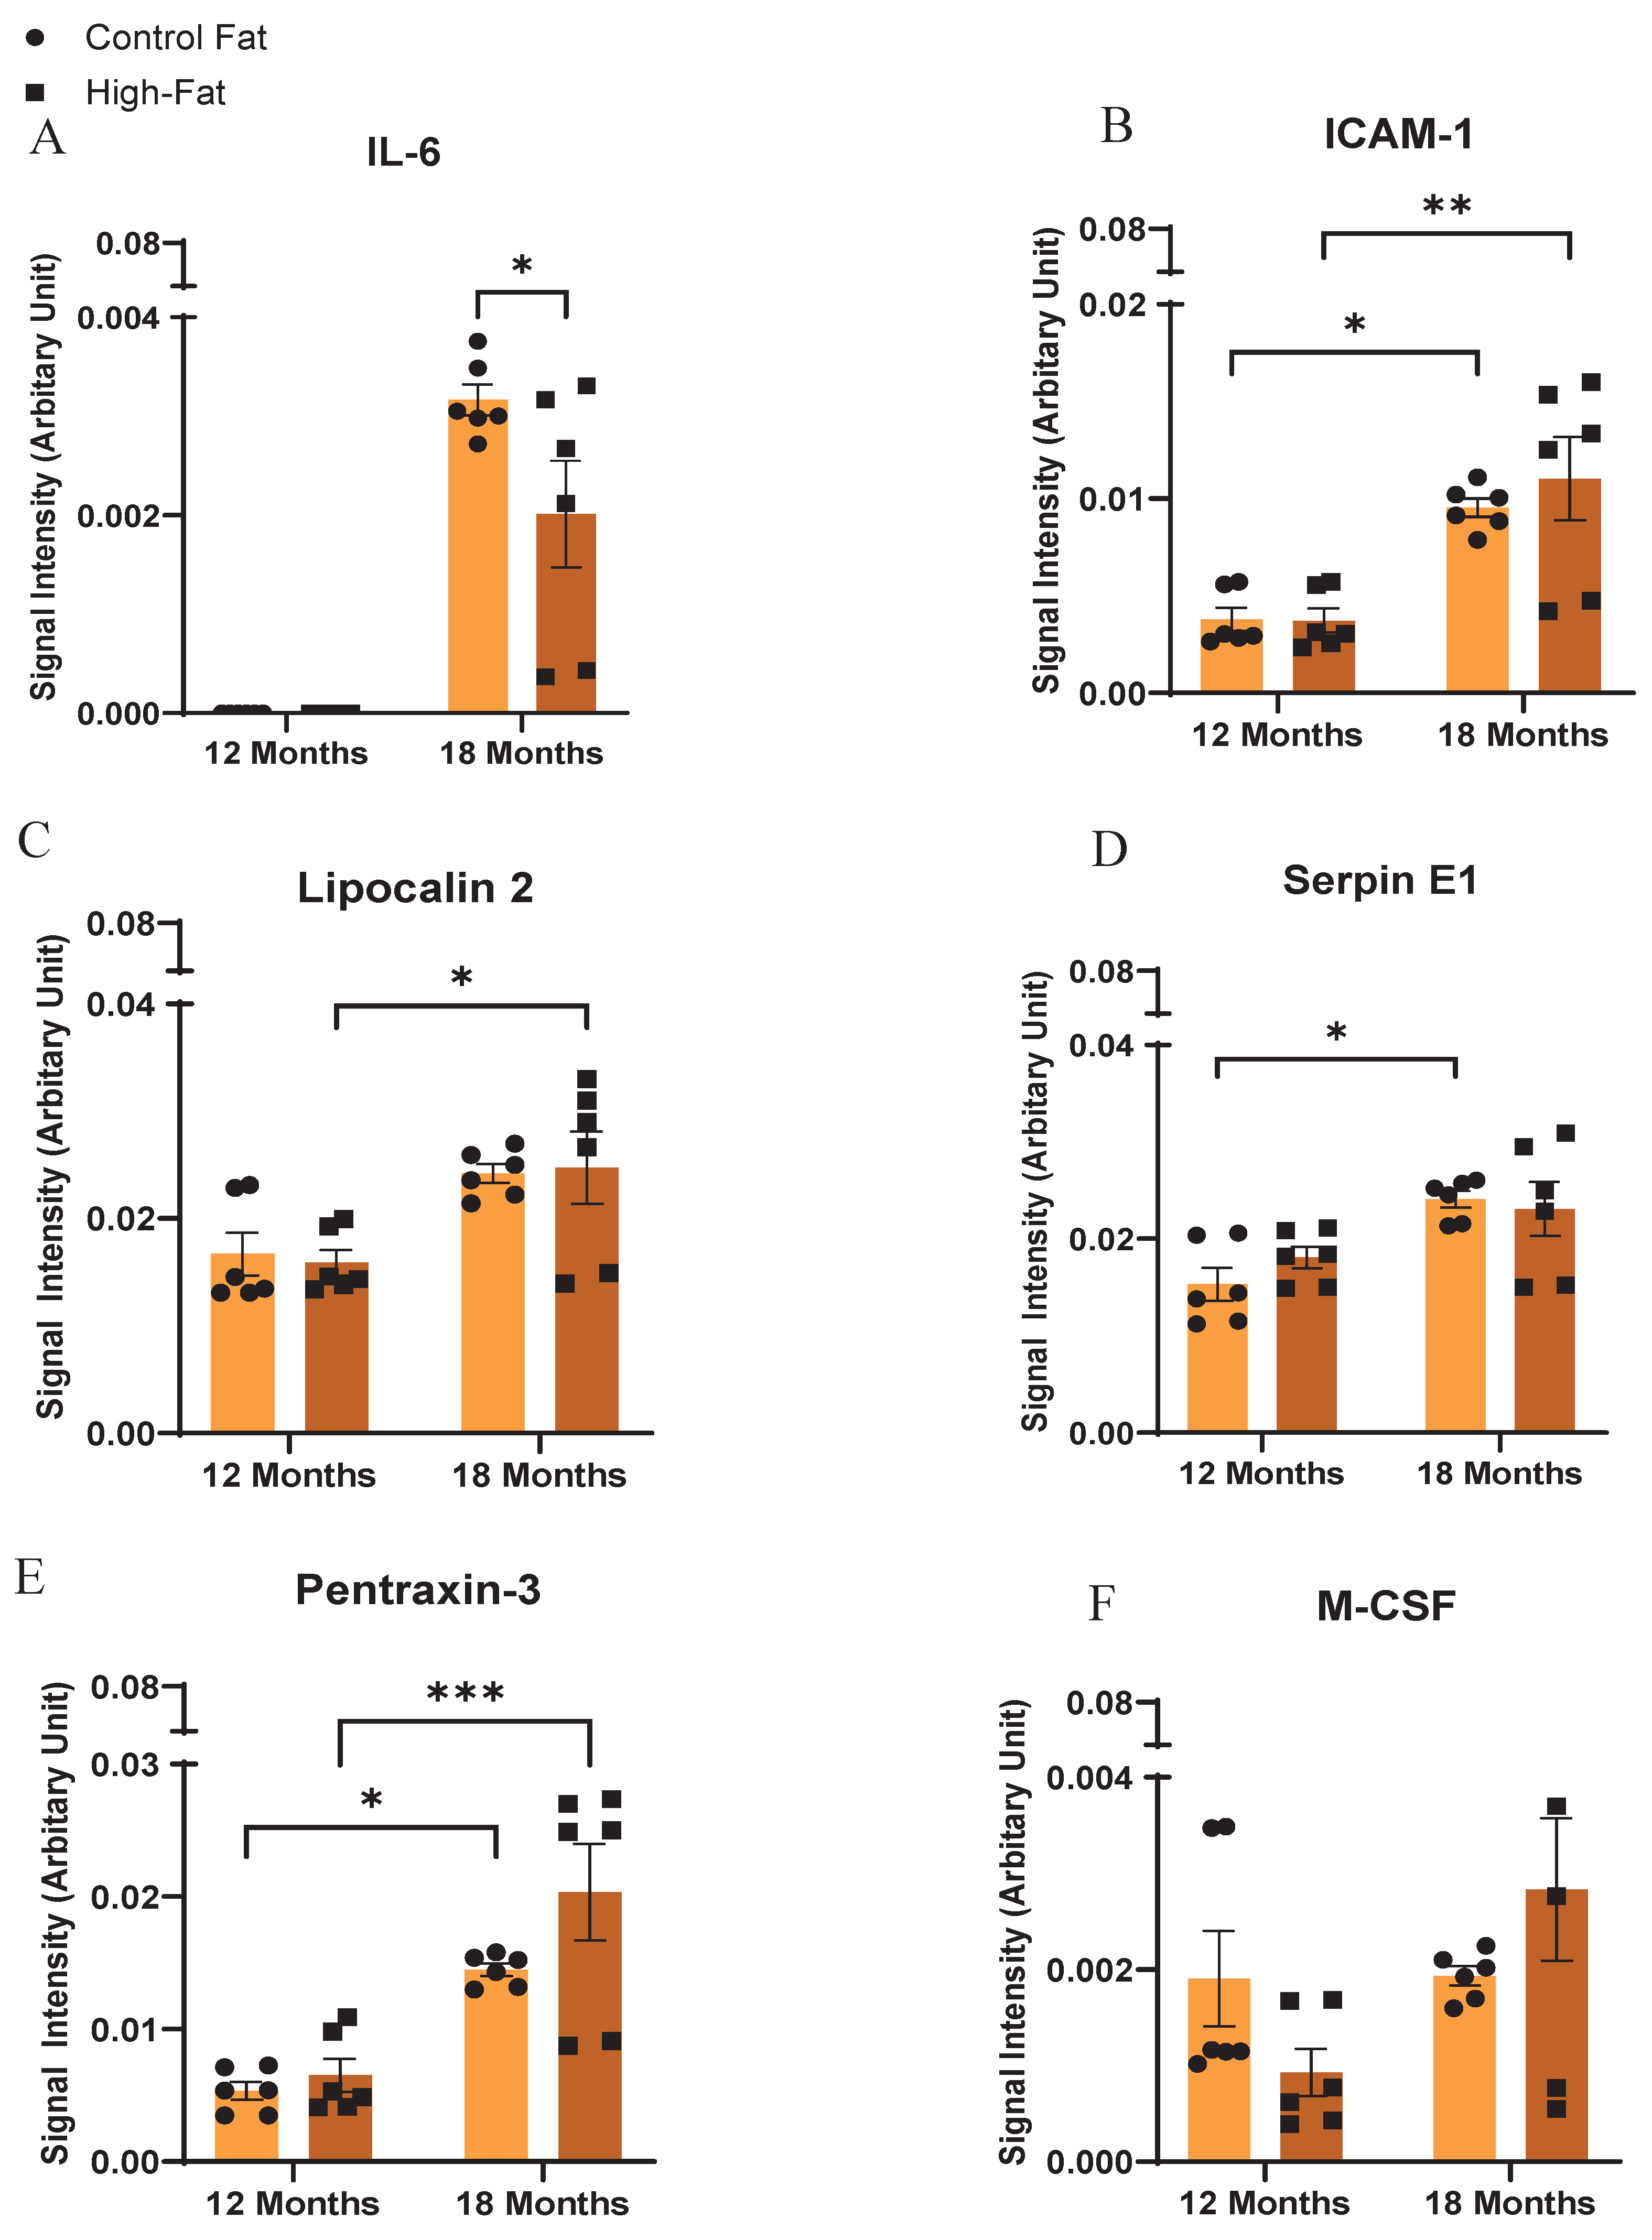
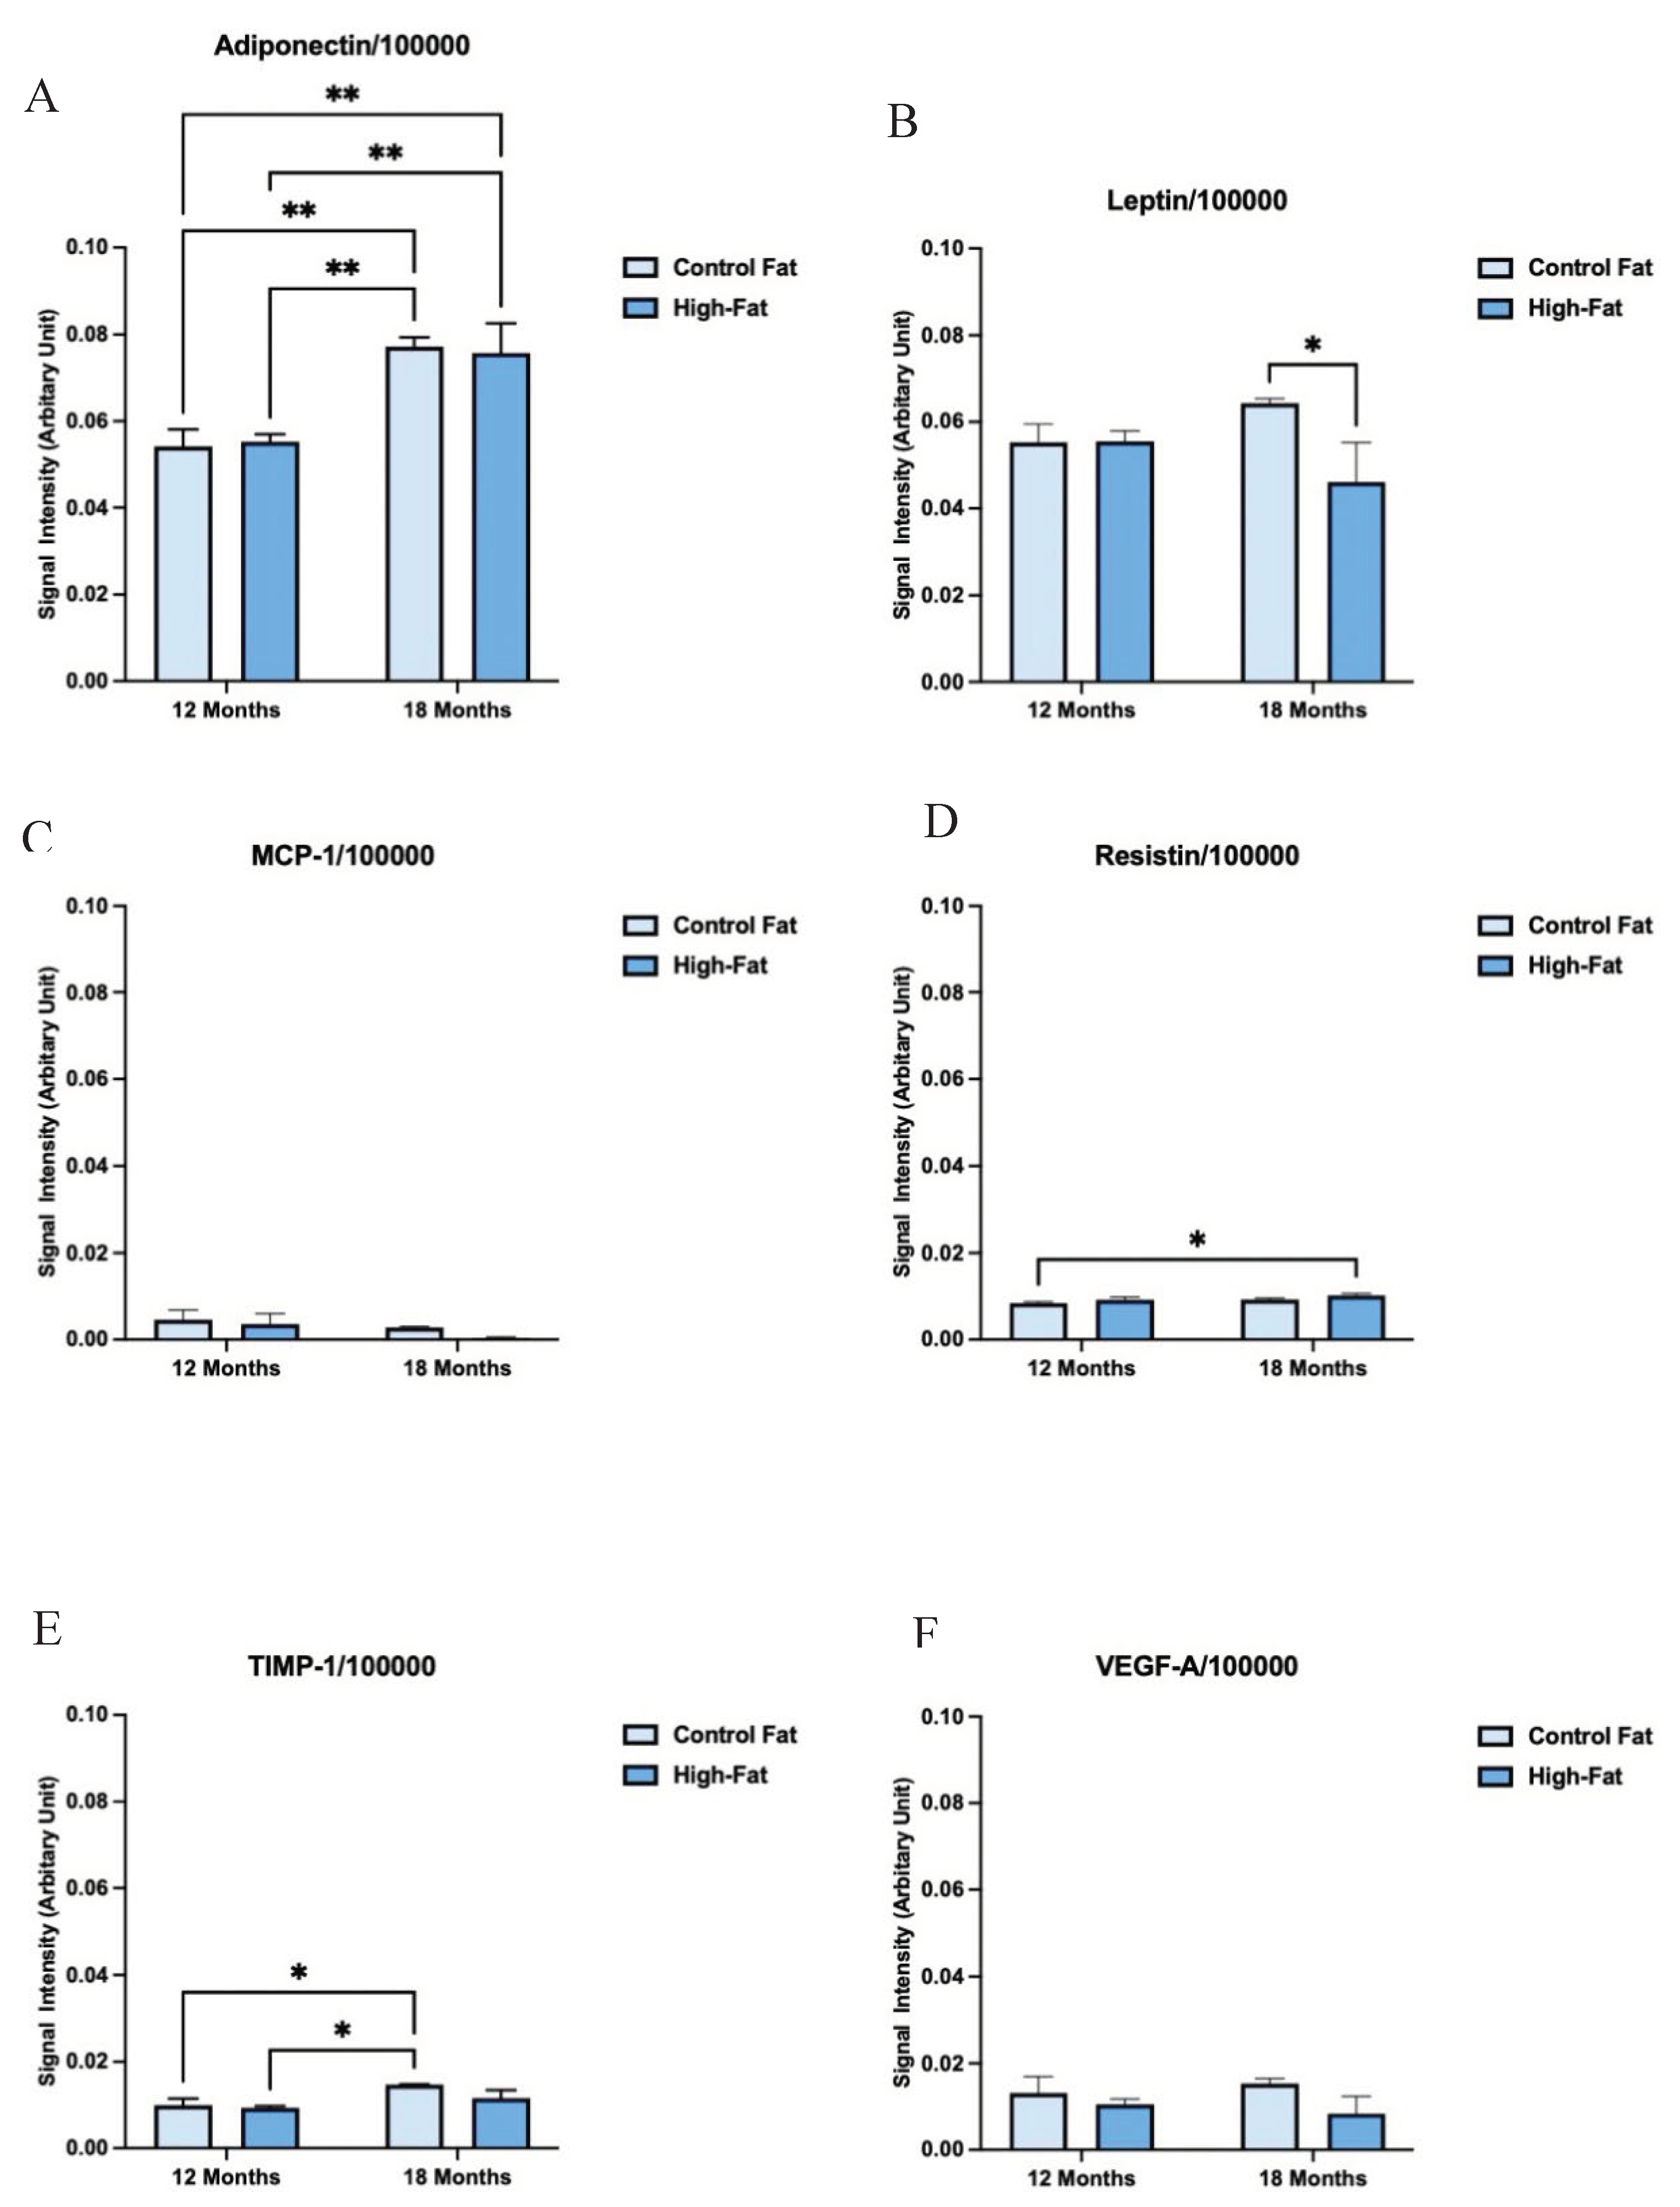
3.2. Secretome Profiles of Visceral Fat Harvested from High-Fat and Control Diet Fed C3H/HeJ Mice Differ Significantly with Diet and Aging
|
Adipocytokines |
Control Fat (Month 12) (Mean±SEM) |
High-Fat (Month 12) (Mean±SEM) |
Control Fat (Month 18) (Mean±SEM) |
High-Fat (Month 18) (Mean±SEM) |
|---|---|---|---|---|
| Ref Spot 1 | 0.039 ± 0.0023 | 0.043 ± 0.0021 | 0.056 ± 0.0004 | 0.050 ± 0.0020 |
| Ref Spot 2 | 0.043 ± 0.0023 | 0.042 ± 0.0016 | 0.049 ± 0.0004 | 0.047 ± 0.0019 |
| Adiponectin | 0.033 ± 0.0020 | 0.046 ± 0.0010 | 0.060 ± 0.0003 | 0.057 ± 0.0023 |
| ICAM-1 | 0.004 ± 0.0002 | 0.003 ± 0.0002 | 0.009 ± 0.0001 | 0.011 ± 0.0008 |
| IL-6 | 0 | 0 | 0.003 ± 6.36E-05 | 0.002 ± 0.0002 |
| Leptin | 0.005 ± 0.0002 | 0.003 ± 0.0002 | 0.002 ±7.10E-05 | 0.008 ± 0.0004 |
| Lipocalin-2 | 0.018 ± 0.0008 | 0.015 ± 0.0004 | 0.020 ± 0.0003 | 0.025 ± 0.0013 |
| MCP-1 | 0.009 ± 0.0008 | 0.011 ± 0.0008 | 0.019 ± 0.0001 | 0.028 ±0.0026 |
| MCS-F | 0.002 ± 0.0002 | 0.000 ± 9.95E-05 | 0.001 ± 4.11E-05 | 0.002 ± 0.0003 |
| Pentraxin-3 | 0.005 ± 0.0002 | 0.006 ± 0.0005 | 0.014 ± 0.0002 | 0.020 ± 0.0015 |
| RBP4 | 0.003 ± 0.0002 | 0.003 ± 0.0001 | 0.004 ± 0.0002 | 0.005 ± 0.0003 |
| Resistin | 0.032 ± 0.0015 | 0.050 ± 0.0015 | 0.051 ± 0.0005 | 0.048 ± 0.0025 |
| Serpin E1 | 0.015 ± 0.0007 | 0.018 ± 0.0004 | 0.024 ± 0.0003 | 0.023 ± 0.0011 |
| TIMP-1 | 0.017 ± 0.0008 | 0.009 ± 0.0008 | 0.003 ± 0.0003 | 0.009 ± 0.0014 |
| VEGF | 0.011 ± 0.0008 | 0.005 ± 0.0004 | 0.002 ± 3.86E-05 | 0.006 ± 0.0004 |
| Ref Spot 3 | 0.040 ± 0.0023 | 0.044 ± 0.0010 | 0.050 ± 0.0003 | 0.045 ± 0.0021 |
3.3. Adipocytokine Profiles of Flash-Frozen Visceral Fat Tissue Harvested from High-Fat and Control Diet Fed C3H/HeJ Mice Differ Significantly from Corresponding Organoid Cultured Samples
4. Discussion
| Aging | Adiponectin, Leptin, MCP-1, TIMP-1, VEGF, IL-6,ICAM-1, Lipocalin-2, Serpin E1, M-CSF |
| High Fat Diet | Adiponectin, Leptin, Resistin, TIMP-1, VEGF |
5. Conclusions
Author Contributions
Funding
Informed Consent Statement
Data Availability Statement
Acknowledgments
Conflicts of Interest
Appendix A
|
D20013102 |
D20013106 |
|
| Product # |
11 kcal% Fat Control Diet |
46 kcal% Fat High-Fat Diet |
| Ingredient (g) | ||
| Casein | 200 | 200 |
| L-Cystine | 3 | 3 |
| Corn Starch | 452.2 | 72.8 |
| Maltodextrin 10 | 75 | 100 |
| Sucrose | 175.21 | 175.21 |
| Cellulose | 50 | 50 |
| Soybean Oil | 25 | 25 |
| Lard | 0 | 0 |
| Beef Fat, Bunge | 20 | 177.5 |
| Mineral Mix S10026 (No Ca, P, K) | 0 | 0 |
| Mineral Mix S10026A (No Ca, P, K, Na, Cl) | 5 | 5 |
| Dicalcium Phosphate | 13 | 13 |
| Calcium Carbonate | 5.5 | 5.5 |
| Potassium Citrate, 1 H2O | 16.5 | 16.5 |
| Sodium Chloride | 2.546 | 2.546 |
| Vitamin Mix V10001 | 10 | 10 |
| Choline Bitartrate | 2 | 2 |
| Cholesterol | 0.6 | 0.49 |
| Yellow Dye #5, FD&C | 0 | 0 |
| Red Dye #40, FD&C | 0.05 | 0 |
| Blue Dye #1, FD&C | 0 | 0.05 |
| Total | 1055.606 | 845.798 |
| gm | ||
| Protein | 179.0 | 179.0 |
| Carbohydrate | 712.4 | 358.0 |
| Fat | 47.4 | 204.9 |
| Fiber | 50.0 | 50.0 |
| Cholesterol | 0.66 | 0.66 |
| gm% | ||
| Protein | 17.0 | 20.8 |
| Carbohydrate | 67.5 | 41.7 |
| Fat | 4.5 | 23.9 |
| Fiber | 4.7 | 5.8 |
| Cholesterol | 0.062 | 0.08 |
| kcals | ||
| Protein | 716.0 | 716.0 |
| Carbohydrate | 2849.6 | 1432.0 |
| Fat | 426.6 | 1844.1 |
| Total | 3992.2 | 3992.1 |
| kcal% | ||
| Protein | 18 | 18 |
| Carbohydrate | 71 | 36 |
| Fat | 11 | 46 |
| Total | 100 | 100 |
| kcal/gm | 3.8 | 4.6 |
| Linoleic Acid, gm/kg Diet (NRC Requirement is 6.8) | 12.9 | 21.9 |
| Arginine, gm/kg Diet (NRC Requirement is 3.0) | 5.6 | 6.9 |
| Histidine, gm/kg Diet (NRC Requirement is 2.0) | 4.3 | 5.2 |
| Isoleucine, gm/kg Diet (NRC Requirement is 4.0) | 7.1 | 8.7 |
| Leucine, gm/kg Diet (NRC Requirement is 7.0) | 14.9 | 18.3 |
| Valine, gm/kg Diet (NRC Requirement is 5.0) | 8.7 | 10.7 |
| Threonine, gm/kg Diet (NRC Requirement is 4.0) | 6.7 | 8.3 |
| Lysine, gm/kg Diet (NRC Requirement is 4.0) | 12.3 | 15.1 |
| Methionine, gm/kg Diet (NRC Requirement is 5.0; half can be Cystine) | 4.7 | 5.8 |
| Cystine, gm/kg Diet (NRC Requirement is - see above) | 3.0 | 3.6 |
| Phenylalanine, gm/kg Diet (NRC Requirement is 7.6; half can be Tyrosine) | 7.9 | 9.7 |
| Tyrosine, gm/kg Diet (NRC Requirement is - see above) | 8.5 | 10.5 |
| Tryptophan, gm/kg Diet (NRC Requirement is 1.0) | 2.0 | 2.4 |
| Sodium (mg/kg diet) | 979 | 1203 |
| Sodium (mg/3982.5 kcal) | 1033 | 1033 |
References
- Carswell, K.A.; Lee, M.J.; Fried, S.K. Culture of isolated human adipocytes and isolated adipose tissue. Methods Mol Biol 2012, 806, 203–214. [Google Scholar] [CrossRef]
- Poddar, M.; Chetty, Y.; Chetty, V.T. How does obesity affect the endocrine system? A narrative review. Clin Obes 2017, 7, 136–144. [Google Scholar] [CrossRef]
- Dufau, J.; Shen, J.X.; Couchet, M.; De Castro Barbosa, T.; Mejhert, N.; Massier, L.; Griseti, E.; Mouisel, E.; Amri, E.Z.; Lauschke, V.M.; et al. In vitro and ex vivo models of adipocytes. Am J Physiol Cell Physiol 2021, 320, C822–c841. [Google Scholar] [CrossRef] [PubMed]
- Redinger, R.N. The pathophysiology of obesity and its clinical manifestations. Gastroenterol Hepatol (N Y) 2007, 3, 856–863. [Google Scholar]
- Blüher, M. Obesity: global epidemiology and pathogenesis. Nat Rev Endocrinol 2019, 15, 288–298. [Google Scholar] [CrossRef]
- Després, J.P.; Lemieux, I. Abdominal obesity and metabolic syndrome. Nature 2006, 444, 881–887. [Google Scholar] [CrossRef] [PubMed]
- Qatanani, M.; Lazar, M.A. Mechanisms of obesity-associated insulin resistance: many choices on the menu. Genes Dev 2007, 21, 1443–1455. [Google Scholar] [CrossRef]
- Mubtasim, N.; Moustaid-Moussa, N.; Gollahon, L. The Complex Biology of the Obesity-Induced, Metastasis-Promoting Tumor Microenvironment in Breast Cancer. Int J Mol Sci 2022, 23. [Google Scholar] [CrossRef] [PubMed]
- Wisse, B.E.; Kim, F.; Schwartz, M.W. Physiology. An integrative view of obesity. Science 2007, 318, 928–929. [Google Scholar] [CrossRef]
- Lissner, L.; Heitmann, B.L. Dietary fat and obesity: evidence from epidemiology. Eur J Clin Nutr 1995, 49, 79–90. [Google Scholar]
- Golay, A.; Bobbioni, E. The role of dietary fat in obesity. Int J Obes Relat Metab Disord 1997, 21 Suppl 3, S2–11. [Google Scholar]
- Mancuso, P.; Bouchard, B. The Impact of Aging on Adipose Function and Adipokine Synthesis. Front Endocrinol (Lausanne) 2019, 10, 137. [Google Scholar] [CrossRef]
- Varghese, M.; Song, J.; Singer, K. Age and Sex: Impact on adipose tissue metabolism and inflammation. Mech Ageing Dev 2021, 199, 111563. [Google Scholar] [CrossRef]
- Ou, M.Y.; Zhang, H.; Tan, P.C.; Zhou, S.B.; Li, Q.F. Adipose tissue aging: mechanisms and therapeutic implications. Cell Death Dis 2022, 13, 300. [Google Scholar] [CrossRef] [PubMed]
- Peek, V.; Neumann, E.; Inoue, T.; Koenig, S.; Pflieger, F.J.; Gerstberger, R.; Roth, J.; Matsumura, K.; Rummel, C. Age-Dependent Changes of Adipokine and Cytokine Secretion From Rat Adipose Tissue by Endogenous and Exogenous Toll-Like Receptor Agonists. Front Immunol 2020, 11, 1800. [Google Scholar] [CrossRef]
- Fontana, L.; Eagon, J.C.; Trujillo, M.E.; Scherer, P.E.; Klein, S. Visceral fat adipokine secretion is associated with systemic inflammation in obese humans. Diabetes 2007, 56, 1010–1013. [Google Scholar] [CrossRef] [PubMed]
- Castro-Barquero, S.; Casas, R.; Rimm, E.B.; Tresserra-Rimbau, A.; Romaguera, D.; Martínez, J.A.; Salas-Salvadó, J.; Martínez-González, M.A.; Vidal, J.; Ruiz-Canela, M.; et al. Loss of Visceral Fat is Associated with a Reduction in Inflammatory Status in Patients with Metabolic Syndrome. Mol Nutr Food Res 2023, 67, e2200264. [Google Scholar] [CrossRef]
- Cobos-Palacios, L.; Ruiz-Moreno, M.I.; Vilches-Perez, A.; Vargas-Candela, A.; Muñoz-Úbeda, M.; Benítez Porres, J.; Navarro-Sanz, A.; Lopez-Carmona, M.D.; Sanz-Canovas, J.; Perez-Belmonte, L.M.; et al. Metabolically healthy obesity: Inflammatory biomarkers and adipokines in elderly population. PLoS One 2022, 17, e0265362. [Google Scholar] [CrossRef]
- Cobos-Palacios, L.; Muñoz-Úbeda, M.; Gallardo-Escribano, C.; Ruiz-Moreno, M.I.; Vilches-Pérez, A.; Vargas-Candela, A.; Leiva-Gea, I.; Tinahones, F.J.; Gómez-Huelgas, R.; Bernal-López, M.R. Adipokines Profile and Inflammation Biomarkers in Prepubertal Population with Obesity and Healthy Metabolic State. Children (Basel) 2022, 9. [Google Scholar] [CrossRef] [PubMed]
- Senkus, K.E.; Crowe-White, K.M.; Bolland, A.C.; Locher, J.L.; Ard, J.D. Changes in Adiponectin:Leptin ratio among older adults with obesity following a 12-month exercise and diet intervention. Nutr Diabetes 2022, 12, 30. [Google Scholar] [CrossRef]
- Oraha, J.; Enriquez, R.F.; Herzog, H.; Lee, N.J. Sex-specific changes in metabolism during the transition from chow to high-fat diet feeding are abolished in response to dieting in C57BL/6J mice. Int J Obes (Lond) 2022, 46, 1749–1758. [Google Scholar] [CrossRef] [PubMed]
- Shen, J.X.; Couchet, M.; Dufau, J.; de Castro Barbosa, T.; Ulbrich, M.H.; Helmstädter, M.; Kemas, A.M.; Zandi Shafagh, R.; Marques, M.A.; Hansen, J.B.; et al. 3D Adipose Tissue Culture Links the Organotypic Microenvironment to Improved Adipogenesis. Adv Sci (Weinh) 2021, 8, e2100106. [Google Scholar] [CrossRef] [PubMed]
- Hales, C.M.; Carroll, M.D.; Fryar, C.D.; Ogden, C.L. Prevalence of Obesity and Severe Obesity Among Adults: United States, 2017-2018. NCHS Data Brief 2020, 1–8. [Google Scholar]
- Neuhouser, M.L.; Aragaki, A.K.; Prentice, R.L.; Manson, J.E.; Chlebowski, R.; Carty, C.L.; Ochs-Balcom, H.M.; Thomson, C.A.; Caan, B.J.; Tinker, L.F.; et al. Overweight, Obesity, and Postmenopausal Invasive Breast Cancer Risk: A Secondary Analysis of the Women’s Health Initiative Randomized Clinical Trials. JAMA Oncol 2015, 1, 611–621. [Google Scholar] [CrossRef] [PubMed]
- Faulkner, J.L. Obesity-associated cardiovascular risk in women: hypertension and heart failure. Clin Sci (Lond) 2021, 135, 1523–1544. [Google Scholar] [CrossRef]
- Hruby, A.; Manson, J.E.; Qi, L.; Malik, V.S.; Rimm, E.B.; Sun, Q.; Willett, W.C.; Hu, F.B. Determinants and Consequences of Obesity. Am J Public Health 2016, 106, 1656–1662. [Google Scholar] [CrossRef]
- Sclafani, A. Animal models of obesity: classification and characterization. Int J Obes 1984, 8, 491–508. [Google Scholar]
- Hariri, N.; Thibault, L. High-fat diet-induced obesity in animal models. Nutr Res Rev 2010, 23, 270–299. [Google Scholar] [CrossRef]
- Surwit, R.S.; Feinglos, M.N.; Rodin, J.; Sutherland, A.; Petro, A.E.; Opara, E.C.; Kuhn, C.M.; Rebuffé-Scrive, M. Differential effects of fat and sucrose on the development of obesity and diabetes in C57BL/6J and A/J mice. Metabolism 1995, 44, 645–651. [Google Scholar] [CrossRef]
- Siersbæk, M.S.; Ditzel, N.; Hejbøl, E.K.; Præstholm, S.M.; Markussen, L.K.; Avolio, F.; Li, L.; Lehtonen, L.; Hansen, A.K.; Schrøder, H.D.; et al. C57BL/6J substrain differences in response to high-fat diet intervention. Sci Rep 2020, 10, 14052. [Google Scholar] [CrossRef] [PubMed]
- Fixe, P.; Praloran, V. M-CSF: haematopoietic growth factor or inflammatory cytokine? Cytokine 1998, 10, 32–37. [Google Scholar] [CrossRef] [PubMed]
- Bui, T.M.; Wiesolek, H.L.; Sumagin, R. ICAM-1: A master regulator of cellular responses in inflammation, injury resolution, and tumorigenesis. J Leukoc Biol 2020, 108, 787–799. [Google Scholar] [CrossRef] [PubMed]
- Bruunsgaard, H.; Ladelund, S.; Pedersen, A.N.; Schroll, M.; Jørgensen, T.; Pedersen, B.K. Predicting death from tumour necrosis factor-alpha and interleukin-6 in 80-year-old people. Clin Exp Immunol 2003, 132, 24–31. [Google Scholar] [CrossRef] [PubMed]
- Gordon, C.J.; Rowsey, P.J.; Bishop, B.L.; Ward, W.O.; Macphail, R.C. Serum biomarkers of aging in the Brown Norway rat. Exp Gerontol 2011, 46, 953–957. [Google Scholar] [CrossRef]
- Kwon, H.J.; Sung, B.K.; Kim, J.W.; Lee, J.H.; Kim, N.D.; Yoo, M.A.; Kang, H.S.; Baek, H.S.; Bae, S.J.; Choi, J.S.; et al. The effect of lipopolysaccharide on enhanced inflammatory process with age: Modulation of NF-κB. J Am Aging Assoc 2001, 24, 163–171. [Google Scholar] [CrossRef]
- Kovner, I.; Taicher, G.Z.; Mitchell, A.D. Calibration and validation of EchoMRI™ whole body composition analysis based on chemical analysis of piglets, in comparison with the same for DXA. Int J Body Compos Res 2010, 8, 17–29. [Google Scholar]
- Jones, A.S.; Johnson, M.S.; Nagy, T.R. Validation of quantitative magnetic resonance for the determination of body composition of mice. Int J Body Compos Res 2009, 7, 67–72. [Google Scholar]
- Tinsley, F.C.; Taicher, G.Z.; Heiman, M.L. Evaluation of a quantitative magnetic resonance method for mouse whole body composition analysis. Obes Res 2004, 12, 150–160. [Google Scholar] [CrossRef]
- Mandarim-de-Lacerda, C.A.; Del Sol, M.; Vásquez, B.; Aguila, M.B. Mice as an animal model for the study of adipose tissue and obesity. Int J Morphol 2021, 39, 1521–1528. [Google Scholar] [CrossRef]
- O'rourke, R.W.; Metcalf, M.D.; White, A.E.; Madala, A.; Winters, B.R.; Maizlin, I.I.; Jobe, B.A.; Roberts, C.T.; Slifka, M.K.; Marks, D.L. Depot-specific differences in inflammatory mediators and a role for NK cells and IFN-gamma in inflammation in human adipose tissue. Int J Obes (Lond) 2009, 33, 978–990. [Google Scholar] [CrossRef]
- Amitani, M.; Asakawa, A.; Amitani, H.; Inui, A. The role of Leptin in the control of insulin-glucose axis. Front Neurosci 2013, 7, 51. [Google Scholar] [CrossRef]
- Yoshimura, T. The chemokine MCP-1 (CCL2) in the host interaction with cancer: a foe or ally? Cell Mol Immunol 2018, 15, 335–345. [Google Scholar] [CrossRef]
- Yousefzadeh, M.J.; Schafer, M.J.; Noren Hooten, N.; Atkinson, E.J.; Evans, M.K.; Baker, D.J.; Quarles, E.K.; Robbins, P.D.; Ladiges, W.C.; LeBrasseur, N.K.; et al. Circulating levels of monocyte chemoattractant protein-1 as a potential measure of biological age in mice and frailty in humans. Aging Cell 2018, 17. [Google Scholar] [CrossRef]
- Kim, S.-H. Age-Associated Increasing of MCP-1 in Adults. J. Exp. Biomed. Sci. 2007, 13, 183–187. [Google Scholar]
- Tripathi, D.; Kant, S.; Pandey, S.; Ehtesham, N.Z. Resistin in metabolism, inflammation, and disease. Febs j 2020, 287, 3141–3149. [Google Scholar] [CrossRef]
- Takahashi, Y.; Kitadai, Y.; Bucana, C.D.; Cleary, K.R.; Ellis, L.M. Expression of vascular endothelial growth factor and its receptor, KDR, correlates with vascularity, metastasis, and proliferation of human colon cancer. Cancer Res 1995, 55, 3964–3968. [Google Scholar]
- Salven, P.; Ruotsalainen, T.; Mattson, K.; Joensuu, H. High pre-treatment serum level of vascular endothelial growth factor (VEGF) is associated with poor outcome in small-cell lung cancer. Int J Cancer 1998, 79, 144–146. [Google Scholar] [CrossRef]
- Niu, G.; Chen, X. Vascular endothelial growth factor as an anti-angiogenic target for cancer therapy. Curr Drug Targets 2010, 11, 1000–1017. [Google Scholar] [CrossRef]
- Jaberi, S.A.; Cohen, A.; D’Souza, C.; Abdulrazzaq, Y.M.; Ojha, S.; Bastaki, S.; Adeghate, E.A. Lipocalin-2: Structure, function, distribution and role in metabolic disorders. Biomed Pharmacother 2021, 142, 112002. [Google Scholar] [CrossRef]
- Hirano, T. IL-6 in inflammation, autoimmunity and cancer. Int Immunol 2021, 33, 127–148. [Google Scholar] [CrossRef]
- Yao, X.; Huang, J.; Zhong, H.; Shen, N.; Faggioni, R.; Fung, M.; Yao, Y. Targeting interleukin-6 in inflammatory autoimmune diseases and cancers. Pharmacol Ther 2014, 141, 125–139. [Google Scholar] [CrossRef]
- Uciechowski, P.; Dempke, W.C.M. Interleukin-6: A Masterplayer in the Cytokine Network. Oncology 2020, 98, 131–137. [Google Scholar] [CrossRef]
- Ying, T.H.; Lee, C.H.; Chiou, H.L.; Yang, S.F.; Lin, C.L.; Hung, C.H.; Tsai, J.P.; Hsieh, Y.H. Knockdown of Pentraxin 3 suppresses tumorigenicity and metastasis of human cervical cancer cells. Sci Rep 2016, 6, 29385. [Google Scholar] [CrossRef]
- Song, T.; Wang, C.; Guo, C.; Liu, Q.; Zheng, X. Pentraxin 3 overexpression accelerated tumor metastasis and indicated poor prognosis in hepatocellular carcinoma via driving epithelial-mesenchymal transition. J Cancer 2018, 9, 2650–2658. [Google Scholar] [CrossRef]
- Iwaki, T.; Urano, T.; Umemura, K. PAI-1, progress in understanding the clinical problem and its aetiology. Br J Haematol 2012, 157, 291–298. [Google Scholar] [CrossRef]
- Lubbers, E.R.; List, E.O.; Jara, A.; Sackman-Sala, L.; Cordoba-Chacon, J.; Gahete, M.D.; Kineman, R.D.; Boparai, R.; Bartke, A.; Kopchick, J.J.; et al. Adiponectin in mice with altered GH action: links to insulin sensitivity and longevity? J Endocrinol 2013, 216, 363–374. [Google Scholar] [CrossRef]
- Nguyen, T.M.D. Adiponectin: Role in Physiology and Pathophysiology. Int J Prev Med 2020, 11, 136. [Google Scholar] [CrossRef]
- Fruebis, J.; Tsao, T.S.; Javorschi, S.; Ebbets-Reed, D.; Erickson, M.R.; Yen, F.T.; Bihain, B.E.; Lodish, H.F. Proteolytic cleavage product of 30-kDa adipocyte complement-related protein increases fatty acid oxidation in muscle and causes weight loss in mice. Proc Natl Acad Sci U S A 2001, 98, 2005–2010. [Google Scholar] [CrossRef]
- Yamauchi, T.; Kamon, J.; Waki, H.; Terauchi, Y.; Kubota, N.; Hara, K.; Mori, Y.; Ide, T.; Murakami, K.; Tsuboyama-Kasaoka, N.; et al. The fat-derived hormone Adiponectin reverses insulin resistance associated with both lipoatrophy and obesity. Nat Med 2001, 7, 941–946. [Google Scholar] [CrossRef]
- Berg, A.H.; Combs, T.P.; Du, X.; Brownlee, M.; Scherer, P.E. The adipocyte-secreted protein Acrp30 enhances hepatic insulin action. Nat Med 2001, 7, 947–953. [Google Scholar] [CrossRef]
- Combs, T.P.; Berg, A.H.; Obici, S.; Scherer, P.E.; Rossetti, L. Endogenous glucose production is inhibited by the adipose-derived protein Acrp30. J Clin Invest 2001, 108, 1875–1881. [Google Scholar] [CrossRef]
- Arita, Y.; Kihara, S.; Ouchi, N.; Takahashi, M.; Maeda, K.; Miyagawa, J.; Hotta, K.; Shimomura, I.; Nakamura, T.; Miyaoka, K.; et al. Paradoxical decrease of an adipose-specific protein, Adiponectin, in obesity. Biochem Biophys Res Commun 1999, 257, 79–83. [Google Scholar] [CrossRef]
- Kern, P.A.; Di Gregorio, G.B.; Lu, T.; Rassouli, N.; Ranganathan, G. Adiponectin expression from human adipose tissue: relation to obesity, insulin resistance, and tumor necrosis factor-alpha expression. Diabetes 2003, 52, 1779–1785. [Google Scholar] [CrossRef]
- Barnea, M.; Shamay, A.; Stark, A.H.; Madar, Z. A high-fat diet has a tissue-specific effect on Adiponectin and related enzyme expression. Obesity (Silver Spring) 2006, 14, 2145–2153. [Google Scholar] [CrossRef]
- Bullen, J.W., Jr.; Bluher, S.; Kelesidis, T.; Mantzoros, C.S. Regulation of Adiponectin and its receptors in response to development of diet-induced obesity in mice. Am J Physiol Endocrinol Metab 2007, 292, E1079–E1086. [Google Scholar] [CrossRef]
- Lee, B.; Shao, J. Adiponectin and energy homeostasis. Rev Endocr Metab Disord 2014, 15, 149–156. [Google Scholar] [CrossRef]
- Qiao, L.; Lee, B.; Kinney, B.; Yoo, H.S.; Shao, J. Energy intake and Adiponectin gene expression. Am J Physiol Endocrinol Metab 2011, 300, E809–E816. [Google Scholar] [CrossRef]
- Coelho, M.; Oliveira, T.; Fernandes, R. Biochemistry of adipose tissue: an endocrine organ. Arch Med Sci 2013, 9, 191–200. [Google Scholar] [CrossRef]
- Morton, G.J.; Schwartz, M.W. Leptin and the central nervous system control of glucose metabolism. Physiol Rev 2011, 91, 389–411. [Google Scholar] [CrossRef]
- Brew, K.; Nagase, H. The tissue inhibitors of metalloproteinases (TIMPs): an ancient family with structural and functional diversity. Biochim Biophys Acta 2010, 1803, 55–71. [Google Scholar] [CrossRef]
- Kralisch, S.; Bluher, M.; Tonjes, A.; Lossner, U.; Paschke, R.; Stumvoll, M.; Fasshauer, M. Tissue inhibitor of metalloproteinase-1 predicts adiposity in humans. Eur J Endocrinol 2007, 156, 257–261. [Google Scholar] [CrossRef]
- Chavey, C.; Mari, B.; Monthouel, M.N.; Bonnafous, S.; Anglard, P.; Van Obberghen, E.; Tartare-Deckert, S. Matrix metalloproteinases are differentially expressed in adipose tissue during obesity and modulate adipocyte differentiation. J Biol Chem 2003, 278, 11888–11896. [Google Scholar] [CrossRef]
- Sharma, A.M.; Staels, B. Review: Peroxisome proliferator-activated receptor gamma and adipose tissue--understanding obesity-related changes in regulation of lipid and glucose metabolism. J Clin Endocrinol Metab 2007, 92, 386–395. [Google Scholar] [CrossRef]
- Meissburger, B.; Stachorski, L.; Röder, E.; Rudofsky, G.; Wolfrum, C. Tissue inhibitor of matrix metalloproteinase 1 (TIMP1) controls adipogenesis in obesity in mice and in humans. Diabetologia 2011, 54, 1468–1479. [Google Scholar] [CrossRef]
- Gerin, I.; Louis, G.W.; Zhang, X.; Prestwich, T.C.; Kumar, T.R.; Myers, M.G., Jr.; Macdougald, O.A.; Nothnick, W.B. Hyperphagia and obesity in female mice lacking tissue inhibitor of metalloproteinase-1. Endocrinology 2009, 150, 1697–1704. [Google Scholar] [CrossRef]
- Corvera, S.; Solivan-Rivera, J.; Yang Loureiro, Z. Angiogenesis in adipose tissue and obesity. Angiogenesis 2022, 25, 439–453. [Google Scholar] [CrossRef]
- Wang, Y.; Lam, K.S.; Kraegen, E.W.; Sweeney, G.; Zhang, J.; Tso, A.W.; Chow, W.S.; Wat, N.M.; Xu, J.Y.; Hoo, R.L.; et al. Lipocalin-2 is an inflammatory marker closely associated with obesity, insulin resistance, and hyperglycemia in humans. Clin Chem 2007, 53, 34–41. [Google Scholar] [CrossRef]
- Yan, Q.W.; Yang, Q.; Mody, N.; Graham, T.E.; Hsu, C.H.; Xu, Z.; Houstis, N.E.; Kahn, B.B.; Rosen, E.D. The adipokine Lipocalin 2 is regulated by obesity and promotes insulin resistance. Diabetes 2007, 56, 2533–2540. [Google Scholar] [CrossRef]
- Zhang, Y.; Foncea, R.; Deis, J.A.; Guo, H.; Bernlohr, D.A.; Chen, X. Lipocalin 2 expression and secretion is highly regulated by metabolic stress, cytokines, and nutrients in adipocytes. PLoS One 2014, 9, e96997. [Google Scholar] [CrossRef]
- Guo, H.; Jin, D.; Zhang, Y.; Wright, W.; Bazuine, M.; Brockman, D.A.; Bernlohr, D.A.; Chen, X. Lipocalin-2 deficiency impairs thermogenesis and potentiates diet-induced insulin resistance in mice. Diabetes 2010, 59, 1376–1385. [Google Scholar] [CrossRef]
- Deis, J.A.; Guo, H.; Wu, Y.; Liu, C.; Bernlohr, D.A.; Chen, X. Adipose Lipocalin 2 overexpression protects against age-related decline in thermogenic function of adipose tissue and metabolic deterioration. Mol Metab 2019, 24, 18–29. [Google Scholar] [CrossRef]
- Law, I.K.; Xu, A.; Lam, K.S.; Berger, T.; Mak, T.W.; Vanhoutte, P.M.; Liu, J.T.; Sweeney, G.; Zhou, M.; Yang, B.; et al. Lipocalin-2 deficiency attenuates insulin resistance associated with aging and obesity. Diabetes 2010, 59, 872–882. [Google Scholar] [CrossRef]
- Alessi, M.C.; Juhan-Vague, I. PAI-1 and the metabolic syndrome: links, causes, and consequences. Arterioscler Thromb Vasc Biol 2006, 26, 2200–2207. [Google Scholar] [CrossRef]
- Samad, F.; Loskutoff, D.J. Tissue distribution and regulation of plasminogen activator inhibitor-1 in obese mice. Mol Med 1996, 2, 568–582. [Google Scholar] [CrossRef]
- Landin, K.; Stigendal, L.; Eriksson, E.; Krotkiewski, M.; Risberg, B.; Tengborn, L.; Smith, U. Abdominal obesity is associated with an impaired fibrinolytic activity and elevated plasminogen activator inhibitor-1. Metabolism 1990, 39, 1044–1048. [Google Scholar] [CrossRef]
- Guo, H.; Qiu, X.; Deis, J.; Lin, T.Y.; Chen, X. Pentraxin 3 deficiency exacerbates lipopolysaccharide-induced inflammation in adipose tissue. Int J Obes (Lond) 2020, 44, 525–538. [Google Scholar] [CrossRef]
- Thomas, C.; Henry, W.; Cuiffo, B.G.; Collmann, A.Y.; Marangoni, E.; Benhamo, V.; Bhasin, M.K.; Fan, C.; Fuhrmann, L.; Baldwin, A.S.; et al. Pentraxin-3 is a PI3K signaling target that promotes stem cell-like traits in basal-like breast cancers. Sci Signal 2017, 10. [Google Scholar] [CrossRef]
- Zhang, Q.; Lei, L.; Jing, D. Knockdown of SERPINE1 reverses resistance of triple-negative breast cancer to paclitaxel via suppression of VEGFA. Oncol Rep 2020, 44, 1875–1884. [Google Scholar] [CrossRef]
- Chen, S.; Li, Y.; Zhu, Y.; Fei, J.; Song, L.; Sun, G.; Guo, L.; Li, X. SERPINE1 Overexpression Promotes Malignant Progression and Poor Prognosis of Gastric Cancer. J Oncol 2022, 2022, 2647825. [Google Scholar] [CrossRef]
- Azimi, I.; Petersen, R.M.; Thompson, E.W.; Roberts-Thomson, S.J.; Monteith, G.R. Hypoxia-induced reactive oxygen species mediate N-cadherin and SERPINE1 expression, EGFR signalling and motility in MDA-MB-468 breast cancer cells. Sci Rep 2017, 7, 15140. [Google Scholar] [CrossRef]
- Wang, S.; Pang, L.; Liu, Z.; Meng, X. SERPINE1 associated with remodeling of the tumor microenvironment in colon cancer progression: a novel therapeutic target. BMC Cancer 2021, 21, 767. [Google Scholar] [CrossRef]
- Levine, J.A.; Oleaga, C.; Eren, M.; Amaral, A.P.; Shang, M.; Lux, E.; Khan, S.S.; Shah, S.J.; Omura, Y.; Pamir, N.; et al. Role of PAI-1 in hepatic steatosis and dyslipidemia. Sci Rep 2021, 11, 430. [Google Scholar] [CrossRef]
- Khan, S.S.; Shah, S.J.; Klyachko, E.; Baldridge, A.S.; Eren, M.; Place, A.T.; Aviv, A.; Puterman, E.; Lloyd-Jones, D.M.; Heiman, M.; et al. A null mutation in SERPINE1 protects against biological aging in humans. Sci Adv 2017, 3, eaao1617. [Google Scholar] [CrossRef]
- Sultzer, B.M. Endotoxin-induced resistance to a staphylococcal infection: cellular and humoral responses compared in two mouse strains. J Infect Dis 1968, 118, 340–348. [Google Scholar] [CrossRef]
- Hoshino, K.; Takeuchi, O.; Kawai, T.; Sanjo, H.; Ogawa, T.; Takeda, Y.; Takeda, K.; Akira, S. Cutting edge: Toll-like receptor 4 (TLR4)-deficient mice are hyporesponsive to lipopolysaccharide: evidence for TLR4 as the Lps gene product. J Immunol 1999, 162, 3749–3752. [Google Scholar] [CrossRef]
- Poltorak, A.; He, X.; Smirnova, I.; Liu, M.Y.; Van Huffel, C.; Du, X.; Birdwell, D.; Alejos, E.; Silva, M.; Galanos, C.; et al. Defective LPS signaling in C3H/HeJ and C57BL/10ScCr mice: mutations in Tlr4 gene. Science 1998, 282, 2085–2088. [Google Scholar] [CrossRef]
- Benomar, Y.; Taouis, M. Molecular Mechanisms Underlying Obesity-Induced Hypothalamic Inflammation and Insulin Resistance: Pivotal Role of Resistin/TLR4 Pathways. Front Endocrinol (Lausanne) 2019, 10, 140. [Google Scholar] [CrossRef]
- Jin, C.; Flavell, R.A. Innate sensors of pathogen and stress: linking inflammation to obesity. J Allergy Clin Immunol 2013, 132, 287–294. [Google Scholar] [CrossRef]
- Kuzmich, N.N.; Sivak, K.V.; Chubarev, V.N.; Porozov, Y.B.; Savateeva-Lyubimova, T.N.; Peri, F. TLR4 Signaling Pathway Modulators as Potential Therapeutics in Inflammation and Sepsis. Vaccines (Basel) 2017, 5. [Google Scholar] [CrossRef]
- Engin, A.B. Adipocyte-Macrophage Cross-Talk in Obesity. Adv Exp Med Biol 2017, 960, 327–343. [Google Scholar] [CrossRef]
- McKernan, K.; Varghese, M.; Patel, R.; Singer, K. Role of TLR4 in the induction of inflammatory changes in adipocytes and macrophages. Adipocyte 2020, 9, 212–222. [Google Scholar] [CrossRef] [PubMed]
- Suganami, T.; Mieda, T.; Itoh, M.; Shimoda, Y.; Kamei, Y.; Ogawa, Y. Attenuation of obesity-induced adipose tissue inflammation in C3H/HeJ mice carrying a Toll-like receptor 4 mutation. Biochem Biophys Res Commun 2007, 354, 45–49. [Google Scholar] [CrossRef]
| Ingredients | Amount | Function/Role |
|---|---|---|
| M199 media | 500 mL | Source of glucose, amino acid, vitamins, and inorganic salts |
| Gentamycin | 50 μg/mL | Antibiotic |
| Penicillin-Streptomycin | 1% or 5 mL | Antibiotics |
| Insulin | 0.7 nM | Aids in lipogenesis and fat accumulation |
| Dexamethasone | 250 nM | Helps in adipogenic gene expression. |
| Amphotericin B | 0.5 μg/mL | Antifungal agent |
| HEPES | 25 nM | Buffering agent |
Disclaimer/Publisher’s Note: The statements, opinions and data contained in all publications are solely those of the individual author(s) and contributor(s) and not of MDPI and/or the editor(s). MDPI and/or the editor(s) disclaim responsibility for any injury to people or property resulting from any ideas, methods, instructions or products referred to in the content. |
© 2024 by the authors. Licensee MDPI, Basel, Switzerland. This article is an open access article distributed under the terms and conditions of the Creative Commons Attribution (CC BY) license (http://creativecommons.org/licenses/by/4.0/).


