1. Introduction
The use of urban green space (UGS) to address health issues related to urban spatial design, such as heat stress and mental stress, is increasingly advocated (Chen et al., 2020; Coppel & Wüstemann, 2017; Fischer et al., 2018; Kondo et al., 2018; Kruize et al., 2019). Hence, urban policy and spatial planning has developed a strong interest in using urban greening for the benefit of resident well-being, but still lack guidance on which greening strategy would be most effective in a given context (Bush, 2020; Gemeente Utrecht, 2019; Gijsen, 2021; Maes et al., 2019; Agenda Stad, 2019). Currently, most science-based guidelines and urban policies deal with the various health benefits and burdens of UGS separately (Dütemeyer et al., 2013; Gassner et al., 2018; Thierfelder & Kabisch, 2016). For example, impacts of UGS on heat stress are addressed in isolation from other relevant UGS impacts on urban health (de Nijs et al., 2019; Liou et al., 2021; Spijker et al., 2019). Moreover, guidelines are often unclear about the quantitative dimension, e.g., how much UGS is needed in a city or neighborhood to achieve a desired level of health benefits. Additionally, urban planners are confronted with contradictory messages, because UGS can also have negative consequences for human health through impacts on, for example pollen concentration and social safety, and the issue- and situation-specific nature of available guidelines and support tools further add to the complexity of UGS planning to promote residents’ health (Oosterbroek et al., 2024).
A spatial model named Urban-EcoMATCH (Urban Ecosystems Mapping and Assessment Tool of Costs and Benefits for Health), presented in Oosterbroek et al. (2023), however, offers the possibility to support the development of ‘healthy’ urban greening strategies in an integrated, quantitative, and context-specific way, accounting for multiple health benefits as well as burdens. In this study, the model is applied to assess the performance of alternative UGS design scenarios as compared to the current situation. This explorative strategic scenario study (sensu Börjeson et al., 2006), aims to answer ‘what-if’ questions regarding UGS design for a concrete, specific case (the city of Maastricht, the Netherlands), but also to generate broader insights concerning effective urban greening strategies with respect to health. With its integrated approach, the study fills a gap left by recent scenario studies on UGS design (i.a. Irvine et al., 2021; Kadaverugu et al., 2021; Kim & Kwon, 2021; Lauf et al., 2016; Zhang et al., 2019), which focussed on specific benefits of UGS, such as reducing heat stress (Kadaverugu et al., 2021; Koopmans et al., 2018), promoting active transport (Rayaprolu et al., 2020), or facilitating management of urban flooding (Koopmans et al., 2018; Liu et al., 2020; Majumdar et al., 2020; Mikovits et al., 2018; Miranda et al., 2016; Rayaprolu et al., 2020). The study also covers several health issues that thus far have not been addressed in other UGS scenario studies, namely, the effects of UGS on mental stress from visually unattractive cityscapes, social safety, and tick-borne infectious diseases.
In the next sections, we first present the study approach and introduce the UGS design scenarios which will be assessed with respect to human health. Then, we describe the results of this integrated scenario assessment. In the final section, we discuss the major findings and their implications for urban greening strategy, as well as the limitations of the study in this regard. We end with a conclusion on the value of the presented approach and on priorities for further research.
2. Methods
In this section, we first shortly describe the scenario study approach and input data. Then, we explain in more detail the different UGS design scenarios that were assessed with the model and the thresholds used in this assessment.
2.1. Scenario Study Approach and Input Data
For each of four UGS design scenarios, including two alternative greening strategy scenarios, the indicator values of five health determinants were estimated with the spatial model described in Oosterbroek et al. (2023). These five health determinants concerned ‘Unattractive views’, ‘Heat stress’, ‘Air pollution’, ‘Perceived unsafety’, and ‘Tick-bite risk’. The UGS contributions to these determinants were calculated by comparing the determinant values in the ‘Current greenspace’, ‘Green parking lots and squares’, and ‘Optimized greenspace locations’ scenarios with the values in the ‘No greenspace’ scenario. The performance of the two alternative greening strategy scenarios (‘Green parking lots and squares’, ‘Optimized greenspace locations’) was assessed relative to the current situation (‘Current greenspace’) and relative to each other.
For the scenario assessment, overall, city-scale indicator values for the five health determinants were calculated as the area-weighted average of the indicator values for all street segments. Furthermore, for each street segment, the model-estimated indicator values of the health determinants were compared with a pre-set threshold value. With these thresholds an additional indicator of the health effects of each scenario was calculated: the number (and proportion) of street segments where the indicator value of a health determinant exceeded the threshold. This may be a more policy-relevant indicator to compare the UGS design scenarios, because locations where one or more thresholds are exceeded are likely to attract the attention of urban policy makers and planners. The value of this indicator will not differ between scenarios if differences in UGS impacts, as reflected in different average indicator values, do not result in more or less exceedance of the threshold.
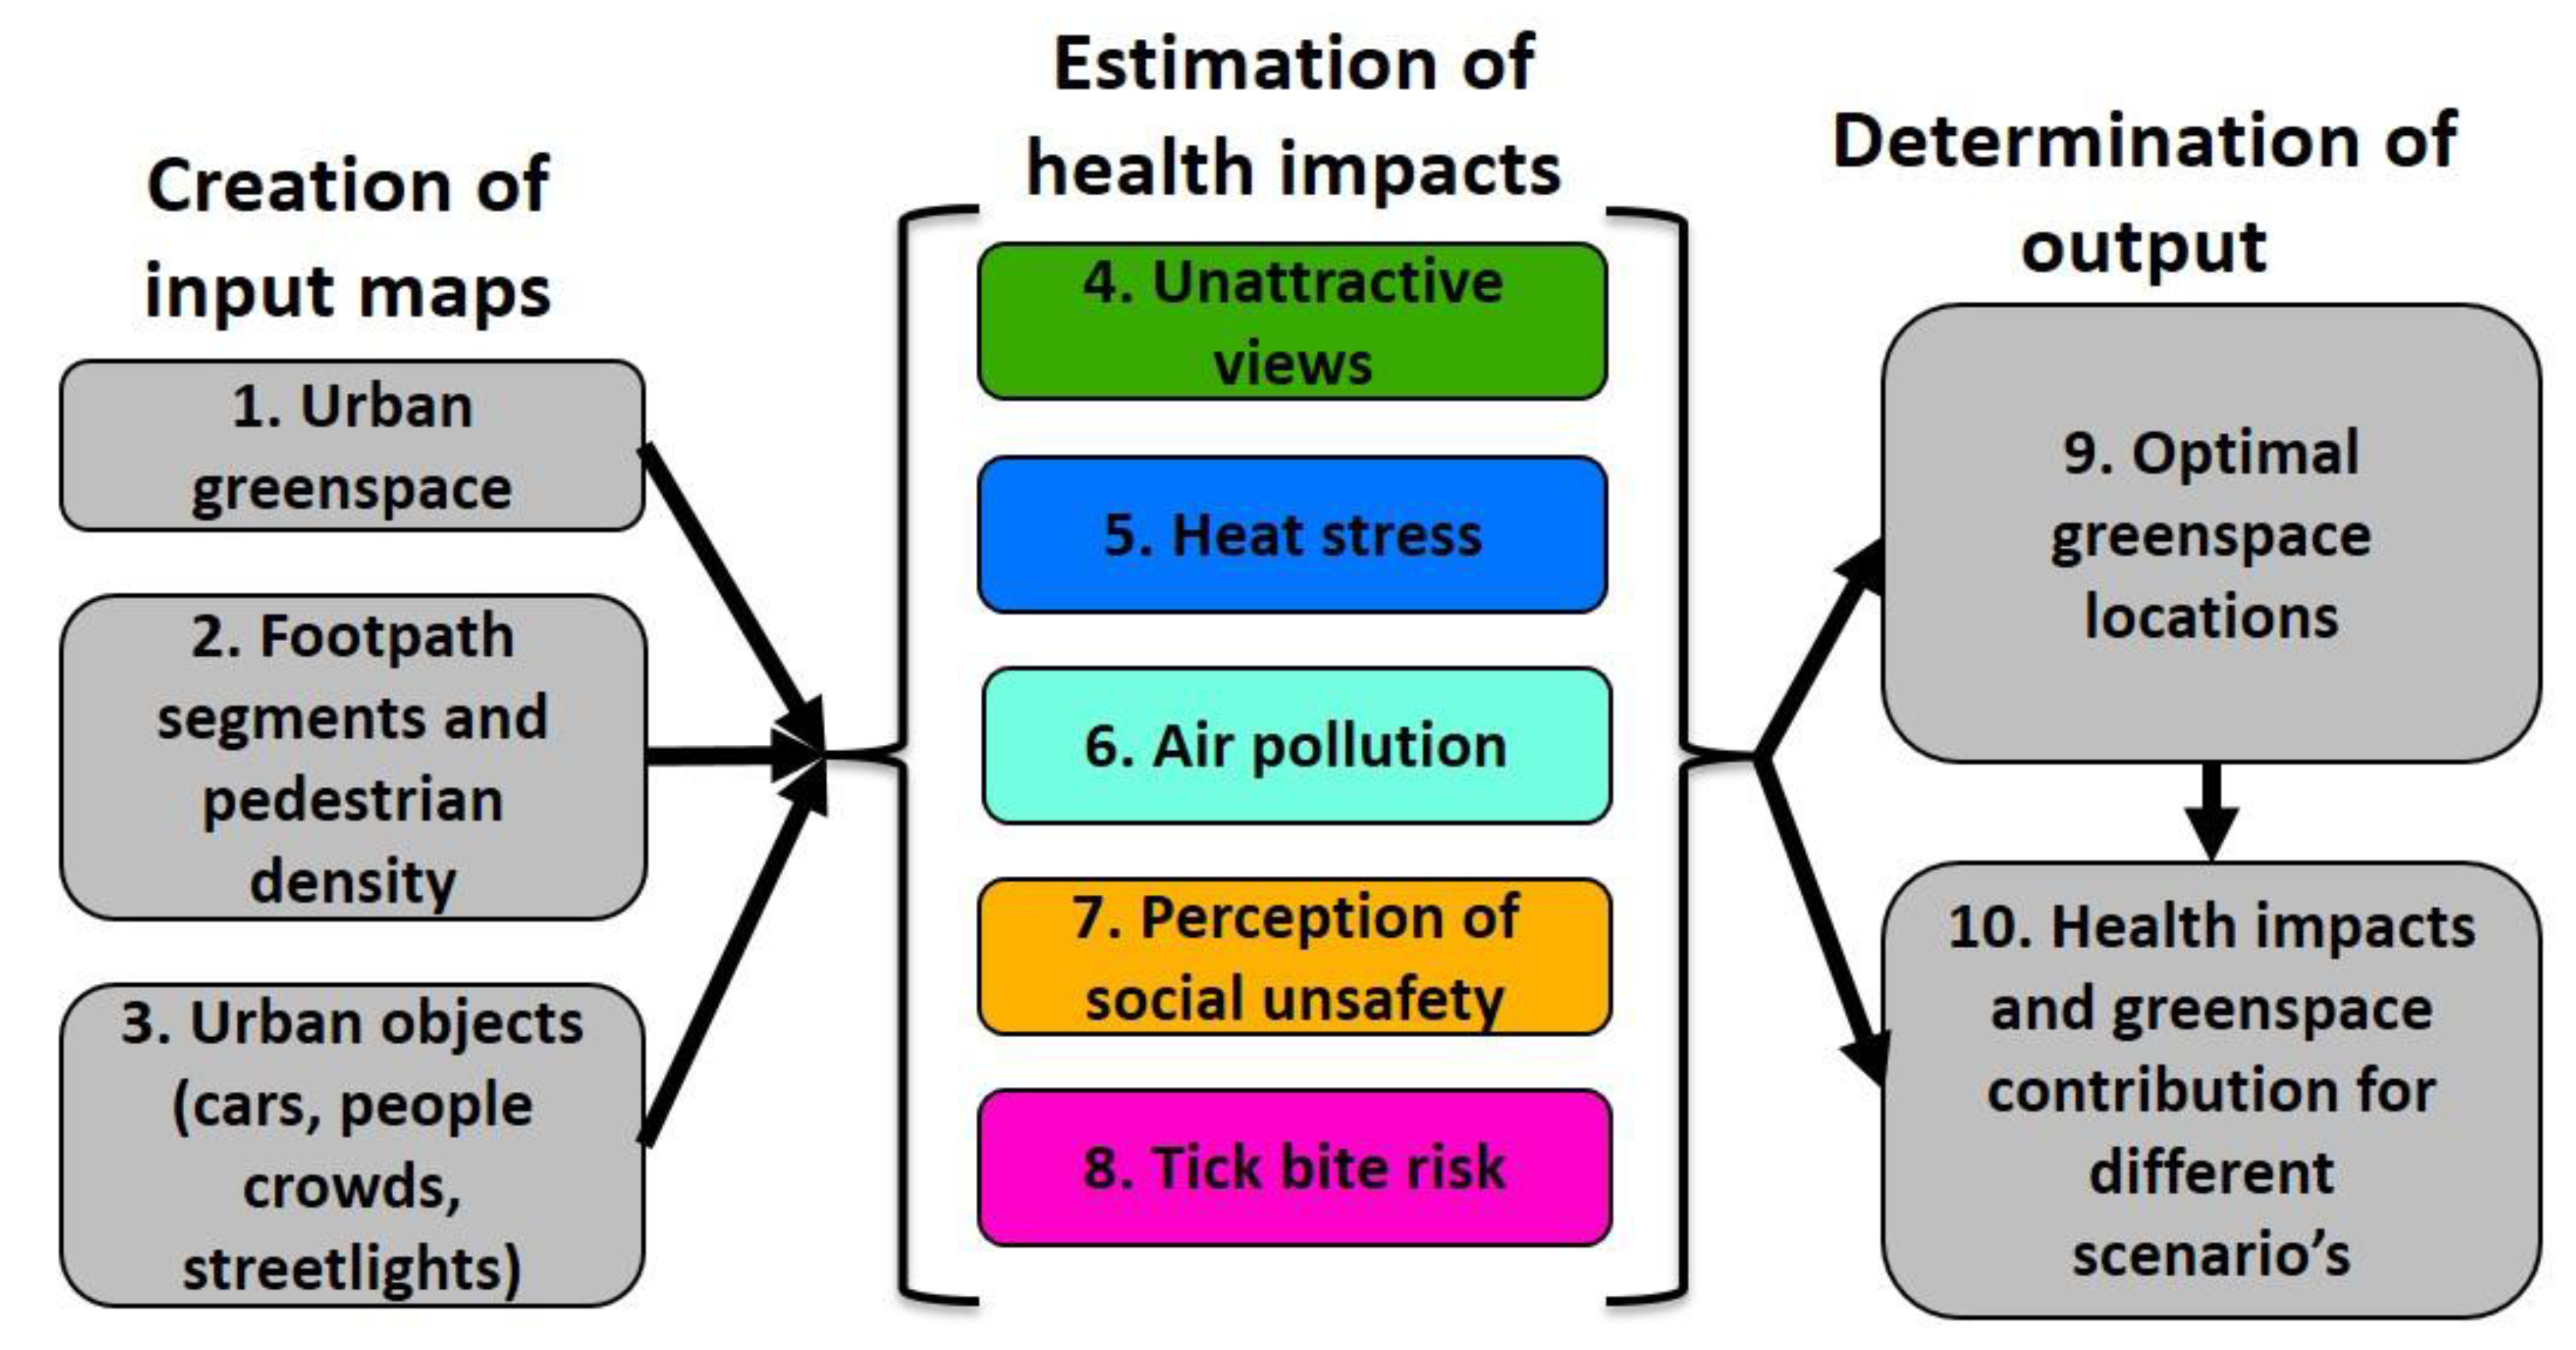
To generate the UGS design for the ‘Optimized greenspace locations’ scenario, a module was added to the original model (
Figure 1). Further information on the model, as well a detailed description of the five health determinants included can be found in Oosterbroek et al. (2023). To run the spatial model, we used several input datasets that are all publicly available for the full Dutch territory and that are often high in resolution (< 1 m). See Oosterbroek et al. (2023) for a more elaborate description of the input data.
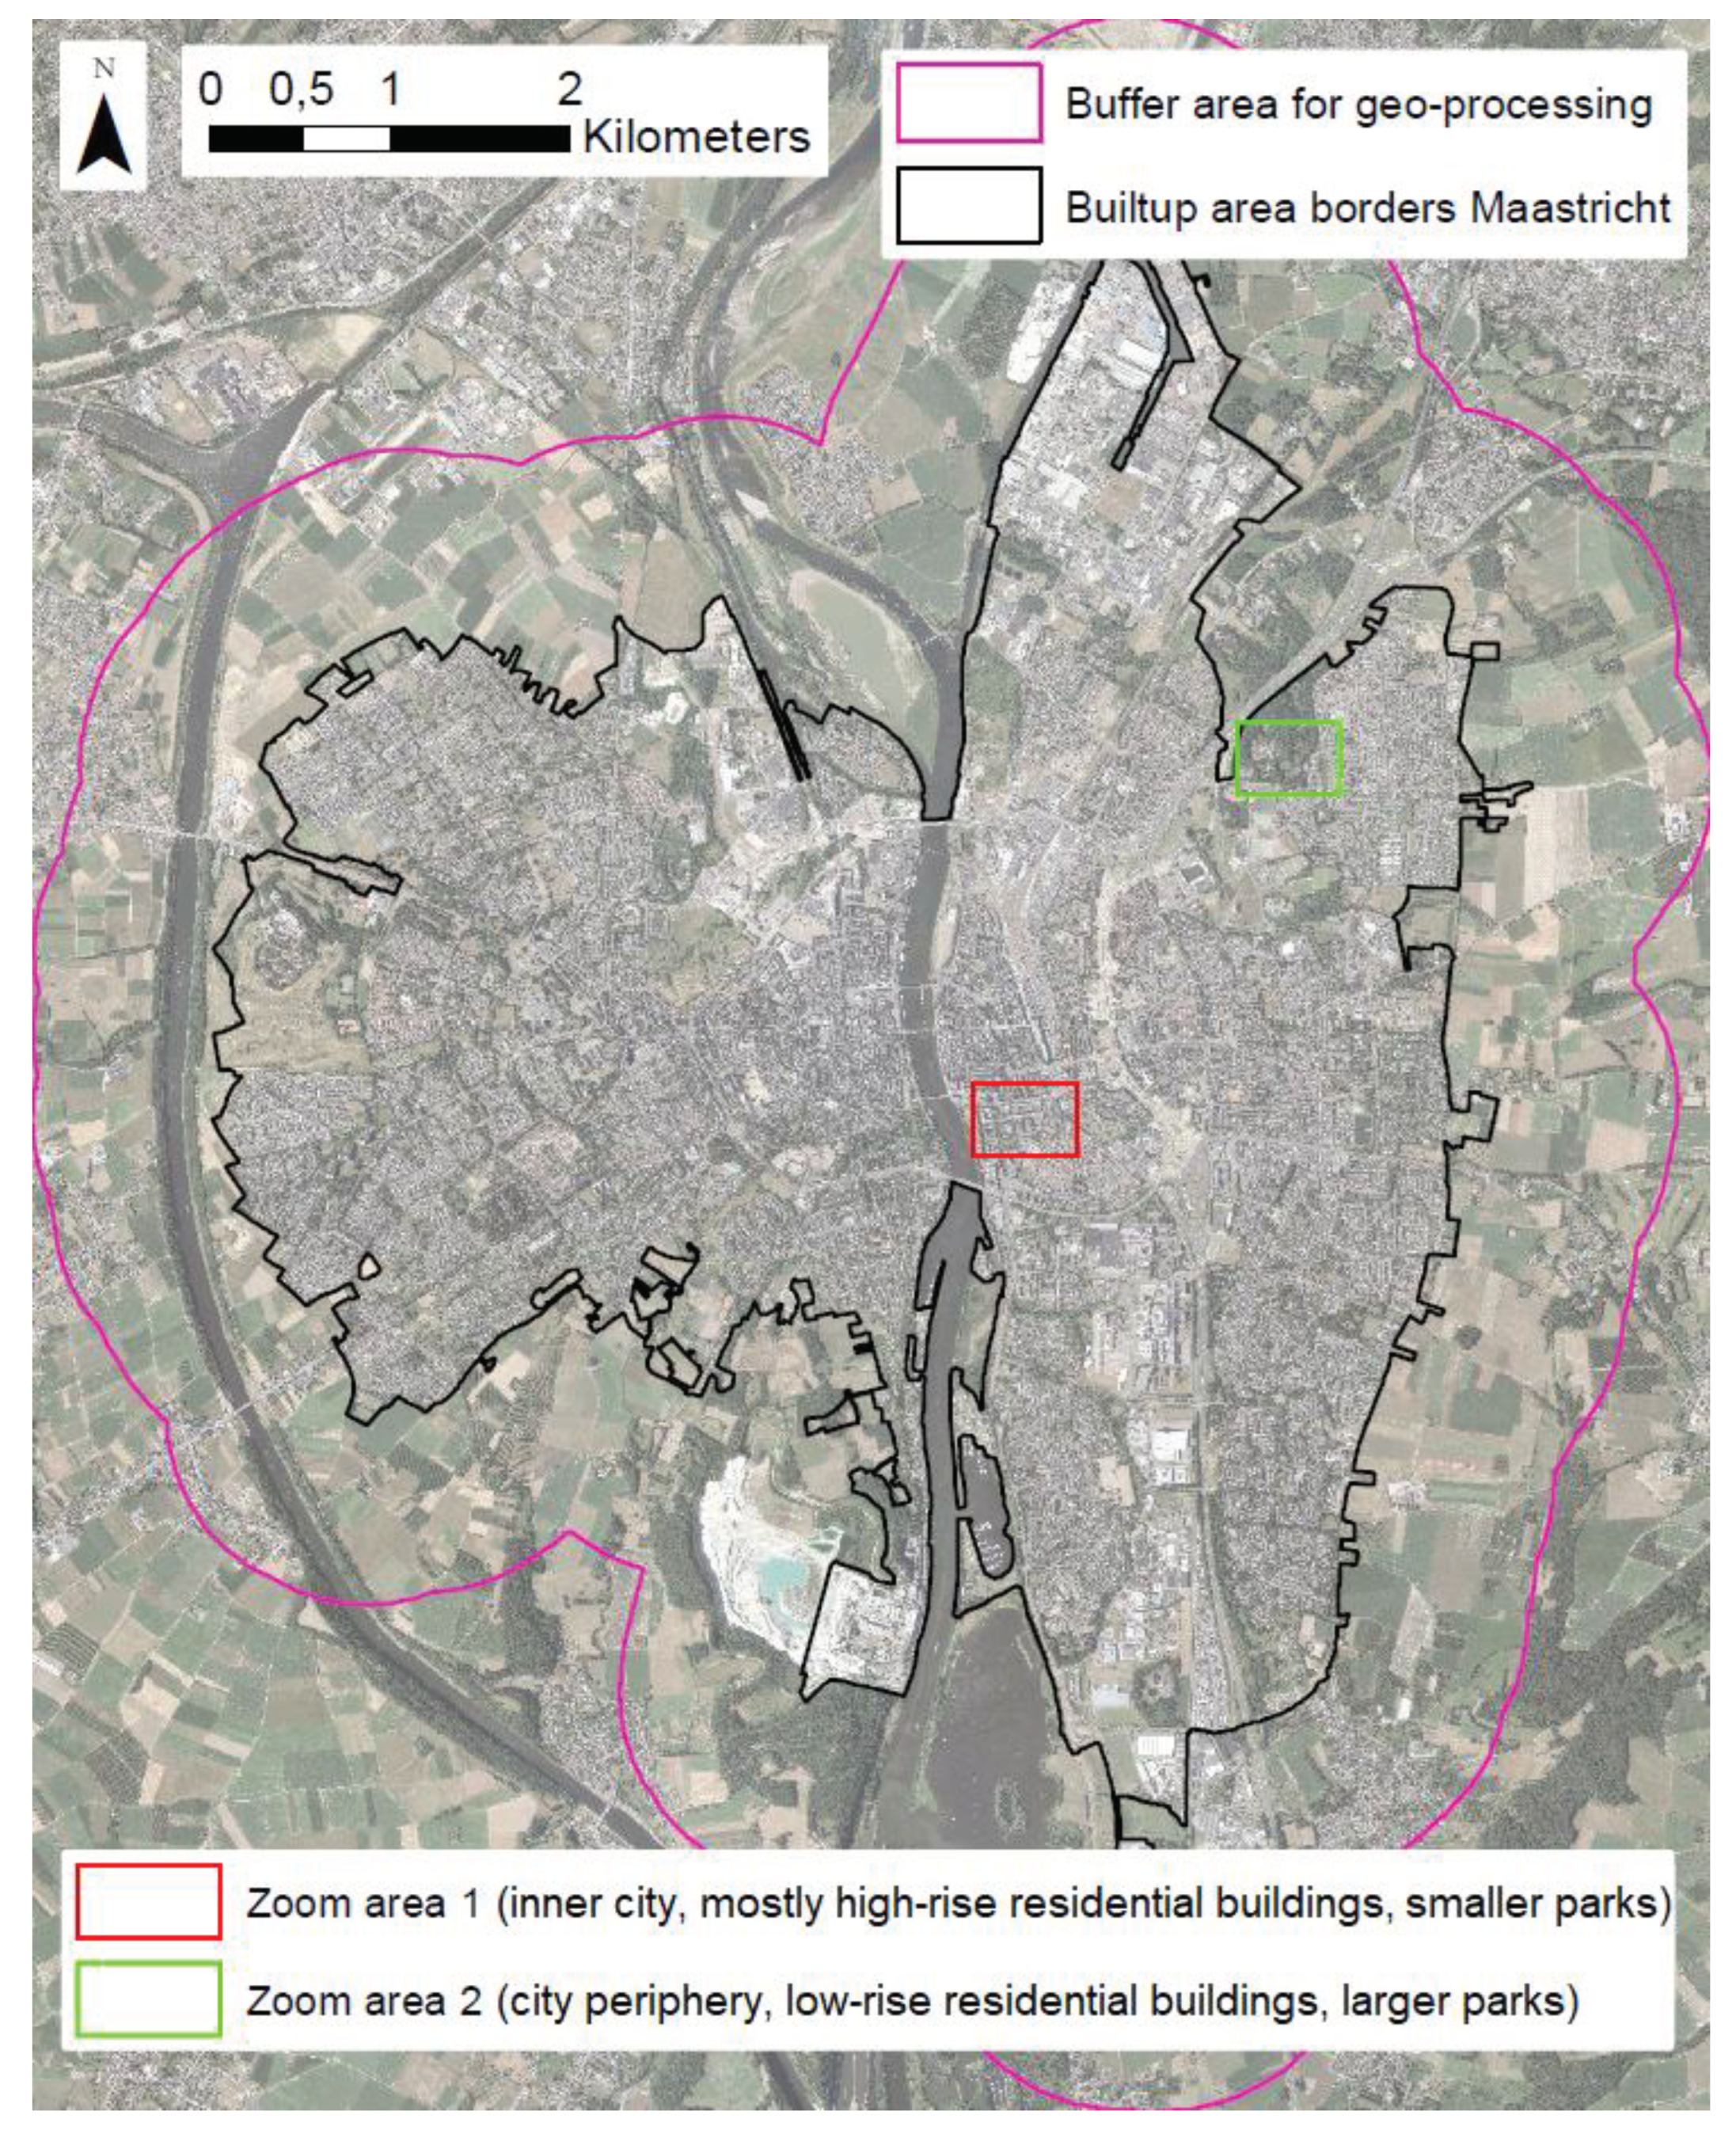
The case study area for this scenario study is the built-up area of Maastricht, The Netherlands. It is a city in the south of the Netherlands, with 122,000 inhabitants (CBS, 2018). Within the Netherlands, Maastricht is an interesting case to apply the model, primarily because it has a heterogeneous urban morphology. We used data of year 2018 for all datasets. For a further description of Maastricht, reasons to focus on Maastricht and its health situation related to the assessed health benefits and burdens, see Oosterbroek et al. (2023). See
Figure 2 for a map of the study area, the borders of the buffered built-up area for geo-processing and the location of the example areas that we use to visualize results.
2.2. UGS Design Scenarios
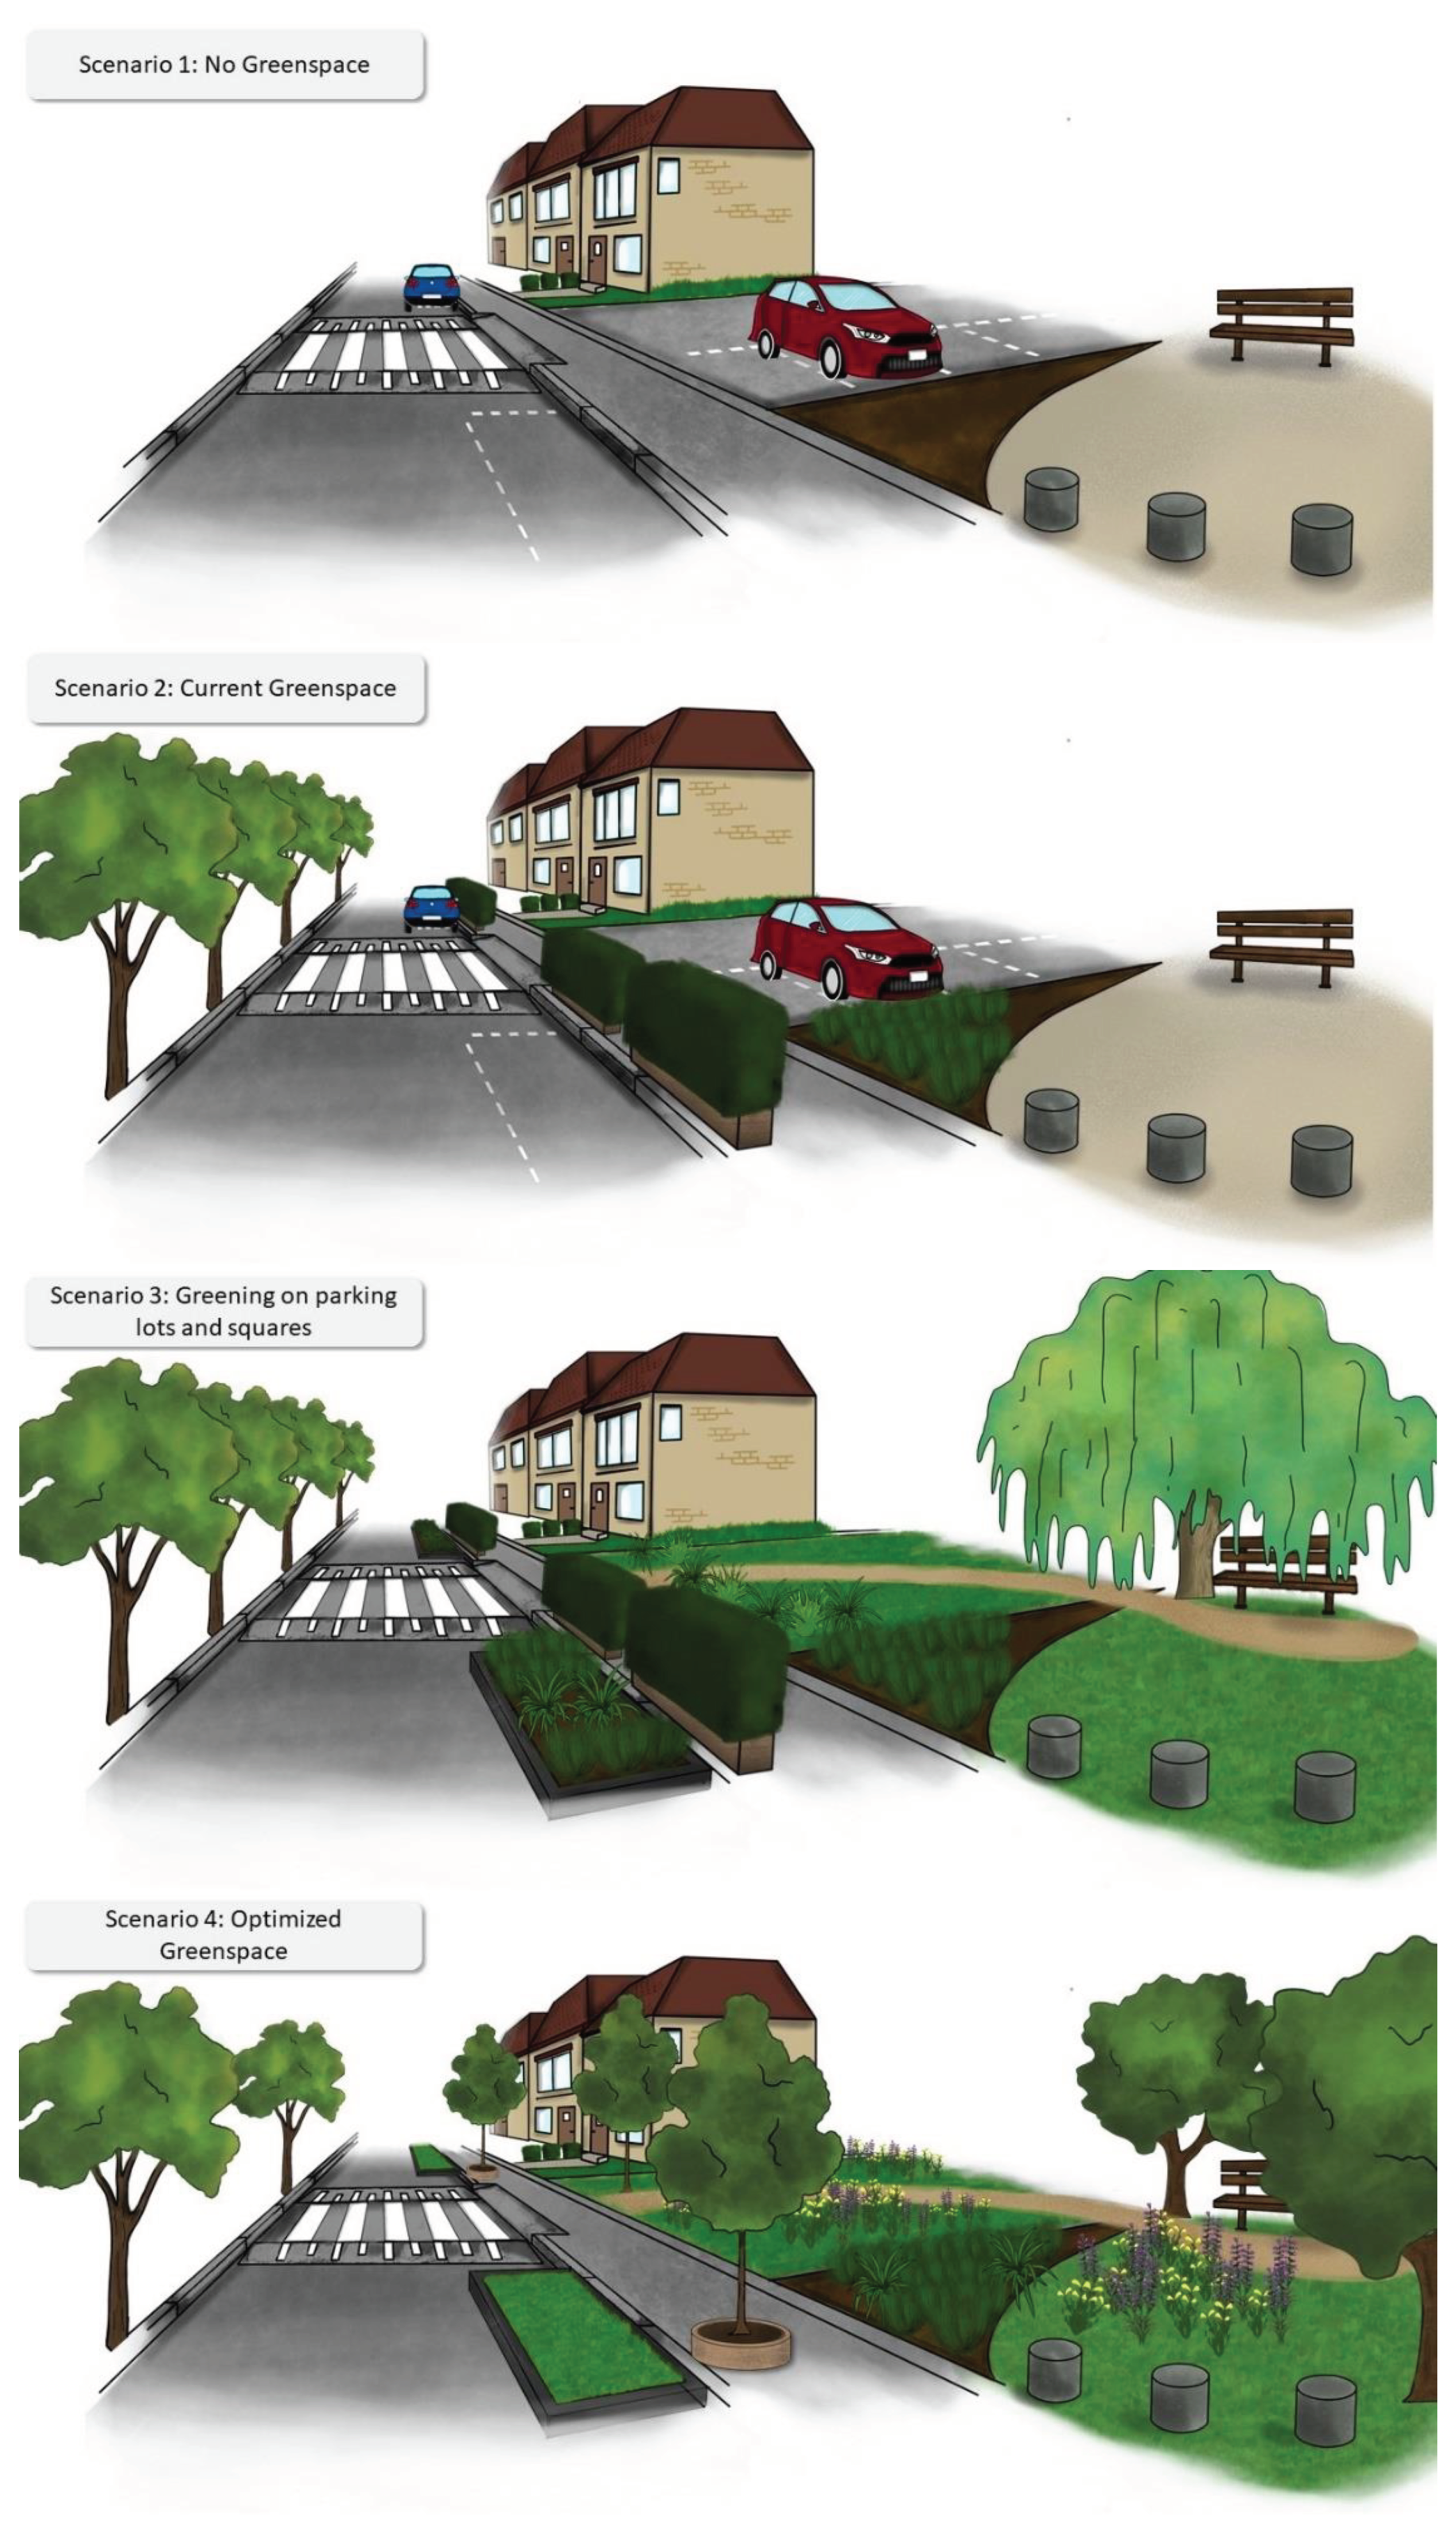
This section introduces the UGS design scenarios for which health impacts were assessed with the model. For all scenarios, privately-owned UGS was included, but only UGS in public areas and areas of private owners accessible to the public (pedestrians) were changed in the alternative UGS design scenarios. As such, these scenarios only include design options that are – in principle - within the power of urban spatial planners to implement. For a visual impression of the four UGS design scenarios at street level, see
Figure 3.
Scenario ‘No Greenspace’
This scenario assumes that Maastricht does not have any public UGS at all. Trees are removed and currently (year 2018) existing shrubs, herbs and grass are replaced by sealed soil. This scenario represents the so-called reference scenario which is used to estimate the UGS contributions to health in the other scenarios. This is done by calculating the difference between the health determinant indicator values estimated in this reference scenario and those in the scenarios with greenspace.
Scenario ‘Current Greenspace’
In this scenario, aerial imagery and topographic maps were combined to reconstruct the UGS situation for the built-up area of Maastricht in the year 2018: see Appendix B in Oosterbroek et al. (2023). Other elements of the spatial design of Maastricht that influence health determinants, for example those related to buildings, roads and cars, were also extracted from the 2018 datasets.
Scenario ‘Green Parking Lots and Squares’
Maastricht’s urban planners have the ambition to green part of the less used parking lots as well as part of the city’s squares, and they are interested in what effects this may have on health benefits and burdens (Maastricht, 2019a, 2019b). As we expected that the city-scale effects on health determinants of the original plans would be very small, we developed a scenario that represents a more extreme version of this ambition, in which all parking lots are replaced by grass fields with shrubs, and all squares are replaced by grass fields with trees. The purpose of this more extreme version of the planners’ ambition is to determine the potential of this greening strategy. Greening of all parking lots and squares would add 4% additional UGS cover, expressed as a percentage of Maastricht’s built-up area in 2018.
Anticipating a preference of residents for an open landscape, shrubs added in this scenario were of modest size (1.2 m in height). Moreover, in line with the municipality’s ambition to increase urban biodiversity, larger trees (20 m in diameter, 12 m in height) were added where space allowed this, reasoning that one large tree increases biodiversity more than two smaller trees.
Scenario ‘Optimized Greenspace Locations’
This scenario uses the UGS volume (i.e., number and size of UGS elements) from the ‘Current greenspace’ scenario, but employs the computer model to redistribute the current UGS over the built-up area of Maastricht to optimize health benefits. All health determinants have the same priority in this scenario: UGS will be located (‘planted’) in areas with an equally high suitability for each of the UGS benefits and an equally low suitability for each of the UGS burdens (see
Box 1 for further explanation). In contrast to the scenario ‘Greening of parking lots and squares’, this scenario does not add any UGS elements compared to the 2018 situation. Hence, the purpose of this scenario is to show the potential benefits of the same amount of UGS when locations are chosen such that health benefits are maximized and burdens minimized.
In Maastricht's built-up area, the space available for optimizing UGS in support of residents’ health is rather limited, especially in the city center. In 2018, grass, herbs and shrubs covered 30% of the built-up area (including both public and private UGS), whilst tree crowns covered 15%. As tree stems do not take up much space, about 30-31% of the surface cover of the built-up area was covered by UGS. Only 8% of the built-up area’s surface is covered by areas that have potential for implementing UGS (re)design. This is mainly because 41% of Maastricht’s built-up area consists of roads, buildings and water. Moreover, 21% of the built-up area consists of private areas without UGS that are not accessible to the public. The surface of such private areas mainly consists of paved area (roads, parking lots) or storage area (sand, building materials). We assume that the space available for optimizing UGS in cities in the Netherlands will not differ greatly from the Maastricht case.
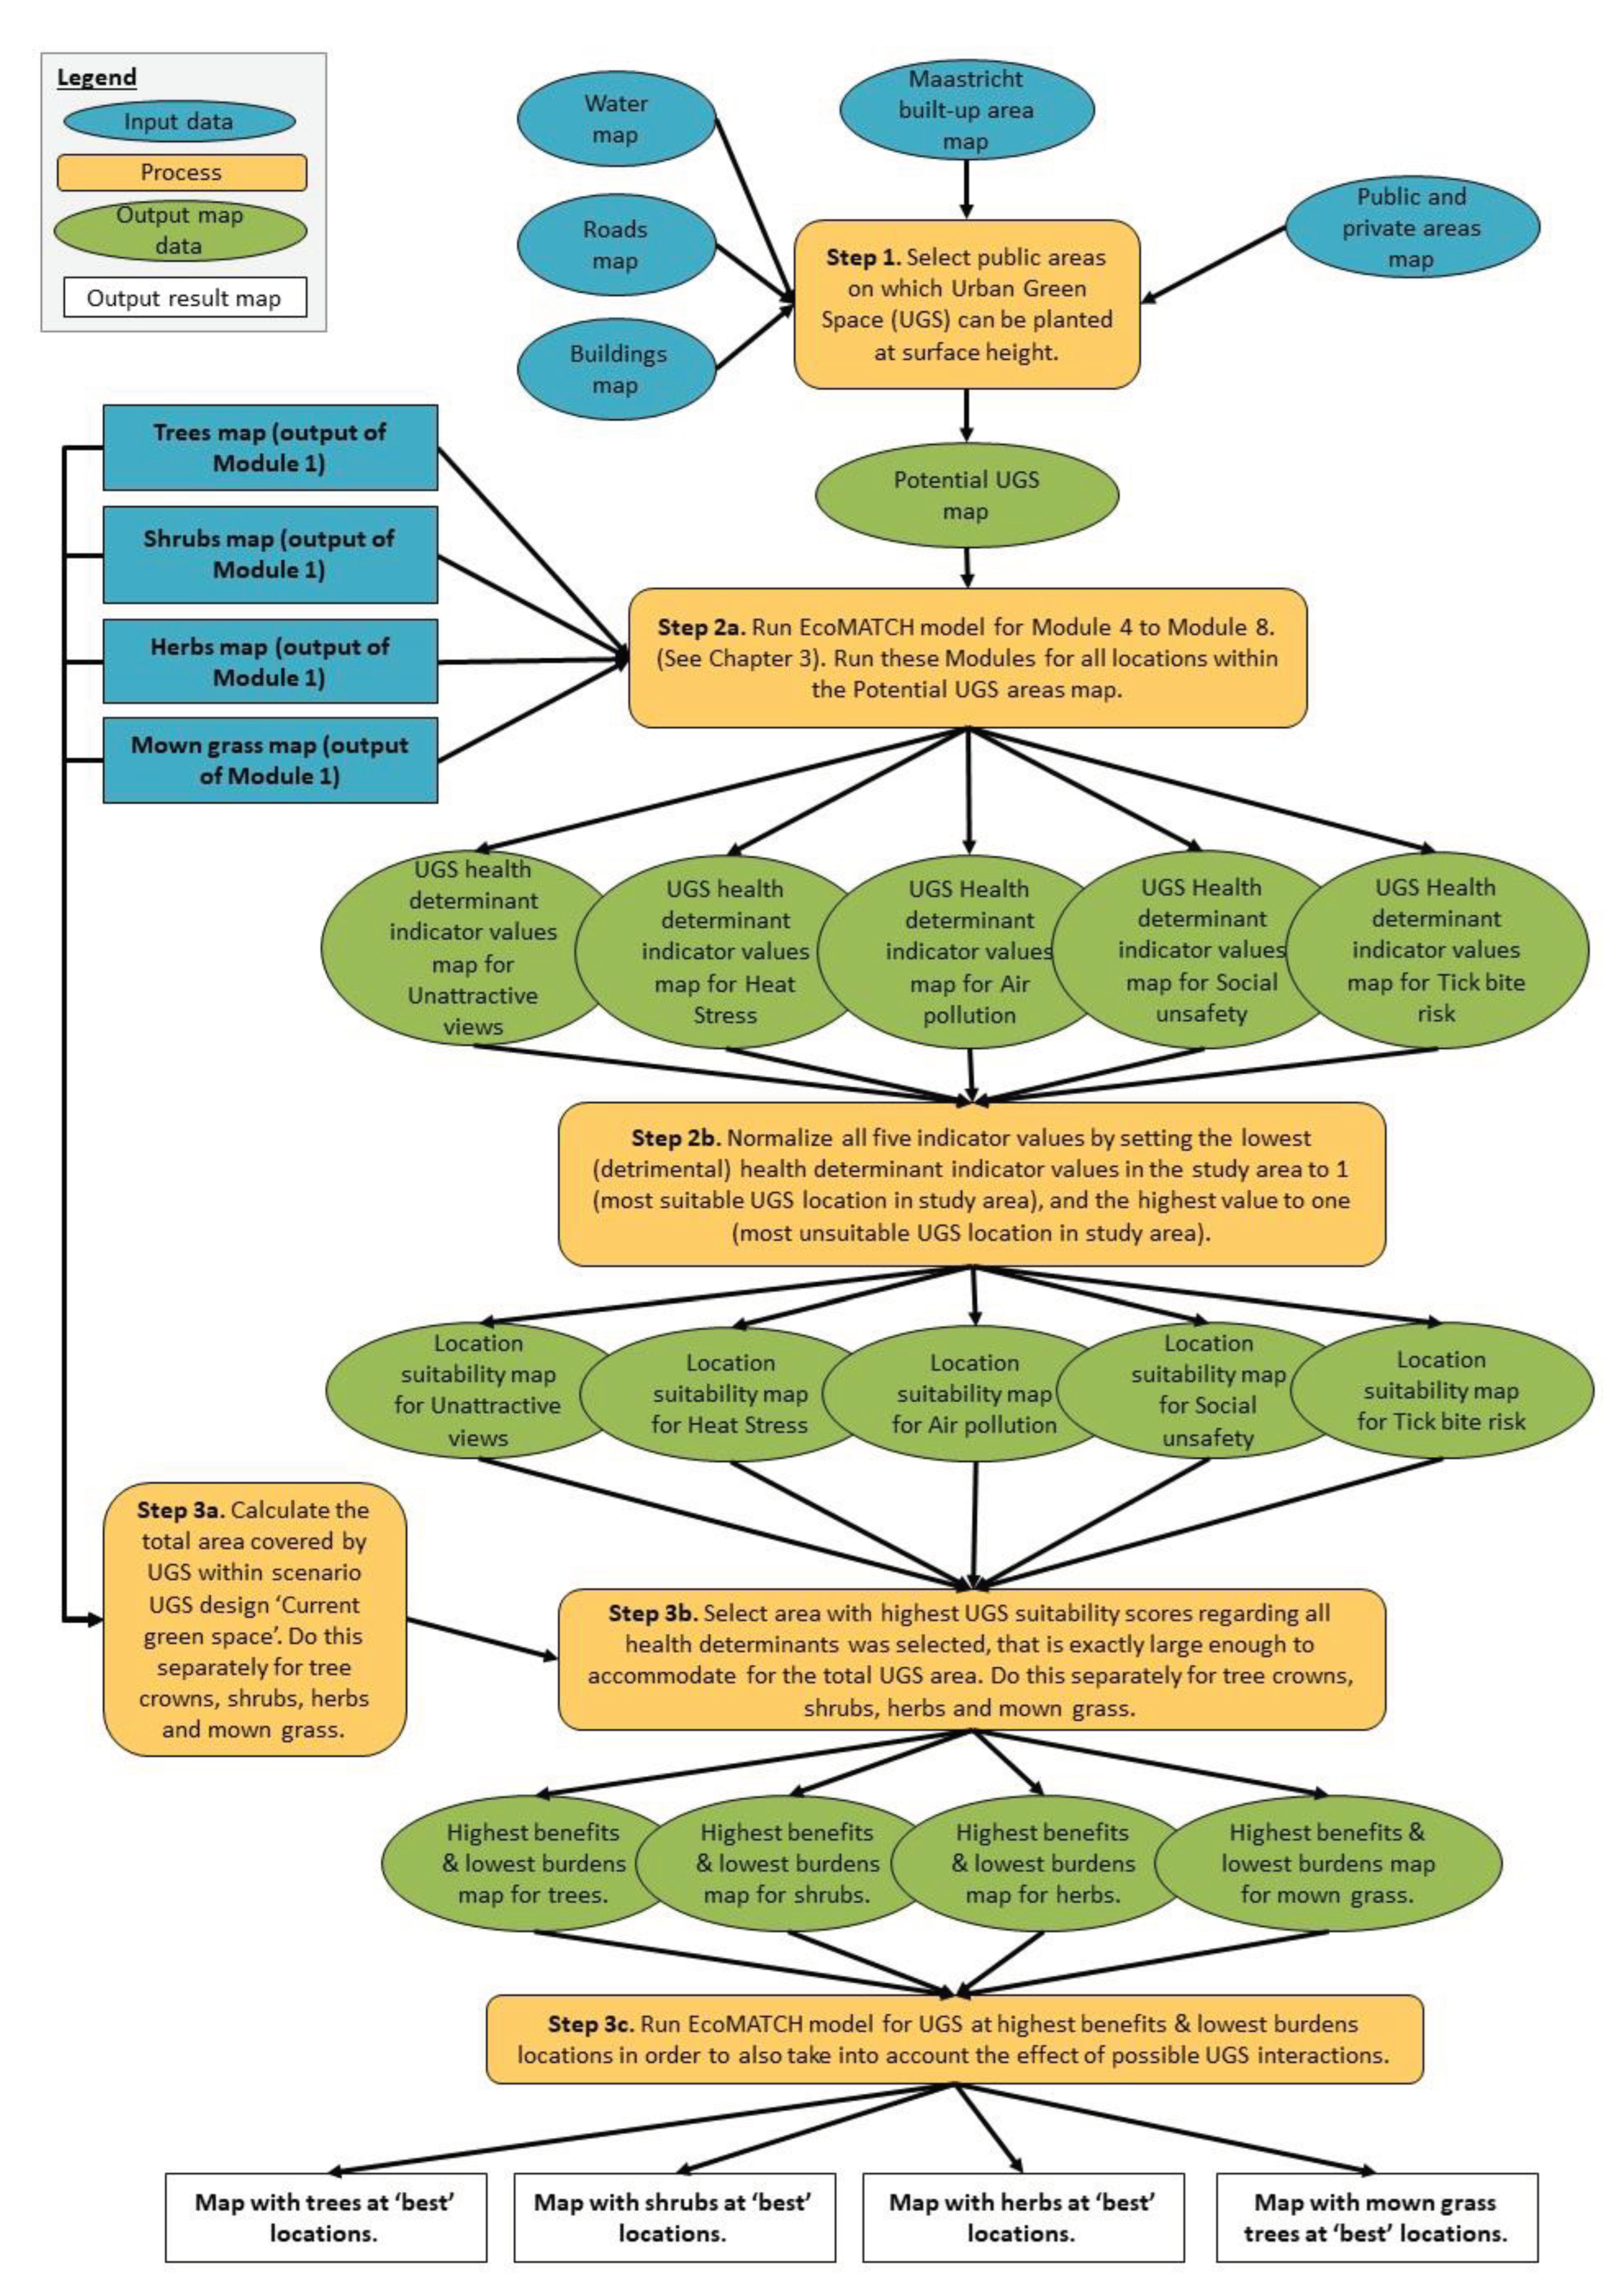
The ‘Optimized greenspace locations’ scenario was generated with module 9 (
Figure 1). The process of determining optimal UGS locations can be divided in three distinct steps, which are described in
Box 1 and
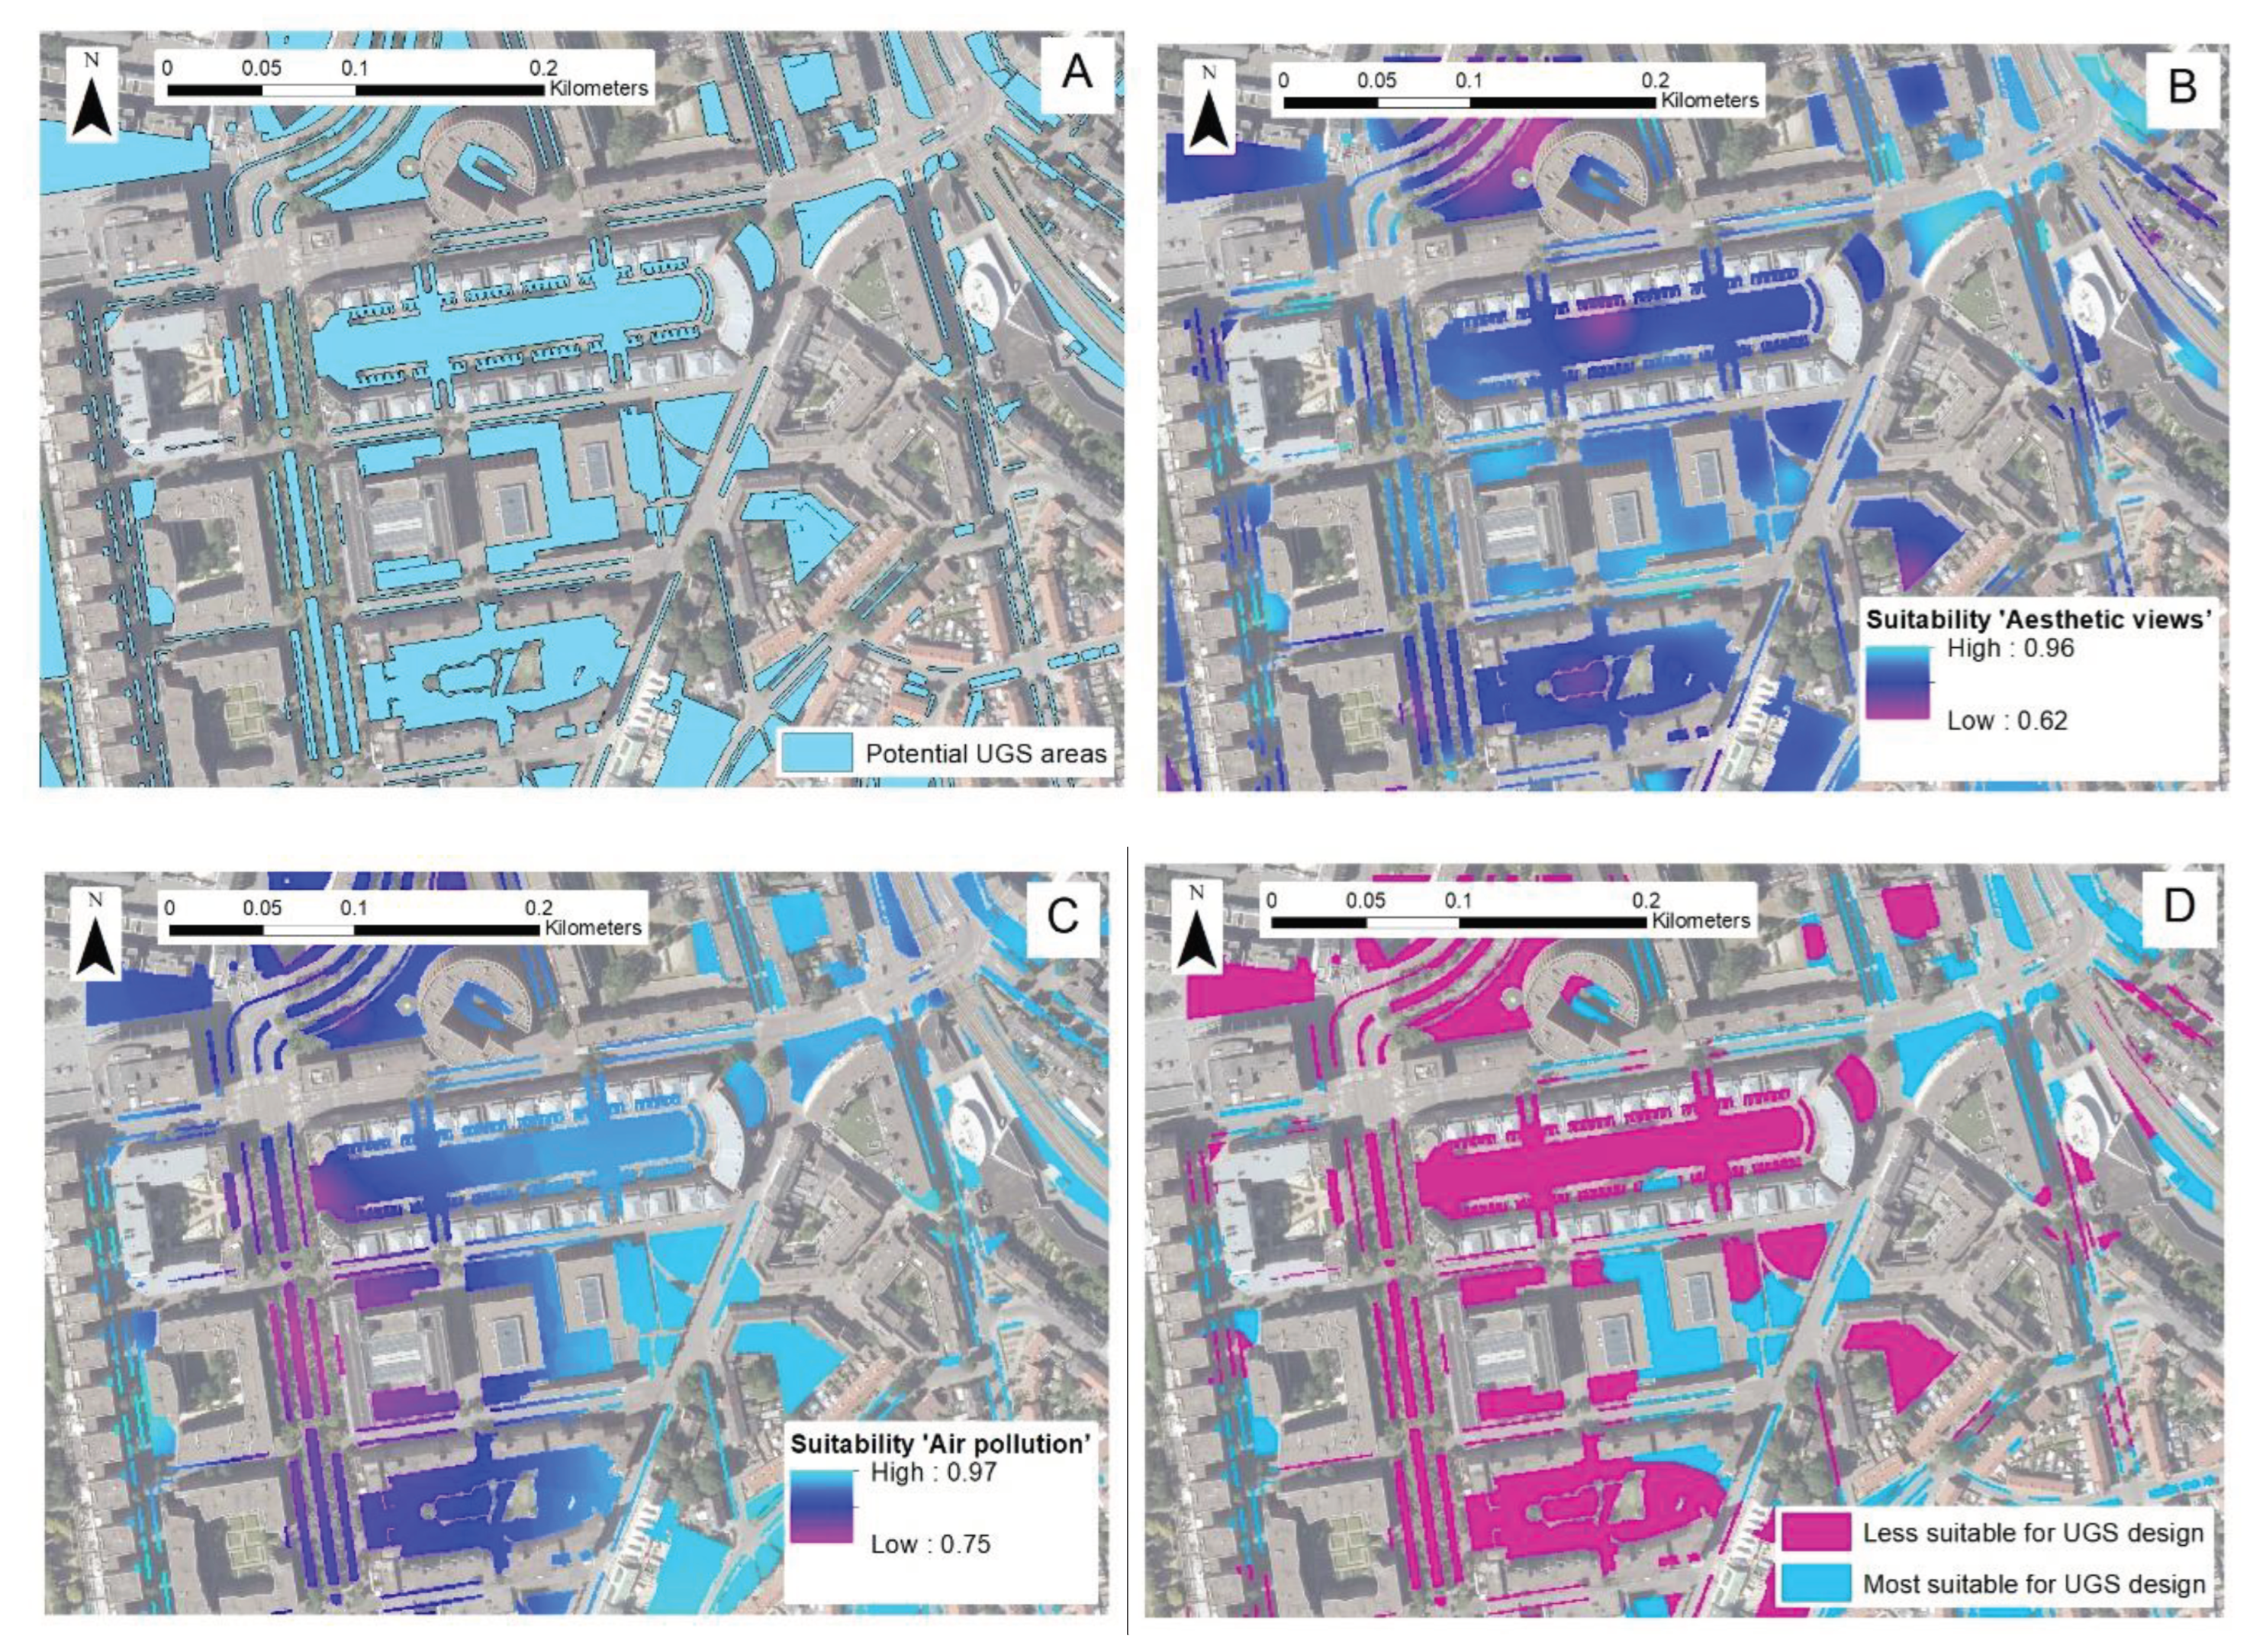
Figure 4. We will explain steps 2 and 3 using the specific example of location optimization for trees, and for the health determinants ‘Unattractive views’ and ‘Air pollution’.
Appendix A explains the geoprocessing methods applied in these steps in detail, including all parameter values and sources used.
Box 1. . Processing steps to create the Urban Green Space design scenario ‘Optimized greenspace locations’.
Step 1: Firstly,
we identified areas in Maastricht's built-up area
that may have potential for UGS (re)design. We only selected public areas and
areas of private owners that are accessible to the public (pedestrians).
Within these areas, we selected areas that were not covered by water,
buildings or roads (including footpaths), such as squares, lawns, herbaceous
areas, hedges, tree planting areas, parking lots, squares and paved area
around buildings. See
Figure 4A for an
example of location, number and size of these areas in this ‘potential UGS
areas map’.
Step 2:
Secondly, we constructed a separate 'UGS location
suitability map' for each of the five health determinants. This location
suitability map was created by running the model for all locations within the
potential UGS areas map from step 1, and calculating the UGS contribution.
Subsequently, (detrimental) health determinant indicator values for the UGS
contribution were inverted and normalized to range 0–1 by setting the highest
value in the study area to zero (most detrimental health effects, so lowest
suitability), and the lowest value to one (least detrimental health effects,
so highest suitability). In this ‘location suitability map’, the lowest
suitability values result from no/lowest beneficial UGS effects, or highest
detrimental UGS effects in the case of health-related burdens, and vice
versa. For example, for the UGS location suitability map of health
determinant ‘Unattractive views’, lowest suitability scores were assigned to
all locations that would not at all be visible by pedestrians. See Figure 4B and 4C for examples of tree
location suitability maps in view of the health determinants ‘Unattractive
views’ and ‘Air pollution’.
Step 3:
Next, we calculated the total area covered by tree
crowns within UGS design scenario ‘Current green space’ (representing the
situation in 2018). Subsequently, an area with the highest suitability scores
for all health determinants was selected, with the size of this area being
just sufficiently large to accommodate for the total tree crown area. The
result was a ‘highest benefits & lowest burdens map’ with sufficient
space to accommodate all trees from the Current UGS scenario (Figure 4D). Hence, this map indicates the
potential UGS areas that are most suitable to accommodate the total area
covered by trees in the most ‘healthy’ way. A similar procedure was
implemented to identify the most suitable potential UGS areas to accommodate
the other UGS types shrubs, herbs and grass (see Appendix A). Finally, the model was run for
all UGS types at these ‘optimal’ locations together, to also take the effect
of possible UGS interactions into account.
2.3. Threshold values to assess and compare UGS design scenarios
To assess the health impacts of the UGS design scenarios, the model-estimated indicator values of the health determinants were compared with threshold values for each health determinant (see
Table 1). The chosen thresholds have different origins. The Heat stress and Air pollution thresholds are based on peer-reviewed literature and official WHO guidelines respectively (Nouri et al., 2018; WHO, 2021). However, it should be noted that these choices are still pragmatic to a certain extent. Regarding the threshold for Air pollution, the NO
2 concentration below which health effects do not occur is much lower and often below background values (WHO, 2006). Regarding the threshold for Heat stress, temperatures above 35 °C PET are already categorized as ‘strong heat stress’ (Nouri et al., 2018), and this level is easily met for every street segment during a heatwave day in Maastricht. For example, air temperature at the hottest heatwave day in 2018 reached 37.5 °C (KNMI, 2021) and the model-estimated values for all street segments of Maastricht were above 35 °C PET. 'Extreme Heat Stress Level 2' (and not Level 1 or 3) was chosen to make differences between UGS design scenarios visible: it is a threshold value for which the frequency of exceedance varies between 0 and 100 percent for all scenarios (without being exactly 0 or 100 percent). The thresholds for Unattractive views, Perceived (social) unsafety and Tick-bite risk are based on intuitive cut-off values. Unattractive view indicator values above zero mean that unattractive objects are more dominant within the pedestrian’s field of view than attractive objects, so these areas are scored as ‘net unattractive’. A perceived social unsafety score of 50 is right in-between the minimum and maximum scores, so a street segment with this score would be perceived as neither really safe nor really unsafe. Finally, a threshold value for Tick-bite risk of 1% may intuitively make sense as people seem to perceive chances larger than one percent as being much more significant in general (Woloshin et al., 2000). This indicator can be considered the chance of being bitten during May to September: the period at which ticks are most active (Takken, 2016b).
3. Results
3.1. Greenspace Design Per Scenario
To show how the different scenarios work out in greenspace design, example area 1 is used to illustrate the differences. Example area 1, located in the city center, can on a more general level be regarded as representative for the entire built-up area of Maastricht. It contains types of footpath surroundings that are dominant in the city such as residential roads, more central local roads with a high traffic intensity, and squares. However, example area 1 does not include a park, whilst the city contains several parks. This also explains why the fraction of open area (the area without buildings/total area) is lower than that in the entire built-up area of Maastricht (70% vs. 82%). However, the differences in UGS design that we discuss below are illustrative for the entire built-up area of Maastricht, and apply to other areas in the city as well.
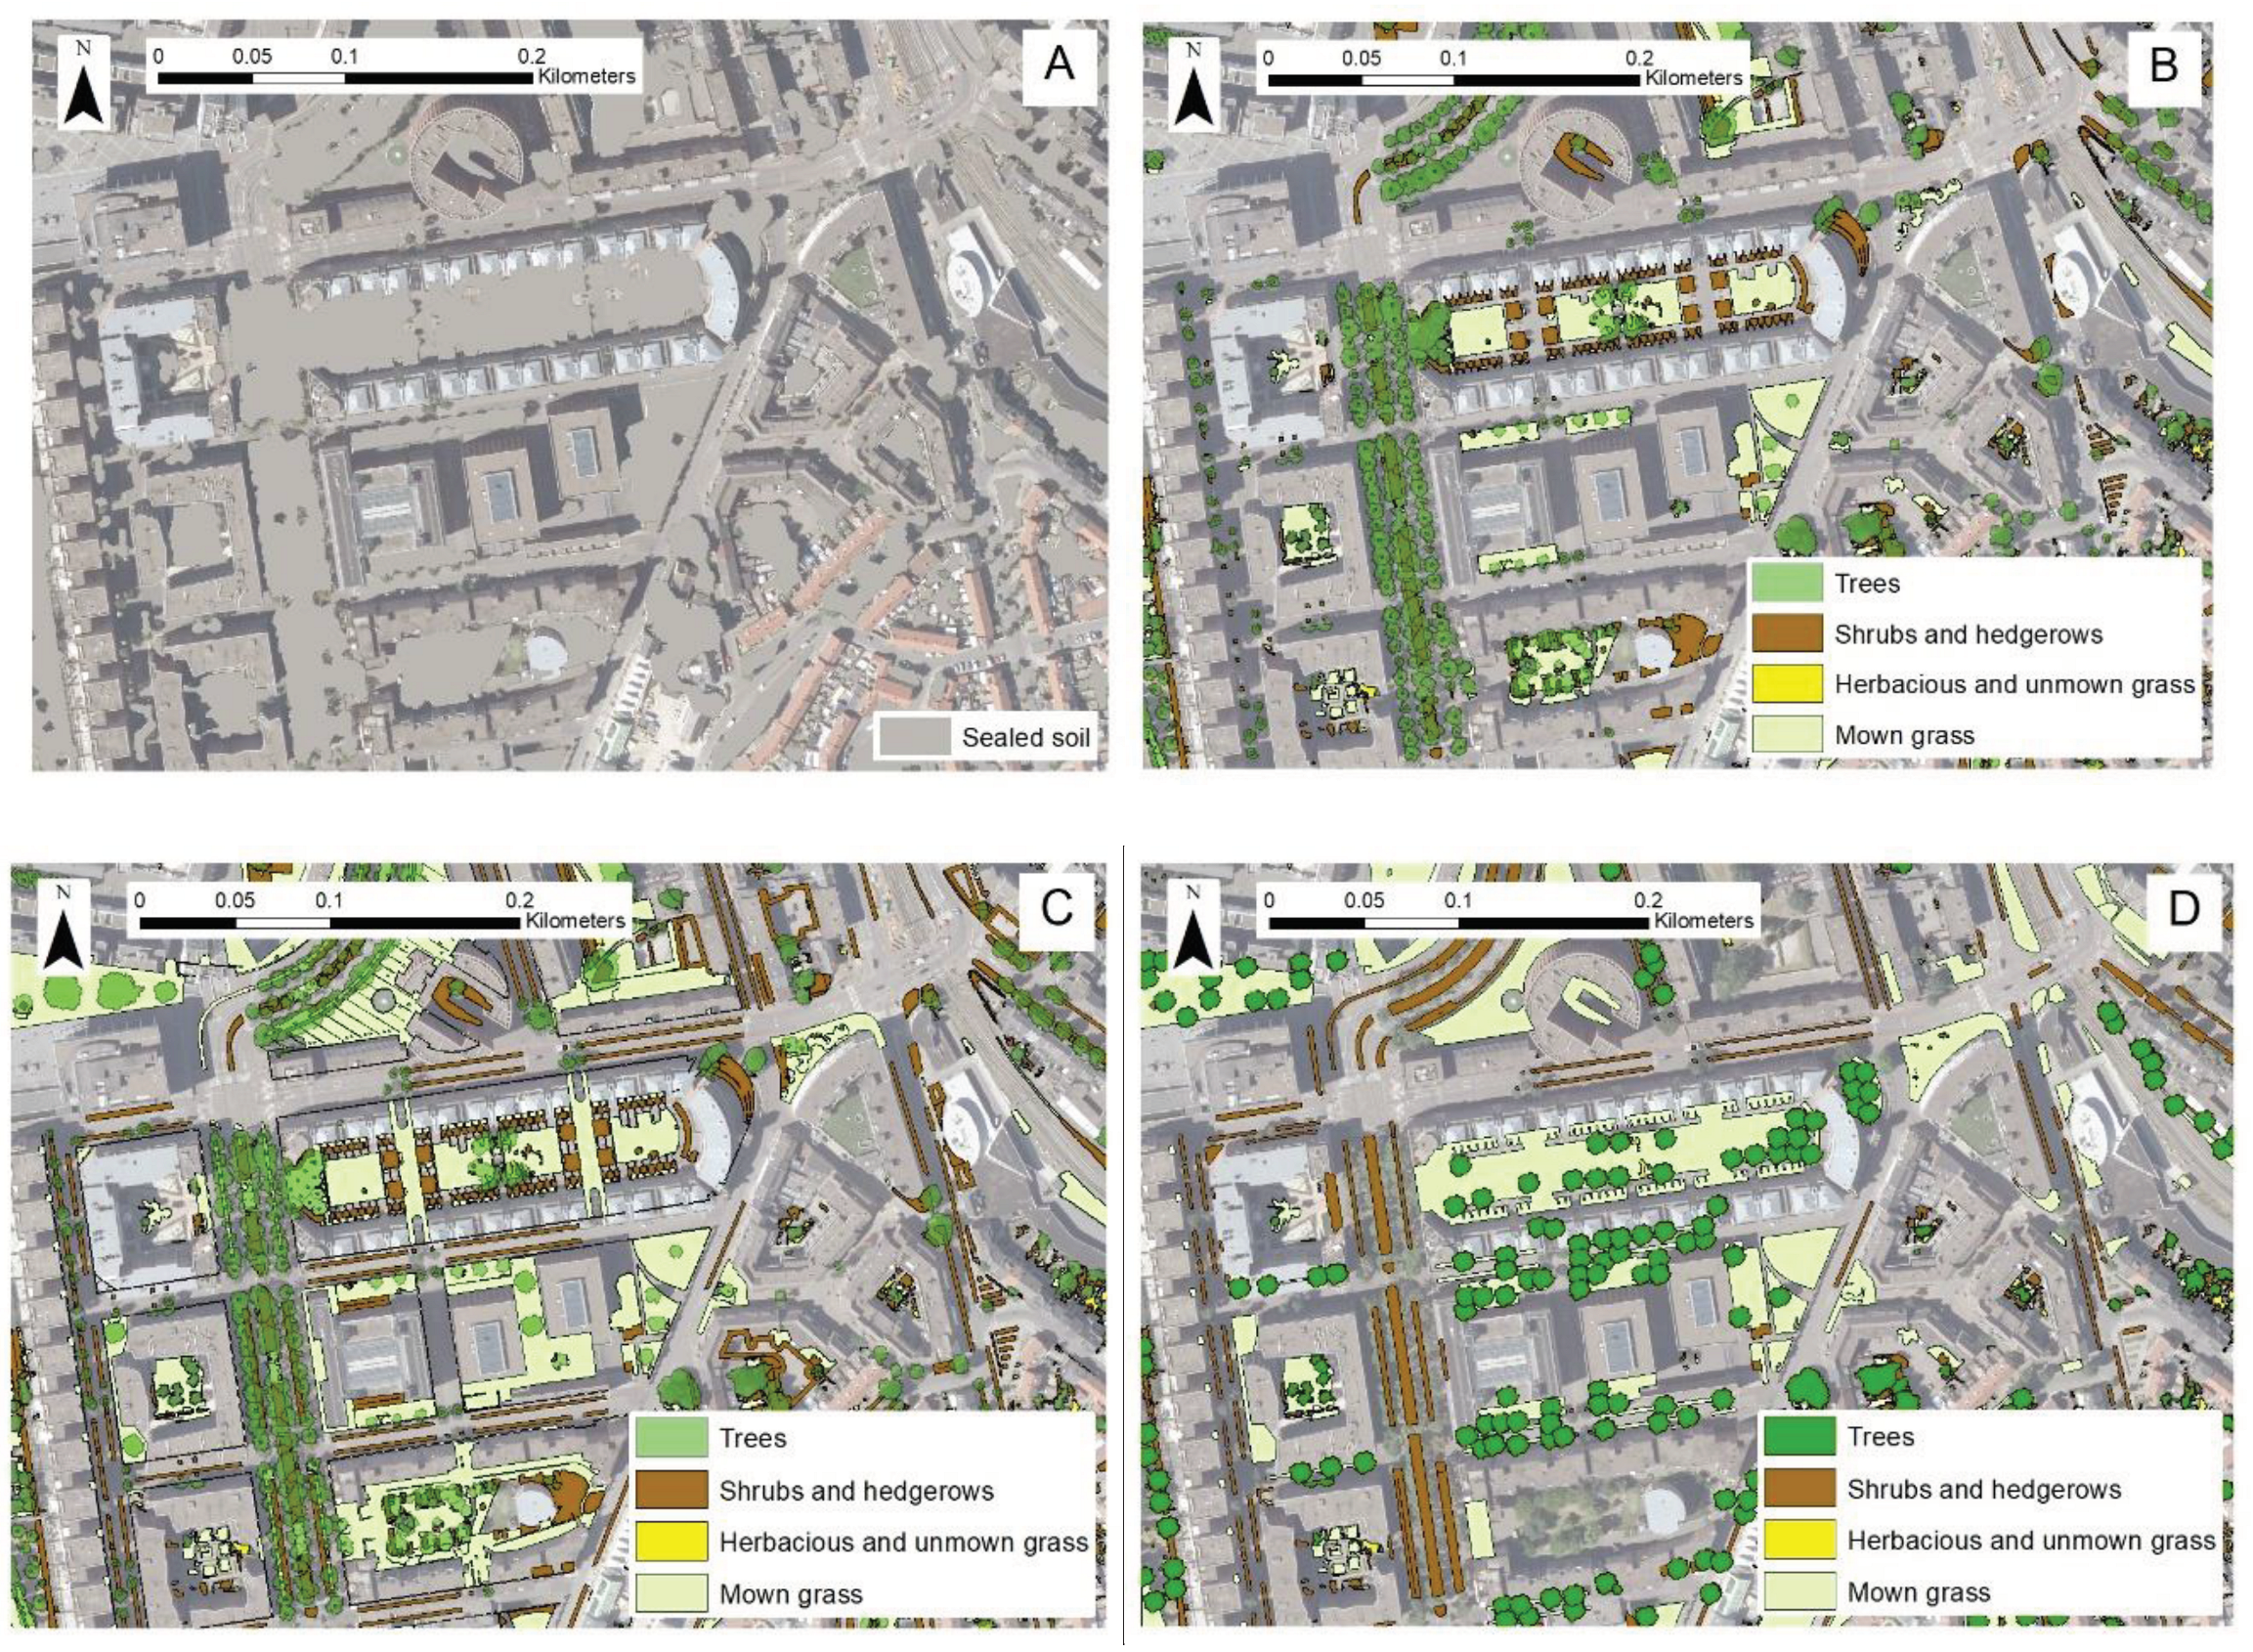
Figure 5 shows the green space design in example area 1 for the reference scenario (
Figure 5A), as well as for the three UGS design scenarios (
Figure 5B-D). Scenario ‘Green parking lots and squares’ (
Figure 5C) shows the effect of replacing all parking lots by grass fields with shrubs, and all squares by grass fields with trees. Compared to the scenario ‘Current greenspace’ (
Figure 5B), these areas are added as greenspace areas. However, for the entire open area of Maastricht, the part taken up by parking lots and squares is small (4%), so health effects can be expected to be relatively small as well. Moreover, most parking lots are individual (dispersed) parking lots alongside and mostly parallel to the road. In these areas there is often only space to add just one type of UGS. In these cases, we added only shrubs (hedgerows), as their volume is higher than mown grass. This potentially yields more benefits than mown grass in terms of reducing Heat Stress, Unattractive views and Air pollution. Comparing the scenario ‘Current greenspace’ (
Figure 5B) with the scenario ‘Optimized greenspace locations’ (
Figure 5D), shows that in the ‘optimized’ scenario less trees and more hedgerows are located next to roads that are more traffic-intensive. The opposite is true for less busy roads such as residential streets, which now contain more trees and less hedgerows next to roads. Furthermore, in scenario ‘Optimized greenspace locations’, squares are populated with more trees and filled with herbs and grass around these trees, while in parks, shrubs and herbs are removed from below trees. Trees further away from footpaths are partially removed as well and moved closer to footpaths, for example in residential areas. Finally, in all types of footpath surroundings, trees, shrubs and grass were relocated somewhat closer to footpaths.
3.2. Health Benefits and Burdens Per Scenario
Table 2 presents the results regarding health benefits and burdens, and the associated contributions of UGS, for the reference scenario (‘No greenspace’) and the three UGS design scenarios (‘Current green space’; ‘Green parking lots and squares’; ‘Optimized greenspace locations’).
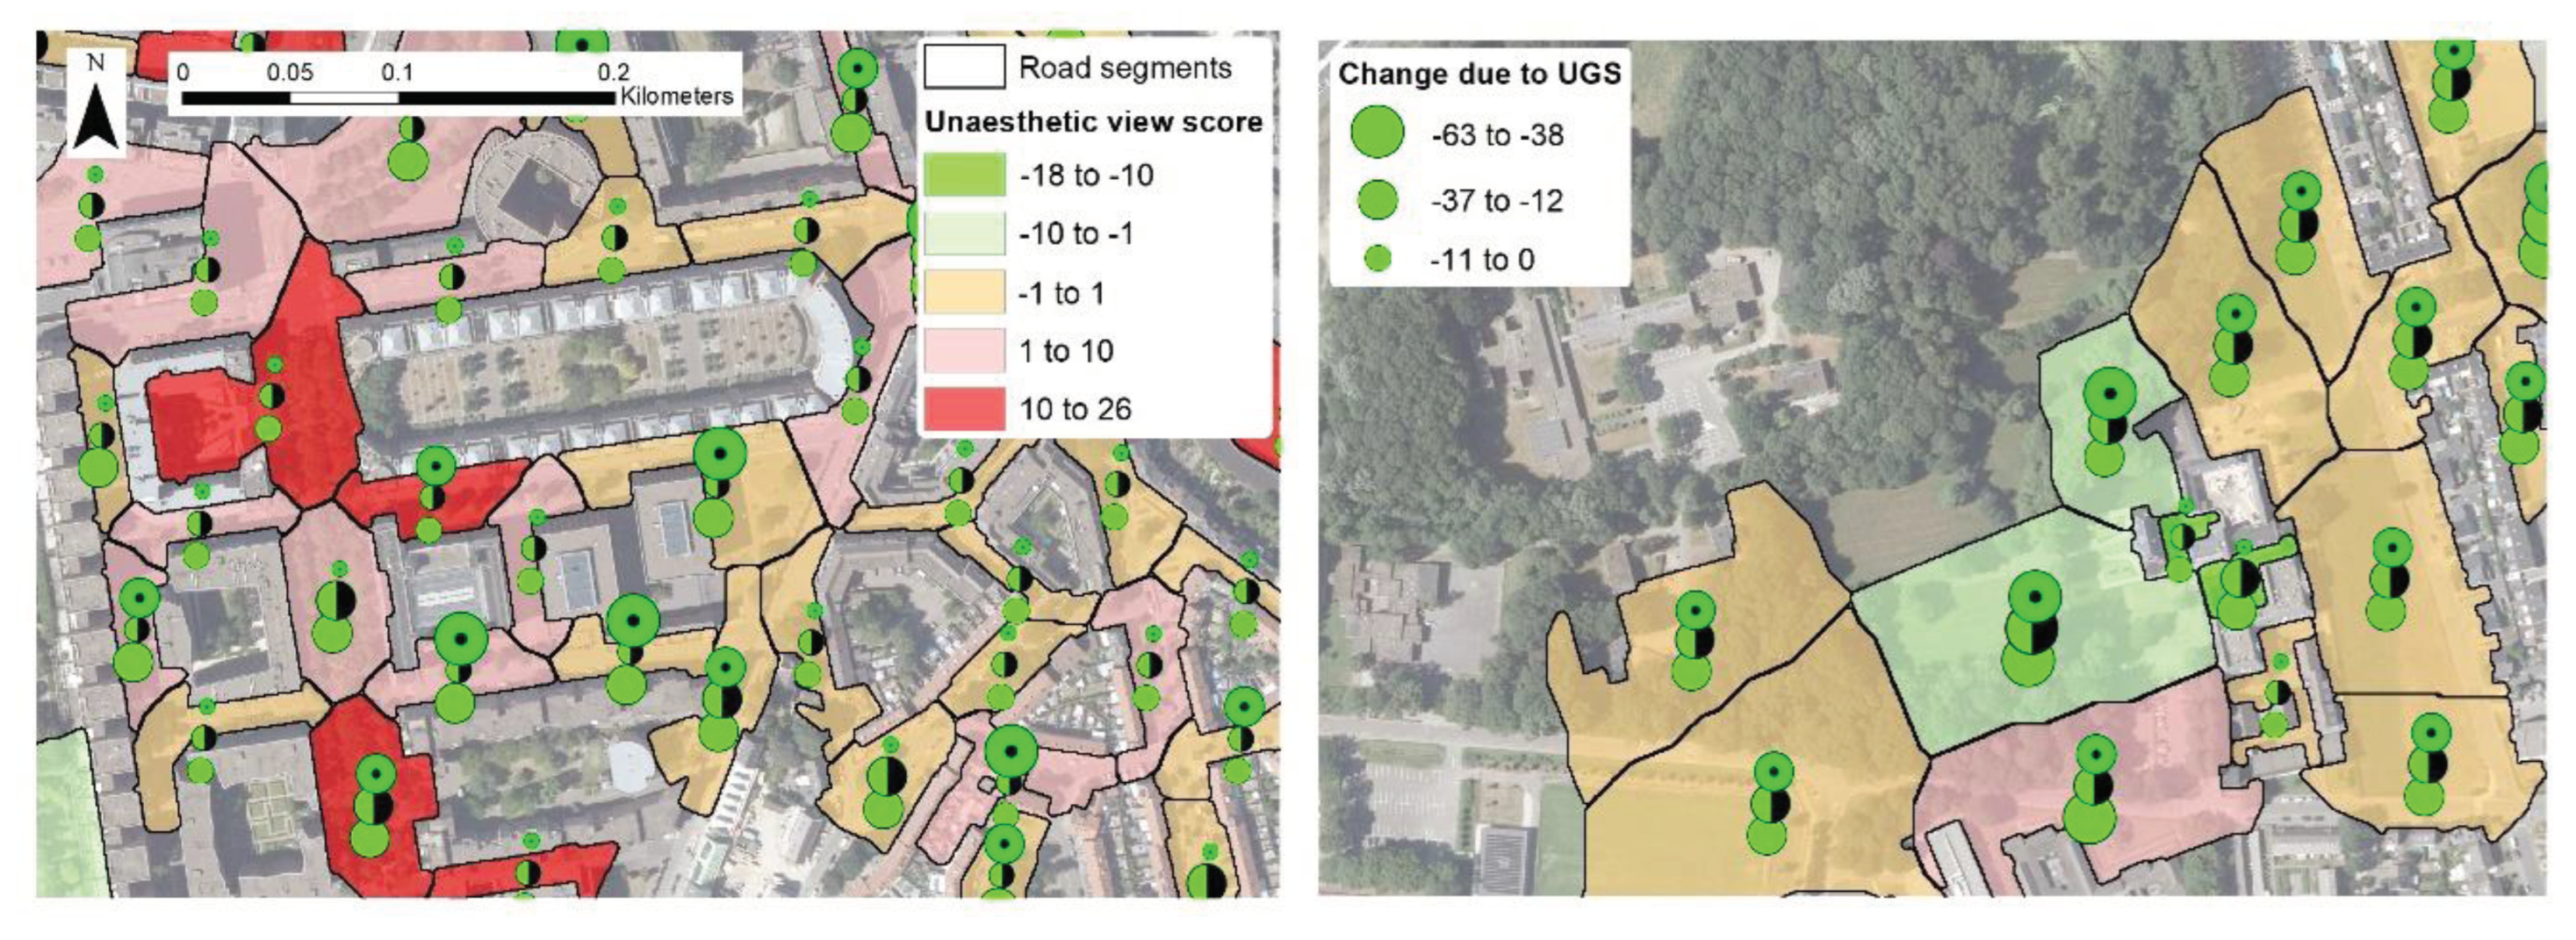
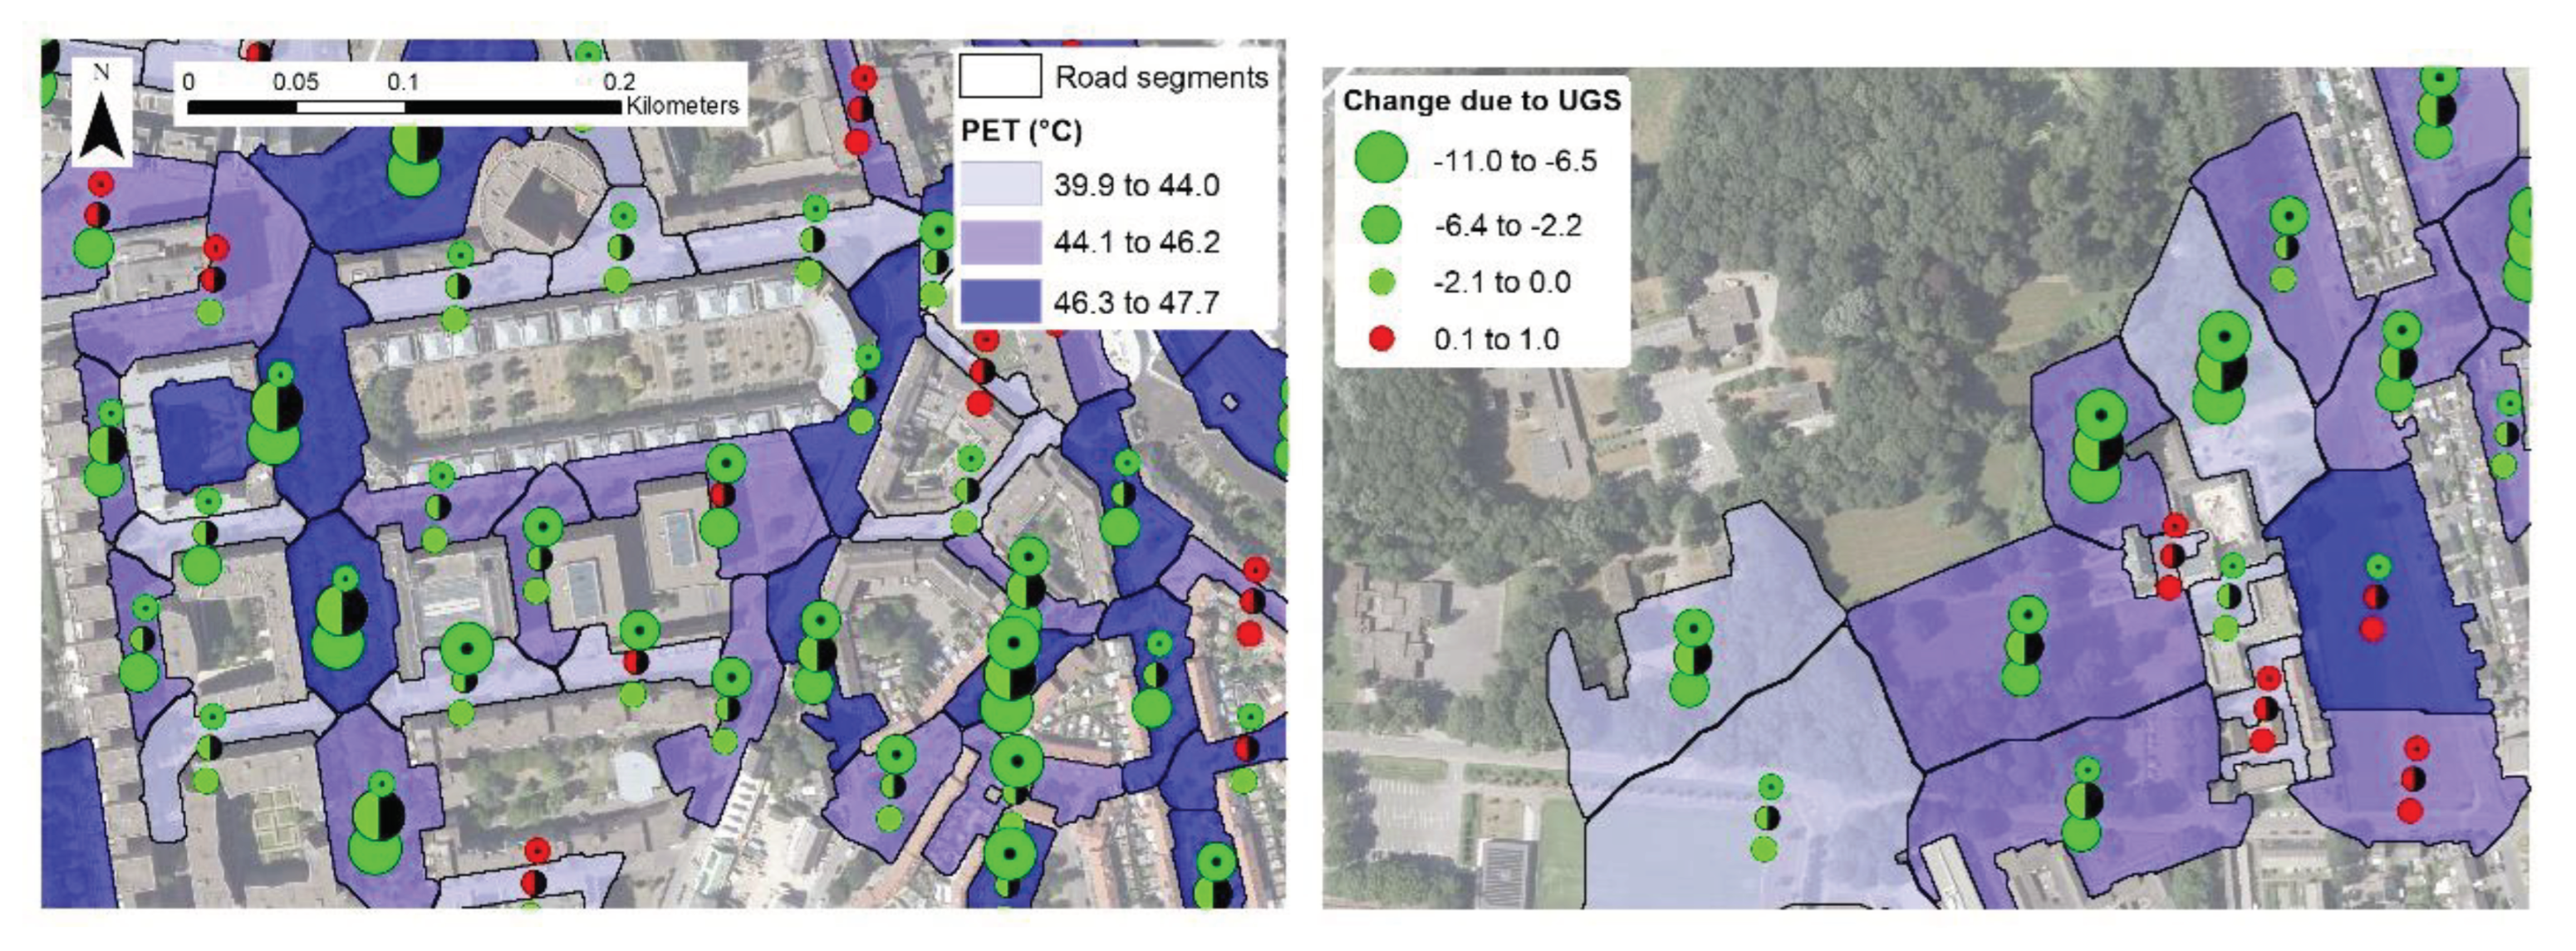
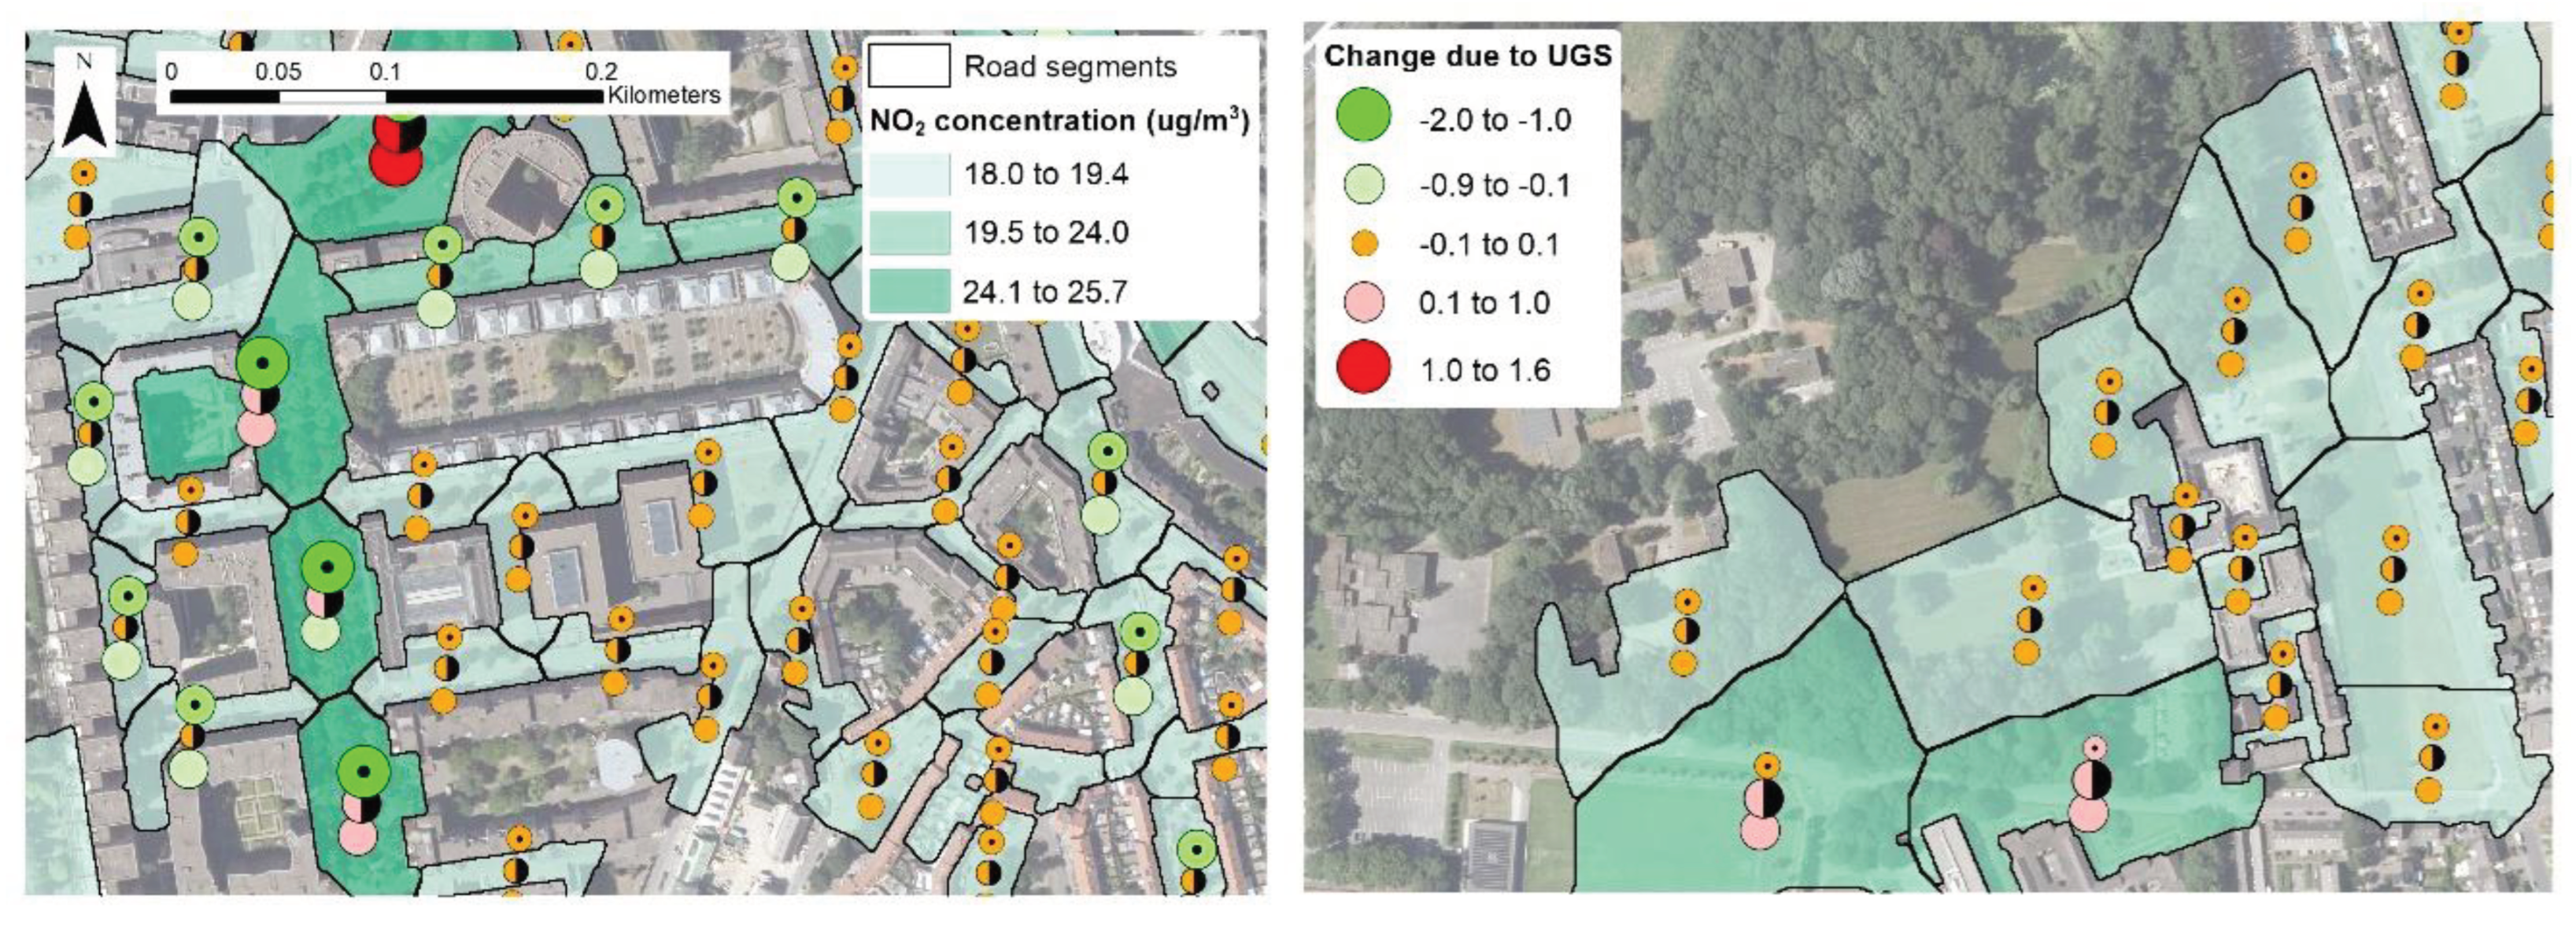
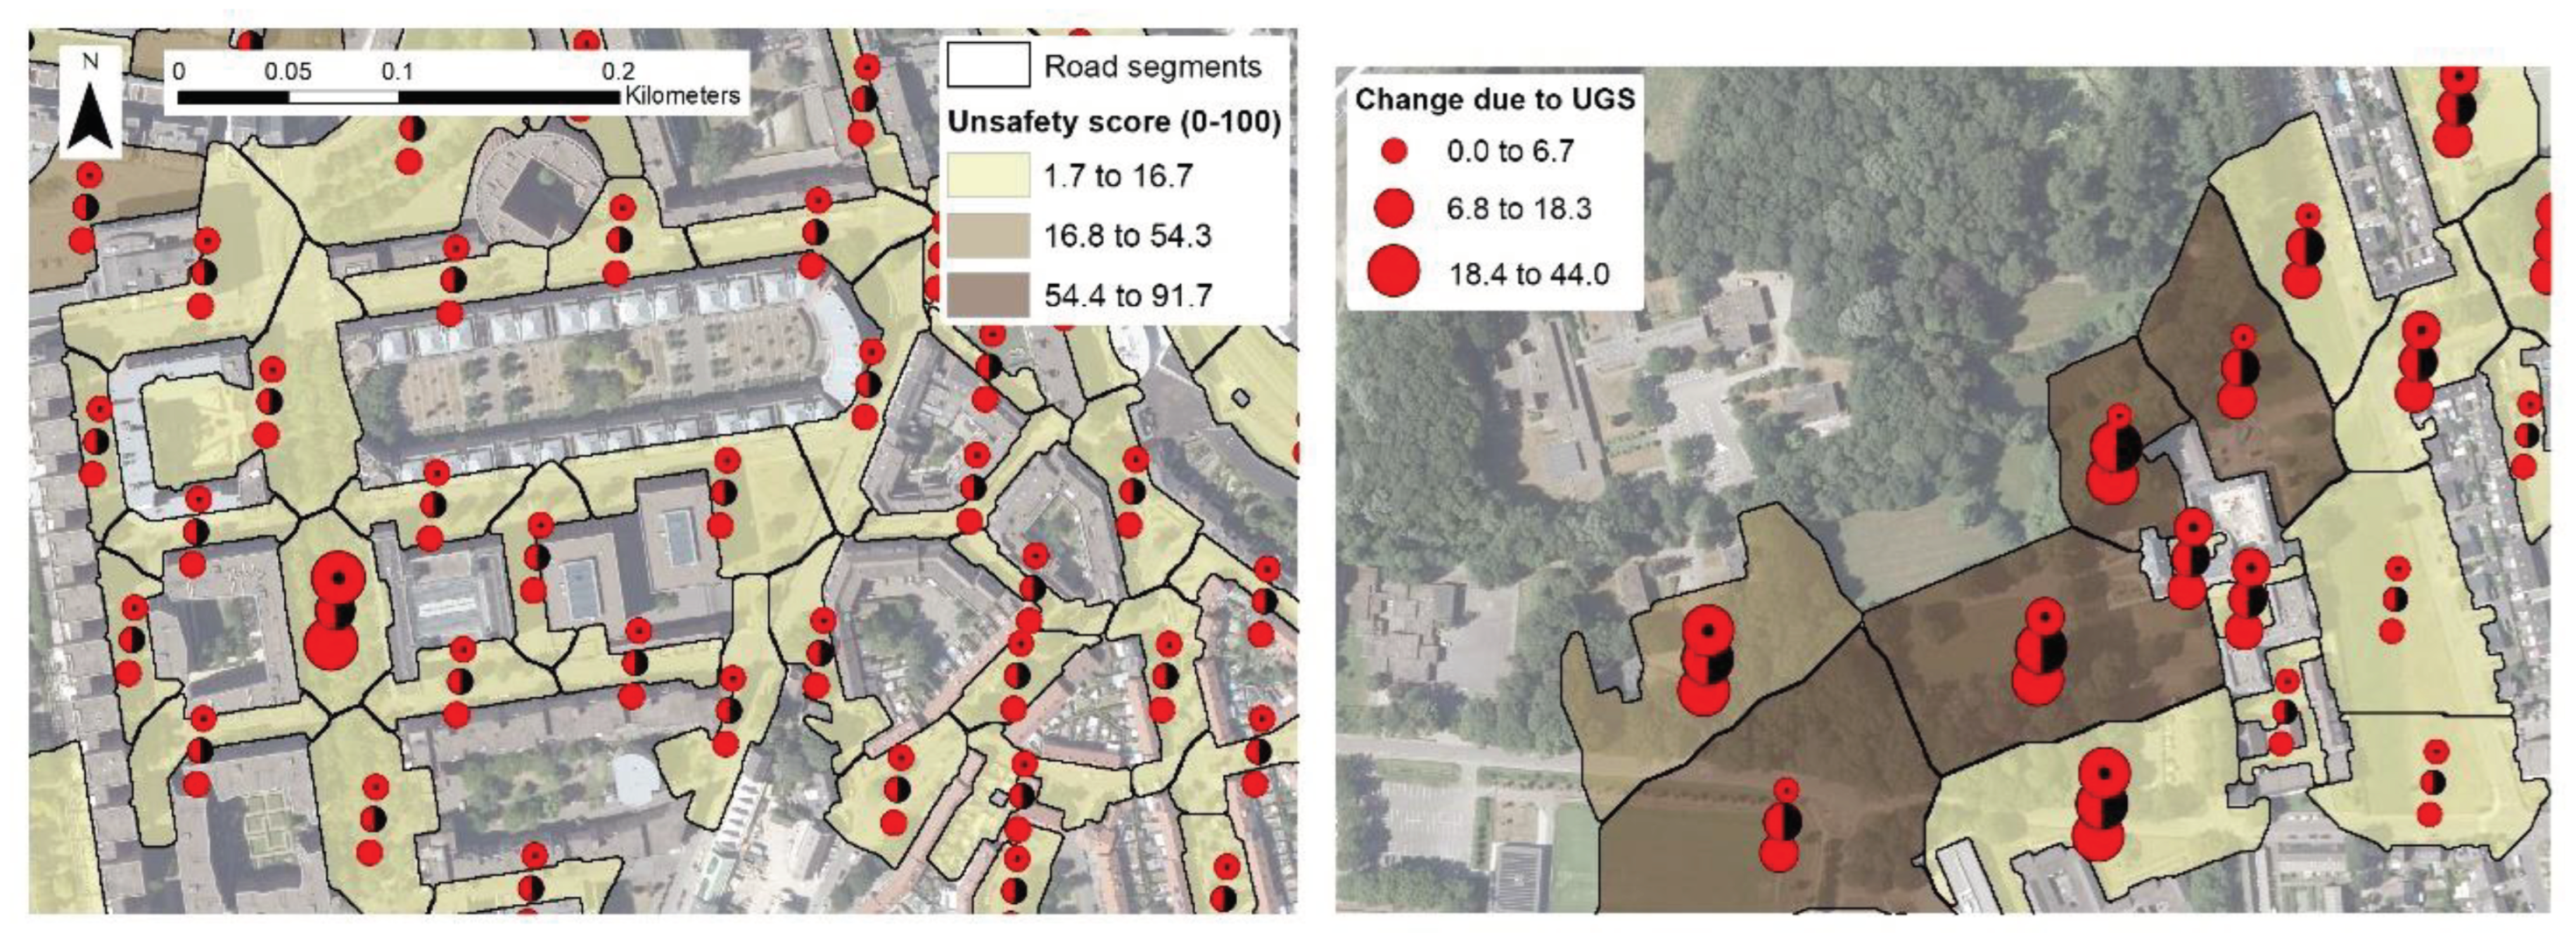
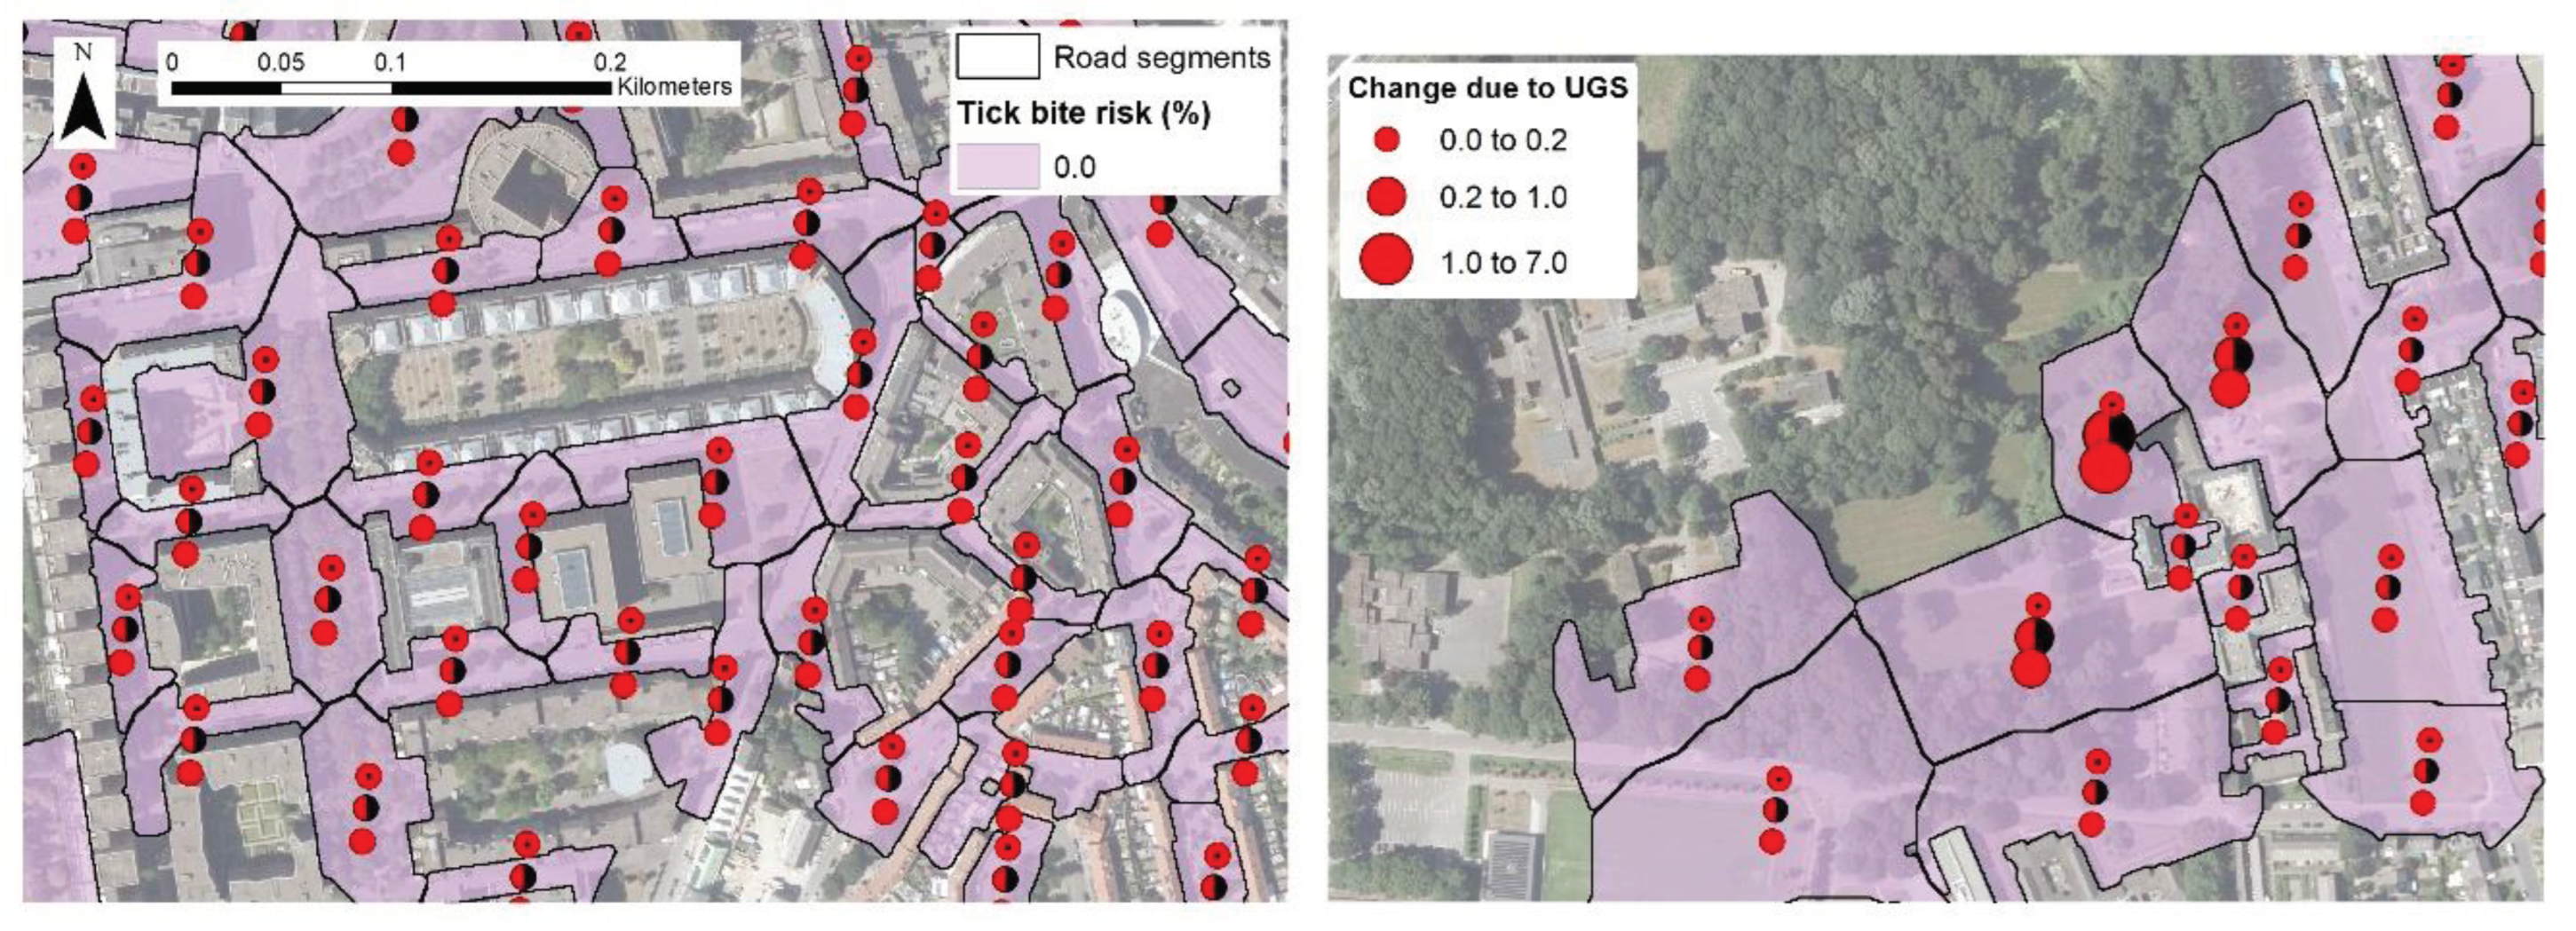
Figure 6,
Figure 7,
Figure 8,
Figure 9 and
Figure 10 show these results at neighborhood-scale (within the example areas), to give an impression of local variation in the values of health determinants and UGS contributions. In these figures and table, the UGS contributions are expressed such that negative values should be interpreted as beneficial for human health because they reduce detrimental health determinant values. Vice versa, positive UGS contribution values should be interpreted as detrimental for human health. Values for health determinant ‘Unattractive views’ can also be negative, which should be interpreted as beneficial for health as well, as negative scores mean that attractive objects are more dominant for a certain footpath segment.
Overall,
Table 2 shows that with the current UGS design of Maastricht’s built-up area, numerous street segments exceed the threshold values (provided in
Table 1). Yet, for Heat stress and Unattractive views, the average indicator value and in particular the exceedance frequency are much reduced compared to the ‘No greenspace’ scenario, indicating substantial health benefits of current UGS. For Perceived unsafety and Tick-bite risk, and to a lesser extent for Air pollution, the average indicator value and exceedance frequency are higher, indicating that current UGS has a detrimental effect on health with respect to these determinants. Compared to the ‘Current greenspace' scenario, implementation of scenario ‘Green parking lots and squares’ is estimated to result in a further decrease of Heat Stress and Unattractive views, and a slight increase in Perceived unsafety and Tick-bite risk. The UGS contribution to Air pollution remains relatively small, but changes from a burden into a benefit. Implementation of scenario ‘Optimized greenspace locations’ is estimated to only slightly increase Perceived unsafety, whilst (beneficially) decreasing the indicator values of the four other health determinants. This translates into even stronger reductions in the number of street segments that exceed threshold levels, especially for Heat stress, Unattractive views and Tick-bite risk. However, for the Unattractive views, the exceedance frequency did not decrease as much as in the ‘Green parking lots and squares’ scenario. This is because street segments that scored lower (i.e., were considered more attractive) in the ‘Optimized greenspace locations’ scenario, were mainly those that already scored below the Unattractive views threshold in the ‘Current greenspace’ scenario.
The following paragraphs detail the changes in UGS design and their associated effects on health determinants for the scenarios ‘Green parking lots and squares’ and ‘Optimized greenspace locations’, in both cases in comparison to scenario ‘Current greenspace’.
Detailed Results for the Scenario ‘Green Parking Lots and Squares’
The strategy of greening all parking lots and squares adds 4% additional UGS cover, expressed as a percentage of Maastricht’s built-up area in 2018. In this UGS design scenario, pedestrians are better shielded from air pollution through hedgerows that replaced parking lots, especially close to roads with high traffic intensity. Since the hedgerows and shrubs were not too tall, the perceived unsafety did not increase much, as the view and sightline are only slightly blocked by the hedgerows (only directly behind the hedgerow). The greening of squares and larger parking places notably decreased the score for unattractive views. The number of larger squares in Maastricht that were filled with grass and trees was small, but where they were present, this led to a local reduction in heat stress due to the combined effect of tree shading and reduced thermal radiation from the grass. Some neighborhoods, however, have shaded parking lots in areas that qualify as potential tick habitat. Adding shrubs to these parking lots increased the estimated tick-bite risk in these areas.
Detailed Results for the Scenario ‘Optimized Greenspace Locations’
In the ‘Optimized greenspace locations’ scenario, the optimization method moved trees out of street canyons with traffic-intensive roads. This resulted in a smaller local street canyon effect, reducing local pedestrian-level air pollution (see
Figure 8). Although the absence of trees at these locations resulted in increased local heat stress, it did not result in an increase in the average heat stress at the neighborhood and city scale, since a large part of these trees was relocated to streets with less car emissions, such as residential roads. At these locations, those trees had an often slightly lower (because such streets are often already slightly more shaded through buildings), but still substantial effect on decreasing heat stress. The optimization method also moved trees that were located further away from footpaths, to less traffic-intensive streets, where they were more effective in reducing Unattractive views and Heat stress. Similar to the ‘Green parking lots and squares’ scenario, shrubs were located alongside busy roads, instead of e.g. as solitary shrubs alongside less busy roads or further away from footpaths. This mainly decreased Air pollution, but also (to a lesser extent) decreased Heat stress and Unattractive views. Where possible, trees and shrubs located further away from footpaths as well as trees from street canyons were relocated adjacent to busy roads with an open road situation. As such, they formed vegetation barriers, reducing air pollution levels. However, this form of optimization of location was not often implemented, as most busy street segments are not in open road situations, and the distance between road and footpath is often too small. Relocating shrubs and herbs, mainly from park-like areas, to squares, reduced Unattractive views and Heat stress. The summed effect of relocating UGS especially had an effect on Unattractive views and Heat stress: Unattractive view threshold exceedances were reduced from 87% to 16%, combined with a Heat stress reduction of about 3 °C PET.
Similar to the scenario ‘Green parking lots and squares’, the area-weighted average Perceived unsafety was estimated to only slightly increase. This can be explained by two factors: 1) relocated hedgerows only slightly blocked view and sightline of pedestrians, and 2) only trees with high crowns were moved closer to pedestrian areas. Another reason why Perceived unsafety only showed a slight increase, is that the optimization method replaced trees closer to the footpath with low tree crowns as well as tall shrubs with trees with high tree crowns. In contrast with the UGS design scenario ‘Green parking lots and squares’, the optimization method did not add shrubs in areas with overarching trees, very nearby footpaths or in tick host habitats. As a result, values for Tick-bite risk did not increase. For street segments with a tick-bite risk larger than zero in the ‘Current greenspace’ scenario and with only publicly accessible UGS affecting footpaths, this value was reduced to zero in the ‘Optimized greenspace locations’ scenario. This was due to the fact that all shrubs and herbs were removed from these places (to be relocated as, for example, street-adjacent hedgerows), and replaced by mown grass where possible.
4. Discussion and Conclusion
This section discusses the major findings and their implications for urban greening strategy, as well as the limitations of this scenario study. We end with a conclusion on the key contributions of the study and the priorities for further research.
4.1. Major Findings and Implications for Urban Greenspace Planning
The results of this scenario study of urban greening strategies can be summarized into four major findings with important implications for urban greenspace planning. First, when the health effects of UGS designs are assessed by the average indicator values of health determinants or when assessed by the frequencies of exceedance of pre-set thresholds, the outcomes may differ. As urban decision makers are most probably more concerned about exceedance of thresholds than about average indicator values, this finding stresses the importance of translating general urban health policy objectives and priorities into specific threshold or target values, and using these values when assessing the effectiveness of proposed greening strategies. Second, there is a real risk that a greening strategy not only results in greater health benefits of UGS, but increases health burdens as well. This means that ‘more green’ is not always an improvement from a health perspective, and that greening strategies should be carefully considered. This leads to the third major finding, which is that – within certain limits – ‘location’ matters more than ‘area’ of UGS, and that well-considered positioning of the various UGS types can reduce trade-offs between beneficial and detrimental effects of UGS. For urban greenspace planning, this implies that it is important to consider UGS location already in an early stage of urban development, as relocating well-developed trees and shrubs is costly and often not even feasible. The analysis of the ‘Optimized greenspace locations’ scenario suggests that a strong reduction in trade-offs between benefits and burdens can already be achieved with only a limited set of UGS design principles. The fourth and final major finding concerns Air pollution. The results show that UGS can have an overall detrimental or beneficial effect, and that a current net burden can be changed into a net benefit by adding more UGS area or changing UGS location. However, the results also show that in both cases the UGS contribution is relatively small, which means that urban spatial planners should realize that greenspace is unlikely to be a major solution to serious air pollution problems.
4.2. Limitations
The approach followed in this assessment of alternative UGS designs has various limitations, which means that in particular the method to determine the optimal location of UGS cannot be implemented in practice without further consideration. First of all, other factors than health were not included in this method. An important factor to consider when choosing a UGS location is the cost of planting and maintenance. It might be much more expensive to keep vegetation alive at the ‘optimal’ location (e.g. due to watering requirements), or to prevent it from being a nuisance to the people living or working nearby (e.g. due to pruning requirements or the need to remove leaf litter). Also conservation of urban biodiversity or cultural heritage can be important factors to consider in UGS design, just as social factors (e.g. optimizing UGS to promote interaction between certain social groups). Another limitation of the approach is that there are other health benefits and burdens of UGS, that have not been taken into account, but that might change optimal locations. For example, trees (e.g. birches) also produce pollen, resulting in sometimes very serious hay fever symptoms.
Finally, the model does not provide an estimate of the overall net health outcome of a given UGS design, which also limits its optimization capacity. A first step would be to include actual health outcomes, such as disease. Examples are the calculation of a reduction in cardiovascular diseases based on an estimated decrease in air pollution, or an epidemiological exposure-response curve to link heat stress (PET) to mortality. Not only would this improvement result in indicators that are more tangible for local decision makers, spatial planners and residents, but it would also be more easy to perform a monetary valuation of the health benefits of greenspace, for example in the form of avoided medical costs or avoided sick leave costs.
However, specific disease and disability burden indicators for all health determinant types included in the model would be in different metrics, as it would concern the increase or reduction of specific and thus differing diseases. Integrating these actual health outcomes with a common metric would have even more advantages. Firstly, it would offer the ability to fully optimize greenspace (or other spatial features of cities) for human health. Secondly, the total health (outcome) burden as well as the total UGS (or other spatial feature) contribution to the total health burden could be expressed in a single comparable figure for each urban design scenario. Modelling actual health effects of UGS design in terms of disease burden, therefore requires two additional model development steps: 1) translation of the current health determinant indicators into specific disease or disability indicators, for example via quantitative epidemiological exposure-response models, and 2) translation of these disease or disability indicators into an aggregate health indicator or common metric.
Regarding step 1, translation to specific disease or disability indicators seems more straightforward for determinants such as air pollution and heat stress using exposure-response curves, as well as traffic unsafety and tick bites using percentage of cases. However, even for these health determinants there would still be challenges, mainly related to data availability to generate exposure-response curves for the urban context. For health determinants such as Unattractive views, Perceived unsafety and Active transport, data availability may be even much lower. Regarding step 2, common metrics to express the burden of different diseases or disabilities, are for example mortality, life expectancy, the disability adjusted life year (DALY), a (possibly more directly correlated) monetary value such as avoided costs of hospital visits or the number of affected people. DALYs account for both years of life lost due to mortality and years lost due to disability due to a health condition (WHO, 2017). They can include the effects of several non-lethal diseases and conditions with severe effects on well-being. However, the DALY approach makes use of disability weight factors (reflecting the severity of the disease) which are often difficult to estimate.
4.3. Conclusion
We presented a novel approach to support the development of urban greening strategies aimed at promoting residents’ health. The approach involves a model-based assessment of the effectiveness of alternative city-scale UGS design scenarios that is integrated, quantitative and spatially explicit, and accounts for multiple health benefits as well as burdens. The scenario study was conducted for a specific case study city (Maastricht) and led to clear conclusions about the health benefits and burdens of concrete UGS designs for this city, but also generated novel, more general insights relevant to planning of UGS for health. These insights notably concern the importance of translating health policy objectives into specific target values or thresholds, and the importance of ‘smart’ choices in UGS location that can effectively reduce trade-offs between the health benefits and burdens of urban greening. Priorities for future research, addressing limitations of the current approach, concern the expansion of the range of health benefits and burdens of UGS covered by the model, and the development of a common metric for the entire range of health benefits and burdens allowing optimization of UGS design to maximize its overall net health benefit.
Acknowledgments
We would like to thank Anouk Schmid, municipal greening strategist of Maastricht, for contributing to this research by co-formulating the scenario ‘Green parking lots and squares’.
Appendix A. Overview of the Geo-Processing Method to Create Scenario ‘Optimized Greenspace Locations’
This Appendix provides an overview of the method to create the computer-generated green space scenario, by presenting a diagram with geo-processing steps.
Figure A1 displays the steps to create this scenario. The code of this component was written in Python programming language (python.org) because of its compatibility with the ArcGIS geo-information software that we used (arcgis.com). See Oosterbroek et al. (2023) for a complete explanation of the model geoprocessing.
Figure A1.
overview of GIS datasets and main GIS processes to create the computer-generated green space scenario. Step numbers (1-3 refer to step numbers in Box 1. For references to Input data and Modules, see Oosterbroek et al. (2023).
Figure A1.
overview of GIS datasets and main GIS processes to create the computer-generated green space scenario. Step numbers (1-3 refer to step numbers in Box 1. For references to Input data and Modules, see Oosterbroek et al. (2023).
References
- Börjeson, L.; Höjer, M.; Dreborg, K.-H.; Ekvall, T.; Finnveden, G. Scenario types and techniques: Towards a user's guide. Futures 2006, 38, 723–739,. [CrossRef]
- Bush, J. The role of local government greening policies in the transition towards nature-based cities. Environ. Innov. Soc. Transitions 2020, 35, 35–44,. [CrossRef]
- CBS. (2018). Bevolking; ontwikkeling in gemeenten met 100 000 of meer inwoners. Retrieved from https://statline.cbs.nl.
- Chen, T., Lang, W., & Li, X. (2020). Exploring the impact of urban green space on residents’ health in Guangzhou, China. Journal of Urban Planning and Development, 146(1), 05019022.
- Coppel, G.; Wüstemann, H. The impact of urban green space on health in Berlin, Germany: Empirical findings and implications for urban planning. Landsc. Urban Plan. 2017, 167, 410–418,. [CrossRef]
- de Nijs, T., Bosch, P., Brand, E., Heusinkveld, B., van der Hoeven, F., Jacobs, C.,... Koopmans, S. (2019). Ontwikkeling standaard stresstest hitte.
- Dütemeyer, D., Barlag, A.-B., Kuttler, W., & Axt-Kittner, U. (2013). Measures against heat stress in the city of Gelsenkirchen, Germany. DIE ERDE–Journal of the Geographical Society of Berlin, 144(3-4), 181-201.
- Fischer, T.B.; Jha-Thakur, U.; Fawcett, P.; Clement, S.; Hayes, S.; Nowacki, J. Consideration of urban green space in impact assessments for health. Impact Assess. Proj. Apprais. 2017, 36, 32–44,. [CrossRef]
- Gassner, F., van Lier, A., Pronk, W., & Brandwagt, D. (2018). ‘Teek II’ Omgaan met teken in de bebouwde kom. Retrieved from https://www.rivm.nl/.
- Gemeente Utrecht. (2019). Gezondheid voor iedereen. Retrieved from https://omgevingsvisie.utrecht.nl/.
- Gijsen, S. (2021). Nature-based solutions in Europe: A frame analysis on urban policy strategies.
- Irvine, K.; Thammasat University; Loc, H.H.(.; Sovann, C.; Suwanarit, A.; Likitswat, F.; Jindal, R.; Koottatep, T.; Gaut, J.; Chua, L.; et al. Bridging the Form and Function Gap in Urban Green Space Design through Environmental Systems Modeling. J. Water Manag. Model. 2021, 29,. [CrossRef]
- Kadaverugu, R.; Gurav, C.; Rai, A.; Sharma, A.; Matli, C.; Biniwale, R. Quantification of heat mitigation by urban green spaces using InVEST model—a scenario analysis of Nagpur City, India. Arab. J. Geosci. 2021, 14,. [CrossRef]
- Kim, I.; Kwon, H. Assessing the Impacts of Urban Land Use Changes on Regional Ecosystem Services According to Urban Green Space Policies Via the Patch-Based Cellular Automata Model. Environ. Manag. 2020, 67, 192–204,. [CrossRef]
- KNMI. (2021). Heatwaves. Retrieved from https://www.knmi.nl/nederland-nu/klimatologie/lijsten/hittegolven.
- Kondo, M. C., Fluehr, J. M., McKeon, T., & Branas, C. C. (2018). Urban green space and its impact on human health. International Journal of Environmental Research and Public Health, 15(3), 445.
- Koopmans, S.; Ronda, R.; Steeneveld, G.-J.; Holtslag, A.A.; Tank, A.M.K. Quantifying the Effect of Different Urban Planning Strategies on Heat Stress for Current and Future Climates in the Agglomeration of The Hague (The Netherlands). Atmosphere 2018, 9, 353,. [CrossRef]
- Kruize, H.; Van Der Vliet, N.; Staatsen, B.; Bell, R.; Chiabai, A.; Muiños, G.; Higgins, S.; Quiroga, S.; Martinez-Juarez, P.; Aberg Yngwe, M.; et al. Urban Green Space: Creating a Triple Win for Environmental Sustainability, Health, and Health Equity through Behavior Change. Int. J. Environ. Res. Public Health 2019, 16, 4403,. [CrossRef]
- Lauf, S.; Haase, D.; Kleinschmit, B. The effects of growth, shrinkage, population aging and preference shifts on urban development—A spatial scenario analysis of Berlin, Germany. Land Use Policy 2016, 52, 240–254,. [CrossRef]
- Liou, Y.-A.; Nguyen, K.-A.; Ho, L.-T. Altering urban greenspace patterns and heat stress risk in Hanoi city during Master Plan 2030 implementation. Land Use Policy 2021, 105, 105405,. [CrossRef]
- Liu, A.; Kelobonye, K.; Zhou, Z.; Xu, Q.; Xu, Z.; Han, L. School Commuting Mode Shift: A Scenario Analysis for Active School Commuting Using GIS and Online Map API. ISPRS Int. J. Geo-Information 2020, 9, 520,. [CrossRef]
- Maastricht. (2019a). Omgevingsvisie Maastricht 2040 deel 2. Retrieved from https://www.maastrichtbeleid.nl.
- Maastricht (2019b). [Personal communication with department of Spatial design, municipality Maastricht].
- Maes, J., Zulian, G., Günther, S., Thijssen, M., & Raynal, J. (2019). Enhancing resilience of urban ecosystems through green infrastructure (EnRoute). Publications Office of the European Union: Luxembourg.
- Majumdar, D.; Purohit, P.; Bhanarkar, A.D.; Rao, P.S.; Rafaj, P.; Amann, M.; Sander, R.; Pakrashi, A.; Srivastava, A. Managing future air quality in megacities: Emission inventory and scenario analysis for the Kolkata Metropolitan City, India. Atmospheric Environ. 2019, 222, 117135,. [CrossRef]
- Mikovits, C.; Rauch, W.; Kleidorfer, M. Importance of scenario analysis in urban development for urban water infrastructure planning and management. Comput. Environ. Urban Syst. 2018, 68, 9–16,. [CrossRef]
- Miranda, A.; Ferreira, J.; Silveira, C.; Relvas, H.; Duque, L.; Roebeling, P.; Lopes, M.; Costa, S.; Monteiro, A.; Gama, C.; et al. A cost-efficiency and health benefit approach to improve urban air quality. Sci. Total. Environ. 2016, 569-570, 342–351,. [CrossRef]
- Nouri, A.S.; Lopes, A.; Costa, J.P.; Matzarakis, A. Confronting potential future augmentations of the physiologically equivalent temperature through public space design: The case of Rossio, Lisbon. Sustain. Cities Soc. 2018, 37, 7–25,. [CrossRef]
- Oosterbroek, B.; de Kraker, J.; Huynen, M.M.; Martens, P.; Verhoeven, K. Assessment of green space benefits and burdens for urban health with spatial modeling. Urban For. Urban Green. 2023, 86,. [CrossRef]
- Oosterbroek, B.; de Kraker, J.; Akkermans, S.; Esser, P.; Martens, P. Participatory Design of Urban Green Spaces to Improve Residents’ Health. Land 2024, 13, 88,. [CrossRef]
- Rayaprolu, H.S.; Llorca, C.; Moeckel, R. Impact of bicycle highways on commuter mode choice: A scenario analysis. Environ. Plan. B: Urban Anal. City Sci. 2018, 47, 662–677,. [CrossRef]
- Spijker, J., Jacobs, C., & Mol, G. (2019). Aanpak hittestress Harderwijk (1566-7197).
- Agenda Stad (2019). Werken aan Groen en Blauw in de stad. Retrieved from agendastad.
- Takken, W. (2016b). Phenology of Ixodes ricinus and Lyme borreliosis risk. In M. A. H. Braks, S. E. van Wieren, W. Takken, & S. H. (Eds.), Ecology and prevention of Lyme borreliosis (Vol. 4, pp. 149).
- Thierfelder, H.; Kabisch, N. Viewpoint Berlin: Strategic urban development in Berlin – Challenges for future urban green space development. Environ. Sci. Policy 2016, 62, 120–122,. [CrossRef]
- WHO. (2006). WHO. Air quality guidelines for particulate matter, ozone, nitrogen dioxide and sulphur dioxide. Global update 2005. World Health Organization. Available from: http://www. euro. who. int/__data/assets/pdf_file/0005/786, 38, E90038.
- WHO. (2017). Determinants of health. Retrieved from http://www.who.int/.
- WHO. (2021). Ambient (outdoor) air pollution. Retrieved from https://www.who.int/.
- Woloshin, S., Schwartz, L. M., Byram, S., Fischhoff, B., & Welch, H. G. (2000). A new scale for assessing perceptions of chance: a validation study. Medical decision making, 20(3), 298-307.
- Zhang, D.; Huang, Q.; He, C.; Yin, D.; Liu, Z. Planning urban landscape to maintain key ecosystem services in a rapidly urbanizing area: A scenario analysis in the Beijing-Tianjin-Hebei urban agglomeration, China. Ecol. Indic. 2018, 96, 559–571,. [CrossRef]
Figure 1.
Overview of modules and module connections in the model used in this study.
Figure 1.
Overview of modules and module connections in the model used in this study.
Figure 2.
The case study area of Maastricht, including the borders of the built-up area, buffer area, and example areas.
Figure 2.
The case study area of Maastricht, including the borders of the built-up area, buffer area, and example areas.
Figure 3.
Visualization at street level of the four UGS design scenarios. Picture by Mara Henke (2021).
Figure 3.
Visualization at street level of the four UGS design scenarios. Picture by Mara Henke (2021).
Figure 4.
Examples illustrating for example area 1 the stepwise method to identify areas highly suitable for trees in view of multiple health determinants. A: ‘Potential UGS areas map’. B: 'Location suitability map' for health determinant ‘Unattractive views’. C: 'Location suitability map' for health determinant ‘Air pollution’. D: ‘High benefits & low burdens map’ for health determinant ‘Unattractive views’ and ‘Air pollution’.
Figure 5.
Greenspace design per scenario in example area 1. A: Scenario ‘No greenspace’. B: Scenario ‘Current greenspace’. C: Scenario ‘Green parking lots and squares’. D: Scenario ‘Optimized greenspace locations’.
Figure 5.
Greenspace design per scenario in example area 1. A: Scenario ‘No greenspace’. B: Scenario ‘Current greenspace’. C: Scenario ‘Green parking lots and squares’. D: Scenario ‘Optimized greenspace locations’.
Figure 6.
Results for health determinant ‘Unattractive views’ for example area 1 (left) and example area 2 (right). For this figure (and subsequent figures), color shades of street segments represent the health determinant value in the situation without urban greenspace. Point symbols represent magnitude (point size) as well as direction (color green for a beneficial decrease, red for a detrimental increase) of health determinants per scenario. The circle with a black semicircle inside shows results for scenario ‘Current greenspace’, the normal circle shows results for scenario ‘Green parking lots and squares’, and the circle with a black dot in its center shows results for scenario ‘Optimized location’.
Figure 7.
Results for health determinant ‘Heat stress’ for example area 1 (left) and example area 2 (right). With PET is ‘Physiologically Equivalent Temperature’ (Nouri et al., 2018).
Figure 7.
Results for health determinant ‘Heat stress’ for example area 1 (left) and example area 2 (right). With PET is ‘Physiologically Equivalent Temperature’ (Nouri et al., 2018).
Figure 8.
Results for health determinant ‘Air pollution’ for example area 1 (left) and example area 2 (right).
Figure 8.
Results for health determinant ‘Air pollution’ for example area 1 (left) and example area 2 (right).
Figure 9.
Results for health determinant ‘Perceived unsafety’ for example area 1 (left) and example area 2 (right).
Figure 9.
Results for health determinant ‘Perceived unsafety’ for example area 1 (left) and example area 2 (right).
Figure 10.
Results for health determinant ‘Tick-bite risk for example area 1 (left) and example area 2 (right).
Figure 10.
Results for health determinant ‘Tick-bite risk for example area 1 (left) and example area 2 (right).
Table 1.
Threshold values used per health determinant.
Table 1.
Threshold values used per health determinant.
| Health determinant |
Threshold values |
Unit |
Description |
| Unattractive views |
0 |
m2/m |
An unattractive views score larger than this threshold value means that unattractive objects are more dominant within the pedestrian’s field of view than attractive objects. |
| Heat stress |
46 |
°C PET |
Physiologically Equivalent Temperature (PET) at ‘Extreme Heat Stress Level 2’ (Nouri et al., 2018). It refers to the mean PET between 12:00 and 18:00 local time, for the hottest day in 2018 during a national heatwave (July 26). |
| Air pollution |
20 |
μg/m3 NO2
|
This threshold value is twice the WHO guideline value for the annual mean concentration of 10 μg/m3 NO2 (WHO, 2021). The value is chosen because the WHO guideline value is exceeded for all street segments in all scenarios. (The lowest values per street segment are 15 μg/m3.) |
| Perceived unsafety |
50 |
- |
This threshold value is reached when, for example, the location is over 50% concealed, supervision from the most nearby home is 25 m away, and an area with at least 50 houses per ha is 50 m away. |
| Tick-bite risk |
1 |
% |
This threshold value is reached when, for example, all conditions are optimal for survival and activity of ticks and tick-host animals, but only 1% of the area directly next to footpaths contains shrubs and herbs. |
Table 2.
Health determinant values, including UGS contributions, for four UGS design scenarios for Maastricht’s built-up area. Positive determinant values represent detrimental health effects. Positive UGS contribution values represent health burdens. Negative UGS contribution values represent health benefits. ‘Threshold exceedances’ indicates the percentage (and number) of the 3721 street segments where the health determinant thresholds were exceeded.
| |
Unattractive views
(m2/m) |
Heat stress (°C PET) |
Air pollution
(μg/m3 NO2) |
Perceived unsafety (0-100) |
Tick-bite risk (%) |
| Scenario |
Indicator
value |
UGS contri-bution |
Indicator
value |
UGS contri-bution |
Indicator
value |
UGS
contri-
bution |
Indicator
value |
UGS contri-bution |
Indicator
value |
UGS contri-bution |
| ‘No greenspace’ |
25.9 |
- |
45.1 |
- |
18.7 |
- |
13.4 |
- |
0.00 |
- |
| Threshold exceedances |
86.9.0% (3234) |
34.5% (1285) |
14.3% (532) |
7.1% (266) |
0.00% (0) |
| ‘Current greenspace’ |
-43.8 |
-49.1 |
43.0 |
-2.2 |
18.8 |
0.1 |
19.6 |
6.2 |
0.04 |
0.04 |
| Threshold exceedances |
23.8% (886) |
17.9% (664) |
14.3% (532) |
10.7% (399) |
0.46% (17) |
| ‘Green parking lots and squares’ |
-68.5 |
-75.7 |
42.5 |
-2.7 |
18.7 |
-0.1 |
20.7 |
7.2 |
0.07 |
0.07 |
| Threshold exceedances |
8.3% (310) |
13.1% (487) |
14.3% (532) |
10.7% (399) |
0.48% (18) |
| ‘Optimized greenspace locations’ |
-81.2 |
-85.6 |
42.2 |
-3.0 |
18.6 |
-0.2 |
20.1 |
6.6 |
0.00 |
0.00 |
| Threshold exceedances |
15.5% (576) |
11.9% (443) |
13.1% (487) |
10.7% (399) |
0.38% (14) |
|
Disclaimer/Publisher’s Note: The statements, opinions and data contained in all publications are solely those of the individual author(s) and contributor(s) and not of MDPI and/or the editor(s). MDPI and/or the editor(s) disclaim responsibility for any injury to people or property resulting from any ideas, methods, instructions or products referred to in the content. |
© 2024 by the authors. Licensee MDPI, Basel, Switzerland. This article is an open access article distributed under the terms and conditions of the Creative Commons Attribution (CC BY) license (http://creativecommons.org/licenses/by/4.0/).
